
Economics Workshop Strategy Unit
132
Economics Workshop Strategy Unit Sandeep Kapur 14-16 March 2007
-
Upload
brynne-fernandez -
Category
Documents
-
view
62 -
download
1
description
Economics Workshop Strategy Unit. Sandeep Kapur. 14-16 March 2007. WORKSHOP OBJECTIVES. To provide rigorous but non-mathematical training in economics, enabling participants to develop a simple yet reliable toolkit for economic analysis practise its application using concrete problems - PowerPoint PPT Presentation
Transcript of Economics Workshop Strategy Unit

Economics Workshop
Strategy Unit
Sandeep Kapur
14-16 March 2007

WORKSHOP OBJECTIVES
To provide rigorous but non-mathematical training in economics, enabling participants to• develop a simple yet reliable toolkit for
economic analysis• practise its application using concrete
problems• apply economic theory to their own work
Introduction to EconomicsConcepts and Tools
Basic Concepts
• MICROECONOMICS: study of decisions made by consumers, producers, and their interaction in specific markets
• MACROECONOMICS: the big picture – emphasizes interactions in the economy as a whole
Basic Concepts
• POSITIVE ECONOMICStries to explain behaviour
• NORMATIVE ECONOMICS prescriptions, usually based on value judgment
The central questions
What goods and service to produce?
How to produce? (choice of technology)
For whom? (income distribution)
FREE MARKET ECONOMYwhat, how & for whom decided by prices, incomes, wealth
COMMAND ECONOMY central authority directs use of resources
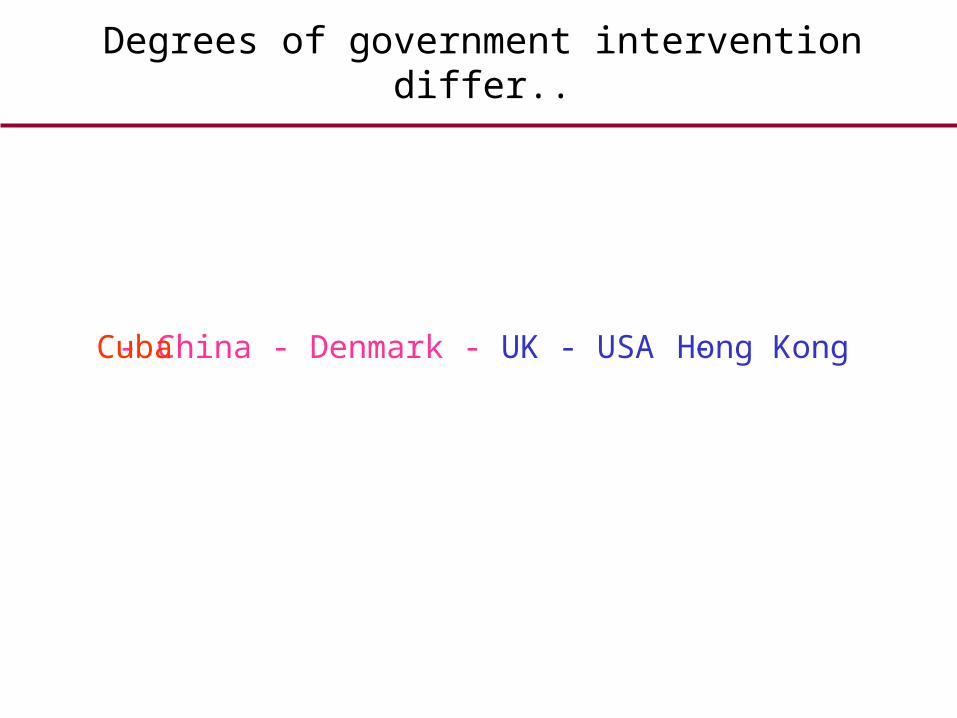
Degrees of government intervention differ..
Hong Kong- China - Denmark - UK - USA -Cuba
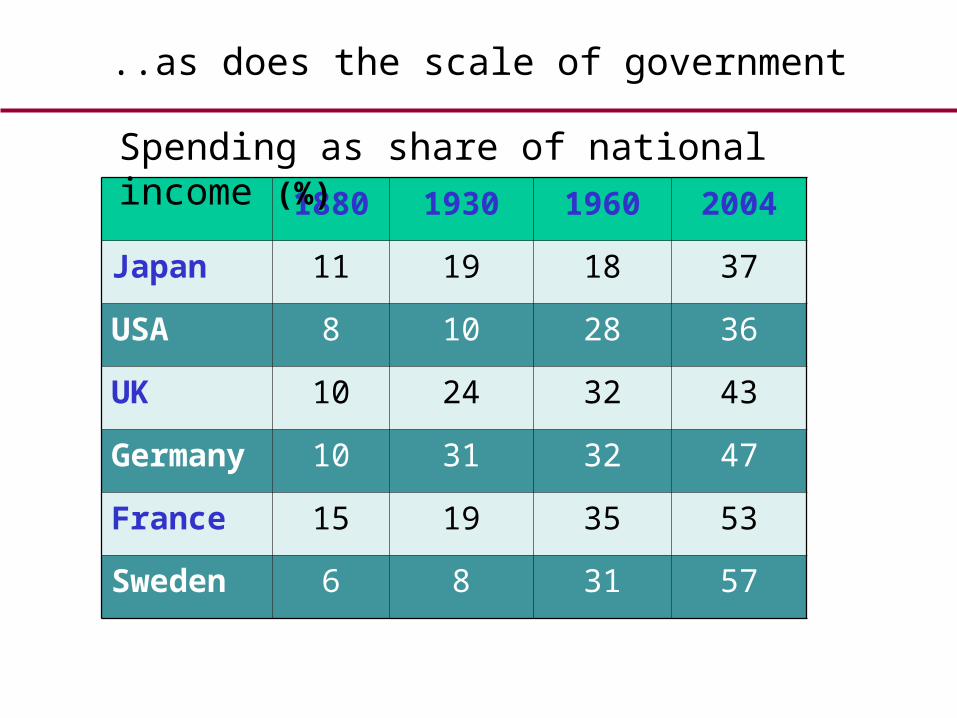
..as does the scale of government
1880 1930 1960 2004
Japan 11 19 18 37
USA 8 10 28 36
UK 10 24 32 43
Germany 10 31 32 47
France 15 19 35 53
Sweden 6 8 31 57
Spending as share of national income (%)
Basic Concepts
OPPORTUNITY COST of any good or service
Quantity of other goods sacrificed to get one more unit of this good
The underlying notion of trade-offs.

Economic Models
MODEL Deliberate simplification of realitylike a map
DATA Time SeriesCross-SectionPanel Data
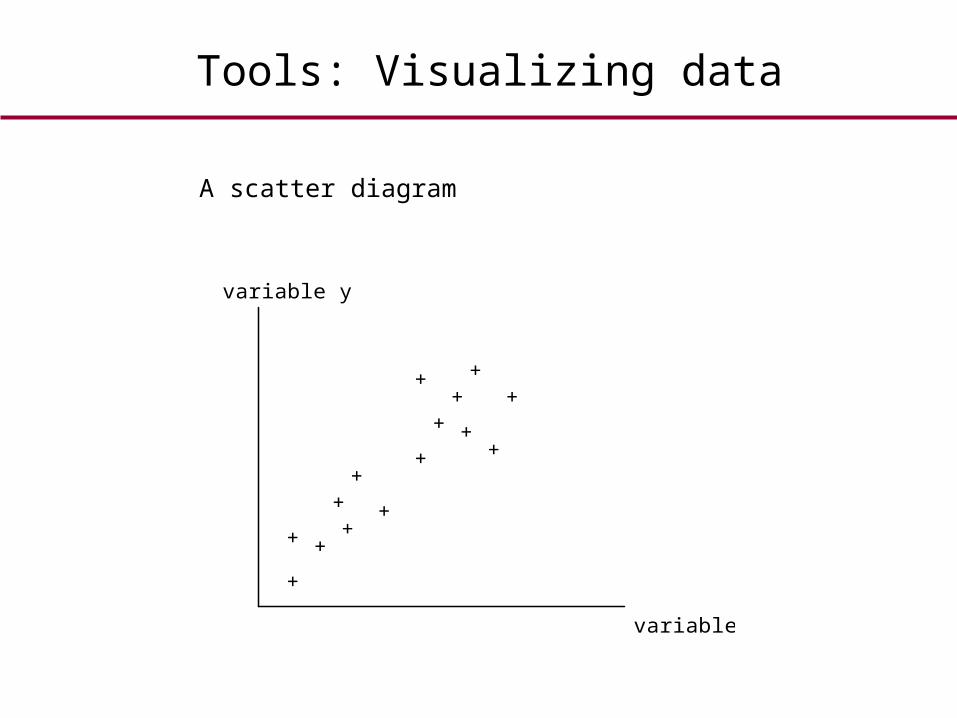
Tools: Visualizing data
A scatter diagram
variable x
variable y
+
++
++
+
+
+
+
+
+
+
++
+
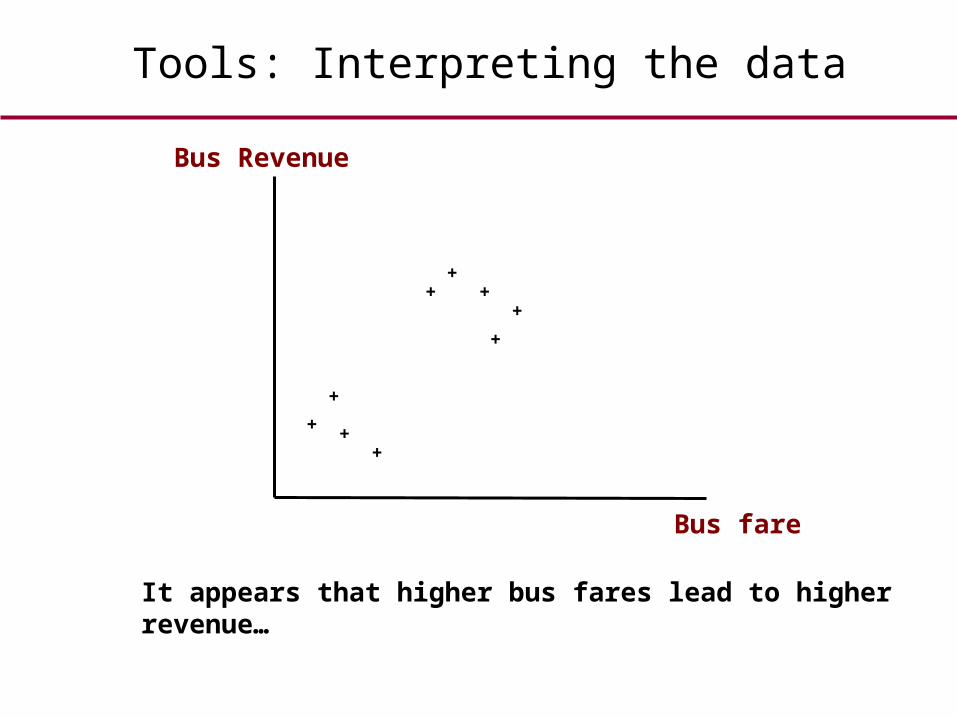
Tools: Interpreting the data
+++
++
+
+
+
+
Bus fare
Bus Revenue
It appears that higher bus fares lead to higher revenue…
+++
++
+
+
+
+
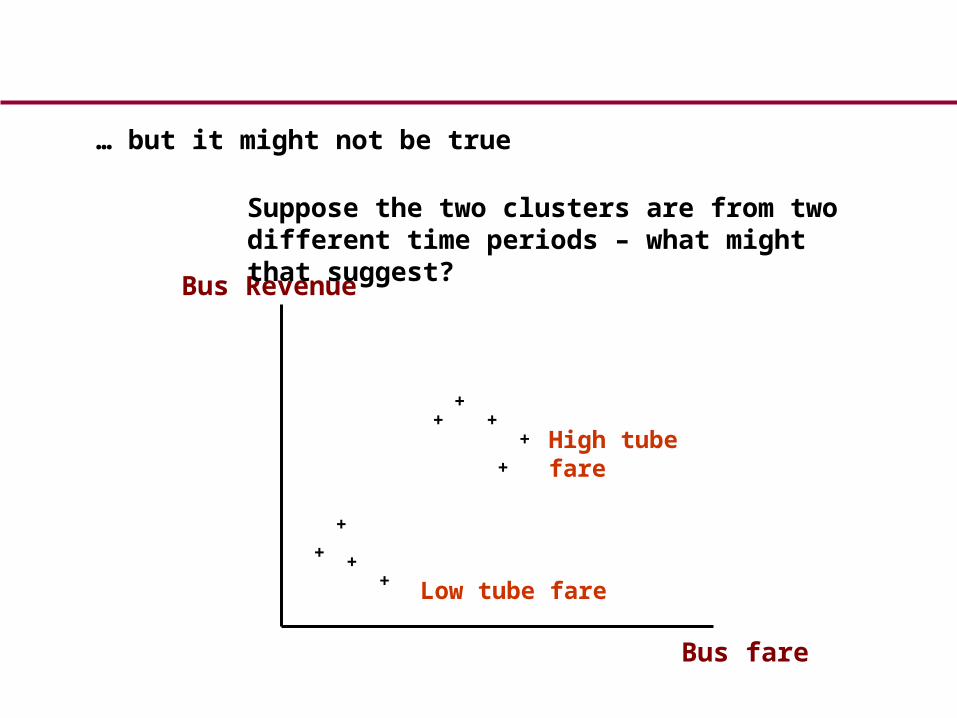
Bus fare
Bus Revenue
… but it might not be true
Low tube fare
High tube fare
Suppose the two clusters are from two different time periods – what might that suggest?
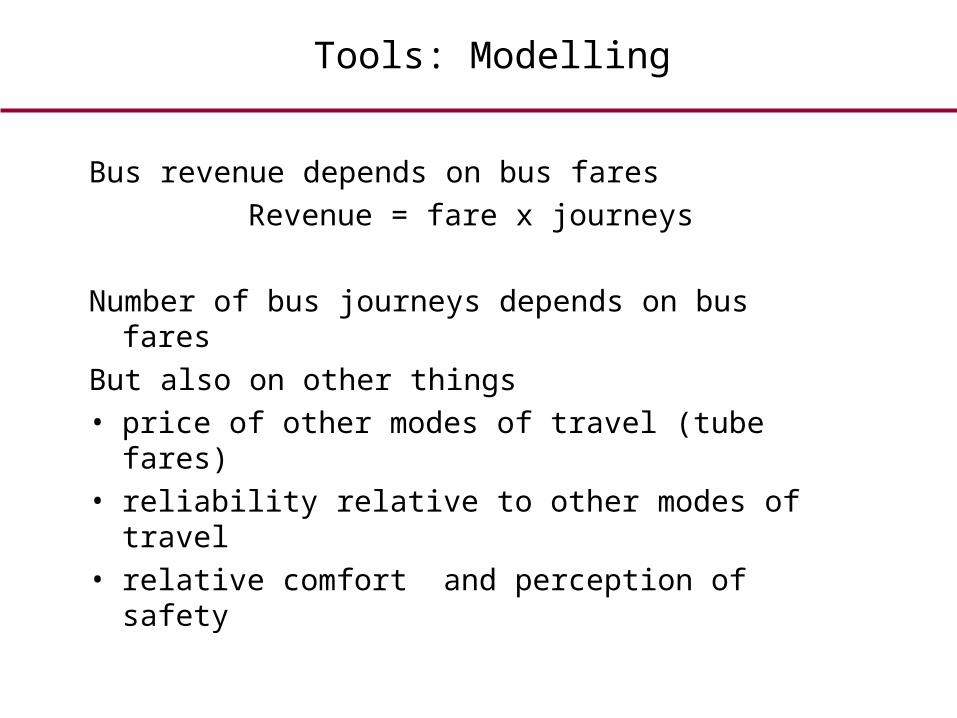
Tools: Modelling
Bus revenue depends on bus fares
Revenue = fare x journeys
Number of bus journeys depends on bus fares
But also on other things• price of other modes of travel (tube fares)• reliability relative to other modes of travel• relative comfort and perception of safety


How Markets WorkDemand, Supply, and Price Adjustment
Market
• DEMANDquantity buyers wish to buy at each price
• SUPPLYquantity producers wish to sell at each price
• MARKET
any arrangement in which prices adjust to reconcile buyers and sellers intentions
• EQUILIBRIUM PRICEthe price at which market clears(i.e. quantity demanded = quantity supplied)
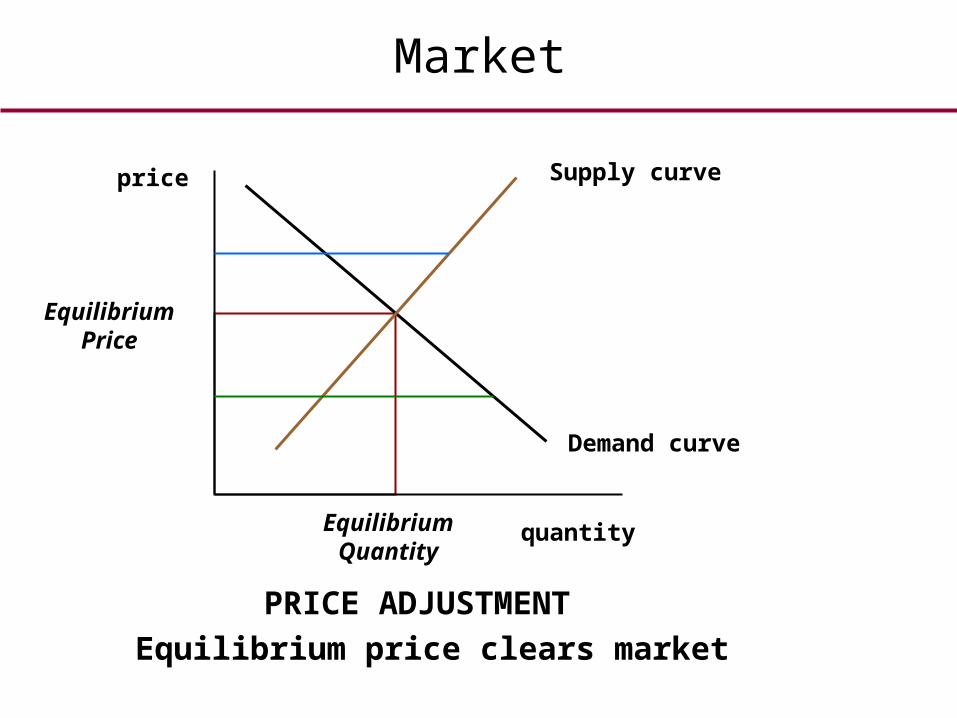
Market
Demand curve
quantity
price
EquilibriumQuantity
EquilibriumPrice
PRICE ADJUSTMENT
Equilibrium price clears market
Supply curve
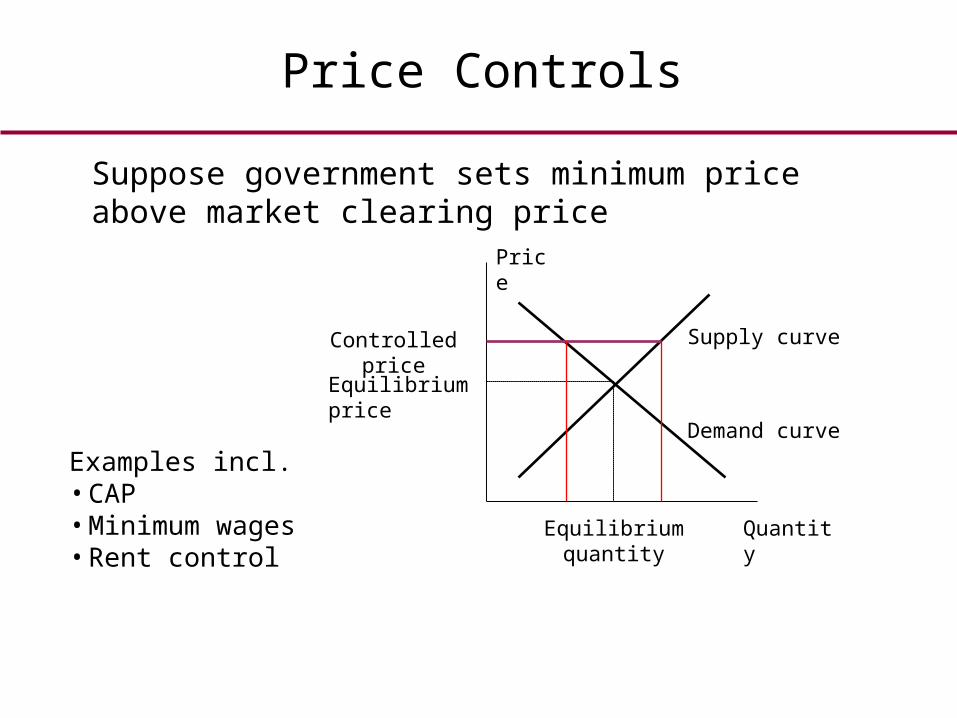
Price Controls
Price
Quantity
Demand curve
Supply curve
Equilibrium price
Equilibrium quantity
Suppose government sets minimum price above market clearing price
Controlled price
Examples incl.• CAP• Minimum wages• Rent control
DEMAND IN DETAIL elaborating on the ‘other things’
Demand curve shows relation between price of a good and quantity demanded of that good.
How does demand change when
1 price of a related good changes?– substitutes vs complements
2 consumer’s income changes?– normal goods vs inferior goods
3 tastes change? – role of fashions and fads
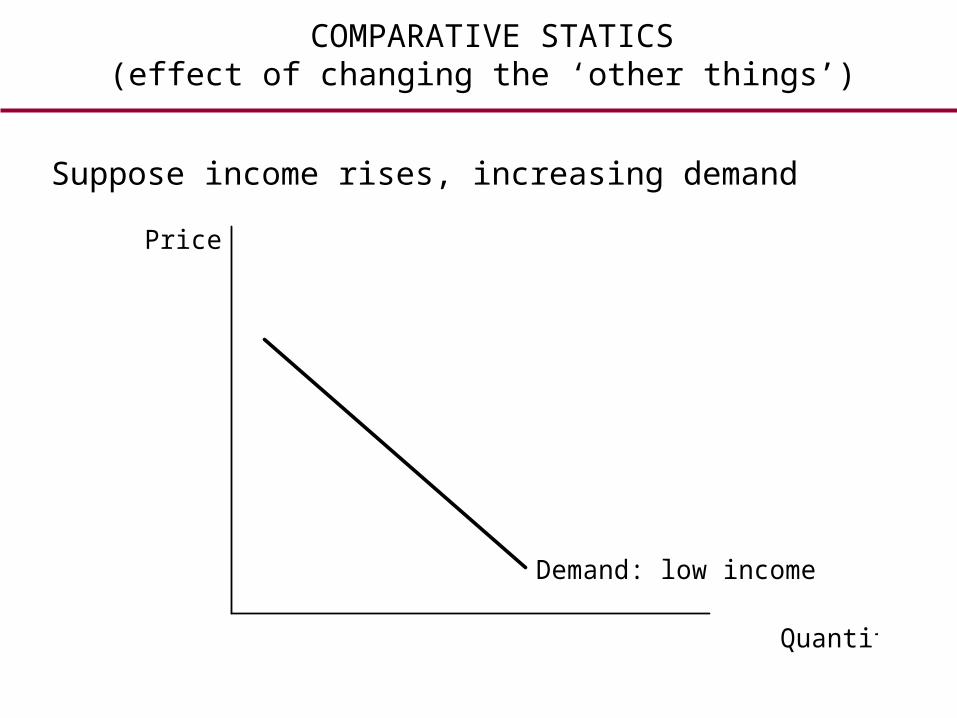
COMPARATIVE STATICS(effect of changing the ‘other things’)
Suppose income rises, increasing demand
Quantity
Price
Demand: low income
Equilibrium price rises
Equilibrium quantity rises
Demand : high income
Supply
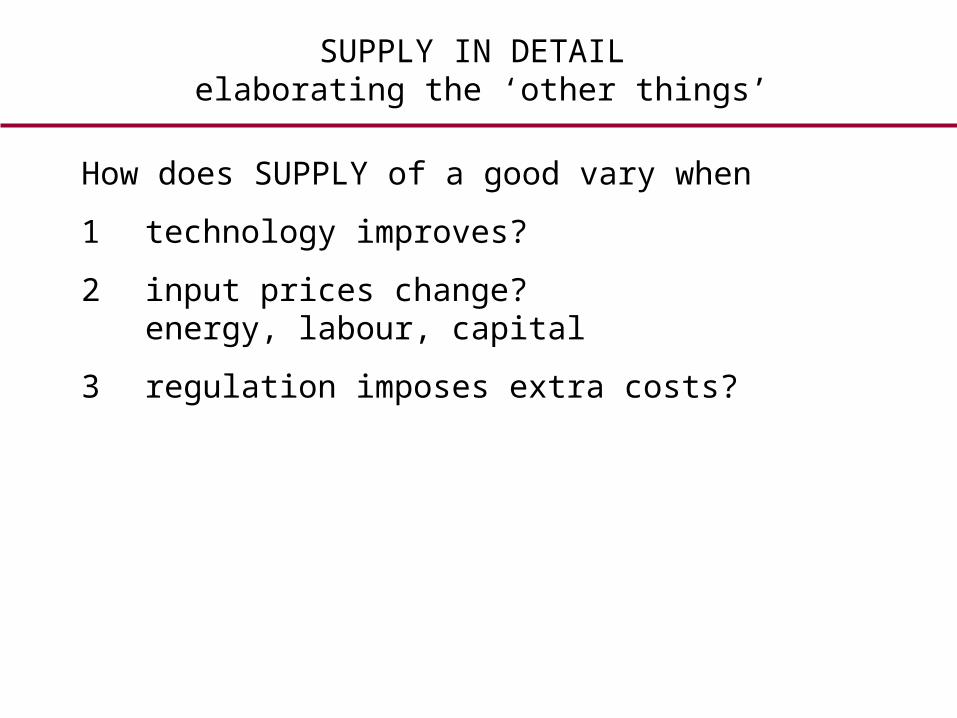
SUPPLY IN DETAIL elaborating the ‘other things’
How does SUPPLY of a good vary when
1 technology improves?
2 input prices change?energy, labour, capital
3 regulation imposes extra costs?
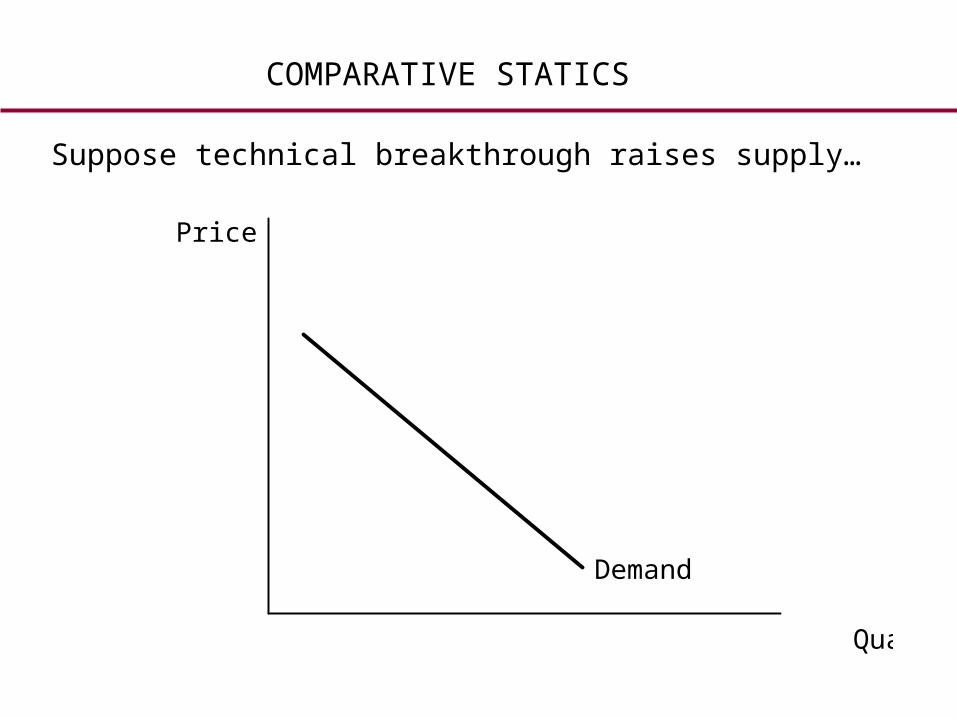
COMPARATIVE STATICS
Suppose technical breakthrough raises supply…
Quantity
Price
Demand
2 but equilibrium price falls
1 Equilibrium quantity rises...
Supply rises
COMPARATIVE STATICS
An important difference
• If demand shifts, equilibrium price and quantity move in the SAME DIRECTION
• If supply shifts, equilibrium price and quantity move in OPPOSITE DIRECTIONS

Introduction to EconomicsGROUPWORK
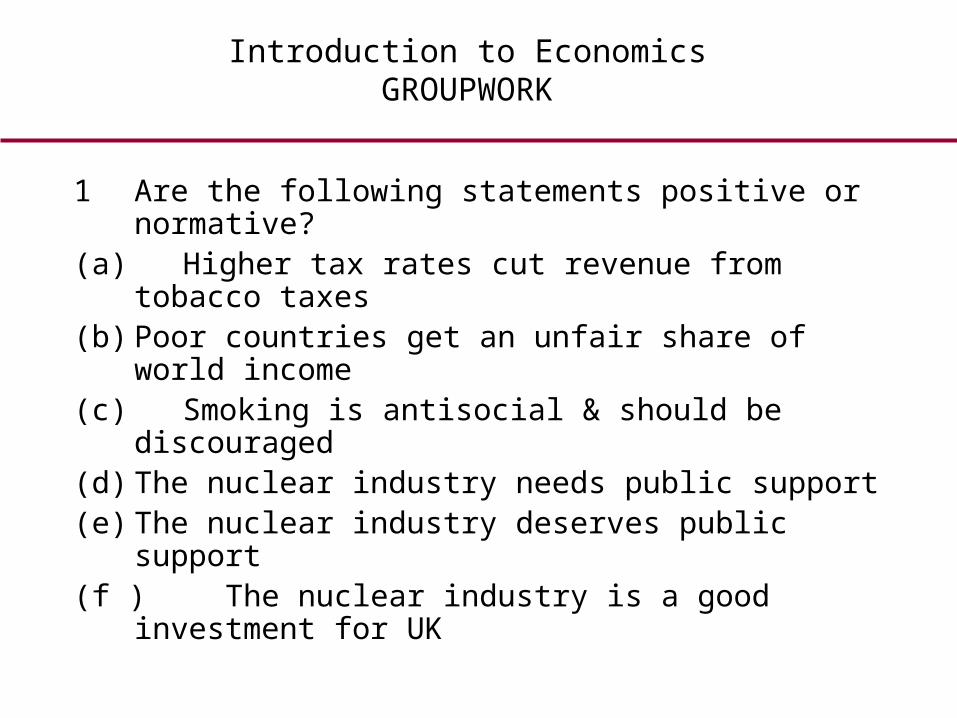
1 Are the following statements positive or normative?
(a) Higher tax rates cut revenue from tobacco taxes(b) Poor countries get an unfair share of world income(c) Smoking is antisocial & should be discouraged(d) The nuclear industry needs public support(e) The nuclear industry deserves public support(f ) The nuclear industry is a good investment for UK
GROUPWORK
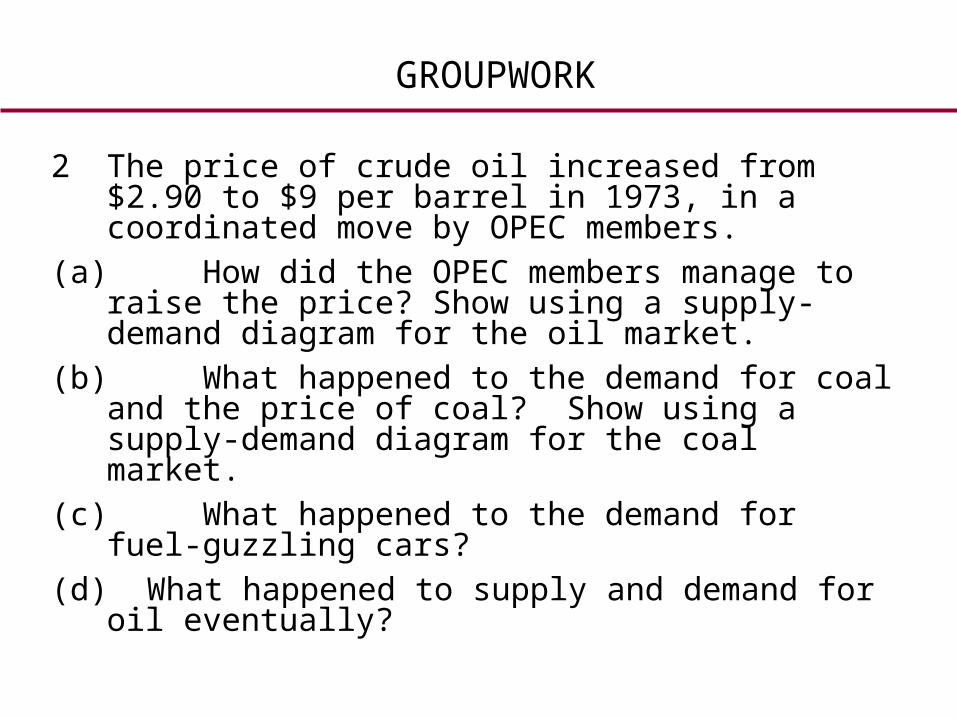
2 The price of crude oil increased from $2.90 to $9 per barrel in 1973, in a coordinated move by OPEC members.
(a) How did the OPEC members manage to raise the price? Show using a supply-demand diagram for the oil market.
(b) What happened to the demand for coal and the price of coal? Show using a supply-demand diagram for the coal market.
(c) What happened to the demand for fuel-guzzling cars?
(d) What happened to supply and demand for oil eventually?
GROUPWORK
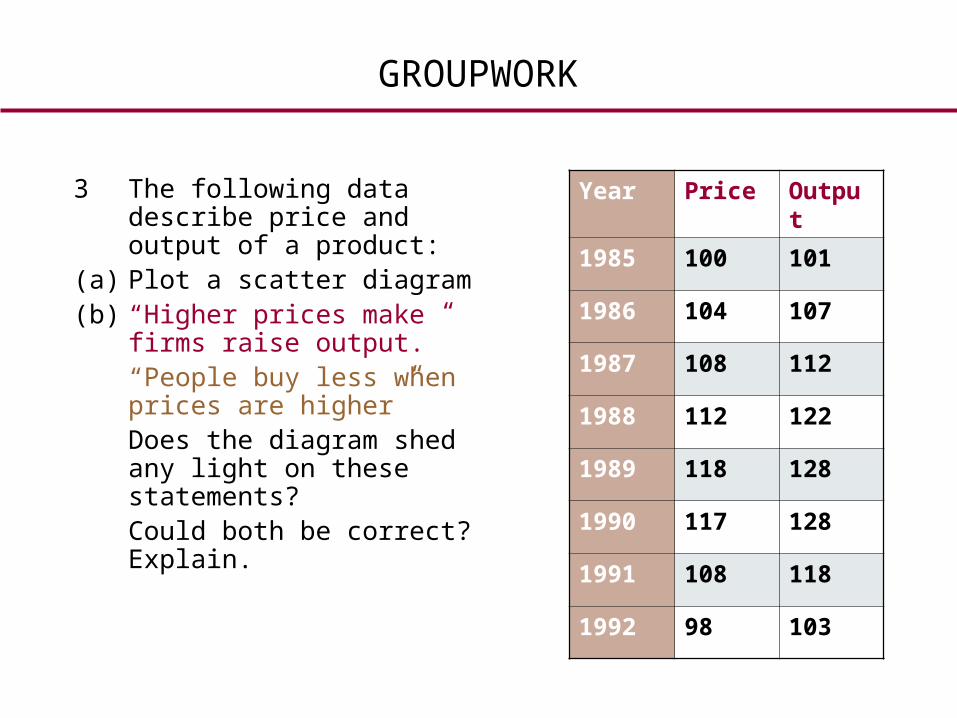
3 The following data describe price and output of a product:
(a) Plot a scatter diagram(b) “Higher prices make firms raise
output.”“People buy less when prices are higher”Does the diagram shed any light on these statements?Could both be correct? Explain.
Year Price Output
1985 100 101
1986 104 107
1987 108 112
1988 112 122
1989 118 128
1990 117 128
1991 108 118
1992 98 103


Elasticity of Demand and Supply
Price Elasticity of Demand
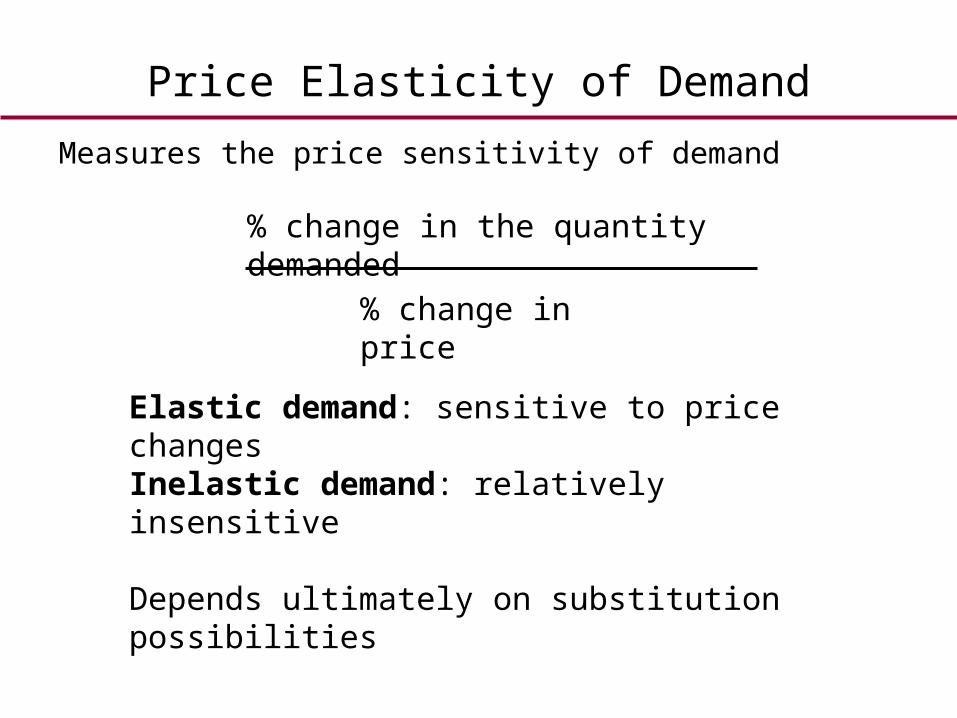
Measures the price sensitivity of demand
% change in the quantity demanded
% change in price
Elastic demand: sensitive to price changesInelastic demand: relatively insensitive
Depends ultimately on substitution possibilities
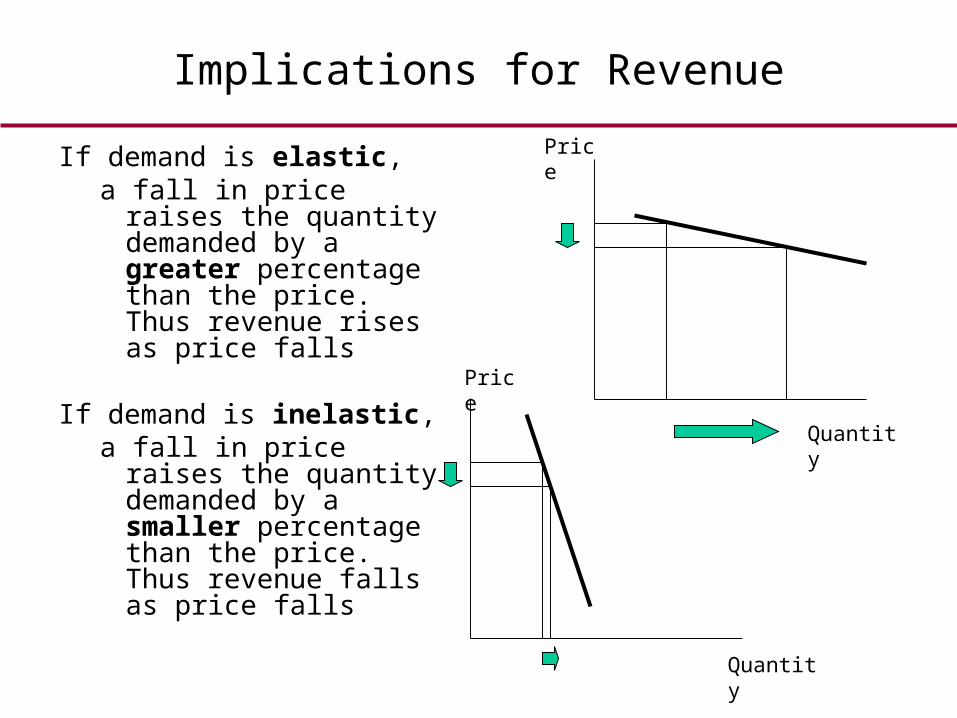
Implications for Revenue
If demand is elastic, a fall in price raises the
quantity demanded by a greater percentage than the price. Thus revenue rises as price falls
If demand is inelastic, a fall in price raises the
quantity demanded by a smaller percentage than the price. Thus revenue falls as price falls
Price
Quantity
Price
Quantity
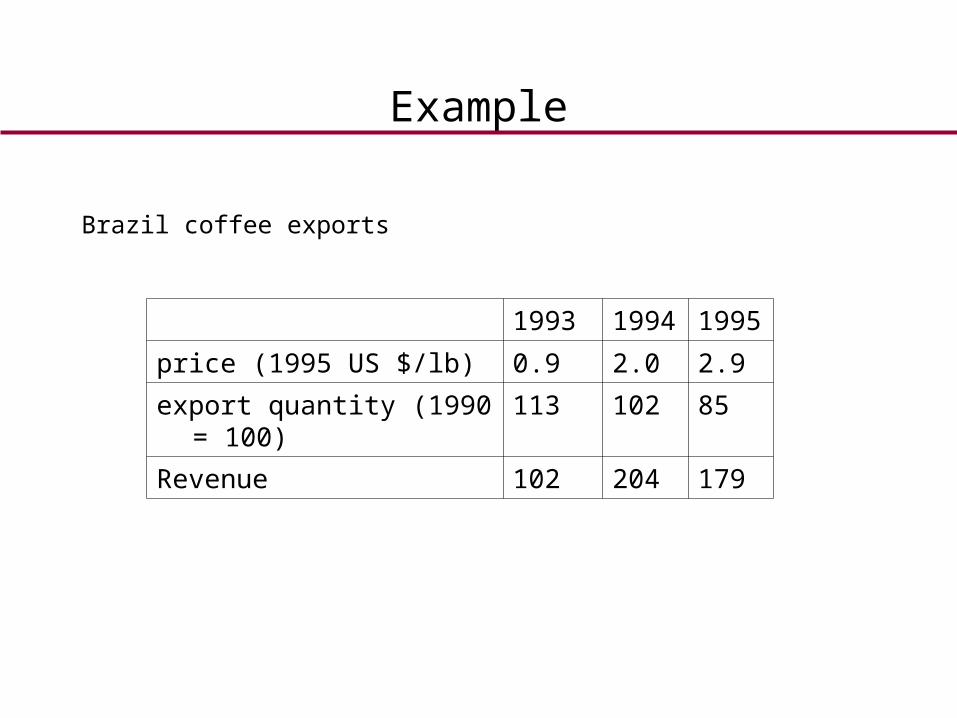
Example
Brazil coffee exports
1993 1994 1995
price (1995 US $/lb) 0.9 2.0 2.9
export quantity (1990 = 100) 113 102 85
Revenue 102 204 179
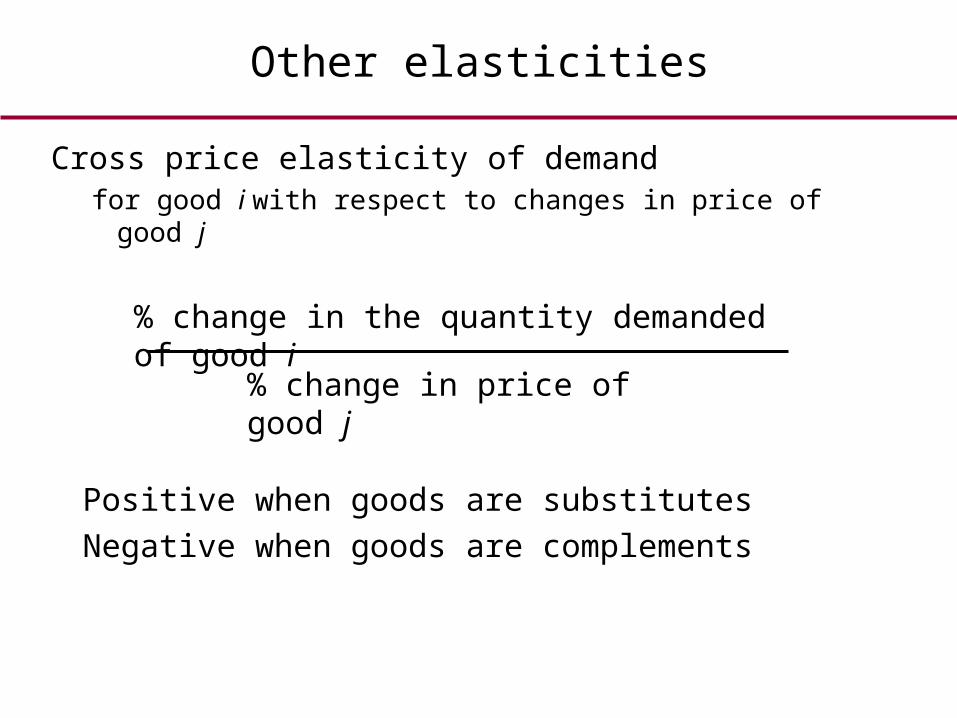
Other elasticities
Cross price elasticity of demandfor good i with respect to changes in price of good j
% change in the quantity demanded of good i
% change in price of good j
Positive when goods are substitutes
Negative when goods are complements
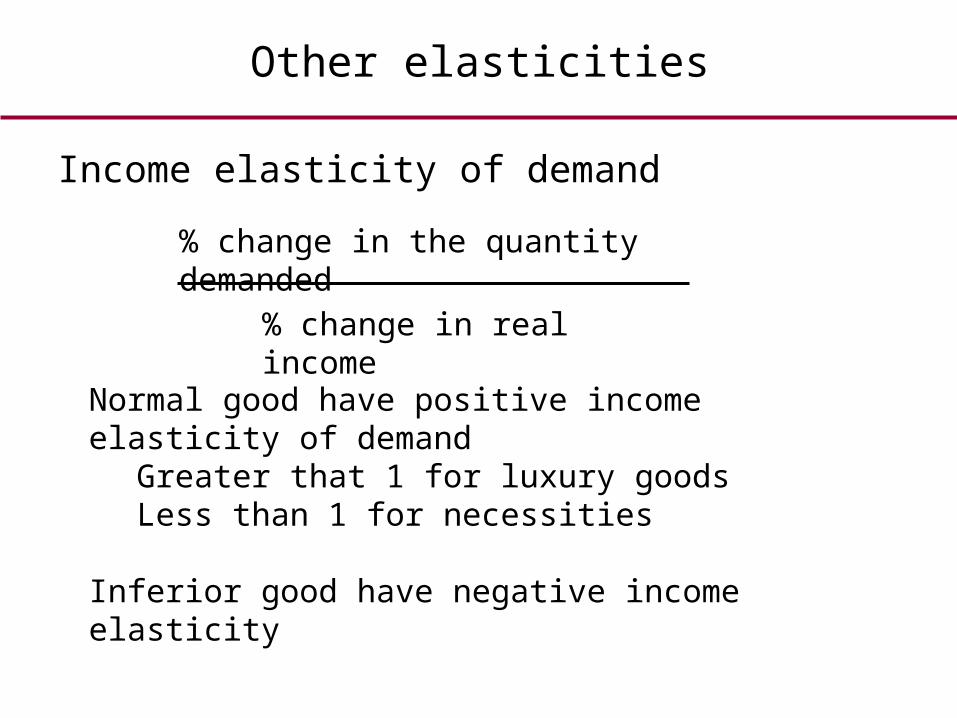
Other elasticities
Income elasticity of demand
% change in the quantity demanded
% change in real income
Normal good have positive income elasticity of demandGreater that 1 for luxury goodsLess than 1 for necessities
Inferior good have negative income elasticity
Price Elasticity of Supply
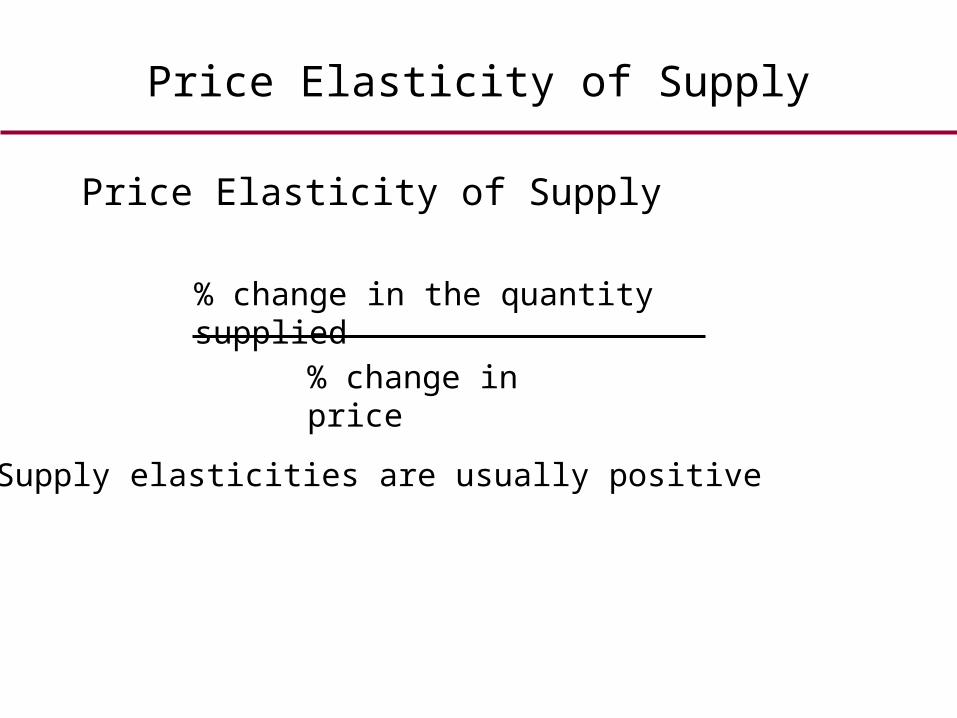
Price Elasticity of Supply
% change in the quantity supplied
% change in price
Supply elasticities are usually positive
Theory of Consumer Choice
Consumers have preferences over different goods and services
Budget constraint describes the different bundles that a consumer can afford given prices and income
Consumer makes herself as well off as possible, given the budget constraint
The Effect of Relative Price Changes
The effect of price changes• “Substitution effect”: you buy less of things that
have become relatively expensive.• “Income effect”: the decrease in real income due to
price increase may reduce purchases of all goods.
Impact of wage rates on labour supply
The two effects may work in opposite directions…
As wage rates increase• workers want to work longer hours because work is
relatively more attractive (substitution effect)• workers may want to work less because higher
incomes make them want to consume more leisure (income effect)
The net effect could go either way
What government does Why intervene?
Government Intervention
Intervention in free markets is usually motivated by
• Equity considerations• Efficiency considerations• Ethical or moral arguments
EQUITY
How fair is the distribution of goods and services?
Of course, fairness is a value judgement
In principle, we can distinguish between• Horizontal equity: equal treatment of equals• Vertical equity: different treatment of different people
to reduce effects of inequality
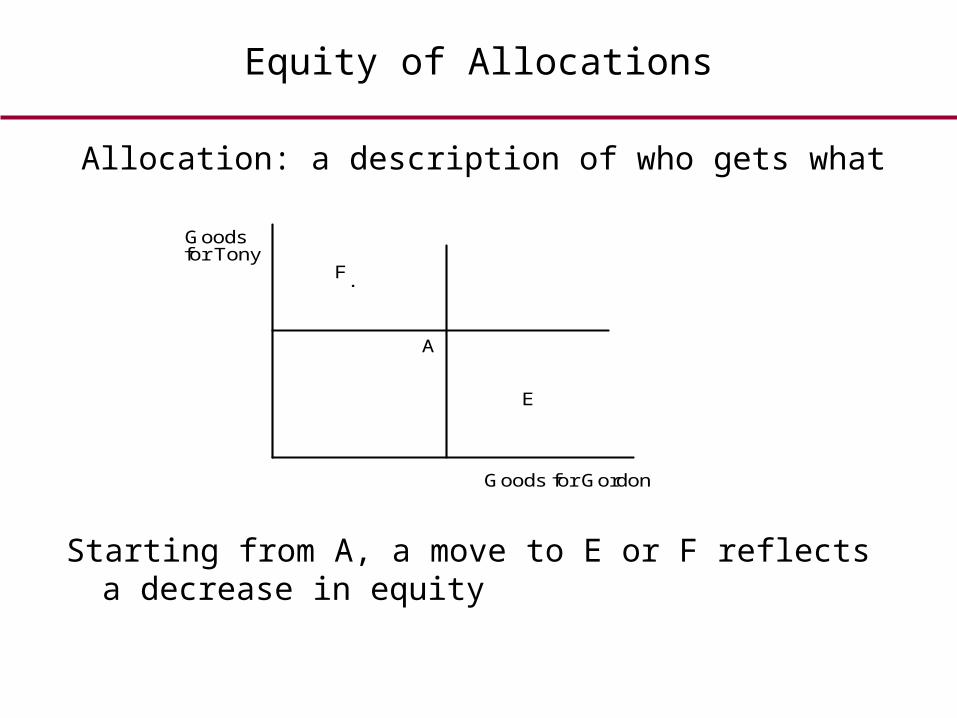
Equity of Allocations
Starting from A, a move to E or F reflects a decrease in equity
Goods for Tony
Goods for Gordon
A
E
F .
Allocation: a description of who gets what
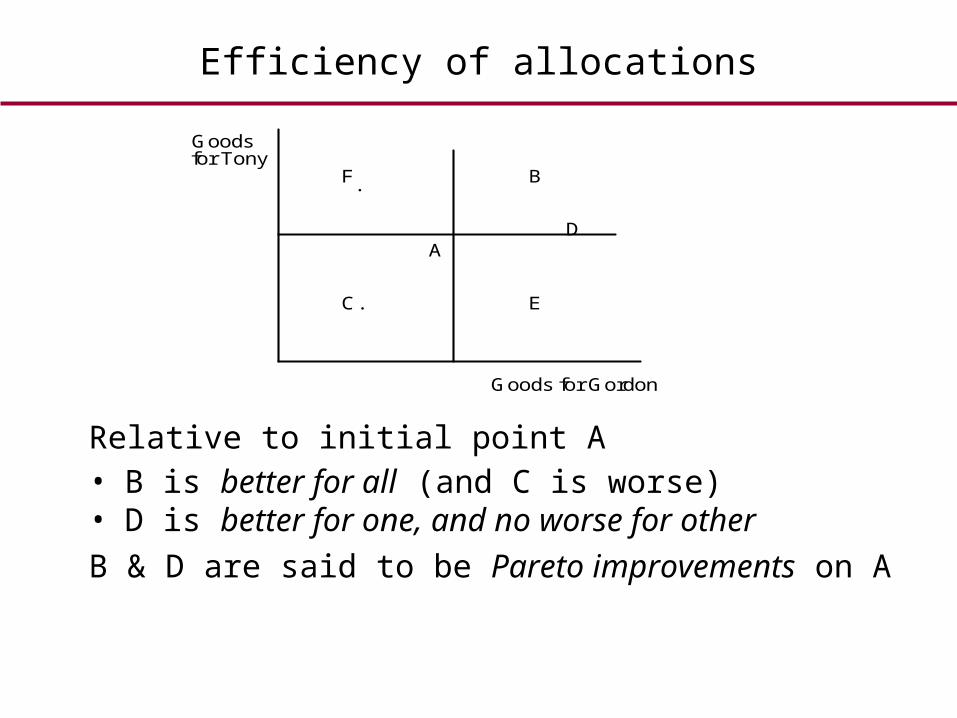
Efficiency of allocations
Relative to initial point A• B is better for all (and C is worse) • D is better for one, and no worse for other
B & D are said to be Pareto improvements on A
Goods for Tony
Goods for Gordon
A
B
C. E
F
D
.
Economic Efficiency
An allocation is Pareto efficient if it is impossible to find another allocation that makes someone better off and nobody worse off.
Are Markets Pareto Efficient?
Key Questions
• Do free markets lead to efficient outcomes? Always?
• What are the implications for policy?
Competitive Markets
In competitive markets
• there are many firms, each too small to have any influence on market price (they are ‘price takers’)
• competition ensures prices are close to the marginal cost of production (marginal cost measures opportunity cost of producing another unit of the good)
• of course, this assumes no tax or other distortions
Competitive Equilibrium & Pareto Efficiency
In undistorted, competitive markets • consumers align their consumption choices to market
prices• competition drives prices to marginal cost of production• thus prices align consumer benefit to marginal cost• (implies cannot reallocate resources to generate a
Pareto improvement)• PUNCH LINE: Competitive equilibrium is efficient
(The Invisible Hand Theorem!)
AN IDEA
If indeed markets are efficient• rely on markets to achieve efficiency, and • confine government intervention to redistribution
However markets may not always be efficient
Market Failure: a circumstance in which equilibrium in free markets fails to achieve an efficient allocation
Group Work: Efficiency and Equity…
Government intervention in the economy is pervasive. For each type of intervention listed below identify the possible rationale. Is it primarily
a. (Pareto) efficiency considerations?b. a desire for greater equity?c. something else?
1. Income tax2. Taxation of petrol3. Windfall tax on utilities4. Regulating utility prices

…Group Work
5. Regulating discharge of sewage in the Thames
6. Legislation against insider trading
7. Banning the use of cocaine
8. Unemployment insurance
9. Making primary school compulsory
10. Maintaining an army
11. Running the NHS
12. Running the Post Office

Correcting Market Failures Why intervene?
How to intervene?
Sources of Market Failure
• Externalities
• Public goods
• Imperfect competition
• Imperfect information
We will look at each of these in turn
MARKET FAILURE: Externalities
EXTERNALITY
• A circumstance in which an individual's choices affects others' utility or productivity
• the effect is direct (not through market or prices)
EXAMPLES• Adverse externality: smoking, pollution• Beneficial externality: bees and orchards• Adverse production externality: pollution
Why Externalities Matter
THE ESSENTIAL PROBLEM• Social cost = private cost + externalities
Social benefit = private benefit + externality• Externalities imply divergence between social and
private costs (or social and private benefit)• Market mechanism aligns private costs and benefits• Efficiency requires alignment of social costs and
benefits• If divergences exist, should not expect socially
efficient allocations
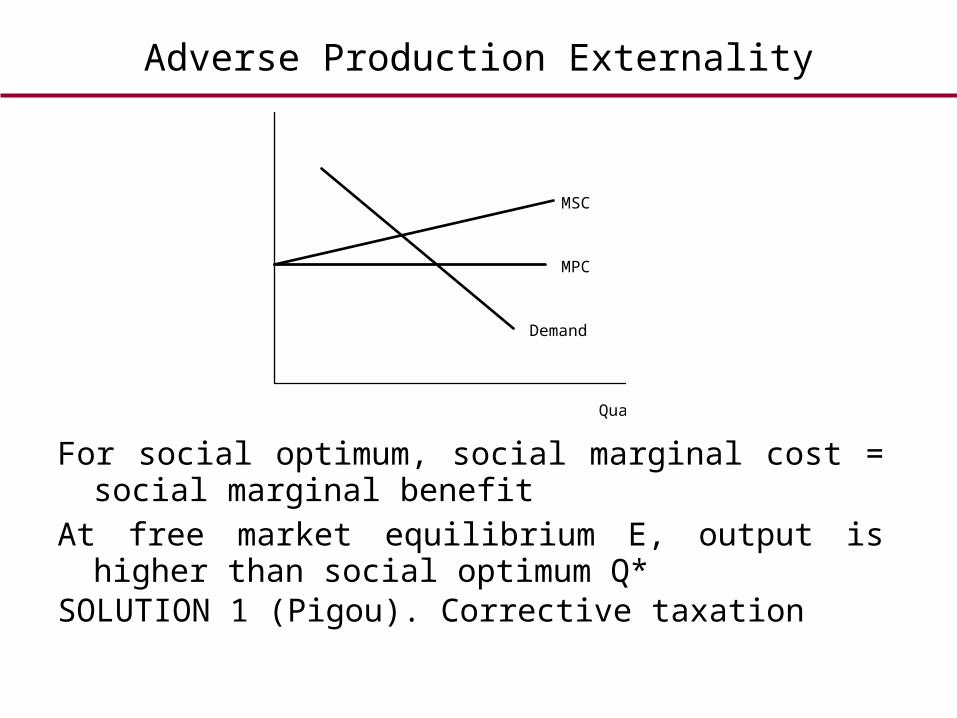
Adverse Production Externality
For social optimum, social marginal cost = social marginal benefit
At free market equilibrium E, output is higher than social optimum Q*
SOLUTION 1 (Pigou). Corrective taxation
Quantity
Demand
MPC
MSC
E
FG
QQ*
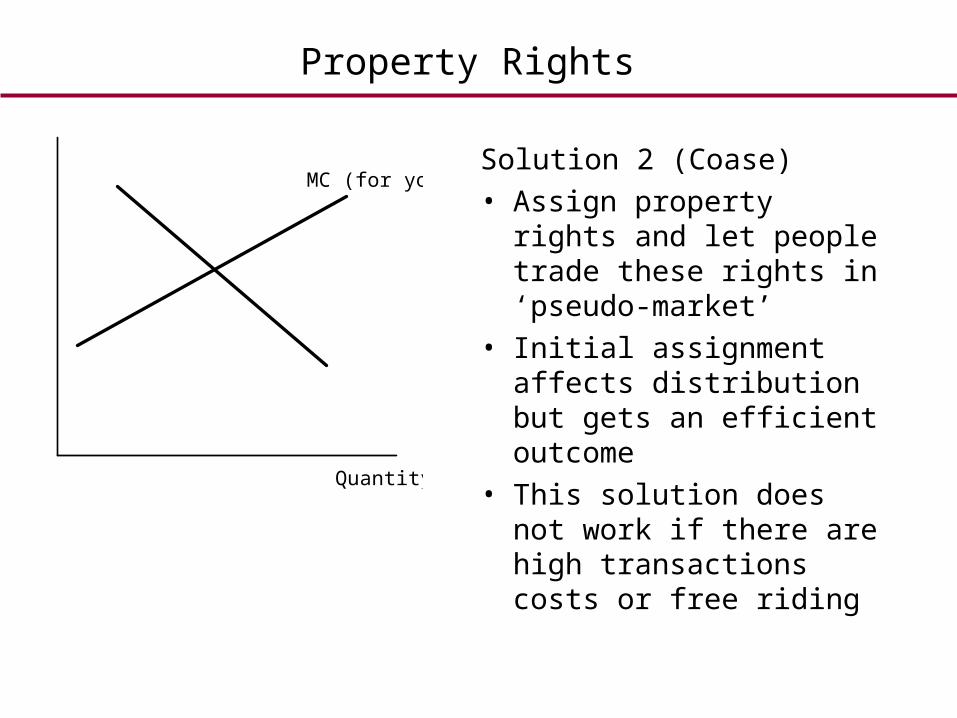
Property Rights
Solution 2 (Coase)• Assign property rights
and let people trade these rights in ‘pseudo-market’
• Initial assignment affects distribution but gets an efficient outcome
• This solution does not work if there are high transactions costs or free riding
Quantity
MC (for you)
QQ*
MB (to me)
Efficient quantity is Q*
MARKET FAILURE: Public Goods
Examples: national defence, TV signal
CHARACTERISTICS• NON-RIVAL CONSUMPTION: my consumption
does not diminish what is available for you• NON-EXCLUDABILITY: impossible or too costly
to prevent people from consuming it
Public Goods
CONSEQUENCES• Free-riding: difficult to make people pay for use• And may not be efficient to charge for useMarkets do not provide right level of public goods
SOLUTION• Public provision, financed through taxes• Note that government needs to ensure right quantity,
but does not need to produce it itself
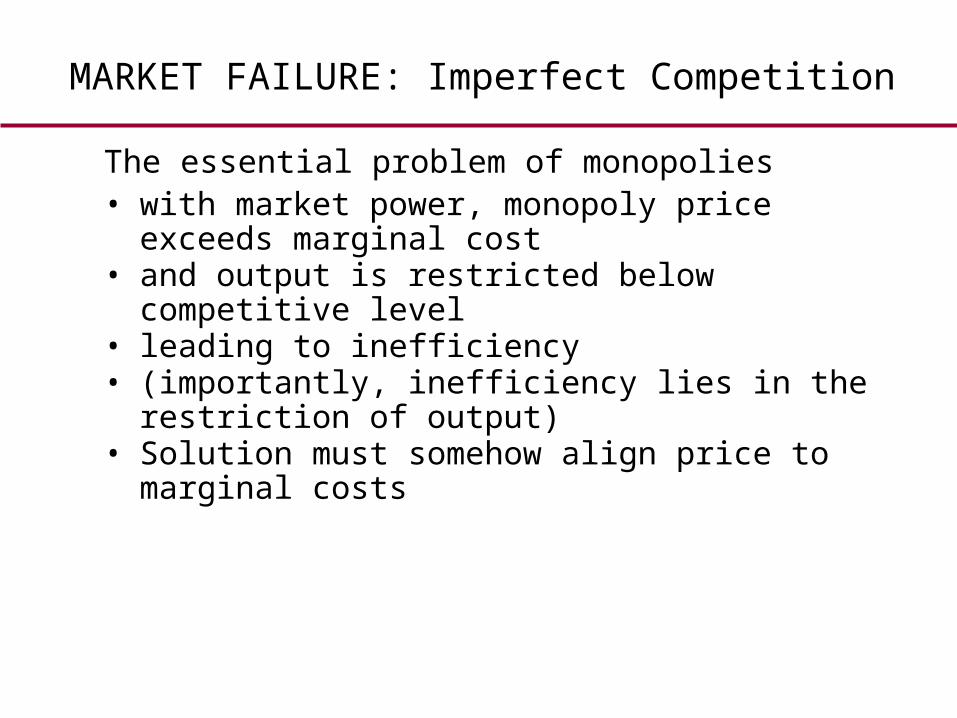
MARKET FAILURE: Imperfect Competition
The essential problem of monopolies• with market power, monopoly price exceeds
marginal cost• and output is restricted below competitive level• leading to inefficiency • (importantly, inefficiency lies in the restriction of
output)• Solution must somehow align price to marginal
costs
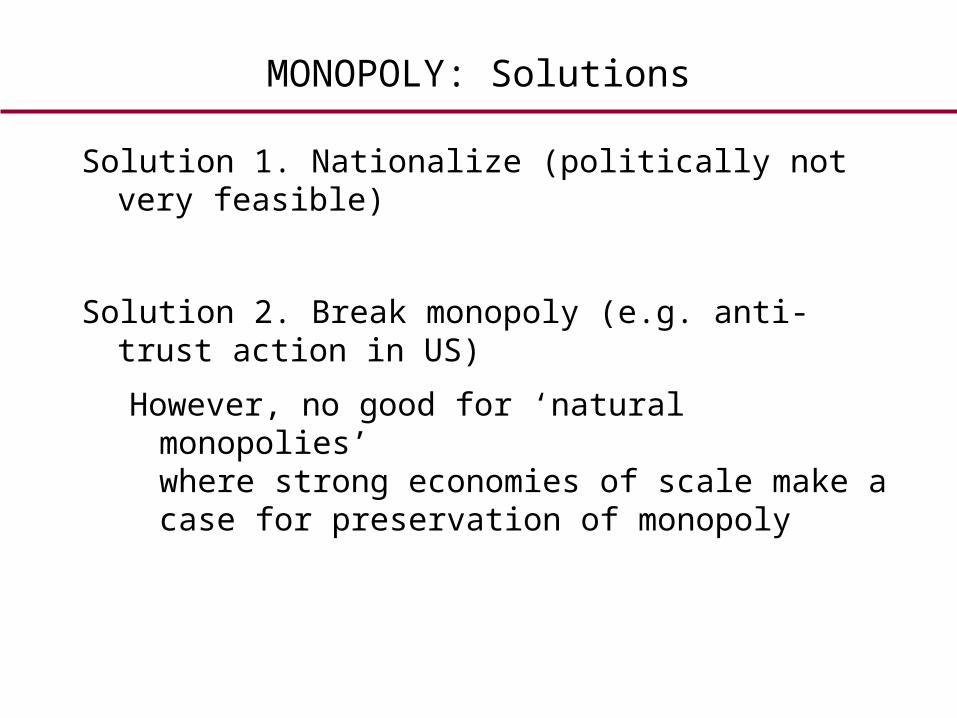
MONOPOLY: Solutions
Solution 1. Nationalize (politically not very feasible)
Solution 2. Break monopoly (e.g. anti-trust action in US)
However, no good for ‘natural monopolies’ where strong economies of scale make a case for preservation of monopoly
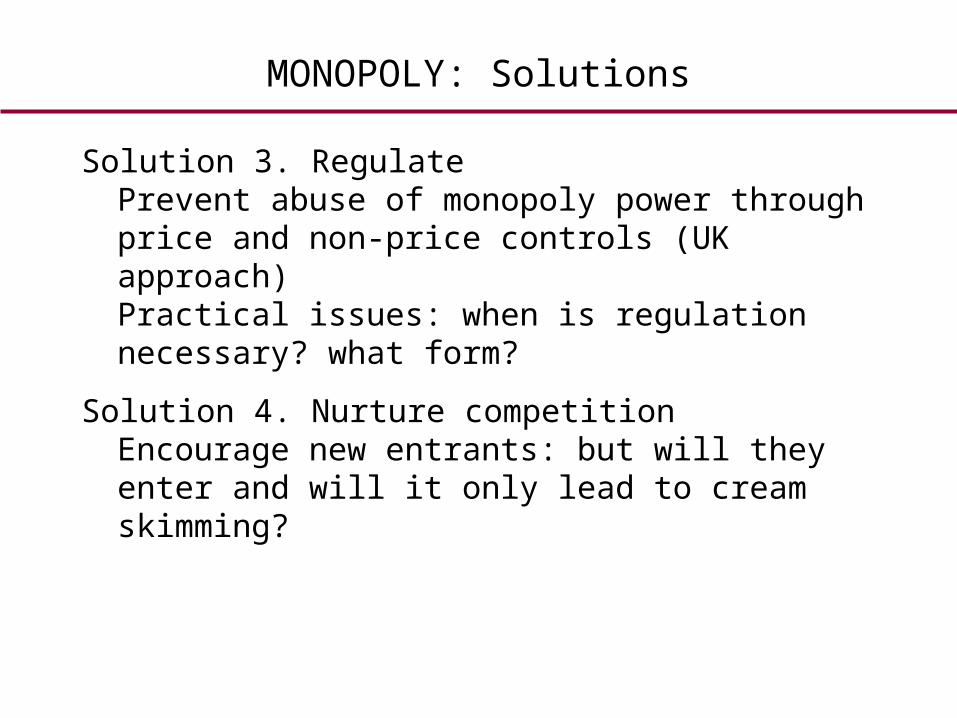
MONOPOLY: Solutions
Solution 3. Regulate Prevent abuse of monopoly power through price and non-price controls (UK approach)Practical issues: when is regulation necessary? what form?
Solution 4. Nurture competition Encourage new entrants: but will they enter and will it only lead to cream skimming?
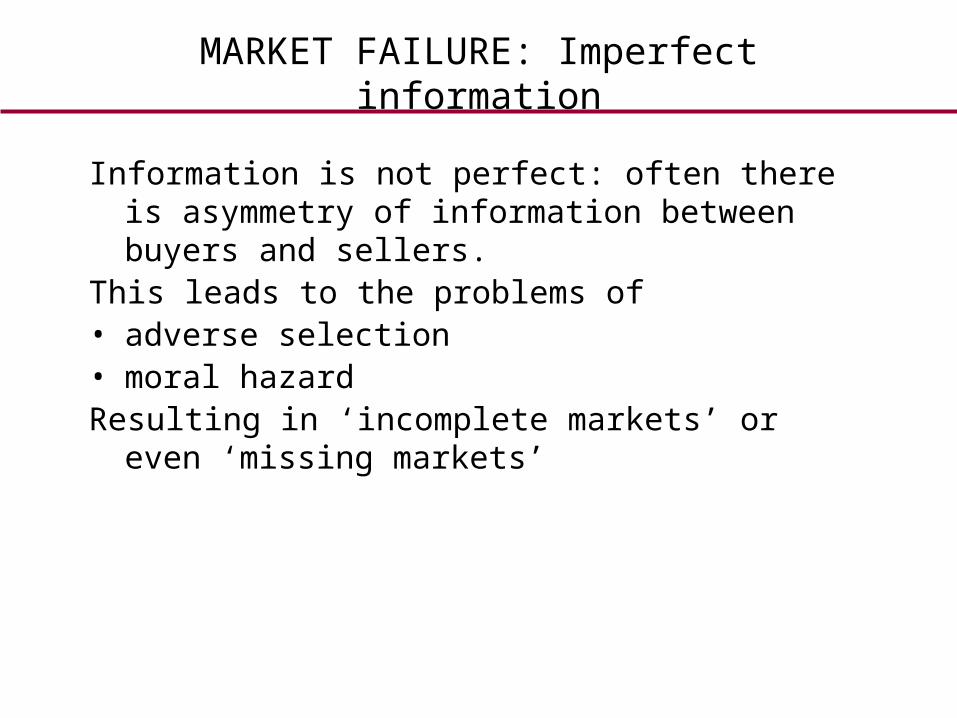
MARKET FAILURE: Imperfect information
Information is not perfect: often there is asymmetry of information between buyers and sellers.
This leads to the problems of• adverse selection• moral hazardResulting in ‘incomplete markets’ or even ‘missing
markets’
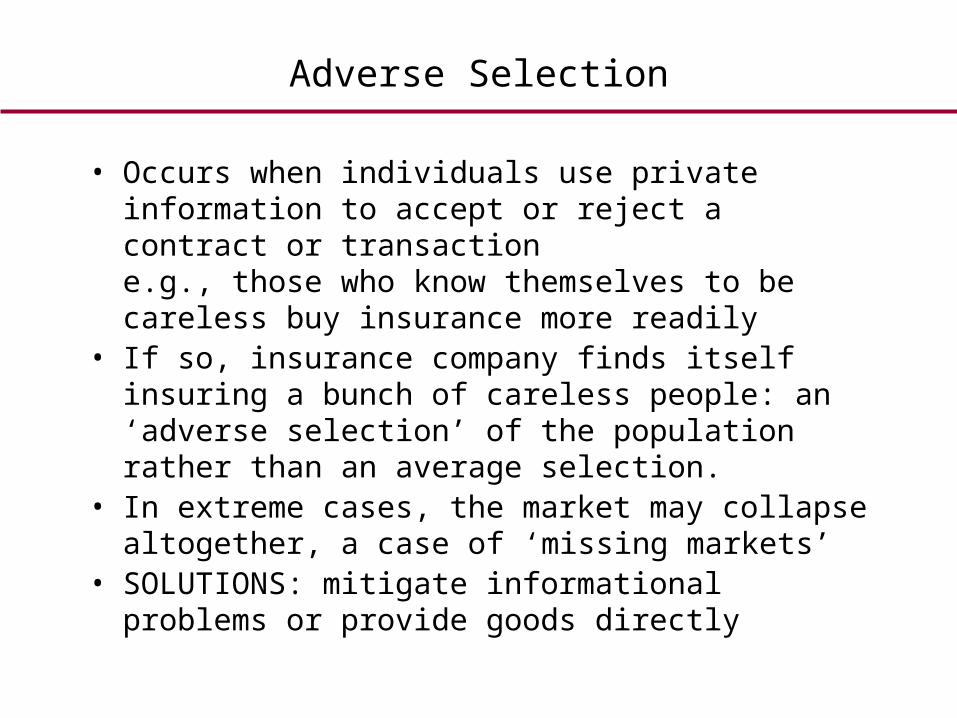
Adverse Selection
• Occurs when individuals use private information to accept or reject a contract or transactione.g., those who know themselves to be careless buy insurance more readily
• If so, insurance company finds itself insuring a bunch of careless people: an ‘adverse selection’ of the population rather than an average selection.
• In extreme cases, the market may collapse altogether, a case of ‘missing markets’
• SOLUTIONS: mitigate informational problems or provide goods directly
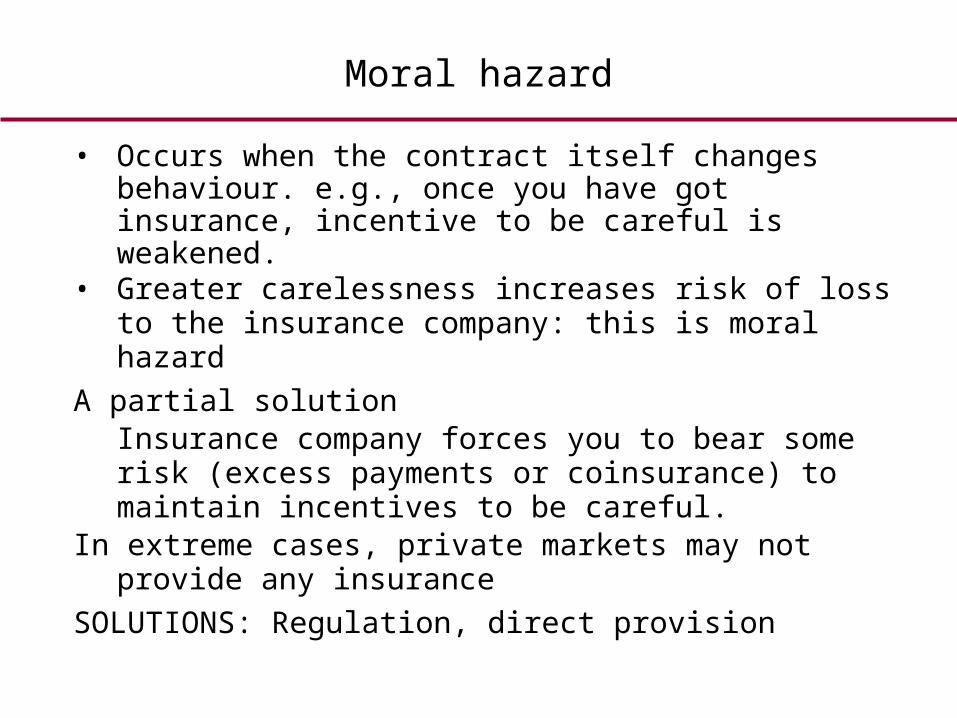
Moral hazard
• Occurs when the contract itself changes behaviour. e.g., once you have got insurance, incentive to be careful is weakened.
• Greater carelessness increases risk of loss to the insurance company: this is moral hazard
A partial solutionInsurance company forces you to bear some risk (excess payments or coinsurance) to maintain incentives to be careful.
In extreme cases, private markets may not provide any insurance
SOLUTIONS: Regulation, direct provision
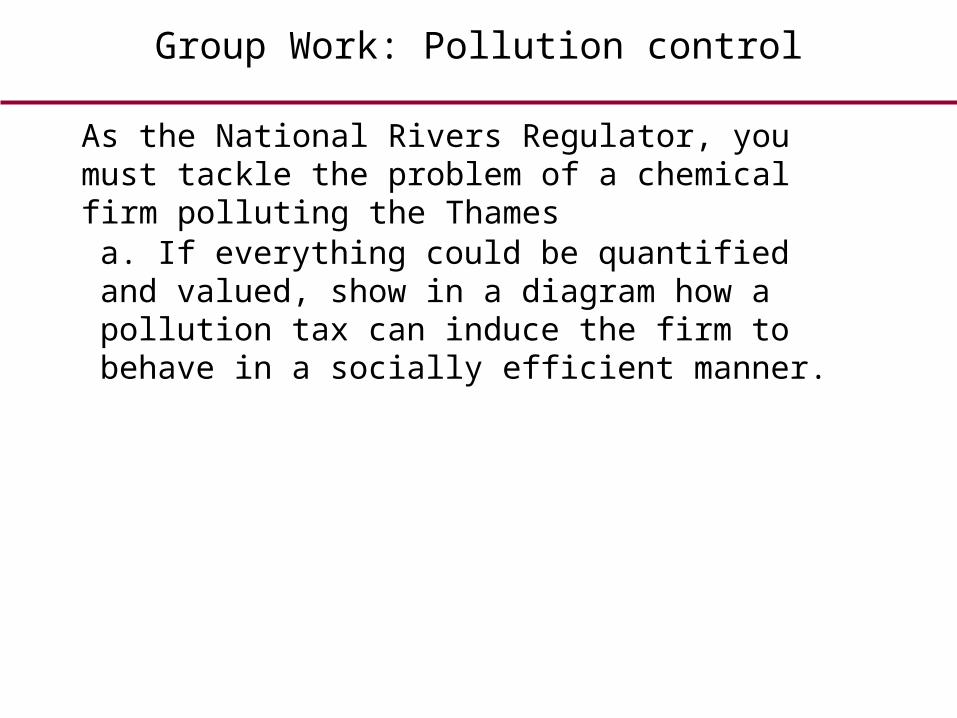
Group Work: Pollution control
As the National Rivers Regulator, you must tackle the problem of a chemical firm polluting the Thames
a. If everything could be quantified and valued, show in a diagram how a pollution tax can induce the firm to behave in a socially efficient manner.
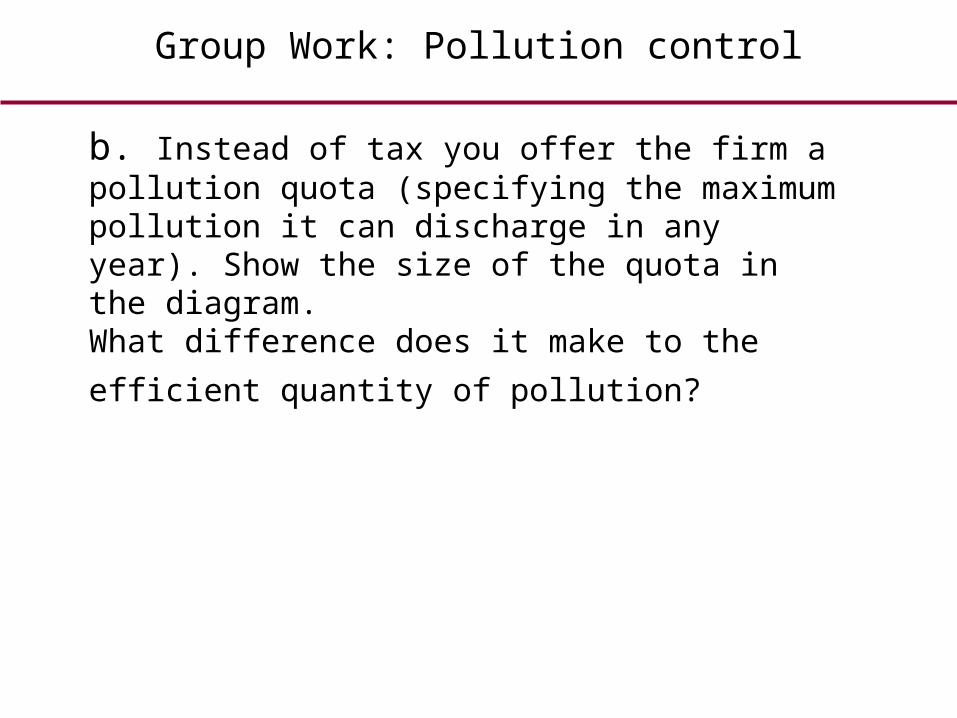
Group Work: Pollution control
b. Instead of tax you offer the firm a pollution quota (specifying the maximum pollution it can discharge in any year). Show the size of the quota in the diagram. What difference does it make to the efficient quantity
of pollution?
Group Work: Pollution control
c. Now suppose information is harder to come by. As the regulator, you are not entirely certain about the firm's cost curve. Does this affect your choice between
tax and quotas?
Group Work: Pollution control
d. Lastly, suppose there are two chemical firms polluting the river, one cleaner than the other. Is it better to
• set a pollution tax? (same rate per unit for both?) • set each a quota? • auction pollution quotas?

Public Spending
Public Spending
Government expenditure: around 40% of GDP • Social insurance: contributory benefits such as
unemployment, sickness, pensions benefits• Equity: non-contributory benefits, such as income
support, housing benefit, family support• Merit goods: what society believes all should have
(externalities or paternalism): benefits-in kind, education, health
• Public goods: law and order, defence• The big three – social security, healthcare and
education – account for 3/5 of the total.

Health care
Health Care: a merit good?
Sources of muddled thinking • an emotional issue • is health a basic right? But so is food • is health care a commodity like any other? like cars,
houses, etc.
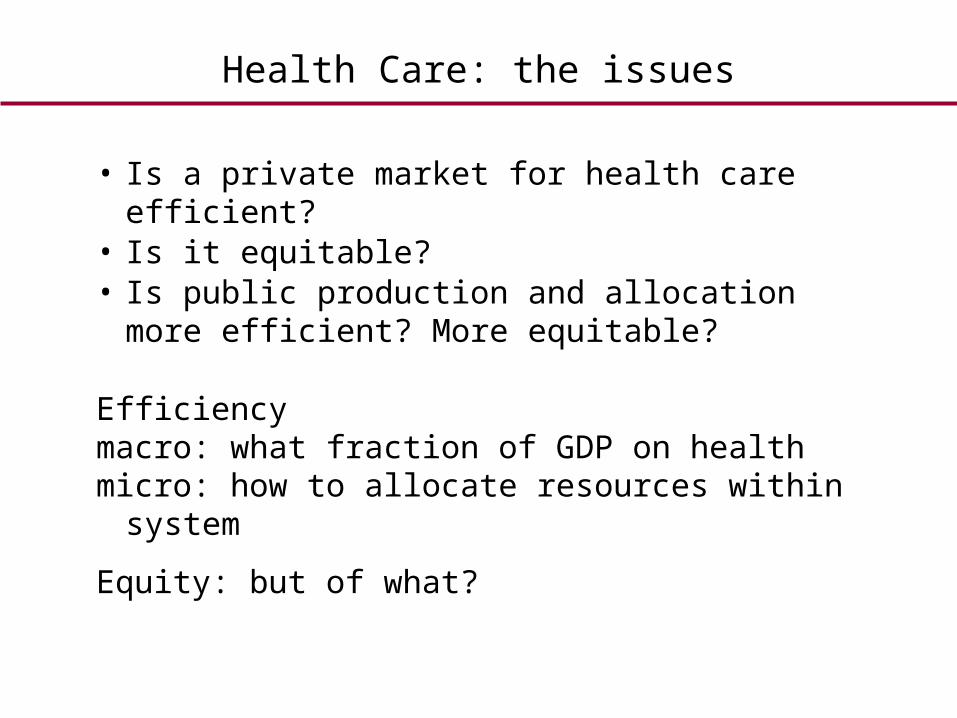
Health Care: the issues
• Is a private market for health care efficient?• Is it equitable? • Is public production and allocation more efficient?
More equitable?
Efficiencymacro: what fraction of GDP on health micro: how to allocate resources within system
Equity: but of what?
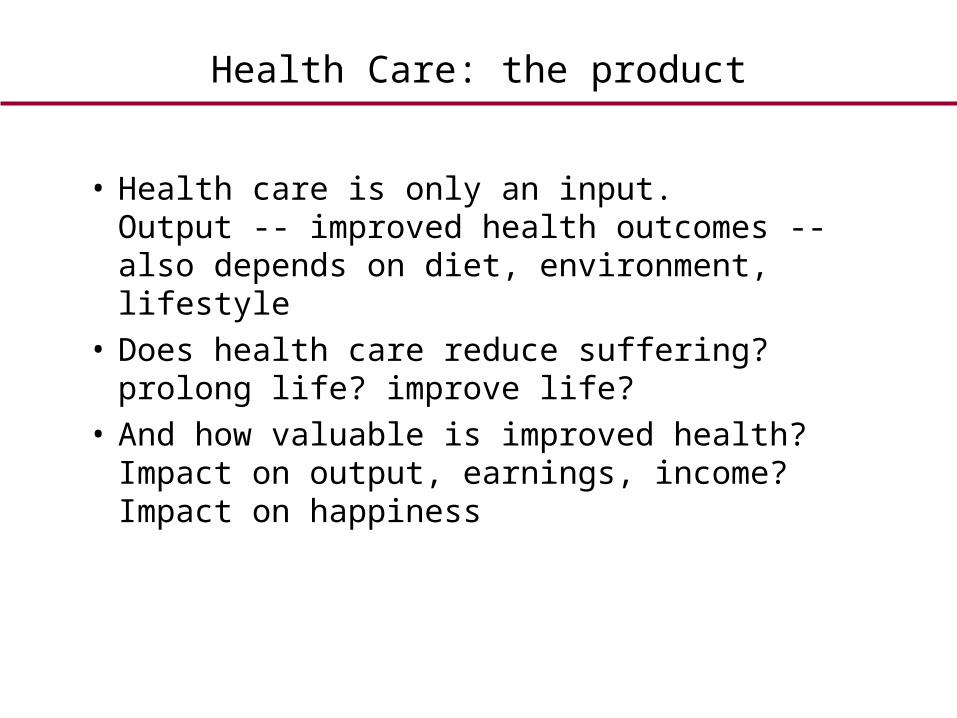
Health Care: the product
• Health care is only an input. Output -- improved health outcomes -- also depends on diet, environment, lifestyle
• Does health care reduce suffering? prolong life? improve life?
• And how valuable is improved health? Impact on output, earnings, income? Impact on happiness
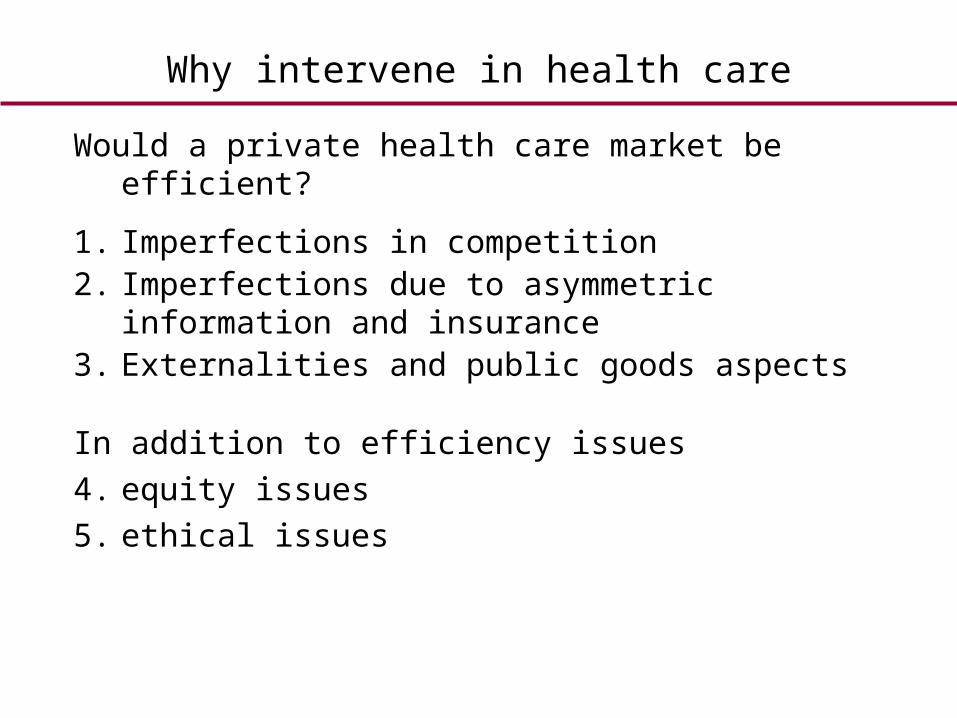
Why intervene in health care
Would a private health care market be efficient?
1. Imperfections in competition2. Imperfections due to asymmetric information and
insurance3. Externalities and public goods aspects
In addition to efficiency issues
4. equity issues
5. ethical issues
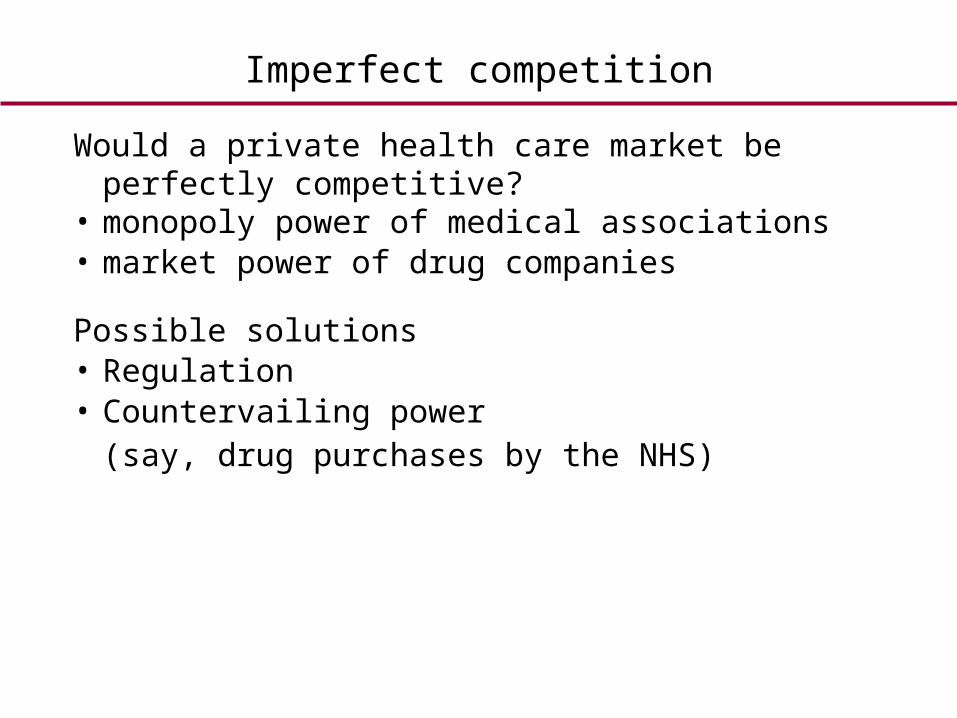
Imperfect competition
Would a private health care market be perfectly competitive?
• monopoly power of medical associations• market power of drug companies
Possible solutions• Regulation• Countervailing power
(say, drug purchases by the NHS)
Imperfect information
Do people know if they are ill? What treatment do they need? What is available?
Here seller (doctor) knows more than buyer • technical complexity of information• patients' inability to weigh alternatives• high cost of errors
In sum, this is hardly rational consumer choice Solutions: provision of information and regulation but
both are costly Public provision?
Problems with Health Insurance
Pattern of demand: small probability of major expenditure
Usually buy insurance in such situations but insurance markets suffer from many problems
• adverse selection: attract especially sick• moral hazard: tendency to ‘over-treat’• correlated risk are hard to insure: epidemics• missing markets for congenital problems
Can intervene to reduce these problems, but causes other problems.
Social insurance?
Externalities and public good
Problem: Communicable diseases are a negative externality
A solution: to subsidise treatment
In general, the public good aspect of basic healthcare
Other reasons for intervention
• Equity arguments
• Moral and ethical argumentsbabies, organs should not be sold
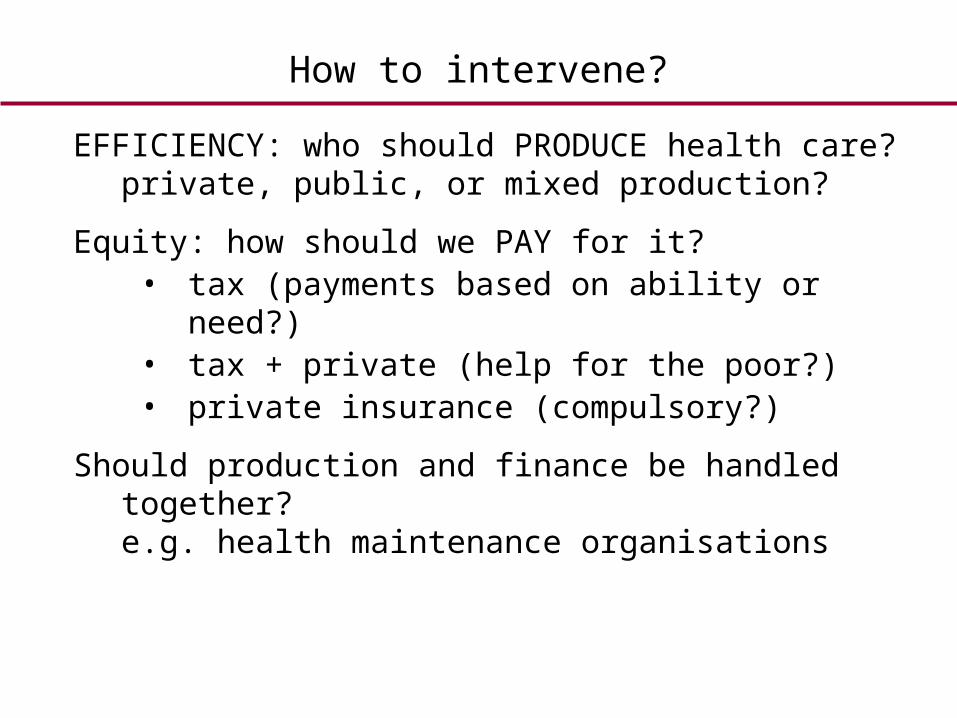
How to intervene?
EFFICIENCY: who should PRODUCE health care? private, public, or mixed production?
Equity: how should we PAY for it? • tax (payments based on ability or need?)• tax + private (help for the poor?)• private insurance (compulsory?)
Should production and finance be handled together? e.g. health maintenance organisations
Other questions
Macro-economic issue
How much should we spend on health? rising cost of health care
• ageing population• more sophisticated (and expensive) treatment

Health care in the UK: case notes
THE PATIENT: NHS• GPs provide primary care: guide and gatekeeper• Since 2003, Foundation Trusts, with financial and
managerial autonomy run hospitals• Primary Care Trusts purchase hospital care,
community services• Strategic Health Authorities to oversee Primary
Care Trusts and NHS Trusts• Department of Health
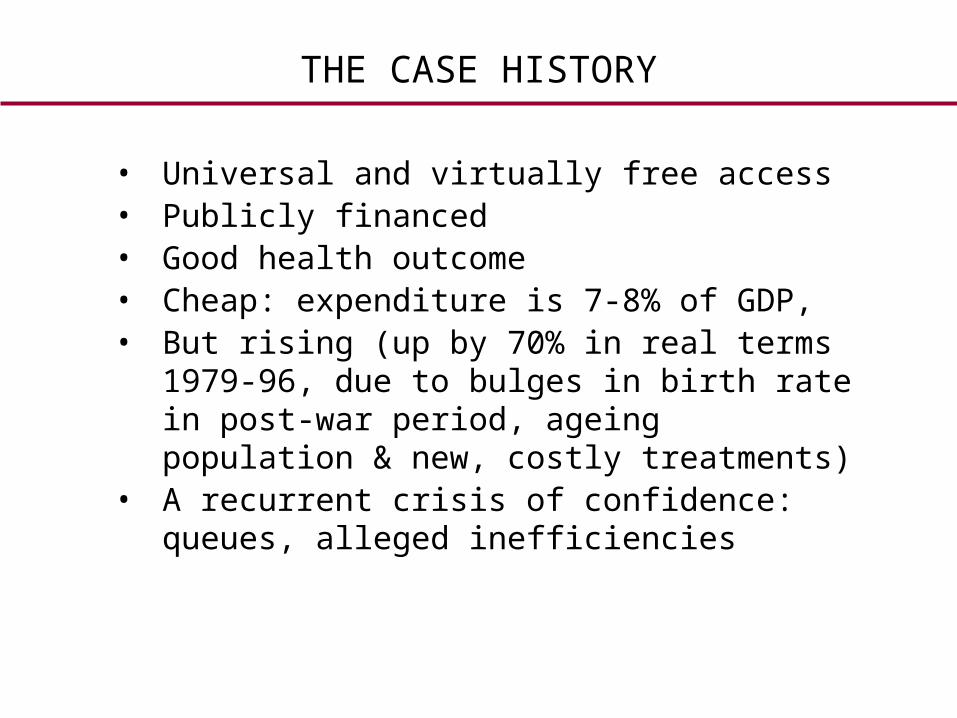
THE CASE HISTORY
• Universal and virtually free access• Publicly financed• Good health outcome• Cheap: expenditure is 7-8% of GDP, • But rising (up by 70% in real terms 1979-96, due
to bulges in birth rate in post-war period, ageing population & new, costly treatments)
• A recurrent crisis of confidence: queues, alleged inefficiencies
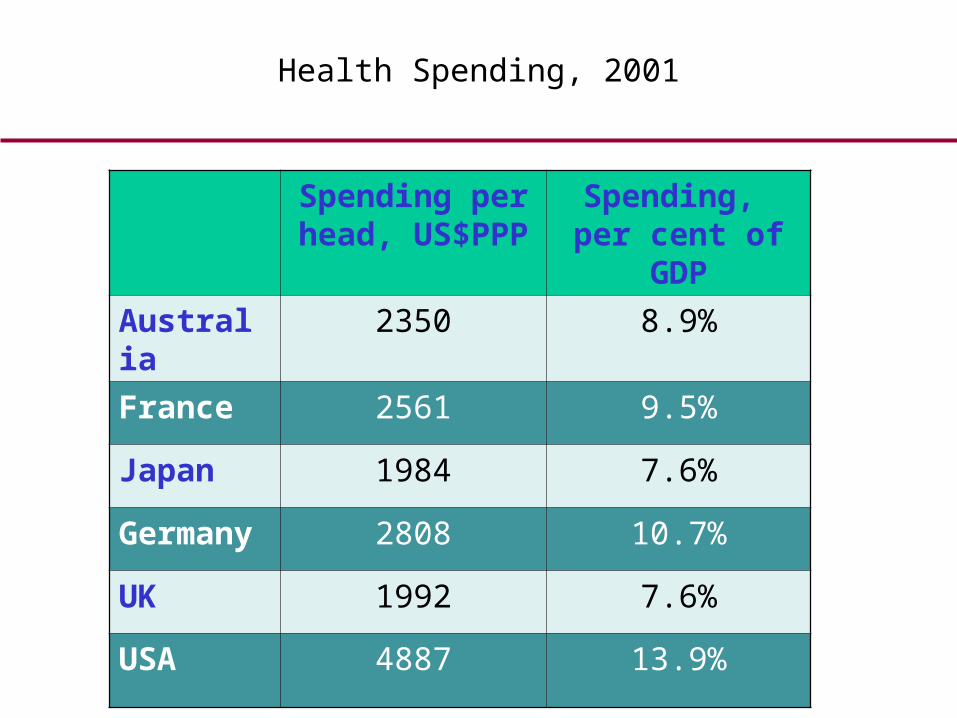
Health Spending, 2001
Spending per head, US$PPP
Spending, per cent of GDP
Australia 2350 8.9%
France 2561 9.5%
Japan 1984 7.6%
Germany 2808 10.7%
UK 1992 7.6%
USA 4887 13.9%
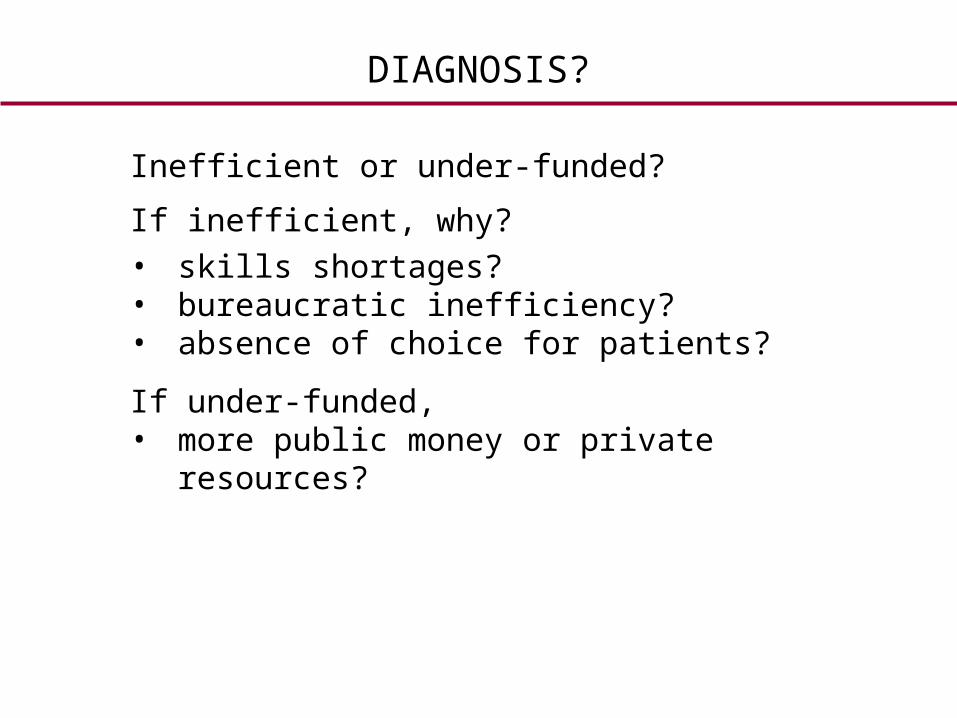
DIAGNOSIS?
Inefficient or under-funded?
If inefficient, why?• skills shortages?• bureaucratic inefficiency?• absence of choice for patients?
If under-funded,• more public money or private resources?
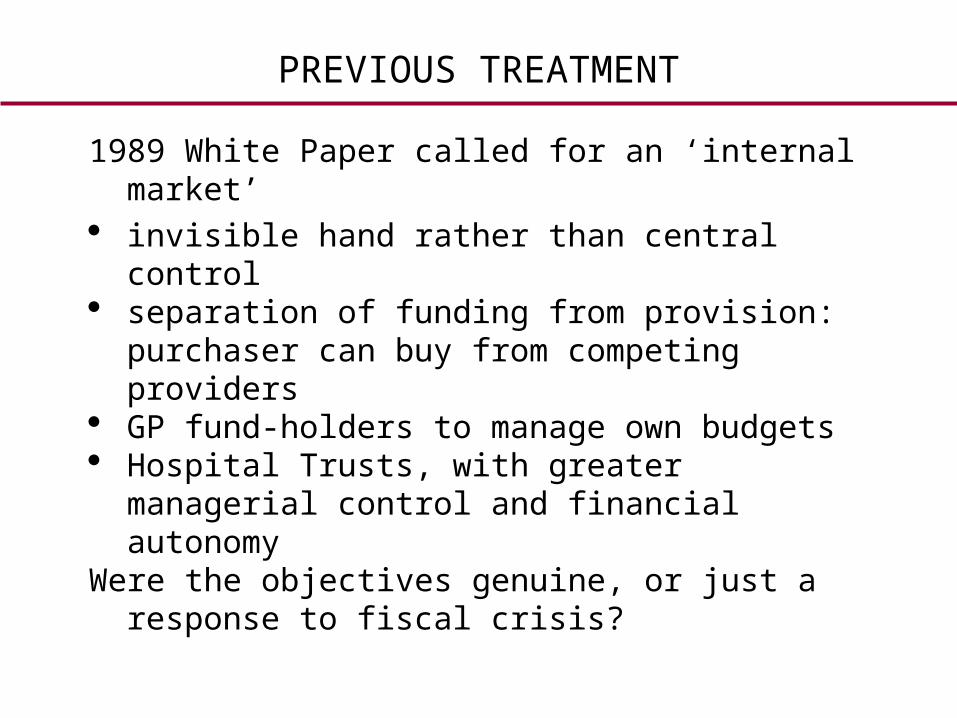
PREVIOUS TREATMENT
1989 White Paper called for an ‘internal market’ invisible hand rather than central control separation of funding from provision: purchaser can
buy from competing providers GP fund-holders to manage own budgets Hospital Trusts, with greater managerial control and
financial autonomyWere the objectives genuine, or just a response to
fiscal crisis?
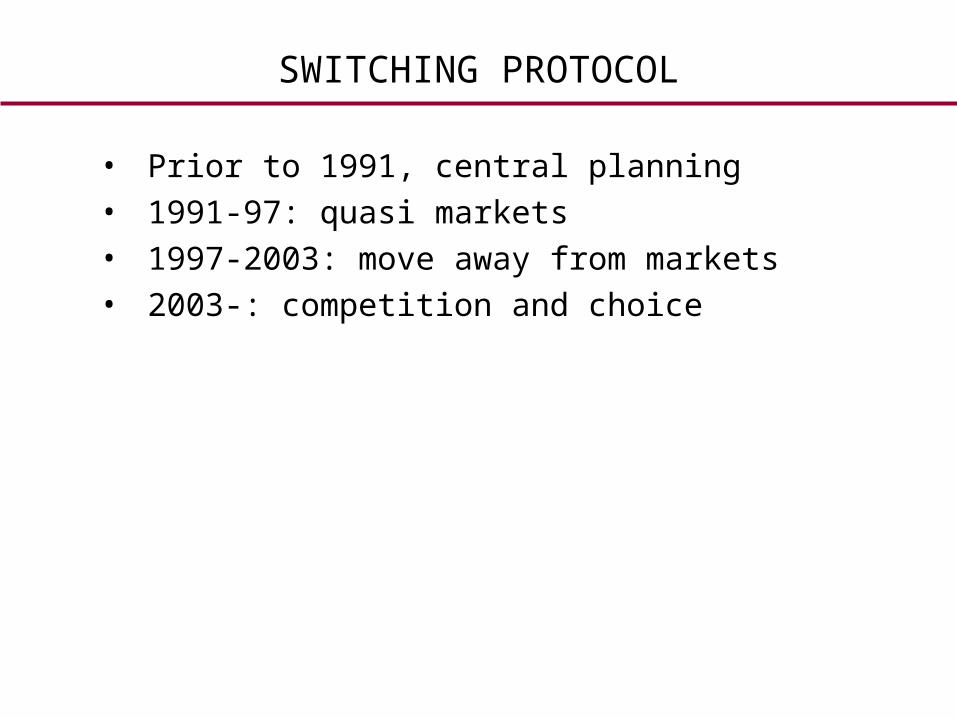
SWITCHING PROTOCOL
• Prior to 1991, central planning• 1991-97: quasi markets• 1997-2003: move away from markets• 2003-: competition and choice
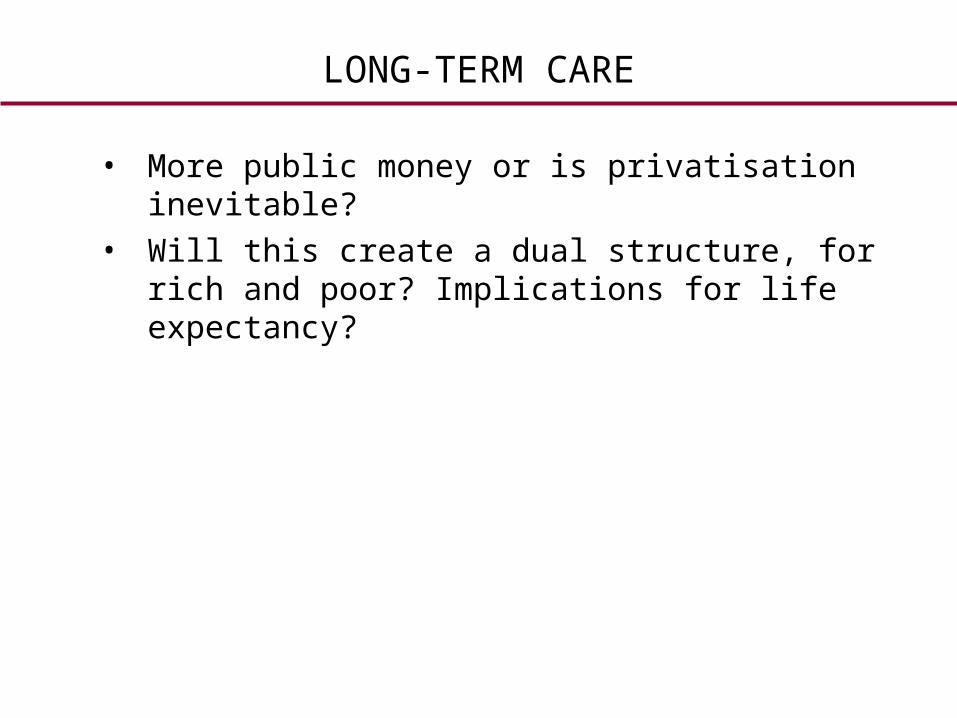
LONG-TERM CARE
• More public money or is privatisation inevitable?• Will this create a dual structure, for rich and poor?
Implications for life expectancy?


Discussion: Education
• Do you expect private markets for education to be efficient? Identify reasons for any market failures.
• Private markets for education may well be inequitable. Should we worry?

Government Failure
Government Failure
• Market failures do not always call for action• We must beware of the possibility of government
failure• For instance, the possibility that governments may
face the same informational constraints as markets• They may also face ‘agency problems’• If so, government intervention could just replace
market failure with government failure
Public versus Private Sector
When comparing public with private sector, it is important to remember that
• public sector losses were sometimes intentional• cost structures differ: Post Office vs private
couriers
Is the public sector inefficient?
Evidence Private sector firms are more efficient PROVIDED they operate in markets with strong competition
Key issue: not ownership, but severity of competition (or competition policy)E.g., many UK utilities improved in RUN-UP to privatisation, while they were still in public hands
But this is not to deny that there have been serious inefficiencies
Agency theory and incentives
Imagine a project where• the agent's effort affects probability of success• effort is unobservable or hard to measure
If so,• the principal needs to provide incentives (carrot or
stick) to induce effort• without incentives, individuals may slack-off
Lesson: incentives matter
Why is the public sector less efficient?
1. The incentives problem• At the organisational level: no fear of bankruptcy, no
competition• At the individual level: not enough carrot (relatively fixed
salary) or stick (relative security of tenure)
In sum, incentive structures are relatively flat
Why not use better incentive schemes in the public sector?
Mostly because measuring success is harder due multiplicity of objectives and poor information
2. Institutional aspects: what DO civil servants do?
Lessons for policy makers
• Market failure does not make an automatic case for intervention (or a helping hand)
• Sometimes government intervention makes matters worse. Informational problems affect both public and private sectors. – regulation may have perverse effects
(fumbling hand)- vulnerability of civil servants to rent-seeking
behaviour (grabbing hand)
• Weigh existing inefficiencies against risk of government failure

Industrial Policy Correcting market failures
INDUSTRIAL POLICY
Central idea: market failure calls for an active role for the government
Examples: intervention can• Assist in the diffusion of new technologies• Circumvent coordination failures, etc.
However, beware the possibility of government failure
New technologies and standards
Problem: uncertainty about new technologies and standards may cause lock-in in to poor standards
Solution: guide technological choices?
Coordination of economic activity
• Location externalities and new lessons in economic geography
• Sunrise industries: correct deficient incentives to acquire skills and imperfection in markets for loans to new firms
• Sunset industries: managing the transition, prevent survival of an inefficiently large number of firms
Cost-Benefit Analysis
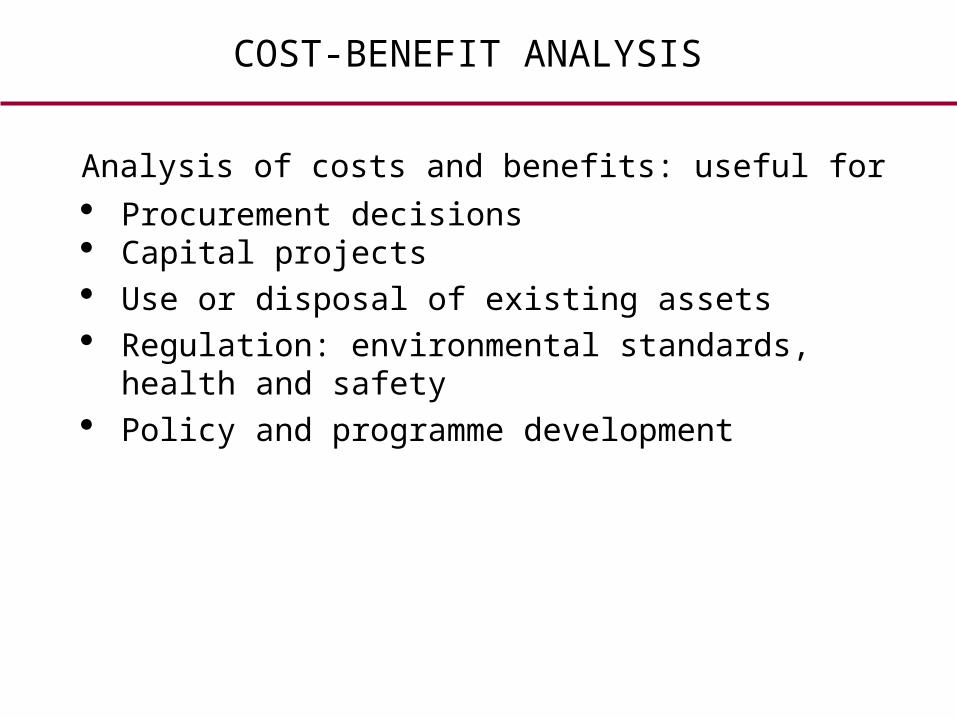
COST-BENEFIT ANALYSIS
Analysis of costs and benefits: useful for Procurement decisions Capital projects Use or disposal of existing assets Regulation: environmental standards, health and
safety Policy and programme development
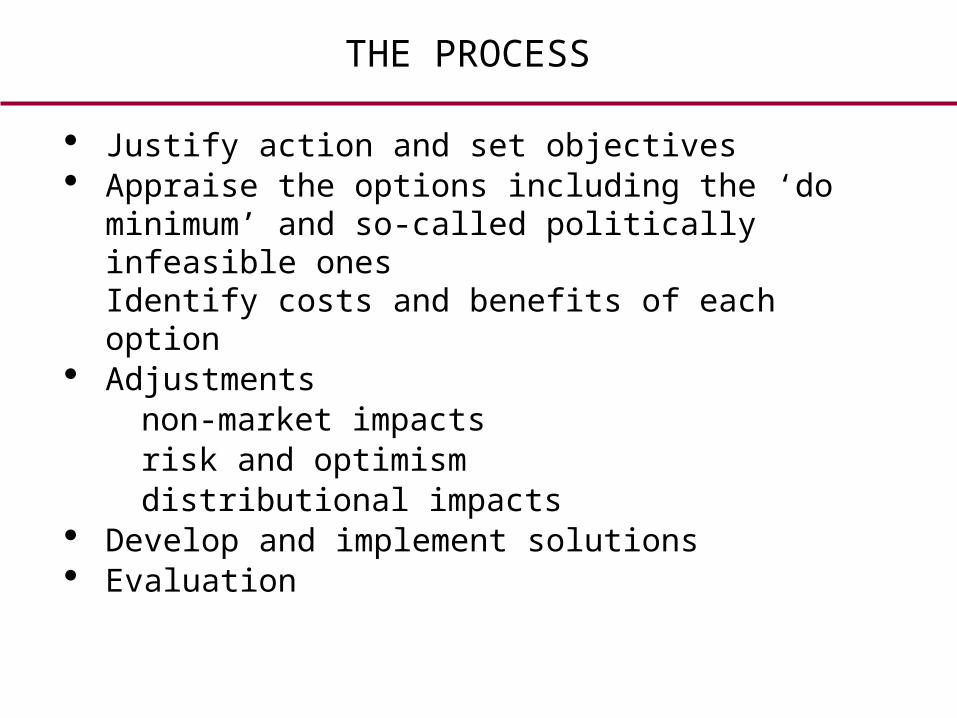
THE PROCESS
Justify action and set objectives Appraise the options including the ‘do minimum’ and so-
called politically infeasible onesIdentify costs and benefits of each option
Adjustmentsnon-market impactsrisk and optimismdistributional impacts
Develop and implement solutions Evaluation
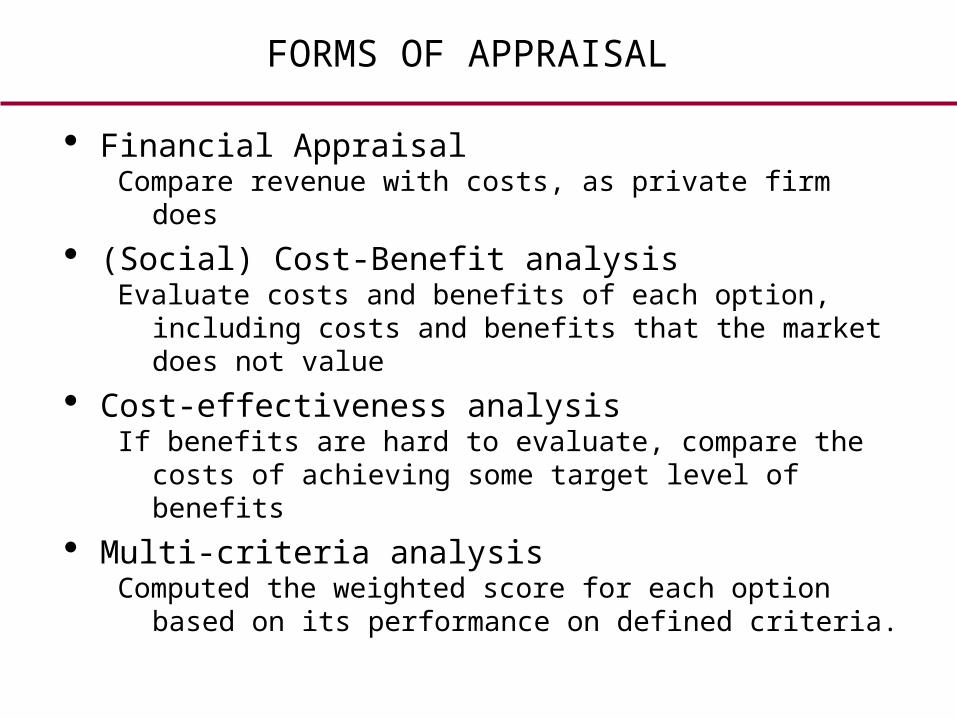
FORMS OF APPRAISAL
Financial Appraisal Compare revenue with costs, as private firm does
(Social) Cost-Benefit analysisEvaluate costs and benefits of each option, including
costs and benefits that the market does not value
Cost-effectiveness analysisIf benefits are hard to evaluate, compare the costs of
achieving some target level of benefits
Multi-criteria analysisComputed the weighted score for each option based
on its performance on defined criteria.
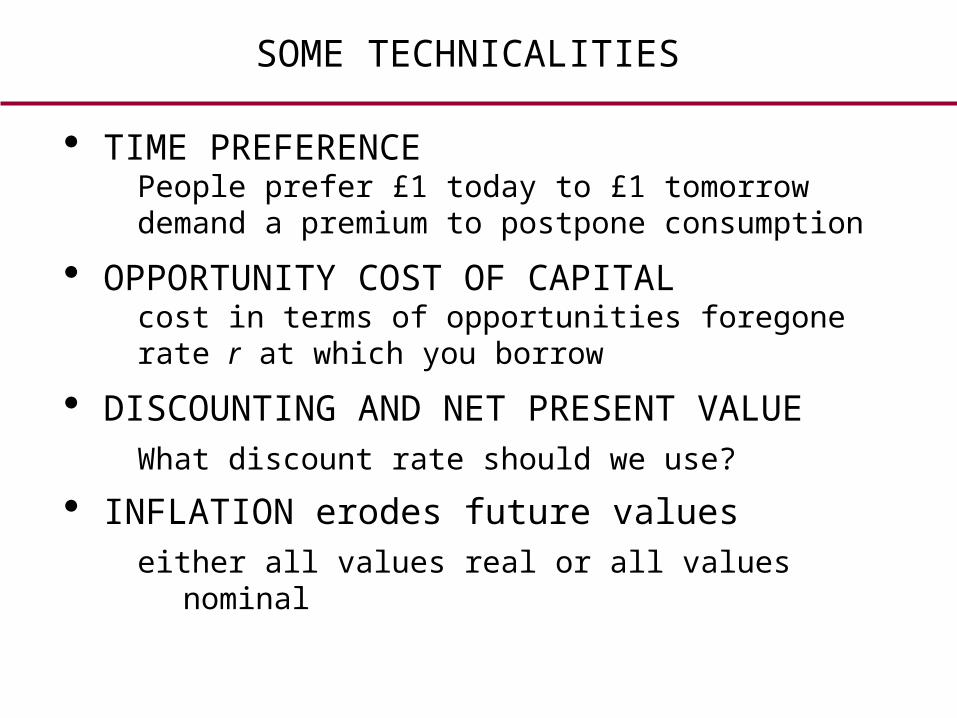
SOME TECHNICALITIES
TIME PREFERENCEPeople prefer £1 today to £1 tomorrowdemand a premium to postpone consumption
OPPORTUNITY COST OF CAPITAL cost in terms of opportunities foregonerate r at which you borrow
DISCOUNTING AND NET PRESENT VALUE What discount rate should we use?
INFLATION erodes future valueseither all values real or all values nominal
Decision rule: Net Present Value Criterion
Forecast the cash flow generated by the project over its lifetime
Assess opportunity cost of capital, and discount future cash flows
Calculate the net present value (NPV): sum of discounted net flows
Decision RuleONE OPTION: Invest if NPV is positiveMANY OPTIONS: Invest in project with highest NPV
All this is easier said than done
SOCIAL COST-BENEFIT ANALYSIS
While private sector cares about profits, government must consider a larger set of benefits and costs
The government uses the Net Present Value criterion but, to the extent social benefits and costs diverge from private benefits and costs, estimates of social NPV could differ
Social rate of time preference may differ from market rates of interest
VALUING NON-MARKET IMPACTS
Evaluate non-market consequences• externalities, including environmental ones• consumers’ surplus• saving of time • saving human life (‘prevented fatality’)• possibilities of catastrophic risk
Often hard to value these. Can use• Willingness to Pay (WTP)• Willingness to Accept (WTA)
Some caveats
Macroeconomic effects• Need not make allowances for broader effects, such
as tax flow-backs, savings in benefit payments, etc. These may happen even if the proposed project is rejected and some other is accepted
What prices should the government use?• Best to use MARKET PRICES. The use of so-called
‘shadow prices’ can be justified only if there is severe market failure.
Other issues
What if the project has irreversible consequence?
Be cautious. Raise the threshold of acceptance for a project to compensate for the irreversibility.
Distributional impact see how costs and benefits affect different groups
The effect of the chosen discount rate
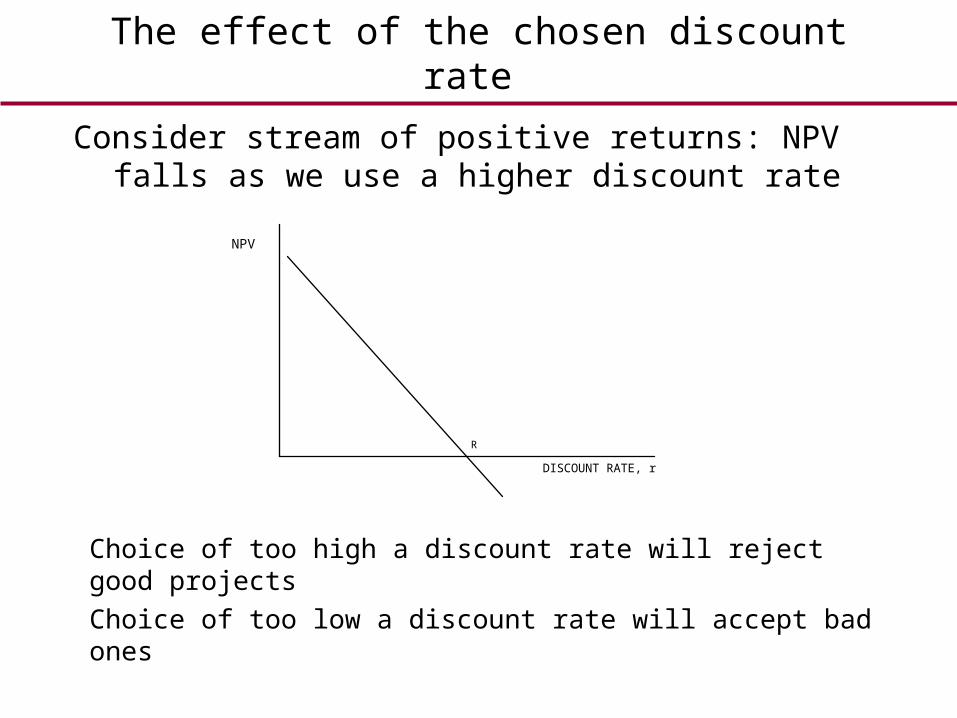
Consider stream of positive returns: NPV falls as we use a higher discount rate
DISCOUNT RATE, r
NPV
R
Choice of too high a discount rate will reject good projects
Choice of too low a discount rate will accept bad ones
What discount rate should the government use?
• Should it use the market rate at which private firms attract finance?
• In THEORY, the answer depends on aggregate impact of all public investment on private investment and consumption
• In PRACTICE, government uses a fixed rate of ‘social time preference’ for consistency.– was set at 6% pa in real terms– now has been ‘stripped’ down to 3.5%
• Lower rates for long-term projects
Risk and Uncertainty
What if benefits or cost are uncertain? Private firms add some risk premium to the discount
rate: this lowers NPV, making acceptance of risky project less likely
Should the government discount risk?In principle, if the government can spread risk very thinly across the population, answer is NO.
In practice, risk evaluation and management is an important part.
Managing and Evaluating Risk
IDENTIFY all risks Assess what can be transferred, at low cost, to the
private sector Use of pilot projects to learn more about costs and
benefits. Use flexible designs avoid the risk of being hostage to fortune.
Eliminate optimism bias Monte Carlo analyses: sensitivity analyses to look at
NPV of project under alternative assumptions about the value of uncertain parameters
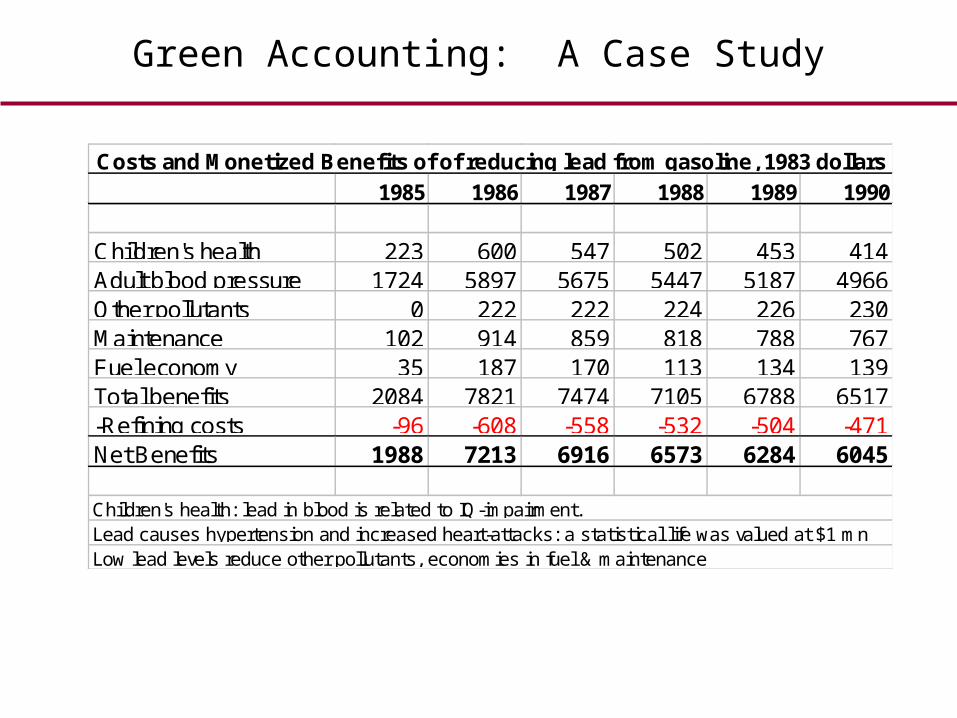
Green Accounting: A Case Study
1985 1986 1987 1988 1989 1990
Children's health 223 600 547 502 453 414Adult blood pressure 1724 5897 5675 5447 5187 4966Other pollutants 0 222 222 224 226 230Maintenance 102 914 859 818 788 767Fuel economy 35 187 170 113 134 139Total benefits 2084 7821 7474 7105 6788 6517-Refining costs -96 -608 -558 -532 -504 -471Net Benefits 1988 7213 6916 6573 6284 6045
Costs and Monetized Benefits of of reducing lead from gasoline, 1983 dollars
Children's health: lead in blood is related to IQ-impairment.Lead causes hypertension and increased heart-attacks: a statistical life was valued at $1 mnLow lead levels reduce other pollutants, economies in fuel & maintenance


The Welfare State
Supply-side economics
Central idea
Force government OUT of market place, to unleash private sector dynamism.
Use microeconomic incentives to increase productivity
Supply-side economics: suggestions
• Cut marginal tax rates to provide incentive for hard work). Cut the dole, to increase labour participation. If output goes up a lot, tax revenue may even rise
• Cut taxes on savings, dividends, to reduce distortions• Rein in the state, cut govt spending (cut real interest
rates), encourage privatisation• Reform labour market (curb the Trade Unions)
Encourage profit-sharing schemes to incentivise workers, vocational training, etc.
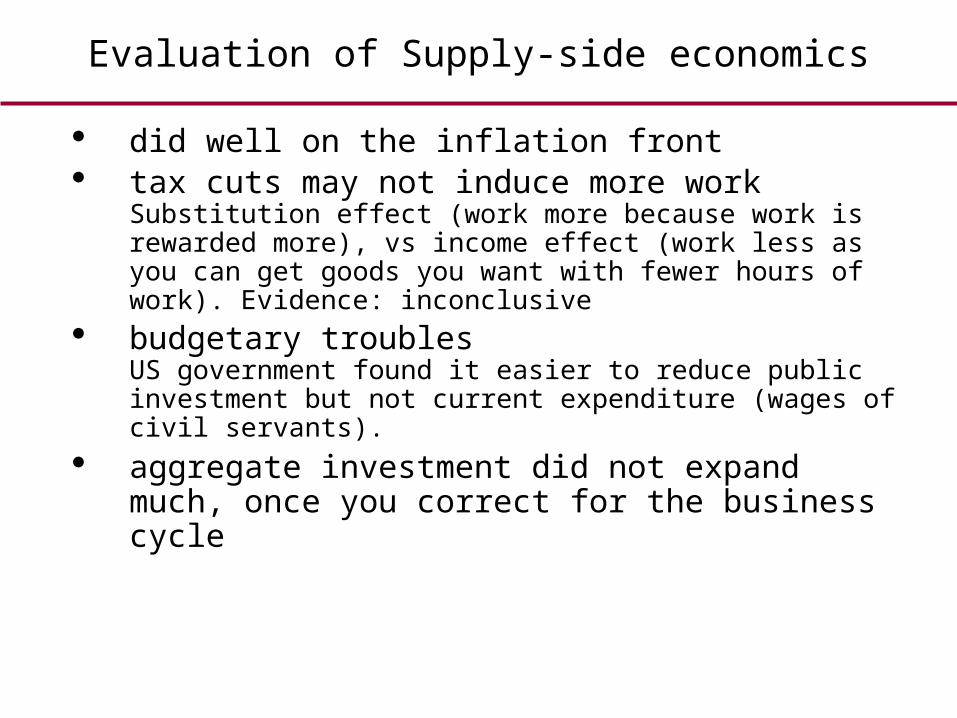
Evaluation of Supply-side economics
did well on the inflation front tax cuts may not induce more work
Substitution effect (work more because work is rewarded more), vs income effect (work less as you can get goods you want with fewer hours of work). Evidence: inconclusive
budgetary troublesUS government found it easier to reduce public investment but not current expenditure (wages of civil servants).
aggregate investment did not expand much, once you correct for the business cycle
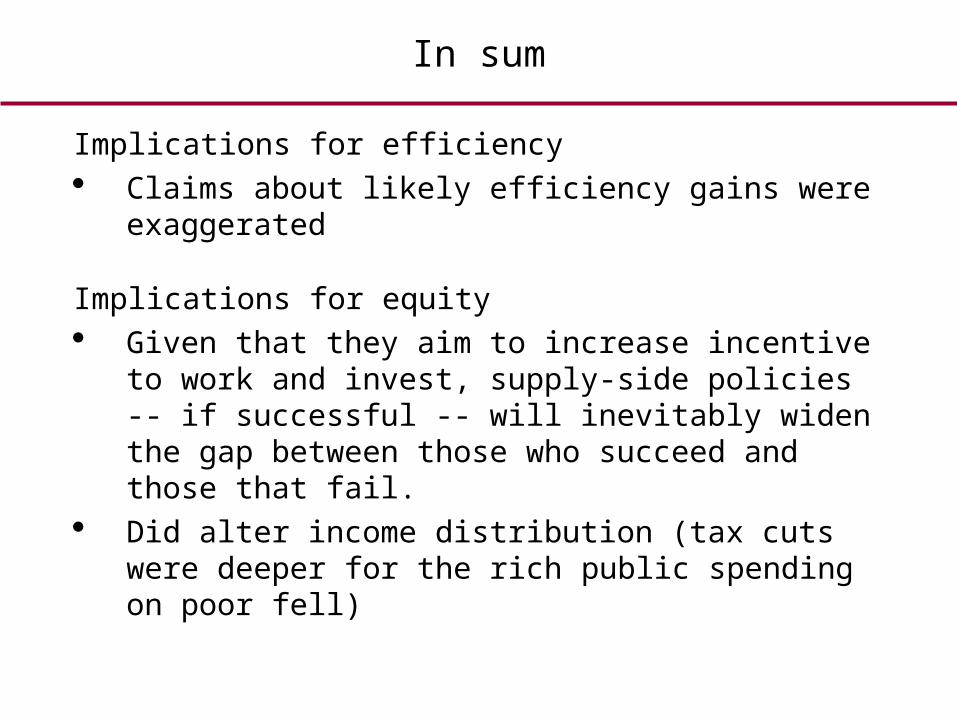
In sum
Implications for efficiency Claims about likely efficiency gains were exaggerated
Implications for equity Given that they aim to increase incentive to work and
invest, supply-side policies -- if successful -- will inevitably widen the gap between those who succeed and those that fail.
Did alter income distribution (tax cuts were deeper for the rich public spending on poor fell)
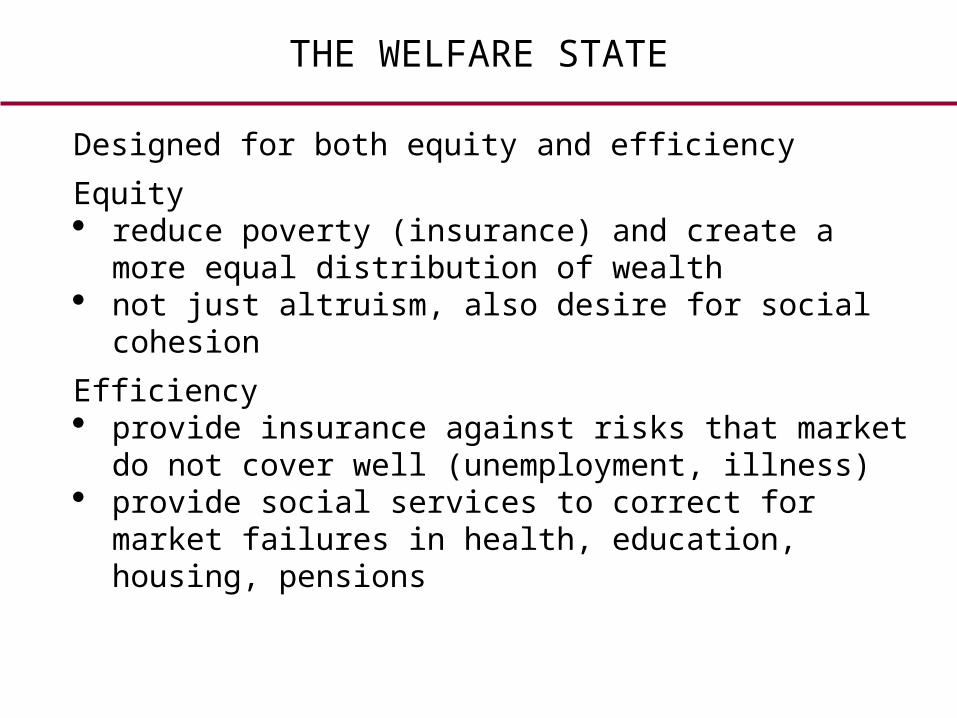
THE WELFARE STATE
Designed for both equity and efficiency
Equity reduce poverty (insurance) and create a more equal
distribution of wealth not just altruism, also desire for social cohesion
Efficiency provide insurance against risks that market do not cover
well (unemployment, illness) provide social services to correct for market failures in
health, education, housing, pensions
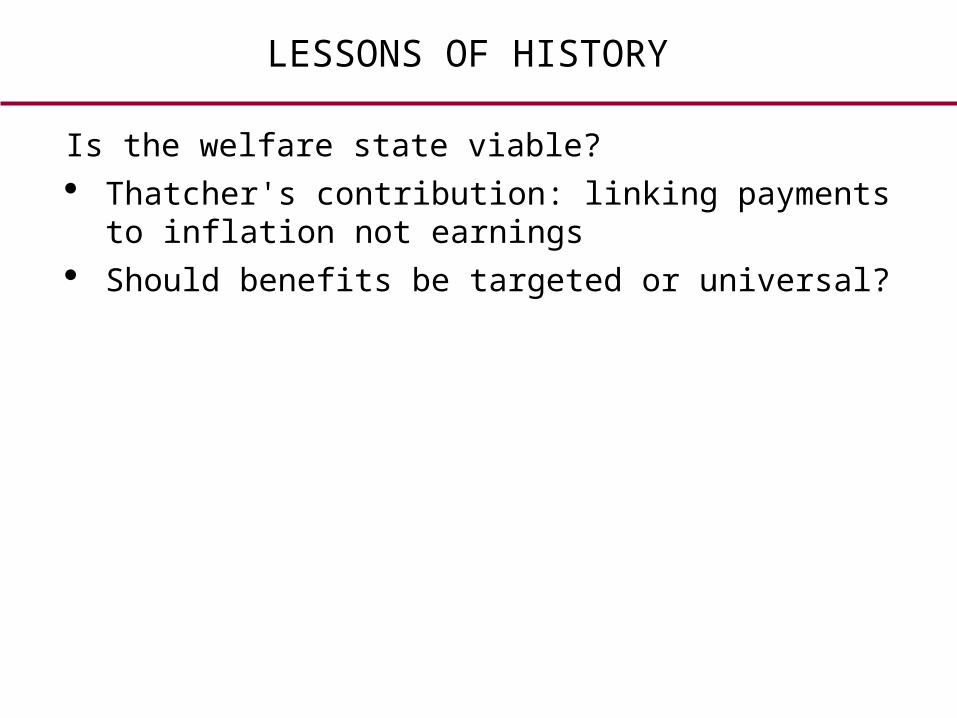
LESSONS OF HISTORY
Is the welfare state viable? Thatcher's contribution: linking payments to inflation not
earnings Should benefits be targeted or universal?
Further reading
John Kay, The Truth about Markets: their genius, their limits, their follies, Penguin, 2004
Nicholas Barr, The Economics of the Welfare State, 4th edition, Oxford University Press, 2004