ECONOMICS TRENDS AND PROSPECTS FOR THE RENEWABLE ENERGY ... · ECONOMICS . TRENDS AND PROSPECTS FOR...
35
ECONOMICS TRENDS AND PROSPECTS FOR THE RENEWABLE ENERGY SECTOR IN THE EAS REGION by Yanrui Wu Business School University of Western Australia DISCUSSION PAPER 13.33
Transcript of ECONOMICS TRENDS AND PROSPECTS FOR THE RENEWABLE ENERGY ... · ECONOMICS . TRENDS AND PROSPECTS FOR...

ECONOMICS
TRENDS AND PROSPECTS FOR THE RENEWABLE ENERGY SECTOR IN THE EAS
REGION
by
Yanrui Wu
Business School University of Western Australia
DISCUSSION PAPER 13.33

TRENDS AND PROSPECTS FOR THE RENEWABLE ENERGY SECTOR IN THE EAS REGION
Yanrui Wu
Professor in Economics
UWA Business School
University of Western Australia
Australia
DISCUSSION PAPER 13.33

ABSTRACT
The rising prices of fossil fuels and deteriorating environment in the world have made renewable
energy the brightest business in the energy sector. In fact, as the world’s fossil fuel resources are
limited and gradually depleting, renewable energy could be the main source of energy in the
future. Thus, developments in the renewable energy sector could have important implications for
the world. In particular, the East Asia Summit (EAS) countries as a group are net energy
importers and hence have a keen interest in renewable energy development. This is not only
related to energy consumption in the region but also linked with the goal of promoting energy
market integration within the EAS group. The objectives of this study are twofold, namely, a) to
present a review of the trends in the renewable energy sector and b) to shed light on the prospects
of development and growth in this sector within the EAS area. Specifically, this project will
review the status and trends of renewable energy development among the EAS members. It will
provide a comparative perspective in renewable energy policy and business development in the
EAS region. It will explore the prospects of future development and growth in renewable energy
and the role of renewable energy in energy market integration within the EAS energy sector.
Key words: Renewables, EAS group, energy market integration
JEL codes: Q40, Q42, Q47

1. Introduction
With the rising awareness of environmental degradation and rapid depletion of fossil fuel
resources, renewable energies (REs) or renewables have attracted the attention of policy makers
as well as energy experts worldwide. The East Asian Summit (EAS) nations as major energy
consumers are also keen to develop their RE sectors. Many EAS countries have adopted specific
policies to promote their RE sectors.1To gain more insight into the RE industry, this paper aims
to present an overview of the status and trends of development in the RE sectors among EAS
members. It will also discuss the implications of RE development for energy market integration
(EMI) policy and business in the EAS region.
The rest of the paper starts with a review of the RE industry in the world (Section 2). This is
followed by discussion of the RE sector in the EAS economies (Section 3). The outlook for REs
and the potential drivers and hindrances for RE growth in the EAS region are then explored
(Section 4). The key findings and policy recommendations are presented in Section 5.
2. The Global RE Industry
REs broadly include energies sourced from sunlight (solar), water (hydro), wind, biomass,
marine (wave), tides (tidal) and geothermal heat. In the existing literature the exact coverage of
REs is not without controversy. For example, biomass can be divided into traditional and modern
biomass. Traditional biomass includes wood, charcoal, crop residues and animal dung mainly
used for cooking and heating while modern biomass refers to biogas and liquid biofuels (such as
1For detailed discussions of RE policies in the EAS region, seeOlz and Beereport(2010), Ipsos (2012) and IRENA (2013b).
1

biodiesel and biogasoline).The use of biomass could be sustainable or unsustainable
(Goldemberg and Coelho 2004). Hydropower is generally classified into traditional or large
hydroelectric power and small hydropower. The latter is assumed to be more environment-
friendly. The measurement of REs by several key organizations also varies. A major problem is
the measure of non-commercial - energies which are dominated by traditional biomass. It is
argued that about 20-40 per cent of biomass use is not reported in official energy statistics (IPCC
2012). Due to this complication, BP (2012) reports traded or commercial energy statistics only.
According to the International Energy Agency (IEA), REs accounted for about 13.0 per cent of
the world’s total energy production in 2010 including 9.8 per cent from biomass, 2.3 per cent
from hydroelectricity and 0.9 per cent from other REs (Figure 1). In recent years (2006-2010),
REs in the world recorded an average annual rate of growth of 3.05 per cent which is higher than
the growth rate (2.31 per cent) of the world’s total primary energy supplies (TPES) in the same
period.2
2 These growth rates are computed using data from the OECD (2013). 2

Source: IEA (2012a).
Figure 1 Composition of Global Energy Production in 2010
In absolute terms all RE supplies in 2010 totaled about 1657 million tons oil equivalent (Mteo)
of which three-quarters are generated by biomass and renewable wastes, 18 per cent by hydro
and 7 per cent by other REs (IEA 2012a). The latter include geothermal (4.0 per cent), wind (1.8
per cent) and solar and tide (1.2 per cent). Though the “other REs” have the smallest share, some
products in this category have recorded high growth in production in recent years. For example,
growth has been exceptionally high for solar photovoltaic (PV) and wind (Figure 2). Other
products with two-digit growth rates include biofuels (biogases and liquid biofuels) and solar
thermal energies according to the same source. The main driving force for the rapid growth in
REs is the declining production cost and hence RE prices in recent years.
Oil 32.2%
Other renewables
0.9%
Coal 27.3%
Nuclear 5.6%
Natural gas 21.6%
Hydro 2.3%
Biomass 9.8%
Others 0.3%
3

Note: The percentage growth rates are computed using data from the OECD (2013).
Figure 2 Annual Growth Rates, 2001-2010
Regional shares of TPES and REs are presented in Table 1. As it is shown in this table, the
underperforming regions where RE shares are lower than their TPES shares are the Middle East,
OECD, and non-OECD Europe and Eurasia. In Africa, Latin America and Asia, REs have
relatively high shares largely due to the use of biomass in these regions. In addition, the world’s
major energy consumers (top-5) accounted for about 52.7 per cent of the world’s TPES in 2010
while their RE production share was only 37.5 per cent in the same period according to Table
1.Thus, the world’s large energy consumers should boost their efforts to promote RE production
and consumption.
-10
0
10
20
30
40
50
60
70
2001 2002 2003 2004 2005 2006 2007 2008 2009 2010
Hydro Geothermal
Biodiesel Biogasoline
Tidal Wind
Solar PV Solar thermal
Biogas
4

Table 1 TPES and RE Shares by Region and in Selected Countries, 2010
_________________________________________________ Regions/countries TPES (%) REs (%) Latin America 5.0 11.1 Middle East 5.1 0.2 Africa 5.5 20.4 Non-OECD Europe and Eurasia 9.0 2.6 Asia 31.9 40.3 OECD 43.5 25.4 World 100.0 100.0 China 19.7 16.9 United States 17.8 7.5 Russian Federation 5.6 1.1 India 5.5 11.0 Japan 4.0 1.0 Sub-total 52.7 37.5 _________________________________________________ Note: TPES and RE are abbreviations for total primary energy supplies and renewable energy, respectively. The numbers are calculated by the author using raw data from the IEA (2012a).
The share of REs in TPES also varies across the groups. REs have relatively high shares in
Africa, Asia and Latin America due to dominant use of biomass (Table 2). For example, in
Africa, biomass amounted to 96.9 per cent of total REs. In these regions, as commercial energies
become more affordable, the share of biomass out of TPES and REs is expected to decline and
thus, the share of REs over TPES is also likely to decline over time Globally, traditional biomass
share over total REs fell from 50 per cent in 2000 to 45 per cent in 2010 (IEA 2012b).
5

Table 2RE Shares over Total Primary Energy Supplies (TPES) in 2010
Regions/countries RE/TPES
(%) Biomass/RE
(%) Hydro/RE
(%) Others/RE
(%)
Middle East 0.5 14.7 46.4 38.8 OECD 7.8 57.4 27.6 15.0 United States 5.6 67.2 18.0 14.7 Japan 3.3 36.1 42.6 21.3 Non-OECD Europe and Eurasia 3.9 36.4 61.8 1.8
Russian Federation 2.6 16.7 80.9 2.4 Africa 49.4 96.9 2.7 0.5 Latin America 29.8 65.6 32.5 1.9 Asia 37.1 81.0 12.6 6.4 China 11.4 72.1 22.2 5.7 India 26.5 93.5 5.4 1.1 World 13.0 75.2 18.0 6.8
Notes: TPES and RE are abbreviations for total primary energy supplies and renewable energy, respectively. The numbers are calculated by the author using raw data from the IEA (2012a).
There is also considerable variation among individual countries which reflects the impact of
energy policies as well as differences in resource endowment. As the largest energy consumer,
China is also the largest RE producer and consumer (Table 1). In relative terms, REs only have a
share over total consumption of less than 10 per cent in the US, Japan and Russia. If biomass is
excluded from the REs, RE shares over TPES in 2010 were 3.2, 2.2, 2.1, 1.8 and 1.7 per cent in
the world’s top five energy consuming economies (China, Russia, Japan, the US and India),
respectively. Therefore the role of REs is still small among the world’s major energy players.
In absolute terms, China not only tops the list of the world’s largest RE producers but is also the
largest supplier of biomass and hydropower, and second to the US in terms of other RE supplies
(wind, solar and so on) (Table 3). In 2010, about 19.4 per cent of the world electricity was
6

generated from REs (IEA 2012a). However, REs play the dominant role in power generation in
some countries. For example, the percentage shares of electricity production from REs in 2010
were 100 in Iceland, 95.7 in Norway, 73.3 in New Zealand, 66.4 in Austria and 60.9 in Canada
(IEA 2012a).
Table 3 Top-10 RE Supplies in the World (MTOE), 2010
Source: OECD (2013).
Due to the resources and technology constraints there are considerable variations in the role of
RE products among the countries. For example, wind power generation has a significant share in
total electricity generation in Denmark (21%), Portugal (18%), Spain (15%), Ireland (10%)and
Germany (6%); geothermal sources account for more than a quarter of total electricity generated
in Iceland, and more than a fifth in El Salvador and Kenya.3
In terms of consumption, REs are dominantly used in the residential, commercial and public
sectors (with a share of 52.5 per cent in 2010). This is largely due to the use of biomass for
3These shares are calculated using the data of electricity production from the World Bank (2012), wind energy supply from IEA (2012a) and geothermal energy supply from the OECD (2013).
Ranking Total Biomass Hydro Others1 China 280.3 China 202.1 China 62.2 United States 18.42 United States 124.9 Nigeria 94.8 Brazil 34.7 China 16.03 Brazil 116.7 United States 84.0 Canada 30.2 Mexico 5.94 Nigeria 95.4 Brazil 81.4 United States 22.5 Italy 5.95 Canada 42.9 Ethiopia 31.0 Russia 14.3 Germany 5.26 Germany 32.5 Pakistan 28.9 Norway 10.1 Spain 4.87 Pakistan 31.6 Germany 25.5 Venezuela 6.6 Iceland 3.38 Ethiopia 31.4 Congo 22.2 Sweden 5.7 Turkey 2.69 Congo 22.9 Tanzania 17.8 France 5.4 El Salvador 1.310 France 21.0 France 14.6 Paraguay 4.7 Kenya 1.2
7

cooking and heating in developing countries. Only 28.5 per cent of REs were used for electricity
and heat production and 3.5 per cent were consumed in the transport sector. However, about a
half of REs in OECD countries is used for the production of electricity and heat (IEA 2012a).
Overall, the role of REs in the world energy has expanded and is still increasing. There are large
differences across the country groups and between the RE products. In general, growth in hydro
and geothermal energies is modest and that in traditional biomass has shown a declining trend.
Further growth in REs will rely on biofuels, wind power and solar energies.
3. REs in the EAS Economies
In 2010, EAS economies as a group accounted for 35.7 per cent of the world’s TPES (Table 4).
In the same year the group also supplied 38.6 per cent of the world’s REs.4 In terms of product
mix, EAS economies have done proportionately better in biomass and other REs according to
Table 4. Three EAS members, namely China, Japan and India, are among the world’s top-5
energy consumers as shown in Table 1. However neither Japan nor India is listed as the world’s
top-10 RE producers (Table 3). Several relatively low income countries, such as, Myanmar,
Cambodia and the Laos still rely largely on biomass as the main source of energy supplies (Table
4).
Overall, about 14 per cent of EAS group’s TPES were drawn from REs in 2010. This figure is
compatible with the world average (13 per cent) in the same year. Similar to the world trend,
biomass dominates REs - in the EAS region as well. In general, EAS as a group follows the
global trend in RE development, although some EAS members such as, Brunei, Singapore, South
4 This figure is estimated using the numbers in Table 4. 8

Korea, Japan, Australia and Malaysia seem to be lagging behind (Table 4). These variations, in
terms of country as well as product mix are described in detail below.
Table 4 RE Shares in EAS Economies, 2010 ________________________________________________________ Members TPES Shares (%) (MTOE) Bio Hydro Other REs Non-REs China 2438 8.3 2.6 0.7 88.5 India 688 24.8 1.4 0.3 73.5 Japan 497 1.2 1.4 0.7 96.7 Korea 250 0.5 0.1 0.1 99.3 Indonesia 208 26.0 0.7 7.8 65.5 Australia 125 4.1 0.9 0.5 94.5 Thailand 117 19.3 0.4 0.0 80.3 Malaysia 73 4.7 0.8 0.0 94.5 Vietnam 59 24.8 4.0 0.0 71.2 Philippines 38 12.6 1.8 22.3 63.4 Singapore 33 0.6 0.0 0.0 99.4 New Zealand 18 6.5 11.7 20.8 61.0 Myanmar 14 75.3 3.1 0.0 21.6 Cambodia 5 72.0 0.1 0.0 27.9 Brunei 3 0.0 0.0 0.0 100.0 Laos 2 67.0 13.0 0.0 20.0 EAS 4568 11.0 1.9 1.1 86.0 World 12782 9.8 2.3 0.9 87.0 ________________________________________________________ Source: Author’s own calculations using data from the IEA (2012a) and IRENA (2013a).
9

Biomass
Traditionally, biomass has been a popular energy source for cooking and heating in Asia. As
energy consumption increases and resources deplete rapidly, biomass as a source of energy will
decline. This trend is evident in Figure 3 which shows clearly the declining trend of biomass
shares over total energy supplies as per capita income rises among the EAS economies. Thus, it
is anticipated that biomass as a share over TPES is likely to fall in countries such as Myanmar,
Cambodia and the Laos which currently rely on biomass as the main source of energy for the
households. The same may also occur in Indonesia, India, Vietnam and Thailand which currently
obtain about one-quarter of their energy supplies from biomass (Table 4).
Notes: The biomass shares are from Table 4. GDP per capita was drawn from the World Bank (2012). Figure 3 Biomass Shares over TPES and GDP per capita, 2010
0.0
10.0
20.0
30.0
40.0
50.0
60.0
70.0
80.0
0 10000 20000 30000 40000 50000 60000
%
US$
10
The decline in the use of traditional biomass is due to its inefficiency and unsustainability. With
an increase in income levels, the consumers tend to use more commercial energies. However,
there is potential growth in the production of biofuels in the EAS area. One example is the
production of palm biodiesel which could be based on the large palm oil sector in Southeast Asia.
In fact, several EAS members have started the production of biodiesel in recent years. In 2010,
Thailand was the largest producer with a production output of 454 kilotonnes oil equivalent (ktoe)
followed by Indonesia with an output of 356 ktoe (OECD 2013). In addition, within the EAS
group, China is the largest producer of biogasoline with a production output of 1035 ktoe in 2010.
In terms of biofuels, their environmental impacts have to be assessed so that their production in
relevant areas does not lead to negative impacts on the local ecological system and hence is
sustainable in the long run. Thus, environmental consideration is an important factor underlying
the development of biofuels. Furthermore, biogas can be produced from organic waste, animal
manure and sewage sludge, and is often used for heating and electricity generation in rural
communities.
Hydro
EAS members are well endowed with hydro resources. During the decade of 2001-2010, hydro
energy production in the EAS group grew at an average annual rate of 8.12 per cent which is
well above the world average rate of 2.77 per cent during the same period.5The Laos and New
Zealand obtained 13 and 11.7 per cent of their countries’ total energy supplies from hydropower,
respectively, which are the highest among the EAS group. Vietnam (4 per cent), Myanmar (3.1
per cent) and China (2.6 per cent) are the other three which achieved relatively shares. In
5These rates of growth were calculated by the author using the statistics downloaded from the OECD (2013). 11

absolute terms, China is the world’s largest producer of hydroelectricity with a share of 21 per
cent over the world total in 2010 (see Table 3). The country’s hydro power also enjoyed an
average annual rate of growth of 12.8 per cent during 2001-2010. There is still potential growth
in the hydro power sector in the EAS area. In particular, as resource endowment varies across
countries, cross-border trade in hydro power has appeared and can be further expanded.
Geothermal
Apart from the biomass and hydropower, other forms of REs have also been produced in the
EAS area. According to Table 5, EAS as a group accounted for 35.3 per cent of the world’s
installed wind capacity, 15.1 per cent of solar capacity and 40.4 per cent of geothermal capacity.
While EAS has a relatively large share over the world’s geothermal capacity, growth of this
product is limited due to resource and technology constraints. For example, over the past decade
(2002-2011), the average rate of growth in the installed capacity of geothermal energy was
modest in both the EAS group (2.2 per cent) and the world (3.1 per cent). The world’s growth in
installed capacity was very much driven by that in the United States which has been the largest
producer of geothermal energy for decades and has been growing at the average rate of 4.0 per
cent since 2002 according to BP (2012). Two EAS members, namely, the Philippines and
Indonesia, in turn have the world’s second and third largest geothermal energy capacity with a
joint share of 28.7 per cent over the world total in 2011. However, the installed capacity in the
top three countries (US, the Philippines and Indonesia) remains almost unchanged in recent years.
In terms of geothermal energy production, EAS group is more impressive with a share of 53.4
per cent of the world total in 2010 (Table 6). Indonesia and the Philippines have been the world’s 12

largest producers since 2002. Substantial production was also recorded in China, New Zealand
and Japan. During the decade of 2001-2010, production output in the EAS group grew at an
average rate of 3.3 per cent which is higher than the world’s average growth rate of 2.2 percent
during the same period. In particular, during 2001-2010, China and Indonesia achieved an
average annual growth rate of 9.1 per cent and 7.0 per cent, respectively.
Table 5 Installed Capacity (megawatts) in EAS, 2011
Countries Geothermal Solar Wind
Australia 1.1 1344.9 2476.0 China 24.0 3000.0 62412.0 India 427.0 16078.0 Indonesia 1189.0 Japan 502.0 4914.1 2595.0 Malaysia 12.6 New Zealand 769.3 603.0 Philippines 1967.0 South Korea 747.6 370.0 Thailand 0.3 EAS 4452.7 10446.2 84534.0
World 11013.7 69371.1 239485.0 EAS (%) 40.4 15.1 35.3
Source: BP (2012).
13

Table 6 World Major Geothermal Energy Producers in 2010 __________________________________________ Countries Ranking Output (Mtoe) Indonesia 1 16.09 Philippines 2 8.54 US 3 8.41 Mexico 4 5.69 Italy 5 4.78 China 6 3.71 New Zealand 7 3.64 Iceland 8 3.35 Japan 9 2.47 Turkey 10 1.97 EAS 34.51 World 64.61 __________________________________________ Note: The raw data are downloaded from the OECD (2013).
Wind
Due to technology advance and the resultant fall in production costs, both the world and EAS
group have experienced rapid expansion in wind farms. During the past decade (2002-2011), the
average annual rate of growth in capacity was 25.5 per cent in the world and 43.6 per cent in the
EAS group, respectively.6 China has been growing at an average rate of 70 per cent since 2002
and overtook the United States to have the world’s largest capacity for wind energy production
in 2010. China’s rapid expansion in wind energy capacity sets a good example for other
developing countries. The country’s growth took off in 2007 when China’s first renewable
energy law was implemented. The Law provides a legal framework for the operation and
development of renewable energy technologies in the country. Grid companies are required to
6The rates of growth cited in this paragraph are derived by the author using the statistics from the BP (2012). 14

prioritize renewable energies over other sources of power (IRENA 2012). India, with the world’s
fifth largest capacity also recorded a high rate of growth of 27.6 per cent annually during 2002-
2011. This growth benefited from the RE purchase obligations mandated under the Indian
Electricity Act and through the implementation of the so-called renewable purchase specification
(RPS).However a renewable energy law is yet to be enacted in India. In terms of wind energy
production, EAS as a group amounted to 22.2 per cent of the world total in 2010 with China and
India being the second and fifth largest producers. Given the rapid growth in capacity,
production is expected to expand significantly in the coming years.
Solar
The production of solar energy has also expanded rapidly in the EAS group. During the period of
2002-2011, the average annual rate of growth in installed photovoltaic (PV) capacity was 36.0
per cent though it is lower than the world average rate of growth of 45.4 per cent (BP 2012). A
main factor underlying this growth in EAS is the rapid expansion in capacity in China in recent
years. While it started at a low base, China’s installed capacity expanded from 100 megawatts
(MW) in 2007 to 300 MW in 2009.It reached 3000 MW in 2011 according to the BP (2012).
High growth was also recorded in Australia (with an average annual growth rate of 92.7 per cent
during 2007-2011) and India (with an average annual growth rate of 79.8 per cent during 2007-
2011).
Due to the increased capacity, the production output of solar PV power in the EAS area grew at
an average annual rate of 30.5 per cent during 2001-2010 (OECD 2013). However, this rate is
lower than the world’s average growth rate of 42.7 per cent in the same period. As a result, the 15

EAS share over the world total solar PV power declined from its peak of 50.3 per cent in 2003 to
18.3 per cent in 2010. During the same period (2001-2010), production in solar thermal energy
has also been growing at the average rate of 17.5 per cent. The EAS share over the world total
solar thermal power has expanded from 37.7 per cent in 2000 to 62.0 per cent in 2010.
In summary, REs are rapidly expanding in the EAS economies. But the development varies a lot
across countries and products. The main products in the EAS economies include biomass, hydro,
geothermal, solar and wind energies. There is hardly any development in oceanic energies.7In
general the share of REs over total energy supplies in the EAS area is similar to that in the world.
The share of biomass over total REs is slightly higher in the EAS group than the world’s average.
However past experience shows that biomass consumption is likely to decline relatively as
economies develop. In addition, geothermal energy production has been stable in recent years.
Hence the potential for growth in the near future lies in solar and wind energies.
4. RE Outlook and Implications for EMI
Growth Prospects
In 2012, the world celebrated the International Year of Sustainable Energy for All (SE4ALL)
initiated by the United Nations (IRENA 2013b). One of the SE4ALL objectives is to double the
2010 RE share over the world energy mix by 2030. The realization of this goal would result in a
RE share of at least 26 per cent in 2030 according to the IEA statistics. To reach this goal
combined with other energy efficiency improvement commitments, RE production in the EAS
7In 2011, only three countries, France, Canada and Korea recorded energy output in the category of “tide, wave and ocean” according to the OECD (2013). France dominates this sector.
16

area would have to grow at an average annual rate of 5-6 per cent according to the forecasts in
Table 7.This rate would be much higher than the average rate of 1.9 per cent achieved by the
region in the past decade (2001-2010). In recent years, only Korea, New Zealand and Thailand
recorded RE growth rates close to this predicted rate. Furthermore, if there is no efficiency
improvement (business as usual), the growth rate would be even higher (at 9.0 per cent). During
the decade of 2001-2010, only Korea achieved such high a growth rate. The main sources of
growth will in turn be wind, solar and biofuel products. By 2030, the output of wind energy
would probably exceed that of solid biofuel.
Table 7Average RE growth rates (%), 2011-2030 _____________________________________________________________________ Products 2001-2010 2011-2030 World EAS I II III Wind 27.1 40.3 (7) 27.1 (784) 27.1 (784) 31.5 (1559) Solar PV 42.7 30.5 (1) 30.5 (103) 30.5 (103) 42.7 (614) Biodiesel 29.7 87.9 (2) 22.0 (81) 25.0 (132) 29.7 (279) Solar thermal 11.8 17.5 (9) 11.8 (87) 17.5 (236) 17.5 (236) Solid biofuel 1.6 0.6 (490) 0.3 (519) 0.3 (519) 0.6 (549) Hydro 2.8 8.1 (89) 4.1 (196) 4.1 (196) 5.4 (254) Geothermal 2.2 3.3 (35) 2.2 (54) 2.2 (54) 3.3 (66) Sub-total 2.5 1.9 (631) 5.5 (1824) 6.0 (2024) 9.0 (3557) _____________________________________________________________________ Notes: The numbers in parentheses are the output values in the final year of each period, namely 2010 and 2030, and expressed in million tons oil equivalent (Mtoe). The raw data for the period 2001-2010 are drawn from the OECD (2013). The three scenarios for the period of 2011-2030 are based on three predicted rates of growth in TPES, namely, 2.2% in the Asia Pacific by BP (2013), 2.8% in Asia by ADB (2013) and 5.6% in EAS (the business as usual case).
In general EAS countries are well-endowed with RE resources. There is considerable scope for
further growth in REs, with the exception of Singapore, which is poorly endowed with RE
resources. The RE policy of the government of Singapore is to focus on modest solar projects,
17
production of biofuels using raw material from neighboring countries and most importantly the
establishment of the country as a R&D centre for REs. For other EAS members, the stated
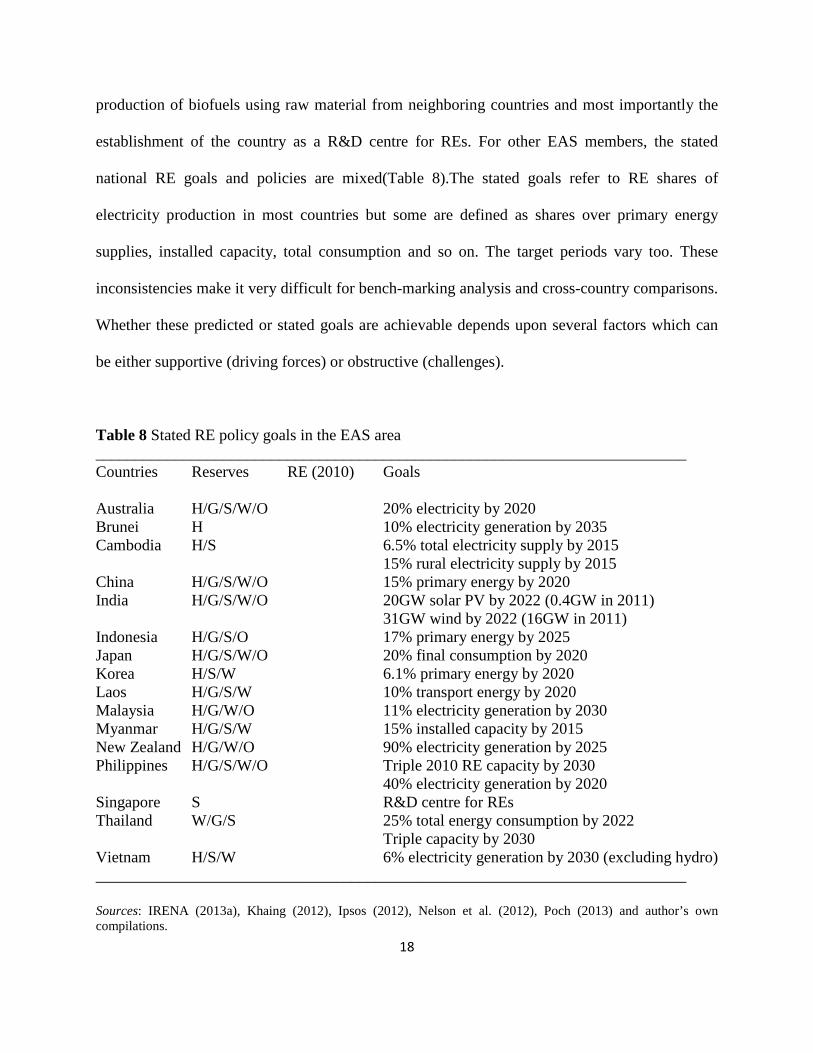
national RE goals and policies are mixed(Table 8).The stated goals refer to RE shares of
electricity production in most countries but some are defined as shares over primary energy
supplies, installed capacity, total consumption and so on. The target periods vary too. These
inconsistencies make it very difficult for bench-marking analysis and cross-country comparisons.
Whether these predicted or stated goals are achievable depends upon several factors which can
be either supportive (driving forces) or obstructive (challenges).
Table 8 Stated RE policy goals in the EAS area __________________________________________________________________________ Countries Reserves RE (2010) Goals Australia H/G/S/W/O 20% electricity by 2020 Brunei H 10% electricity generation by 2035 Cambodia H/S 6.5% total electricity supply by 2015
15% rural electricity supply by 2015 China H/G/S/W/O 15% primary energy by 2020 India H/G/S/W/O 20GW solar PV by 2022 (0.4GW in 2011) 31GW wind by 2022 (16GW in 2011) Indonesia H/G/S/O 17% primary energy by 2025 Japan H/G/S/W/O 20% final consumption by 2020 Korea H/S/W 6.1% primary energy by 2020 Laos H/G/S/W 10% transport energy by 2020 Malaysia H/G/W/O 11% electricity generation by 2030 Myanmar H/G/S/W 15% installed capacity by 2015 New Zealand H/G/W/O 90% electricity generation by 2025 Philippines H/G/S/W/O Triple 2010 RE capacity by 2030 40% electricity generation by 2020 Singapore S R&D centre for REs Thailand W/G/S 25% total energy consumption by 2022
Triple capacity by 2030 Vietnam H/S/W 6% electricity generation by 2030 (excluding hydro) __________________________________________________________________________ Sources: IRENA (2013a), Khaing (2012), Ipsos (2012), Nelson et al. (2012), Poch (2013) and author’s own compilations.
18

Driving Forces for RE Growth
Several factors could be the driving forces for further RE growth in the EAS area. Firstly, the
increasing awareness of global climate change demands urgent actions by governments to
control and reduce carbon emissions. Till date, various regulations have been introduced and
enforced in the world, particularly within the OECD economies. EAS members are following or
will have to follow the global trend. Furthermore, some EAS members have enjoyed high
economic growth for decades. However, this is at the cost of a continuously deteriorating local
and regional environment. . Thus, for their own benefit, the EAS members need to change their
energy mix and use more clean energies and REs are the best choice. So far many EAS members
have adopted RE strategies or goals to guide future development. These include large players
such as China, India, Japan and Australia (IEA 2012b).
Secondly, technological advance has led to a dramatic decline in the RE cost.8 For example, it is
reported that the selling price of PV cells dropped from US$1.5/watt in 2010 to US$0.60/watt in
2011 (UNEP 2012). This decline will continue in the future and hence make REs more
economically competitive with fossil fuels. Some REs are not luxuries anymore and are
affordable by many low and middle income economies. For example, the lowest levelized cost
for wind power in China is now close to the ceiling cost of nuclear and hydro power, and is
projected to fall by 20-30 per cent from current level by 2030.9 By then wind power is nearly
competitive with other forms of generation (ADB 2013). In addition, the affordability of REs is
also due to the rising energy prices in recent years.
8For comprehensive reviews of RE technology costs, see Hearps and McConnell (2011) and Kost et al. (2012). 9 The levelized cost of energy is defined as the cost of an energy generating system over its life time (IPCC 2012).
19
Thirdly, EAS countries, particularly the developing members, can or will increasingly be able to
afford the development of RE products because of their robust economic performance and
subsequently rising income. According to ADB (2013), developing Asian economies will
maintain a growth rate of 6.6 per cent in the coming years. This rate is much higher than the
industrial countries’ average rate of 1.2 per cent (ADB 2013). In particular, according to the
same source, the relatively poor EAS members such as Cambodia and the Laos will enjoy a rate
of growth of 7.4 per cent and 7.7 per cent respectively.
Lastly, with the rising income, consumers can afford to pay more for electricity. This provides
the opportunity for the introduction of feed-in-tariffs (FiT) in several EAS countries. For
example, the March 2011 Fukushima nuclear accident in Japan triggered a fundamental shift in
the country’s energy policy. The most immediate effect is the introduction of a series of clean
energy FiTs. These tariffs are far higher than the retail commercial power price which averaged
¥14.59/kWh in the year to March 2012. In the year to March 2013, for example, the biomass
tariff is ¥33.60/kWh for 20 years with wind generating ¥23.10/kWh and geothermal up to ¥42
for 15 years. The solar tariff is amongst the highest in the world, at ¥42 (US$0.53) (METI 2013).
FiTs have also been introduced in other EAS countries (such as Australia, China, India,
Indonesia, Malaysia, the Philippines, Thailand and Vietnam). This kind of policy supports will
certainly boost the development of REs within the EAS area.
Challenges for RE Development
While economic growth has increased the affordability of REs by many EAS members, several
EAS economies are still at the early stage of development. Their governments are still struggling
with the provision of universal access to modern energies for all citizens. Thus investment in 20

REs is limited, not to mention government subsidies for RE initiatives. The latter played a key
role in promoting REs in Europe and other parts of the world. According to the IEA (2012b),
subsidies provided to RE projects in the world totaled about US$88 billion in 2011 and are
expected to reach US$240 billion per year by 2035. The main recipients are producers - from the
solar, wind and biofuel sectors. Furthermore, the expanded access to modern energies in some
EAS member economies will essentially reduce the use of traditional biomass. As a result, it is
even more challenging for those countries to meet the RE4ALL goal by 2030.
In addition, for EAS members who can afford more investment in REs, an important concern is
the need for electricity storage and smart grids to support higher RE penetration levels in the
electricity sector. Smart grid technologies are already making significant contributions to
electricity grids in some countries in the world (such as Puerto Rico, Jamaica, Denmark, and
Singapore). However, these technologies are still undergoing continual refinement and
improvement and hence vulnerable to potential technical and non-technical risks. Thus, RE
growth will be constrained by infrastructure development as well as the evolution of technology.
These also include capacities in assessing and predicting the availability of renewable energy
sources. These capacities offer additional benefits, notably the promise of higher reliability and
overall electricity system efficiency.
5. Key Findings and Recommendations
In the midst of global climate change and rapid depletion of fossil fuel resources, REs provide a
bright prospect for the world’s energy sector. EAS countries will have to follow the same trend
as the rest of the world and expand their RE industries. Through a review of the global RE 21

industry, this paper helps gain important insight into the development of the RE sector in the
world in general and the EAS area in particular. Several interesting findings can be summarized
as follows.
Key Findings
First, it is shown that, though REs in the world have enjoyed faster growth than total energy
production, their share over total output is still small. This share amounted to about 1 percent in
2010 if traditional biomass and hydroelectricity are excluded. The situation is similar in the EAS
area. There are however substantial variations across the countries. Growth also varies
considerably across the RE products.
Second, it is argued that great growth potential in the future will come from wind, solar and
biofuel power which will be competitive with traditional fossil fuels due to technological
advance. Among the EAS regions, there is also ample scope for growth in hydroelectricity,
particularly in relatively less developed economies such as Cambodia, Myanmar and the Laos. .
In several EAS countries, there is also potential for growth in geothermal energy. However,
environmental impacts have to be carefully assessed and hence taken into consideration when
new projects especially hydro and biofuel ones are initiated.
Third, to reach the UN goal of doubling RE shares over total primary energy supplies by 2030,
there are still challenges for many EAS members. These include technological constraints in the
short run, the balance between RE investment and spending in providing energy for all (such as
22

electrification), and the complex relation between economic development and environmental
control.
Policy Recommendations
For improved promotion of RE development within the EAS area, the following
recommendations are made.
Recommendation 1: Strengthening regional institutional facilities
Globally, in 2009, the International Renewable Energy Agency (IRENA) was founded and
dedicated to the course of promoting renewable energies. Not all EAS countries have become
IRENA members. It is thus necessary to set up a regional body which is exclusively responsible
for the promotion of REs within the EAS region. This body can be a sub-unit of an existing
regional institution or an independent inter-governmental organisation. Through such an
organization, local policymakers and think-tanks can hold regular meetings to discuss regional
cooperation in RE policies, investment, and technologies. This institution can also oversee the
standardization and harmonization of RE rules and practices within the EAS area. At present,
due to the lack of dialogues among members, the RE goals are quite diverse and inconsistent
among the member economies.
23
Recommendation 2: Setting potential goals for RE development
It is common practice that potential goals are set for each member within economic blocks such
as the EU. Through intergovernmental exchanges and consultations, EAS members could agree
to some potential goals for each country within a certain period of time. These goals would
reflect the reality in each member’s economy. Setting those goals can help promote the
awareness of REs in member countries. In addition, through information exchanges and strategic
planning, policy makers in member countries can identify priorities in their RE development.
The formation of regional goals can also help member countries better respond to the IRENA
roadmap or simply global campaign for green energy development.
Recommendation 3: Promoting sub-regional coordination in RE development
As RE resources are unevenly distributed, sub-regional coordination could lead to more efficient
allocation of resources in some areas such as hydroelectricity. In particular, for large hydro
projects near border areas, sub-regional or cross-border cooperation could better protect the
environment. Through cross-border cooperation, members involved could also benefit from the
availability of more capital and potentially better technologies. The greater Mekong sub-regional
(GMS) group is a good example.10 The group held its 18th ministerial conference in December
2012 and has established the GMS Environment Operations Center (EOC) and Regional Power
Coordination Center. It is expected to play a key role in developing hydro power and promoting
EMI within the region. Similar coordination could be adopted to manage the production of palm
oil which is a main input for biofuels and would be a threat to biodiversity in some regions.11
10GMS involves Cambodia, the Laos, Myanmar, Thailand, Vietnam and two provinces (Yunnan and Guangxi) of China. 11 For a background review of the palm oil sector, see Pye and Bhattacharya (2012).
24

Recommendation 4: Boosting EMI through RE development
Policy makers have reached a consensus to promote energy market integration (EMI) within the
EAS area.12As RE is a rapidly growing energy product, it could play an important role in the
promotion of EMI. In terms of cross-country interconnectivity, hydroelectricity has been traded
across the greater Mekong sub-region for several years. Thus RE is leading sub-regional EMI
within the EAS. In addition, as REs are relatively new products in most EAS members, they are
less constrained by the existing regulations and policies. Thus, it is relatively easy for members
to reach consensuses and adopt common standards and practices which are prerequisites for EMI.
Acknowledgements
Work on this report benefited from the financial support of the Economic Research Institute for
ASEAN and East Asia (ERIA, Jakarta) and helpful comments from an anonymous reviewer and
participants of two workshops organized by ERIA in January and May, 2013.
References
ADB (2013), Asian Development Outlook 2013: Asia’s Energy Challenge, Asian Development
Bank, Manila.
BP (2012), Statistical Review of World Energy 2012, London: BP (www.bp.com).
BP (2013), BP Energy Outlook 2030, London: BP (www.bp.com).
Goldemberg, Jose and Suani Teixeira Coelho (2004), “Renewable Energy: Traditional Biomass
vs. Modern Biomass”, Energy Policy 32, 711–714.
12For more detailed discussion about EMI, see Shi and Kimura (2009) and Wu et al. (2012, 2013). 25

Hearps, Patrick and Dylan McConnell (2011), “Renewable Energy Technology Cost Review”,
Technical Paper Series, Melbourne Energy Institute, University of Melbourne, March.
IEA (2012a), Renewables Information 2012, International Energy Agency (www.iea.org), Paris.
IEA (2012b), World Energy Outlook 2012: Renewable Energy Outlook, International Energy
Agency (www.iea.org), Paris.
IPCC (2012), Renewable Energy Sources and Climate Change Mitigation, a special report of the
Intergovernmental Panel on Climate Change, World Meteorological Organization (WMO)
and the United Nations Environment Programme (UNEP), New York: Cambridge
University Press.
Ipsos (2012), “Meeting the Energy Challenge in South East Asia: A Paper on Renewable Energy,
Ipsos Business Consulting, July.
IRENA (2012), 30 Years of Policies for Wind Energy: Lessons from 12 Wind Energy Markets,
International Renewable Energy Agency (www.irena.org), Abu Dhabi, UAE.
IRENA (2013a), Renewable Energy Country Profiles: Asia, International Renewable Energy
Agency (www.irena.org), Abu Dhabi, UAE.
IRENA (2013b), Doubling the Global Share of Renewable Energy: A Roadmap to 2030,
International Renewable Energy Agency (www.irena.org), Abu Dhabi, UAE.
Khaing, U. Win (2012), “Myanmar’s Future Potentials in Low Carbon Energy”, presentation at
Myanmar 2nd Forum: Green Economy Green Growth, November 13-15.
Kost, C., T. Schlegl, J. Thomsen, S. Nold and J. Mayer(2012), “Levelized Cost of Electricity
Renewable Energies”, Fraunhofer Institute for Solar Energy Systems, Germany.
METI (2013), “Present Status and Promotion Measures for the introduction of Renewable
Energy in Japan”, Ministry of Economy, Trade and Industry, Japan (www.meti.go.jp).
26

Nelson, David, Gireesh Shrimali, Shobhit Goel, Charith Konda and Raj Kumar (2012), “Meeting
India’s Renewable Energy Targets: The Financing Challenge”, CPI-ISB Report, Climate
Policy Initiative (www.climatepolicyinitiative.org).
OECD (2013), OECD iLibrary online database (http://www.oecd-ilibrary.org/energy/data/iea-
renewables-information-statistics_renewab-data-en).
Olz, Samantha and Milou Beereport (2010), “Deploying Renewables in Southeast Asia: Trends
and Potential”, Working Paper, International Energy Agency (www.iea.org), Paris.
Poch, Kong chheng (2013), “Renewable Energy Development in Cambodia: Status, Prospects
and Policies”, chapter xx in this report.
Pye, Oliver and Jayati Bhattacharya (eds) (2012), The Palm Oil Controversy in Southeast Asia: A
Transnational Perspective, Singapore: ISEAS.
Shi, X. and F. Kimura (eds) (2010), “Energy Market Integration in the East Asia Summit Region:
Review of Initiatives and Estimation of Benefits”, ERIA Research Project Report 2009-
13, Jakarta: Economic Research Institute for ASEAN and East Asia (ERIA).
UNEP (2012), “Global Trends in Renewable Energy Investment 2012”, a report commissioned
by UNEP.
World Bank (2012), World Development Indicators (www.worldbank.org), Washington D.C.
Wu, Y., F. Kimura and X. Shi (eds) (2013), Energy Market Integration in East Asia: Deepening
Understanding and Moving Forward, Routledge-ERIA Studies in Development
Economics, London: Routledge (in press).
Wu, Y., X. Shi and F. Kimura (eds) (2012), “Energy Market Integration in the East Asia:
Theories, Electricity Sector and Subsidies”, ERIA Research Project Report 2011-17,
Jakarta: Economic Research Institute for ASEAN and East Asia (ERIA).
27

Editor, UWA Economics Discussion Papers: Ernst Juerg Weber Business School – Economics University of Western Australia 35 Sterling Hwy Crawley WA 6009 Australia Email: [email protected] The Economics Discussion Papers are available at: 1980 – 2002: http://ecompapers.biz.uwa.edu.au/paper/PDF%20of%20Discussion%20Papers/ Since 2001: http://ideas.repec.org/s/uwa/wpaper1.html Since 2004: http://www.business.uwa.edu.au/school/disciplines/economics
ECONOMICS DISCUSSION PAPERS 2012
DP NUMBER AUTHORS TITLE
12.01 Clements, K.W., Gao, G., and Simpson, T.
DISPARITIES IN INCOMES AND PRICES INTERNATIONALLY
12.02 Tyers, R. THE RISE AND ROBUSTNESS OF ECONOMIC FREEDOM IN CHINA
12.03 Golley, J. and Tyers, R. DEMOGRAPHIC DIVIDENDS, DEPENDENCIES AND ECONOMIC GROWTH IN CHINA AND INDIA
12.04 Tyers, R. LOOKING INWARD FOR GROWTH
12.05 Knight, K. and McLure, M. THE ELUSIVE ARTHUR PIGOU
12.06 McLure, M. ONE HUNDRED YEARS FROM TODAY: A. C. PIGOU’S WEALTH AND WELFARE
12.07 Khuu, A. and Weber, E.J. HOW AUSTRALIAN FARMERS DEAL WITH RISK
12.08 Chen, M. and Clements, K.W. PATTERNS IN WORLD METALS PRICES
12.09 Clements, K.W. UWA ECONOMICS HONOURS
12.10 Golley, J. and Tyers, R. CHINA’S GENDER IMBALANCE AND ITS ECONOMIC PERFORMANCE
12.11 Weber, E.J. AUSTRALIAN FISCAL POLICY IN THE AFTERMATH OF THE GLOBAL FINANCIAL CRISIS
12.12 Hartley, P.R. and Medlock III, K.B. CHANGES IN THE OPERATIONAL EFFICIENCY OF NATIONAL OIL COMPANIES
28

12.13 Li, L. HOW MUCH ARE RESOURCE PROJECTS WORTH? A CAPITAL MARKET PERSPECTIVE
12.14 Chen, A. and Groenewold, N. THE REGIONAL ECONOMIC EFFECTS OF A REDUCTION IN CARBON EMISSIONS AND AN EVALUATION OF OFFSETTING POLICIES IN CHINA
12.15 Collins, J., Baer, B. and Weber, E.J. SEXUAL SELECTION, CONSPICUOUS CONSUMPTION AND ECONOMIC GROWTH
12.16 Wu, Y. TRENDS AND PROSPECTS IN CHINA’S R&D SECTOR
12.17 Cheong, T.S. and Wu, Y. INTRA-PROVINCIAL INEQUALITY IN CHINA: AN ANALYSIS OF COUNTY-LEVEL DATA
12.18 Cheong, T.S. THE PATTERNS OF REGIONAL INEQUALITY IN CHINA
12.19 Wu, Y. ELECTRICITY MARKET INTEGRATION: GLOBAL TRENDS AND IMPLICATIONS FOR THE EAS REGION
12.20 Knight, K. EXEGESIS OF DIGITAL TEXT FROM THE HISTORY OF ECONOMIC THOUGHT: A COMPARATIVE EXPLORATORY TEST
12.21 Chatterjee, I. COSTLY REPORTING, EX-POST MONITORING, AND COMMERCIAL PIRACY: A GAME THEORETIC ANALYSIS
12.22 Pen, S.E. QUALITY-CONSTANT ILLICIT DRUG PRICES
12.23 Cheong, T.S. and Wu, Y. REGIONAL DISPARITY, TRANSITIONAL DYNAMICS AND CONVERGENCE IN CHINA
12.24 Ezzati, P. FINANCIAL MARKETS INTEGRATION OF IRAN WITHIN THE MIDDLE EAST AND WITH THE REST OF THE WORLD
12.25 Kwan, F., Wu, Y. and Zhuo, S. RE-EXAMINATION OF THE SURPLUS AGRICULTURAL LABOUR IN CHINA
12.26 Wu, Y. R&D BEHAVIOUR IN CHINESE FIRMS
12.27 Tang, S.H.K. and Yung, L.C.W. MAIDS OR MENTORS? THE EFFECTS OF LIVE-IN FOREIGN DOMESTIC WORKERS ON SCHOOL CHILDREN’S EDUCATIONAL ACHIEVEMENT IN HONG KONG
12.28 Groenewold, N. AUSTRALIA AND THE GFC: SAVED BY ASTUTE FISCAL POLICY?
29

ECONOMICS DISCUSSION PAPERS 2013
DP NUMBER AUTHORS TITLE
13.01 Chen, M., Clements, K.W. and Gao, G.
THREE FACTS ABOUT WORLD METAL PRICES
13.02 Collins, J. and Richards, O. EVOLUTION, FERTILITY AND THE AGEING POPULATION
13.03 Clements, K., Genberg, H., Harberger, A., Lothian, J., Mundell, R., Sonnenschein, H. and Tolley, G.
LARRY SJAASTAD, 1934-2012
13.04 Robitaille, M.C. and Chatterjee, I. MOTHERS-IN-LAW AND SON PREFERENCE IN INDIA
13.05 Clements, K.W. and Izan, I.H.Y. REPORT ON THE 25TH PHD CONFERENCE IN ECONOMICS AND BUSINESS
13.06 Walker, A. and Tyers, R. QUANTIFYING AUSTRALIA’S “THREE SPEED” BOOM
13.07 Yu, F. and Wu, Y. PATENT EXAMINATION AND DISGUISED PROTECTION
13.08 Yu, F. and Wu, Y. PATENT CITATIONS AND KNOWLEDGE SPILLOVERS: AN ANALYSIS OF CHINESE PATENTS REGISTER IN THE US
13.09 Chatterjee, I. and Saha, B. BARGAINING DELEGATION IN MONOPOLY
13.10 Cheong, T.S. and Wu, Y. GLOBALIZATION AND REGIONAL INEQUALITY IN CHINA
13.11 Cheong, T.S. and Wu, Y. INEQUALITY AND CRIME RATES IN CHINA
13.12 Robertson, P.E. and Ye, L. ON THE EXISTENCE OF A MIDDLE INCOME TRAP
13.13 Robertson, P.E. THE GLOBAL IMPACT OF CHINA’S GROWTH
13.14 Hanaki, N., Jacquemet, N., Luchini, S., and Zylbersztejn, A.
BOUNDED RATIONALITY AND STRATEGIC UNCERTAINTY IN A SIMPLE DOMINANCE SOLVABLE GAME
13.15 Okatch, Z., Siddique, A. and Rammohan, A.
DETERMINANTS OF INCOME INEQUALITY IN BOTSWANA
13.16 Clements, K.W. and Gao, G. A MULTI-MARKET APPROACH TO MEASURING THE CYCLE
13.17 Chatterjee, I. and Ray, R. THE ROLE OF INSTITUTIONS IN THE INCIDENCE OF CRIME AND CORRUPTION
13.18 Fu, D. and Wu, Y. EXPORT SURVIVAL PATTERN AND DETERMINANTS OF CHINESE MANUFACTURING FIRMS
13.19 Shi, X., Wu, Y. and Zhao, D. KNOWLEDGE INTENSIVE BUSINESS SERVICES AND THEIR IMPACT ON INNOVATION IN CHINA
13.20 Tyers, R., Zhang, Y. and Cheong, T.S.
CHINA’S SAVING AND GLOBAL ECONOMIC PERFORMANCE
30

13.21 Collins, J., Baer, B. and Weber, E.J. POPULATION, TECHNOLOGICAL PROGRESS AND THE EVOLUTION OF INNOVATIVE POTENTIAL
13.22 Hartley, P.R. THE FUTURE OF LONG-TERM LNG CONTRACTS
13.23 Tyers, R. A SIMPLE MODEL TO STUDY GLOBAL MACROECONOMIC INTERDEPENDENCE
13.24 McLure, M. REFLECTIONS ON THE QUANTITY THEORY: PIGOU IN 1917 AND PARETO IN 1920-21
13.25 Chen, A. and Groenewold, N. REGIONAL EFFECTS OF AN EMISSIONS-REDUCTION POLICY IN CHINA: THE IMPORTANCE OF THE GOVERNMENT FINANCING METHOD
13.26 Siddique, M.A.B. TRADE RELATIONS BETWEEN AUSTRALIA AND THAILAND: 1990 TO 2011
13.27 Li, B. and Zhang, J. GOVERNMENT DEBT IN AN INTERGENERATIONAL MODEL OF ECONOMIC GROWTH, ENDOGENOUS FERTILITY, AND ELASTIC LABOR WITH AN APPLICATION TO JAPAN
13.28 Robitaille, M. and Chatterjee, I. SEX-SELECTIVE ABORTIONS AND INFANT MORTALITY IN INDIA: THE ROLE OF PARENTS’ STATED SON PREFERENCE
13.29 Ezzati, P. ANALYSIS OF VOLATILITY SPILLOVER EFFECTS: TWO-STAGE PROCEDURE BASED ON A MODIFIED GARCH-M
13.30 Robertson, P. E. DOES A FREE MARKET ECONOMY MAKE AUSTRALIA MORE OR LESS SECURE IN A GLOBALISED WORLD?
13.31 Das, S., Ghate, C. and Robertson, P. E.
REMOTENESS AND UNBALANCED GROWTH: UNDERSTANDING DIVERGENCE ACROSS INDIAN DISTRICTS
13.32 Robertson, P.E. and Sin, A. MEASURING HARD POWER: CHINA’S ECONOMIC GROWTH AND MILITARY CAPACITY
13.33 Wu, Y. TRENDS AND PROSPECTS FOR THE RENEWABLE ENERGY SECTOR IN THE EAS REGION
13.34 Yang, S., Zhao, D., Wu, Y. and Fan, J.
REGIONAL VARIATION IN CARBON EMISSION AND ITS DRIVING FORCES IN CHINA: AN INDEX DECOMPOSITION ANALYSIS
31

ECONOMICS DISCUSSION PAPERS 2014
DP NUMBER AUTHORS TITLE
14.01 Boediono, Vice President of the Republic of Indonesia
THE CHALLENGES OF POLICY MAKING IN A YOUNG DEMOCRACY: THE CASE OF INDONESIA (52ND SHANN MEMORIAL LECTURE, 2013)
14.02 Metaxas, P.E. and Weber, E.J. AN AUSTRALIAN CONTRIBUTION TO INTERNATIONAL TRADE THEORY: THE DEPENDENT ECONOMY MODEL
14.03 Fan, J., Zhao, D., Wu, Y. and Wei, J. CARBON PRICING AND ELECTRICITY MARKET REFORMS IN CHINA
14.04 McLure, M. A.C. PIGOU’S MEMBERSHIP OF THE ‘CHAMBERLAIN-BRADBURY’ COMMITTEE. PART I: THE HISTORICAL CONTEXT
14.05 McLure, M. A.C. PIGOU’S MEMBERSHIP OF THE ‘CHAMBERLAIN-BRADBURY’ COMMITTEE. PART II: ‘TRANSITIONAL’ AND ‘ONGOING’ ISSUES
14.06 King, J.E. and McLure, M. HISTORY OF THE CONCEPT OF VALUE
14.07 Williams, A. A GLOBAL INDEX OF INFORMATION AND POLITICAL TRANSPARENCY
14.08 Knight, K. A.C. PIGOU’S THE THEORY OF UNEMPLOYMENT AND ITS CORRIGENDA: THE LETTERS OF MAURICE ALLEN, ARTHUR L. BOWLEY, RICHARD KAHN AND DENNIS ROBERTSON
32