Economics of ISP Settlement - NUS Computing
49
Economics of ISP Settlement Richard T. B. Ma School of Computing National University of Singapore CS 4226: Internet Architecture
Transcript of Economics of ISP Settlement - NUS Computing
Economics of ISP Settlement
Richard T. B. Ma School of Computing
National University of Singapore
CS 4226: Internet Architecture
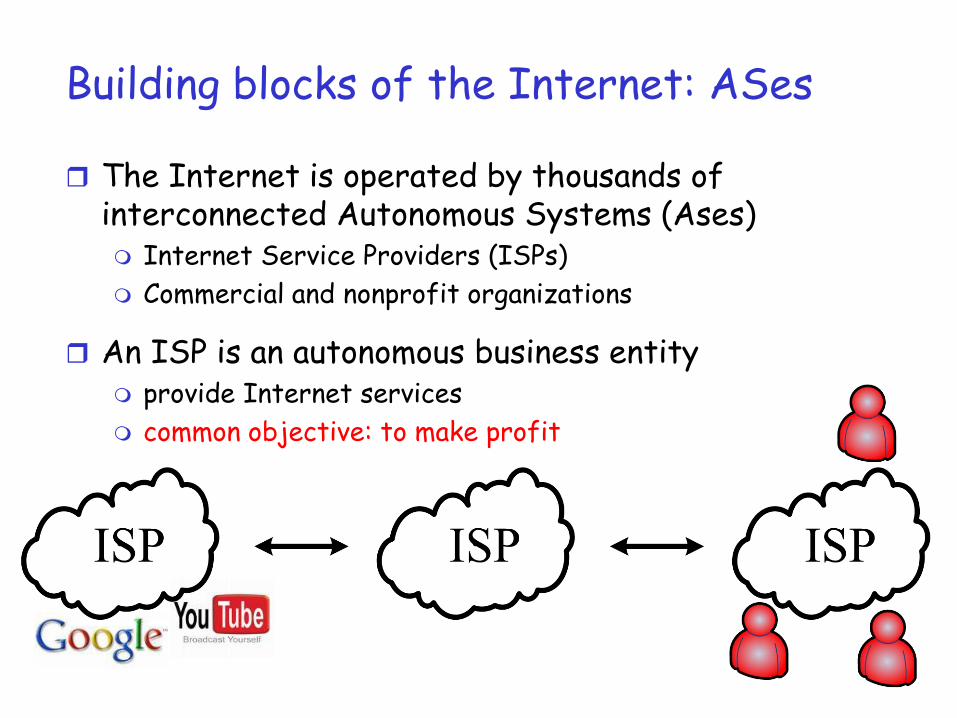
Building blocks of the Internet: ASes
The Internet is operated by thousands of interconnected Autonomous Systems (Ases) Internet Service Providers (ISPs) Commercial and nonprofit organizations
An ISP is an autonomous business entity provide Internet services common objective: to make profit

What is an Autonomous System?
Usually a network of routers redundantly interconnected
Identified by a globally unique AS Number (ASN)
Controlled by a single administrative domain one company could have several ASNs
but a given ASN is typically controlled by a single entity
Common routing protocol and policy

Example: Singtel

AS Topology: UUNET (AS701)
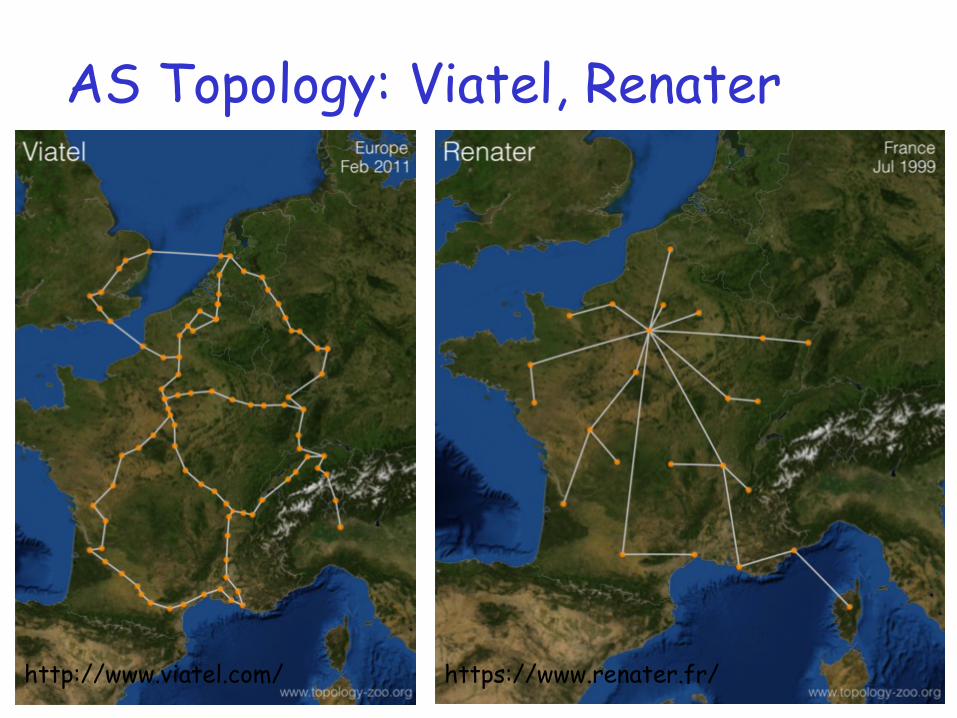
AS Topology: Viatel, Renater
http://www.viatel.com/ https://www.renater.fr/
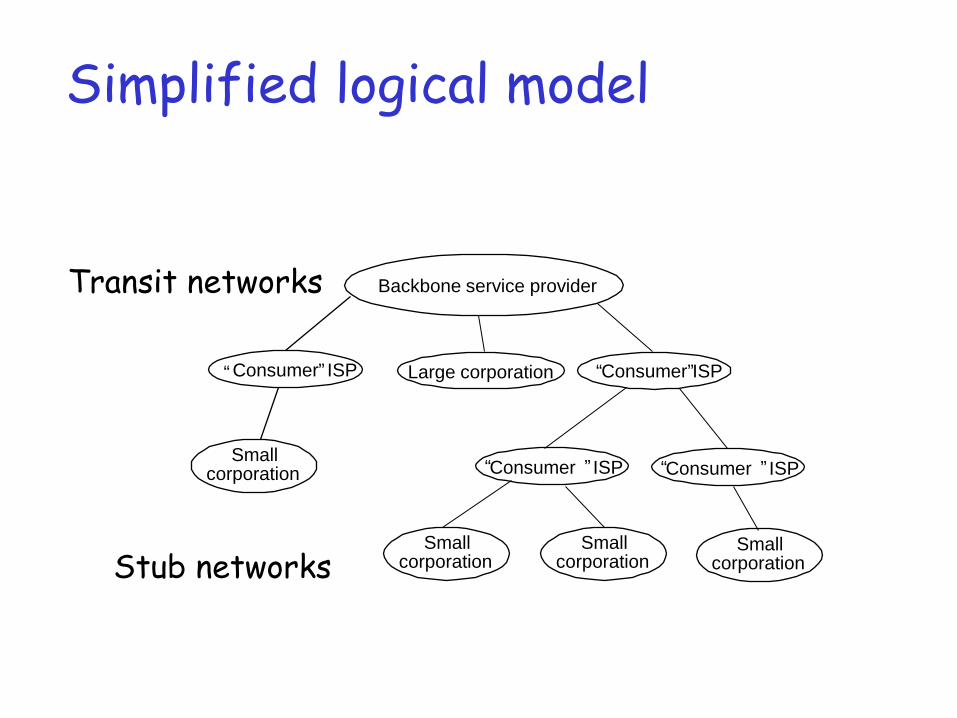
Simplified logical model
Backbone service provider
Large corporation
Small corporation “ Consumer ” ISP
“ Consumer ” ISP “ Consumer ” ISP
“ Consumer ” ISP
Small corporation
Small corporation
Small corporation Stub networks
Transit networks
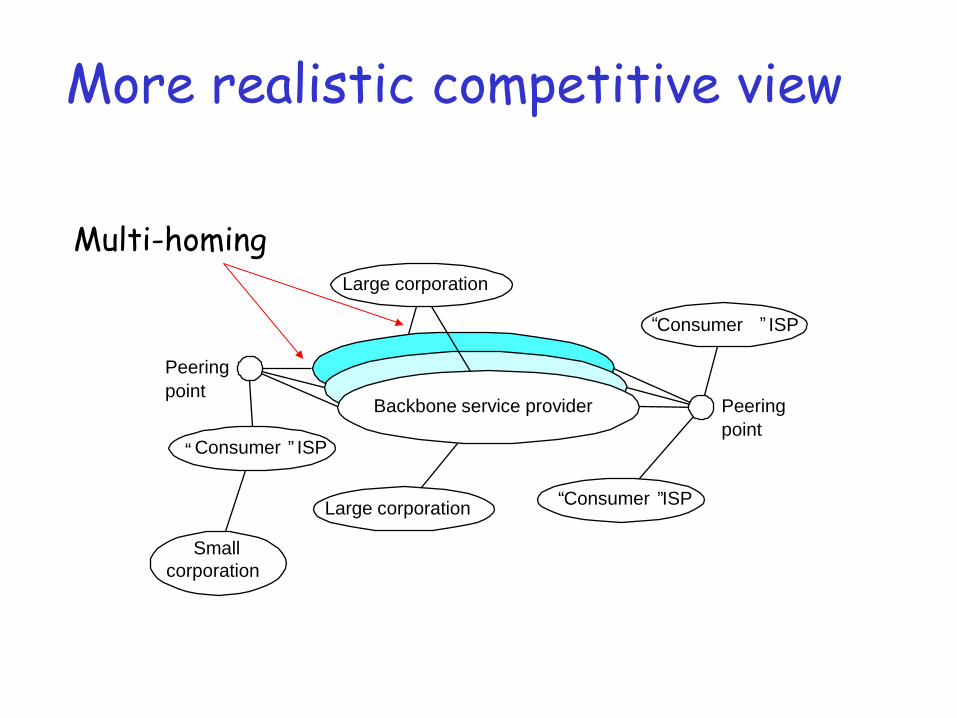
More realistic competitive view
Backbone service provider
Peering point
Peering point
Large corporation
Large corporation
Small corporation
“ Consumer ” ISP
“ Consumer ” ISP
“ Consumer ” ISP
Multi-homing
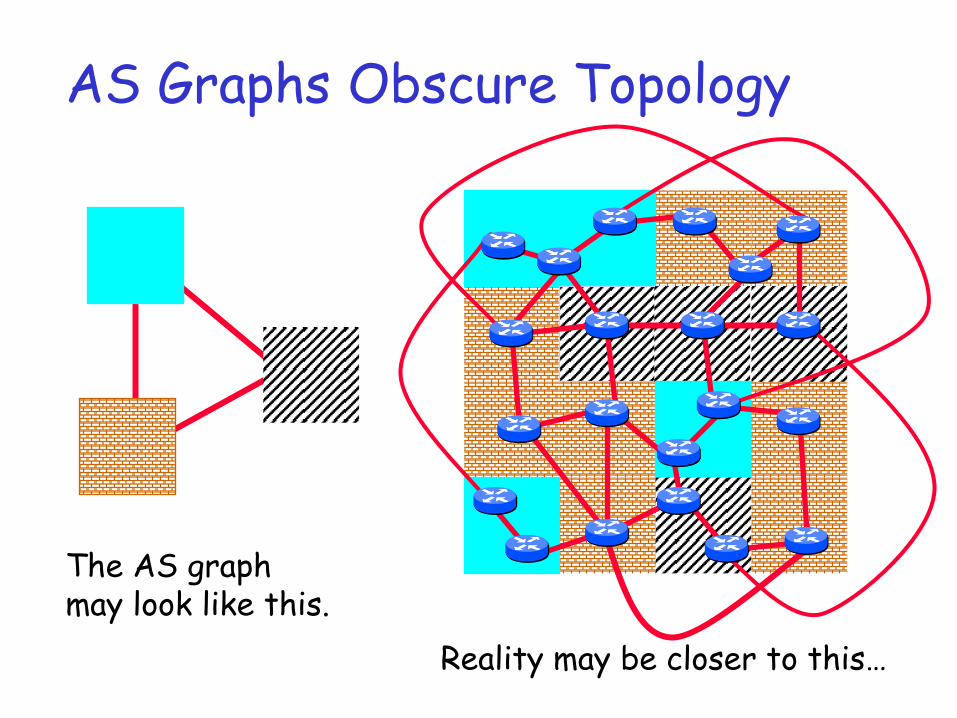
AS Graphs Obscure Topology
The AS graph may look like this.
Reality may be closer to this…
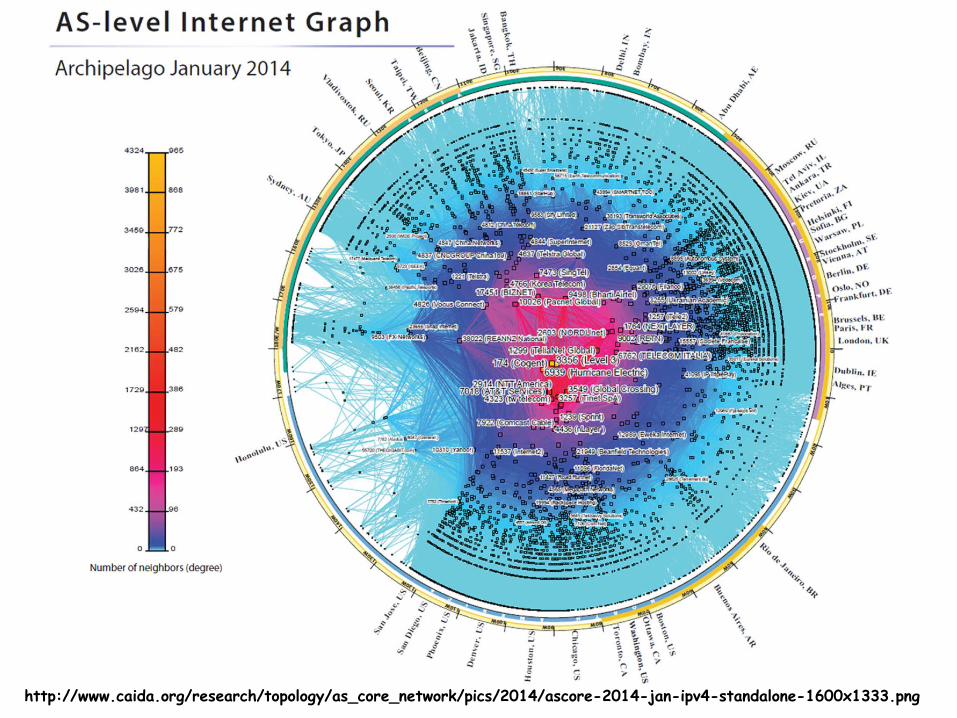
http://www.caida.org/research/topology/as_core_network/pics/2014/ascore-2014-jan-ipv4-standalone-1600x1333.png
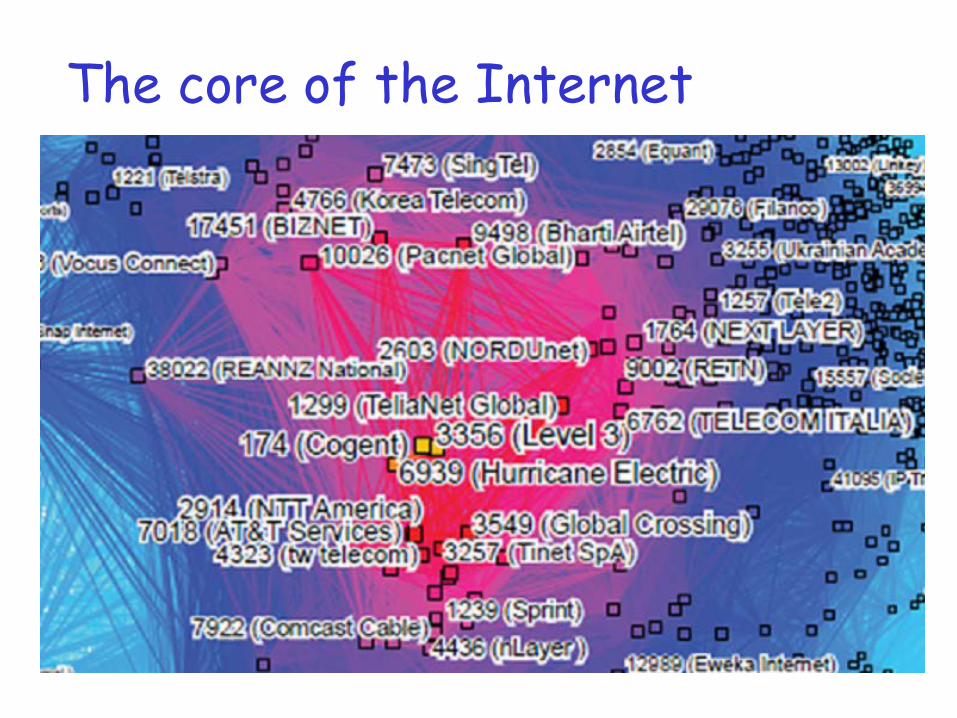
The core of the Internet

Three types of ISPs Eyeball (local) ISPs:
provide Internet access to residential users. e.g., Singtel in SG and Comcast in US
Content ISPs: server content providers and upload information. e.g., Cogent, Google, Akamai (Content Delivery Networks)
Transit ISPs: provide global connectivity, transit services for others. e.g., tier 1 ISPs: Level3, Global Crossing

Current ISP business practices
Settlement-Free Peering
Customer-Provider Settlement
Two forms of bilateral settlements:
Provider ISPs
Customer ISPs
$$$ $$$
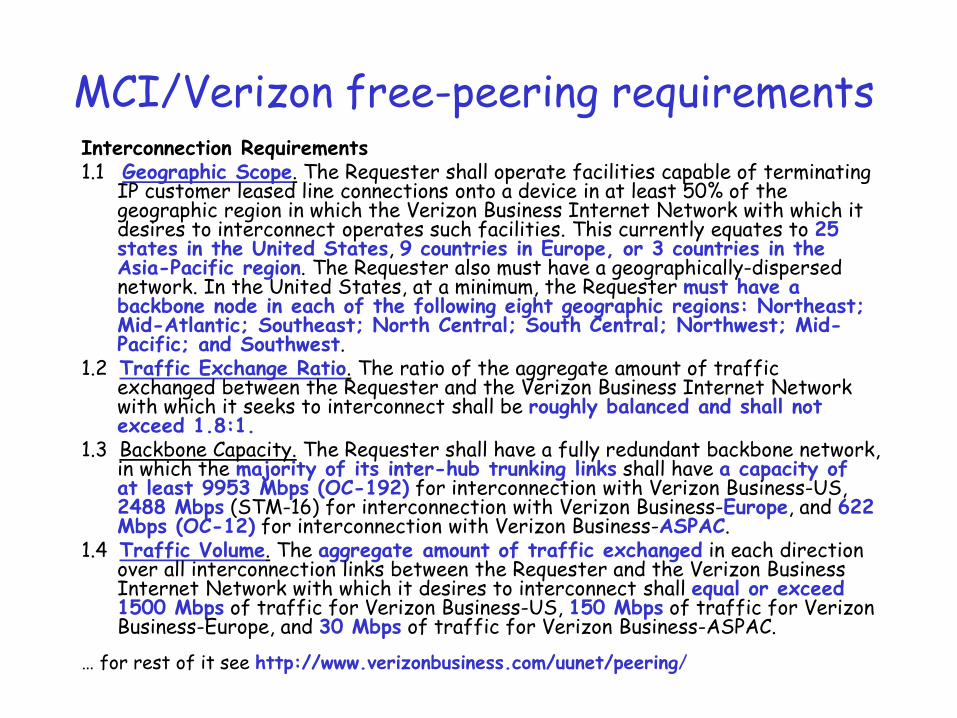
MCI/Verizon free-peering requirements Interconnection Requirements 1.1 Geographic Scope. The Requester shall operate facilities capable of terminating
IP customer leased line connections onto a device in at least 50% of the geographic region in which the Verizon Business Internet Network with which it desires to interconnect operates such facilities. This currently equates to 25 states in the United States, 9 countries in Europe, or 3 countries in the Asia-Pacific region. The Requester also must have a geographically-dispersed network. In the United States, at a minimum, the Requester must have a backbone node in each of the following eight geographic regions: Northeast; Mid-Atlantic; Southeast; North Central; South Central; Northwest; Mid-Pacific; and Southwest.
1.2 Traffic Exchange Ratio. The ratio of the aggregate amount of traffic exchanged between the Requester and the Verizon Business Internet Network with which it seeks to interconnect shall be roughly balanced and shall not exceed 1.8:1.
1.3 Backbone Capacity. The Requester shall have a fully redundant backbone network, in which the majority of its inter-hub trunking links shall have a capacity of at least 9953 Mbps (OC-192) for interconnection with Verizon Business-US, 2488 Mbps (STM-16) for interconnection with Verizon Business-Europe, and 622 Mbps (OC-12) for interconnection with Verizon Business-ASPAC.
1.4 Traffic Volume. The aggregate amount of traffic exchanged in each direction over all interconnection links between the Requester and the Verizon Business Internet Network with which it desires to interconnect shall equal or exceed 1500 Mbps of traffic for Verizon Business-US, 150 Mbps of traffic for Verizon Business-Europe, and 30 Mbps of traffic for Verizon Business-ASPAC.
… for rest of it see http://www.verizonbusiness.com/uunet/peering/
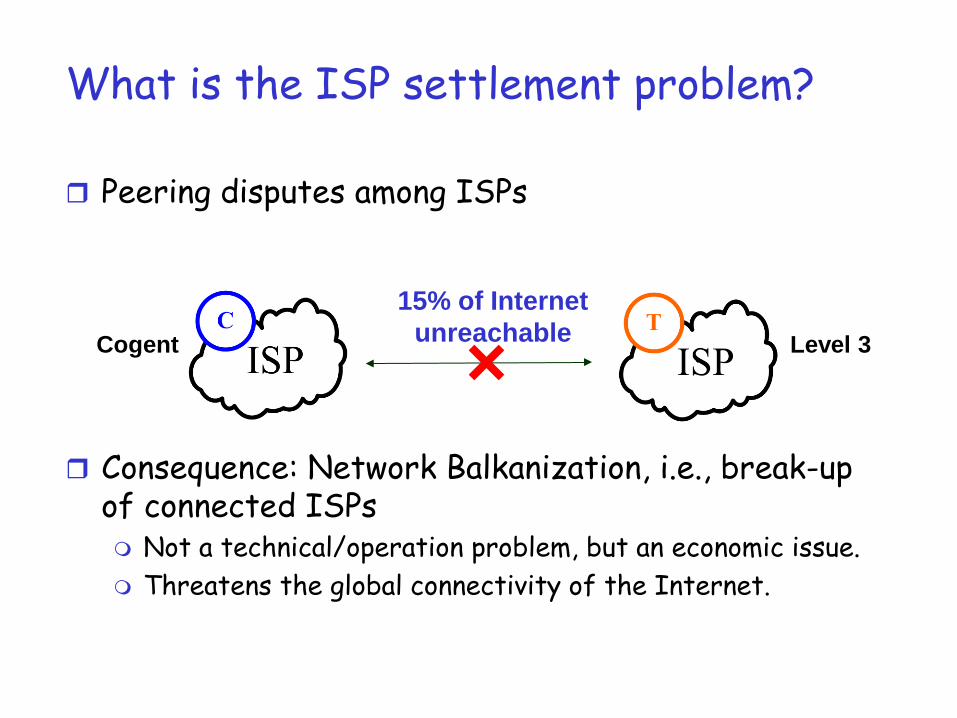
What is the ISP settlement problem?
Peering disputes among ISPs
Consequence: Network Balkanization, i.e., break-up of connected ISPs Not a technical/operation problem, but an economic issue. Threatens the global connectivity of the Internet.
15% of Internet unreachable Cogent Level 3
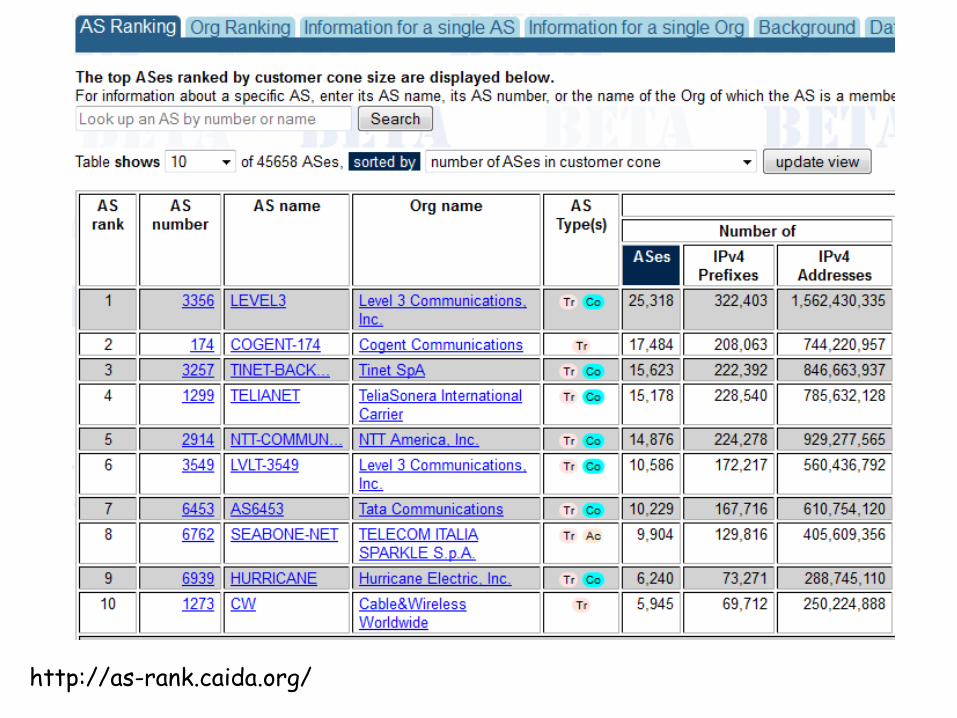
http://as-rank.caida.org/
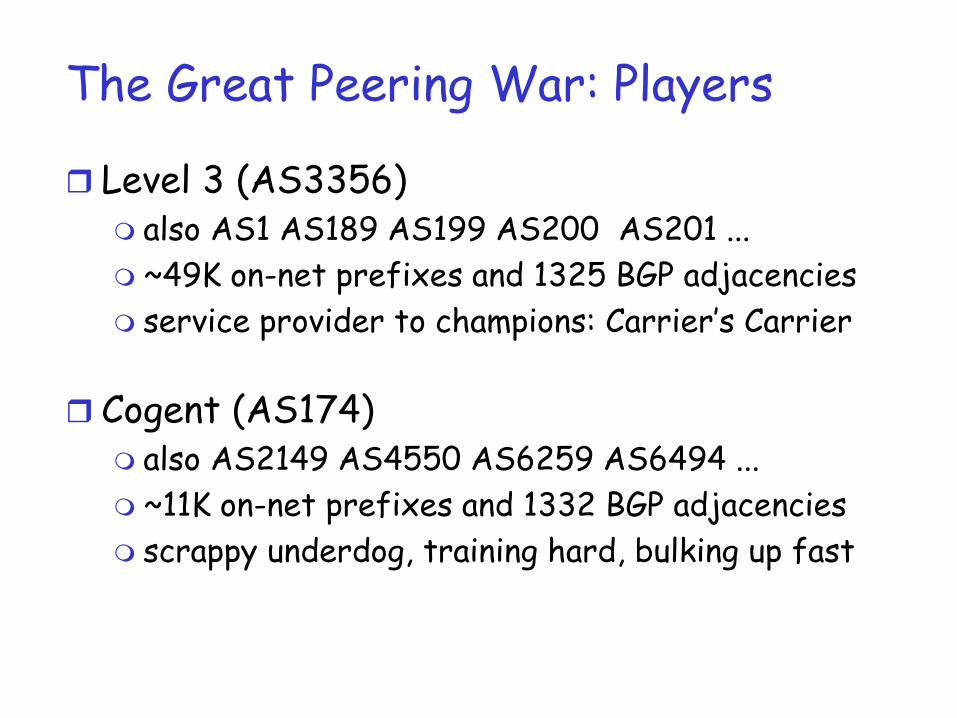
The Great Peering War: Players
Level 3 (AS3356) also AS1 AS189 AS199 AS200 AS201 ... ~49K on-net prefixes and 1325 BGP adjacencies service provider to champions: Carrier’s Carrier
Cogent (AS174) also AS2149 AS4550 AS6259 AS6494 ... ~11K on-net prefixes and 1332 BGP adjacencies scrappy underdog, training hard, bulking up fast

The Timeline 31 Jul 2005: L3 Notifies Cogent of intent
to disconnect. Both notify their sales departments; none notifies customers.
16 Aug 2005: Cogent begins massive sales, expecting Sept. 15 as depeering date.
31 Aug 2005: L3 Notifies Cogent again … 5 Oct 2005 9:50: L3 disconnects Cogent.
Mass hysteria ensues up to, and including policymakers in Washington, D.C.
7 Oct 2005 ~19:00: L3 reconnects Cogent.

The Event Oct 5 between 9:00
and 11:00 Cogent lost 5081
routes from L3. L3 lost 2322 routes
from Cogent.
Oct 7 around 19:00 Cogent regained 4070
routes from L3. L3 regained 2210
routes from Cogent.
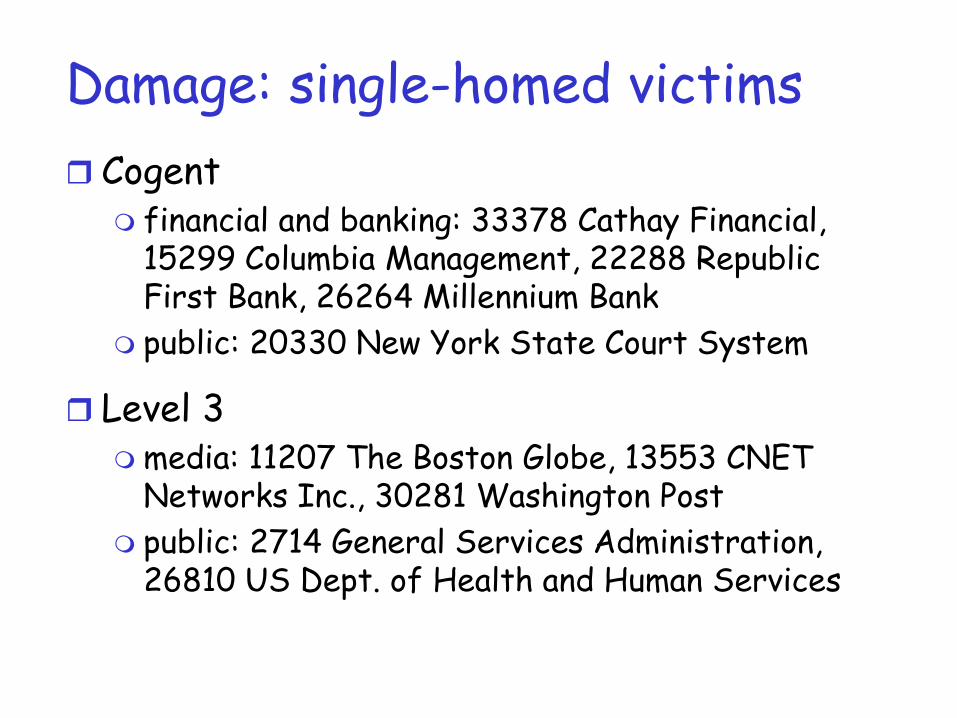
Damage: single-homed victims Cogent
financial and banking: 33378 Cathay Financial, 15299 Columbia Management, 22288 Republic First Bank, 26264 Millennium Bank
public: 20330 New York State Court System
Level 3 media: 11207 The Boston Globe, 13553 CNET
Networks Inc., 30281 Washington Post public: 2714 General Services Administration,
26810 US Dept. of Health and Human Services
Reference
Richard T. B. Ma, Dah Ming Chiu, John C. S. Lui, Vishal Misra and Dan Rubenstein, “On Cooperative Settlement Between Content, Transit and Eyeball Internet Service Providers”, IEEE/ACM Transactions on Networking, 19(3), June 2011.

How do we share profit? -- the baseline case
One content and one eyeball ISP
Define total profit 𝑉 = total revenue – total costs = content-side profit + eyeball-side profit
Fair profit sharing:
𝝋𝑩𝟏 = 𝝋𝑪𝟏 =𝟏𝟐𝑽
C1 B1

How do we share profit? – 2 symmetric eyeball ISPs
Desirable properties:
Symmetry: same profit for symmetric eyeball ISPs 𝝋𝑩𝟏 = 𝝋𝑩𝟐 = 𝝋𝑩
Efficiency: summation of individual ISP profits equals 𝑉 𝝋𝑩𝟏 + 𝝋𝑩𝟐 + 𝝋𝑪𝟏 = 𝑽
Fairness: same mutual contribution for any pair of ISPs
𝝋𝑪𝟏 −12𝑉 = 𝝋𝑩𝟏 − 0
Unique solution (Llyod Shapley, 1953)
C1
B2
B1
�𝝋𝑪𝟏 =
𝟐𝟑𝑽
𝝋𝑩𝟏 =𝟏𝟔𝑽

Coalition game framework
A set 𝒩 of players
A value function 𝑣 𝒮 defined on any subset 𝒮 ⊆ 𝒩 of players the value that can be generated by the set 𝒮 of
players independently 𝑣 ∅ = 0 and 𝑣 𝒩 = 𝑉
How should we split the value of the grand coalition 𝒩 among the players?

The Shapley value
It has a closed form
𝜑𝑖 =1𝒩 !
� 𝑣 𝑃𝑖𝜋 ∪ 𝑖 − 𝑣 𝑃𝑖𝜋
𝜋∈Π
Π denotes the set of all orderings of players 𝑃𝑖𝜋 denotes the set of players that precede 𝑖 in
the ordering 𝜋
Interpretations: average marginal contribution of player 𝑖 to the
set of players arrived earlier, when arrivals are uniformly distributed
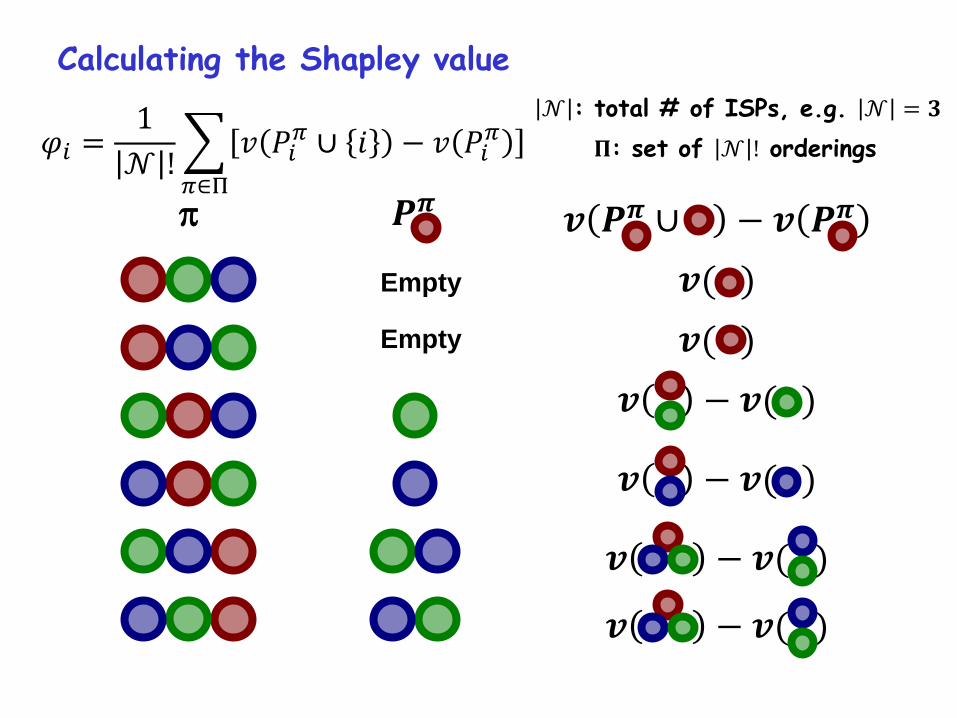
𝒗 𝑷𝝅 ∪ − 𝒗 𝑷𝝅
𝒗( )
𝒗( )
𝒗 − 𝒗( )
𝒗 − 𝒗( )
𝒗 − 𝒗( )
𝒗 − 𝒗( )
π
Empty
𝑷𝝅
Empty
𝒩 : total # of ISPs, e.g. 𝒩 = 𝟑 𝚷: set of 𝒩 ! orderings
Calculating the Shapley value
𝜑𝑖 =1𝒩 !
� 𝑣 𝑃𝑖𝜋 ∪ 𝑖 − 𝑣 𝑃𝑖𝜋
𝜋∈Π
Calculation 3 players with value function
𝑣 𝒩 = 𝑣 𝐶1,𝐵1 = 𝑣 𝐶1,𝐵2 = 𝑉 𝑣 𝐵1,𝐵2 = 𝑣 𝐵1 = 𝑣 𝐵2 = 𝑣 𝐶1 = 𝑣 ∅ = 0
3! = 6 permutations 𝐶1𝐵1𝐵2, 𝐶1𝐵2𝐵1, 𝐵1𝐶1𝐵2, 𝐵1𝐵2𝐶1, 𝐵2𝐶1𝐵1, 𝐵2𝐵1𝐶1
𝜑𝐵1 =16
{ 𝑣 𝐶1 ∪ 𝐵1 − 𝑣 𝐶1 + 𝑣 𝐶1𝐵2 ∪ 𝐵1 − 𝑣 𝐶1𝐵2+ 𝑣 ∅ ∪ 𝐵1 − 𝑣 ∅ + 𝑣 ∅ ∪ 𝐵1 − 𝑣 ∅+ 𝑣 𝐵2𝐶1 ∪ 𝐵1 − 𝑣 𝐵2𝐶1 + 𝑣 𝐵2 ∪ 𝐵1 − 𝑣 𝐵2 }
=16 𝑉 − 0 + 𝑉 − 𝑉 + 0 − 0 + 0 − 0 + 𝑉 − 𝑉 + 0 − 0 =
16𝑉
𝜑𝐶1 =16
{ 𝑣 ∅ ∪ 𝐶1 − 𝑣 ∅ + 𝑣 ∅ ∪ 𝐶1 − 𝑣 ∅+ 𝑣 𝐵1 ∪ 𝐶1 − 𝑣 𝐵1 + 𝑣 𝐵1𝐵2 ∪ 𝐶1 − 𝑣 𝐵1𝐵2+ 𝑣 𝐵2 ∪ 𝐶1 − 𝑣 𝐵2 + 𝑣 𝐵2𝐵1 ∪ 𝐶1 − 𝑣 𝐵2𝐵1 }
=16 0 − 0 + 0 − 0 + 𝑉 − 0 + 𝑉 − 0 + 𝑉 − 0 + 𝑉 − 0 =
46𝑉 =
23𝑉
C1
B2
B1

Convex coalition games
The value function 𝑣 is convex if for all coalitions 𝒮 and 𝒯 𝑣 𝒮 ∪ 𝑖 − 𝑣 𝒮 ≤ 𝑣 𝒯 ∪ 𝑖 − 𝑣 𝒯 ,∀𝒮 ⊆ 𝒯
marginal profit increases with the size of the coalition
Natural models for networks Metcalfe’s law: 𝑣 𝒩 = 𝑂 𝒩 2 Odlyzko’s law: 𝑣 𝒩 = 𝑂 𝒩 log 𝒩
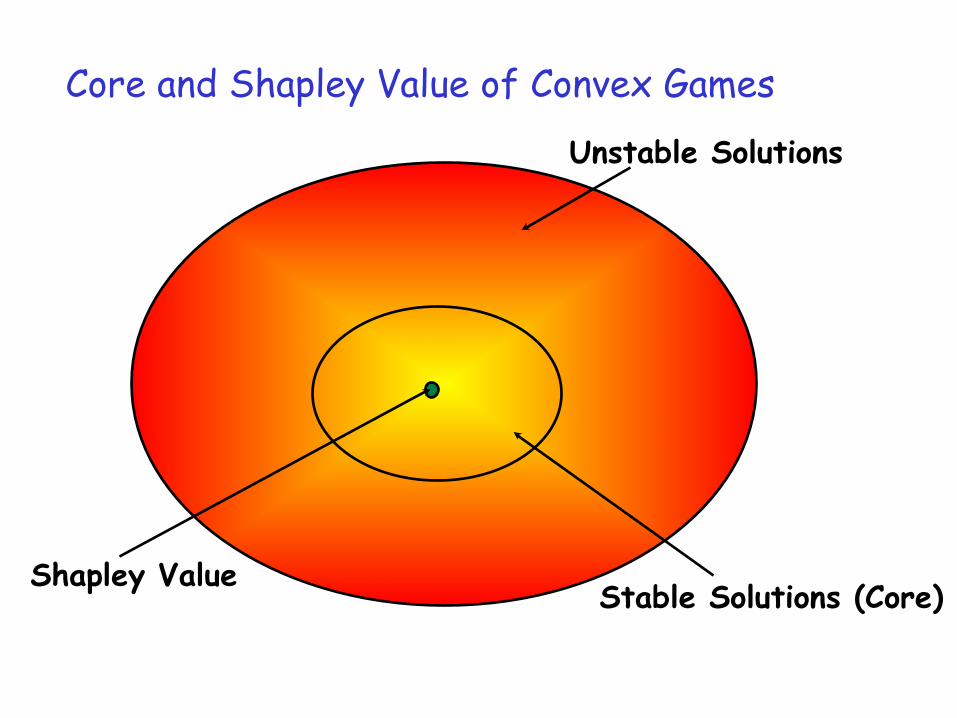
Core and Shapley Value of Convex Games
Unstable Solutions
Stable Solutions (Core) Shapley Value
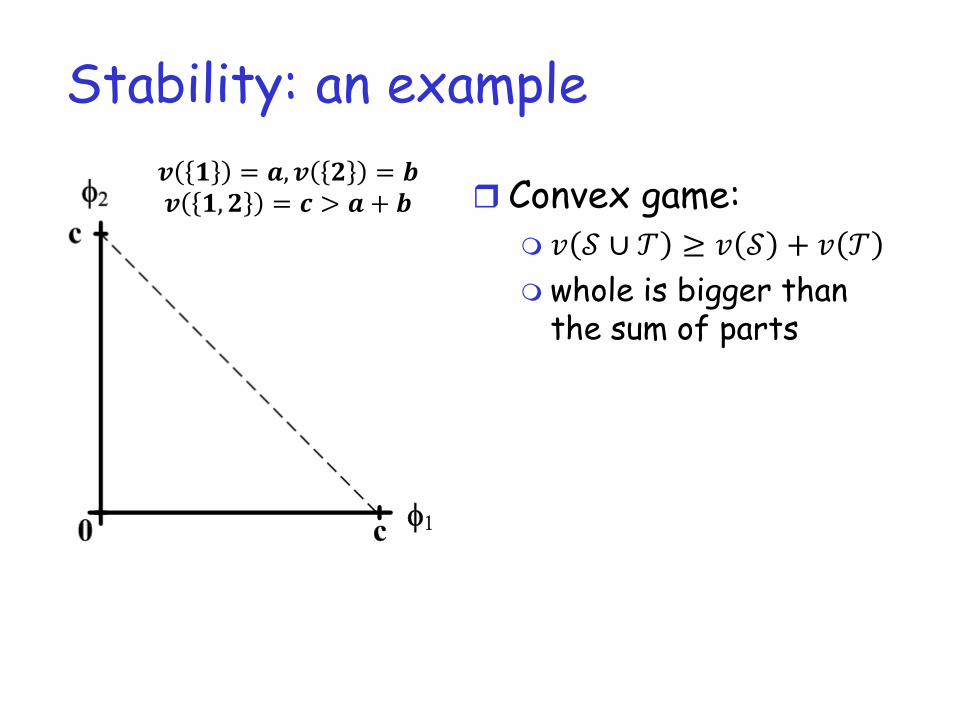
Stability: an example
Convex game: 𝑣 𝒮 ∪ 𝒯 ≥ 𝑣 𝒮 + 𝑣 𝒯 whole is bigger than
the sum of parts
𝒗 𝟏 = 𝒂,𝒗 𝟐 = 𝒃 𝒗 𝟏,𝟐 = 𝒄 > 𝒂 + 𝒃

Stability: an example
Convex game: 𝑣 𝒮 ∪ 𝒯 ≥ 𝑣 𝒮 + 𝑣 𝒯 whole is bigger than
the sum of parts Core: the set of
efficient profit-share that no coalition can improve upon or block
𝒗 𝟏 = 𝒂,𝒗 𝟐 = 𝒃 𝒗 𝟏,𝟐 = 𝒄 > 𝒂 + 𝒃

Stability: an example
Convex game: 𝑣 𝒮 ∪ 𝒯 ≥ 𝑣 𝒮 + 𝑣 𝒯 whole is bigger than the
sum of parts Core:
the set of efficient profit-share that no coalition can improve upon or block
Shapley value: core is a convex set. located at the center of
gravity of the core
𝒗 𝟏 = 𝒂,𝒗 𝟐 = 𝒃 𝒗 𝟏,𝟐 = 𝒄 > 𝒂 + 𝒃

How do we share profit? – n symmetric eyeball ISPs
Theorem: the Shapley profit sharing solution is
𝝋𝑪 =𝒏
𝒏 + 𝟏𝑽; 𝝋𝑩 =
𝟏𝒏 𝒏 + 𝟏
𝑽
C1
B2
B1
Bn

Profit share -- multiple eyeball and content ISPs
Theorem: the Shapley profit sharing solution is
𝝋𝑪 =𝒏
𝒎 𝒏 + 𝒎𝑽; 𝝋𝑩 =
𝒎𝒏 𝒏 + 𝒎
𝑽
C2
C1
Cm
B1
B2
Bn

Verify the result
𝝋𝑪 =𝒏
𝒎 𝒏 + 𝒎𝑽; 𝝋𝑩 =
𝒎𝒏 𝒏 + 𝒎
𝑽
Symmetry and efficiency are trivial
Fairness, for an eyeball and a content ISP we want to show the following is true:
𝒏
𝒎 𝒏 + 𝒎𝑽 −
𝒏 − 𝟏𝒎 𝒏− 𝟏 + 𝒎
𝑽 =𝒎
𝒏 𝒏 + 𝒎𝑽−
𝒎− 𝟏𝒏 𝒏 + 𝒎− 𝟏
𝑽

Results and implications of ISP profit sharing
𝝋𝑪 = 𝒏𝒎 𝒏+𝒎
𝑽; 𝝋𝑩 = 𝒎𝒏 𝒏+𝒎
𝑽
Each ISP’s profit share is Inversely proportional to the number
of ISPs of the same type. Proportional to the number of ISPs of
the other type.
C2
C1
Cm
B1
B2
Bn
Intuition When more ISPs provide the same service, each of them
obtains less bargaining power. When fewer ISPs provide the same service, each of them
becomes more important.
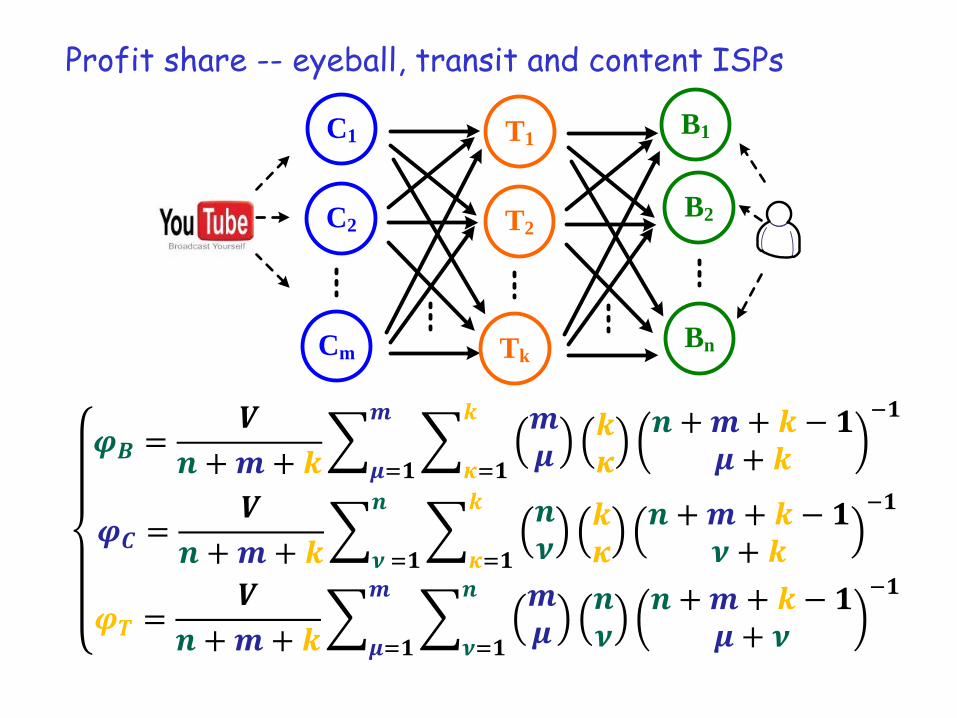
Profit share -- eyeball, transit and content ISPs
C2
C1
Cm
B1
B2
Bn
T2
T1
Tk
𝝋𝑩 =𝑽
𝒏 + 𝒎 + 𝒌� �
𝒎𝝁
𝒌𝜿
𝒏 + 𝒎 + 𝒌 − 𝟏𝝁 + 𝒌
−𝟏𝒌
𝜿=𝟏
𝒎
𝝁=𝟏
𝝋𝑪 =𝑽
𝒏 + 𝒎 + 𝒌� � 𝒏
𝝂𝒌𝜿
𝒏 + 𝒎 + 𝒌 − 𝟏𝝂 + 𝒌
−𝟏𝒌
𝜿=𝟏
𝒏
𝝂 =𝟏
𝝋𝑻 =𝑽
𝒏 + 𝒎 + 𝒌� �
𝒎𝝁
𝒏𝝂
𝒏 + 𝒎 + 𝒌 − 𝟏𝝁 + 𝝂
−𝟏𝒏
𝝂=𝟏
𝒎
𝝁=𝟏

Profit share – general topologies
B2
B1
C1 T1ϕC1 = 0
B2
B1
C1 T1
ϕC1 = 1/3V
B2
B1
C1 T1
ϕC1 = 1/3V
B2
B1
C1 T1
1. Shapley values under sub-topologies:
C1 is veto.
B2
B1
C1 T1
2. whether profit can still be generated without it:
Dynamic Programming! Result:
𝜑𝑖 =1𝒩
�𝜑𝑖 𝒩\ 𝑗 + 𝑉𝑖𝑣𝑣𝑣𝑣
𝑗≠𝑖
⇒ 𝝋𝑪𝟏 =𝟏𝟒� 𝟎 +
𝟏𝟑𝑽 +
𝟏𝟑𝑽 + 𝑽
𝒋≠𝒊
=𝟓𝟏𝟐
𝑽
T1
T2
T3
T4
C2
C1
C3
B2
B3
B1
B2
Eyeball ISPsContent
ISPsTransit ISPs
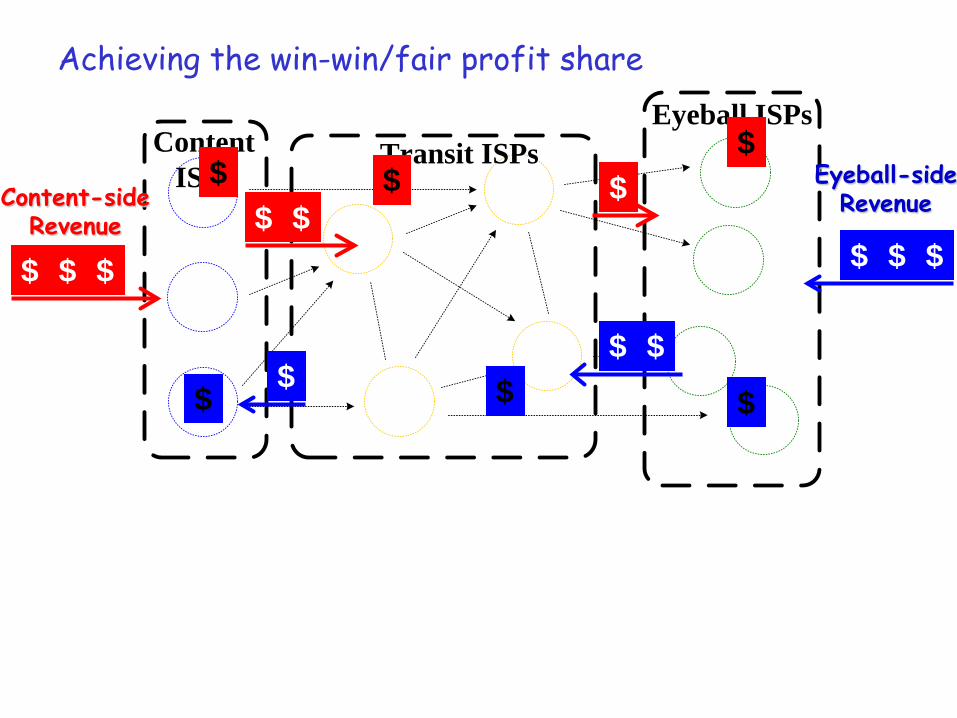
Achieving the win-win/fair profit share
$ $ $ $ $
$ $ $
$
$ $ $
$
$
$ $ $ $
Content-side Revenue
Eyeball-side Revenue

T1
T2
T3
T4
C2
C1
C3
B2
B3
B1
B2
Eyeball ISPsContent
ISPsTransit ISPs
Achieving the win-win/fair profit share
Two revenue flows to achieve the Shapley solution: – Content-side revenue: Content Transit Eyeball – Eyeball-side revenue: Eyeball Transit Content
$ $ $ $ $
$
$ $ $
$ $ $
Content-side Revenue
Eyeball-side Revenue
T1
T2
T3
T4
C2
C1
C3
B2
B3
B1
B2
Eyeball ISPsContent
ISPsTransit ISPs
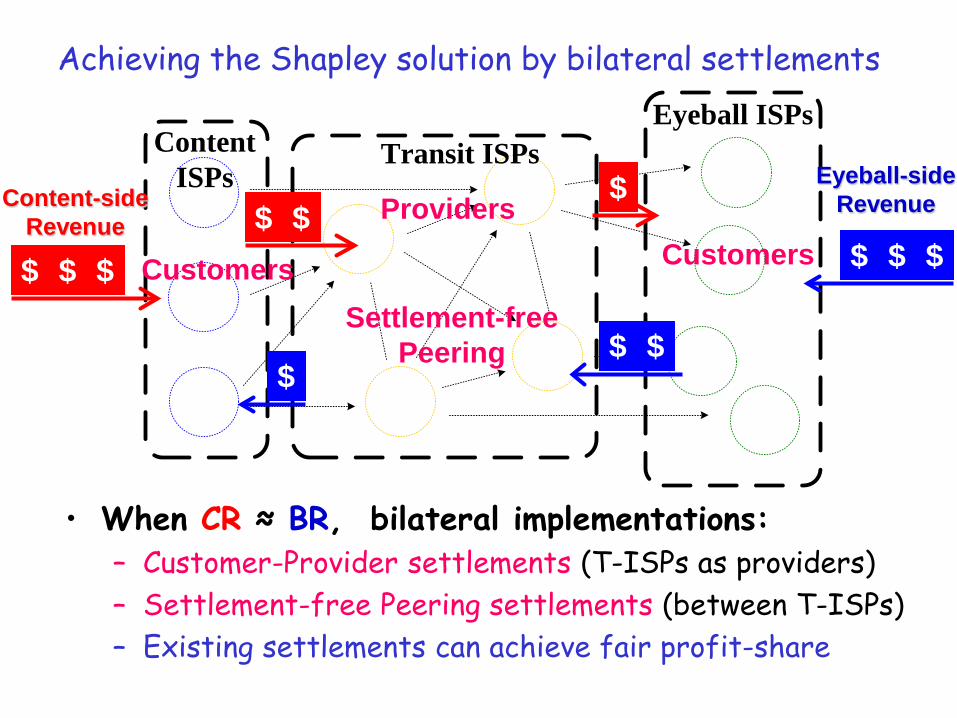
Achieving the Shapley solution by bilateral settlements
$ $ $ $ $
$
$ $ $
$ $ $
• When CR ≈ BR, bilateral implementations: – Customer-Provider settlements (T-ISPs as providers) – Settlement-free Peering settlements (between T-ISPs) – Existing settlements can achieve fair profit-share
Providers Customers Customers
Settlement-free Peering
Content-side Revenue
Eyeball-side Revenue

T1
T2
T3
T4
C2
C1
C3
B2
B3
B1
B2
Eyeball ISPsContent
ISPsTransit ISPs
$ $ $ $ $ $
$ $ $
$ $ $
$ $ $ $ $ $ $ $ $ $ $ $
• If CR >> BR, bilateral implementations: – Reverse Customer- Provider (T-ISPs compensate Eyeballs) – Paid Peering (Content-side compensates eyeball-side) – New settlements are needed to achieve fair profit-share – Published in 2008, happened from 2011 (Comcast Vs. Level3)
Customer Provider
Paid Peering
Eyeball-side Revenue
Content-side Revenue
Achieving the Shapley solution by bilateral settlements


A case study: Spanish Market
Study with Telefonica an eyeball ISP in Europe & South America the biggest broadband provider in Spain
Broadband market in Spain: 9.86 million user accesses.

AS-level ISP topology

User Demand Elasticity
Elastic user demand users can easily switch among local ISPs models a perfect competition among ISPs
Inelastic user demand
users cannot easily switch among ISPs. geographic limitations. long-term contracts incur large switching costs.
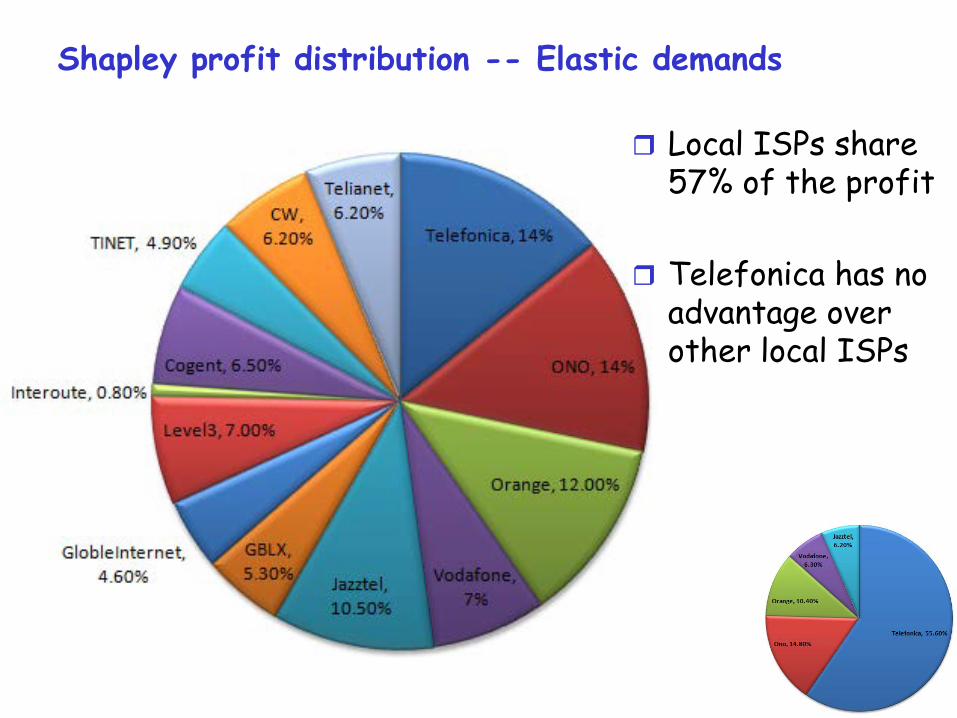
Shapley profit distribution -- Elastic demands
Local ISPs share 57% of the profit
Telefonica has no advantage over other local ISPs

Shapley profit distribution -- Inelastic demands
Local ISPs share 85% of the profit
Profits reflect the market power

Profit distribution: user demand elasticity matters!