Economics of Bamboo Boring : A study of the North-East Region of
80
Economics of Bamboo Boring : A study of the North-East Region of Bihar April 2004 Sponsored by: Planning Commission (SER Division) Government of India New Delhi
Transcript of Economics of Bamboo Boring : A study of the North-East Region of

Economics of Bamboo Boring : A study of the North-East Region of
Bihar
April 2004 Sponsored by:
Planning Commission (SER Division) Government of India
New Delhi

LL
C O N T E N T S Chapters Particulars Page No. Preface i – ii List of Tables & Photographs iii - iv ONE : INTRODUCTION 1 – 20 1.1 Background 1.2 Status of Irrigation in Bihar 1.3 Need for Minor Irrigation 1.4 Bamboo Boring 1.5 Sustainability of Bamboo Boring : North – East vis-à-vis Other Regions 1.6 Objectives of the Study 1.7 Research Questions 1.8 Methodology 1.9 Reference Year 1.10 Limitations of the Study 1.11 Layout of the Report TWO : REVIEW OF LITERATURE 21 – 31 2.1 National & Regional Level 2.2 International Level THREE : AGRO-ECONOMIC PROFILE OF 32 - 47 THE STUDY AREA AND THE RESPONDENTS Section – I : The study area 3.1 Location and Area 3.2 Population and Workers (Census – 2001) 3.3 Land use Pattern 3.4 Physical and Climatic Features 3.5 Rivers, Canals and Waterways 3.6 Cropping Pattern 3.7 Irrigational Status Section – II : The Respondents Educational Status, Social Status, Occupational Status, Family Status, Average Number of Workers, Land Holding Accounts, Irrigational Status of Owned Land, Source-wise Irrigational Status, Status of Farm Assets and Cropping Pattern FOUR : RESULTS AND DISCUSSIONS 48 – 73 4.1 Costs and Benefits of Bamboo Boring - Types of Stainers used - Prevailing Methods for Making Bamboo Boring Stainers

LLL
- Methods for Joining the Bamboo Stainers - Methods of Bamboo Boring in the Study Area - Methods of Bamboo Boring in the Study Area 4.2 Economics of Bamboo Boring 4.3 Cost of Pumping Across the Farm Size 4.4 Returns from Pumping on Per Farm Basis 4.5 Returns from Pumping on Per Boring 4.6 Bamboo Boring Vs. Shallow Tubewells - Cost Benefits Analysis 4.7 Pump Efficiency : Bamboo Boring Vrs. GI & PVC Pipe 4.8 Impact of Bamboo Boring on GCA and Cropping Intensity 4.9 Impact of Bamboo Boring on Income 4.10 Impact of Bamboo Boring on Employment 4.11 Constraints FIVE : SUMMARY AND CONCLUSIONS 74 – 96 5.1 Background 5.2 Bamboo Boring 5.3 Sustainability of Bamboo Boring : North – East Regions Vrs. Other Regions 5.4 Objectives 5.5 Research Questions 5.6 Methodology 5.7 Reference Year 5.8 Limitations 5.9 Review of Literature 5.10 Profile of the Study Area 5.11 Profile of the Respondents 5.12 Results & Discussions 5.13 Economics of Bamboo Boring 5.14 Bamboo Boring Vrs. Shallow Tube-wells 5.15 Impact on GCA and Cropping Intensity 5.16 Impact on Income 5.17 Impact on Employment 5.18 Constraints 5.19 Policy Prescriptions BIBLIOGRAPHY 97 – 99 Annex. – I : Comments on the draft Report 100 Annex. – II : Action Taken Report 101

�
P r e f a c e
Modern irrigation system lays stress on big dams but these are not suitable in certain regions of Bihar. The glaring example is of Koshi Dam in which crores and crores of rupees have been invested but the returns in terms of benefits have been extremely meagre and disappointing. This phenomenon should leaed us to find out alternative to big dams and this alternative must be cheap and must not have any long gestation period. It can be immediately applied and the result can immediately flow from the moment of its implementation. Bihar after vivisection has shrunk to only an agricultural sector and this necessitates ground water management, which can start working and giving benefits just after its introduction. This is the high time that we should go back to the traditional and customary irrigation methods with certain modification and changes. 'Bamboo boring' is one of the old systems of irrigation and this is entirely suitable in the present scenario especially for north-east region of Bihar. I am very much thankful to Planning Commission for sanctioning me the present research project entitled "Economics of Bamboo Boring : A Study of the North-East Region of Bihar". The study has been conducted on its economic viability, suitability profitability, sustainability and efficacy. The main findings of the study indicate that there are two congenial factors viz., favourable soil condition and water level for installation of bamboo boring. Besides, the devices are feasible and profitable in the region. A comparative economic analysis of bamboo boring and shallow tube-wells has been made which reveals that the bamboo boring is more economical and attractive devices for the cultivators in general and small and marginal farmers in particular. The Cost Benefit ratio was calculated at 1 : 2.36 which further proves its viability. Moreover, positive impact on income, employment and production of the crops was also traced. But the devices were not found free from the constraints for which serious considerations are required by the policy makers in terms of technological, financial, humane and power backup. I hope, the findings of the study will help the policy makers to make the devices meaningful and purposeful in the north east region of Bihar. The present study is the outcome of sincere advice, co-operation and learned suggestions received from a galaxy of scholars and officials of various departments. Such an intellectual debt is too complex and entity to be acknowledged in a brief space First of all, I express my sincere thanks to all the officials of Planning Commission, Government of India especially, Sri P. K. Aggarwal, and Shri Avinash Mishra for their valuable and useful comments on the draft

�
reoort of the study, which gave me opportunities to enrich the contents of the report. I express my gratefulness to our Vice-Chancellor, Sri Ashok Kumar Chauhan, I.A.S; the Pro-Vice-Chancellor, Prof. Ajit Kumar Sinha and the Registrar, Prof. Umesh Prasad Singh for their enthusiastic approach to research. The District Statistical Officer, District Agriculture Officer, Block Officials and the officials of the Department of Minor Irrigation and Groundwater, Saharsa District and the respondents deserve my special thanks for their sincere co-operation. Finally I must thank all the members of the Project team particularly Dr. Himanshu Mohan Mishras 'Deepak', Md. Masood Alam, Mr. Arbind Kumar Singh and Mr. C. P. Azad for their untiring efforts in completion of the study. Further I take this opportunity to thank all the members of the Agro-Economic Research Centrefor Bihar & Jharkhand, T M Bhagalpur University, Bhagalpur for their expert advice and co-operation in the conduct of the study.
(Ugra Mohan Jha) Project Director
List of Tables & Photographs
S. N. Table No.
Description Page No.
1. 1.1 District wise GCA, TIA & TWIA and its percentages in Bihar (1997 – 98)
4
2. 1.2 District wise irrigation potential from ground water
5
3. 1.3 Block - wise number of Bamboo Borings under operation (2002–2003)
17
4. 1.4 Distribution of Sample Respondents 18
5. 3.1 Population and Workers Profile in Saharsa District
33
6. 3.2 Land-use Pattern in the District 34 7. 3.3 Cropping Pattern of Saharsa District 36
8. 3.4 Source-wise Total Irrigated Area of Saharsa District (2001-02)
37
9. 3.5 Educational Status of Sample Respondents by Size Groups
38
10. 3.6 Social Status of Sample Respondents by Size Groups
39

�
11. 3.7 Occupational Status of Sample Respondents by Size Groups
40
12. 3.8 Family Status of Sample Respondents by Size Groups
41
13. 3.9 Average Number of Workers on per farm basis
42
14. 3.10 Land Holding Accounts of Sample Respondents
43
15. 3.11 Irrigational Status of Land Owned by Respondents
43
16. 3.12 Source-wise Irrigational Status of Operated Land
44
17. 3.13 Status of Farm Assets Owned by Respondents
45
18. 3.14 Cropping Pattern Followed by Sample Respondents
47
Photographs : Components of Bamboo Boring
51 (a to d)
19. 4.1 Estimated Cost of Bamboo Boring Across the Farm Size on Per Boring Basis
52
20. 4.2 Estimated Cost of Bamboo Boring Across the Farm Size Per Farm in Sample District
54
21. 4.3 Costs of Pumping Across the Farm Size per Boring
58
22. 4.4 Costs of Pumping Across the Farm Size per Farm
60
23. 4.5 Returns from Pumping Across Farm Sizes on Per Farm.
61
24. 4.6 Returns from Pumping Across Farm Sizes on Per Boring
62
25. 4.7 Estimated Cost of Bamboo Boring & Shallow Tube-wells
63
26. 4.8 Change in Cropping Intensity Per Farm Across the Farms Due to Inception of Bamboo Boring in Sample Area
69
27. 4.9 Incremental Income After Inception of BTW Across the Farms
70
28. 4.10 Incremental Employment Generated for Human Labour of Per Hectare Net Sown Area (mandays/ha.) Across the Farms
71

�
CHAPTER – ONE
INTRODUCTION
1.1 Background “Irrigation is every thing in India; water is more valuable than land, because, when water is applied to land it increases its productiveness, at least six-fold, and renders great extent of land +89productive, which otherwise would produce nothing or next to nothing” (Sir Charles Travelyan). Irrigation forms the datum line for sustained successful agriculture. In a country like India, its importance is all the more great. Agriculture by irrigation antedates recorded history and is probably one of the oldest occupations of the civilised man. Irrigation is the obvious means of making the country’s agriculture relatively independent of the vagaries of rains and of putting on a more secure footing, the agricultural economy of the nation on which to great extent the welfare and happiness of the largest section of the people in a predominantly agricultural country hinges. Irrigation has played a vital role in the continuous process of agricultural development. Without water we cannot imagine agricultural production. Economic and social development to a great extent depends upon the creation of surplus agricultural produce. This often requires extension of agriculture through new irrigation projects or the improvement of existing irrigation system and practices to ensure optimum land utilisation through efficient water use. Irrigation development in the past had mostly taken place as a measure of famine relief. In India, in fact, famines gave birth to the idea of artificial irrigation. Now, with the population multiplying rapidly, irrigation has assumed greater importance for augmenting agricultural production. The importance of irrigation may be viewed from three aspects, viz., ‘protective aspect’ to make up the moisture deficiency in soils during the cropping season so as to ensure proper and sustained growth of crop grown; ‘additional land use aspect’ to enable a second or third crop being raised on the land provided with irrigation which could other wise not be cultivated efficiently more particularly during the post or pre-monsoon period. The third aspect helps in augmenting and preserving the properties of soils by application of adequate supply of water. Water is a basic input influencing crop production. All plant nutrients enter into the plants through water. Irrigation promotes employment and income both. The construction and maintenance of an irrigation project have far reaching effects on the economic life of the community living within a region and also to some extent on the community living without it. Investment in an irrigation

�
project leads to the creation of new or additional productive activity and new or additional production. The utilisation of opportunities created by such capital work needs further investment in order to launch new productive activities or for expanding old activities in the area affected by the project. In this way, irrigation adds tremendously to output, employment and capital formation in agriculture sector. It may supplement the slender income of poor farmers by providing side jobs. It encourages farmers to adopt more scientific techniques. It enables them to sow the right grains at right time and realise higher profits. It also permits them to go in for more intensive cropping which creates new opportunities for gainful employment (two or three crops in place of one crop), changing the cropping pattern and by facilitating the use of modern inputs such as; fertiliser, pesticides and hybrid seeds. 1.2 Status of Irrigation in Bihar Bihar has high percentage of irrigation and ranks fifth among the major states. The gross cropped area of Bihar is estimated at 7946435 ha. and out of it the total irrigated area is 4040706 (60.92 %). As regards the tubewell irrigated area is concerned, it is 2351439 ha. accounting for nearly 29.59 per cent of the gross cropped area. The percentage of tubewell irrigated area to the total irrigated area has been estimated at 48.58 per cent. The data presented in table 1.1 clearly states that the on irrigational front tubewell does not occupy the major source of irrigation as it irrigates only 30 per cent of the gross cropped area and less than 50 per cent of the total irrigated area. Virtually the canals occupied the major source of irrigation in the state. But it is to be mentioned here that the poor maintenance of canal irrigation structure in the state has badly affected its proper functioning. It is due to the fact that most of canal beds have silted, which has restricted the sufficient water flow at the night time. Thus, the importance of tubewell irrigation has increased. Further the table 1.1 highlights the district wise irrigation potential from ground water in the state. It clearly reveals that the percentage of irrigation potential created to the ultimate irrigation potential ranges between 61.41 per cent and 22.33 per cent in Begusarai and Banka district respectively. It means that there is much potential of ground water irrigation in the state which is to be tapped with a maximum of 77.67 per cent and minimum of 38.59 per cent across the districts in the state. As regards the study area, the irrigational potential created is just 43.16 per cent to the ultimate irrigation potential from the ground water. So there is immense scope to tap the potential of remaining 56.84 per cent of the total ground water irrigational resources in the district.

�
Most of rivers in Bihar are seasonal and carry insignificant flows in the rabi season and often dry up during summer where the scarcity of water is acute. In North Bihar Kosi, Gandak and Ghaghra with their catchments in the glacial regions have perennial flow. Mahananda, Kamla and Baghmati with their sources in the Himalayan region have much less flow during dry months. The characteristic of these rivers in that about 80 to 90 per cent of the annual run – off takes place during the 4 months of monsoons, the rivers are largely dry during 8 months of the year.
Table : 1.1 District wise GCA, TIA & TWIA and its percentages in Bihar (1997 – 98)
(In ha.) Sl. No.
Name of the districts
Gross Cropped
Area (GCA)
Total Irrigated
Area (TIA)
% of TIA to the GCA
Tube-well Irrigated Area
(TWIA)
% of TWIA to the GCA
% of TWIA to the TIA
1. Araria 255093 78444 30.87 45138 17.70 57.33 2. Aurangabad 272317 218075 80.09 41046 15.08 18.83 3. Banka 157476 110583 70.23 50672 32.18 45.83 4. Begusarai 185927 86406 46.48 78094 42.01 90.38 5. Bhagalpur 190548 79633 36.55 48910 25.67 70.24 6. Bhojpur 242482 188537 77.76 37509 15.47 19.90 7. Bouxer 198459 159745 80.50 34268 17.27 21.46 8. Champaran (E) 352491 164468 40.66 132824 37.69 80.76 9. Champaran (W) 418959 303861 48.66 14123 8.15 16.74 10. Darbhanga 198032 75016 37.87 21684 10.95 28.91 11. Gaya 213920 153474 71.75 81237 35.98 52.94 12. Gopalganj 245204 119334 48.67 50850 30.74 42.62 13. Jahanabad 161540 138281 85.61 70834 43.85 51.23 14. Jamui 69549 27277 39.22 5228 7.52 19.17 15. Kaimur 209169 168748 80.68 85700 40.98 50.79 16. Katihar 277231 127677 46.06 122234 44.10 95.74 17. Khagaria 130024 77673 59.74 75697 58.22 97.46 18. Kishanganj 169207 416 23.65 40016 23.65 100.00 19. Lakhi sarai 85540 50563 59.11 20469 23.93 40.49 20. Madhepura 223612 130558 58.39 65250 29.18 49.98 21. Madhubani 289657 96484 33.31 37327 12.89 38.69 22. Munger 71010 41560 58.46 7697 10.84 18.55 23. Muzaffarpur 301631 121706 40.35 94585 31.36 77.72 24. Nalanda 239420 197569 82.52 136203 56.89 68.94 25. Nawada 151188 131431 86.94 57535 38.06 43.78 26. Patna 241721 164543 68.07 164543 68.07 100.00 27. Purnea 293040 148090 50.54 101282 34.57 68.40 28. Rohtas 366729 332161 90.58 46347 12.64 13.96 29. Saharsa 214371 96753 45.14 84205 39.28 87.03 30. Samastipur 255339 94521 37.02 93877 36.77 99.32 31. Saran 234348 109561 46.76 73706 31.46 67.28 32. Sheikhpura 59853 46993 78.52 18981 31.72 40.40 33. Shivhar 46454 16540 35.59 13293 28.61 80.73 34. Sitamarhi 214444 61413 28.64 46537 21.71 75.78 35. Siwan 265539 134309 50.58 94332 35.53 70.24 36. Supaul 248214 122948 59.54 61622 24.83 50.12 37. Vaishali 196674 80506 40.94 77587 39.45 96.38
Bihar 7946435 4840706 60.92 2351439 29.59 48.58 Source : Department of Minor Irrigation, Government of Bihar, Patna

�
Table : 1.2 District wise irrigation potential from ground water
Sl. No.
District
Total ground water
resource (Ha. m)
Qnty. Of Ground Water resource form drinking and industrial use
(Ha. m.)
Available ground water resource for
irrigation (Ha. m.)
Ultimate ground water resource for
irrigation (Ha. m.)
Irrigation potential created
(Ha.)
Ultimate irrigation potential
(Ha.)
% of potential created
to ultimate potential
1 Araria 128251 19238 109014 98111 45253 150941 29.98 2 Aurangabad 86785 13017 73769 66391 47941 165973 28.88 3 Banka 96332 14452 81892 73703 41138 184254 22.33 4 Begusarai 63479 9523 53962 48563 45878 74709 61.41 5 Bhabhua 98529 14778 83751 75373 54641 188437 29.00 6 Bhagalpur 72645 10898 61749 55573 47972 138935 34.53 7 Bhojpur 73076 10960 62116 55895 33209 89024 33.54 8 Buxer 72405 10859 61546 55389 31527 85215 37.00 9 Champaran (E) 129954 19493 110463 99415 68424 152948 44.74 10 Champaran (W) 196182 29426 186757 150079 62505 230891 27.07 11 Darbhanga 68408 10261 58148 52330 30928 80511 38.41 12 Gaya 116187 17454 98760 88883 88707 222207 39.92 13 Gopalganj 68670 10300 98370 52532 33856 80818 41.89 14 Jamui 46097 6914 39183 35265 22348 88161 25.35 15 Jehanabad 47897 7184 40714 36640 31532 56372 55.94 16 Katihar 88327 13249 75080 67570 48737 103953 46.88 17 Khagaria 45530 6829 38701 34831 24266 53585 45.29 18 Kishanganj 83342 12501 70841 63758 24905 98085 25.39 19 Lakhisarai 28308 4246 24062 21656 21059 54139 38.90 20 Madhepura 54696 8204 40493 41843 32215 64374 50.04 21 Madhubani 93940 14092 79849 71863 36653 110559 33.15 22 Munger 27809 4172 23637 21274 18166 53185 34.16 23 Muzaffarpur 99824 14974 84852 76366 67567 117485 57.51 24 Nalanda 64865 9729 55137 39621 48664 124053 39.23 25 Nawadah 48105 7217 40853 36802 44105 92002 47.94 26 Patna 95476 14321 81155 73040 67385 112369 59.97 27 Purnea 120448 18068 102380 92144 41939 141760 29.58 28 Rohtas 116655 17497 99159 89241 77722 223103 34.84 29 Saharsa 51794 7769 44027 39623 26307 60959 43.16 30 Samastipur 81394 12208 69186 62265 53257 95795 55.69 31 Saran 78762 11815 67349 60251 39342 92698 42.44 32 Shaikhpura 11526 1729 9797 8817 11499 22044 52.16 33 Sitamarhi 66792 10020 66775 51096 44408 78608 56.49 34 Siwan 63960 9597 54369 48931 41028 75278 54.50 35 Supaul 60422 9264 51358 46223 41389 71111 58.20 36 Vaishali 63293 9492 53801 48419 43030 74490 57.77
Source : Department of Minor Irrigation, Government of Bihar, Patna
Efficient water management depends upon selecting the irrigation method best suited to local conditions, properly preparing the land and installing irrigation equipment as required, and then intelligently managing the irrigation operations. The development of the system of irrigation in a region is governed by local, meteorological, geological and other physical conditions. Therefore, there cannot be any uniformity in the systems of irrigation in different tracts. The irrigation system of Bihar differs region-wise. The major and medium irrigation projects suffer from certain draw blocks. A large number of pre –requisites are needed for their successful implementations. They need huge amount of capital expenditure for

�
purchase of land, construction of surface storage and provision of distribution channels and sufficient money for resettlement of the oustees from the areas that may be submerged under the dam. There is wastage of water in distribution system. A large area might suffer from the problems of water logging, needing vast amount of money for reclamation purposes. The catchment area of the dams needs protection from soil erosion, otherwise the dam may be silted very soon and go out of use. Such schemes involve more time in investigation, planning and construction and the gestation period is even large. Hence, they are less reliable for timely supply of water. 1.3 Need for Minor Irrigation The above mentioned factors clearly indicate that the efficiency of major and medium irrigation projects is limited in Bihar and especially in North –Eastern part of Bihar. Hence, there is every need for the construction, preservation and improvement of such minor works which can meet irrigation requirements of poor agrarian economy of Bihar. Really, speaking, small irrigation works should form the backbone of agriculture of the state. Minor irrigation projects relate to the development of ground water resources on scientific lines. Ground water is one of the earth’s most widely distributed resources. It provides an assured and dependable source of irrigation free from the vagaries of rainfall. The exploitation of ground water in canal command where surface flows are not adequate attains special significance. The ground water in such cases acts as a dependable balancing reservoirs from which supplies can be drawn to make up deficiencies in river supplies. It also helps in controlling water logging and salinisation in the canal commands. The utilisation of irrigation potential is almost immediate. The Grow More Food Enquiry Committee (1952) recommended that top priority should be given to minor irrigation schemes. To draw the attention of the state govt. to the problems of acceleration, effective utilisation and proper maintenance of minor irrigation works, three Regional Minor Irrigation Conferences were convened by the Ministry of Food and Agriculture in 1958. Subsequently in 1959, the Agricultural Production Team of the Ford Foundation recommended, among others, that more emphasis be placed on irrigation projects which yield rapid returns in food production, like tube - wells and shallow masonry wells. The minor irrigation systems have comparatively short gestation period and can be handled to a large extent by the cultivators themselves. They need small initial outlay and can be executed with the help of local resources and equipments. The cost per hectare of minor irrigation is lower than in major irrigation.

�
Thus, the above facts show the importance of minor irrigation system for the poor agrarian economy of Bihar. The govt. has also given top priority to the development of minor irrigation projects in almost all of our five Year plans. The remarkable increase in food production in ground water irrigated area is a testimony of realisation of ground water as an important source of minor irrigation. The ground water can be utilised through two broad means; open wells and tube – wells. In all over India, open wells as a means of irrigation have been used on an extensive scale since ancient times. In these, water is lifted using simple tools operated either by manual or by animal power. But open wells periodically suffer from low water table and are often unable to supply the normal quantity of water in summer seasons. Their discharge is generally not sufficient to sustain a pump set. Their command areas are also very small. On account of these factors, in the period of 1968 – 69 the popularity of open wells as a means of irrigation declined and they gave way to tube-well irrigation. The tube-well, too, can be put under two broad categories; deep and shallow. The deep tube-wells tap deep seated aquifers (more than 300 ft. from the earth’s surface) and the shallow tube-wells tap shallow aquifers (less than 200 ft. from the earth’s surface). The deep tube-wells are generally fitted with high power on water lifting machines of more than 15 h. p. capacity. The shallow tubewells are generally fitted with small power water lifting machines, 3 to 8 h. p. capacities. The deep tubewells are not suited to the majority of the farmers of Bihar, since most of them are poor and their holdings are very small. They can neither afford to install such costly by tube-wells nor make full use of them, since their holdings are not only small but also divided and fragmented into several pieces. 1.4 Bamboo Boring Like shallow tube-well another low cost device for exploiting ground water has been introduced by the farmers of Saharsa district of Bihar. This unique system of irrigation is called Bamboo Boring. It is most popular among small and marginal cultivators of North – Eastern part of Bihar. Mr. Ram Prasad Choudhary Jaisawal of Village Lalpur in the Singheshwer Asthan Block of old Saharsa district (now Madhepura), a medium farmer owning about 15 acres of land, was the first person who invented the ‘bamboo tube-well’ in December 1968. It bids fair to presage a spectacular break through in the exploitation of ground water. The Bamboo Tube-wells (BTWs) provide an excellent example of intermediate technology well suited to the needs of small sized land holdings.

��
It may be mentioned that a BTW is essentially a shallow tube well but drilled upto a depth of only 50 ft. to 80 ft. But the shallow tube wells are comparatively deeper (up to 200 ft.) and tap more aquifers than the bamboo tube-wells. The traditional BTW was cased with a pipe made of bamboo strips. Originally the casing consisted of six strips of bamboo tied to steel rings of about 4” to 6” diameter and wrapped with coir strainer. A BTW consists of 3 bamboo pipes of 20 ft. length. Generally three bamboos are used in a BTW. One or two labourers can finish the bamboo strips. One labour may wrap the coir strainer on bamboo pope. About 4 to 5 kgs. Of coir strainers are used in a 20 ft. bamboo pipe. In this may about 15 kg. coir strips are used in a BTW. The materials used are locally available and village labourers may easily finish the total work. The only skilled technician needed is the village blacksmith for iron rings. Six bamboo strips are circularly laid over iron rings of 4” to 5” diameter and fixed to rings with nails and iron wires. Then coir string is tightly bound around the bamboo frame. About 20 iron rings are used in a 20 ft. length bamboo frame. Thus the bamboo tubewell has brought the tapping of ground water well within the means of small cultivators. Bamboo tubewells are more popular in Purnea and Saharsa districts of north-east region of Bihar, particularly amongst small and marginal farmers. BTWs involve low capital cost in comparison to 7 times more for shallow tubewells and they need most simple technology. BTWs are being drilled and installed by local artisans in a relatively shorter period of time. However, now the technology has changed. Recently some improvements have been made is BTW. The top 15 to 20 ft. portion of the casing is now replaced by the metal pipe to avoid the cutting of coir strainer by rats. Coir strainer has been replaced by plastic net and plastic wire. The improved BTW is economically more sound than the traditional BTW. The life of traditional BTWs was about at 4 to 5 years. But, the life of the improved BTWs is about 7 to 10 years. The life of the shallow tube-wells (STWs) is estimated at 15 years. The cost of improved BTW is nearly double than that of traditional BTW. The improved BTWs are more popular among small and marginal farmers of Saharsa Purnea, Khagaria, Madhepura, Supoul, Katihar and some part of Bhagalpur districts of Bihar. In the beginning the Bihar State Tube-well Department had several objections to the efficiency of BTW. The bamboo was easily affected by air and water, destroyed by white ants and rodents and could not resist the soil pressure. But the severe drought of 1972 turned out to be the proverbial ‘blessings in disguise’ for the districts of Saharsa and Purnea. As part of the programme to step up rabi production, the Government of Bihar, placed funds at the disposal of the district collectors for sanctioning loans to small farmers for sinking bamboo tubewells. The district administration of both

��
the districts gave the highest priority of the sinking of bamboo tubewells and geared up the entire administrative machinery. As a result from October 1972 to January 1973 a period of four months only – over 1900 bamboo tubewells were sunk and over one lakh acres of agricultural land was brought under irrigation in these two districts. For these schemes sufficient funds were sanctioned by Agricultural Refinance and Development Corporation (ARDC) to Bihar State Land Development Bank (BSLDB) and Kosi Regional Rural Bank (Kosi RRB) for the construction of shallow tubewells, bamboo tubewells and installation of pumps sets. The original scheme sanctioned to BSLDB in January 1969 envisaged provision of long term finance to the farmers for construction of 7,329 shallow tube wells with pump sets in Purnea and Saharsa districts involving a credit assistance of Rs. 808.88 lakhs. The area of operation of scheme was confined to 43 blocks of Purnea and 18 blocks of Saharsa districts. The scheme was phased for implementation over a period of three years, i.e. 1969 to 1972. It was first re-phased by ARDC in February 1970. The re-phased scheme provided a reduced financial assistance of Rs. 675.30 lakhs and the period of implementation was extended by another two years, i.e. upto 1973-74. Since the physical and financial achievements under the scheme were not satisfactory, the scheme was again rephased on the request of BSLDB with a reduced physical and financial programme of 2000 shallow tube-wells with pump sets and 6,050 pump sets alone involving financial assistance of Rs. 414.66 lakhs and the period of implementation was extended upto June 1975. The BSLDB achieved both physical and financial targets by advancing loans of Rs. 442.30 lakhs for 1,926 shallow tube wells and 6,536 pump sets. The scheme was closed in March 1975. Further, on account of the growing popularity of the bamboo tubewells in these districts the BSLDB submitted a supplementary scheme to ARDC for approval. The scheme envisaging construction of 4000 bamboo tubewells with pump sets and 4000 pump sets alone involving credit assistance of Rs. 368.00 lakhs and refinance assistance of Rs. 331.20 lakh was sanctioned to the BSLDB in May 1976. The scheme was phased for implementation over a period of about 5 years. The scheme was closed in June 1980. The Bank had achieved the financial programme to the tune of Rs. 373.72 lakhs covering 1,043 bamboo tubewells with pump sets and 6,081 single purpose pump sets. A minor irrigation scheme with financial outlay of Rs. 14.36 lakhs for construction of 429 bamboo tubewells alone, 100 bamboo tubewells with pump sets and 255 pump sets alone was sanctioned by the ARDC to Kosi RRB in September, 1978. The scheme was phased for implementation over three years i.e. 1978 – 1980. Since there was high demand for bamboo tube wells in the scheme area, the bank achieved the targets of the scheme much

��
earlier, i.e. March, 1979. The targets of BTW alone were 429 but the achievements were for more up to 942 BTWs. The targets of BTWs with pump sets were 100 but the achievements were 139. These targets indicated that BTWs were gaining mo re popularity. In this way, the bamboo tube well has several obvious advantages. In the context of acute shortage of steel, its substitution by bamboo is a welcome development from the point of view of the national economy. The most attractive feature of the bamboo tubewell is its extremely low cost. Further, the bamboo tubewell has brought the exploitation of ground water within the reach of small cultivators. Even cultivators who own as little as half an acre of land have installed bamboo tube well. Most of the holdings being fragmented, hitherto even well – to do farmers found it difficult and uneconomic to provide irrigation for all the plots of land owned by them. Now they are in a position to install a bamboo tube well in each scattered plot and bring the entire holdings under irrigation. The bamboo tubewell has also generated considerable employment in the rural areas of Bihar. Bamboo tube wells provide employment for village labourers who are unskilled. The fabrication and installation of one bamboo tubewell gives employment to about ten labourers for one day. Thus, the large scale exploitation of ground water by sinking BTWs will be remedy to a great extent the water logging caused by the Kosi irrigation system. In all probability this low cost device for the exploitation of ground water will bring considerable agricultural prosperity to Kosi area in the years to come. Most of the farmers have now become cost conscious. When they find that the investment is worthwhile they go in for sinking bamboo tubewells in a big way with only nominal assistance from the financial institutions. In this way BTWs turn out to be a corrective and a complement to canal irrigation, big, medium, small and marginal farmers of Saharsa district have drilled BTWS to improve agricultural production. The living standard of the cultivators increased after the use of BTWS. According to the statement of the farmers of the Saharsa district the agricultural production increased 3 to 4 times by the use of BTWS. Before BTWS we could not grow wheat, maize, paddy at such a large scale. Now – a – days, BTW is an important source of irrigation in Saharsa district. Farmers are fully dependent on BTWS for irrigation. BTWS provide income, employment, cropping pattern, etc. Farmers now cultivate wheat, paddy, maize, banana, sugarcane, jute, and tobacco on a large scale. Marginal farmers have adopted the co-operative formula. They have low income and capital. Five to ten farmers sink the BTW on co-operative basis and then

��
irrigate their land accordingly. Thus BTWS are most popular among all categories of the farmers of Saharsa district. 1.5 Sustainability of Bamboo Boring : North – East vis-à-vis other Regions Sustainability depends on the existence of stability or permanence of pre-requisites and the existence of necessity and viability. Bamboo Boring is sustainable in the whole area of present Bihar. The soil in North-West of Bihar and the parts of Bihar just south of river Ganga is extremely congenial for bamboo boring. Water level is available within 80 Ft. and this is extremely suitable for having irrigation by bamboo boring. Further, if layers of sand are encountered underground that will create a great obstacle for this system of irrigation because sands may enter the strainers which will thus be blocked and choked. This will paralyse the operation of bamboo boring and render it inoperative. Such an eventuality has no possibility to emerge in any part of existing Bihar. The soil condition and water level are both suitable for this type of irrigation. To cap all it is extremely cheap and easy to handle. It does not require great skill or technical dexterity to operate the system. Besides it can be installed in a day and that also with local labour and materials easily and locally available. One favourable feature operating in favour of sustainability is the existence of a large number of marginal and small farmers. It is they who pre-dominate. Big land holders are conspicuous by their absence in Bihar and they do not usually go in for bamboo boring because they have abundance of monetary and other resources. If small, marginal and subsistence farmers call the tune and place themselves in control of the arrangement and installation, the future of bamboo boring is assured and its permanence guaranteed. Indian agriculture has been a moot witness to the fast pace of ground water depletion through the intermediate categories of tube–wells. All available research studies which have been conducted in Agricultural Universities and in other research organizations on the failure of bamboo boring and shallow tube-wells show that the sustainability of bamboo boring has been the prime factor across the state. The conditions of such tube–wells were solely dependent on water table condition, property of the soil, type of soil, etc, which are directly linked with its sustainability. The suitability of bamboo boring in north-east region of the sampled state and other parts of the country has been rightly pointed out. In this regard we have gone through various published and unpublished research journals and works carried out by various institutions in the state and out side of the state. Review of these literatures established that bamboo tube-wells were found especially in Gangetic basin and Kosi river belt of the country.

��
The composite information related with sustainability of bamboo boring, indicates that these tubewells were sustainable in the area where ground water table ranges between 20 feet to 80 feet from the surface. It means bamboo boring is technically feasible only in regions where good aquifers are available within a maximum depth of 80 feet. On the other hand, where there is a tendency of frequent fall in the water table in different parts of the country, it is generally beyond the investment capability of the farmers, specially poor farmers and so the sustainability of such boring is doubtful. In case of Bihar the water table were found constant for the whole year between 45 to 120 feet in the sample area, while the state of U. P., Haryana, Punjab and West Bengal witnessed a fall of 10 to 25 cm per annum in the water table. Hence, in the regions where such borings are in existence they face the threat of their existence as declining trends in water levels are being witnessed in these areas. It is also observed that in flood prone area of the region the decline in water level in case of shallow aquifers automatically went down during the flood. After 1970, there was a gradual shift in the cropping pattern of the country from food to commercial crops, which demands more irrigational water. Since farmers have been using more water to meet the increased demand without the recharge of aquifer, this caused recurring shortfall of water especially in case of shallow type of aquifers for assured crop production. Water extraction rates were more than recharge rates causing enhancement of irrigation expenditure in case of shallow aquifers also like bamboo boring. This caused non-sustainability of the resources across the country. 1.6 Objectives of the study The broad objectives of the study are : i. To gauge the importance of Bamboo Boring with particular reference to the area of land irrigated, number of labour employed and the amount of capital invested in selected farms, ii. To quantify the costs and benefits accruing to sample farmers, iii. To identify the season-wise suitability of Bamboo Boring in selected farms, iv. To pin down the main constraints in regard to the installation, lifting of ground water, maintenance and operation, v. To assess the feasibility, suitability, sustainability and desirability of bamboo boring in the sample area, vi. To examine the impact of bamboo boring on income and employment of sample farmers, vii. To suggest measures for the consideration and implementation of the findings by the government and policymakers. 1.7 Research Questions

��
The study has also tried to find out the answers of the following research questions : I. Does the adoption of Bamboo Boring provide economic profitability to the cultivators of the area ? If yes, upto what extent ? II. Is bamboo boring the best source of irrigation under minor projects ? III. Is there any problem of under utilisation of irrigation potential available in the study area ? 1.8 Methodology A multi-stage sampling design has been followed for selection of the bottom unit of the sample. As proposed, at the first stage, the district of Saharsa has been selected purposively. It is to be pointed out here that the Bamboo tube-well (BTW) was first introduced in Saharsa district. It has not only the larger potential but also feasible conditions also. Subsequently at the second stage of sampling two blocks, namely, ‘Kahra’ and ‘Saur Bazar’ were selected on the basis of larger concentration of bamboo boring devices of the irrigation, which can be visualised from the following table (1.1) dealing with the block – wise number of bamboo borings during the year 2002 – 03. As is evident from the table that of the total 16,115 (BTWs) in the district during 2002-03, the larger concentration was found at Kahra (1067 %) and Saur Bazar (10.62 %). So these two blocks were selected for the purpose of the study. At third stage of sampling, the selection of 5 villages was made on the same basis as adopted in case of selection of sample blocks. Under Kahra block; Bangaon, Baryahi Basti, Kahra, Mani Rahua and Parari villages and under Saur Bazar Azgaiba, Bhawanipur, Chandaur, Kanp and Raghunathpur villages were selected. This way 10 villages, 5 each from the sample block, were covered under the study.
Table : 1.3
Block - wise number of Bamboo Borings under operation (2002–2003) Bamboo - Boring
Sl. No. Name of Blocks Operational Non-operational
Total
1 Kahra 897
(5.57) 823
(5.10) 1720
(10.67)
2 Sattar - Kataiya 676
4.19) 762
4.73) 1438 (8.92)
3 Saur - Bazar 898
(5.57) 814
5.05) 1712.
(10.62)
4 Pattar Ghat 766
(4.75) 732
(4.55) 1498 (9.30)
5 Sonbarsa 896
(5.56) 810
(5.04) 1706
(10.60) 6 Simri Bakhtiyarpur 841 783 1624

��
(5.22) (4.86) (10.08)
7 Salkhua 878
(5.45) 769
(4.77) 1647
(10.22)
8 Banma Itahari 667
(4.14) 734
(4.56) 1401 (8.70)
9 Mahishi 850
(5.27) 828
(5.14) 1678
(10.41)
10 Nauhatta 856
(5.31) 835
(5.17) 1691
(10.48)
Total 8225
(51.03) 7890
(48.97) 16113
(100.00) Source : Dist. Agri l . Office, Saharsa
At the bottom level, the selection of respondents was made. The procedure adopted for selection of the respondents was first of all, the farmers using the BTW were enlisted in each of the sample villages and further the enlisted farmers were classified on the basis of size of land holdings broadly in four categories, viz., marginal (< 1 ha.), small (1 – 2 ha.) medium (2 – 4 ha.) and large (> 4 ha.). After classification 12 farmers were selected from each of the sample villages, who were proportionately represented in the sample. These way 60 farms were selected from each of the sample block, which comes to a total of 120 farmers in the sample area / study area for in depth study. The farm – wise distribution of the sample respondents is presented in table no. 1.2.
Table : 1.4 Distribution of sample respondents
Categories of farmers Sl. No.
Name of sample Blocks
Name of sample villages Large Medium Small Marginal
Overall
1. Saur Bazar (i) Azgaiba 2 (1.67)
4 (3.33)
2 (1.67)
4 (3.33)
12 (10.0)
(ii) Bhawanipur 0 2 (1.67)
6 (5.0)
4 (3.33)
12 (10.0)
(iii) Chandaur 2 (1.66)
4 (3.33)
4 (3.33)
2 (1.67)
12 (10.0)
(iv) Kanp 0 2 (1.66)
4 (3.33)
6 (5.0)
12 (10.0)
(v) Raghunathpur 0 4 (3.34)
2 (1.67)
6 (5.0)
12 (10.0)
Sub - total 4 (3.33)
16 (13.33)
18 (15.0)
22 (18.33)
60 (50.00)
2. Kahra (i) Bangaon 0 4 (3.33)
4 (4.33)
4 (3.33)
12 (10.0)
(ii) Baryahi Basti 2 (1.67)
2 (1.67)
2 (1.67)
6 (5.0)
12 (10.0)
(iii) Kahra 0 2 (1.67)
6 (5.0)
4 (3.33)
12 (10.0)
(iv) Mani Rahua 0 4 (3.33)
4 (3.33)
4 (3.34)
12 (10.0)

��
(v) Parari 2 (1.66)
2 (1.67)
6 (5.0)
2 (1.67)
12 (10.0)
Sub - total 4 (3.33)
14 (11.67)
22 (18.33)
20 (16.67)
60 (50.0)
GRAND - TOTAL 8
(6.66) 30
(25.0) 40
(33.33) 42
(35.0) 120
(100.00) Source : Field Survey (Figures in parenthesis indicates percentage)
Besides above, several discussions were also arranged with the concerned officials and the villagers in group to elicit the information collected from the primary sources which are collected with the help of duly structured schedule. 1.9 Reference Year The reference year of the study was agricultural year 2002 – 2003, viz, by incorporating Kharif 2002 and Rabi 2003. 1.10 Limitations of the Study The present study, being an empirical one, has certain in-built limitations : (i) It was not possible to cover entire area in view of the time constraints. (ii) The respondents were mostly illiterate and shy and also in some cases they were not found interested to provide adequate information. (iii) The investigation has been carried out only in two blocks of the Saharsa district, hence, the general acceptability of the results have its own limitations. (iv) Primary survey research method of data collection (previous year / off season) is based on recall of memory because the farmers were not maintaining the records. So it cannot be free from its biases particularly in case of literate and semi-literate farmers. (v) Since the entire Saharsa district is not fed with bamboo boring, hence, the effect of irrigation on cropping intensity or cropping pattern could not be uniformly investigated. 1.11 Layout of the Report The report is presented in five chapters. The chapter first presents the introduction, importance of irrigation – minor irrigation and tube well, importance of bamboo boring, objectives of the study, research questions, methodology, reference period, limitations and layout of the report. The second chapter gives an account of the review of literature both at national, regional and international levels. The chapter third is devoted to agro-economic profile of the study area and the sample respondents. The chapter IV deals with empirical results and discussion. The fifth chapter contains the summary and conclusions of the study.
EEE

CHAPTER – TWO
Review of Literature
A number of economists, scientist technocrats and bureaucrats have attempted to study the dynamics of minor irrigation especially that of shallow tube – wells and bamboo tube-wells at international, national, state or regional levels. They have used different yardsticks to draw inferences in the study. Main findings of these studies have been discussed in the following paras. 2.1 National & Regional Level An ex-post evaluation study on deep tube wells in Bihar conducted by NABARD (1989) reported that the implementation of these scheme was not smooth. Even with rephasement up to June, 1983, achievements could not exceed 74.0 per cent of physical target and 05.0 per cent of financial target. The study has pointed out several reasons for slow / poor achievement which were as (i) delay in formulation individual projects and also in submission of expenditure statement, (ii) proper appreciation of the stipulated norms by concerned parties, (iii) effective supervision by the participating banks was lacking, and (iv) short supply of construction materials. According to the study there was perceptible change in the cropping pattern towards cultivation of crops such as wheat, maize, paddy, potato, etc. Cropping intensity, as expected, increased from 157 per cent in the case of rain fed farm to around 219 per cent under irrigated conditions. Yield rates also increased significantly. NABARD (1988) in its a study on Shallow Tube wells in Darbhanga, Madhubani and Samastipur districts in Bihar reported important factors such as smaller holding size, the simultaneous implementation of DTW also dissuaded the farmers to go in for private investment, non-availability of timely help from the minor irrigation department for supply of rigs, and irregular supply of electricity which contributed to the slow progress of the scheme. NABARD (1988), further reported that due to implementation of STW project there was 55 per cent increase in the cropping intensity of benefited area over the rain-fed conditions. There were considerable increase in the use of fertilizers, pesticides and improved seeds which resulted in change in cropping pattern, yield level, and income and employment opportunities.

��
Mukhopadhyay (1973) reported that the STWs, because of their size, suit the holding structure of the area, secondly because of their low capital requirements they are more likely to fall within the reach of the majority of the farmers than the large deep tube wells, thirdly STWs are energy saving and more labour absorbing which is of crucial importance at the moment in the context of energy crisis and wide spread unemployment, fourthly, they appear to be more economical as they require less amount of fixed capital investment per unit of either irrigation potential or actual irrigated area. They are thus capital saving and labour absorbing and hence conform to the resource endowment of the area with abundance of labour but shortage of capital.. Appu, P. S. (1974) in an article captioned “The Bamboo Tube Well” in Economic & Political weekly has dealt with the financial cost of bamboo tube wells and opines that it is well within the monetary resources of small cultivators. Syed Farooque Azam in his “Irrigation and Agricultural Development” opines, on the basis of field observation, “that even in those areas where there is a dense network of canals farmer depends on tube-wells because of the timeliness and adequacy of water supply. The irrigation water is in the hands of the farmers and they can use it in whatever time and whatever amount it is required”. L. S. S. O’ Malley in his Bengal District Gazetteers’ 1907, 1908 and 1910 Calcutta mentions the use of bamboo basket in the indigenous method of irrigation in the northern hills and foothills of Bengal. Water is conveyed to the field that are situated sometimes at long distances through irrigation channels and lifted through bamboo basket. Nandini Chatterjee in her study on “Irrigated Agriculture” refers to shallow tube well irrigation that accounts for 24.19 per cent of gross irrigated area of West Bengal. The adoption of new agricultural strategy (1966) has imparted great momentum and spurt in the use of this type of irrigation. She holds that shallow tube well irrigation is a more assured source of irrigation as ground water is not as responsive to rainfall fluctuation as surface water. This system is privately owned and therefore there is surety of timely and adequate supply of water. There is neither loss through transmission nor over supply of water. Jha U. M. (1984) in his study has specifically referred to the bamboo tube well irrigation and dilated on the subject in great detail. He calls this system “unique”. He points out that it is low cost device within the purse string of small and marginal cultivators. He writes, “Farmers of Darbhanga Division are also being inspired with the successful operation of the bamboo tube

��
well in Purnea and Saharsa districts. Most of the farmers have now become cost conscious. When they find that the investment is worthwhile they go in far sinking bamboo tube wells in a big way with only nominal assistance”. Professor Jha has further pointed out that the large scale exploitation of ground water by sinking bamboo tube wells will be remedy to a great extent the water logging caused by the Kosi irrigation system. The bamboo tube–well may turn out to be a corrective and complement to canal irrigation. C. Dakshinamurti, A. M. Michal and Shrimohan in their joint works on Water Resources of India and their Utilization in Agriculture (1973) mention that water has to be applied efficiently at times and in amounts consistent with the physical property of soil and plant growth. The Report of the Irrigation Commission (1972) refers to the sub-surface irrigation method and points out that the sprinkler method of irrigation was introduced in the early 50s but it has not caught on. It has been found that the farmers have preferred shallow tube well irrigation. The Irrigation Commission of 1972 has also admitted that “since independence, there has been a progressive deterioration in the financial returns for irrigation works. Instead of a profit, the works have been showing increasing losses and imposing a growing on the general revenues of the states”. In 1959 the Agricultural Production Team of the Ford Foundation has recommended that those irrigation projects should be accepted and implemented which yield rapid returns in food production such as tube wells and shallow masonry wells. A. M. Michel in his book “Irrigation Theory and Practice” emphasizes the need of designing the system of irrigation for the most efficient use of water by the crop and therefore has indirectly highlighted the need of exploiting underground water resources. Tushar Shah in his “Ground Water Markets and irrigation Development : Political Economy and Practical Policy, Oxford University Press, Mumbai, 1993” has emphasized the necessity of instituting ground water market. His view has been supported by S. Kalavalli and David L. Chicoine in their joint work “Ground Water Markets in Gujrat (India), have lent countenance to the views of Tushar Shah. Frederich Kahnert & Gilbert Levine have also confirmed this view (Ground water irrigation & the Rural Poor : Options for Development in Gangetic Basin). They have edited this work published under the authority of the World Bank, Washington.

��
Vikash Dubas talks about the possibility of instituting water market for ground water in Bihar and points out that this is a necessity but stiff resistance may come from the big land owners who use pumps for power rather than for profit. Geoff Wood supports the use of ground water for irrigation purposes particularly through pumps and tube wells but draws attention to the dangers of monopoly power used by the water sellers. Existence of monopoly may lead to higher charges of indifferent quality of irrigation service. Sharma, I. D. (1984) in his study on some aspects of Shallow Tube wells and Ground Water Development in the Gangetic basin reported that the implementation of STWs project has added tremendously to output and employment in the agricultural sector by raising cropping intensity, changing cropping pattern, and by facilitating the use of modern inputs. Saksena (1983) reported that ground water provides an assured and dependable source of irrigation free from the vagaries of rainfall. The exploitation of ground water in canal commands, where surface flows are not adequate, attains special significance. The ground water in such cases acts as a dependable balancing reservoir from which supplies of water can be drawn to make up deficiencies in river supplies. Pathak (1982) reported that the remarkable increase in food production in ground water irrigated area is a testimony of realization of ground water as an important source of irrigation. In order to have quick results in the field of agricultural production, minor irrigation schemes were given too much importance on account of the low cost of execution and deriving immediate benefits from the potential created. Professor Jha reported that the BTW or STW is a low cost device for exploiting ground water. It is, of course, an innovation introduced in the Saharsa district of Bihar in December 1968. Mishra H. M. (1985) in his study on irrigation in North Bihar with special reference to Kosi project reported that the bamboo tube well or shallow tube well is a low cost device for exploiting ground water. The materials used are all locally available, the only skilled technician needed is the village blacksmith the work can be completed in a day and the cost is only about Rs. 250/- the bamboo tube wells has brought the tapping of ground water well within the means of small cultivators. 2.2 International Level

��
According to China Irrigation and Drainage Corporation, Ministry of Water Resources, Beijing People’s Republic of China, there are 5 types of irrigation and the thing to be noted is that small irrigation represents over 30 per cent of the total irrigated area. It is 16.4 million ha which comes under this scheme. Water – lifting irrigation, well – irrigation or fragmentary small equipment irrigation are very important there. The manufacturing industry for irrigation equipment in China has developed gradually in the recent past. Small irrigation equipment is mainly purchased and used by rural households. To facilitate the extension and after sales service China has established ample product sales service. The prices of Chinese small irrigation equipment are very low. Labour costs are very low in China and these bring down product prices. R. Purcell, IPTRID Programme Manager, World Bank, Washington D. C., USA has highlighted the potential for small scale irrigation in sub – Saharan Africa but he has chosen the sample of Kenya. F. A. O. / IPTRID missions have found that lower cost, more water-efficient irrigation technologies have the potential to greatly expand small scale irrigation in East and Southern Africa. They significantly improve food security and family incomes. After adopting new technologies Kenya is doing notably and prominently better than most other countries of this region. Subsistence farmers are fast being transformed into commercial and thus there is a sea – change in their status, outlook and mindset. Kenya has carefully seized and exploited opportunities of small farming and faced and overcome boldly the constraints. Traditional irrigation in Kenya is some 400 years old and has longer span of prime than other countries of this region but Kenya has departed form the traditional path and has become a leader in a new field. It has become expert in utilising low – cost technologies for small - scale irrigation. Small - scale irrigation is an irrigation on small plots where farmers have the major controlling influence and when they can and do use a level of technology. Further the technology is such that the farmers can effectively operate and economically maintain Kenya’s total irrigated area is about 80,000 ha. The estimated potential is more than 3 lakh ha. Kenya resorts to rain water harvesting bucket irrigation, gravity-fed sprinkler and drip, treadle and pedal pumps, rope and waster, motorised pumps, wind power and construction of small earthen dams. Gravity and pump sprinkler system has proved very good for horticultural crops. Irrigation system has developed on the slopes of Kenya also. Besides sprinkler and engine users, the pedal pump users are also much better off.

��
It is the women who do most of the field work and they have gained greater earning power. A young farmer grows French beans onions. The income gains from the commercialised farming through shallow and small-scale irrigation are impressive. MBB Consulting Engineers of South Africa have also dealt with promotion of low – cost and water saving technologies for small-scale irrigation. In South – Africa knowledge about appropriate applications of technology for small - scale irrigation has been transferred to designers, manufacturers, donor’s and consultants. First, requirements of the farmers should be assessed and the technology suited to them should be found out. The sprinkler system has proved its efficacy and supremacy because a farmer can start small and expand as he leaves how to use and can afford the system. A Subregional workshop was held at Harare, Zimbabwe on 14 - 17 April 1997. It discussed irrigation technology transfer in support of Food Security. R. K. Sivanappan produced a paper emphasising the importance for water harvesting and soil moisture. Conservation in small watersheds for small - scale irrigation. E. Perry presented a paper in which he showed how food security could be secured in Sub – Saharan Africa through improved manual irrigation technologies. A Seminar has discussed the political economy of food, agriculture and irrigation development in East and Southern Africa. The view has been expressed that the 21st century will witness an increasing number of hungry and malnourished people in many parts of Africa. The African people will regard it as politically unacceptable and socially dangerous. The small farmers have no capacity to project their economic interests and articulate them. The issues of their development cannot be divorced from issues of democracy, politics and governance. There is the traditional competition between large-scale commercial agriculture and smallholder agriculture. This clouds agricultural policy and opportunities. What is needed is to transform smallholder agriculture to a more science-based production. A World Bank study has accepted the grim fact that structural adjustment programmes in Sub – Saharan Africa are not generating a sustainable supply response in agriculture. This is so particularly from small holders. In countries like Malawi, Zimbabwe and South Africa economic reforms have been introduced but the gains from them have been generated by the commercial farmers who are mainly exporters. In Zimbabwe and Malawi they are creating new support institutions. In South Africa they are tilting and skewing public sector institutions in their favour. Hence the conclusion is inescapable that small irrigation projects, methods and technologies should be introduced to cover the interests of the small holders. The small holder agriculture does not need lip service but requires deep and driving commitment in an all-round way.

��
In a review of the irrigation equipment manufacture and supply sector in South Africa, F. H. Koe Gelenberg, it has been pointed out that irrigation should be easy to operate and maintain at village level or at the community level. The recommendation has been to use renewable energies like wind, stun, animals, etc. M. Sonou, F. A. O. Regional Officer for Africa, Accra, Ghana has dealt with the low cost shallow tube-well construction in west Africa and has pointed out that one of the main constraints to irrigation development in West Africa is the mobilisation of water resources and its associated high costs which are mostly prohibitive. West Africa has failed to utilise 66 per cent of its potential for irrigation 95 per cent of irrigation is done by surface water which has high evaporation rate and, therefore, it is not available at the right moment and in adequate quantity. Hence the recommendation is to use and tap groundwater resources. Farmers lift water from shallow dug – outs and dug – wells. This emphasises the importance of shallow groundwater irrigation in certain circumstances. Then there is the opinion of Mardivamba Rukurri, Professor of Agricultural Economics, University of Zimbabwe who has considered the need of creating an enabling environment for the uptake of low – cost irrigation equipment by small scale farmers. He opines that the performance for large and specialised irrigation systems by African governments and donors alike is arguably the most serious error of economic judgement with respect to irrigation. He further holds that smallholder irrigation is showing greater financial and economic viability. It is rather doing better where the system is owned and operated by the farmers. Economics of irrigation has been studied in some countries of Africa, Tanzania, Malawi, Zambia and Zimbabwe and the study has revealed that land and crops respond differently to different systems of irrigation. Irrigated crops yield almost 4 times higher gross margins than rain–fed crops. Hence different irrigation technologies input and output prices and break even yields could be important to justify the future of irrigation technology transfer and uptake. In Malawi rope and water pumps are also in use. Vegetables are the main crops which can be grown with the help of small scale. In Zambia also vegetables are comparatively more profitable than maize and paddy. Fraen Kel (1986) has come to the conclusion that small holders generally achieve better energy ratios than large ones, i.e., the ratio of energy available in the crops produced to the energy required to produce it. Small holder family farms also offer greater impact on alleviating hunger, poverty and

��
unemployment. Besides this, small holder farmers who use irrigation generally achieve much higher incomes than their rain-fed counterparts. There is low level of capital investment in Zimbabwe but still small scale irrigation has proved to be economically viable. M. K. Gakundi, General Manager, Smallholders Irrigation Scheme Development Organisation, Kenya has considered funding irrigation development in Kenya with special reference to funding by the Small Holder Irrigation Scheme Development Organization. The economy of Kenya, just like that of India, is an agricultural one. Hence what is needed for sustainable agriculture is well – planned and well – operated irrigation system. In 1989 Ministry of Agriculture reviewed schemes of irrigation development and concluded that the way irrigation projects were being implemented was a continuous drain on the government fund and therefore, SISDO in 1991 was established with the assistance of Ministry of Agriculture and the approval of the Ministry of Finance and Economic Development. The schemes launched and the measures taken – all emphasize the beauty, viability and efficacy in the smallness and shallowness of irrigation. When we come to Australia we find special features of water resources in this continent. The first sellers had come from the U. K. They found in Australia that the rivers were small. The flows fluctuated widely from year to year, from month to month and even from day to day. Many of them ran dry in summer. There was great evaporation. But there is a huge resource of underground water. The example is the great Artesian Basin, one of the largest in the world. Hence underground water resources can be profitably tapped in Australia and the desert can be converted into a blooming garden by a large number of small irrigation projects. The foregoing studies, thus, reveal that shallow tube-wells/bamboo tube-wells are most acceptable methods of irrigation for small and marginal farmers, especially in an agriculturally predominant but irrigationally mismanaged region. The small holder irrigation system, as that of bamboo boring, has greater financial and economic viability. Of course, the large scale exploitation of ground water by sinking bamboo tube-well may turn out to be the most corrective and complementary source of irrigation in agriculturally predominant region.

CHAPTER – THREE
Agro-Economic Profile of the Study Area and Respondents
This chapter deals with the agro-economic profile of the study area (Saharsa) and the socio-economic features of the sample respondents under two different sections, viz., I & II. SECTION – I : THE STUDY AREA 3.1 Location and Area The district of Saharsa was created as a separate district in 1954. A large part of the district in the past was subjected to annual floods and inundations by a host of rivers originating from the Himalayas. It is bounded on the north by Supaul and some parts of Madhubani district, in south by the districts of Khagaria and parts of Madhepura in the east by Madhepura and in the west by the district of Darbhanga. Sahara is the chief town being the district headquarters and also the headquarters of Kosi Division. The total area of the district is 1195.60 square kilometers. 3.2 Population & Workers (Census, 2001) The total population of the district is 1506418, accounted for 1.82 per cent of the state’s population. The density of the population in the district is 885 persons. Of the total, males constituted for 52.35 per cent and females 47.65 per cent. Rural population is 91.77 per cent and the urban population is only 8.23 per cent. The proportion of scheduled castes is 30.75 per cent whereas the scheduled tribes are only 0.60 per cent. The overall literacy percentage is 39.28 per cent, which is far below the literacy percentage of 47.53 per cent of the state. The literacy percentage of males and females were 52.04 per cent and 25.31 per cent respectively. As regards the workers, the total workers were 39.27 per cent of the total population in the district. Main workers, marginal workers, cultivators, agricultural labourers, other workers and non – workers were 27.35 per cent, 11.92 per cent, 31.66 per cent, 52.47 per cent, 13.82 per cent and 60.73 per cent respectively of the total population in the district. It indicates that cultivators and agricultural labourers constitute together around 85 per cent of the total population in the district. The data depicted in table no. 3.1 clearly represents the demographic scenario of the district.
Table : 3.1 Population and Workers Profile in Saharsa District

��
Sl. No. Particulars Figures Percentage 1 Total Area (1. Square Kms.) 1195.60 --- 2 Total Population (2001 Census)
(a) Male (b) Female
15,06,418 7,88,585 7,17,833
100.00 52.35 47.65
3 Rural Population 13,82,403 91.47 4 Urban population 1,24,015 8.23 5 Scheduled Caste 4,63,149 30.75 6 Scheduled Tribes 8,969 0.60 7 Literates (12th rank in Bihar)
a. Male b. Female c. Total
3,26,498 1,44,951 4,71,449
52.04 25.31 39.28
Total Workers 5,91,511 39.27 (a) Main Workers 4,12,008 27.35 (b) Marginal Workers 1,79,503 11.92 (c) Non - Workers 9,14,907 60.73 (d) Cultivators 1,87,263 31.66 (e) Agril. Labourers 3,10,347 52.47
8
(f) Other Workers 81,731 13.82 Source : Census, 2001
3.3 Land-use Pattern The data presented in table no. 3.2 indicate the land use pattern in the district. As stated earlier, the total geographical area in the district is 403 thousand hectares (1195.60 square kilometers). Out of it, the net sown area is 246 thousand hectares (61.04 %) followed by 17.12 per cent non – agricultural area, 8.44 per cent barren and uncultivable land, 4.71 per cent current fallow, 3.97 per cent other fallow, 2.98 per cent forests and groves, 1.24 per cent cultivable barren land and 0.50 per cent permanent and other pasture land.
Table No. 3.2 Land-use Pattern in the District
Sl. No. Land particulars Area (in 000’
ha.) Percentage
1 Total geographical area 403.0 100.00 2 Barren and uncultivable land 34.0 8.44 3 Non-agricultural land 69.0 17.12 4 Area under forest & grooves 12.0 2.98 5 Permanent and other pasture land 2.0 0.50 6 Cultivable barren 05.0 1.24 7 Other fallow 16.0 3.97 8 Current fallow 19.0 4.71 9 Net sown area 246.0 61.04
Source : Census, 1991

��
3.4 Physical and Climatic Features The entire district lies north of the holy river Ganges and is comprised of plains. It lies in north-east plains, a sub-zone of middle Gangetic plains (zone no. 4) of agro-climatic zones, as demarcated by the Planning Commission in 1988. The district being at the end of the mid-Gangetic valleys, drainage and management of floods and seasonal rushes are problems of the region. A little over 60 per cent of land is cultivated and only 44 per cent of this is irrigated. The region receives around 1224 mm of rainfall and the climate is similar to other sub-zones in the Bihar plains – dry to moist sub-humid. The soil type is sandy to silty loam, medium to strongly acidic. The cropping intensity is high relatively to the other sub-zones. However, land productivity is low. 3.5 Rivers, Canals and Waterways The most important river of the district is the ‘Kosi’. It rises in the Himalayas, and known as ‘Bihar’s River of Sorrow’. Most of other important rivers of the district emerge from the Himalayas and fall into the river Khagri which itself joins the Kosi. 3.6 Cropping Pattern The data presented in table no. 3.3 show the cropping pattern in the district during the reference period of the study. The table is designed into two parts, viz., crop-wise and season-wise. The production of foodgrains occupies the foremost place in the district. Paddy and wheat are the main staple foodgrains which are produced in the district nearly by 60 per cent of GCA. Maize occupied the third largest crop nearly by 7.30 per cent of GCA. Pulses occupied relatively smaller area in the district. The net sown area is 246 thousand hectares and the cropping intensity was found at 150.41 per cent. As regards the season wise, kharif possess the larger area by 38.92 per cent of GCA followed by rabi 30.27 per cent, summer by 15.95 per cent and Bhadai by 14.86 per cent. It reveals that kharif and rabi together account for nearly 70 per cent of the GCA.
Table No. 3.3 Cropping Pattern of Saharsa District
(Area in ‘000 ha.) A. Crop-wise
Crops Area Percentage Paddy 143 38.65 Wheat 80 21.62 Maize 27 7.30 Masoor 3 0.81 Khesari 12 3.24

��
Pea 1 0.27 Jute 17 4.59 Potato 4 1.08 Others 83 22.44 Gross cropped area 370 100.00 Net sown area (NSA) 246 --- Area sown more than once 124 --- Cropping intensity 150.41 ---
B. Season-wise Season Area Percentage Bhadai 55 14.86 Kharif 144 38.92 Rabi 112 30.27 Summer 59 15.95 GCA 370 100.00
Source : District Agriculture Office, Saharsa
3.7 Irrigational Status As indicated earlier, nearly 45.14 per cent of the gross cropped area in the district is irrigated and the percentage of tubewell irrigated area to the GCA is 39.28 per cent whereas the percentage of tubewell irrigated area to the total irrigated area is 87.03 per cent. It indicates that tubewell occupied the major sources of irrigation in the district. The data presented in table 3.4 clearly reveal that in the year 2001 – 02, tubewells irrigated nearly 90.61 per cent of the total irrigated area followed by canals (8.37 % of GCA) and ponds only by 1.02 per cent of GCA.
Table 3.4 Source-wise Total Irrigated Area of Saharsa District (2001-02)
Source Area (In ha.)
Percentage
Canal 4464.77 8.37 Ponds 547.06 1.02 Tubewells a. Govt. b. Private
48364.33 314.32
48050.01
90.61 0.65
99.35 Total Irrigated Area 53376.16 100.00
Source : District Agriculture Office, Saharsa
The table also reveals among that tubewells, private tubewells are the major sources, which account for nearly 99.35 per cent of the tubewell irrigated area whereas the government sources show its existence only. It has no substantial contribution in irrigating the area under tubewells. SECTION – II : THE RESPONDENTS For examining the empirical results, it is necessary to understand the socio – economic features of the sample respondents, which provide an insight to the analysis. Here an attempt has been made to highlight the socio – economic features of the sample farmers. The parameters used for

��
examining the status of the sample farmers are : educational status, social groups, occupational status, size of family, types of worker, involved in agricultural operation, land holding accounts, irrigational status, source-wise irrigational status, status of farm assets, cropping pattern adopted by the sample farmers and the cropping intensity. As indicated earlier, an altogether 120 farmers form the sample size of the present study. The sample size has been equally distributed in both of the sample blocks. The overall picture showed that out of 120 farmers, 42 (35.09 %) belonged to marginal category, 40 (33.33 %) small, 30 (25.0 %) medium category and 8 (6.67 %) large category farmers. The pattern of distribution of sample farmers across the farms indicates almost the existing pattern of land holding in Bihar. The table 3.5 gives an analysis of the sample farmers based on their educational status. It may be seen from the table that out of the total, 15.0 per cent are illiterate, 17.0 per cent literate, 30.83 per cent attained the education upto the primary level, 30 per cent upto the secondary level and only 6.67 per cent were graduates and above. In other words, nearly 65 per cent of the sample respondents have attained education upto the primary level and only about 35 per cent of the sample respondents have education above the secondary level. From, the data it is clear that the educational status of more than 94 per cent of sample respondents is upto the secondary level. Hence, it reflects the success and failure stories of primary and secondary level education in the state. The educational status across the farm size group shows that educational status of small and marginal farmers is almost identical.
Table 3.5 Educational Status of Sample Respondents by Size Group
Categories of farmers Items
Large Medium Small Marginal
Overall
(i) Illiterate 00 03 (2.50)
06 (5.0)
09 (7.50)
18 (15.00))
(ii) Literate 00
04 (3.33)
04 (3.33)
13 (10.83)
21 (17.00)
(iii) Primary 01 (0.83)
06 (5.0)
16 (13.33)
14 (11.67)
37 (30.83)
(iv) Secondary 04 (3.34)
15 (12.50)
13 (10.84)
04 (3.33)
36 (30.0)
(v) Graduate & above 03 (2.50)
02 (1.67)
01 (0.83)
02 (1.67)
08 (6.67)
Total 08 (6.66)
30 (25.0)
40 (33.33)
42 (35.0)
120 (100.00)

��
The table 3.6 shows the distribution of sample farmers on the basis of social groups. Overall analysis reveals that out of the total, 76 (63.33 %) belonged to intermediate castes, 36 (30.0 %) general castes and 08 (6.66 %) scheduled castes and scheduled tribes. The table further reveals that in all the four categories, percentage of intermediate caste farmers were highest in number. It reflects that the farmers engaged in agricultural operations of the study area mostly belonged to backward community.
Table 3.6 Social Status of Sample Respondents by Size Groups
Categories of farmers B. Social Group
Large Medium Small Marginal
Overall
(i) General Caste 06 (5.0)
08 (6.67)
18 (15.0)
04 (3.33)
36 (30.0)
(ii) Intermediate Caste 02 (1.67)
22 (18.33)
18 (15.0)
34 (28.34)
76 (63.33)
(iii) SC and ST 00
00 04 (3.33)
04 (3.33)
08 (6.66)
Total 08 (6.66)
30 (25.0)
40 (33.33)
42 (35.0)
120 (100.00)
Source : Field Survey, (Figures in parenthesis indicate percentage)
Table 3.7 highlights the occupational status of sample farmers. This table has further been divided into two parts. The first part deals with primary occupation and the second part deals with secondary occupation. The overall analysis of the data regarding primary occupation reveals that out of the total respondents 100 (83.33 %) farmers adopted agriculture as primary occupation followed by 10 (8.33 %) service, 04 (3.33 %) business and 6 (5.00 %) other occupations. Further overall analysis of data regarding secondary occupation reflects that out of the total 44 (36.67 %) farmers have adopted business as secondary occupation, 38 (31.67 %) other occupations, 18 (15.0 %) service as secondary occupation and 20 (16.66 % farmers) having agriculture as secondary occupation. It may be observed from the analysis that in all the four categories the maximum numbers of farmers followed agriculture as primary occupation. Hence, it may be observed that nearly 80 per cent of the people of the study area are engaged in agricultural activities. The table 3.8 displays the size of family of the sample respondents. It shows that out of the total respondents 70 (58.33 %) farmers were having medium size family (5 – 8 members), followed by 40 (33.33 %) large size family (more than 8 members) and only 10 (8.34 %) farmers having nuclear family (below 4 members).

��
When we analyze the data across the category-wise farmers, it is observed that the number of the medium size family (5 – 8 members) is the highest among all the four categories. It may be due to lack of education, poverty, ignorance, etc.
Table 3.7 Occupational Status of Sample Respondents by Size Groups
Categories of farmers Items
Large Medium Small Marginal
Overall
(i) Primary (a) Agriculture
08
(6.66)
22
(18.33)
34
(28.32)
36
(30.0)
100
(83.33) (b) Service 00 04
(3.33) 02
(1.67) 04
(3.33) 10
(8.34) (c) Business 00 02
(1.67) 02
(1.67) 00 04
(3.33) (d) Others 00 02
(1.67) 02
(1.67) 02
(1.67) 06
(5.0) Sub Total 08
(6.66) 30
(25.0) 40
(33.33) 42
(35.0) 120
(100.00)
(ii) Secondary (a) Agriculture
00
08
(6.66)
06
(5.0)
06
(5.0)
20
(16.66) (b) Service 02
(1.67) 06
(5.0) 06
(50.0) 04
(3.33) 18
(15.0) (c) Business 02
(1.67) 08
(6.67) 16
(13.33) 18
(15.0) 44
(36.67) (d) Others 04
(3.33) 08
(6.67) 12
(10.0) 14
(11.67) 38
(31.67) Sub Total 08
(6.66) 30
(25.0) 40
(33.33) 42
(35.0) 120
(100.00) Source : Field Survey (Figures in parenthesis indicate percentage)
Table 3.8
Family Status of Sample Respondents by Size Groups Categories of farmers Size of family
Large Medium Small Marginal
Overall
(i) Small (1 – 4 members) 00 00 02 (1.67)
08 (6.67)
10 (8.34)
(ii) Medium (5 – 8 members) 04 (3.33)
16 (13.33)
26 (21.66)
24 (20.0)
70 (58.33)
(iii) Large (Above 8 members)
04 (3.33)
14 (11.67)
12 (10.0)
10 (8.33)
40 (33.33)
Total 08 (6.66)
30 (25.0)
40 (33.33)
42 (35.0)
120 (100.00)
Source : Field Survey (Figures in parenthesis indicate percentage)
The table 3.9 reflects the average number of workers on per farm basis. The overall analysis of the table reveals that the average number of farm workers is 2.93. There are two types of workers, i.e., full time workers and part time

��
workers. Out of the total farm workers the average number of full time workers is 1.52 and that of part time workers is 1.41. The average number of casual labourers is 2.23 and out of this the average number of contractual workers is 1.13 and that of non-contractual workers is 1.10. The average number of non – farm workers and permanent farm servant is identical, i.e., 0.87.
Table 3.9 Average Number of Workers on per farm basis
(Figure in average) Categories of farmers Types of Workers
Large Medium Small Marginal
Overall
(i) Farm workers (a) Full time (b) Part Time
1025 4.75 5.50
4.06 1.86 2.20
2.95 1.80 1.15
0.71 0.38 0.33
2.93 1.52 1.41
(ii) Non-farm workers 4.00 1.33 0.00 0.00 0.87 (iii) Permanent farm servant 3.50 2.53 0.00 0.00 0.87 (iv) Casual Labour (a) Contractual (b) Non – Contractual
10.25 5.75 4.50
5.66 2.66 3.00
0.40 0.25 0.15
0.00 0.00 0.00
2.23 1.13 1.10
Source : Field Survey (Figures in parenthesis indicate percentage)
The table 3.10 presents the land holding accounts of the sample farmers. The table indicates that the average land holding size in the study area was 2.17 ha. and the average operated land holding size was 2.37 ha. It has also been found that per household land holding was 0.74 ha. for marginal farmers, 1.60 ha. for small farmers, 3.56 ha. for medium farmers and 7.29 ha. for large category farmers. The average leased-in and leased-out land area was 0.40 ha. and 0.19 ha. respectively. The average uncultivable land was, i.e., 0.006 ha. Hence it may be observed that the intensive cropping pattern was being followed by the sample respondents because of having assured irrigation system through the bamboo – boring. The table 3.11 reveals the irrigational status of land owned by sample farmers. The overall analysis of the table shows that the total operated area per farm size was 2.37 ha. Out of it, 1.73 ha. (73.03 %) was irrigated land and 0.65 ha. (27.0 %) was unirrigated land. Thus, the percentage of irrigated land was higher on account of larger number of operational bamboo – borings in the study area and the cheapest source of irrigation.
Table 3.10 Land Holding Accounts of Sample Respondents
(Area in average ha.) Categories of farmers Land Holding Accounts
Large Medium Small Marginal
Overall
(i) Land owned 7.29 3.56 1.60 0.74 2.07 (ii) Leased in land 0.00 0.00 0.38 0.78 0.40
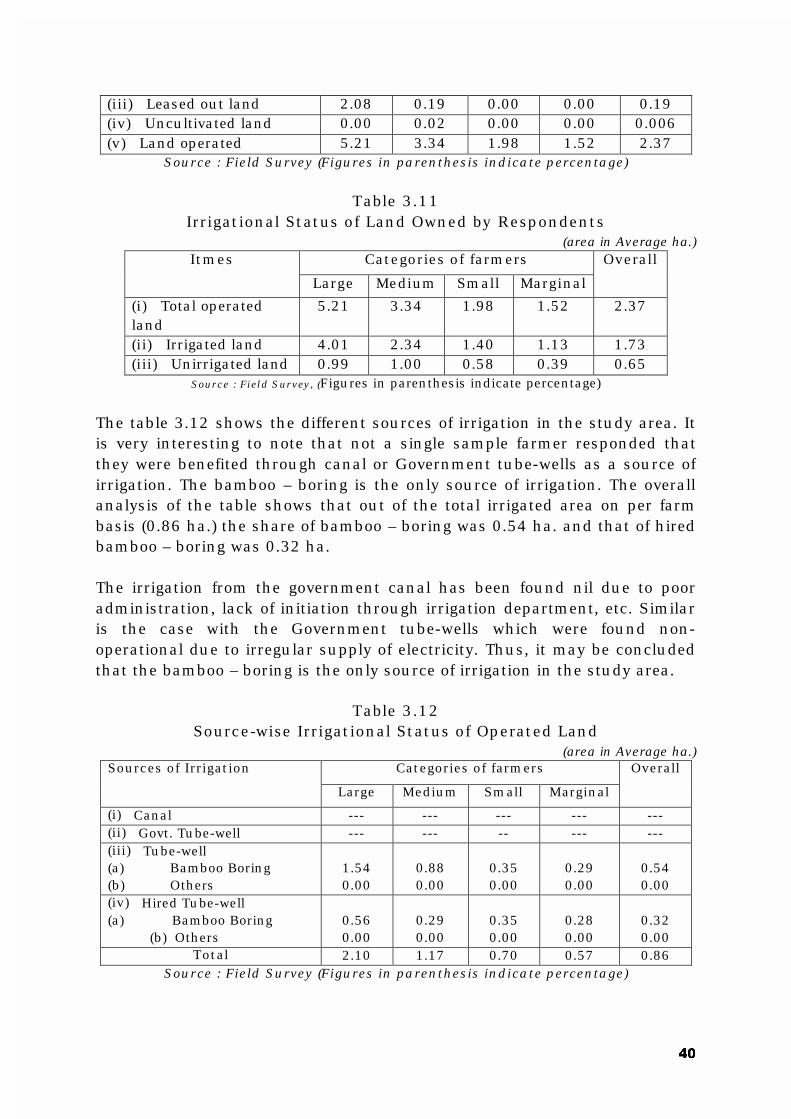
��
(iii) Leased out land 2.08 0.19 0.00 0.00 0.19 (iv) Uncultivated land 0.00 0.02 0.00 0.00 0.006 (v) Land operated 5.21 3.34 1.98 1.52 2.37
Source : Field Survey (Figures in parenthesis indicate percentage)
Table 3.11
Irrigational Status of Land Owned by Respondents (area in Average ha.)
Categories of farmers Itmes
Large Medium Small Marginal
Overall
(i) Total operated land
5.21 3.34 1.98 1.52 2.37
(ii) Irrigated land 4.01 2.34 1.40 1.13 1.73 (iii) Unirrigated land 0.99 1.00 0.58 0.39 0.65
Source : Field Survey, (Figures in parenthesis indicate percentage)
The table 3.12 shows the different sources of irrigation in the study area. It is very interesting to note that not a single sample farmer responded that they were benefited through canal or Government tube-wells as a source of irrigation. The bamboo – boring is the only source of irrigation. The overall analysis of the table shows that out of the total irrigated area on per farm basis (0.86 ha.) the share of bamboo – boring was 0.54 ha. and that of hired bamboo – boring was 0.32 ha. The irrigation from the government canal has been found nil due to poor administration, lack of initiation through irrigation department, etc. Similar is the case with the Government tube-wells which were found non-operational due to irregular supply of electricity. Thus, it may be concluded that the bamboo – boring is the only source of irrigation in the study area.
Table 3.12
Source-wise Irrigational Status of Operated Land (area in Average ha.)
Categories of farmers Sources of Irrigation
Large Medium Small Marginal
Overall
(i) Canal --- --- --- --- --- (ii) Govt. Tube-well --- --- -- --- --- (iii) Tube-well (a) Bamboo Boring (b) Others
1.54 0.00
0.88 0.00
0.35 0.00
0.29 0.00
0.54 0.00
(iv) Hired Tube-well (a) Bamboo Boring (b) Others
0.56 0.00
0.29 0.00
0.35 0.00
0.28 0.00
0.32 0.00
Total 2.10 1.17 0.70 0.57 0.86 Source : Field Survey (Figures in parenthesis indicate percentage)

��
The table 3.13 depicts the status of farm assets owned by the sample respondents on per farm basis. The table shows that availability and use of important farm implements / assets in the study area were very poor. The number of some important farm implements like tractors, pump sets (diesel and electric), threshers, sprayers and bullock carts, implements was not only inadequate in the study area but far below the state and national average. The overall per farm availability of tractors was 0.11, pump sets (diesel) 0.57, harrows 0.67, sprayers 0.42, and bullock carts 0.33. The availability of these farm implements has direct bearing on the production of crops. From the table it may be found that its availability was almost directly related with the size of farm. The possession of drought animals and milch animals was some what better than farm implements. The number of bullock per farm basis was 0.55 higher than the he-buffalos (0.45). Among milch animals the number of cows on per farm basis was 0.61, buffalos 0.51, goats 0.35 and young stocks 0.40. Thus, it may be concluded that the study area still lacks the scientific mode of cultivation and thus is deprived of full utilization of natural resources and high yielding potentials. The main reasons may be due to lack of scientific information, low level of education, poverty, lack of Government initiatives, etc.
Table 3.13 Status of Farm Assets Owned by Respondents
(Average figure) Categories of farmers Items
Large Medium Small Marginal
Overall
(I) Farm equipment (a) Tractor 0.63 0.23 0.02 0.00 0.11 (b) Pump set (i) Diesel (ii) Electric
1.00 0.38
0.70 0.17
0.65 0.00
0.31 0.00
0.57 0.06
(c) Thresher 0.62 0.57 0.52 0.40 0.50 (d) Harrow 0.38 0.63 0.65 0.76 0.67 (e) Bullock - cart 0.25 0.23 0.35 0.38 0.33 (f) Sprayer 0.88 0.43 0.40 0.33 0.42 (II) Draught -Animal (a) Bullock 0.50 0.40 0.55 0.66 0.55 (b) He - buffalo 0.25 0.46 0.45 0.48 0.45 (III) Milch - Animal (a) Cow 2.12 0.67 0.60 0.76 0.61 (b) Buffalo 0.62 0.40 0.45 0.62 0.51 (c) Goat 0.00 0.17 0.30 0.54 0.33 (d) Young stocks 0.62 0.37 0.37 0.40 0.40
Source : Field Survey ( Figures in parenthesis indicate percentage) The table 3.14 reflects the cropping pattern followed by the sample farmers in the study area. From the overall position it is clear that during kharif season paddy was grown in 193.12 ha. which was 67.79 per cent of the total operated area and 37.36 per cent of the grossed cropped area. Similarly

��
wheat was grown in 187.82 ha. which was 65.89 per cent of the total operated area and 36.33 per cent of the gross cropped area. The total area under pulses was 47.42 ha. which was 16.64 per cent of the total operated area and 9.09 per cent of the gross cropped area. Oilseeds occupied very little area under cultivation. Maize was cultivated in 55.32 ha. which was 11.10 per cent of the total cropped area and 10.77 per cent of the gross cropped area. Horticultural crops also occupied very little area (19.66 ha.) Thus, the cropping pattern followed by the sample respondents in the study area was paddy / maize – wheat / pulses / oilseeds. During summer season maize and moong were grown in a very little area. The overall cropping intensity was 181.37 per cent some what above the state level. Such a high cropping intensity could be possible only on account of more use of bamboo-borings, the cheapest source of irrigation by the sample respondents. Cropping intensity was found highest (184.23 %) among marginal farmers as they followed intensive cropping pattern having small size of farm holding.
Table 3.14 Cropping Pattern Followed by Sample Respondents
(Area in ha.) Categories of farmers Major crops grown
Large Medium Small Marginal
Overall
1. Paddy a. Total Area b. Irrigated Area c. Unirrigated area
30.96 26.66 04.30
70.92 56.92 14.00
47.82 34.28 12.54
43.42 38.46 04.96
193.12 156.32 36.80
2. Wheat a. Total Area b. Irrigated Area c. Unirrigated area
29.52 27.54 02.28
72.60 68.20 04.40
47.66 40.28 07.38
40.04 34.60 05.44
187.82 170.32 17.50
3. Pulses a. Total Area b. Irrigated Area c. Unirrigated area
07.82 02.78 05.04
12.64 03.32 09.32
15.50 03.46 12.04
11.46 03.28 08.18
47.42 12.84 34.58
4. Maize a. Total Area b. Irrigated Area c. Unirrigated area
03.36 01.48 01.88
21.04 10.46 10.58
20.02 08.20 11.82
14.90 05.48 09.42
55.32 25.62 29.70
5. Horticultural Crops a. Total Area b. Irrigated Area c. Unirrigated area
02.22 02.22 00.00
03.52 03.52 00.00
08.10 05.50 02.60
05.82 05.20 00.62
19.66 16.44 03.22
6. Other Crops a. Total Area b. Irrigated Area c. Unirrigated area
00.72 00.72 00.00
02.52 02.52 00.00
02.28 00.00 02.28
02.12 01.72 00.40
07.64 04.96 02.68
7. Total Cropped Area 74.64 183.24 141.38 117.76 516.98 8. Cropping intensity (In %)
179.15
182.58 178.69 184.23 181.37
Source : Field Survey (Figures in parenthesis indicate percentage)

��
CHAPTER – FOUR
Results and Discussions
This chapter deals with the results and discussions of the sample farmers in the study area. It includes background information, cost and benefits of bamboo boring, economics of bamboo boring, cost of pumping, returns on pumping, impact of bamboo boring on GCA, cropping intensity and constraints faced has the sample respondents. Bamboo boring is a very cheap source of irrigation. It is very unique device of irrigation under minor irrigation system. It was introduced in Bihar in 1968. At present about 1,57,629 hectares of land are being irrigated through this source of irrigation. The estimated capacity of this system constitutes 3.15 per cent of all the sources of irrigation in the state. Also, this system of irrigation is not rival to canal irrigation. It is only a complement to it in places where it can be fabricated and installed. At the same time it is corrective to big dam irrigation. Thus bamboo – boring is being regarded as a break-through in the exploitation of ground water in Bihar. Inputs required in bamboo – boring are locally available. The village blacksmith is the technician and is armed with necessary know – how. Sinking process is very easy and takes very short span of time. It starts to supply water immediately. It is free from defects like alkalinity, water-logging and silting. In this way there are a number of plus points of bamboo boring which have induced our respondents to prefer this cheapest and easy source of irrigation. In brief, these points may be enumerated as hereunder : (i) Inputs required in bamboo boring are locally available. (ii) The average total cost involved in one BB is about Rs. 2000/- and hence a very low capital investment. (iii) No technical expert is required for the purpose of its sinking. (iv) Water is available within 30 – 40 fit from the surface. (v) Not affected by water-logging, alkalinity or salinity. (vi) Low maintenance cost (vii) Easy to operate. (viii) It takes hardly one day in sinking the pipe as well as bamboo. 4.1 Cost and benefits of bamboo boring In this section costs and benefits of Bamboo Boring have been estimated for all categories of sample farmers. But before the analysis of the costs and benefits, it is essential to know the types of strainers being used by sample farmers, methods of making and joining the bamboo strainers by them, and the prevailing procedures in the study area. All these things have been

��
discussed here under different heads. Besides, the cost of pumping has also been estimated in this section. For calculating the benefits of bamboo boring the gross receipt expenses and net value of produce have been taken into consideration. The tabular analysis was used for arriving at the results. The standard costs and benefits concepts have been applied for the analysis. Types of Strainers Used by Sample Farmers It was observed that several types of strainers were being used by the farmers of the study area. The most popular five types of strainers are : (a) Bamboo strips wrapped with coconut coir (two layers) (b) Bamboo strips wrapped with three layers of nylon cloths. (c) P. V. C. slotted wrapped with nylon cloth. (d) M. S. Rod (1” dia; 6 no.) wrapped with coconut coir (two layers). (e) M. S. Rod wrapped with three layers of nylon cloth. Out of the above five types of strainers, type (a) and type (c) are the most common strainers across the different categories of sample farmers. Out of 120 respondents 45 pre cent (54) were found using type (a) strainers and 38.33 per cent (46) were found using type (c) strainers in the sample area. Rest 16.67 per cent (20) was found using (b), (d) and (e) types of strainers in the study area. In nutshell it has been found from the study that (a) and (c) types of the strainers were most popular in the sample area. Prevailing Methods For Making Bamboo Strainers in the Sampled Area : In course of our field survey it was noticed that the methods for making bamboo strainers were originally developed in the sample district (Saharsa) and this is a very popular method. As per discussions with sample farmers the following sequences were found for bamboo strainers. � Firstly, they prepared M. S. rings of 10 – 12 c.m. diameters with the help of about 1.5 mm iron sheet or some iron – flaps. � Secondly, they made six number of holes on periphery of iron rings at equal distance to affix bamboo of 20 feet length and 1 inch width strips on them with the help of iron nails (1” size). � Thirdly they prepared bamboo strips and fixed them over the periphery of iron rings with the help of nails. The iron rings were placed at about 30 c.m. intervals. � Fourthly the frame of the bamboo strips was wrapped tightly by two layers of coconut coir. � Finally the wrapped coconuts wrapped were reinforced by wrapping one layer of 20 gauges G. I. wire at a distance of about 15 to 20 cm. In the study area about cent per cent of the sample respondents were found using the above mentioned methods for making bamboo boring strainers.

��
Methods for Joining the Bamboo Strainers After knowing the methods for making bamboo strainers, the survey team also enquired about the methods for joining the bamboo strainers in the sample area. The most common methods were as bamboo strainers were prepared at 6 meters length and they were attached with a nipple (one end threaded) at both ends of the strainers and one strainer was joined with another strainer with the help of a socket. It was observed during our field survey that the limited numbers of farmers were found joining the strainers by overlapping bamboo strips and tightening them with the help of fine wire. The overlapping portion was tightened by nylon cloth or coconut coir. Majority of our sample respondents reported that bamboo boring was most suitable in river belts, where water level was less than 8 meter depth and ground water was available up to about 30 meters. Bamboo strainers were used at lower portion at the length of about 15 to 20 meters and there were plain pipes (blind pipes) at the length of about 8 to 9 meters. They were sunk at the upper most portions. The total depth of bamboo boring was reported to be about 30 meters only. Methods of Bamboo Boring in the Study Area It was observed that farmers of the study area were found using local method for bamboo boring. They reported that after boring up to the desired depth, boring pipes were taken out. After that the plain pipes and strainers were put in the bore. Then gravel packing or sand packing was done around the strainers and pipes. At the top of pipe, one check valve (reflex valve) and a bottle tee were attached to facilitate connection with pumping sets. At local level the following materials were used for bamboo boring -- (i) Iron sheet of 1.5 mm, (ii) bamboo of about 20 feet length (iii) coconut coir (iv) G. I. wire (v) blank pipe (vi) bottle tee (vii) check valve (viii) iron nails (ix) sockets and nipple (x) sands and gravel, etc. 4.2 Economics of Bamboo Boring Bamboo boring is the most important source of irrigation in the study area. Primary data relating to farmers’ input materials for the establishment of bamboo boring have been obtained through field survey. They were analyzed separately for different inputs on the basis of per boring and per farm respectively across the farm size groups. The results of the analysis have been presented as hereunder in the table 4.1.

��
IMAGES

��
Table 4.1 Estimated Cost of Bamboo Boring Across the Farm Size on Per Boring
Basis (In Rs.)
Farmers Sl. No. Components
Large Medium Small Marginal
Overall
1. Iron Sheet 273.60 265.80 254.80 248.80 258.32 (8.49)
2. Bamboo (20’ length)
84.00 82.00 88.00 92.00 87.06 (2.86)
3. Coconut coir 320.10 289.05 337.20 292.35 308.07 (10.13)
4. G. I. Wire 16.00 15.00 20.40 18.80 17.87 (0.59)
5. Blank Pipe 1512.50 1611.50 1675.30 1439.00 1120.03 (36.81)
6. Bottle Tee 78.40 81.20 148.40 145.00 120.14 (3.95)
7. Check Valve 45.60 78.30 143.10 136.25 114.76 (3.77)
8. Iron Nail 11.52 12.60 11.70 9.90 11.38 (0.37)
9. Socket & Nipple
91.41 60.72 97.02 105.93 88.94 (2.92)
10. Sand / Gravels
14.37 17.55 16.45 11.37 14.95 (0.49)
11. Labour Charge 462.40 507.45 529.55 549.95 521.43 (17.14)
12. Cost incurred in transporting the materials
61.88 49.55 52.60 55.90 53.88 (1.77)
13. Contingent expenditures
28.53 42.22 50.71 68.33 49.18 (1.62)
14. Sub-Total (I to 13)
3030.31 3112.94 3425.23 3167.58 2766.01 (90.91)
15. Overhead & Supervision charge @ 10 %
303.30 311.29 242.52 316.78 276.60 (9.09)
16. Sub-total 303.30 311.29 242.52 316.78 276.60 (9.09)
Grand Total (14+16) 3333.61 3424.23 3767.73 3484.34 3042.61 (100.00)
Source : Field Survey (Figures in parenthesis indicate percentage )
The results of estimated cost per bamboo boring across the farm size are presented in table 4.1. The table reveals that at overall level per boring costs have been worked out at Rs. 3042.61. Though, the expenditure varied from

��
Rs. 3767.73 (small farms) to Rs. 3333.61 (large farms) across the farms. The table further indicates that of the total costs, blank pipe costs constituted higher amount followed by labour charge, coconut coir, iron sheet, etc. At overall level on an average cost for blank pipe was estimated at Rs. 1120.03 and for labour charges at Rs. 521.43 which constitute about 36.81 and 17.14 per cent of the total cost respectively. The estimates clearly indicate that the total cost of establishment of boring was found lower at large categories of farmers as compared to other categories of farms. The reasons behind it were that large farmers possessed larger land area as compared to other categories. They sunk comparatively higher number of borings as compared to small land holding size categories of farms. Therefore, the cost for establishment of boring was also found lower in large categories of farms as compared to other farms. The rate of major inputs used in the above estimation is based on the following figures : (i) Iron sheet, @ Rs. 20/per Kg. (ii) Cost of bamboo, (20 ft. length) @ Rs. 21/ bamboo (iii) Coconut coir @ Rs. 15/per Kg. (iv) G. I. Wire @ Rs. 20/per Kg. (v) Blank pipe @ Rs. 55/per ft. (vi) Bottle tee @ Rs. 140/each (vii) Check valve @ Rs. 135/per valve (viii) Iron nails @ Rs. 18/per Kg. (ix) Socket @ Rs. 33/each (x) Sand/gravels @ 25 paise/per Kg. (xi) Labour charge @ Rs. 85/per day (xii) Overhead Charges @ 10 %
Table 4.2
Estimated Cost of Bamboo Boring Across the Farm Size per Farm in Sample District
Categories of Farmers
Sl. No. Components Large Medium Small Marginal
Overall
1. Iron Sheet 1.5 mm (Kgs.)
478.8 249.18 299.76 298.56 307.11 (9.41)
2. Bamboo (20’ Length) 147 76.87 103.53 110.40 103.49 (3.17)
3. Coconut coir 182.91 270.98 396.70 350.82 321.72 (9.86)
4. G. I. Wire 9.14 14.06 24.00 22.56 18.98 (0.58)
5. Blank Pipe 864.28 1510.78 970.94 966.80 1106.91 (33.92)
6. Bottle Tee 44.80 76.12 174.58 294.00 167.73 (5.14)

��
7. Check Valve 43.20 77.40 168.35 283.5 161.74 (4.96)
8. Iron Nail 6.58 11.81 13.76 11.76 11.73 (0.36)
9. Socket & Nipple 52.23 56.92 114.14 127.11 94.63 (2.90)
10. Sand / Gravels 8.21 16.43 19.35 13.64 15.45 (0.47)
11. Labour Charge 364.22 475.73 622.76 659.94 549.51 (16.84)
12. Cost incurred in transporting the materials
35.36 40.45 61.88 67.08 55.94 (1.71)
13. Contingent expenditure
16.30 39.58 59.65 14.79 51.91 (1.59)
14. Sub-Total (1 to 13) 2153.03 2918.33 3024.40 3280.96 2966.85 (90.91)
15. Over Head & Supervision charge @ 10 %
215.30 291.83 302.44 328.09 296.68 (9.09)
16. Sub-Total 215.30 291.83 302.44 328.09 296.68 (9.09)
Grand Total (14-16) 2368.33 3210.26 3326.84 3609.05 3263.53 (100.00)
Source : Field Survey (Figures in parenthesis indicate percentage )
The table 4.2 indicates the per farm cost incurred in establishment of boring. It may be observed from the table that at overall level Rs. 3263.53 were spent for the establishment of bamboo boring. The across farm size analysis indicates that marginal farmers bore higher amount (Rs. 3609.05) followed by small farmers (Rs. 3326.84) medium categories (Rs. 3210.26) and large farms (Rs. 2368.33). Again in case of large categories of farms the expenditure on establishment of boring was quite low as compared to other categories of farms. The reasons were the same as mentioned earlier in case of per boring establishment cost. The cost of blank pipe at overall level constituted Rs. 1106.91 (33.92 % of the total cost). The next component which constituted higher amount after blank pipe was estimated for labour charges which was Rs. 549.51 (16.84 % of the totals cost) per farm. It reveals that the cost of blank pipe and labour charges are the major components, which constituted together nearly by 50 per cent of the total cost. The above analysis clearly indicates that across the farm size costs for establishing bamboo boring was found varying with the variation in the farm size. Because it was for those farms which possessed lower number of borings and whose establishment costs were higher than larger number of boring owners.

��
4.3 Cost of Pumping Across the Farm Size After establishment of borings farmers were to lift the water through pumping machines. Therefore, it is necessary here to work out the pumping costs. For calculating pumping costs the total costs were divided into two parts i.e. fixed cost and operating cost and then sum of all costs. The analytical procedure which has been adopted for this is being presented below. Under Fixed Costs a. interests on the investment were calculated by annual Value of installation X Interest rate Interest cost = 2 (Interest rate is assumed @ 12 % per annum b. Depreciation Original Cost – Salvage value (i) Annual depreciation = Useful life in year (ii) Diesel engine (expected life 14 Years) Under Operating costs / Variable costs (i) Estimate of fuel consumption for 8 hp. Diesel engine * Fuel consumption (per hour) = 1.25 litre Diesel cost (per litre) = Rs. 21/- * Operation cost per hour (per hr.) = BHP X fuel consumed in litres per hrs. X cost of fuel per litre. (i) Consumption of Lubricant oil & grease Diesel engine = 4.5 liter per 1000 HP. Hrs. Lubricant cost @ Rs. 95/- per litre Costs of maintenance and repair of pump Total Costs In Rs.) Yearly cost = Estimated life (In year) (Estimated life of pump is 15 years)
Estimates of engine maintenance and repairs costs

��
It is very difficult to predict the maintenance and repair costs of engine. Therefore, a nominal amount may be added on the basis of costs incurred on yearly basis. Estimates of operators’ wages Per labour per day (8 hrs.) wage has been calculated on the basis of @ Rs. 75/- mandays. Miscellaneous costs Under this head items like plastic pipe, ropes and minor implements, etc. have been calculated on fixed basis, i.e., Rs. 150/- for both owned and hired. After calculating the above costs, benefits acquired from it have also been estimated on the basis of followings : Total income Return per rupee working expenses = Total working expenses. (a) Assumed prevailing rate of irrigation in the area on the basis of per hour in rupee. (b) Worked out per hectare time taken in irrigation.
Table 4.3 Costs of Pumping Across the Farm Size per Boring
(in Rs. / Annum) Categories of farmers Item
Large Medium Small Marginal
Overall
Fixed Cost I Interest 200.01 205.45 226.07 209.06 188.55
(0.83) ii Depreciation 1071.42 1071.42 1071.42 1071.42 1071.42
(4.72) Sub - Total 1271.43 1276.87 1297.49 1280.48 1259.97
(5.55) Operating Cost i. Fuel Consumption 28507.50 21442.50 18607.50 16987.5 20108.5
(88.60) ii Lubricant oils 570.15 428.85 372.15 339.75 402.17
(1.77) iii Pumping maintenance
100.83 107.43 111.68 95.93 74.66 (0.33)
iv Engine maintenance
75.00 75.00 75.00 75.00 75.00 (0.33)

��
v Operator wage 652.5 615.60 599.40 529.20 589.0 (2.60)
vi Miscellaneous 270.0 196.35 140.25 122.70 186.20 (0.82)
Sub Total 30175.98 22865.73 19905.98 18150.08 21435.53 (94.45)
Grand Total 31447.41 24142.60 21203.47 19430.56 22695.50 (100.00)
Source : Field Survey (Figures in parenthesis indicate percentage)
Note : Interest Rate calculated @ 12 %, diesel engine cost @ Rs. 15,000/-, expected life 14 Years, fuel consumption @ 1 : 2.5 Lt., fuel rate @ Rs. 21/- Lt., lubricant rate @ Rs. 95/- per liter and life of Pumps 15 years. The data presented in table no. 4.3 show the cost of pumping across the farms on per boring basis. As explained earlier, the cost of pumping consisted of fixed and operating costs. The table reveals that on overall basis the fixed cost is estimated at Rs. 1259.97 per boring which accounted for only 5.55 per cent of the total costs. Operating cost is calculated at Rs. 21435.53 per boring, accounted for 94.45 per cent of the total cost. It clearly shows that the operating cost is a major component of total pumping cost as it involves fuel consumption, maintenance of pumps’ engine, wages paid to operators and others. Out of the operating cost, the cost of fuel is larger, which forms nearly 88.60 per cent of the total cost. It means that the diesel run pumps are costlier in operation. Moreover, the cost of pumping varies across the farms. It is larger in case of large farms (Rs. 31447.41) and lower in case of marginal farms (Rs. 19430.50). The data further reveals that it established a relation with the farm sizes as it increases with the increase of farm sizes. It may due to greater use of pumping devices by the large farms.
Table 4.4
Costs of Pumping Across the Farm Size per Farm (in Rs. / Annum)
Categories of farmers Items
Large Medium Small Marginal
Overall
Fixed Cost i Interest 114.29 192.60 265.96 250.87 222.49
(0.96) ii Depreciation 612.24 1004.45 1260.49 1285.70 1118.00
(4.86) Sub - Total 726.53 1197.05 1526.45 1536.57 1340.49
(5.82) Operating Cost i. Fuel Consumption 16290.0 20102.34 21891.17 20385.0 20253.13
(87.96) ii Lubricant oils 325.80 402.04 437.82 407.70 405.06
(1.76) iii Pumping maintenance 57.61 100.71 131.38 115.16 118.03
(0.51) iv Engine maintenance 42.85 70.31 88.23 90.00 84.88
(0.37)

��
v Operator wage 372.86 577.12 705.17 635.04 653.80 (2.84)
vi Miscellaneous 154.28 184.08 165.00 147.24 169.91 (0.74)
Sub Total 17243.40 21436.60 23418.77 21780.14 21684.01 (94.18)
Grant Total 17969.93 22633.65 249945.22 23316.7 23025.30 (100.00)
Source : Field Survey (Figures in parenthesis indicate percentage)
The data presented in table no. 4.4 shows the cost of pumping across the farms on per farm basis. The table shows that on overall basis, the total cost of pumping is Rs. 123025.30 per farm comprising fixed cost as Rs. 1340.49 per farm (5.82 % of the total pumping cost) and operating cost as Rs. 21684.81 per farm (94.18 % of the total pumping cost). It clearly indicates that operational cost constitutes the major portion of the cost of pumping. But the cost of pumping varies across the farms. It is estimated at Rs. 17963.93 per farm on large farms, Rs. 21436.60 per farm on medium farms, Rs. 23418.77 per farm on small farms and Rs. 217840.44 per farm on marginal farms. It clearly reveals that smaller the farm higher the cost of pump and larger the farm lower the cost of pump. It is due to the fact that large farm uses the pump on larger scale. 4.4 Returns from Pumping on per Farm Basis The data presented in table no. 4.5 show the returns from the pump across the farm sizes on per farm basis. The table reveals that on the overall basis, per rupee return is estimated at Rs. 2.36. But it varies across the farms. It is estimated at Rs. 2.42 on large farms, Rs. 2.37 on medium farms, Rs. 2.34 on small farms and Rs. 2.33 on marginal farms. It reveal that larger the farms, higher the return. Moreover, it can be concluded that the return from pumping is always more than double to the amount of investment, which testifies that this device is economically viable.
Table 4.5 Returns from Pumping Across Farm Sizes on per Farm.
Categories of farmers Item
Large Medium Small Marginal
Overall
No. of hour used/yr. 1267.23 955.46 827.29 755.50 840.18 Rate of return from pumping/yr. (@ Rs. 60/hr.)
76033.80 57327.60 49637.4 45330.0 50406.00
Total costs of pumping 31447.41 24142.60 21203.47 19430.5 22695.50 Net return from pumping/yr.
44586.39 33185.0 28430.33 25905.5 27709.83
Rates of return (per rupee)
1 : 2.42 1 : 2.3.7 1 : 2.34 1 : 2.33 1 : 2.3.6
Source : Field Survey
4.5 Return from Pumping on Per Boring

��
The data presented in table no. 4.6 show the returns from the pump across the farm sizes on per boring basis. The table reveals that on overall basis the per rupee return is estimated at Rs. 220. But, it varies across the farms. It is estimated at Rs. 2.42 on large farms, Rs. 1.67 on medium farms, Rs. 2.39 on small farms and Rs. 2.33 on marginal farms. It reveals that the returns on per boring are different across the farms. It is larger on large farms followed by small farms, marginal farms and medium farms. Moreover, it may be concluded that the return on per rupee varied between Rs. 1.67 to Rs. 2.42. It signifies that the return from pumping devices on per boring basis is always profitable. Thus, the device on per boring basis is also feasible.
Table 4.6 Returns from Pumping Across Farm Sizes on Per Boring
(in Rs. / Annum) Categories of farmers Item
Large Medium Small Marginal
Overall
Number of hours used per year
724.13 895.74 973.21 888.86 9947.18
Return from pumping per hrs. (@ Rs. 60 per hrs.)
43468.46 53744.62 59560.56 54403.20 37522.53
Total cost of pumping 17969.95 32008.60 24945.25 23316.60 22957.18 Net return from pumping per year
25498.51 21736.02 36243.96 31086.60 22957.19
Rate of Return (per Rs.) on working expense
1 : 2.42 1 : 1.67 1 : 2.39 1 : 2.33 1 : 2.20
4.6 Bamboo Boring Vrs. Shallow Tubewell Bamboo boring was first introduced in the Eastern Kosi region of Bihar in the year 1968–69 whereas the shallow tube-wells (STWs) were first introduced in the state of Uttar Pradesh in early 1950s. After their introduction, these devices become very popular throughout the country. The reasons for popularity of bamboo boring in the state as well as in the country were suitability of the devices, such as shallow depth, small size of holdings, low capital requirement, high labour absorbing capacity and easy operation. Its specific advantage is that it is made up of locally available materials. Similarly, the shallow tube-wells are best suited for small land holdings and its low-capital requirement. The economic lives of STWs are comparatively higher than that of bamboo boring. Hence, both bamboo boring and shallow tube–wells were suitable for small size pumping machines of 3 to 5 Horse Power capacity. Further, on account of advantages like, energy saving, labour absorption, capital saving and low maintenance cost these devices became very popular in the country. Cost-Benefit Analysis

��
The estimated installation cost of both bamboo boring and shallow tube well have been worked out at price level prevailing during the year 2002, and presented hereunder:
Table : 4.7 Estimated Cost of Bamboo Boring & Shallow Tube-wells
in Rs. Components Estimated cost for
bamboo boring (In Rs.)
Estimated cost for shallow tube-wells
(In Rs.) 1. Iron sheet 258.00 ---- 2. Bamboo 87.00 ---- 3. Coconut coir 308.00 ---- 4. Iron wire 18.00 ---- 5. Blank pipe/Iron pipe 1120.00 3020.00 6. Bottle tee/socket 120.00 230.00 7. Check Valve 115.00 195.00 8. Iron Nails 10.00 5.00 9. Nipple 80.00 ---- 10. Sand / Gravels 15.00 ---- 11. Gunny bag 10.00 ---- 12. Labour charge 525.00 385 13. Transporting 55.00 130.00 14. (Miscellaneous) Expenditure 50.00 65.00 15. 2 – 4 inch Socket ---- 120.00 16. Strainer/plunger ---- 2000.00 17. Supervision & Over head charge
275.00 620.00
Total expenditure 3041.00 6770.00 Source : Field survey & discussions with Officials of Minor Irrigation Department, Government of Bihar
The above table suggests plentiful evidence in support of sinking bamboo boring being 44.92 per cent cheaper than that of shallow tube-wells. As the table reveals, total estimated cost incurred in the installation of bamboo – boring was calculated at Rs. 3,041 in comparison to the amount calculated for STW (Rs. 6770/-). Higher labour charge incurred in sinking a bamboo boring (Rs. 525/-) as compared to shallow tubewell (Rs. 385/-) indicates the farmer’s greater labour absorbing capacity. The table further reveals lower material costs meant for bamboo boring in comparison to shallow tube-wells, particularly for the items, viz., blank pipe/iron pipe, bottle tee /socket, check valve, transportation cost, miscellaneous expenditure and supervision and overhead charges are also quite lower in sinking bamboo boring in comparison to shallow tube-wells (Rs. 55/-, Rs. 50/- Rs. 275/- and Rs. 130/-, Rs. 65/- and Rs. 620/-) respectively. Benefits derived from the installation of bamboo boring and shallow tube wells were also worked out on the basis of estimates provided by the officials of Minor Irrigation and State Tube-well Departments, which give an idea of

��
benefits received out of the investments in both the devices separately which present a comparative picture of costs & benefits. According to one estimate shallow tube wells have been found to discharge water to the tune of about 30,000 liters / hour through 7.5 H. P. pumping machine, which are sufficient to irrigate about 6 hectare of land on per annum basis. The average cost of irrigation per hectare of land through this device during one agricultural year has been worked out at Rs. 2,000/- approximately. It includes Rs. 1,200/- as costs of fuel and machines, labour, etc. The expected life of STW has been estimated to be 10 years. Hence, the annual net returns come to Rs. 800/- per hectare and, thus, the total net revenue from one STW will be Rs. 4,800/- per annum out of irrigation of about 6 hectares of land. In this way, the total installation cost of one STW, i.e., Rs. 6,770/- will be realized in two years. The per rupee return from the investment was Rs. 1.71. Similarly in the case of bamboo boring the per rupee return is estimated at Rs. 2.36. Concludingly it may be stated that both devices are feasible and profitable in the area. The comparative economic analysis of bamboo boring & shallow tube wells may also be presented in a tabular form on the basis of some common parameters as noted in next page :

65
PARAMETERS SHALLOW TUBE WELLS BAMBOO TUBE WELLS Depth More than 100 ft. Less than 80 ft. Economic life More than 10 years Less than 10 years Capital requirement Comparatively higher than BTW Comparatively lower than STW Technology Complex Simple Time Comparatively more time taken in installation of BTW In shorter period of time Maximum depth of functioning Upto 150 ft. Upto 80 ft. depth Horse power (HP) More than 7 H. P. Upto to 5 H. P. appropriate for lifting Type Strainer Cavity Change in cropping pattern Larger extent Lesser extent Yield rate & stability Phenomenal increase in crop output Substantial rise in existing crop with positive
impact Water table Between 50 ft. to 150 ft. 15 to 80 ft. Size of holding Upto 2 ha. Below 1 ha. Operation Mechanical Manually (local labour) Suitability for the area No shortage of capital Shortage of capital but abundance of labour Economic returns Positive over the lost Advantage over shallow tubewell Ratio of created energy wasted & used
40 : 60 60 : 40
Sustainability Well recognized in the specific area Well recognized in the specific area Per Rupee return 1.71 2.36

66
4.7 Pump Efficiency : Bamboo Boring Vs. GI & PVC PIPE Friction is one of the governing factors of pump efficiency. Generally centrifugal types of pumps are used in bamboo boring devices. The co-efficient of friction depends upon roughness of the surface of contact of the flow of water passing through internal surface of conduit. The overall efficiency depends upon several things like, pump, human skill, etc. It has been found that practical efficiency is quite lower than the rated efficiency in the actual efficiency range system. For example, the theoretical efficiency is 40 per cent and it creates only 15 per cent of the actual efficiency. Earlier studies regarding efficiency of pumps reveal that devices with PVC pipe, steel pipe (G-I Pipe), hose pipe and bamboo boring have little higher overall practical efficiencies except in case of bamboo boring. Because of higher roughness in case of bamboo boring discharge. It is comparatively lower than in case of other pipes. The roughness co-efficient of bamboo – boring pipe is higher than other pipes, hence, pump – efficiency decreases to some extent, but not significantly. It is very important to note here that the cost of installation of Bamboo – boring is well within the reach of marginal and small farmers due to its locally available materials and simple technology involved. Keeping in view the low financial capacity of a majority of farmers residing in the sampled regions and ‘lower cost and better efficiency of bamboo – boring in comparison to other pipes, adaptability of this device is greater and more suitable for the area. Various research studies were conducted at different research institutions for assessing the efficiency of pipes also. Outcome of these studies reveals that in case of bamboo – boring EI & PVC pipes, the overall practical efficiencies of EI & PVC are a little higher than bamboo boring which could not be measured properly. The only considerable factor is that the actual cost of installation of bamboo boring is comparatively quite low. Yet another advantage with this device is that it is installed by using locally available materials, which are abundantly found in the sampled area with very simple construction technology and easily adaptable by the farmers. Besides, these were within the existing capacity of owners of marginal and small land holdings. Hence, this type of pipe can be highly recommended in the economically backward regions, particularly in low water table areas, because it provides a significant advantage over other devices. In nut-shell, it may be concluded that bamboo – boring pipes possess distinct advantages over other devices/pipes.

67
See BAMBOO pipe figure.Pm5 (PAGE MAKER FILE)

68
4.8 Impact of bamboo boring on GCA and cropping intensity The table no. 4.8 highlights the impact of bamboo boring on the gross cropped area and the cropping intensity. The table shows that on overall basis the gross cropped area and the cropping intensity of the sample farms have increased by 59.52 per cent. But, it varies across the farms. It is larger at marginal farms (66.55 %) followed by large farms (58.52 %), small farms (58.40 %) and medium farms (56.25 %). It indicates that the cropping intensity has increased by more than 50 per cent on all the farms, which testifies that the bamboo boring devices in the sample area is playing a catalytic role in promoting the overall agricultural growth in the gross cropped area.
Table 4.8
Change in Cropping Intensity Per Farm Across the Farms Due to Inception of Bamboo Boring in Sample Area.
(in ha.) Categories of Farmers Items
Large Medium Small Marginal
Overall
Before inception of bamboo boring 1. Net sown area 41.64 100.36 79.12 63.92 285.04 2. Total cropped area 43.65 103.07 82.56 78.42 307.70 3. Cropping intensity 104.83 102.70 104.35 122.68 107.95 After inception of bamboo boring 1. Net sown area 41.64 100.36 79.12 63.92 285.04 2. Total cropped area 74.60 183.24 141.38 117.76 516.98 3. Cropping intensity 179.15 182.58 178.69 184.23 181.37
% of change after inception of bamboo boring Total Cropped Area 58.52 56.25 58.40 66.65 59.52 Cropping Intensity 58.52 56.25 58.40 66.65 59.52
Source : Field Survey
4.9 Impact of Bamboo Boring on Income The data presented in table 4.9 highlights the net incremental income after the installation of bamboo boring. It has been measured on the basis of estimated value of output before and after installation of the bamboo tubewell. The table reveals that the gross value of output, before BTW was estimated at Rs. 20179.43 per ha. on all farms. However, it varies across the farms, which is clear from the table that it increases with the increase in farm sizes. Likewise, the value of output after BTW has been estimated at Rs. 26072.02 per ha. on all farms. It also varies across the farms and moreover it indicates that it increases with the increase in the size of farms. On the basis of these two figures the percentage net increment over BTW has also been drawn. The table clearly indicates that the gross income has increased by 29.20 per cent on all farms. Though it was found a little higher in case of large farms (30.28 %) followed by marginal farms (29.26 %),
69
medium farms (29.20 %) and small farms (28.13 %). It clearly indicates that the income accrued to the sample farms after the installation of BTW is a positive sign of the benefits of BTW in the study area.
Table 4.9 Incremental Income after Inception of BTW Across the Farms
(In Rs./ha.) Categories of farmers Particulars
Large Medium Small Marginal
Overall
Gross value of output before BTW
23568.68 21962.56 19469.70 18582.67 20179.43
Gross value of output after BTW
31411.16 28375.63 24945.56 24019.96 26072.02
Net Increment (In %) 30.28 29.20 28.13 29.26 29.20 Source : Field Survey
4.10 Impact of Bamboo Boring on Employment The impact of BTW has also been assessed on employment level of the sample farms. The data presented is table no. 4.10 justifies it. The data reveals that the employment generated for human labour of per hectare of net sown area was found at 52.71 mandays, consisting of 27.29 mandays for family labours and 25.42 mandays for hired labour. But it varies across the farms. It is higher at 61.75 mandays on marginal farms followed by 56.84 mandays on small farms, 53.19 mandays on medium farms and 48.26 mandays on large farms. It clearly indicates that small farm sizes utilized larger the mandays incase of total generated mandays and family labours. Incase of hired labour, it was found increasing with the increase in the farm sizes. It is due to the fact that marginal and small farmers mostly engaged themselves as family labour due to smaller size of holdings whereas medium and large farms engaged hired labour on larger scale as they did not engage themselves in the agricultural activities. Besides above the increase in employment level has also been assessed on per unit basis, which has been estimated at 76.29 mandays on overall basis, constituting 34.12 mandays as family labour and 42.17 mandays as hired labour. The data on distribution of family and hired labour in total employment reveals that it decreases with the increase of farm sizes for family labour and hired labour both.
Table 4.10 Incremental Employment Generated for Human Labour of Per Hectare Net
Sown Area (mandays/ha.) Across the Farms Categories of farmers Particulars
Large Medium Small Marginal
Overall

70
Mandays utilized per ha. of net sown area (i) Family labour (ii) Hired labour
21.84 26.42
26.26 27.13
29.33 27.51
37.99 23.76
27.29 25.42
Total 48.26 53.19 56.84 61.75 52.71 Incremental employments per units (i) Family labour (ii) Hired Labour
27.74 33.55
31.86 38.59
36.54 41.03
39.39 48.30
34.12 42.17
Total 61.29 70.47 77.87 87.69 76.29 Source : Field Survey
Summing up, on the basis of the above analysis it can be concluded that the bamboo tube-well is very successful irrigational device in the study area as the soil and water table available in the project area are most suited for this device. Hence the suitability of bamboo Boring is justified in the project area. As regards the feasibility, the returns were found always higher than the investment. Therefore, it indicates that the device is economically feasible in the project area. In regard to its sustainability, the study finds that the life of boring is not longer due to its traditional method of sinking and usages of cheaper materials. But its sustainability may be ensured by making some modification or adoption of scientific method of sinking as well as the usage of quality materials. Moreover, its desirability is unquestionable on account of being a low – cost device, and having positive impact on income, employment and production of crop in the study area, which is agriculturally a slow and backward region in the state. But the devices and farmers are not free from the constraints, which are discussed in next paras. 4.11 Constraints According to Kashem and Yones (1988) the term “constraints” generally refer to barriers or impediments (technological, socio – economic, input availability and administrative) confronted in achieving desired objectives. In course of field survey, it has been observed that there are various constraints, which are being faced by the sample respondents in regard to installation, lifting of ground – water, maintenance and operation of bamboo boring in the study area. These constraints are enumerated as below : (a) Constraints in Installation of Bamboo Boring : The main constraints during installation of bamboo boring are (i) lack of Government subsidy and aid (ii) poor supply of electricity (iii) high cost of input like iron pipe, reflex, motor (diesel or electric) (iv) high cost of shinking, and (v) lack of co-operation from Government officials. (b) Constraints in lifting ground water :

71
Although ground water is available within the depth of 40 – 50 fit, but due to high cost of diesel / k. oil, poor power supply, etc. farmers full difficult in making effective use of bamboo boring for irrigating their field. (c) Constraints in maintenance of bamboo – boring : Though its maintenance is too easy and very less inputs are required, sometimes it very difficult to keep constant vigil on the Bamboo Boring due to the nefarious attitude of some anti – social elements who use to drop stone pieces in the boring proved and thus nor its usefulness. Another important constrains in maintenance of Bamboo Boring has been found the rotting of bamboo pieces within 5 years. (d) Constraints in operation of bamboo – boring : Generally farmers do not use the reflex in their boring due to high cost of reflex. Regular use of boring without reflex socket hammered the bamboo used in boring and destroyed the net (plastic) and bamboo also. Thus, the life of Bamboo–Boring is reduced to 5 -6 years.

CHAPTER – FIVE
Summary And Conclusions
5.1 Background Bihar has high percentage of irrigation and ranks fifth among the major states. The gross cropped area of Bihar is estimated at 7946435 ha. and out of it the total irrigated area is 4040706 (60.92 %). As regards the tubewell irrigated area is concerned, it is 2351439 ha., accounting for nearly 29.59 per cent of the gross cropped area. The percentage of tubewell irrigated area to the total irrigated area has been estimated at 48.58 per cent. On irrigational front tubewell does not occupy the major source of irrigation as it irrigates only 30 per cent of the gross cropped area and less than 50 per cent of the total irrigated area. Virtually the canals occupied the major source of irrigation in the state. But it is to be mentioned here that the poor maintenance of canal irrigation structure in the state has badly affected its proper functioning. It is due to the fact that most of canal beds have silted, which has restricted the sufficient water flow at the right time. Thus, the importance of tubewell irrigation has increased. The district wise analysis on irrigation potential from ground water in the state reveals that the percentage of irrigation potential created to the ultimate irrigation potential ranges between 61.41 per cent and 22.33 per cent in Begusarai and Banka district respectively. It means that there is much potential of ground water irrigation in the state which is to be tapped with a maximum of 77.67 per cent and minimum of 38.59 per cent across the districts in the state. As regards the study area, the irrigational potential created is just 43.16 per cent to the ultimate irrigation potential from the ground water. So there is immense scope to tap the potential of remaining 56.84 per cent of the total ground water irrigational resources in the district. The ground water can be utilised through two broad means; open wells and tube – wells. The tube-well, too, can be put under two broad categories; deep and shallow. The deep tube-wells tap deep seated aquifers (more than 300 ft. from the earth’s surface) and the shallow tube-wells tap shallow aquifers (less than 200 ft. from the earth’s surface). The deep tube-wells are generally fitted with high power on water lifting machines of more than 15 h. p. capacity. The shallow tubewells are generally fitted with small power water lifting machines, 3 to 8 h. p. capacities. 5.2 Bamboo Boring Like shallow tube-well another low cost device for exploiting ground water has been introduced by the farmers of Saharsa district of Bihar. This unique

75
system of irrigation is called Bamboo Boring. It is most popular among small and marginal cultivators of North – Eastern part of Bihar. Mr. Ram Prasad Choudhary Jaisawal of Village Lalpur in the Singheshwer Asthan Block of old Saharsa district (now Madhepura), a medium farmer owning about 15 acres of land, was the first person who invented the ‘bamboo tube-well’ in December 1968. It bids fair to presage a spectacular break through in the exploitation of ground water. The Bamboo Tube-wells (BTWs) provide an excellent example of intermediate technology well suited to the needs of small sized land holdings. It may be mentioned that a BTW is essentially a shallow tube well but drilled upto a depth of only 50 ft. to 80 ft. But the shallow tube wells are comparatively deeper (up to 200 ft.) and tap more aquifers than the bamboo tube-wells. The traditional BTW was cased with a pipe made of bamboo strips. Originally the casing consisted of six strips of bamboo tied to steel rings of about 4” to 6” diameter and wrapped with coir strainer. A BTW consists of 3 bamboo pipes of 20 ft. length. Generally three bamboos are used in a BTW. One or two labourers can finish the bamboo strips. One labour may wrap the coir strainer on bamboo pope. About 4 to 5 kgs. of coir strainers are used in a 20 ft. bamboo pipe. In this may about 15 kg. coir strips are used in a BTW. The materials used are locally available and village labourers may easily finish the total work. The only skilled technician needed is the village blacksmith for iron rings. Six bamboo strips are circularly laid over iron rings of 4” to 5” diameter and fixed to rings with nails and iron wires. Then coir string is tightly wound around the bamboo frame. About 20 iron rings are used in a 20 ft. length bamboo frame. Thus the bamboo tubewell has brought the tapping of ground water well within the means of small cultivators. Bamboo tubewells are more popular in Purnea and Saharsa districts of north-east region of Bihar, particularly amongst small and marginal farmers. BTWs involve low capital cost in comparison to 7 times more for shallow tubewells and they need most simple technology. BTWs are being drilled and installed by local artisans in a relatively shorter period of time. However, now the technology has changed. Recently some improvements have been made is BTW. The top 15 to 20 ft. portion of the casing is now replaced by the metal pipe to avoid the cutting of coir strainer by rats. Coir strainer has been replaced by plastic net and plastic wire. The improved BTW is economically more sound than the traditional BTW. The life of traditional BTWs was about at 4 to 5 years. But, the life of the improved BTWs is about 7 to 10 years. The life of the shallow tube-wells (STWs) is estimated at 15 years. The cost of improved BTW is nearly double than that of traditional BTW. The improved BTWs are more popular among small and marginal farmers of Saharsa Purnea, Khagaria, Madhepura, Supoul, Katihar and some part of Bhagalpur districts of Bihar.

76
In the beginning the Bihar State Tube-well Department had several objections to the efficiency of BTW. The bamboo was easily affected by air and water, destroyed by white ants and rodents and could not resist the soil pressure. But the severe drought of 1972 turned out to be the proverbial ‘blessings in disguise’ for the districts of Saharsa and Purnea. As part of the programme to step up rabi production, the Government of Bihar, placed funds at the disposal of the district collectors for sanctioning loans to small farmers for sinking bamboo tubewells. The district administration of both the districts gave the highest priority of the sinking of bamboo tubewells and geared up the entire administrative machinery. As a result from October 1972 to January 1973 a period of four months only – over 1900 bamboo tubewells were sunk and over one lakh acres of agricultural land was brought under irrigation in these two districts. In this way, the bamboo tube well has several obvious advantages. In the context of acute shortage of steel, its substitution by bamboo is a welcome development from the point of view of the national economy. The most attractive feature of the bamboo tubewell is its extremely low cost. Further, the bamboo tubewell has brought the exploitation of ground water within the reach of small cultivators. Even cultivators who own as little as half an acre of land have installed bamboo tube well. Most of the holdings being fragmented, hitherto even well – to do farmers found it difficult and uneconomic to provide irrigation for all the plots of land owned by them. Now they are in a position to install a bamboo tube well in each scattered plot and bring the entire holdings under irrigation. Now – a – days, BTW is an important source of irrigation in Saharsa district. Farmers are fully dependent on BTWS for irrigation. BTWS provide income, employment, cropping pattern, etc. Farmers now cultivate wheat, paddy, maize, banana, sugarcane, jute, and tobacco to a large scale. Marginal farmers have adopted the co-operative formula. They have low income and capital. Five to ten farmers sink the BTW on co-operative basis and then irrigate their land accordingly. Thus BTWS are most popular among all categories of the farmers of Saharsa district. 5.3 Sustainability of Bamboo Boring : North East Region Vs. Other Regions Sustainability depends on stability, necessity and viability of the boring. So far the sustainability of the bamboo boring is concerned, there are two congenial factors in the sampled area, viz., favourable soil and water level. Besides it can be installed with local labour and cheap materials which do not obstruct in installation even by small and marginal farmers. Available literatures and studies suggest that it can be smoothly operated specially in Gangetic and Kosi river basin. But in case of other parts of the country particularly in U. P., Haryana, Punjab and West Bengal there is wide

77
fluctuations in the water table, which restrict its smooth operation. Thus unless and until favourable soil condition and water table are found in other regions, there is no possibility and feasibility of bamboo boring. 5.4 Objectives i. To gauge the importance of Bamboo Boring with particular reference to the area of land irrigated, number of labour employed and the amount of capital invested in selected farms, ii. To quantify the costs and benefits accruing to sample farmers, iii. To identify the season-wise suitability of Bamboo Boring in selected farms, iv. To pin down the main constraints in regard to the installation, lifting of ground water, maintenance and operation, v. To assess the feasibility, suitability, sustainability and desirability of bamboo boring in the sample area, vi. To examine the impact of bamboo boring on income and employment of sample farmers, vii. To suggest measures for the consideration and implementation of the findings by the government and policymakers. 5.5 Research Questions
I. Does the adoption of Bamboo Boring provide economic profitability to the cultivators of the area ? If yes, upto what extent
II. Is bamboo boring the best source of irrigation under minor projects ?
III. Is there any problem of under utilisation of irrigation potential available in the study area ? 5.6 Methodology A multi-stage sampling design has been followed for the selection of the bottom unit of the sample. At the first stage, the district of Saharsa has been selected purposively. It is to be pointed out here that the Bamboo tube-well (BTW) was first introduced in Saharsa district. It has not only the larger potential but has also feasible conditions. Subsequently at the second stage of sampling two blocks, namely, ‘Kahra’ and ‘Saur Bazar’ were selected on the basis of larger concentration of bamboo boring devices of the irrigation.
78
At third stage of sampling, the selection of 5 villages was made on the same basis as adopted in case of selection of sample blocks. Under Kahra block; Bangaon, Baryahi Basti, Kahra, Mani Rahua and Parari villages and under Saur Bazar Azgaiba, Bhawanipur, Chandaur, Kanp and Raghunathpur villages were selected. This way 10 villages, 5 each from the sample block, were covered under the study. At the bottom level, the selection of respondents was made. First of all, the farmers using the BTW were enlisted in each of the sample villages and the enlisted farmers were further classified broadly in four categories, viz., marginal (< 1 ha.), small (1 – 2 ha.) medium (2 – 4 ha.) and large (> 4 ha.) on the basis of size of land holdings. After classification 12 farmers were selected from each of the sample villages, who were proportionately represented in the sample. These way 60 farms were selected from each of the sample block, which comes to a total of 120 farmers in the sample area / study area for in depth study. Besides above, several discussions were also arranged with the concerned officials and the villagers in group to elicit the information collected from the primary sources which were collected with the help of duly structured schedule. 5.7 Reference Year The reference year of the study was agricultural year 2002 – 2003, viz, by incorporating Kharif, 2002 and Rabi, 2003. 5.8 Limitations (i) It was not possible to cover entire area in view of the time constraints. (ii) The respondents were mostly illiterate and shy and also in some cases they were not found interested to provide adequate information. (iii) The investigation has been carried out only in two blocks of the Saharsa district, and hence, the general acceptability of the results has its own limitations. (iv) Primary survey research method of data collection (previous year / off season) was based on recall of memory because the farmers were not maintaining the records. So it cannot be free from its biases particularly in case of literate and semi-literate farmers. (v) Since the entire Saharsa district is not fed with bamboo boring, hence, the effect of irrigation on cropping intensity or cropping pattern could not be uniformly investigated. 5.9 Review of Literature A number of economists, scientist technocrats and bureaucrats have attempted to study the dynamics of minor irrigation especially that of

79
shallow tube – wells and bamboo tube-wells at, national, state or regional and international levels, viz., NABARD (1988), NABARD (1989), Mukhopadhyay (1973), Appu, P. S. (1974), Syed Farooque Azam, L. S. S. O’ Malley, Nandini Chatterjee, Jha U. M. (1984), C. Dakshinamurti, A. M. Michal and Shrimohan (1973), The Report of the Irrigation Commission (1972), Agricultural Production Team of the Ford Foundation (1959), A. M. Michel, Tushar Shah (1993), Frederich Kahnert & Gilbert Levine, Vikash Dubas, Geoff Wood, Sharma, I. D. (1984), Saksena (1983), Pathak (1982), Mishra H. M. (1985), China Irrigation and Drainage Corporation, R. Purcell, F. A. O., M. Sonou, F. A. O. Regional Officer, Mardivamba Rukurri, Professor of Agricultural Economics, University of Zimbabwe, Fraen Kel (1986), M. K. Gakundi, General Manager, Smallholders Irrigation Scheme Development Organization, Kenya, On the basis of the observations made by the above studies it may be concluded that a cheap, easy, and instantly productive system is needed which justifies the suitability of the bamboo boring as unique irrigation system. 5.10 Profile of the Study Area The district of Saharsa was created as a separate district in 1954. Saharsa is the chief town being the district headquarters as also the headquarters of Kosi Division. The total area of the district is 1195.60 square kilometers. The total population of the district is 1506418, accounted for 1.82 per cent of the state’s population. The density of the population in the district is 885 persons. Of the total, males constituted for 52.35 per cent and females 47.65 per cent. Rural population is 91.77 per cent and the urban population is only 8.23 per cent. The proportion of scheduled castes is 30.75 per cent whereas the scheduled tribes are only 0.60 per cent. The overall literary percentage is 39.28 per cent, which is far below the literacy percentage of 47.53 per cent of the state. The literacy percentage of males and females were 52.04 per cent and 25.31 per cent respectively. As regards the workers, the total workers were 39.27 per cent of the total population in the district. Main workers, marginal workers, cultivators, agricultural labourers, other workers and non – workers were 27.35 per cent, 11.92 per cent, 31.66 per cent, 52.47 per cent, 13.82 per cent and 60.73 per cent respectively of the total population in the district. The total geographical area in the district is 403 thousand hectares (1195.60 square kilometers). Out of it, the net sown area is 246 thousand hectares (61.04 %) followed by 17.12 per cent non – agricultural area, 8.44 per cent barren and uncultivable land, 4.71 per cent current fallow, 3.97 per cent other fallow, 2.98 per cent forests and groves, 1.24 per cent cultivable barren land and 0.50 per cent permanent and other pasture land.

80
The entire district lies in the north of the holy river Ganges and is comprised of plains. It lies is the north east plains, a sub-zone of middle Gangetic plains (zone no. 4) of agro-climatic zones, as demarcated by the Planning Commission in 1988. The district being at the end of the mid-Gangetic valleys, drainage and management of floods and seasonal rushes are problems of the region. A little over 60 per cent of land is cultivated and only 44 per cent of this is irrigated. The region receives around 1224 mm of rainfall and the climate is similar to other sub-zones in the Bihar plains – dry to moist sub-humid. The soil type is sandy to silty loam, medium to strongly acidic. The cropping intensity is high relatively to the other sub-zones. However, land productivity is low. The most important river of the district is the ‘Kosi’. It rises in the Himalayas, and known as ‘Bihar’s River of Sorrow’. Most of other important rivers of the district emerge from the Himalayas and fall into the river Khagri which itself joins the Kosi. The cropping pattern in the district during the reference period of the study reveals that paddy and wheat are the main staple foodgrains which are produced in the district nearly by 60 per cent of GCA. Maize occupied the third largest crop nearly by 7.30 per cent of GCA. Pulses occupied relatively smaller area in the district. The net sown area is 246 thousand hectares and the cropping intensity was found at 150.41 per cent. As regards the season wise, kharif possess the larger area by 38.92 per cent of GCA followed by rabi 30.27, per cent summer by 15.95 per cent and Bhadai by 14.86 per cent. It reveals that kharif and rabi together account for nearly 70 per cent of the GCA. Nearly 45.14 per cent of the gross cropped area in the district is irrigated and the percentage of tubewell irrigated area to the GCA is 39.28 per cent whereas the percentage of tubewell irrigated area to the total irrigated area is 87.03 per cent. It indicates that tubewell occupied the major sources of irrigation in the district. 5.11 Profile of the Respondents An altogether 120 farmers form the sample size of the present study. The sample size has been equally distributed in both of the sample blocks. The overall picture showed that out of 120 farmers, 42 (35.09 %) belonged to marginal category, 40 (33.33 %) small, 30 (25.0 %) medium category and 8 (6.67 %) large category farmers. The pattern of distribution of sample farmers across the farms indicates almost the existing pattern of land holding in Bihar. An analysis of the sample farmers based on their educational status. It may be seen from the table that out of the total, 15.0 per cent are illiterate, 17.0

81
per cent literate, 30 83 per cent attained the education up to the primary level, 30 per cent up to the secondary level and only 6.67 per cent were graduates and above. In other words, nearly 65 per cent of the sample respondents have attained education upto the primary level and only about 35 per cent of the sample respondents have education above the secondary level. It is clear that the educational status of more than 94 per cent of sample respondents is upto the secondary level. Hence, it reflects the success and failure stories of primary and secondary level education in the state. The educational status across the farm size group shows that educational status of small and marginal farmers is almost identical. The distribution of sample farmers on the basis of social groups reveals that on overall out of the total, 76 (63.33 %) belonged to intermediate castes, 36 (30.0 %) general castes and 08 (6.66 %) scheduled castes and scheduled tribes. It has been observed that in all the four categories, the percentage of intermediate caste farmers were highest in number. It reflects that the farmers engaged in agricultural operations of the study area mostly belonged to backward community. The occupational status of sample farmers has been divided into two parts. The first part deals with primary occupation and the second part deals with secondary occupation. The overall analysis of the data regarding primary occupation reveals that out of the total respondents 100 (83.33 %) farmers adopted agriculture as primary occupation followed by 10 (8.33 %) service, 04 (3.33 %) business and 6 (5.00 %) other occupations. The overall analysis of data regarding secondary occupation reflects that out of the total 44 (36.67 %) farmers have adopted business as secondary occupation, 38 (31.67 %) other occupation, 18 (15.0 %) service as secondary occupation and 20 (16.66 % farmers) having agriculture as secondary occupation. It may be observed from the analysis that in all the four categories the maximum numbers of farmers followed agriculture as primary occupation. Hence, it may be observed that nearly 80 per cent of the people of the study area are engaged in agricultural activities. The size of family of the sample respondents indicates that out of the total respondents 70 (58.33 %) farmers were having medium size family (5 – 8 members), followed by 40 (33.33 %) large size family (more than 8 members) and only 10 (8.34 %) farmers having nuclear family (below 4 members). When we analyze the data across the category wise farmers, it is observed that the number of the medium size family (5 – 8 members) is the highest among all the four categories. It may be due to lack of education, poverty, ignorance, etc.

82
The overall analysis reveals that the average number of workers on per farm basis is 2.93. There are two types of workers, i.e., full time workers and part time workers. Out of the total farm workers the average number of full time workers is 1.52 and that of part time workers is 1.41. The average number of casual labourers is 2.23 and out of this the average number of contractual workers is 1.13 and that of non-contractual workers is 1.10. The average number of non – farm workers and permanent farm servant is identical, i.e., 0.87. The land holding accounts of the sample farmers indicates that the average land holding size in the study area was 2.17 ha. and the average operated land holding size was 2.37 ha. It has also been found that per household land holding was 0.74 ha. for marginal farmers, 1.60 ha. for small farmers, 3.56 ha. for medium farmers and 7.29 ha. for large category farmers. The average leased-in and leased-out land areas were 0.40 ha. and 0.19 ha. respectively. The average uncultivable land was i.e. 0.006 ha. Hence it may be observed the intensive cropping pattern was being followed by the sample respondents because of having assured irrigation system through the bamboo – boring. The irrigational status of land owned by sample farmers shows that on overall basis the total operated area per farm size was 2.37 ha. out of which 1.73 ha. (73.03 %) was irrigated land and 0.65 ha. (27.0 %) was unirrigated land. Thus, the percentage of irrigated land was higher on account of larger number of operational bamboo – borings in the study area and the cheapest source of irrigation. Thus, it may be concluded that the bamboo – boring is the only source of irrigation in the study area. The status of farm assets owned by the sample respondents on per farm basis shows that availability and use of important farm implements / assets in the study area were very poor. The number of some important farm implements like tractors, pump sets (diesel and electric), threshers, sprayers, bullock carts and implements was not only inadequate in the study area but far below the state and national average. The overall per farm availability of tractors was 0.11, pump sets (diesel) 0.57, harrows 0.67, sprayers 0.42, and bullock carts 0.33. The availability of these farm implements has direct bearing on the production of crops. From the table it may be found that its availability was almost directly related with the size of farm. The possession of drought animals and milch animals was some what better than farm implements. The number of bullock per farm basis was 0.55 higher than the he-buffalos (0.45). Among milch animals the number of cows on per farm basis was 0.61, buffalos 0.51, goats 0.35 and young stocks 0.40.

83
Thus, it may be concluded that the study area still lacks the scientific mode of cultivation and thus is deprived of full utilization of natural resources and high yielding potentials. The main reasons may be due to lack of scientific information, low level of education, poverty, lack of Government initiatives, etc. The cropping pattern followed by the sample farmers in the study area indicates that on overall basis during kharif season paddy was grown in 193.12 ha. which was 67.79 per cent of the total operated area and 37.36 per cent of the grossed cropped area. Similarly wheat was grown in 187.82 ha. which was 65.89 per cent of the total operated area and 36.33 per cent of the gross cropped area. The total area under pulses was 47.42 ha. which was 16.64 per cent of the total operated area and 9.09 per cent of the gross cropped area. Oilseeds occupied very little area under cultivation. Maize was cultivated in 55.32 ha. which was 11.10 per cent of the total cropped area and 10.77 per cent of the gross cropped area. Horticultural crops also occupied very little area (19.66 ha.) Thus, the cropping pattern followed by the sample respondents in the study area was paddy / maize – wheat / pulses / oilseeds. During summer season maize and moong were grown in a very little area. The overall cropping intensity was 181.37 per cent some what above the state level. Such a high cropping intensity could be possible only on account of more use of bamboo-borings, the cheapest source of irrigation by the sample respondents. Cropping intensity was found highest (184.23 %) among marginal farmers as they followed intensive cropping pattern having small size of farm holding. 5.12 Results and Discussions Bamboo boring is a very cheap source of irrigation. It is very unique device of irrigation under minor irrigation system. It was introduced in Bihar in 1968. At present about 1,57,629 hectares of land are being irrigated through this source of irrigation. The estimated capacity of this system constitutes 3.15 per cent of all the sources of irrigation in the state. Thus bamboo – boring is being regarded as a break-through in the exploitation of ground water in Bihar. Inputs required in bamboo – boring are locally available. The village blacksmith is the technician and is armed with necessary know – how. Sinking process is very easy and takes very short span of time. It starts to supply water immediately. It is free from defects like alkalinity, water-logging and silting. In this way there are a number of plus points of bamboo boring which have induced our respondents to prefer this cheapest and easy source of irrigation. It was observed that several types of strainers were being used by the farmers of the study area. The most popular five types of strainers are : (a)

84
Bamboo strips wrapped with coconut coir (two layers), (b) Bamboo strips wrapped with three layers of nylon cloths, (c) P. V. C. slotted wrapped with nylon cloth, (d) M. S. Rod (1” dia; 6 no.) wrapped with coconut coir (two layers), and (e) M. S. Rod wrapped with three layers of nylon cloth. Out of the above five types of strainers, type (a) and type (c) are the most common strainers across the different categories of sample farmers. Out of 120 respondents 45 pre cent (54) were found using type (a) strainers and 38.33 per cent (46) were found using type (c) strainers in the sample area. Rests 16.67 per cent (20) were found using (b), (d) and (e) types of strainers in the study area. In nutshell it has been found from the study that (a) and (c) types of the strainers were most popular in the sample area. It was observed that farmers of the study area were found using local method for bamboo boring. They reported that after boring up to the desired depth, boring pipes were taken out. After that the plain pipes and strainers were pur in the bore. Then gravel packing or sand packing was done around the strainers and pipes. At the top of pipe, one check valve (reflex valve) and a bottle tee were attached to facilitate connection with pumping sets. At local level, the materials were used for bamboo boring were : (i) iron sheet of 1.5 mm, (ii) bamboo of about 20 feet length (iii) coconut coir (iv) G. I. wire (v) blank pipe (vi) Bottle tee (vii) Check valve (viii) Iron nails (ix) sockets and nipple (x) sands and gravel, etc. 5.13 Economics of Bamboo Boring Bamboo boring is the most important source of irrigation in the study area. Primary data relating to farmers’ input materials for the establishment of bamboo boring have been obtained through field survey. They were analyzed separately for different inputs on the basis of per boring and per farm respectively across the farm size groups.
The results of estimated cost per bamboo boring across the farm size are presented in table 4.1. The table reveals that at overall level per boring costs have been worked out at Rs. 3042.61. But the expenditure varied from Rs. 3767.73 (small farms) to Rs. 3333.61 (large farms) across the farms. The table further indicates that of the total costs, blank pipe costs constituted higher amount followed by labour charge, coconut coir, iron sheet, etc. At overall level on an average cost for blank pipe was estimated at Rs. 1120.03 and for labour charges at Rs. 521.43 which constitute about 36.81 and 17.14 per cent of the total cost respectively. The estimates clearly indicate that the total cost of establishment of boring was found lower at large categories of farmers as compared to other categories of farms. The reason behind it was that large farmers possessed larger land area as compared to other categories. They sunk comparatively higher number of borings as

85
compared to small land holding size categories of farms. Therefore, the cost for establishment of boring was also found lower in large categories of farms as compared to other farms. The per farm cost incurred in establishment of boring, at overall level, was Rs. 3263.53. The across farm size analysis indicates that marginal farmers incurred higher amount (Rs. 3609.05) followed by small farmers (Rs. 3326.84) medium categories (Rs. 3210.26) and large farms (Rs. 2368.33). Again in case of large categories of farms the expenditure on establishment of boring was quite low as compared to other categories of farms. The reasons were the same as mentioned earlier in case of per boring establishment cost. The cost of blank pipe at overall level constituted Rs. 1106.91 (33.92 % of the total cost). The next component which constituted higher amount after blank pipe was estimated for labour charges which was Rs. 549.51 (16.84 % of the totals cost) per farm. It reveals that the cost of blank pipe and labour charges are the major components, which constituted together nearly by 50 per cent of the total cost. The above analysis clearly indicates that across the farm size costs for establishing bamboo boring was found varying with the variation in the farm size. Because it was for those farms which possessed lower number of borings and whose establishment costs were higher than larger number of boring owners. After establishment of borings, farmers were to lift the water through pumping machines. Therefore, it is necessary here to work out the pumping costs. For calculating pumping costs the total costs were divided into two parts i.e. fixed cost and operating cost and then sum of all costs. The cost of pumping across the farms on per boring basis consisted of fixed and operating costs. On overall basis the fixed cost was estimated at Rs. 1259.97 per boring which accounted for only 5.55 per cent of the total costs. Operating cost is calculated at Rs. 21435.53 per boring, accounted for 94.45 per cent of the total cost. It clearly shows that the operating cost is major component of total pumping cost as it involves fuel consumption, maintenance of pumps’ engine, wages paid to operators and others. Out of the operating cost, the cost of fuel is larger, which forms nearly 88.60 per cent of the total cost. It means that the diesel run pumps are costlier in operation. Moreover, the cost of pumping varies across the farms. It is larger in case of large farms (Rs. 31447.41) and lower in case of marginal farms (Rs. 19430.50). The data further reveal that it increases with the increase of farm sizes. It may due to greater use of pumping devices by the large farms. The cost of pumping across the farms on per farm basis was found Rs. 123025.30 comprising fixed cost as Rs. 1340.49 per farm (5.82 % of the total pumping cost) and operating cost at Rs. 21684.81 per farm (94.18 % of the total pumping cost). It clearly indicates that operational costs constitute

86
the major portion of the cost of pumping. But the cost of pumping varies across the farms. It is estimated at Rs. 17963.93 per farm on large farms, Rs. 21436.60 per farm on medium farms, Rs. 23418.77 per farm on small farms and Rs. 217840.44 per farm on marginal farms. It clearly reveals that smaller the farm higher the cost of pump and larger the farm lower the cost of pump. It is due to the fact that large farm uses the pump on larger scale. The returns from the pump across the farm sizes on per farm basis reveal that on the overall basis, per rupee return is estimated at Rs. 2.36. But it varies across the farms. It is estimated at Rs. 2.42 on large farms, Rs. 2.37 on medium farms, Rs. 2.34 on small farms and Rs. 2.33 on marginal farms. It reveal that larger the farms, higher the return. Moreover, it can be concluded that the return from pumping is always more than double to the amount of investment, which testifies that this device is economically viable. The returns from the pump across the farm sizes on per boring basis reveals that on overall basis the per rupee return is estimated at Rs. 220. But, it varies across the farms. It is estimated at Rs. 2.42 on large farms, Rs. 1.67 on medium farms, Rs. 2.39 on small farms and Rs. 2.33 on marginal farms. It reveals that the returns on per boring are different across the farms. It is larger on large farms followed by small farms, marginal farms and medium farms. Moreover, it may be concluded that the return on per rupee varied between Rs. 1.67 to Rs. 2.42. It signifies that the return from pumping devices on per boring basis is always profitable. Thus, the device on per boring basis is also feasible. 5.14 Bamboo Boring Vs. Shallow Tube-Well For a comparative analysis of bamboo boring and shallow tubewell, cost benefit ratio has been worked out, which reveals that sinking of bamboo boring is cheaper by 44.92 per cent over shallow tube-wells. The estimated installation costs of bamboo boring and shallow tube wells were Rs. 3041 and Rs. 6770 respectively. However, labour cost was found higher in case of bamboo boring (Rs. 525) over shallow tube-well (Rs. 385). But the costs of materials, supervision and overhead charges were lower in case of bamboo boring over shallow tube-wells. The per rupee return on bamboo boring has been calculated at Rs. 2.36 whereas in case of shallow tube-well it was Rs. 1.71. Thus, both the devices are feasible and profitable in the region. But in case of bamboo boring it is more economical especially for small and marginal farmers in the region. 5.15 Impact on G. C. A. and cropping intensity The impact of bamboo boring on the gross cropped area and the cropping intensity shows that on overall basis the gross cropped area and the cropping intensity of the sample farms have increased by 59.52 per cent. But, it varies across the farms. It is larger at marginal farms (66.55 %)

87
followed by large farms (58.52 %), small farms (58.40 %) and medium farms (56.25 %). It indicates that the cropping intensity has increased by more than 50 per cent on all the farms, which testifies that the bamboo boring devices in the sample area is playing a catalytic role in promoting the overall agricultural growth in the gross cropped area.
5.16 Impact on Income The net incremental income after the installation of bamboo boring has been measured on the basis of estimated value of output before and after installation of the bamboo tubewell. The gross value of output before BTW was estimated at Rs. 20179.43 per ha. on all farms. However, it varies across the farms. It increases with the increase of farm sizes. Likewise, the value of output after BTW has been estimated at Rs. 26072.02 per ha. on all farms. It also varies across the farms and moreover it indicates that it increases with the increase in the size of farms. On the basis of these two figures the percentage net increment over BTW has also been drawn. The gross income has increased by 29.20 per cent on all farms. It was found a little higher in case of large farms (30.28 %) followed by marginal farms (29.26 %), medium farms (29.20 %) small farms (28.13 %). It clearly indicates that the income accrued to the sample farms after the installation of BTW is a positive sign of the benefits of BTW in the study area. 5.17 Impact on employment The impact of BTW has also been assessed on employment level of the sample farms. The employment generated for human labour of per hectare of net sown area was found at 52.71 mandays, consisting of 27.29 mandays for family labours and 25.42 mandays for hired labour. But it varies across the farms it is higher at 61.75 mandays on marginal farms followed by 56.84 mandays on small farms, 53.19 mandays on medium farms and 48.26 mandays on large farms. It clearly indicates that smaller the farm size larger the mandays utilized in case of total mandays generated and family labours engaged. In case of hired labour, it was found increasing with the increase in the farm size. It is due to the fact that marginal and small farmers mostly engaged themselves as family labour due to smaller size of holdings whereas medium and large farms engaged hired labour on larger scale as they did not engage themselves in the agricultural activities. Besides above the increase in employment level has also been assessed on per unit basis, which has been estimated at 76.29 mandays on overall basis, constituting 34.12 mandays as family labour and 42.17 mandays as hired labour. The data on distribution of family and hired labour in total employment reveal that it decreases with the increase of farm size for both family labour and hired labour. Summing up, on the basis of the above analysis it can be concluded that the bamboo tube-well is a very successful irrigational device in the study area as

88
the soil and water table available in the project area are most suited for this device. Hence the suitability of bamboo boring is justified in the project area. As regards the feasibility, the returns were found always higher than the investment. Therefore, it indicates that the device is economically feasible in the project area. In regard to its sustainability, the study finds that the life of boring is not longer due to its traditional method of sinking and usages of cheaper materials. But its sustainability may be ensured by making some modification or adoption of scientific method of sinking as well as the usage of quality materials. Moreover, its desirability is unquestionable on account of being a low – cost device and having positive impact on income, employment and production of crop in the study area, which is agriculturally a slow and backward region in the state. But the devices and farmers are not free from the constraints. 5.18 Constraints In course of field survey, it has been observed that there are various constraints, which are being faced by the sample respondents in regards to installation, lifting of ground – water, maintenance and operation of bamboo boring in the study area. These constraints are enumerated below : (a) Constraints in Installation of Bamboo Boring : The main constraints during installation of bamboo boring are (i) lack of Government subsidy and aid (ii) poor supply of electricity (iii) high cost of input like iron pipe, reflex, motor (diesel or electric) (iv) high cost of shinking, and (v) lack of co-operation from Government officials. (b) Constraints in lifting ground water : Although ground water is available within the depth of 40 – 50 fit, but due to high cost of diesel / k. oil, poor power supply, etc. farmers full difficult in making effective use of bamboo boring for irrigating their field. (c) Constraints in maintenance of bamboo – boring : Though its maintenance is too easy and very less inputs are required, sometimes it very difficult to keep constant vigil on the Bamboo Boring due to the nefarious attitude of some anti – social elements who use to drop stone pieces in the boring proved and thus nor its usefulness. Another important constrains in maintenance of Bamboo Boring has been found the rotting of bamboo pieces within 5 years. (d) Constraints in operation of bamboo – boring : Generally farmers do not use the reflex in their boring due to high cost of reflex. Regular use of boring without reflex socket hammered the bamboo used in boring and destroyed the net (plastic) and bamboo also. Thus, the life of Bamboo–Boring is reduced to 5 -6 years.

89
5.19 Policy Prescriptions On the basis of both quantitative and qualitative data and discussions held with sample respondents and experts following policy prescriptions may be pinpointed : • Technological Back-up Most of the sample farmers were found using the devices in a traditional manner, whereas technological up gradation is warranted, which can be made available by the concerned department, i.e., Minor Irrigation. The department has a promotional role to play in transferring the technology from lab to land. The life of the bamboo boring can be enhanced by the use of ‘Reflux’ which is most popularly and profitably used in adjoining district. But the same was not found to be conspicuous by its absence in the study area. Thus, it has to be accorded top priority. Besides above other technological back-up like ticking system etc. is essential with a view to enhancing the life and workability of bamboo boring. • Financial Back-up Most of the sample farmers were found to belong to the group of marginal and small farmers (68.33 %), with inadequate capital base of their own. Hence efforts have to be made to provide credit to them, if subsidy is not feasible. Under such circumstances, a financial back-up is essential, which can be provided to them by PACS and Commercial Banks/RRBs at a concessional rate of interest. In order to overcome this problem, NABARD may be approached for directing its grassroots lending institutions to provide credit for the same. • Human back-up Above all, human back-up is rather more important to reap the benefits from this device. In course of survey, it was observed that the boring is filled up and clogged by some nefarious or zealous or anti-social elements. It needs to be urgently checked by way of mass awareness, campaign. Besides, some social and legal recourse may also be adopted. Moreover, bureaucrats/technocrats should also involve themselves in promoting the technology in the spirit of regional development and prosperity. • Power Backup It was also observed from the field survey that either lack of electrification or erratic supply to the electrified village used to cause a major problem to the sample farms in operating the pump sets. In absence of electricity farmers were found using diesel to run the pump set, which accounted for nearly 88 per cent of operational costs. Hence villages having BTWs must be ensured regular power supply which will activate small and marginal farmers who are unable to afford diesel cost to run the pump set.
GGGGGG

90
BIBLIOGRAPHY
¾ A. N. Sinh, Institute of Social Studies, Patna – Agro Economic Survey of Bihar : A Pilot Study. ¾ Appu, P. S.; Bamboo Tube-well : A Low Cost Device for Exploiting Ground Water. ¾ Banerjee, N. N.;Report on the Possibility of Extending Well – Irrigation in Bihar and Chotanagpur, Calcutta 1907. ¾ Bose, S. R. & Ghosh, P. P.; Agro – Economic Survey of Bihar : Pilot Study, Patna, 1976. ¾ Dhawan, B. D. ; Irrigation in India’s Agricultural Development, 1994. ¾ Ghosh, G. K.; Water of India (Quality and Quantity), 2002 ¾ Government of Bihar; Second Bihar State Irrigation Commission, 1994, Vol. VI. ¾ India, Department of Agriculture, - Minor Irrigation, Delhi, 1965. ¾ India, Ministry of Community Development; Principles and Practice of Minor Irrigation in India, Delhi, 1975. ¾ Jha, U. M.; Irrigation and Agricultural Development. Deep and Deep Publication, New Delhi, (1984) ¾ Mahajan, Gautam; Evaluation and Development of Ground Water, 1989. ¾ Mahajan, Gautam; Ground Water Surveys and Investigation, 1995. ¾ Merriam, John L.; Irrigation System Evaluation and Improvement. ¾ Mollinga, Peter P.; Water for Food and Rural Development, 2000. ¾ Mukhopadhaya, A.; “Benefit cost Analysis of Alternative Tube-well Irrigation Projects in Nadia District of W. Bengal”, Indian Journal of Agricultural; Economics, 1973, P. 196 ¾ NABARD, Economic Analysis and publication Department, Bombay, Bamboo and Shallow Tube-wells in Purnea District, Bihar, 1998.

91
¾ NABARD, Regional Office, Patna; Shallow Tube-well in Darbhanga, Madhubani and Samastipur District, Bihar, 1988. ¾ NABARD, Regional Office, Patna; Deep Tube-wells in Bihar, 1989. ¾ Pathak, B. D.; “Ground Water Resources and Development Potential in India”, Central Ground Water Board, Government of India, 1982, P. 1. ¾ Pathak, B. D.; Op. Cite, P. 6. ¾ Saksena, R. S.; “Ground Water Potential of India and Present Status of Developments”, Proceedings, Seminar on Ground Water Development, Indian Water Resources Society, Roorkee, U. P., India, 1983, P. 99. ¾ Sharma, I.; Water Management in a Drought Prone Area : Palamau (With Special Reference to D. P. A. P. Schemes) Unpublished Ph. D. Thesis, Patna, University, Patna, 1982, P. 135. ¾ Shukla,S. K. & Srivastava, P. R.; Water Resources Planning and Development, 1992. ¾ Verma, Binoy N.; Flood Devastation Agricultural Development in Eastern India, Vol. I, 1998.

92
ANNEXURE - I
C O M M E N T S O N T H E D R A FT R E P O R T
No. 0 - 15012 / 91 / 01 - SER Government of India
Planning Commission (SER Division)
Yojana Bhavan, Sansad Marg,
New Delhi, dated 15.10.2003 The Registrar, Tilkamanjhi Bhagalpur University Bhagalpur - 812007 Subject : Study on "Economics of Bamboo Boring : A Study of the North East Region of Bihar" - regarding. Sir, The draft report of the above mentioned study submitted by you has been examined and the comments of the Planning Commission are as follows : (i) The sustainability of bamboo boring in North east region as well as other regions of Bihar and other part of the country needs to be enunciated. (ii) Photographs for different components of bamboo boring may also be furnished. (iii) The research study has compared the two scenarios, one for bamboo boring and other without bamboo boring. However, the cost benefits, etc. needs to be compared with bamboo boring and STW. Similarly the component of friction is more in bamboo boring accordingly will effect on pump efficiency as compared to EI & PVC pipe. This needs to be compared. (iv) The economics of bamboo boring purpose gets defeated if it is not compared with shallow tube-wells. You are requested to finalise the report after incorporating the above observations. The 2nd instalment of the study is being released.
Yours faithfully
Sd/- (P. K. Aggarwal)
Deputy Adviser (SER)
93
ANNEXURE - II
ACTION TAKEN REPORT (i) Action taken in accordance with the comments (Chapter - I, Section - 1.5, Page Nos. - 13 - 15) (ii) Action taken in accordance with the comments (Chapter - IV, Page Nos. 51 (a) to 51 (d) (iii & iv) Action taken in accordance with the comments (Chapter - IV, Section 4.6 & 4.7, Page Nos. 62 - 68) (U. M. Jha) Principal Investigator