ECONOMICS KNOWLEDGE INTENSIVE BUSINESS SERVICES AND THEIR ... · ECONOMICS . KNOWLEDGE INTENSIVE...
35
ECONOMICS KNOWLEDGE INTENSIVE BUSINESS SERVICES AND THEIR IMPACT ON INNOVATION IN CHINA by Xing Shi and Dingtao Zhao School of Management University of Science and Technology of China and Yanrui WU Business School University of Western Australia DISCUSSION PAPER 13.19
Transcript of ECONOMICS KNOWLEDGE INTENSIVE BUSINESS SERVICES AND THEIR ... · ECONOMICS . KNOWLEDGE INTENSIVE...
ECONOMICS
KNOWLEDGE INTENSIVE BUSINESS SERVICES AND THEIR IMPACT ON INNOVATION IN CHINA
by
Xing Shi
and
Dingtao Zhao
School of Management University of Science and Technology of China
and
Yanrui WU
Business School University of Western Australia
DISCUSSION PAPER 13.19
KNOWLEDGE INTENSIVE BUSINESS SERVICES AND THEIR IMPACT ON INNOVATION IN CHINA
Xing SHI1, 2, Yanrui WU2*, Dingtao ZHAO1
1. School of Management, University of Science and Technology of China
2. Economics (M251), Business School, University of Western Australia
DISCUSSION PAPER 13.19
Abstract: This paper aims to examine the impact of knowledge intensive business
services (KIBS) on innovation in China. First, we review the development of KIBS in
China by analysing the agglomeration, utilization and quality of KIBS. Second,
regression techniques are employed to investigate the impact of KIBS on innovation
in the Chinese economy. We found that KIBS are becoming a major force in
promoting innovation, especially in eastern China. Furthermore, we also found that
the effect of KIBS on innovation is highly related to the average level of human
capital. Given the findings in this study, we made some policy suggestions.
Key words: Agglomeration; Innovation; Knowledge intensive business services
JEL codes: L80; O14; O30
*Corresponding author: Professor Yanrui Wu ([email protected]). We acknowledge the generous financial support from the China Scholarship Council and Australian Research Council (DP1092913), and helpful comments from three anonymous referees.
1. Introduction
While many studies on technological innovation are focused on the manufacturing
industry, the service industry has been virtually ignored for a long time. With the
pioneering works of Barras (1986) and Gershuny and Miles (1983), services attracted
the attention of researchers in innovation studies during the eighties. But it was in the
nineties that researchers’ interest in services expanded. Among a variety of service
activities, the knowledge-intensive business services (KIBS) are of special interest. In
general KIBS refer to those services which are mainly concerned with providing
knowledge-intensive inputs to the business processes of other organisations, including
both private and public sector clients. Examples include the advertising, marketing,
financial services, consultancy services and other research-related services. These
services are special due to their close relationship with knowledge and they are often
considered as one of the hallmarks of the knowledge-based economy. The roles of
KIBS in innovation systems usually involve (a) knowledge exchange; (b) knowledge
provision; and (c) knowledge transfer (Miles 2005). Muller and Zenker (2001)
pointed out that KIBS act as co-producers and initiators of innovation. Wood (2002)
argued that the context-specific relationships between KIBS and their clients cause
the spatial agglomeration of KIBS. These studies showed three key dimensions of
KIBS, namely, knowledge, innovation and agglomeration (Muller and Doloreux
2009). In other words, KIBS are highly related to knowledge, can improve innovation
greatly and tend to concentrate in metropolitan areas.
To sustain China’s rapid economic growth, enhancing the country’s innovative
capacity has become the key to adjusting the industrial structure and in changing the
economic growth pattern of China. Porter (1990) argues that innovative capacity is
essential to productivity and that competitiveness can be equated with productivity.
1
Based on this argument, KIBS play an important role in promoting economic
competitiveness and growth. In recent years, the KIBS industries have been booming
in China, although they are still far behind the same industries in developed countries.
Thus, to better understand the contribution of KIBS to innovation and regional
disparity in the Chinese context, a number of questions are explored in this paper.
Namely, to what extent do KIBS promote China’s innovative capacity? Does the
average level of human capital affect the performance of KIBS?
This study first measures the agglomeration, utilization and quality of KIBS in
China, and then reviews the growing history and regional development of the KIBS
industry. Furthermore, we investigate the impact of KIBS on the output of innovation.
Wood (1998) indicated that the growing role of KIBS appears to be an opportunity for
developed regions and a threat for peripheral regions. A knowledge-based regional
polarization is currently taking place, in which KIBS play a pivotal role (Wood 2005).
Therefore, regional disparity is also considered in this study.
In the section that follows, we provide an overview of the literature with regard to
KIBS and their impact. The third section presents the econometric models. After that,
data issues and preliminary analysis of KIBS in China are provided in Section 4.
Empirical analysis and some discussions are presented in the fifth section, while in
Section 6 we examine the robustness of our findings. Finally, a conclusion and policy
suggestions are provided in Section 7.
2. Conceptual Issues and Relevant Literature
The definition of KIBS is still being debated (Wood 2002). Miles et al. (1995) defined
the KIBS industries using three criteria. First, KIBS refer to private companies or
organisations. Second, their business activities are based on professional knowledge
(related to a specific technical discipline or technical functional domain). Third, KIBS
2
supply knowledge-based intermediate inputs. Den Hertog (2000) stated that KIBS
form a category of service activities which is often highly innovative in its own right
and facilitates innovation in other economic sectors such as industrial and
manufacturing sectors. According to the definition by Bettencourt el al. (2002), KIBS
are considered as “enterprises whose primary value-added activities consist of the
accumulation, creation, or dissemination of knowledge for the purpose of developing
a customized service or product solution to satisfy the client’s needs”. As for the
specific categorization of KIBS, the nomenclature often follows the National
Classification of Economic Activities which has been adopted by the European Union
and become increasingly popular for identifying KIBS in Europe.1 According to this
classification system, the KIBS sectors primarily include
o computers and related activities: two digit code 72 including six subsectors at
the three digit level, namely the hardware consultancy (721), software
consultancy and supply (722), data processing (723), database activities (724),
maintenance and repair of office, accounting and computing machinery (725),
and other computer-related activities (726);
o research and development: two digit code 73 including two subsectors at the
three digit level, namely research and experimental development in natural
sciences and engineering (731) and research and experimental development in
social sciences and humanities (732); and
o other business services: two digit code 74 including four subsectors at the
three digit level, namely legal, accounting, book-keeping and auditing
activities; tax consultancy; market research and public opinion polling;
business and management consultancy; holdings (741), architecture and
1 For details, see “NACE Rev. 2: Statistical classification of economic activities” published by Eurostat, European Commission (http://epp.eurostat.ec.europa.eu/portal/page/portal/eurostat).
3
engineering activities and related technical consultancy (742), technical testing
and analysis (743) and advertising (744).2
Among the above definitions reviewed, three core elements can be identified
(Muller and Doloreux 2009). First, KIBS are related to “business services” or
specialised services which are demanded by firms and public organisations and are
not produced for private consumption (Strambach 2001). Second the phrase being
“knowledge intensive” can be interpreted in terms of either labor qualification (Miles
2005) or the conditions for transactions between the service providers and the service
users or procurers (Hauknes 1999). Finally, “knowledge intensive firms” refer to the
firms that undertake complex operations of an intellectual nature in which human
capital is the dominant factor (Alvesson 1995).
The existing definitions of KIBS show the importance of knowledge which can
be regarded as a kind of dynamic combination of organised experience, values, related
information and insight (Starbuck 1992, Nonaka and Toyama 2003). Knowledge can
be divided into two types, namely, the codified knowledge and tacit knowledge
(Nonaka et al. 1995; Polanyi 1967). The codified knowledge can be recorded by
media or carried by language. Thus it is easy to transfer and manage the codified
knowledge. Tacit knowledge is the informal knowledge which is hard to describe or
capture by media and language, and which can only be acquired through informal
learning process and is relate to individual’s experience, feeling and opinion.
Therefore, in comparison with the codified knowledge, it is more difficult to obtain
the tacit knowledge. However, to understand and explain the codified knowledge
needs the tacit knowledge. KIBS combine various types of highly specialized
knowledge, both codified and tacit, in order to develop problem-specific solutions,
2 This list is compiled by Muller and Doloreux (2009).
4
thus increasing the exchange of otherwise disconnected pools of knowledge, and
provide professional services (Windrum and Tomlinson 1999).
Furthermore, the function of KIBS is also debated. Some authors adopt what can be
described as a management or organizational perspective, and define the role of KIBS
as the transfer of knowledge to their clients. Examples include Strambach (2001),
Glücker (1999) and Schulz (2000), who emphasised the generation, diffusion and
creation of knowledge through interaction between KIBS and their clients. It is argued
that KIBS not only transfer knowledge and information to the users of their services,
but that their activities can also be considered as collaborative learning processes
(Aslesen and Isaksen 2010). In fact, the resolution of the specific problems facing
client firms may lead to the development of new knowledge (den Hertog 2002). Thus,
the KIBS play an intermediary role for relevant knowledge, specifically the role of
transforming scientific and technical information to tacit knowledge.
Authors also examined KIBS and their role in the process of innovation (den
Hertog 2000; Tether 2005; Camacho and Rodriguez 2008; Naranjo-Valencia et al.
2011). KIBS are assumed to carry out three major functions, acting as the facilitators,
carriers and source of innovation for their client firms (Fischer 2001; Hipp 2000).
Specifically, KIBS act as facilitators of innovation when they collaborate with their
client firms in the innovation process. They function as the carriers of innovation
when they directly participate in innovations by their client firms. Finally, KIBS are
sources of innovation when they generate innovations for their client firms.
The above-mentioned literature emphasised the complementarity between customer
resources and capacities and the external knowledge provided by KIBS (Muller and
Zenker 2001; Tether and Tajar 2008; Cambra-Fierro et al. 2011). By providing
expertise, KIBS represent an interface between their customers and the knowledge
5
base available in the entire economy, and hence are a catalyst for innovation
(Castellacci 2008; Castaldi 2009). In all cases, the provision of knowledge (tacit and
codified) by KIBS is carried out through strong supplier/client interaction (Muller and
Zenker 2001; Mas-Verdu´ 2007). Indeed, the impact of KIBS on innovation will
depend on the type and intensity of the relationship between the organisation
providing the services and the users. For this reason, it seems particularly appropriate
to evaluate the impacts of KIBS on the innovation effort in an economy.
Empirical studies focus on different regions. For example, Rodriguez and Camacho
(2008) evaluated and compared the R&D diffusion role of a group of KIBS in eleven
European countries, with the results showing the existence of a potential
“compensatory” role for the imported high-tech services in some countries.
Mas-Verdu´ et al (2011) considered the drive for innovation in the Spanish economy
and the impacts of KIBS using an input-output framework, finding that KIBS are
significant net generators of innovation. However research on KIBS has mainly
focused on developed countries, with little attention paid to less developed countries
such as China. Although researchers in China are aware of the significant role of
KIBS, they primarily focus on the innovation in KIBS themselves, neglecting the
impacts KIBS have on innovative capacity and economic growth. This paper thus fills
the void in the literature by exploring empirical evidence of the impact of KIBS on
innovation in the context of China as a developing country, introducing the average
level of human capital as a method to test the threshold effect.
3. Methods
The goal of this empirical analysis is to explore the impact of the agglomeration of
KIBS on innovation at the provincial level. For this purpose, we adopt the framework
of the knowledge production function (KPF) introduced by Griliches in 1979. In the
6
KPF framework, knowledge creation is modeled as a functional relationship between
the inputs and outputs of the knowledge production process (Acs et al. 2002). The
concept of KPF has been used to measure the contribution of R&D and knowledge
spillovers to growth in productivity. In the empirical literature, the relationship
between R&D input and output is generally represented through a linear or non-linear
polynomial model (Comanor 1965; Vernon and Gusen 1974; Koeller 1995).
Symbolically,
( )Y f R Xλ ε= + + (1)
where Y is the output of innovation, R is the input of innovation, X is a vector
of control variables, λ is a vector of unknown parameters, and ε represents the
random error term.
In this study, it is assumed that capital ( K ) and labor ( L ) are employed in the
innovation process. The Cobb-Douglas knowledge production function of equation (1)
becomes
k kXY AK L e eλα β ε∑= (2)
where A reflects the efficiency of R&D activities, Xs are the factors affecting the
efficiency of R&D activities and α , β and iλ are parameters to be estimated. In
this study the output of innovation is measured by the number of patents granted. The
capital and labor inputs are defined as the R&D stock and full-time equivalent R&D
personnel, respectively.
Furthermore, we augment equation (2) by introducing KIBS and the average level
of human capital (HC) as control variables. In natural logarithmic form
1 2 3ln ln ln ln it itit it it it it itY A K L KIBS HC KIBS HCα β λ λ λ ε= + + + + + × + (3)
where KIBS refer to the agglomeration of KIBS and HC is the average level of human
capital. These variables will be described in detail in the data section. The subscripts
7
i and t represent the region and time and itε is the stochastic error. This equation
can be estimated using ordinary least squares (OLS). Some econometric issues are
involved and will be discussed in section 5.
4 Data Issues and Preliminary Analysis
The empirical estimation is based on a balanced panel data-set taken from 30 Chinese
regions for the period of 2004-2010 (Tibet is excluded due to missing data). The size
of the full sample is thus 210. All data employed in this research is drawn from the
China Statistical Yearbook (2005-2011) and the China Statistical Yearbook of
Science and Technology (2005-2011). There are three key variables in equation (3),
namely, KIBS , R&D stock (K) and human capital (HC). Our discussion of data issues
focuses on the measurement of these two variables.
Measurement of KIBS
Due to variations in world statistic systems, there is no consensus about the
categorization of KIBS as discussed in Section 2. In this paper we draw information
from the National Industries Classification of China (GB/T 4754-2011) and the
United Nations’ International Standard Industrial Classification of All Economic
Activities, Revision 4 (ISIC Rev. 4. 0). Our choice of data is to some extent dictated
by the availability of Chinese data in this area. To fully use the data available, KIBS
are divided into four major categories and fourteen sub-categories as shown in Table
1. For the purpose of comparison, the codes from the EU and Chinese classification
systems are also presented in Table 1.
8
[Insert Table 1 around here]
Two methods are utilised in this study to measure the agglomeration of KIBS. First,
following the theory of industrial agglomeration, the location quotient (LQ) index is
used to reflect the agglomeration and specialization of KIBS. The equation is
expressed as follow:
1 1 1 1( / ) / ( / )
m n n m
ij ij ij ij ijj i i j
LQ L L L L= = = =
= ∑ ∑ ∑∑
(4)
where ijL represents the employment of industry j in region i , m is the
number of industries and n is the number of regions. One of the channels through
which the KIBS promote the diffusion of knowledge and innovation is through labor
mobility. For this reason, the quantity of employment is used in equation (4). To
present an alternative way of measuring agglomeration, the density of employment is
calculated to measure the spatial density of KIBS.
Employment Density = (Number of Employees) / (Area of the district) (5)
As KIBS are mainly agglomerated in the urban region, the area of the district refers to
the municipal district in each province. Other main variables with descriptive statistics
are detailed in Table 2.
[Insert Table 2 here]
The R&D stock estimates
In this paper, we present R&D stock using the perpetual inventory method (PIM):
1
- 0
0
(1 ) (1 )t
i tt t i
iR E Rδ δ
−
=
= − + −∑ (6)
9
where tR is the R&D stock in period t , t iE − is the R&D expenditure of period
t i− , and δ is the rate of obsolescence of the R&D capital. 0R is the initial level of
R&D stock which is calculated as follows:
10
ERg δ
=+
(7)
where g is the growth rate of E , which is estimated using the arithmetic average
growth rate in the first three years. Following the previous research, the rate of
obsolescence δ is assumed to be 15% (Griliches 1980).
To take inflation into consideration, we have to find a price index to deflate R&D
expenditure. However, in the statistical data available, we are not able to find the
specific data collected according to the spending purpose. Thus, it is a difficult task to
establish a price index of R&D expenditure in the field of innovation economics in
China. Two alternative ways have been adopted to deal with this problem. One
solution is to use the GDP deflator directly (Zhao and Hu 2012). The other one is
based on the argument that the R&D expenditure mainly consists of the R&D
personnel costs and the expenditure of fixed assets. Thus the weighted average of the
consumer price index and the fixed asset price index is an appropriate deflator.
Mathematically,
PI = ωPIc + (1-ω)PIi (8)
where PI is the R&D deflator, PIc and PIi are the consumer and fixed asset price
indices, respectively and ω is the weight. In this paper the second method is chosen.
The weight is assumed to be 0.55 which is widely used in the literature (Kong and Su
2012; Song et al. 2011; Yang and Luo 2011; Li et al. 2008; Zhu and Xu 2003).
10
Measuring human capital
We employ the technique proposed by Barro and Lee (2000) to evaluate the average
level of human capital. We assume that the years of schooling of illiteracy, primary
school (PS), junior high school (JH), senior high school (SH), junior college and
above (JCA) are 0, 6, 9, 12 and 16 years respectively. Thus the average level of
human capital (HC) is calculated as follow:
HC = (ratio of PS)*6 + (ratio of JH)*9 + (ratio of SH)*12 + (ratio of JCA)*16 (9)
where the “ratio” refers to the share of population in each group over the total
population aged 6 and above.
KIBS in China
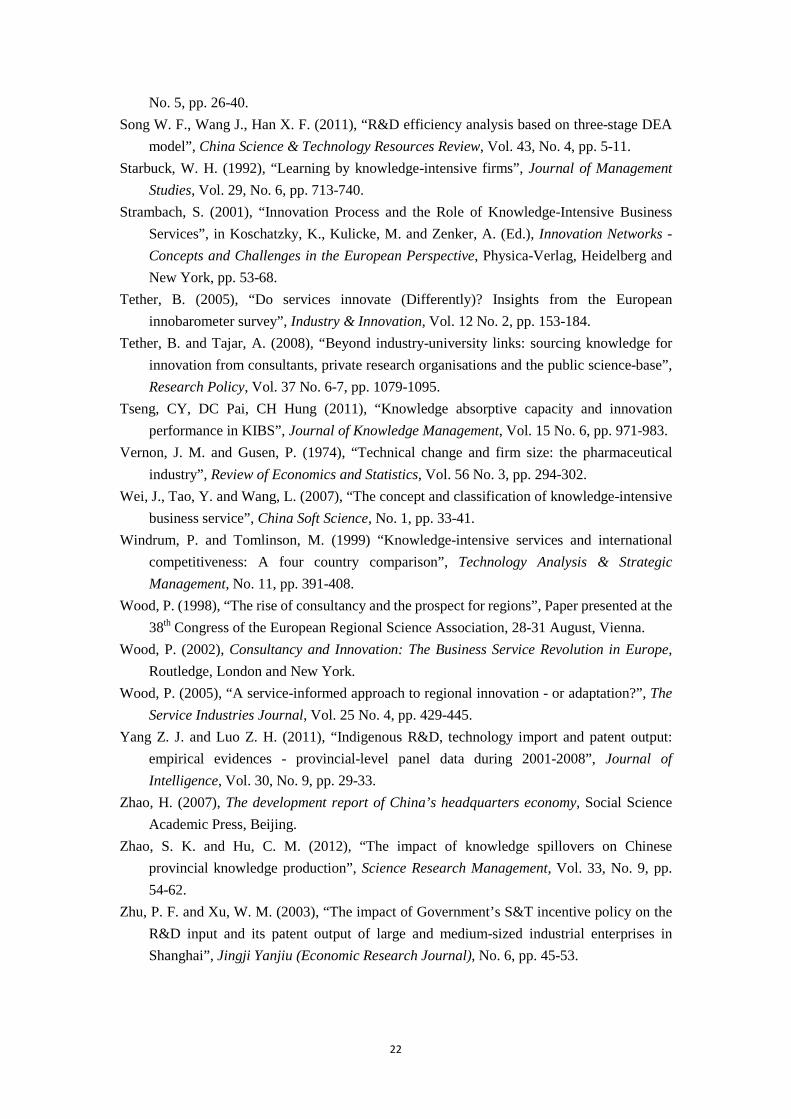
Since China’s reform and opening to international trade, the service industry has
experienced rapid growth which has accelerated the upgrading of industry structure,
contributing to the transformation of the long-term economic growth pattern in China.
This can be seen in Fig. 1, with the ratio of service industry in GDP at about 25% in
1978, increasing to around 45% in 2010. This figure has almost doubled in the past
three decades. The importance of the service industry can be seen to have grown
considerably.
[Insert Figures 1 and 2 here]
However, in comparison with developed countries, there still remains a huge gap.
In Fig. 2, the ratio of service industry employment in developed countries is around
70%, while China’s is just above 30%. This reflects the fact that the service industry
in China is less developed. This is mainly due to the traditional policy of emphasizing
11
material production and ignoring the service sector. It also implies that there is great
potential for service sector growth in China. However another gap, which is even
greater, is seen in the structure of the service sector. In Table 3, although both the
shares of KIBS value-added in GDP and the service industry are growing modestly,
China is still well behind the developed world. In 2006, for example, the share of
KIBS value-added in GDP in China was 9.37%, while comparatively this figure in the
United States was 24.87% (Zhao 2007). In China, the traditional service industries
still occupy the dominant position, while the modern service industries are relatively
underdeveloped. Thus it is a tough task to optimize and upgrade the structure of
China’s service industry by expanding modern services, while still keeping up the
pace of growth in traditional services.
[Insert Table 3 here]
The development of KIBS has obviously been uneven across regions in China. It
can be seen in Fig. 3 that the KIBS are more agglomerated in the eastern region, and
that the LQ index of KIBS in central and western regions are very close, though there
are some fluctuations in the central region.
[Insert Figures 3 and 4 here]
At the provincial level, Fig. 4 shows the ten regions with greatest amount of KIBS
agglomeration. It has been found that the majority of KIBS are clustered in Beijing
(BJ), Shanghai (SH) and Tianjin (TJ), which are all metropolitan cities. Although
economic development in Xinjiang (XJ), Shanxi (WSX) and Qinghai (QH) in western
12
China has been relatively backward, the agglomeration of KIBS in these regions is
high.
5 Empirical Results
The data-set described in the preceding section is applied to the empirical models. The
estimation results are shown in Table 4. We first consider the traditional knowledge
function with labor and capital inputs only. In Models 2 and 3, the KIBS
agglomeration and average level of human capital are introduced separately.
Furthermore, the cross term of the agglomeration and the average level of human
capital is considered in Model 4.
In all of the cases, we conducted Hausman tests. The random effect model is then
adopted if the Hausman test is not significant. If it is found to be significant, the fixed
effect model is more appropriate. In Models 1, 3 and 4, the p values of Hausman test
are less than 0.01; this means the hypothesis that the random effect model is preferred
is rejected. Hence the fixed effect models are used. As for Model 2, the p value of the
Hausman test is greater than 0.10, thus the hypothesis cannot be rejected and the
random effect model is preferable.
[Insert Table 4 here]
In all the models we observe that the elasticity of capital is greater than the labor
input. In Model 2, the p value of the KIBS agglomeration is not significant, which
means that there is no evidence that KIBS affect the innovation output. However in
Model 3, the p value of human capital is 0.000, which is significant at the 1% level.
With the introduction of the cross term between the location quotient and the human
capital measurement, ln(LQ)*ln(HC), the results show that the coefficients of KIBS
13
agglomeration and the cross term are -3.291 and 1.516 respectively. These results are
both very significant. Thus, there is a threshold effect of human capital, with a
threshold value of 2.171 (3.291 / 1.516). The average level for China was 2.135 up
until 2010.
The impact of KIBS on innovation is positive if ln(HC) is greater than 2.171, while
it is negative if ln(HC) is smaller than 2.171. Hence, the impact of KIBS
agglomeration on innovation is associated with a high level of human capital. By
2010, only Beijing (BJ), Tianjin (TJ), Shanxi (SX), Liaoning (LN), Jilin (JL),
Heilongjiang (HLJ), Shanghai (SH) and Guangdong (GD) had reached this standard.
Generally, although the KIBS agglomeration is a significant factor affecting
innovation, its impact is limited and is conditional on the level of human capital
development.
To further analyse the regional disparity of the impact of KIBS on innovation, we
divide China’s 30 provinces into three groups; Eastern China, Central China and
Western China[1]. The separate regression results are shown in Table 5. In eastern
China, the elasticity of the labor input is smaller than that reported in Table 4, while
the elasticity of capital is higher than that in Model 3. The threshold value of human
capital is 2.032 and all the provinces in eastern China meet this standard. For central
China, the elasticity of labor inputs is much higher than that of the other regions. The
threshold value in Central China is 2.045, which is higher than the value for the
Eastern region.
The labor inputs are not significant in western China, while the elasticity of capital
inputs is much lower than in the other regions. The coefficient of the KIBS
[1]Eastern China includes Beijing, Fujian, Guangdong, Hainan, Hebei, Jiangsu, Liaoning, Shandong, Shanghai, Tianjin and Zhejiang Province. Central China includes Anhui, Henan, Heilongjiang, Hubei, Hunan, Jilin, Jiangxi and Shanxi province. Western China includes Gansu, Guangxi, Guizhou, Neimenggu, Ningxia, Qinghai, Shanxi, Sichuan, Xinjiang, Yunnan and Chongqing province.
14
agglomeration variable, human capital and their cross-term are all found to be
statistically significant. The implied threshold level of human capital in the western
region is 2.022. In the western region, Gansu (GS), Guizhou (GZ) and Yunnan (YN)
have failed to meet this criterion.
[Insert Table 5 here]
The above observed disparity is mainly due to the uneven development of the
regional economies. This was caused by the regions’ original status and the different
supporting policies across regions, which should be considered from the evolutionary
perspective (Simmie and Strambach 2006). At the macro level, economic
development conforms to a certain path, and since the economy of eastern China is
better developed, it follows that the service industries will be better involved. At the
micro level, the better economy status and development environment for both
enterprises and talents will definitely attract higher quality firms and human resources,
which will create preferable circumstances for KIBS performance. Central China,
although under the support of the “Central Rise” policy and owning a good base of
science and technology, is confined by its economic base and relative infrastructure
conditions. The western region lags behind in many aspects such as infrastructure,
capital inputs, human capital and technology level. Both the absorption and
innovative capacity are low, thus the agglomeration of KIBS will be a huge driving
force both for upgrading industries and elevating innovation.
15
6. Robustness Tests
In order to check the robustness of our results, we consider different measurements of
key variables to conduct more regressions. We also set the rate of obsolescence as
20% and 10% to test the sensitivity.
Alternative Measure of KIBS by employment density
In the previous analysis, the degree of KIBS agglomeration is measured by the LQ
index, which represents the comparative advantage and degree of specialization of
one industry in one region.
[Insert Table 6 here]
Here we use employment density (ED) to replace the LQ index to test the impact of
KIBS on regional innovation from the view of spatial agglomeration. The definition
of ED is mentioned in section 4. The results are given in Tables 6 and 7. As per prior
research, the Model selection is based on the Hausman test and the details are
specified in tables.
From Table 6, we found that the results are a little bit different. In Model 2, the
coefficient of ED is 0.344 and very significant. But in Model 4, there is no evidence
to support the existence of a threshold effect. Like the regression we conducted
previously, the regional disparity is also considered here. In the eastern region, the
coefficient of the cross term is 1.512. It also shows a high threshold level of human
capital, which is calculated as 2.423. Only Beijing manages to achieve this level.
[Insert Table 7 here]
16
In both Central and Western China, the impacts of KIBS on innovation are
significant, and there is strong evidence of the existence of a threshold level of human
capital at the regional level. The value of the threshold level in Central and Western
China is 2.163 and 2.106 respectively.
Alternative rates of obsolescence: 20% and 10%
We set the rate of obsolescence at 20% and 10% respectively to test the sensitivity. In
Table 8, it is found that the results are quite similar to those from the previous
regression in Table 4, although the elasticity and coefficients are slightly different.
We also test the robustness at the 10% rate. There is no significant difference between
the results. Therefore the detailed results are not shown here.
[Insert Table 8 here]
The regional analysis in Table 9 leads to the same conclusion. The test at the 10%
level is also conducted for this data. It is found that the results are not sensitive to
changes in the rate of obsolescence of R&D stock.
[Insert Table 9 here]
To summarize, our regression results consistently show the positive impact of
KIBS on regional innovation output. KIBS are becoming a major force in promoting
innovation in China. It also can be concluded that the average level of human
resources plays a very important role in determining KIBS performance, and that
there is strong evidence that the threshold effect of human capital exists in China.
17
These findings are robust even if we change the measurement of KIBS agglomeration
or the rate of obsolescence.
7. Conclusion and Policy Suggestions
This study applied regional data to examine the impact of KIBS agglomeration on
innovation and whether the threshold effect of human capital has existed in China in
recent years. It adds to existing literature on KIBS by investigating specifically the
impact of KIBS on innovation in a developing region, and by introducing the
threshold effect of human capital. It also reviewed the current development and
regional distribution of KIBS in China. It is found that KIBS agglomeration affects
innovation output positively and significantly, which is consistent with the theory and
empirical analysis conducted previously. In comparison with developed countries,
KIBS in China are still in the initial stage of development. Furthermore, the
performance of KIBS is highly related to the average level of human capital, with the
threshold level slightly above the mean for these provinces. Thus many regions fail to
meet this criterion. These results, however, are sensitive to the choice of variables as
there may be heterogeneity between variables. Generally, these regressions lead to the
same conclusion, although some coefficients change to a certain extent.
Based on these analyses, we make some policy suggestions. First, the government
should increase the support of KIBS development and learn from the successful
experiences of developed countries (e.g. United States and the United Kingdom) so
that KIBS as an important source of economic growth can be expanded. Second,
different regions should adopt appropriate policies according to the regional reality.
The development of KIBS should meet the demand of other sectors, and both the
services supplied by KIBS and the absorptive ability of the service buyers will
18
determine the innovation diffusion (Tseng et al. 2011). Therefore, the awareness of
cultivating an open innovation system and a mature network should always be kept in
mind. Third, the performance of KIBS is conditional on the level of human capital.
The Chinese government should consciously cultivate and introduce specialists in this
field. Furthermore, KIBS should be considered as being as important as high-tech
industries, because otherwise the backwardness of KIBS will restrict the regional
innovative capacity.
Finally, there are limitations to this research. We concentrated on the KIBS effects
and the role of human capital. There are still other factors that affect the regional
innovation performance. In addition, more in-depth studies can be conducted about
the mechanism of KIBS contribution to innovation when data for different kinds of
innovation output at the city-level becomes available in the future. Furthermore, as a
large developing country, China’s experience may have policy implications for other
developing countries at the similar stage of development. A cross country comparison
or a case study of selected economies would be interesting.
References Acs, Z., Anselin, L. and Varga, A. (2002), “Patents and innovation counts as measures of
regional production of new knowledge”, Research Policy, Vol. 31 No. 7, pp. 1069-1085. Alvesson, M. (1995), Management of Knowledge-intensive Companies, de Gruyter, Berlin and
New York. Aslesen, H. and Isaksen, A. (2010), “Knowledge-intensive business services as knowledge
mediators in different regional contexts: the case of Norway”, in Doloreux, D., Freel, M. and Shearmur, R. (Ed.), Knowledge intensive business services: geography and innovation, Ashgate, Farhham, pp. 99-122.
Barras, R. (1986), “Towards a theory of innovation in services”, Research Policy, Vol. 15 No. 4, pp. 161-173.
Barro, R. J. and Lee, J. W. (2000), “International data on educational attainment: updates and implications”, NBER Working Paper 7911, National Bureau of Economic Research (NBER), September.
Bettencourt, L., Ostrom, A., Brown, S. and Roundtree, R. (2002), “Client co-production in
19
knowledge-intensive business services”, California Management Review, Vol. 44 No. 4, pp. 100-128.
Camacho, J. and Rodriguez, M. (2008), “Patterns of innovation in the service sector: some insights from the Spanish innovation survey”, Economics of Innovation and New Technology, Vol. 17 No. 5, pp. 459-471.
Cambra-Fierro, J., Florin, J., Perez, L. and Whitelock J (2011), “Inter-firm market orientation as antecedent of knowledge transfer, innovation and value creation in networks”, Management Decision, Vol. 49 No. 3, pp. 444-467.
Castaldi, C. (2009), “The relative weight of manufacturing and services in Europe: an innovation perspective”, Technological Forecasting and Social Change, Vol. 76 No. 6, pp 709-722.
Castellacci, F. (2008), “Technological paradigms, regimes and trajectories: manufacturing and service industries in a new taxonomy of sectoral patterns of innovation”, Research Policy, Vol. 37 No. 6-7, pp. 978-994.
Comanor, W. S. (1965), “Research and technical change in the pharmaceutical industry”, Review of Economics and Statistics, Vol. 47 No. 2, pp. 182-190.
den Hertog, P. (2000), “Knowledge-intensive business services as co-producers of innovation”, International Journal of Innovation Management, Vol. 4 No. 4, pp. 491-528.
den Hertog, P. (2002), “Co-producers of innovation: on the role of knowledge-intensive business services in innovation”, in Gadrey, J. and Gallouj, F. (Ed.), Productivity innovation and knowledge in services: New Economic and Socio-economic Approaches, Edward Elgar, Cheltenham and Massachusetts, pp. 233-255.
Fischer, M. M. (2001), “Innovation, knowledge creation and systems of innovation”, Annals of Regional Science, Vol. 35 No. 2, pp. 199-216.
Gershuny, J. and Miles, I. (1983) The New Service Economy: The Transformation of Employment in Industrial Societies, Pinter, London.
Glückler, J. (1999), “Management consulting-structure and growth of a knowledge intensive business service market in Europe”, IWSG Working Papers 12-1999, Institut für Wirtschafts- und Sozialgeographie, Department of Economic and Social Geography, Johann Wolfgang Goethe-Universität Frankfurt.
Griliches, Z. (1979), “Issues in assessing the contribution of research and development to productivity growth”, Bell Journal of Economics, Vol. 10 No. 1, pp. 92-116.
Griliches, Z. (1980), “R&D and productivity slowdown”, American Economic Review, Vol. 70 No. 2, pp. 343-348.
Hauknes J. (1999), “Knowledge intensive services - what is their role?” Paper presented at the OECD Forum on Realising the Potential of the Service Economy, 28 September, Paris.
Hipp, C. (2000), “Information Flows and Knowledge Creation in Knowledge-Intensive Business Services: Scheme for a Conceptualization”, in Metcalfe, J. S. and Miles, I. (Ed.), Innovation Systems in the Services Economy: Measurement and Case Study Analysis, Kluwer Academic Publishers, Boston, pp. 149-167.
Koeller, C. T. (1995), “Innovation, market structure and firm size: a simultaneous equations model”, Managerial and Decision Economics, Vol. 16 No. 3, pp. 259-269.
20

Kong, W. J. and Su, W. H. (2012), “Intellectual property right protection, international technology spillover, and economic growth”, Science Research Management, Vol. 33, No. 6, pp. 120-127.
Li X. P., Lu X. X. and Zhu Z. D. (2008), “International trade, technological progress and productivity growth of Chinese industries”, China Economic Quarterly, Vol. 7, No. 2, 549-564.
Mas-Verdu´, F. (2007), “Services and innovation systems: European models of technology centres”, Service Business, Vol. 1 No. 1, pp. 7-23.
Mas-Verdu´, F., Wensley, A., Alba, M., Alvarez-Coque, J. M. G. (2011), “How much does KIBS contribute to the generation and diffusion of innovation?”, Service Business, Vol. 5 No. 3, pp. 195-212.
Miles, I. (2005), “Knowledge intensive business services: prospects and policies”, Foresight, Vol. 7 No. 6, pp. 39-63.
Miles, I., Kastrinos, N., Flanagan, K., Bilderbeek, R., den Hertog, P., Huitink, W. and Bouman, M. (1995), “Knowledge intensive business services: their role as users, carriers and sources of innovation”, EIMS Publication No. 15, Innovation Programme, DGXIII, Luxembourg.
Muller, E. and Doloreux, D. (2009), “What we should know about knowledge-intensive business services”, Technology in Society, Vol. 31 No. 1, pp. 64-72.
Muller, E. and Zenker, A. (2001), “Business services as actors of knowledge transformation: the role of KIBS in regional and national innovation systems”, Research Policy, Vol. 30 No. 9, pp. 1501-1516.
Naranjo-Valencia, J., Jime´nez-Jime´nez, D. and Sanz-Valle, R. (2011), “Innovation or imitation? The role of organizational culture”, Management Decision, Vol. 49 No. 1, pp. 55-72.
Nonaka, I. and Takeuchi, H. (1995), The knowledge creating company: how Japanese companie create the dynamics of innovation, Oxford University Press, New York.
Nonaka, I. and R. Toyama (2003), “The knowledge-creating theory revisited: knowledge creation as a synthesizing process”, Knowledge Management Research and Practice, Vol. 1, No. 1, pp. 2-10.
Polanyi, M. (1967), The tacit dimension, Routledge & Kegan Paul, London. Porter, M. (1990), “The competitive advantage of nations”, Harvard Business Review, Vol. 68
No. 2, pp.73-93. Rodriguez, M. and Camacho, J. (2008), “Are KIBS more than intermediate inputs? An
examination into their R&D diffuser role in Europe”, International Journal of Service Technology Management, Vol. 10 No. 2-4, pp. 254-272.
Schulz, C. (2000), “Environmental service-providers, knowledge transfer, and the greening of industry”, Presented at IGU Commission on the Organization of Industrial Space Annual Residential Conference: Industry, Knowledge and Environment, 8-12 August, Dongguan China,.
Simmie J., Strambach S. (2006), “The contribution of KIBS to innovation in cities: an evolutionary and institutional perspective”, Journal of Knowledge Management, Vol. 10
21
No. 5, pp. 26-40. Song W. F., Wang J., Han X. F. (2011), “R&D efficiency analysis based on three-stage DEA
model”, China Science & Technology Resources Review, Vol. 43, No. 4, pp. 5-11. Starbuck, W. H. (1992), “Learning by knowledge-intensive firms”, Journal of Management
Studies, Vol. 29, No. 6, pp. 713-740. Strambach, S. (2001), “Innovation Process and the Role of Knowledge-Intensive Business
Services”, in Koschatzky, K., Kulicke, M. and Zenker, A. (Ed.), Innovation Networks - Concepts and Challenges in the European Perspective, Physica-Verlag, Heidelberg and New York, pp. 53-68.
Tether, B. (2005), “Do services innovate (Differently)? Insights from the European innobarometer survey”, Industry & Innovation, Vol. 12 No. 2, pp. 153-184.
Tether, B. and Tajar, A. (2008), “Beyond industry-university links: sourcing knowledge for innovation from consultants, private research organisations and the public science-base”, Research Policy, Vol. 37 No. 6-7, pp. 1079-1095.
Tseng, CY, DC Pai, CH Hung (2011), “Knowledge absorptive capacity and innovation performance in KIBS”, Journal of Knowledge Management, Vol. 15 No. 6, pp. 971-983.
Vernon, J. M. and Gusen, P. (1974), “Technical change and firm size: the pharmaceutical industry”, Review of Economics and Statistics, Vol. 56 No. 3, pp. 294-302.
Wei, J., Tao, Y. and Wang, L. (2007), “The concept and classification of knowledge-intensive business service”, China Soft Science, No. 1, pp. 33-41.
Windrum, P. and Tomlinson, M. (1999) “Knowledge-intensive services and international competitiveness: A four country comparison”, Technology Analysis & Strategic Management, No. 11, pp. 391-408.
Wood, P. (1998), “The rise of consultancy and the prospect for regions”, Paper presented at the 38th Congress of the European Regional Science Association, 28-31 August, Vienna.
Wood, P. (2002), Consultancy and Innovation: The Business Service Revolution in Europe, Routledge, London and New York.
Wood, P. (2005), “A service-informed approach to regional innovation - or adaptation?”, The Service Industries Journal, Vol. 25 No. 4, pp. 429-445.
Yang Z. J. and Luo Z. H. (2011), “Indigenous R&D, technology import and patent output: empirical evidences - provincial-level panel data during 2001-2008”, Journal of Intelligence, Vol. 30, No. 9, pp. 29-33.
Zhao, H. (2007), The development report of China’s headquarters economy, Social Science Academic Press, Beijing.
Zhao, S. K. and Hu, C. M. (2012), “The impact of knowledge spillovers on Chinese provincial knowledge production”, Science Research Management, Vol. 33, No. 9, pp. 54-62.
Zhu, P. F. and Xu, W. M. (2003), “The impact of Government’s S&T incentive policy on the R&D input and its patent output of large and medium-sized industrial enterprises in Shanghai”, Jingji Yanjiu (Economic Research Journal), No. 6, pp. 45-53.
22
Source: China Statistics Yearbook (1979-2011)
Figure 1 Service Industry GDP Shares, 1978-2010
Source: China Statistics Yearbook (2011)
Figure 2 Service Industry Employment Shares in Selected Countries, 2008
23
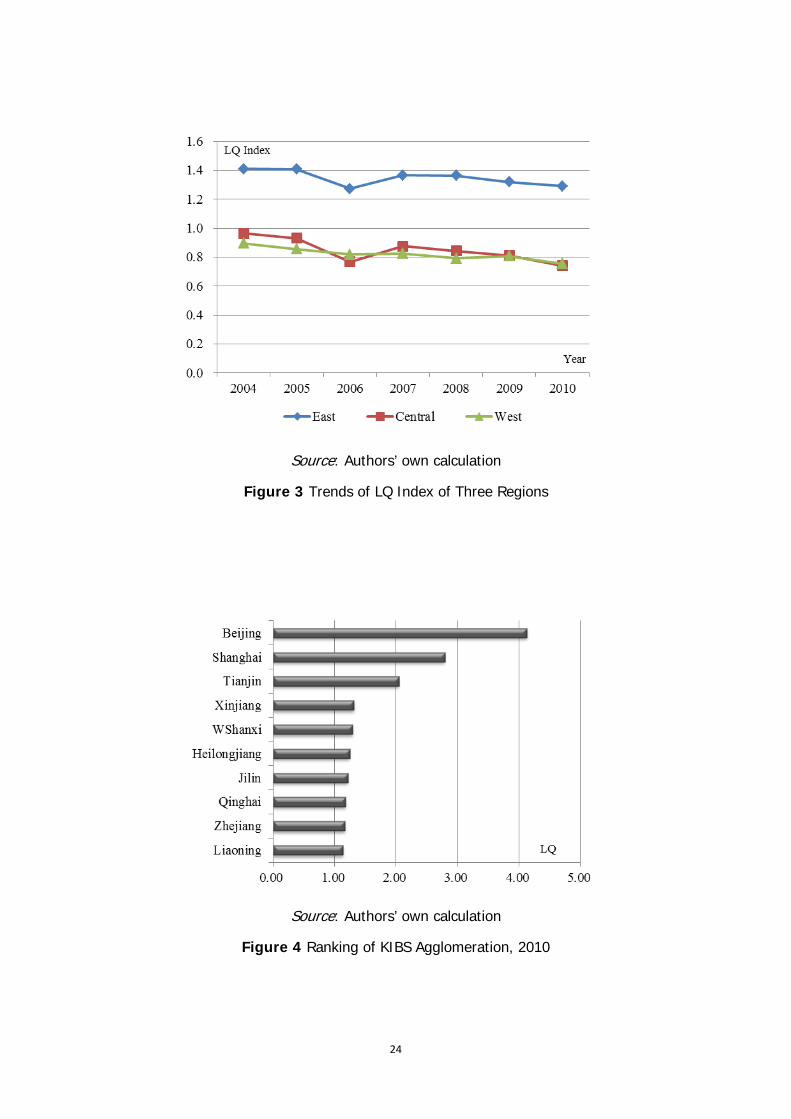
Source: Authors’ own calculation
Figure 3 Trends of LQ Index of Three Regions
Source: Authors’ own calculation
Figure 4 Ranking of KIBS Agglomeration, 2010
24
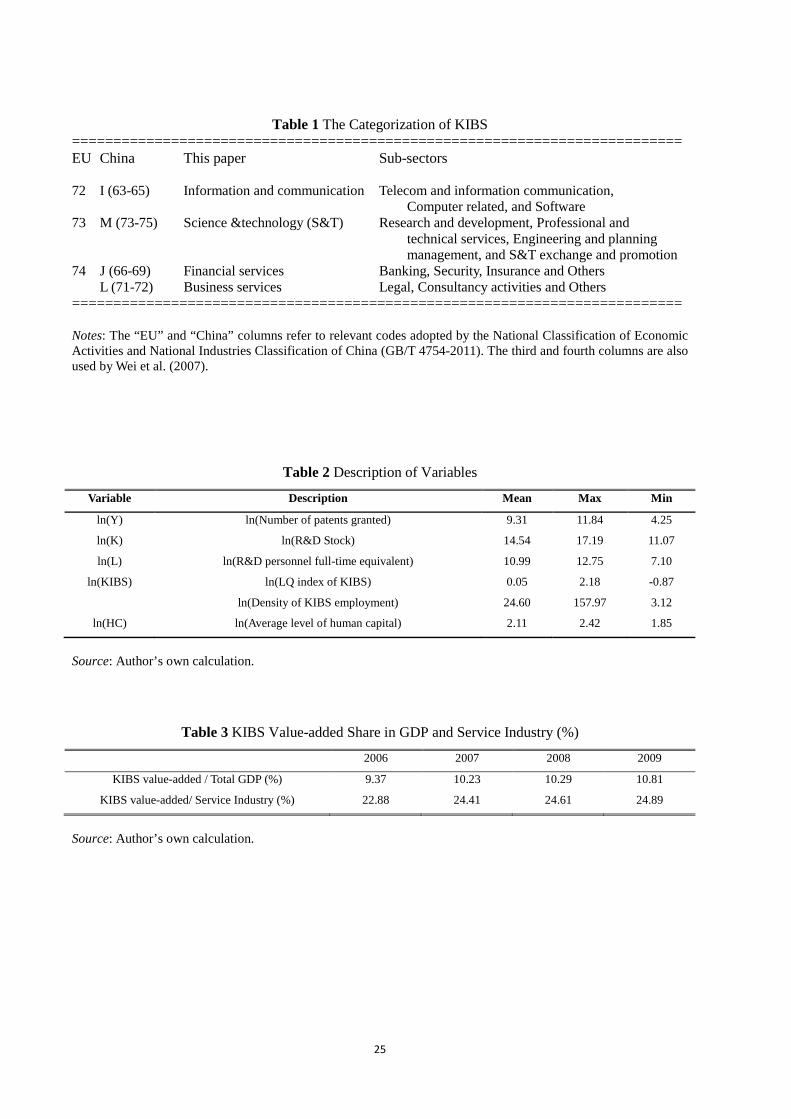
Table 1 The Categorization of KIBS
========================================================================== EU China This paper Sub-sectors 72 I (63-65) Information and communication Telecom and information communication,
Computer related, and Software 73 M (73-75) Science &technology (S&T) Research and development, Professional and
technical services, Engineering and planning management, and S&T exchange and promotion
74 J (66-69) Financial services Banking, Security, Insurance and Others L (71-72) Business services Legal, Consultancy activities and Others ========================================================================== Notes: The “EU” and “China” columns refer to relevant codes adopted by the National Classification of Economic Activities and National Industries Classification of China (GB/T 4754-2011). The third and fourth columns are also used by Wei et al. (2007).
Table 2 Description of Variables
Variable Description Mean Max Min
ln(Y) ln(Number of patents granted) 9.31 11.84 4.25
ln(K) ln(R&D Stock) 14.54 17.19 11.07
ln(L) ln(R&D personnel full-time equivalent) 10.99 12.75 7.10
ln(KIBS) ln(LQ index of KIBS) 0.05 2.18 -0.87
ln(Density of KIBS employment) 24.60 157.97 3.12
ln(HC) ln(Average level of human capital) 2.11 2.42 1.85
Source: Author’s own calculation.
Table 3 KIBS Value-added Share in GDP and Service Industry (%)
2006 2007 2008 2009
KIBS value-added / Total GDP (%) 9.37 10.23 10.29 10.81
KIBS value-added/ Service Industry (%) 22.88 24.41 24.61 24.89
Source: Author’s own calculation.
25
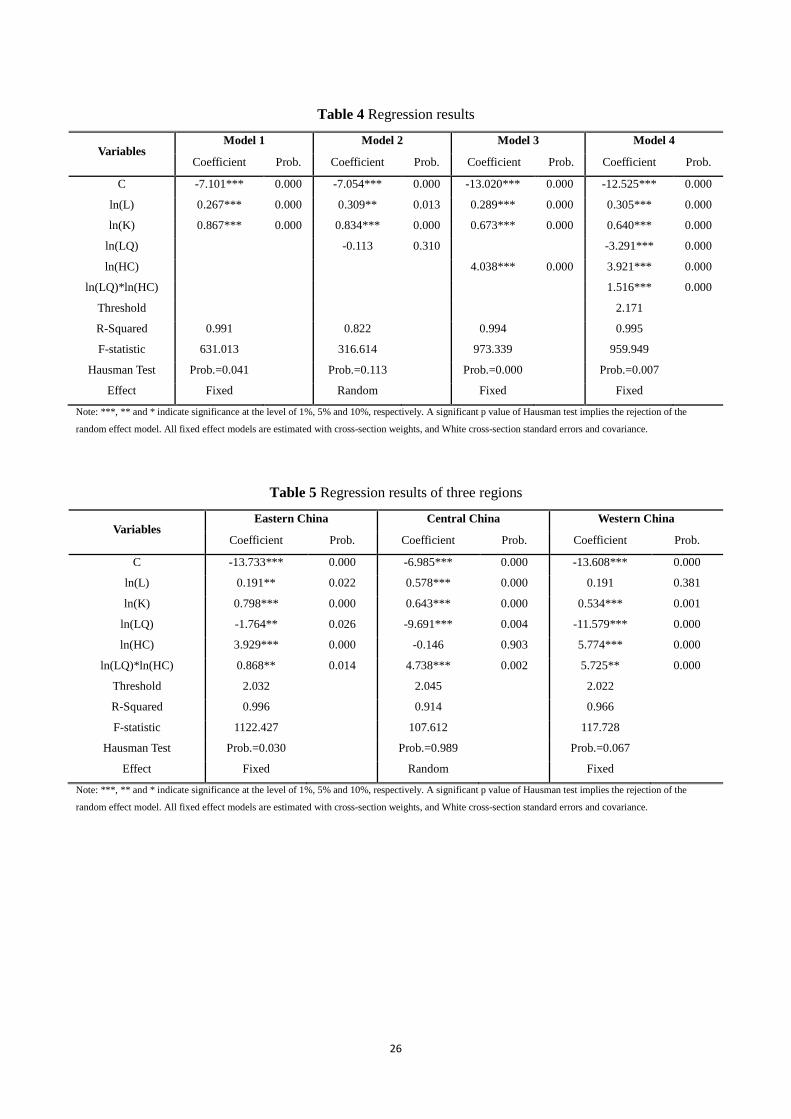
Table 4 Regression results
Variables Model 1 Model 2 Model 3 Model 4
Coefficient Prob. Coefficient Prob. Coefficient Prob. Coefficient Prob.
C -7.101*** 0.000 -7.054*** 0.000 -13.020*** 0.000 -12.525*** 0.000
ln(L) 0.267*** 0.000 0.309** 0.013 0.289*** 0.000 0.305*** 0.000
ln(K) 0.867*** 0.000 0.834*** 0.000 0.673*** 0.000 0.640*** 0.000
ln(LQ) -0.113 0.310 -3.291*** 0.000
ln(HC) 4.038*** 0.000 3.921*** 0.000
ln(LQ)*ln(HC) 1.516*** 0.000
Threshold 2.171
R-Squared 0.991 0.822 0.994 0.995
F-statistic 631.013 316.614 973.339 959.949
Hausman Test Prob.=0.041 Prob.=0.113 Prob.=0.000 Prob.=0.007
Effect Fixed Random Fixed Fixed
Note: ***, ** and * indicate significance at the level of 1%, 5% and 10%, respectively. A significant p value of Hausman test implies the rejection of the
random effect model. All fixed effect models are estimated with cross-section weights, and White cross-section standard errors and covariance.
Table 5 Regression results of three regions
Variables Eastern China Central China Western China
Coefficient Prob. Coefficient Prob. Coefficient Prob.
C -13.733*** 0.000 -6.985*** 0.000 -13.608*** 0.000
ln(L) 0.191** 0.022 0.578*** 0.000 0.191 0.381
ln(K) 0.798*** 0.000 0.643*** 0.000 0.534*** 0.001
ln(LQ) -1.764** 0.026 -9.691*** 0.004 -11.579*** 0.000
ln(HC) 3.929*** 0.000 -0.146 0.903 5.774*** 0.000
ln(LQ)*ln(HC) 0.868** 0.014 4.738*** 0.002 5.725** 0.000
Threshold 2.032 2.045 2.022
R-Squared 0.996 0.914 0.966
F-statistic 1122.427 107.612 117.728
Hausman Test Prob.=0.030 Prob.=0.989 Prob.=0.067
Effect Fixed Random Fixed
Note: ***, ** and * indicate significance at the level of 1%, 5% and 10%, respectively. A significant p value of Hausman test implies the rejection of the
random effect model. All fixed effect models are estimated with cross-section weights, and White cross-section standard errors and covariance.
26
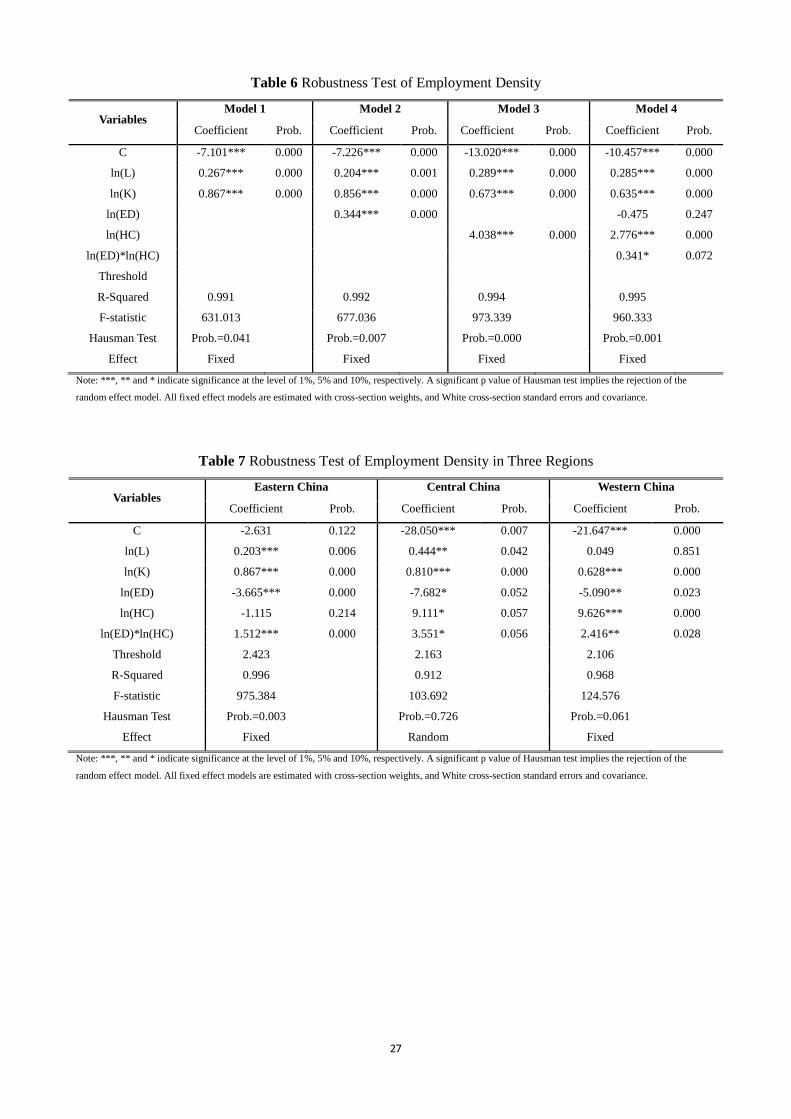
Table 6 Robustness Test of Employment Density
Variables Model 1 Model 2 Model 3 Model 4
Coefficient Prob. Coefficient Prob. Coefficient Prob. Coefficient Prob.
C -7.101*** 0.000 -7.226*** 0.000 -13.020*** 0.000 -10.457*** 0.000
ln(L) 0.267*** 0.000 0.204*** 0.001 0.289*** 0.000 0.285*** 0.000
ln(K) 0.867*** 0.000 0.856*** 0.000 0.673*** 0.000 0.635*** 0.000
ln(ED) 0.344*** 0.000 -0.475 0.247
ln(HC) 4.038*** 0.000 2.776*** 0.000
ln(ED)*ln(HC) 0.341* 0.072
Threshold
R-Squared 0.991 0.992 0.994 0.995
F-statistic 631.013 677.036 973.339 960.333
Hausman Test Prob.=0.041 Prob.=0.007 Prob.=0.000 Prob.=0.001
Effect Fixed Fixed Fixed Fixed
Note: ***, ** and * indicate significance at the level of 1%, 5% and 10%, respectively. A significant p value of Hausman test implies the rejection of the
random effect model. All fixed effect models are estimated with cross-section weights, and White cross-section standard errors and covariance.
Table 7 Robustness Test of Employment Density in Three Regions
Variables Eastern China Central China Western China
Coefficient Prob. Coefficient Prob. Coefficient Prob.
C -2.631 0.122 -28.050*** 0.007 -21.647*** 0.000
ln(L) 0.203*** 0.006 0.444** 0.042 0.049 0.851
ln(K) 0.867*** 0.000 0.810*** 0.000 0.628*** 0.000
ln(ED) -3.665*** 0.000 -7.682* 0.052 -5.090** 0.023
ln(HC) -1.115 0.214 9.111* 0.057 9.626*** 0.000
ln(ED)*ln(HC) 1.512*** 0.000 3.551* 0.056 2.416** 0.028
Threshold 2.423 2.163 2.106
R-Squared 0.996 0.912 0.968
F-statistic 975.384 103.692 124.576
Hausman Test Prob.=0.003 Prob.=0.726 Prob.=0.061
Effect Fixed Random Fixed
Note: ***, ** and * indicate significance at the level of 1%, 5% and 10%, respectively. A significant p value of Hausman test implies the rejection of the
random effect model. All fixed effect models are estimated with cross-section weights, and White cross-section standard errors and covariance.
27
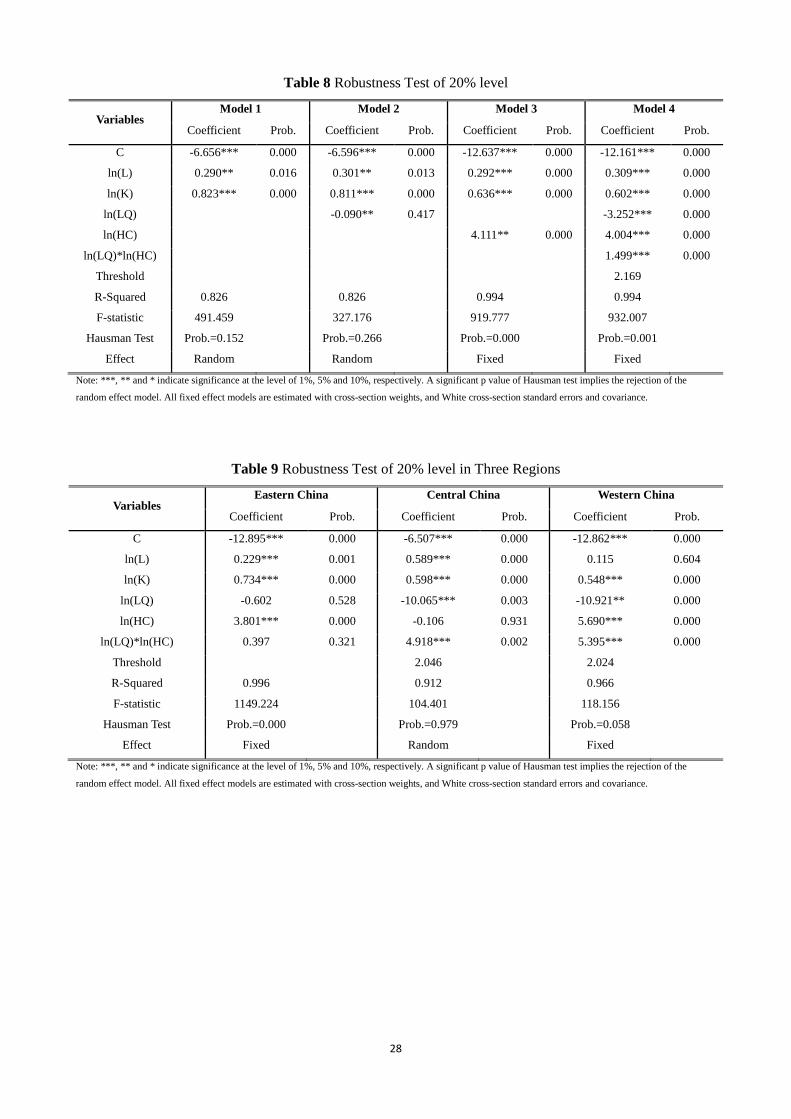
Table 8 Robustness Test of 20% level
Variables Model 1 Model 2 Model 3 Model 4
Coefficient Prob. Coefficient Prob. Coefficient Prob. Coefficient Prob.
C -6.656*** 0.000 -6.596*** 0.000 -12.637*** 0.000 -12.161*** 0.000
ln(L) 0.290** 0.016 0.301** 0.013 0.292*** 0.000 0.309*** 0.000
ln(K) 0.823*** 0.000 0.811*** 0.000 0.636*** 0.000 0.602*** 0.000
ln(LQ) -0.090** 0.417 -3.252*** 0.000
ln(HC) 4.111** 0.000 4.004*** 0.000
ln(LQ)*ln(HC) 1.499*** 0.000
Threshold 2.169
R-Squared 0.826 0.826 0.994 0.994
F-statistic 491.459 327.176 919.777 932.007
Hausman Test Prob.=0.152 Prob.=0.266 Prob.=0.000 Prob.=0.001
Effect Random Random Fixed Fixed
Note: ***, ** and * indicate significance at the level of 1%, 5% and 10%, respectively. A significant p value of Hausman test implies the rejection of the
random effect model. All fixed effect models are estimated with cross-section weights, and White cross-section standard errors and covariance.
Table 9 Robustness Test of 20% level in Three Regions
Variables Eastern China Central China Western China
Coefficient Prob. Coefficient Prob. Coefficient Prob.
C -12.895*** 0.000 -6.507*** 0.000 -12.862*** 0.000
ln(L) 0.229*** 0.001 0.589*** 0.000 0.115 0.604
ln(K) 0.734*** 0.000 0.598*** 0.000 0.548*** 0.000
ln(LQ) -0.602 0.528 -10.065*** 0.003 -10.921** 0.000
ln(HC) 3.801*** 0.000 -0.106 0.931 5.690*** 0.000
ln(LQ)*ln(HC) 0.397 0.321 4.918*** 0.002 5.395*** 0.000
Threshold 2.046 2.024
R-Squared 0.996 0.912 0.966
F-statistic 1149.224 104.401 118.156
Hausman Test Prob.=0.000 Prob.=0.979 Prob.=0.058
Effect Fixed Random Fixed
Note: ***, ** and * indicate significance at the level of 1%, 5% and 10%, respectively. A significant p value of Hausman test implies the rejection of the
random effect model. All fixed effect models are estimated with cross-section weights, and White cross-section standard errors and covariance.
28

Editor, UWA Economics Discussion Papers:
Ernst Juerg Weber Business School – Economics University of Western Australia 35 Sterling Hwy Crawley WA 6009 Australia Email: [email protected] The Economics Discussion Papers are available at: 1980 – 2002: http://ecompapers.biz.uwa.edu.au/paper/PDF%20of%20Discussion%20Papers/ Since 2001: http://ideas.repec.org/s/uwa/wpaper1.html Since 2004: http://www.business.uwa.edu.au/school/disciplines/economics
ECONOMICS DISCUSSION PAPERS 2011
DP NUMBER AUTHORS TITLE
11.01 Robertson, P.E. DEEP IMPACT: CHINA AND THE WORLD ECONOMY
11.02 Kang, C. and Lee, S.H. BEING KNOWLEDGEABLE OR SOCIABLE? DIFFERENCES IN RELATIVE IMPORTANCE OF COGNITIVE AND NON-COGNITIVE SKILLS
11.03 Turkington, D. DIFFERENT CONCEPTS OF MATRIX CALCULUS
11.04 Golley, J. and Tyers, R. CONTRASTING GIANTS: DEMOGRAPHIC CHANGE AND ECONOMIC PERFORMANCE IN CHINA AND INDIA
11.05 Collins, J., Baer, B. and Weber, E.J. ECONOMIC GROWTH AND EVOLUTION: PARENTAL PREFERENCE FOR QUALITY AND QUANTITY OF OFFSPRING
11.06 Turkington, D. ON THE DIFFERENTIATION OF THE LOG LIKELIHOOD FUNCTION USING MATRIX CALCULUS
11.07 Groenewold, N. and Paterson, J.E.H. STOCK PRICES AND EXCHANGE RATES IN AUSTRALIA: ARE COMMODITY PRICES THE MISSING LINK?
11.08 Chen, A. and Groenewold, N. REDUCING REGIONAL DISPARITIES IN CHINA: IS INVESTMENT ALLOCATION POLICY EFFECTIVE?
11.09 Williams, A., Birch, E. and Hancock, P. THE IMPACT OF ON-LINE LECTURE RECORDINGS ON STUDENT PERFORMANCE
11.10 Pawley, J. and Weber, E.J. INVESTMENT AND TECHNICAL PROGRESS IN THE G7 COUNTRIES AND AUSTRALIA
11.11 Tyers, R. AN ELEMENTAL MACROECONOMIC MODEL FOR APPLIED ANALYSIS AT UNDERGRADUATE LEVEL
11.12 Clements, K.W. and Gao, G. QUALITY, QUANTITY, SPENDING AND PRICES
11.13 Tyers, R. and Zhang, Y. JAPAN’S ECONOMIC RECOVERY: INSIGHTS FROM MULTI-REGION DYNAMICS
29

11.14 McLure, M. A. C. PIGOU’S REJECTION OF PARETO’S LAW
11.15 Kristoffersen, I. THE SUBJECTIVE WELLBEING SCALE: HOW REASONABLE IS THE CARDINALITY ASSUMPTION?
11.16 Clements, K.W., Izan, H.Y. and Lan, Y. VOLATILITY AND STOCK PRICE INDEXES
11.17 Parkinson, M. SHANN MEMORIAL LECTURE 2011: SUSTAINABLE WELLBEING – AN ECONOMIC FUTURE FOR AUSTRALIA
11.18 Chen, A. and Groenewold, N. THE NATIONAL AND REGIONAL EFFECTS OF FISCAL DECENTRALISATION IN CHINA
11.19 Tyers, R. and Corbett, J. JAPAN’S ECONOMIC SLOWDOWN AND ITS GLOBAL IMPLICATIONS: A REVIEW OF THE ECONOMIC MODELLING
11.20 Wu, Y. GAS MARKET INTEGRATION: GLOBAL TRENDS AND IMPLICATIONS FOR THE EAS REGION
11.21 Fu, D., Wu, Y. and Tang, Y. DOES INNOVATION MATTER FOR CHINESE HIGH-TECH EXPORTS? A FIRM-LEVEL ANALYSIS
11.22 Fu, D. and Wu, Y. EXPORT WAGE PREMIUM IN CHINA’S MANUFACTURING SECTOR: A FIRM LEVEL ANALYSIS
11.23 Li, B. and Zhang, J. SUBSIDIES IN AN ECONOMY WITH ENDOGENOUS CYCLES OVER NEOCLASSICAL INVESTMENT AND NEO-SCHUMPETERIAN INNOVATION REGIMES
11.24 Krey, B., Widmer, P.K. and Zweifel, P. EFFICIENT PROVISION OF ELECTRICITY FOR THE UNITED STATES AND SWITZERLAND
11.25 Wu, Y. ENERGY INTENSITY AND ITS DETERMINANTS IN CHINA’S REGIONAL ECONOMIES
30
ECONOMICS DISCUSSION PAPERS 2012
DP NUMBER AUTHORS TITLE
12.01 Clements, K.W., Gao, G., and Simpson, T.
DISPARITIES IN INCOMES AND PRICES INTERNATIONALLY
12.02 Tyers, R. THE RISE AND ROBUSTNESS OF ECONOMIC FREEDOM IN CHINA
12.03 Golley, J. and Tyers, R. DEMOGRAPHIC DIVIDENDS, DEPENDENCIES AND ECONOMIC GROWTH IN CHINA AND INDIA
12.04 Tyers, R. LOOKING INWARD FOR GROWTH
12.05 Knight, K. and McLure, M. THE ELUSIVE ARTHUR PIGOU
12.06 McLure, M. ONE HUNDRED YEARS FROM TODAY: A. C. PIGOU’S WEALTH AND WELFARE
12.07 Khuu, A. and Weber, E.J. HOW AUSTRALIAN FARMERS DEAL WITH RISK
12.08 Chen, M. and Clements, K.W. PATTERNS IN WORLD METALS PRICES
12.09 Clements, K.W. UWA ECONOMICS HONOURS
12.10 Golley, J. and Tyers, R. CHINA’S GENDER IMBALANCE AND ITS ECONOMIC PERFORMANCE
12.11 Weber, E.J. AUSTRALIAN FISCAL POLICY IN THE AFTERMATH OF THE GLOBAL FINANCIAL CRISIS
12.12 Hartley, P.R. and Medlock III, K.B. CHANGES IN THE OPERATIONAL EFFICIENCY OF NATIONAL OIL COMPANIES
12.13 Li, L. HOW MUCH ARE RESOURCE PROJECTS WORTH? A CAPITAL MARKET PERSPECTIVE
12.14 Chen, A. and Groenewold, N. THE REGIONAL ECONOMIC EFFECTS OF A REDUCTION IN CARBON EMISSIONS AND AN EVALUATION OF OFFSETTING POLICIES IN CHINA
12.15 Collins, J., Baer, B. and Weber, E.J. SEXUAL SELECTION, CONSPICUOUS CONSUMPTION AND ECONOMIC GROWTH
12.16 Wu, Y. TRENDS AND PROSPECTS IN CHINA’S R&D SECTOR
12.17 Cheong, T.S. and Wu, Y. INTRA-PROVINCIAL INEQUALITY IN CHINA: AN ANALYSIS OF COUNTY-LEVEL DATA
12.18 Cheong, T.S. THE PATTERNS OF REGIONAL INEQUALITY IN CHINA
12.19 Wu, Y. ELECTRICITY MARKET INTEGRATION: GLOBAL TRENDS AND IMPLICATIONS FOR THE EAS REGION
12.20 Knight, K. EXEGESIS OF DIGITAL TEXT FROM THE HISTORY OF ECONOMIC THOUGHT: A COMPARATIVE EXPLORATORY TEST
12.21 Chatterjee, I. COSTLY REPORTING, EX-POST MONITORING, AND COMMERCIAL PIRACY: A GAME THEORETIC ANALYSIS
12.22 Pen, S.E. QUALITY-CONSTANT ILLICIT DRUG PRICES
12.23 Cheong, T.S. and Wu, Y. REGIONAL DISPARITY, TRANSITIONAL DYNAMICS AND CONVERGENCE IN CHINA
31

12.24 Ezzati, P. FINANCIAL MARKETS INTEGRATION OF IRAN WITHIN THE MIDDLE EAST AND WITH THE REST OF THE WORLD
12.25 Kwan, F., Wu, Y. and Zhuo, S. RE-EXAMINATION OF THE SURPLUS AGRICULTURAL LABOUR IN CHINA
12.26 Wu, Y. R&D BEHAVIOUR IN CHINESE FIRMS
12.27 Tang, S.H.K. and Yung, L.C.W. MAIDS OR MENTORS? THE EFFECTS OF LIVE-IN FOREIGN DOMESTIC WORKERS ON SCHOOL CHILDREN’S EDUCATIONAL ACHIEVEMENT IN HONG KONG
12.28 Groenewold, N. AUSTRALIA AND THE GFC: SAVED BY ASTUTE FISCAL POLICY?
ECONOMICS DISCUSSION PAPERS 2013
DP NUMBER AUTHORS TITLE
13.01 Chen, M., Clements, K.W. and Gao, G.
THREE FACTS ABOUT WORLD METAL PRICES
13.02 Collins, J. and Richards, O. EVOLUTION, FERTILITY AND THE AGEING POPULATION
13.03 Clements, K., Genberg, H., Harberger, A., Lothian, J., Mundell, R., Sonnenschein, H. and Tolley, G.
LARRY SJAASTAD, 1934-2012
13.04 Robitaille, M.C. and Chatterjee, I. MOTHERS-IN-LAW AND SON PREFERENCE IN INDIA
13.05 Clements, K.W. and Izan, I.H.Y. REPORT ON THE 25TH PHD CONFERENCE IN ECONOMICS AND BUSINESS
13.06 Walker, A. and Tyers, R. QUANTIFYING AUSTRALIA’S “THREE SPEED” BOOM
13.07 Yu, F. and Wu, Y. PATENT EXAMINATION AND DISGUISED PROTECTION
13.08 Yu, F. and Wu, Y. PATENT CITATIONS AND KNOWLEDGE SPILLOVERS: AN ANALYSIS OF CHINESE PATENTS REGISTER IN THE US
13.09 Chatterjee, I. and Saha, B. BARGAINING DELEGATION IN MONOPOLY
13.10 Cheong, T.S. and Wu, Y. GLOBALIZATION AND REGIONAL INEQUALITY IN CHINA
13.11 Cheong, T.S. and Wu, Y. INEQUALITY AND CRIME RATES IN CHINA
13.12 Robertson, P.E. and Ye, L. ON THE EXISTENCE OF A MIDDLE INCOME TRAP
13.13 Robertson, P.E. THE GLOBAL IMPACT OF CHINA’S GROWTH
13.14 Hanaki, N., Jacquemet, N., Luchini, S., and Zylbersztejn, A.
BOUNDED RATIONALITY AND STRATEGIC UNCERTAINTY IN A SIMPLE DOMINANCE SOLVABLE GAME
13.15 Okatch, Z., Siddique, A. and Rammohan, A.
DETERMINANTS OF INCOME INEQUALITY IN BOTSWANA
13.16 Clements, K.W. and Gao, G. A MULTI-MARKET APPROACH TO MEASURING THE CYCLE
32

13.17 Chatterjee, I. and Ray, R. THE ROLE OF INSTITUTIONS IN THE INCIDENCE OF CRIME AND CORRUPTION
13.18 Fu, D. and Wu, Y. EXPORT SURVIVAL PATTERN AND DETERMINANTS OF CHINESE MANUFACTURING FIRMS
13.19 Shi, X., Wu, Y. and Zhao, D. KNOWLEDGE INTENSIVE BUSINESS SERVICES AND THEIR IMPACT ON INNOVATION IN CHINA
13.20 Tyers, R., Zhang, Y. and Cheong, T.S.
CHINA’S SAVING AND GLOBAL ECONOMIC PERFORMANCE
13.21 Collins, J., Baer, B. and Weber, E.J. POPULATION, TECHNOLOGICAL PROGRESS AND THE EVOLUTION OF INNOVATIVE POTENTIAL
13.22 Hartley, P.R. THE FUTURE OF LONG-TERM LNG CONTRACTS
13.23 Tyers, R. A SIMPLE MODEL TO STUDY GLOBAL MACROECONOMIC INTERDEPENDENCE
13.24 McLure, M. REFLECTIONS ON THE QUANTITY THEORY: PIGOU IN 1917 AND PARETO IN 1920-21
33


![Physical concept ontology for the knowledge intensive ... · of the Knowledge Intensive Engineering Framework (KIEF) to support knowledge-intensive engineering [6]. Knowledge-intensive](https://static.fdocuments.us/doc/165x107/5b90c6fd09d3f28a7e8cb604/physical-concept-ontology-for-the-knowledge-intensive-of-the-knowledge-intensive.jpg)