Economics ch 2
33
Title Date Lifetime Learning… Building Success… Towards Globalization Economics -Chapter 2 Demand, Supply and Market Equilibrium Lifetime Learning… Building Success… Towards Globalization
-
Upload
eibfs-2000 -
Category
Economy & Finance
-
view
48 -
download
0
Transcript of Economics ch 2

TitleDate
Lifetime Learning… Building Success… Towards Globalization
Economics -Chapter 2Demand, Supply and Market Equilibrium
Lifetime Learning… Building Success… Towards Globalization

• The Market:• The market for a product is a situation in which the buyer and
seller communicate with each other for the purpose ofexchange.
• The market may be local, regional, national or international.• The market may have no exact location, as with exchange via
the internet.
EIBFS/Economics
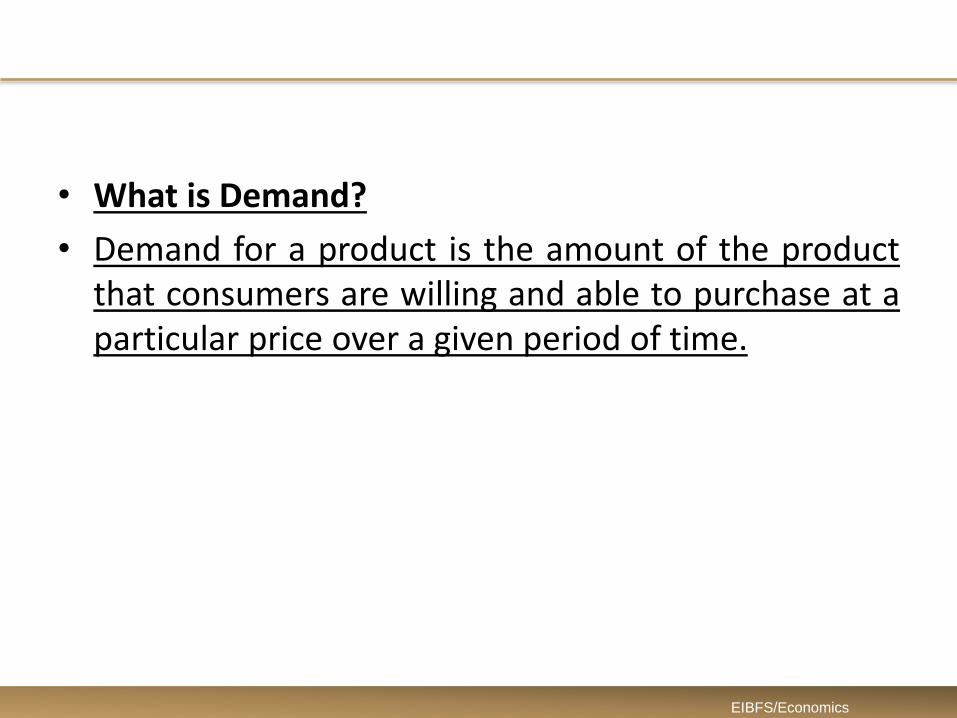
• What is Demand?
• Demand for a product is the amount of the productthat consumers are willing and able to purchase at aparticular price over a given period of time.
EIBFS/Economics

• Factors influencing/ affecting the demand
– Price of the product
– Price of other products
– Household income
– Tastes
– Advertising.
EIBFS/Economics
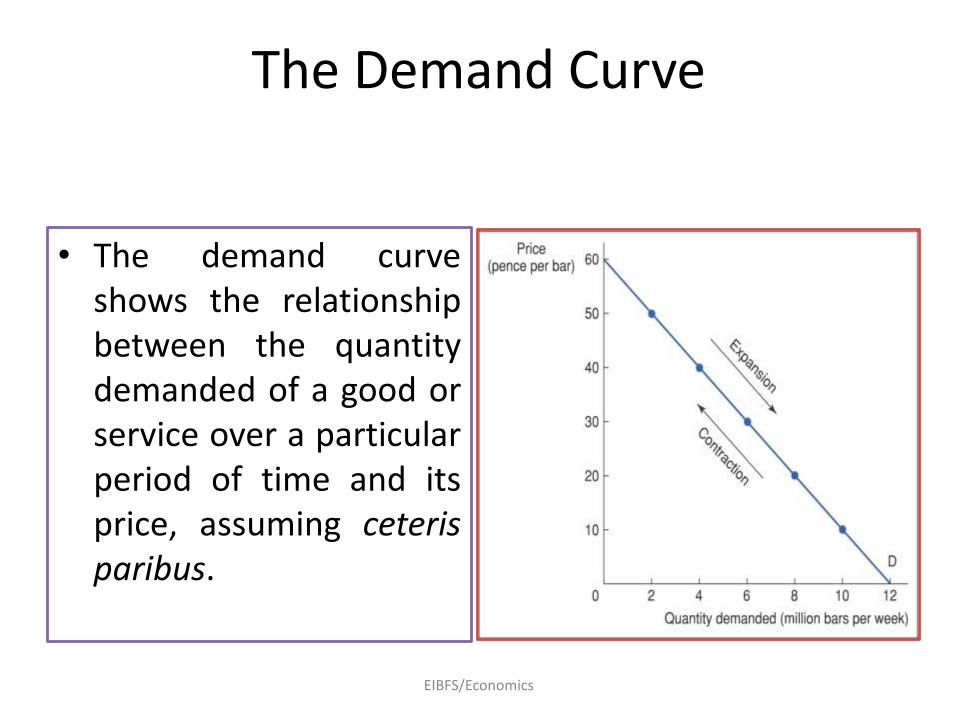
The Demand Curve
• The demand curveshows the relationshipbetween the quantitydemanded of a good orservice over a particularperiod of time and itsprice, assuming ceterisparibus.
EIBFS/Economics

Demand Curve Explained
• Price on vertical axis and quantity demanded on horizontal axis.
• Demand is a flow concept - measured over a period of time.
• Curve slopes downward from left to right, a negativerelationship.
• A change in price of the product shall lead to a movement alongthe demand curve.
• Assumption of ceteris paribus meaning ‘ all other factorsremaining unchanged.
EIBFS/Economics
6

Movement along the Demand Curve
• Movement along the demand curve is the result of a rise orfall in the price of the product itself.
• A change in price of a product leads to a Movement Alongthe Demand Curve.
– Quantity demanded decrease— contraction of demand
– Quantity demanded increase— expansion of demand
EIBFS/Economics

Shift in Demand Curve
• Factors other than the price of the product shall shift theposition of the demand curve.
– Increase in demand — shift to the right
– Decrease in demand — shift to the left
• Shift factors’ (known as conditions of demand) include:
– Price of other related products
– Level of household income.
– Tastes of consumers
– Number of consumers
– Advertising
EIBFS/Economics
Shift factors Explained
A change in the prices of related product affects thedemand in two ways:
• An increase in the price of a substitute for a good, increases thedemand for the good. (right shift)
• A fall in the price of a substitute for a good, decreases the demandfor the good. (left shift)
• Substitute goods can be used in place of one another (Pepsi cola-Coca cola)
EIBFS/Economics
• Complementary goods are used jointly or purchasedtogether. (car and petrol)
• A fall in the price of a complement to a good increases thedemand for the good. (right shift)
• An increase in the price of a complement to a good decreasesthe demand for the good. (shift to left)
EIBFS/Economics
Change in household income:
Normal goods-With an increase in income demand for thenormal commodity increases. (right shift)
Inferior goods-With an increase in income demand for theinferior goods decreases. (left shift)
• Changes in taste:
– in favour of a product can increase demand, (right shift)
– against a product can decrease demand. (left shift)
• Advertising:
– Successful advertising can increase demand, (right shift)
EIBFS/Economics

EIBFS/Economics

Shift in Demand Curve
• The quantity demanded of a product decreases (shift to the left) if there is:
– Fall in price of substitute
– Rise in price of complement
– Fall in real income (normal product)
– Rise in real income (inferior product)
– Change of tastes against product
– Fall in advertising expenditure.
EIBFS/Economics

• The quantity demanded of a product increases (shift to the right) if there is
– Rise in price of substitute
– Rise in number of consumers
– Rise in income
– Rise in advertising cost
– Tastes in favour of product
• The quantity demanded of a product decreases (shift to the left) if there is
– Fall in price of substitute
– Fall in number of consumers
– Fall in income
– Fall in advertising Cost
– Tastes against product
EIBFS/Economics

Shift in Demand Curve
• The quantity demanded of a product increases (shift to the right) if there is:
– Rise in price of substitute
– Fall in price of complement
– Rise in real income (normal product)
– Fall in real income (inferior product)
– Change of tastes in favour of product
– Rise in advertising expenditure.
•
EIBFS/Economics

Market Demand Curve
• Market demand curve is the total amount thatconsumers demand at a particular price over a givenperiod of time.
• The market demand curve is derived from summingthe individual demand curves horizontally.
EIBFS/Economics

Supply
• What is Supply?
• Supply of a product is the quantity of the productthat firms are willing and able to offer for sale at aparticular price over a particular period of time.
EIBFS/Economics

• Factors influencing supply are:– Price of the product
– Price of all the other products
– Price of the factors of production
– Technology
– All other factors (taxes, weather)
– Note: Assumption of ceteris paribus
EIBFS/Economics
• A change in the price of the product:
– An increase in the price of a product will increase thequantity supplied in market (more profitable for theproducers) assuming ceteris paribus.
– The relation ship between price and quantity supplied canbe presented in the form of supply schedule ( in table) or inthe form of supply curve (graph)
EIBFS/Economics
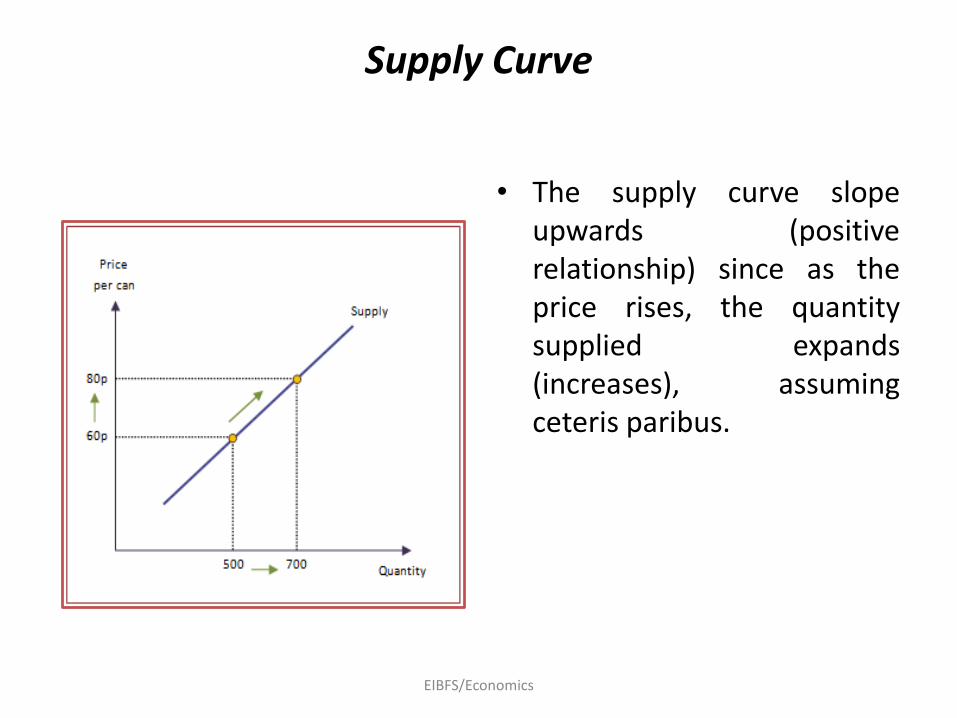
Supply Curve
• The supply curve slopeupwards (positiverelationship) since as theprice rises, the quantitysupplied expands(increases), assumingceteris paribus.
EIBFS/Economics

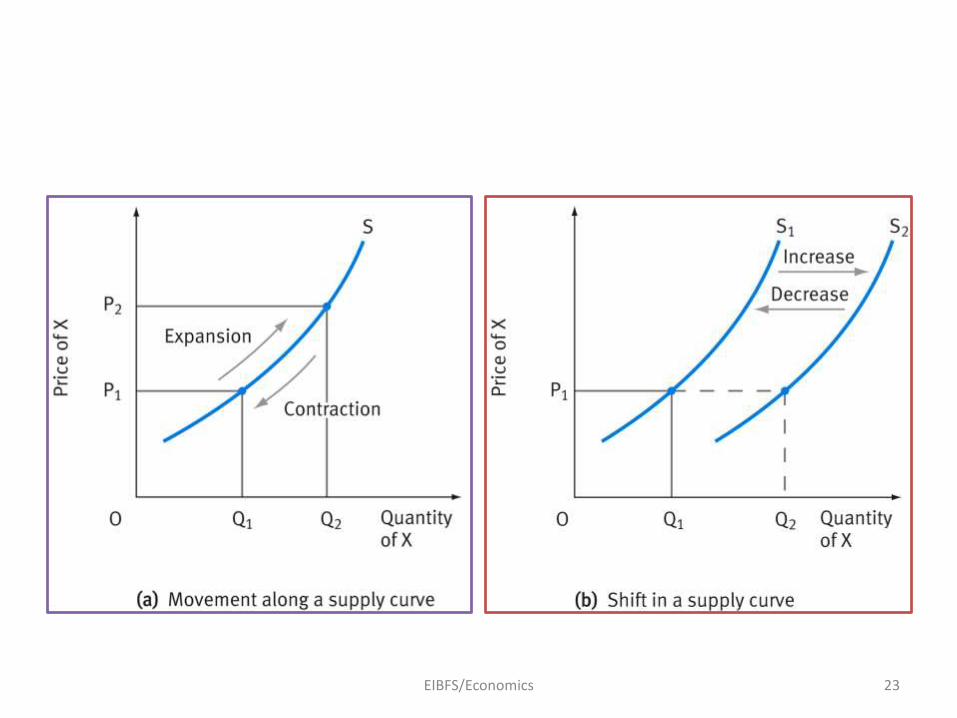
Movement along the Supply Curve
• A change in the price of the product will lead to amovement along the supply curve (same line).
• Movement along the supply curve is the result of a rise or fall in the price of the product itself.
• The Quantity supplied of a products contracts (falls) if:
– the price falls
• The Quantity supplied of a products expands(increases) if:
– The prices rises
EIBFS/Economics
21
Shift in Supply Curve
• The other factors which influence the supply willshift the position of the supply curve (new line).
• Shift factors are:
– A change in the price of other products.
– A change in the price of the factors of production.
– A change in technology
– Other factors (weather, taxes, subsidy)
EIBFS/Economics
22
EIBFS/Economics 23

Shift in Supply Curve
• The quantity supplied of a product decreases (shift to the left) if there is:
– Rise in price of substitute product
– Fall in price of complement product
– Rise in costs of production
– Decline in the level of technology
– A new tax on the product
EIBFS/Economics
Shift in Supply Curve
• The quantity supplied of a product increases (shift to the right) if there is:
– Fall in price of substitute product
– Rise in price of complement product
– Fall in costs of production
– Improvement in the level of technology
– Introduction of subsidy on the product
EIBFS/Economics
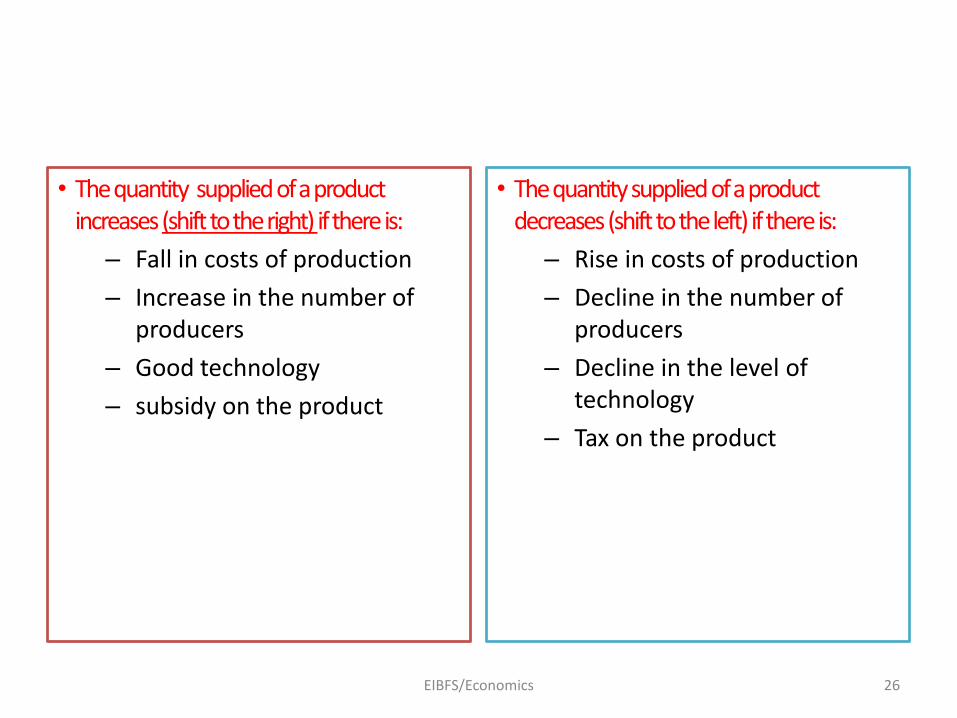
• The quantity supplied of a product increases (shift to the right) if there is:
– Fall in costs of production
– Increase in the number of producers
– Good technology
– subsidy on the product
• The quantity supplied of a product decreases (shift to the left) if there is:
– Rise in costs of production
– Decline in the number of producers
– Decline in the level of technology
– Tax on the product
EIBFS/Economics 26

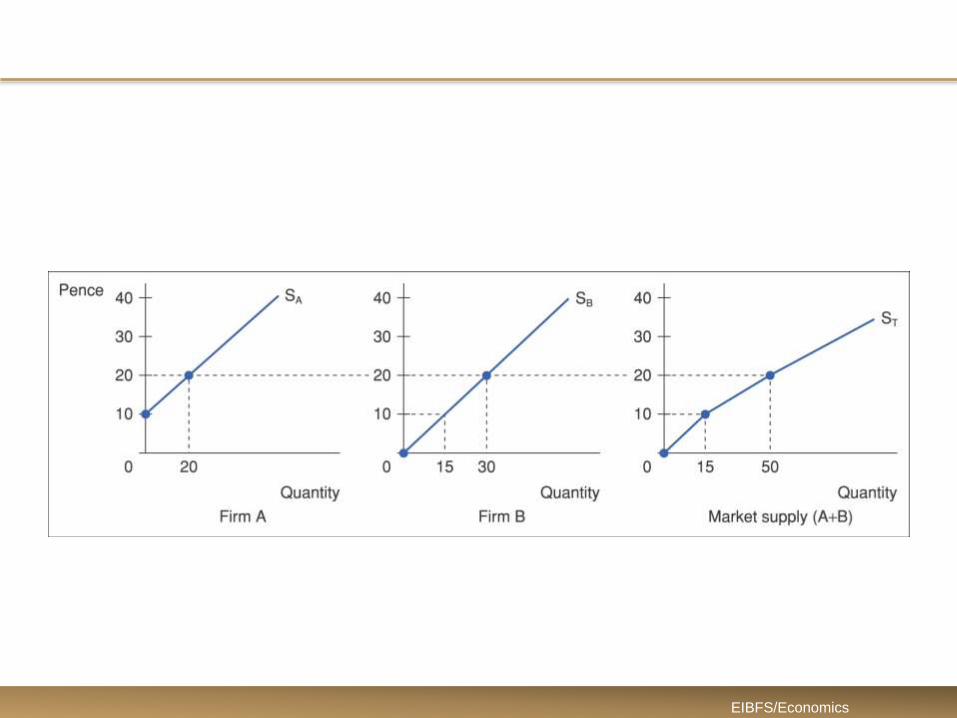
• Market Supply is the total amount of the productthat all the firms are willing and able to supply at aparticular price over a given period of time.
• The market supply curve is derived from summingthe individual firm supply curves horizontally.
EIBFS/Economics
EIBFS/Economics
Market equilibrium
• Equilibrium price relates to the price at which thequantity demanded equals the quantity supplied.
• Disequilibrium refers to a situation in which demanddoes not equal supply.
• This can lead to a situation of either excess demandor excess supply.
EIBFS/Economics

Market equilibrium (Continued)
•At price 35 pence, → equilibrium
price and quantity. (quantity
demanded 5 million bars =
quantity supplied 5 million bars.
•At price 20 pence →
disequilibrium situation; excess
demand of 6 million bars; cause
the price to rise.
• At price 50 pence →
disequilibrium excess supply of 6
million bars; cause the price tofall
EIBFS/Economics

Changes in equilibrium
• The equilibrium price and output may change as aresult of any one (or more) of the following:
• Increase in demand (Figure 2.9a)
• Decrease in demand
• Increase in supply (Figure 2.9b)
• Decrease in supply.
EIBFS/Economics
31

EIBFS/Economics
• What is demand curve?
• A. The demand curve shows the relationship between the quantity demanded of a product and its price, over a period of time.
EIBFS/Economics