ECONOMICS - CBSE Portal · 10. Explain consumer's equilibrium, in case of a single commodity, with...
24
118 ECONOMICS Time allowed : 3 hours Maximum Marks : 100 General Instructions : (i) All questions in both the sections are compulsory. (ii) Marks for questions are indicated against each. (iii) Question Nos. 1 and 13 are very short-answer questions carrying 1 mark for each part. They are required to be answered in one sentence each. (iv) Question Nos. 2-5 and 14-17 are short-answer questions carrying 3 marks each. Answer to them should not normally exceed 60 words each. (v) Question Nos. 6-9 and 18-21 are also short-answer questions carrying 4 marks each. Answer to them should not normally exceed 70 words each. (vi) Question Nos. 10-12 and 22-24 are long-answer questions carrying 6 marks each. Answer to them should not normally exceed 100 words each. (vii) Answers should be brief and to the point and the above word limits be adhered to as far as possible. (viii) All parts of a question should be answered at one place. QUESTION PAPER CODE 58/1/1 SECTION ‘A’ 1. Answer the following questions : 4×1 (i) Define market supply. (ii) What is meant by producer's equilibrium ? (iii) Define marginal physical product. (iv) Define equilibrium price. 2. State any three causes of a rightward shift of demand curve of a commodity. 3 3. State the geometric method of measuring price elasticity of supply (in case of straight line supply curve). 3 4. What is the relationship between marginal cost and average variable cost ? 3 5. State three main features of perfect competition. 3
Transcript of ECONOMICS - CBSE Portal · 10. Explain consumer's equilibrium, in case of a single commodity, with...
118
ECONOMICS
Time allowed : 3 hours Maximum Marks : 100
General Instructions :
(i) All questions in both the sections are compulsory.
(ii) Marks for questions are indicated against each.
(iii) Question Nos. 1 and 13 are very short-answer questions carrying 1 mark for each part.They are required to be answered in one sentence each.
(iv) Question Nos. 2-5 and 14-17 are short-answer questions carrying 3 marks each. Answerto them should not normally exceed 60 words each.
(v) Question Nos. 6-9 and 18-21 are also short-answer questions carrying 4 marks each.Answer to them should not normally exceed 70 words each.
(vi) Question Nos. 10-12 and 22-24 are long-answer questions carrying 6 marks each.Answer to them should not normally exceed 100 words each.
(vii) Answers should be brief and to the point and the above word limits be adhered to asfar as possible.
(viii) All parts of a question should be answered at one place.
QUESTION PAPER CODE 58/1/1
SECTION ‘A’
1. Answer the following questions : 4×1(i) Define market supply.(ii) What is meant by producer's equilibrium ?(iii) Define marginal physical product.(iv) Define equilibrium price.
2. State any three causes of a rightward shift of demand curve of a commodity. 3
3. State the geometric method of measuring price elasticity of supply (in case ofstraight line supply curve). 3
4. What is the relationship between marginal cost and average variable cost ? 3
5. State three main features of perfect competition. 3
119
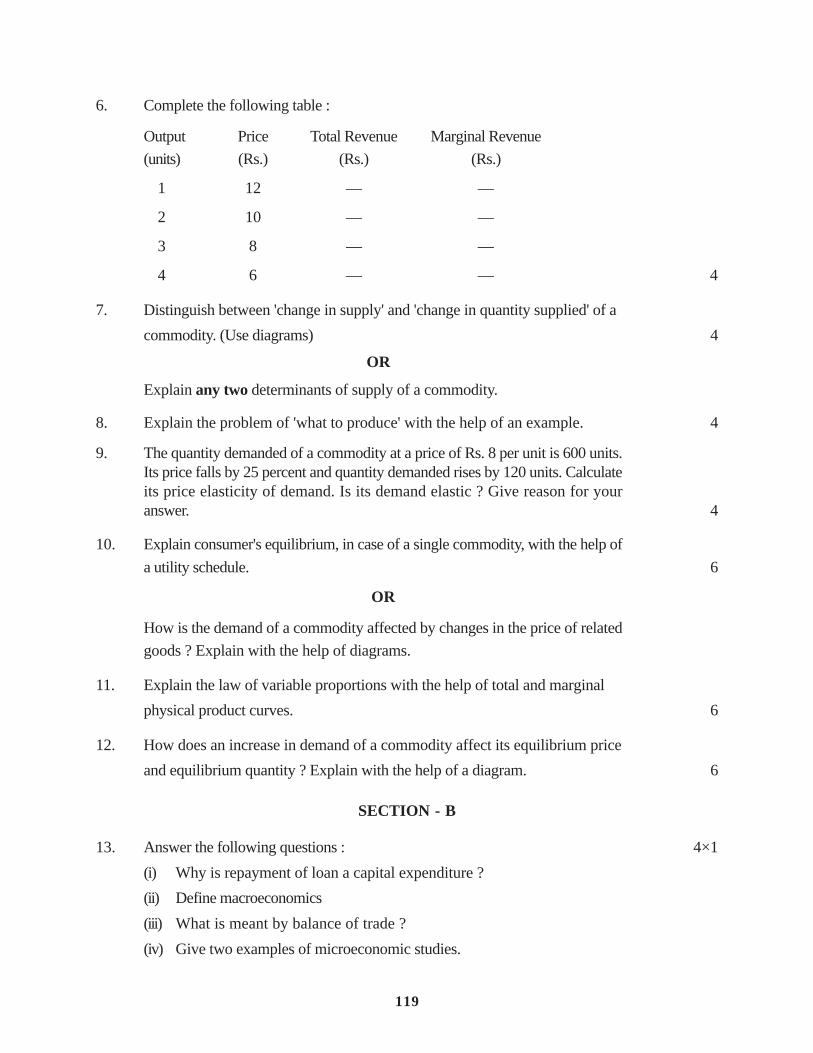
6. Complete the following table :
Output Price Total Revenue Marginal Revenue(units) (Rs.) (Rs.) (Rs.)
1 12 — —
2 10 — —
3 8 — —
4 6 — — 4
7. Distinguish between 'change in supply' and 'change in quantity supplied' of acommodity. (Use diagrams) 4
OR
Explain any two determinants of supply of a commodity.
8. Explain the problem of 'what to produce' with the help of an example. 4
9. The quantity demanded of a commodity at a price of Rs. 8 per unit is 600 units.Its price falls by 25 percent and quantity demanded rises by 120 units. Calculateits price elasticity of demand. Is its demand elastic ? Give reason for youranswer. 4
10. Explain consumer's equilibrium, in case of a single commodity, with the help ofa utility schedule. 6
OR
How is the demand of a commodity affected by changes in the price of relatedgoods ? Explain with the help of diagrams.
11. Explain the law of variable proportions with the help of total and marginalphysical product curves. 6
12. How does an increase in demand of a commodity affect its equilibrium priceand equilibrium quantity ? Explain with the help of a diagram. 6
SECTION - B
13. Answer the following questions : 4×1(i) Why is repayment of loan a capital expenditure ?(ii) Define macroeconomics(iii) What is meant by balance of trade ?(iv) Give two examples of microeconomic studies.
120
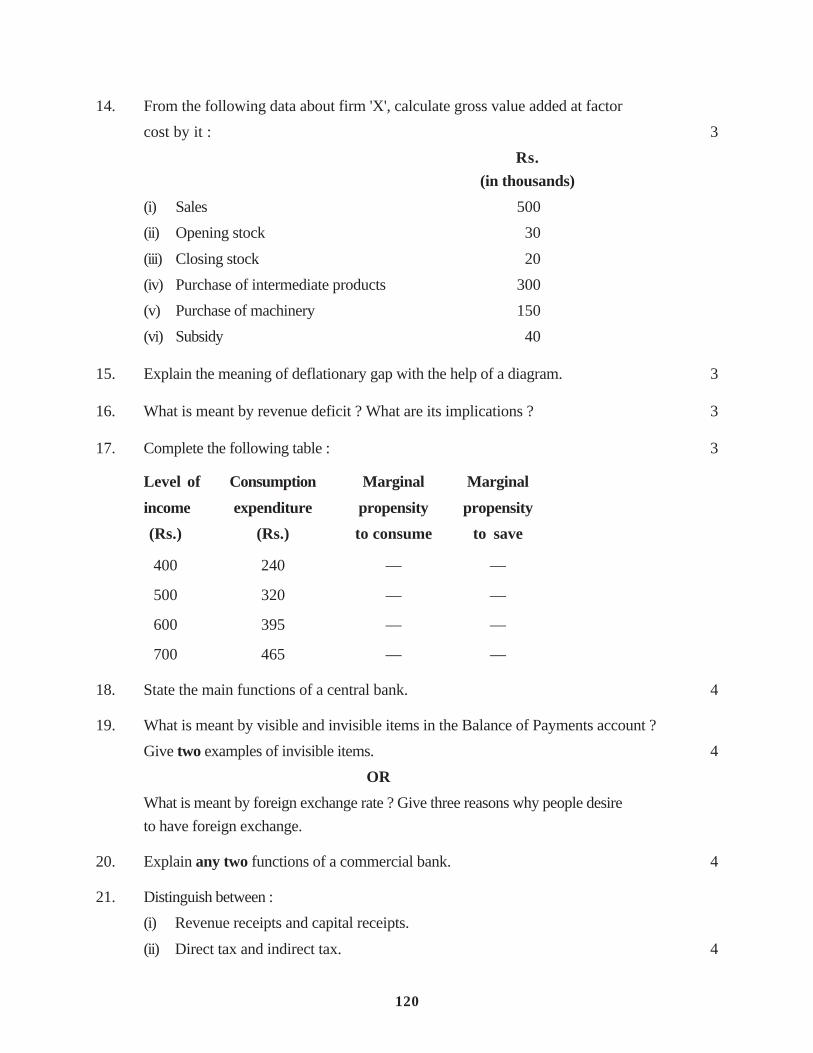
14. From the following data about firm 'X', calculate gross value added at factorcost by it : 3
Rs.(in thousands)
(i) Sales 500(ii) Opening stock 30(iii) Closing stock 20(iv) Purchase of intermediate products 300(v) Purchase of machinery 150(vi) Subsidy 40
15. Explain the meaning of deflationary gap with the help of a diagram. 3
16. What is meant by revenue deficit ? What are its implications ? 3
17. Complete the following table : 3
Level of Consumption Marginal Marginalincome expenditure propensity propensity(Rs.) (Rs.) to consume to save
400 240 — —
500 320 — —
600 395 — —
700 465 — —
18. State the main functions of a central bank. 4
19. What is meant by visible and invisible items in the Balance of Payments account ?Give two examples of invisible items. 4
ORWhat is meant by foreign exchange rate ? Give three reasons why people desireto have foreign exchange.
20. Explain any two functions of a commercial bank. 4
21. Distinguish between :(i) Revenue receipts and capital receipts.(ii) Direct tax and indirect tax. 4
121
22. From the following data, calculate :(a) Personal disposable income and(b) National income
Rs.(in crores)
(i) Private income 3,000(ii) Compensation of employees 800(iii) Mixed income of self employed 900(iv) Net factor income from abroad (-) 50(v) Net retained earnings of private enterprises 600(vi) Rent 350(vii) Profit 600(viii) Consumption of fixed capital 200(ix) Direct taxes paid by households 300(x) Corporation tax 350(xi) Net indirect taxes 250(xii) Net exports (-) 70(xiii) Interest 450 3, 3
23. Explain the working of investment multiplier with the help of a numerical example. 6
OR
In an economy planned savings exceed planned investment. How will the equalitybetween the two be achieved ? Explain.
24. Distinguish between the following giving suitable examples in support of youranswer : 3, 3(a) Domestic product and national product(b) Intermediate product and final product
QUESTION PAPER CODE 58/1
SECTION ‘A’1. Answer the following questions : 1×4
(i) Define production function.(ii) What is meant by producer's equilibrium ?(iii) What causes an upward movement along a supply curve ?(iv) Under which market form, is a firm a price-taker ?
2. Explain the law of demand with the help of a demand schedule. 3
122
3. Give three causes of an increase in the supply of a commodity. 3
4. What is the relationship between marginal revenue and average revenue ? 3
5. State the main features of monopoly market. 3
6. Complete the following table : 4
Output Total Cost Average Variable Cost Marginal Cost(units) (Rs.) (Rs.) (Rs.)
0 80 — —
1 180 — —
2 270 — —
3 350 — —
4 440 — —
7. At a price of Rs. 50 per unit, the quantity demanded of a commodity is 1000units. When its price falls by 10 percent, its quantity demanded rises to 1080units. Calculate its price elasticity of demand. Is its demand inelastic ? Givereasons for your answer. 4
8. Define price elasticity of supply. How is it measured by geometric method ? (Incase of a straight line supply curve) 4
9. Explain the problem of 'how to produce' with the help of an example. 4
OR
Explain the problem of 'what to produce' with the help of a production possibilitycurve.
10. How does a consumer reach equilibrium position when he is buying only onecommodity ? Explain with the help of marginal utility schedule. 6
OR
Briefly explain any three factors that shift the demand curve to the right.
11. Distinguish between returns to a factor and returns to scale. Explain the reasonsfor increasing returns to a factor. 6
12. How does an increase in supply of a commodity affect its equilibrium price andequilibrium quantity ? Explain with the help of a diagram. 6
123
SECTION B
13. Answer the following questions : 1×4(i) What is micro-economics ?(ii) Give two examples of a macro-economic studies.(iii) Why are borrowings treated as capital receipts ?(iv) What is meant by balance of payments account ?
14. Explain the meaning of equilibrium level of national income, with the help of adiagram. 3
15. From the following data about a firm 'A', calculate net value added at marketprice by it : 3
(Rs.in thousands)
(i) Sales 700(ii) Change in stock 40(iii) Depreciation 80(iv) Net indirect taxes 100(v) Purchase of machinery 250(vi) Purchase of intermediate products 400
16. What is the basis of classifying government expenditure into revenue expenditureand capital expenditure ? Give an example of each. 3
17. Complete the following table : 3Income Consumption Expenditure Marginal Propensity Marginal(Rs.) (Rs.) to Consume Propensity to Save
1000 900 — —1200 1060 — —1400 1210 — —1600 1350 — —
18. State any three main functions of a central bank. Describe any one of them. 4
19. Explain the meaning and implications of fiscal deficit. 4
20. List four items each of current account and capital account of the balance ofpayments account. 4
OR
Mention four sources each of demand and supply of foreign exchange.
124
21. Briefly explain any four main functions of a commercial bank. 4
22. Explain briefly the distinction between : 6
(a) Gross domestic product at factor cost and Net national product at marketprice.
(b) National income and Net national disposable income.
23. Explain with the help of a numerical example how an increase in investment inan economy affects its level of income. 6
OR
Why should planned savings and planned investment be equal at equilibriumlevel of income ? Explain with the help of a diagram.
24. From the following data, calculate(a) National income, and(b) Personal disposable income 3, 3
(Rs.in crores)
(i) Compensation of employees 1200(ii) Rent 400(iii) Profit 800(iv) Consumption of fixed capital 300(v) Mixed income of self-employed 1000(vi) Private income 3600(vii) Net factor income from abroad (-) 50(viii) Net retained earnings of private enterprises 200(ix) Interest 250(x) Net indirect taxes 350(xi) Net exports (-) 60(xii) Direct taxes paid by households 150(xiii) Corporation tax 100
125
Marking Scheme ---- Economics
General Instructions
1. Please examine each part of a question carefully and allocate the marks allotted for the partas given in the marking scheme below. Total marks for any answer may be put in acircle on the left side where the answer ends.
2. The answers given in the marking scheme below are suggested answers. The content is thusindicative. The candidates may express the content in various forms. But, for standardizationof evaluation it is necessary to follow the marking scheme suggested here on the basis ofexpected content.
3. For mere arithmetical errors, there should be minimal deduction. Only ½ mark be deductedfor such an error.
4. Wherever only two/three or a "given" number of examples/factors/points are expected onlythe first two/three or expected number should be read. The rest are irrelevant and must notbe examined.
5. There should be no effort at "moderation" of the marks by the evaluating teachers. Theactual total marks obtained by the candidate may be of no concern to the evaluators.
General Note : In case of numerical question no mark is to be given if only the final answer isgiven.
QUESTION PAPER CODE 58/1/1
EXPECTED ANSWERS/VALUE POINTS
SECTION ‘A’
1. (i) Total quantity of a commodity that all its producers are willing to sell at agiven price during a period of time. 1
(ii) The situation when a producer earns maximum profit. 1
(iii) It is the change in total physical product when an additional unit of variableinput is used. 1
(iv) The price of a commodity at which its quantity demanded and quantity suppliedare equal. 1
126
2. Causes for a rightward shift of demand curve:(i) Rise in price of substitute good.(ii) Fall in price of complementary good.(iii) Increase in income (normal good)(iv) Favourable change in taste for the commodity.
(Any three) 1×3
3. (i) If the supply curve intersects the ox-axis in its positive range, than elasticityof supply <1
(ii) If the supply curve intersects the oy-axis in its positive range, the elasticity ofsupply > 1
(iii) If the supply curve passes through the origin, the elasticity of supply = 1 1×3
4. (i) When marginal cost is less than average variable cost, average variable costfalls.
(ii) When marginal cost is equal to average variable cost, average variable costis constant.
(iii) When marginal cost is greater than average variable cost, average variablecost rises. 1×3
5. Three main features of perfect competition are :(i) Large number of buyers and sellers.(ii) The product is homogeneous.(iii) There is free entry and exit of firms etc.
(Any three) 1×3
6. Output Price Total Revenue Marginal(Units) (Rs.) (Rs.) Revenue
(Rs.)
1 12 12 122 10 20 83 8 24 44 6 24 0 ½×8
7. When supply increases or decreases due to change in factors other than price ofthe commodity, it is called change in supply. It causes a shift of supply curve.When supply rises or falls due to change in price, other factors remaining constant,then it is called change in quantity supplied. It results is movement along a supplycurve. 2
127
Change in supply Change in Qty supplied ½×2
½×2
OR
(i) Technological change(ii) Input price change(iii) Change in price of related good etc.
(Any two) ½×2(Explanation) 1½×2
8. An economy has only limited resources and the wants are unlimited. Wants aresatisfied by goods and services which are to be produced by the resources. So allgoods and services cannot be produced. The economy has to decide which goodsto be produced. For example, on a given piece of land, all crops cannot be grown.If it is used for growing wheat than on the area on which wheat is grown, othercrop cannot be grown. This is the problem of what to produce. 4
9. 2∆P720Q6P600Q8P 1100 −=====
120∆Q =
PP
QQe 0
0dd ∆
×∆
=
1
28
600120
−×= 1½
8.0−= ½
Its demand is inelastic because when
dde
is less than one, it is called inelasticdemand. 1

128
10. Consumer equilibrium means a situation when a consumer buys that much quantityof a commodity which gives him maximum utility. How many units of the commodityhe should buy is explained with the help of marginal utility schedule given below.
Units consumed of ‘A’ Marginal utility of ‘A’1 142 123 104 8 2
Suppose the price of A is Rs. 5/- per unit and the marginal utility of each rupee tohim is 2. Then for each unit of A he has to sacrifice 10 utility. He will compare themarginal utility of each unit of A with the utility he sacrifices. He will go on buyingtill the M.U. of A is equal to the utility that he sacrifices. From the table it is clear,that he will buy 3 units because at 3rd unit, what he pays is just equal to what hegets. So he is in equilibrium. 4
OR
Related good, can be substitute or complementary. 2
When the price of substitute good falls (rises) it becomes relatively cheaper (costlier),so it is substituted (gets substituted) for the given commodity. So the demand forthe commodity decreases (increases). This results in a rightward (leftward) shift ofdemand curve.
1
When price of complementary good falls (rises) its quantity demanded rises (falls).The demand for given commodity increases (decreases) as complementary goodsare used together. This will cause a rightward (leftward) shift of demand curve ofgiven commodity. 2

129
1
11. The law of variable proportion states that to increase production as more andmore unit of a variable factor are applied with fixed factors, the proportion inwhich the factor of production are used, varies. The total and marginal physicalproduct changes as shown in the diagram. 1
3
TPP increases at an increasing rate upto point ‘A’. Then it increases at decreasingrate upto point ‘C’ beyond point ‘C’, it decreases. 1
MPP is increasing upto point ‘B’. Then it decreases but is positive upto point ‘D’ beyond which it is negative. 1
130
12. An increase in demand of a commodity results in a rightward shift of demandcurve as shown by dotted demand curve in the diagram.
2
The original equilibrium price is OP and equilibrium quantity is OQ. When demandcurve shifts to right, the quantity demanded at OP price exceeds the quantitysupplied by TR. This will result in competition among buyers. This will raise theprice. At a higher price, quantity demanded will fall and quantity supplied willincrease, resulting in upward movement along new demand curve and given supplycurve. This reduces the gap between quantity demanded and quantity supplied.These changes continues till we reach the price OP1 at which quantity demandedis equal to quantity supplied. 3
OP1 is new equilibrium price which is higher than old equilibrium price. Newequilibrium quantity is OQ1 which is also higher than old equilibrium quantity. 1
SECTION 'B'
13. (i) Because repayment of loan reduces the liability. 1(ii) It is the study of the economy as a whole. 1(iii) Balance of trade is the difference between value of exports and imports of
goods. 1(iv) (i) Study of consumer’s equilibrium
(ii) Study of price determination of a commodity etc. ½×2
14. Gross value added at factor cost = (i) + [(iii) - (ii)] - (iv) + (vi) 1= 500 + (20 – 30) – 300 + 40 1½= Rs. 230 thousand ½
131
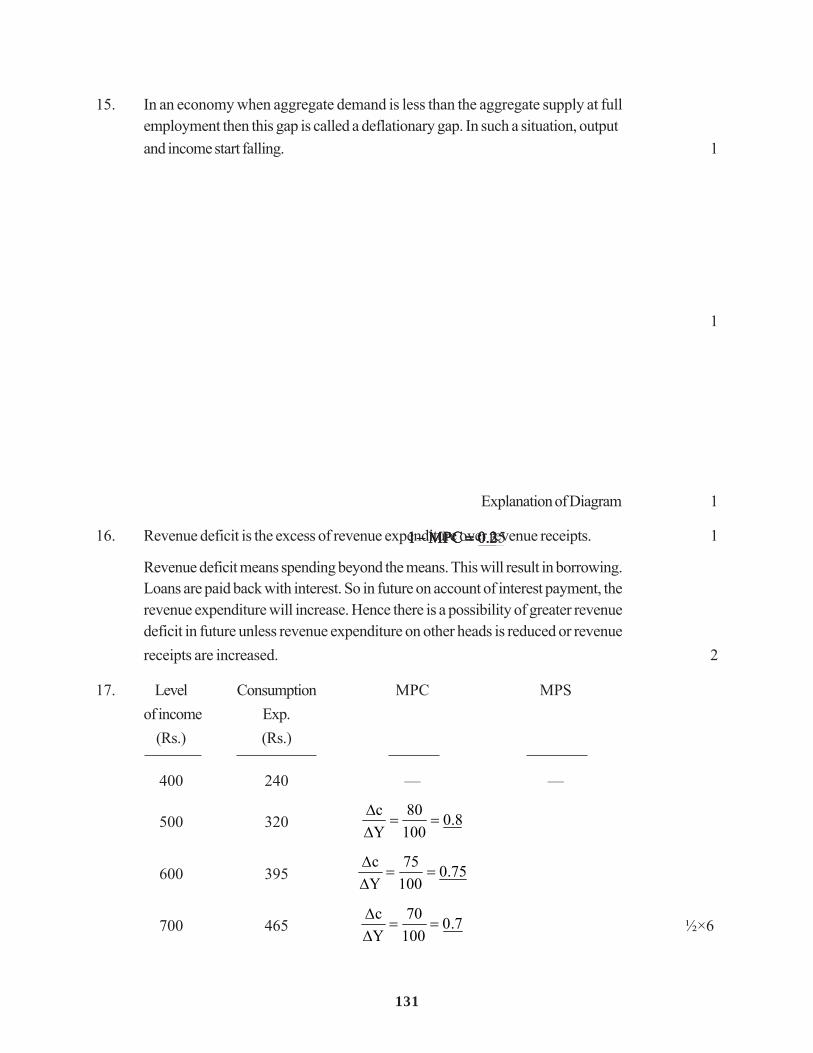
15. In an economy when aggregate demand is less than the aggregate supply at fullemployment then this gap is called a deflationary gap. In such a situation, outputand income start falling. 1
1
Explanation of Diagram 1
16. Revenue deficit is the excess of revenue expenditure over revenue receipts. 1
Revenue deficit means spending beyond the means. This will result in borrowing.Loans are paid back with interest. So in future on account of interest payment, therevenue expenditure will increase. Hence there is a possibility of greater revenuedeficit in future unless revenue expenditure on other heads is reduced or revenuereceipts are increased. 2
17. Level Consumption MPC MPSof income Exp.
(Rs.) (Rs.)
400 240 — —
500 320 8.010080
Yc
==∆∆
2.0MPC1 =−
600 395 75.010075
Yc
==∆∆
25.0MPC1 =−
700 465 7.010070
Yc
==∆∆
3.0MPC1 =−
½×6
132
18. Main functions of a central bank are :(i) Currency authority or Bank of issue(ii) Banker to the Government(iii) Controller of money supply and credit(iv) Lender of the last resort. etc.
(Only four) 1×419. Visible items refer to items relating to trading in goods with other countries. Invisible
items refer to items relating to trading of services with other countries and unilateraltransfers. 3
Two examples of invisible items are :(1) Transport services(2) Insurance and banking etc.
(Any two) ½×2
OR
The rate at which one currency is exchanged for another currency. 1
The three reasons are –
(1) To import from other countries(2) To send a gift abroad(3) To purchase financial assets abroad, etc.
(Any three) 1×320. Main functions of a commercial bank are :
(i) Accepting Deposits(ii) Giving loans(iii) Discounting Bills of Exchange(iv) Acts as an agent of its customers, collecting and making payments on their
behalf.Any two ½×2
Explanation 1½×2
21. (i) Revenue receipts are receipts that neither create a liability nor reduce anasset whereas capital receipt either create a liability or reduce an asset. 2
(ii) When the liability to pay and the burden of a tax falls on the same person, itis a direct tax. When the burden of a tax can be shifted to some other person,it is an indirect tax. 2
22. (a) Personal disposable income = (i) – (v) – (x) – (ix) 1= 3000 – 600 – 350 – 300 1½= Rs. 1750 crores ½
133
(b) National Income = (ii) + (iii) + (vi) + (vii) + (xiii) + (iv) 1= 800 + 900 + 350 + 600 + 450 - 50 1½= Rs. 3050 crores ½
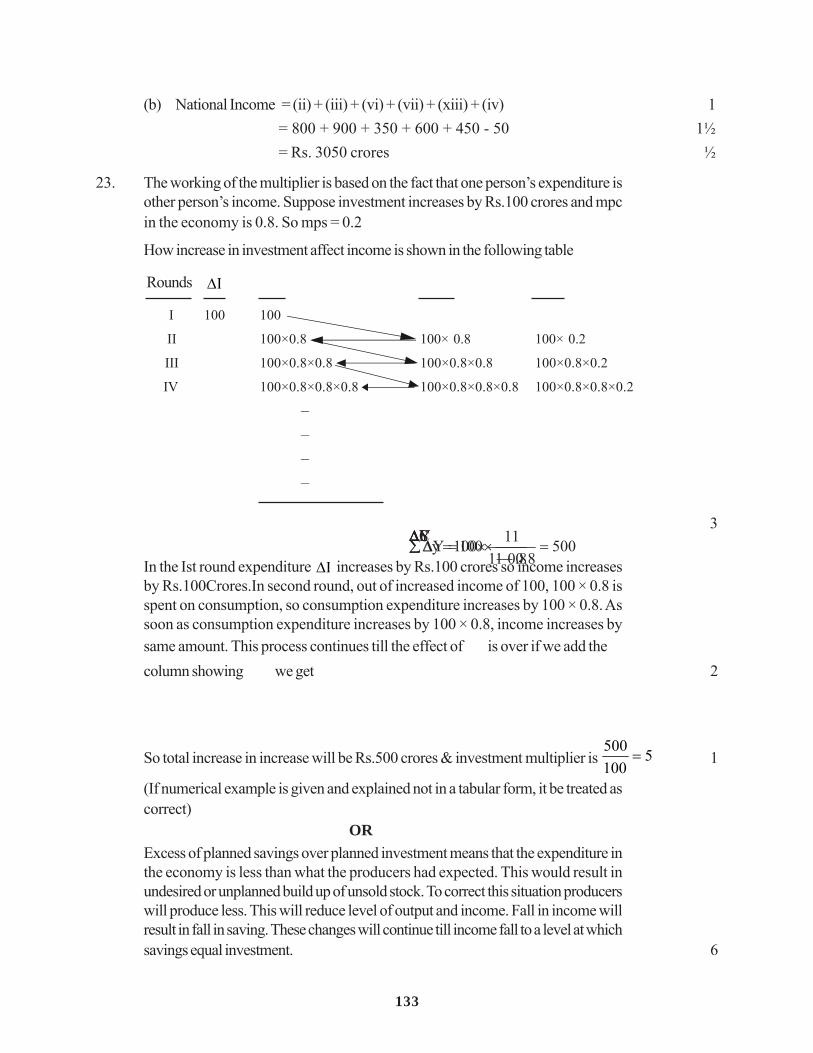
23. The working of the multiplier is based on the fact that one person’s expenditure isother person’s income. Suppose investment increases by Rs.100 crores and mpcin the economy is 0.8. So mps = 0.2
How increase in investment affect income is shown in the following table
Rounds I∆
Y∆C∆S∆
I 100 100
II 100×0.8 100× 0.8 100× 0.2
III 100×0.8×0.8 100×0.8×0.8 100×0.8×0.2
IV 100×0.8×0.8×0.8 100×0.8×0.8×0.8 100×0.8×0.8×0.2
– – – –
8.011100y−
×=∆∑3
In the Ist round expenditure I∆ increases by Rs.100 crores so income increasesby Rs.100Crores.In second round, out of increased income of 100, 100 × 0.8 isspent on consumption, so consumption expenditure increases by 100 × 0.8. Assoon as consumption expenditure increases by 100 × 0.8, income increases bysame amount. This process continues till the effect of
I∆
is over if we add thecolumn showing
Y∆
we get 2
5008.01
1100Y =−
×=∆∑
So total increase in increase will be Rs.500 crores & investment multiplier is 5100500
= 1
(If numerical example is given and explained not in a tabular form, it be treated ascorrect)
ORExcess of planned savings over planned investment means that the expenditure inthe economy is less than what the producers had expected. This would result inundesired or unplanned build up of unsold stock. To correct this situation producerswill produce less. This will reduce level of output and income. Fall in income willresult in fall in saving. These changes will continue till income fall to a level at whichsavings equal investment. 6
134
24. (a) Total production within the domestic territory is called domestic productwhereas total production by the resident of a country is called national product. 2
Examples ½×2(b) A product which is purchased by one production unit from another for resale
is called intermediate product whereas a product purchased for investmentor for consumption is called a final product. 2
Examples ½×2
QUESTION PAPER CODE 58/1
EXPECTED ANSWERS/VALUE POINTS
SECTION ‘A’
1. (i) It is a technological relationship between physical inputs and physical output. 1(ii) The level of output at which producer earns maximum profit. 1(iii) Rise in price. 1(iv) Perfect competition. 1
2. Law of demand states that there is an inverse relationship between the price andquantity demanded of a good, other things remaining the same. 1
Price(Rs.) Quantity demanded(Units)5 20 14 253 30
The above schedule shows that as price falls quantity demanded rises. 1
3. The three causes of increase in supply of a commodity are:(i) Improvement in technology(ii) Decrease in prices of other goods(iii) Fall in prices of inputs.(iv) Fall in excise tax rate
(Any three) 1×3
4. When marginal revenue is less than average revenue, average revenue falls. 1When marginal revenue is equal to average revenue, average revenue is constant. 1When marginal revenue is greater than average revenue, average revenue rises. 1
5. Main features of a monopoly market are :(i) There is a single seller(ii) There is no close substitute of the product(iii) No freedom of entry of new firms 1×3
135
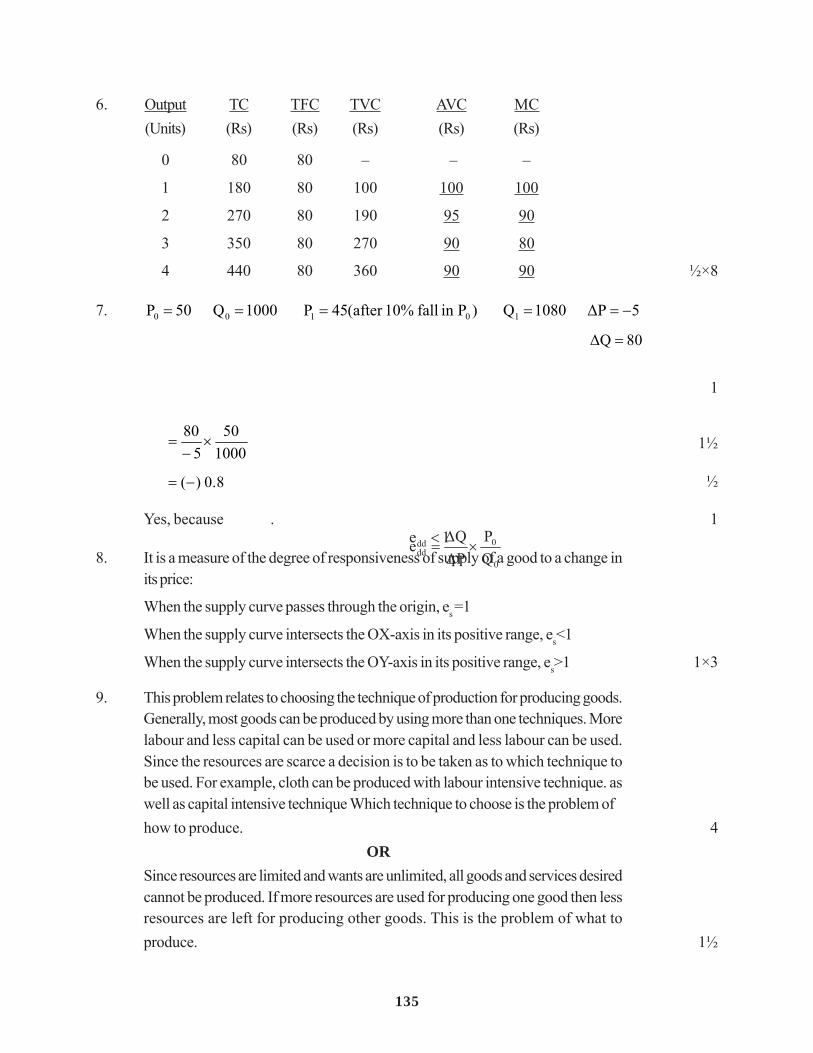
6. Output TC TFC TVC AVC MC(Units) (Rs) (Rs) (Rs) (Rs) (Rs)
0 80 80 – – –
1 180 80 100 100 100
2 270 80 190 95 90
3 350 80 270 90 80
4 440 80 360 90 90 ½×8
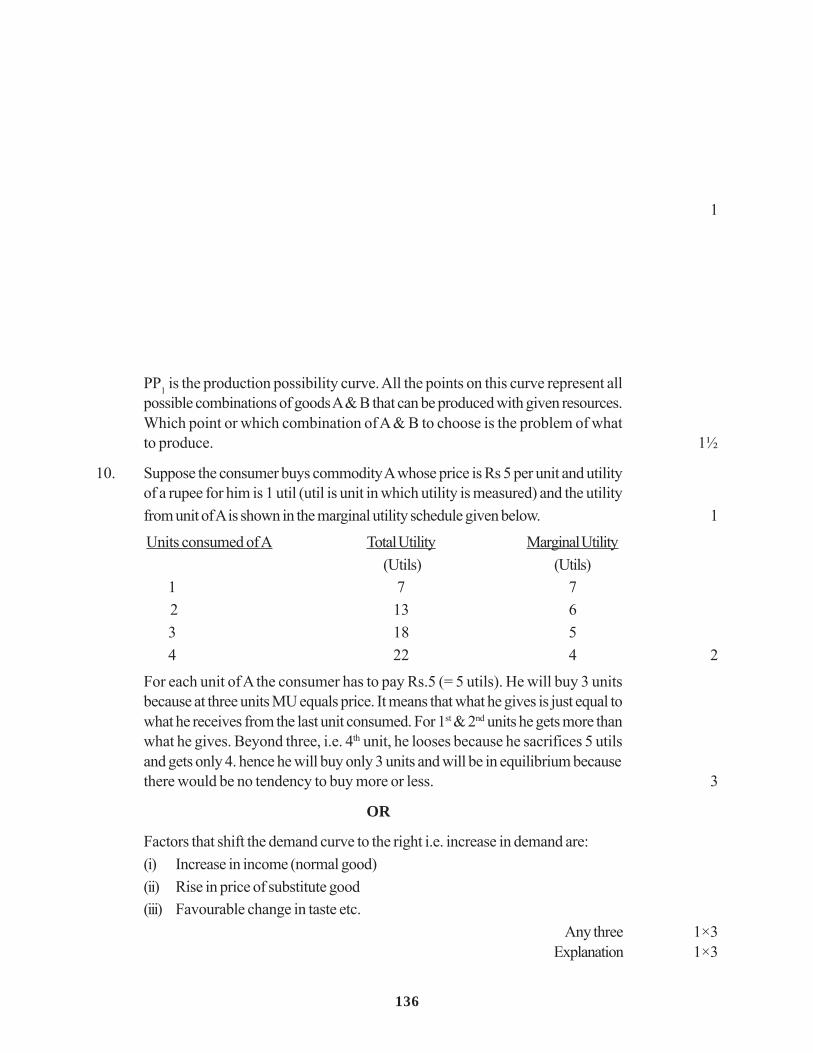
7. 5∆P0801Q)Pinfall%10after(54P0001Q05P 10100 −=====
08∆Q =
0
0dd Q
PPQe ×∆∆
=
1
100050
580
×−
= 1½
8.0)(−= ½
Yes, because 1edd <
. 1
8. It is a measure of the degree of responsiveness of supply of a good to a change inits price:
When the supply curve passes through the origin, es =1
When the supply curve intersects the OX-axis in its positive range, es<1
When the supply curve intersects the OY-axis in its positive range, es>1 1×3
9. This problem relates to choosing the technique of production for producing goods.Generally, most goods can be produced by using more than one techniques. Morelabour and less capital can be used or more capital and less labour can be used.Since the resources are scarce a decision is to be taken as to which technique tobe used. For example, cloth can be produced with labour intensive technique. aswell as capital intensive technique Which technique to choose is the problem ofhow to produce. 4
ORSince resources are limited and wants are unlimited, all goods and services desiredcannot be produced. If more resources are used for producing one good then lessresources are left for producing other goods. This is the problem of what toproduce. 1½
136
1
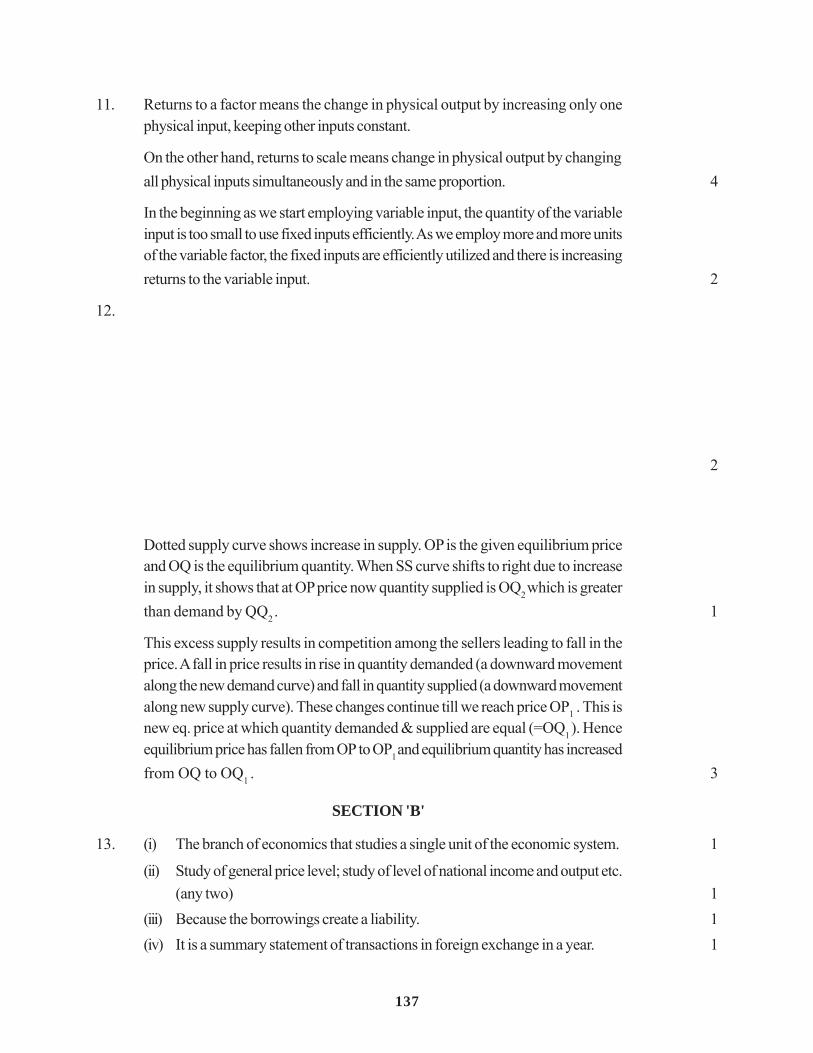
PP1 is the production possibility curve. All the points on this curve represent allpossible combinations of goods A & B that can be produced with given resources.Which point or which combination of A & B to choose is the problem of whatto produce. 1½
10. Suppose the consumer buys commodity A whose price is Rs 5 per unit and utilityof a rupee for him is 1 util (util is unit in which utility is measured) and the utilityfrom unit of A is shown in the marginal utility schedule given below. 1
Units consumed of A Total Utility Marginal Utility (Utils) (Utils)
1 7 7 2 13 63 18 54 22 4 2
For each unit of A the consumer has to pay Rs.5 (= 5 utils). He will buy 3 unitsbecause at three units MU equals price. It means that what he gives is just equal towhat he receives from the last unit consumed. For 1st & 2nd units he gets more thanwhat he gives. Beyond three, i.e. 4th unit, he looses because he sacrifices 5 utilsand gets only 4. hence he will buy only 3 units and will be in equilibrium becausethere would be no tendency to buy more or less. 3
OR
Factors that shift the demand curve to the right i.e. increase in demand are:(i) Increase in income (normal good)(ii) Rise in price of substitute good(iii) Favourable change in taste etc.
Any three 1×3Explanation 1×3
137
11. Returns to a factor means the change in physical output by increasing only onephysical input, keeping other inputs constant.
On the other hand, returns to scale means change in physical output by changingall physical inputs simultaneously and in the same proportion. 4
In the beginning as we start employing variable input, the quantity of the variableinput is too small to use fixed inputs efficiently. As we employ more and more unitsof the variable factor, the fixed inputs are efficiently utilized and there is increasingreturns to the variable input. 2
12.
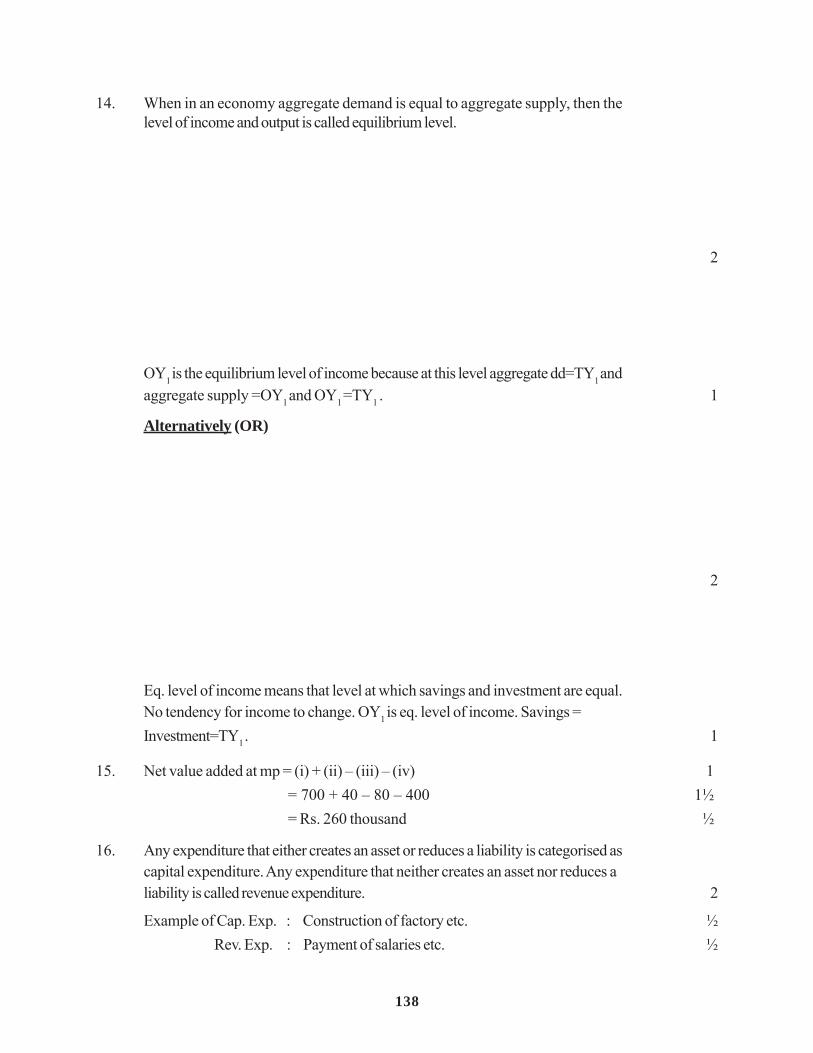
2
Dotted supply curve shows increase in supply. OP is the given equilibrium priceand OQ is the equilibrium quantity. When SS curve shifts to right due to increasein supply, it shows that at OP price now quantity supplied is OQ2 which is greaterthan demand by QQ2 . 1
This excess supply results in competition among the sellers leading to fall in theprice. A fall in price results in rise in quantity demanded (a downward movementalong the new demand curve) and fall in quantity supplied (a downward movementalong new supply curve). These changes continue till we reach price OP1 . This isnew eq. price at which quantity demanded & supplied are equal (=OQ1 ). Henceequilibrium price has fallen from OP to OP1 and equilibrium quantity has increasedfrom OQ to OQ1 . 3
SECTION 'B'
13. (i) The branch of economics that studies a single unit of the economic system. 1
(ii) Study of general price level; study of level of national income and output etc.(any two) 1
(iii) Because the borrowings create a liability. 1(iv) It is a summary statement of transactions in foreign exchange in a year. 1
138
14. When in an economy aggregate demand is equal to aggregate supply, then thelevel of income and output is called equilibrium level.
2
OY1 is the equilibrium level of income because at this level aggregate dd=TY1 andaggregate supply =OY1 and OY1 =TY1 . 1
Alternatively (OR)
2
Eq. level of income means that level at which savings and investment are equal.No tendency for income to change. OY1 is eq. level of income. Savings =Investment=TY1 . 1
15. Net value added at mp = (i) + (ii) – (iii) – (iv) 1= 700 + 40 – 80 – 400 1½= Rs. 260 thousand ½
16. Any expenditure that either creates an asset or reduces a liability is categorised ascapital expenditure. Any expenditure that neither creates an asset nor reduces aliability is called revenue expenditure. 2
Example of Cap. Exp. : Construction of factory etc. ½Rev. Exp. : Payment of salaries etc. ½
139
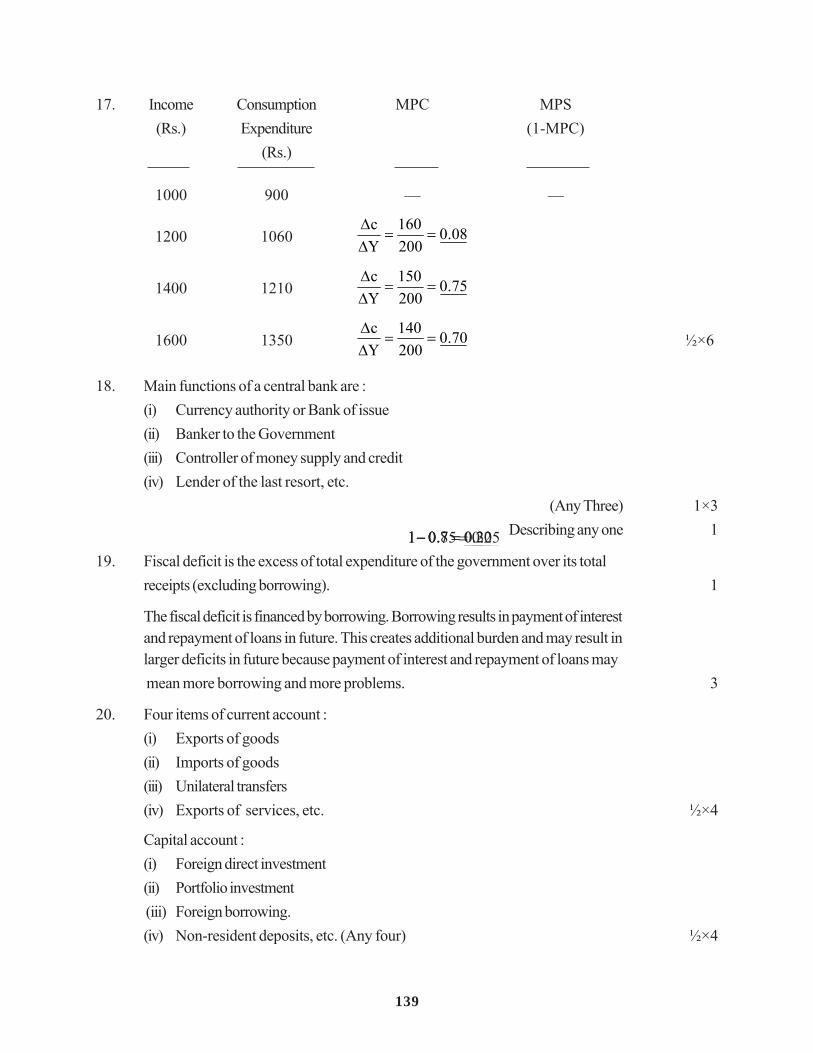
17. Income Consumption MPC MPS(Rs.) Expenditure (1-MPC)
(Rs.)
1000 900 — —
1200 1060 08.0200160
Yc
==∆∆
20.08.01 =−
1400 1210 75.0200150
Yc
==∆∆
25.075.01 =−
1600 1350 70.0200140
Yc
==∆∆
3.07.01 =−
½×6
18. Main functions of a central bank are :(i) Currency authority or Bank of issue(ii) Banker to the Government(iii) Controller of money supply and credit(iv) Lender of the last resort, etc.
(Any Three) 1×3Describing any one 1
19. Fiscal deficit is the excess of total expenditure of the government over its totalreceipts (excluding borrowing). 1
The fiscal deficit is financed by borrowing. Borrowing results in payment of interestand repayment of loans in future. This creates additional burden and may result inlarger deficits in future because payment of interest and repayment of loans may mean more borrowing and more problems. 3
20. Four items of current account :(i) Exports of goods(ii) Imports of goods(iii) Unilateral transfers(iv) Exports of services, etc. ½×4
Capital account :(i) Foreign direct investment(ii) Portfolio investment (iii) Foreign borrowing.(iv) Non-resident deposits, etc. (Any four) ½×4
140
OR
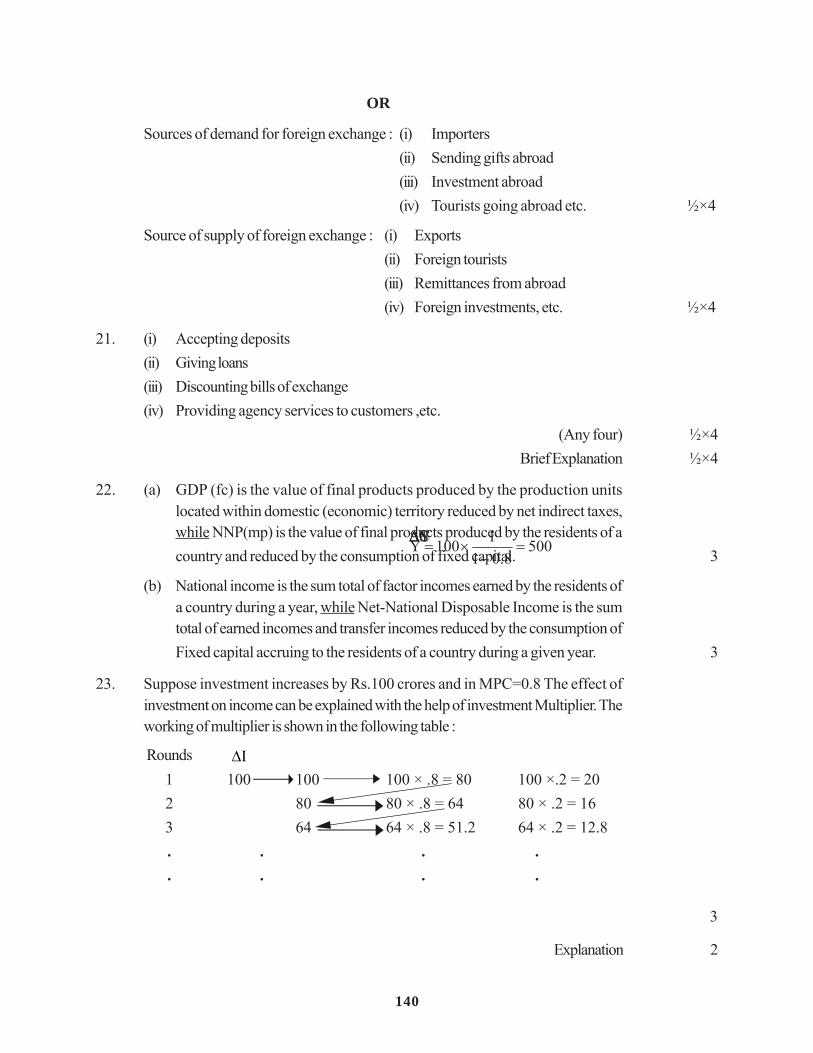
Sources of demand for foreign exchange : (i) Importers(ii) Sending gifts abroad(iii) Investment abroad(iv) Tourists going abroad etc. ½×4
Source of supply of foreign exchange : (i) Exports(ii) Foreign tourists(iii) Remittances from abroad(iv) Foreign investments, etc. ½×4
21. (i) Accepting deposits(ii) Giving loans(iii) Discounting bills of exchange(iv) Providing agency services to customers ,etc.
(Any four) ½×4Brief Explanation ½×4
22. (a) GDP (fc) is the value of final products produced by the production unitslocated within domestic (economic) territory reduced by net indirect taxes,while NNP(mp) is the value of final products produced by the residents of acountry and reduced by the consumption of fixed capital. 3
(b) National income is the sum total of factor incomes earned by the residents ofa country during a year, while Net-National Disposable Income is the sumtotal of earned incomes and transfer incomes reduced by the consumption ofFixed capital accruing to the residents of a country during a given year. 3
23. Suppose investment increases by Rs.100 crores and in MPC=0.8 The effect ofinvestment on income can be explained with the help of investment Multiplier. Theworking of multiplier is shown in the following table :
Rounds I∆
Y∆C∆S∆
1 100 100 100 × .8 = 80 100 ×.2 = 202 80 80 × .8 = 64 80 × .2 = 163 64 64 × .8 = 51.2 64 × .2 = 12.8. . . .. . . .
5008.01
1100Y =−
×=
3
Explanation 2
141
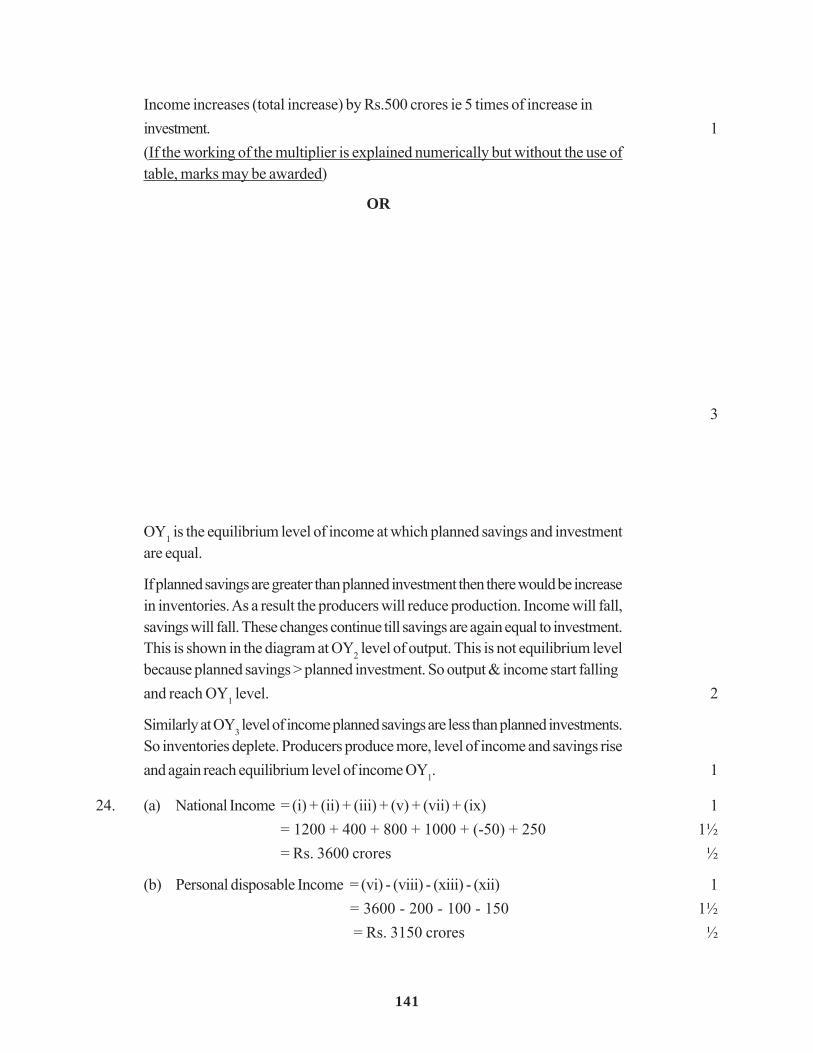
Income increases (total increase) by Rs.500 crores ie 5 times of increase ininvestment. 1(If the working of the multiplier is explained numerically but without the use oftable, marks may be awarded)
OR
3
OY1 is the equilibrium level of income at which planned savings and investmentare equal.
If planned savings are greater than planned investment then there would be increasein inventories. As a result the producers will reduce production. Income will fall,savings will fall. These changes continue till savings are again equal to investment.This is shown in the diagram at OY2 level of output. This is not equilibrium levelbecause planned savings > planned investment. So output & income start fallingand reach OY1 level. 2
Similarly at OY3 level of income planned savings are less than planned investments.So inventories deplete. Producers produce more, level of income and savings riseand again reach equilibrium level of income OY1. 1
24. (a) National Income = (i) + (ii) + (iii) + (v) + (vii) + (ix) 1= 1200 + 400 + 800 + 1000 + (-50) + 250 1½= Rs. 3600 crores ½
(b) Personal disposable Income = (vi) - (viii) - (xiii) - (xii) 1= 3600 - 200 - 100 - 150 1½ = Rs. 3150 crores ½