REVISE AQA: GCSE French Revision Guide (REVISE AQA GCSE MFL 09)
description
WORKBOOK ANSWERS AQA A2 Economics Unit 3 Business Economics and the Distribution of IncomeThis Answers book provides answers for the questions asked in the workbook. They are intended as a guide to give teachers and students feedback. The candidate responses supplied here for the longer essay-style questions are intended to give some idea about how the exam questions might be answered. The examiner commentaries (underlined text) have been added to give you some sense of what is rewarded in the exam and which areas can be developed. Again, these are not the only ways to answer such questions but they can be treated as one way of approaching questions of these types.
Topic 1 The firm: objectives, costs and revenues1 Both private and public companies are privately owned capitalist business enterprises. The difference
stems from their ownership. Private companies are owned by private shareholders who can choose the buyer of their shares. Public company shares are listed on the stock market, which means that they have to comply with the rules of the stock market and any member of the public can buy shares in the company.
2 An excess of sales receipts over the spending of a business during a period of time, which can be calculated using the formula: profit = revenue – costs.
3 At any level of output, revenue is calculated by multiplying output by the price at which each unit of output is sold. In perfect competition, because it is always possible to increase sales revenue by selling more units of output, the revenue-maximising level of output does not exist. In other market structures, including monopoly and oligopoly, marginal revenue falls as more units of the good are sold. Revenue maximisation occurs at the level of output at which marginal revenue is zero (MR = 0). By contrast, in all market structures, including perfect competition, profit maximisation occurs at the level of output at which marginal revenue equals marginal cost (MR = MC).
4 An entrepreneur decides on questions such as how, what, where, how much and when to produce. Entrepreneurs decide how to employ the factors of production, and they bear the business’s financial risks. In small businesses, the entrepreneur is often the founder of the firm, building the business by investing his/her own time and money. The entrepreneur directly manages the business and takes the important decisions about its direction and strategy.
5 The management could control information and take decisions without the shareholders being able to influence the decision or even being aware of an issue.
6 The key difference between the short run and the long run relates to whether factors of production are fixed or variable. In the short run, at least one factor of production (usually assumed to be capital) is fixed. Labour is assumed to be variable. In the long run, all factors of production are variable and none is fixed.
7 This question is the obverse of question 6. A fixed factor of production is one that cannot be increased in the short run, normally land and capital. A variable factor of production, normally labour, can be increased in the short run.
AQA A2 Economics Unit 3 Business Economics and the Distribution of Income 1
Philip Allan, an imprint of Hodder Education © Ray Powell, James Powell
TOPIC 1 The firm: objectives, costs and revenues
8 The law of diminishing returns sets in when units of a variable factor of production, such as labour, are added to fixed factors of production. Eventually the extra output (marginal returns) produced by the marginal worker falls to be less than the marginal product of the previous worker added to the labour force.
9 (i) The firm increases the scale of production and experiences a more than proportionate increase in output.
(ii) The firm increases the scale of production and experiences a proportionate increase in output.
(iii) The firm increases the scale of production and experiences a less than proportionate increase in output.
10
11 Average variable costs are total variable costs divided by the size of output. Average total costs are total costs divided by the size of output. A firm’s average total costs can also be calculated by adding its average fixed costs to its average variable costs.
12 Technical economies of scale occur when a firm’s production methods benefit significantly from increasing to a larger scale. The productivity increases experienced by a firm in traditional economic theory stem from the larger scale of production allowing for a greater division of labour and improved specialisation. Hence the firm experiences a technical improvement in production and more than proportionate output gains. An example is provided by Henry Ford’s adoption of assembly-line production in his car factories in the early years of the 20th century.
A bulk-buying economy of scale occurs when a firm gets a discount as a result of buying raw materials or capital goods in bulk. For example, a school may be able to buy 100 computers at £300 each, whereas a single computer would be priced at £600.
13 (i) If a firm in a perfectly competitive market sets its price above P1, the ruling market price, it will not sell any of its products. This is because its products are identical to those of its competitors, and buyers who possess perfect market information and will buy from the cheaper rival firms selling at the ruling market price.
(ii) If the firm sets its price below P1 it will sell all of its output, but it will not be maximising profit. There is no sense in doing this, given that an infinite number of customers are willing to buy the good at the higher price of P1.
AQA A2 Economics Unit 3 Business Economics and the Distribution of Income 2
Philip Allan, an imprint of Hodder Education © Ray Powell, James Powell

TOPIC 1 The firm: objectives, costs and revenues
14 You can understand this question by referring back to the answer to question 3. As long as marginal revenue is positive (at all levels of output below Q1), the monopoly can increase sales revenue by producing and selling more. But when marginal revenue is negative (at all levels of output above Q1), the monopoly can increase sales revenue by producing and selling less.
Exam-style answers (essay)01 The laws of diminishing returns and returns to scale are both parts of production theory. (The law of diminishing returns is also known as the law of diminishing marginal productivity.) Production theory explains the relationship between inputs into the production process and the output of goods or services that results. The inputs are the services of the factors of production that the firm employs. The basic nature of production is shown in the diagram below.
Production theory divides into short-run production theory and long-run production theory. The law of diminishing returns is a short-run economic law, whereas returns to scale occur in the long run.
The law of diminishing returns has the status of an economic ‘law’, because in the short run at least one of the factors of production (usually assumed to be capital) is held fixed. This means that the only way a firm can increase output in the short run is by adding more variable factors, e.g. labour, to fixed capital. Eventually, as labour is added to fixed capital, an extra worker (the marginal worker) gets in the way of the already existing labour force and the additional output attributable to the marginal worker begins to fall. This is when the law of diminishing returns has set in.
Returns to scale by contrast occur in the long run when all the factors of production increase. The firm increases its scale or size of operation. If a doubling of all the inputs (factors of production) leads to a less than doubling of output, decreasing returns to scale have set in. (Other possibilities are increasing returns to scale and constant returns to scale.)
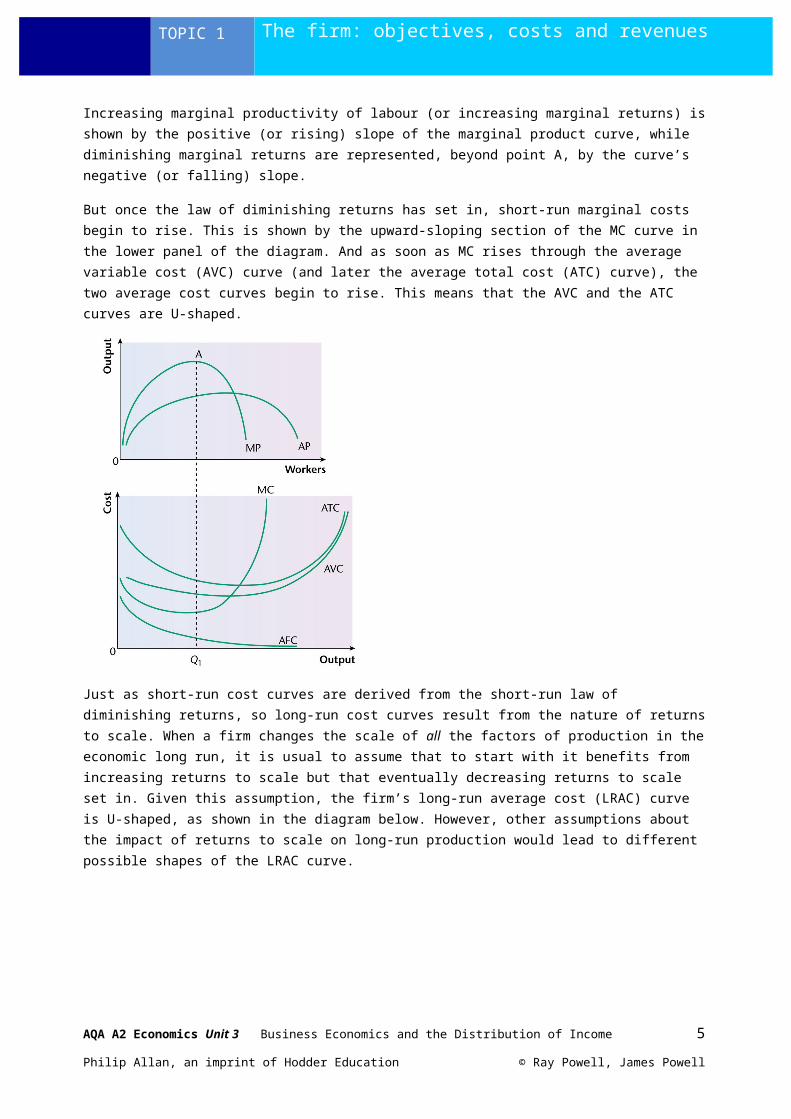
To understand the relationship between the law of diminishing returns and short-run cost curves, consider the diagram on the next page.
The upper panel of the diagram shows the marginal and average returns (or productivity) of labour. Diminishing marginal returns begin at point A. Increasing marginal productivity of labour (or increasing marginal returns) is shown by the positive (or rising) slope of the marginal product curve, while diminishing marginal returns are represented, beyond point A, by the curve’s negative (or falling) slope.
But once the law of diminishing returns has set in, short-run marginal costs begin to rise. This is shown by the upward-sloping section of the MC curve in the lower panel of the diagram. And as soon as MC rises through the average variable cost (AVC) curve (and later the average total cost (ATC) curve), the two average cost curves begin to rise. This means that the AVC and the ATC curves are U-shaped.
AQA A2 Economics Unit 3 Business Economics and the Distribution of Income 3
Philip Allan, an imprint of Hodder Education © Ray Powell, James Powell

TOPIC 1 The firm: objectives, costs and revenues
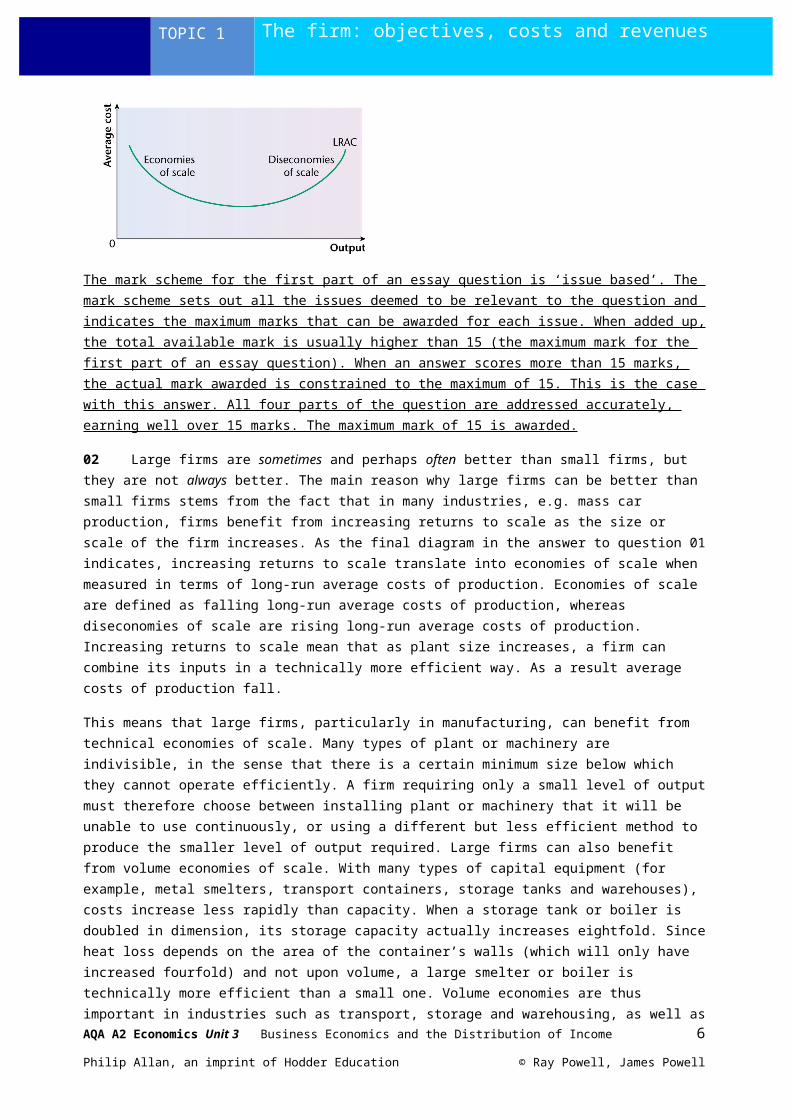
Just as short-run cost curves are derived from the short-run law of diminishing returns, so long-run cost curves result from the nature of returns to scale. When a firm changes the scale of all the factors of production in the economic long run, it is usual to assume that to start with it benefits from increasing returns to scale but that eventually decreasing returns to scale set in. Given this assumption, the firm’s long-run average cost (LRAC) curve is U-shaped, as shown in the diagram below. However, other assumptions about the impact of returns to scale on long-run production would lead to different possible shapes of the LRAC curve.
The mark scheme for the first part of an essay question is ‘issue based’. The mark scheme sets out all the issues deemed to be relevant to the question and indicates the maximum marks that can be awarded for each issue. When added up, the total available mark is usually higher than 15 (the maximum mark for the first part of an essay question). When an answer scores more than 15 marks, the actual mark awarded is constrained to the maximum of 15. This is the case with this answer. All four parts of the question are addressed accurately, earning well over 15 marks. The maximum mark of 15 is awarded.
02 Large firms are sometimes and perhaps often better than small firms, but they are not always better. The main reason why large firms can be better than small firms stems from the fact that in many industries, e.g. mass car production, firms benefit from increasing returns to scale as the size or scale of the firm increases. As the final diagram in the answer to question 01 indicates, increasing returns to scale translate into economies of scale when measured in terms of long-run average costs of production. Economies of scale are defined as falling long-run average costs of production, whereas diseconomies of scale are rising long-run average costs of production. Increasing returns to scale mean that as plant size increases, a firm can combine its inputs in a technically more efficient way. As a result average costs of production fall.
AQA A2 Economics Unit 3 Business Economics and the Distribution of Income 4
Philip Allan, an imprint of Hodder Education © Ray Powell, James Powell
TOPIC 1 The firm: objectives, costs and revenues
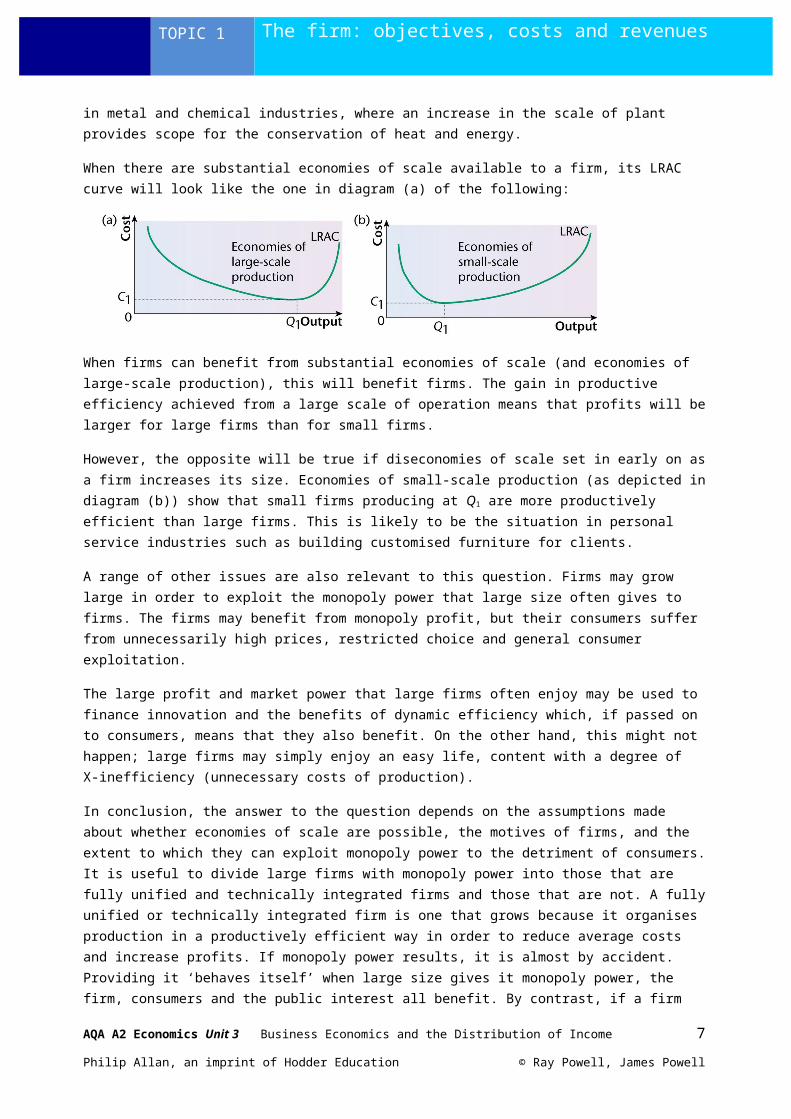
This means that large firms, particularly in manufacturing, can benefit from technical economies of scale. Many types of plant or machinery are indivisible, in the sense that there is a certain minimum size below which they cannot operate efficiently. A firm requiring only a small level of output must therefore choose between installing plant or machinery that it will be unable to use continuously, or using a different but less efficient method to produce the smaller level of output required. Large firms can also benefit from volume economies of scale. With many types of capital equipment (for example, metal smelters, transport containers, storage tanks and warehouses), costs increase less rapidly than capacity. When a storage tank or boiler is doubled in dimension, its storage capacity actually increases eightfold. Since heat loss depends on the area of the container’s walls (which will only have increased fourfold) and not upon volume, a large smelter or boiler is technically more efficient than a small one. Volume economies are thus important in industries such as transport, storage and warehousing, as well as in metal and chemical industries, where an increase in the scale of plant provides scope for the conservation of heat and energy.
When there are substantial economies of scale available to a firm, its LRAC curve will look like the one in diagram (a) of the following:
When firms can benefit from substantial economies of scale (and economies of large-scale production), this will benefit firms. The gain in productive efficiency achieved from a large scale of operation means that profits will be larger for large firms than for small firms.
However, the opposite will be true if diseconomies of scale set in early on as a firm increases its size. Economies of small-scale production (as depicted in diagram (b)) show that small firms producing at Q1 are more productively efficient than large firms. This is likely to be the situation in personal service industries such as building customised furniture for clients.
A range of other issues are also relevant to this question. Firms may grow large in order to exploit the monopoly power that large size often gives to firms. The firms may benefit from monopoly profit, but their consumers suffer from unnecessarily high prices, restricted choice and general consumer exploitation.
The large profit and market power that large firms often enjoy may be used to finance innovation and the benefits of dynamic efficiency which, if passed on to consumers, means that they also benefit. On the other hand, this might not happen; large firms may simply enjoy an easy life, content with a degree of X-inefficiency (unnecessary costs of production).
In conclusion, the answer to the question depends on the assumptions made about whether economies of scale are possible, the motives of firms, and the extent to which they can exploit monopoly power to the detriment of consumers. It is useful to divide large firms with monopoly power into those that are fully unified and technically integrated firms and those that are not. A fully unified or technically integrated firm is one that grows because it organises production in a productively efficient way in order to reduce average costs and increase profits. If monopoly power results, it is almost by accident. Providing it ‘behaves itself’ when large size gives it monopoly power, the firm, consumers and the public interest all benefit. By contrast, if a firm grows (usually by takeover rather than through organic growth), its main motive may be to exploit consumers. Clearly such firms are not ‘best’.
AQA A2 Economics Unit 3 Business Economics and the Distribution of Income 5
Philip Allan, an imprint of Hodder Education © Ray Powell, James Powell
TOPIC 1 The firm: objectives, costs and revenues
The mark scheme for the second part of an essay question is ‘level of skill based’. Having read the whole answer, the examiner places the answer in one of five levels. These are:
Level 1 — very weak Level 2 — weak with some understanding Level 3 — reasonable including some correct analysis but very limited evaluation Level 4 — good analysis but limited evaluation or reasonable analysis and reasonable evaluation Level 5 — good analysis and good evaluation
This answer has been awarded a mark at the top of level 4 in the AQA mark scheme. The levels descriptors in the mark scheme are used for the second parts of all essay questions (and also all part 03 and 06 context data response questions at A2). The level 4 descriptor is:
A2Levels mark scheme
AO1 Knowledge and understanding of theories, concepts and terminology
AO2 Application of theories, concepts and terminology
AO3 Analysis of economic problems and issues
AO4 Evaluation of economic arguments and evidence, making informed judgements
Level 417–21 marks(mid-point 19)
Good analysis but limited evaluation
or
Reasonable analysis and reasonable evaluation
Good throughout the answer with few errors and weaknesses
Good throughout much of the answer with few errors and weaknesses
Good application to issuesWhere appropriate, good use of data to support answer
Some good application to issuesWhere appropriate, some good use of data to support answer
Relevant and precise with a clear and logical chain of reasoningThere is good awareness of the interrelatedness of economic issues
Largely relevant and well organised with reasonable logic and coherenceThere is some awareness of the interrelatedness of economic issues
Limited but showing some appreciation of alternative points of view
Reasonable, showing an appreciation of alternative points of view
The answer displays both good analysis and good evaluation, but does not quite reach level 5. Although analysis of economies and diseconomies of scale is excellent, the analysis on monopoly is too thin, based on assertion rather than rigorous development and application of economic theory. Hence the answer is placed at the top of level 4 rather than level 5.
AQA A2 Economics Unit 3 Business Economics and the Distribution of Income 6
Philip Allan, an imprint of Hodder Education © Ray Powell, James Powell
Topic 2 Competitive markets
1 It is impossible for human beings to possess perfect information about what is happening in a market.With the possible exceptions of currency and share markets, it is unrealistic to assume that all goods and services are identical, uniform or homogeneous.
2 Motorists can research similar car models in trade magazines and on the internet to get a picture of the price of cars depending on age, mileage, condition and availability.
3 Whenever marginal revenue exceeds marginal cost (MR > MC), selling an extra unit of output always increases total profit. The extra unit adds more to revenue than it does to costs. But whenever marginal revenue is less than marginal cost (MR < MC), selling an extra unit of output always reduces total profit. The extra unit adds more to costs than it does to revenue. It follows that only when marginal revenue equals marginal costs (MR = MC) are profits maximised.
4 Normal profit is the level of profit made by a firm that provides just sufficient incentive to stay in the market. As a profit level, it is not high enough to attract new firms into the industry to compete with existing firms, or low enough to force firms out of the market.
Supernormal profit is excess profit over and above normal profit. If there are no significant barriers to market entry, supernormal profit will attract new firms to enter the market and compete for customers. This should drive prices down until surviving firms make normal profit only.
5 When the price of a good is greater than the marginal cost of production, the result is allocative inefficiency because the price charged by firms will be greater than the cost of making the last unit. This indicates that the firm is over-charging consumers. Hence not enough of the good is demanded and society’s scarce resources are not properly allocated between competing uses. Allocative inefficiency occurs when P > MC or P < MC. For any given employment of resources and any initial distribution of income and wealth among the population, total consumer welfare can increase if resources are re-allocated from markets where P < MC into those where P > MC, until allocative efficiency is achieved when P = MC in all markets.
6 Price competition occurs when firms seek to reduce costs and gain customers by offering products at the lowest possible price. By offering the good at a low price they hope to create an incentive for the consumer to buy the product.
Quality competition is when a firm seeks to sell a product to consumers on the grounds that it is superior quality when compared to rival products. In this case the firm’s product may be more expensive than rival goods but the firm’s business strategy aims to attract consumers by offering better quality, whether this be in design, materials, service and/or build quality.
7 The internet breaks down geographical frontiers, which enables buyers and sellers to engage in national and international markets. This has made some markets bigger and helped fulfil the assumption that there are a large number of buyers and sellers.
Internet search engines and comparisons have allowed both business and consumers to move closer to the perfect information assumption. Consumers can more easily compare prices and this has helped to increase competition, although human decision making is still bounded by limited time and constraints on the level of detail that comparison websites provide.
Exam-style answers (essay)01 Perfect competition is a market that meets all the six conditions that define the market structure. These are: (i) a very large number of buyers and sellers; (ii) each with perfect market information; (iii) each able to buy or sell as much as it wishes at the ruling market price determined in the market as a whole; (iv) individual buyers and sellers unable to influence the ruling market price through their own actions; (v) a
AQA A2 Economics Unit 3 Business Economics and the Distribution of Income 7
Philip Allan, an imprint of Hodder Education © Ray Powell, James Powell

TOPIC 2 Competitive markets
uniform or identical product; and (vi) an absence of barriers to entry into and exit from the market in the long run, i.e. complete freedom of entry and exit. A barrier to entry prevents new firms from entering a market.
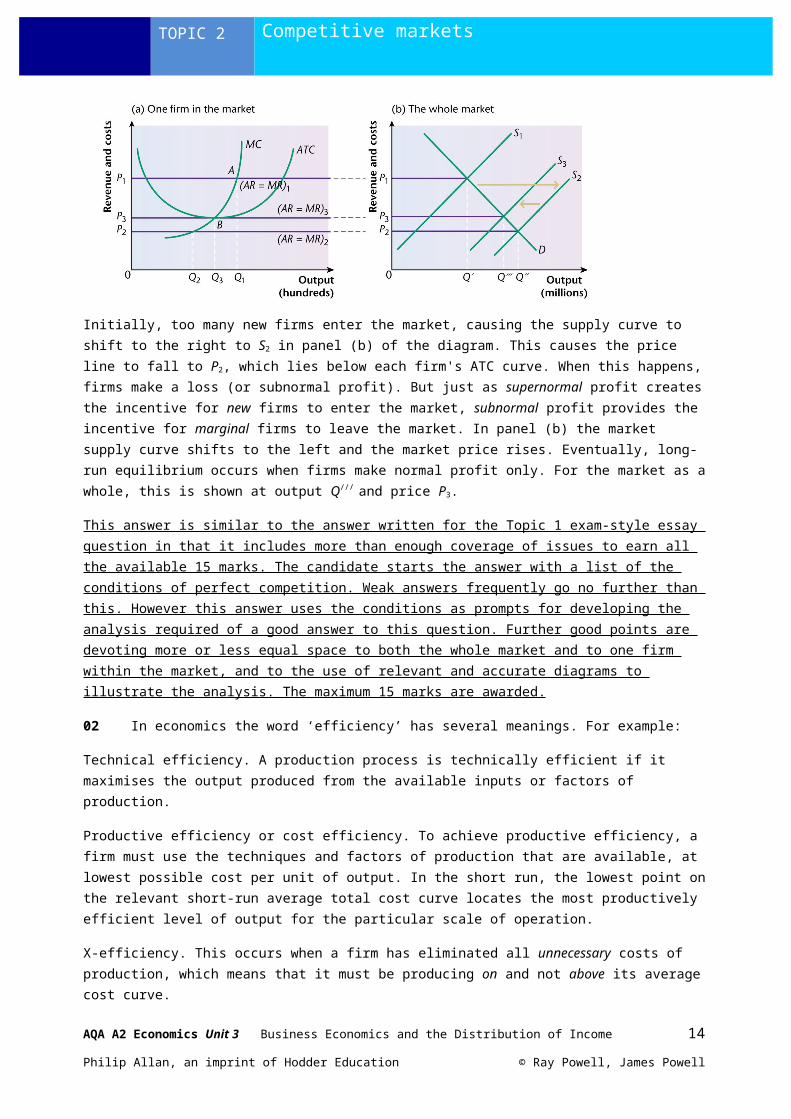
Taken together, these conditions tell us that a perfectly competitive firm, whose AR and MR curves are depicted in panel (a) of the diagram below, faces a perfectly elastic demand curve for its product. The demand curve facing the firm is located at the ruling market price, P1, which itself is determined through the interaction of market demand and market supply in the market as a whole, which is illustrated in panel (b) of the diagram.
The assumption that a perfectly competitive firm can sell whatever quantity it wishes at the ruling market price P1, but that it cannot influence the ruling market price by its own action, means that the firm is a passive price-taker. Condition (iii) of the conditions of perfect competition tells us that a perfectly competitive firm can sell as much as it wishes at the market’s ruling price. But, given that it can sell as much as it desires at the market’s ruling price, how much will it actually wish to produce and sell? Providing we assume that each firm’s business objective is solely to maximise profit, the answer is shown in panel (a) of the next diagram:
Panel (a) in the diagram above adds the perfectly competitive firm’s average total cost (ATC) curve and its marginal cost (MC) curve to the revenue curves shown in the earlier diagram. Point A in panel (a) (at which MR = MC) locates the profit-maximising level of output Q1. At this level of output, total sales revenue is shown by the area OQ1AP1. Total cost is shown by the area OQ1BC1. Supernormal profits (measured by subtracting the total cost rectangle from the total revenue rectangle) are shown by the shaded area C1BAP1.
Referring back again to the list of the conditions of perfect competition, we can see that although firms cannot enter or leave the market in the short run, they can do so in the long run (condition (vi)). Suppose that in the short run, firms make supernormal profit. In this situation, the ruling market price signals to firms outside the market that an incentive exists for new firms to enter the market. The next diagram shows what might then happen:
AQA A2 Economics Unit 3 Business Economics and the Distribution of Income 8
Philip Allan, an imprint of Hodder Education © Ray Powell, James Powell

TOPIC 2 Competitive markets
Initially, too many new firms enter the market, causing the supply curve to shift to the right to S2 in panel (b) of the diagram. This causes the price line to fall to P2, which lies below each firm's ATC curve. When this happens, firms make a loss (or subnormal profit). But just as supernormal profit creates the incentive for new firms to enter the market, subnormal profit provides the incentive for marginal firms to leave the market. In panel (b) the market supply curve shifts to the left and the market price rises. Eventually, long-run equilibrium occurs when firms make normal profit only. For the market as a whole, this is shown at output Q///
and price P3.
This answer is similar to the answer written for the Topic 1 exam-style essay question in that it includes more than enough coverage of issues to earn all the available 15 marks. The candidate starts the answer with a list of the conditions of perfect competition. Weak answers frequently go no further than this. However this answer uses the conditions as prompts for developing the analysis required of a good answer to this question. Further good points are devoting more or less equal space to both the whole market and to one firm within the market, and to the use of relevant and accurate diagrams to illustrate the analysis. The maximum 15 marks are awarded.
02 In economics the word ‘efficiency’ has several meanings. For example:
Technical efficiency. A production process is technically efficient if it maximises the output produced from the available inputs or factors of production.
Productive efficiency or cost efficiency. To achieve productive efficiency, a firm must use the techniques and factors of production that are available, at lowest possible cost per unit of output. In the short run, the lowest point on the relevant short-run average total cost curve locates the most productively efficient level of output for the particular scale of operation.
X-efficiency. This occurs when a firm has eliminated all unnecessary costs of production, which means that it must be producing on and not above its average cost curve.
Allocative efficiency. This occurs when it is impossible to improve overall economic welfare by reallocating resources between industries or markets (assuming an initial ‘fairness’ in the distribution of income and wealth among the population). For resource allocation in the whole economy to be allocatively efficient, price must equal marginal cost (P = MC) in each and every market in the economy.
Dynamic efficiency. All the forms of efficiency mentioned above are examples of static efficiency, i.e. efficiency measured at a particular point in time. By contrast, dynamic efficiency measures improvements in technical and productive efficiency that occur over time. Improvements in dynamic efficiency result from the introduction of better methods of producing existing products (including firms' ability to benefit to a greater extent from economies of scale), and also from developing and marketing completely new products.
AQA A2 Economics Unit 3 Business Economics and the Distribution of Income 9
Philip Allan, an imprint of Hodder Education © Ray Powell, James Powell

TOPIC 2 Competitive markets
The diagram below shows that a perfectly competitive firm achieves both productive and allocative efficiency in the long run, but only under the assumption that there are no economies of scale. The firm is productively efficient because it produces the optimum output at the lowest point on the ATC curve, and it is allocatively efficient because P = MC. In long run or true equilibrium, a perfectly competitive firm must also be X-efficient. The reason is simple. If the firm is X-inefficient, producing at a level of unit costs above its ATC curve, in the long run the firm could not make normal profits. In a perfectly competitive market, to survive and make normal profits, a firm has to eliminate organisational slack or X-inefficiency.
The first sentence in the previous paragraph asserted that perfect competition is efficient provided there are no economies of scale. Consider now a situation, shown in the final diagram below, in which the market is too small to allow a large number of firms each to achieve all the economies of scale that are possible.
For a firm to benefit from economies of scale to the full, and hence to be productively efficient in the long run as well as in the short run, its short-run cost curve would have to be positioned at SRATCN, or indeed further to the right than this. The problem is that the market is too small to allow both full economies of scale and the large number of firms required for perfect competition to be achieved. Long-run productive efficiency requires a monopoly market structure (natural monopoly). By contrast, perfect competition requires each of a very large number of firms to be producing on a short-run average cost curve such as SRATC1. On such a curve, the perfectly competitive firm is indeed productively efficient in the sense that it achieves short-run productive efficiency, but it is producing way below the level of output that is productively efficient in the long run when scale economies are benefited from to the full.
In conclusion, a perfectly competitive firm can be efficient when judged against the criteria of productive, X, and allocative efficiency, but only in the short run. Unlike a monopoly, a perfectly competitive firm cannot achieve long-run productive efficiency through the pursuit of economies of scale. Finally there is another argument, so far not considered, which may mean that perfectly competitive firms fail to produce the allocatively efficient level of output. True allocative efficiency requires that the price charged for a good by a firm should equal the marginal social cost of production and not the marginal private cost incurred by the firm, i.e. P = MSC and not P = MPC. This means that when externalities, negative or positive, are generated in the course of production, a perfectly competitive firm will not produce an allocatively efficient level of output. Nor will the whole market.
AQA A2 Economics Unit 3 Business Economics and the Distribution of Income 10
Philip Allan, an imprint of Hodder Education © Ray Powell, James Powell

TOPIC 2 Competitive markets
This is clearly a level 5 answer which earns full marks. The level descriptors for level 5 are:
A2Levels mark scheme
AO1 Knowledge and understanding of theories, concepts and terminology
AO2 Application of theories, concepts and terminology
AO3 Analysis of economic problems and issues
AO4 Evaluation of economic arguments and evidence, making informed judgements
Level 522–25 marks(mid-point 24)
Good analysis and good evaluation
Good throughout the answer with few errors and weaknesses
Good application to issuesWhere appropriate, good use of data to support answer
Relevant and precise with a clear and logical chain of reasoningThere is good awareness of the interrelatedness of economic issues
Good with a clear final judgement
The question focuses solely on efficiency criteria and not on welfare criteria, namely the consumer surplus members of households enjoy in perfectly competitive markets. Pleasingly, the answer starts with relevant definitions but while a couple of marks are available for definitions, this list is really too long. Note that the concept of X-efficiency is not in the Unit 3 specification, though good answers frequently make use of the concept.
AQA A2 Economics Unit 3 Business Economics and the Distribution of Income 11
Philip Allan, an imprint of Hodder Education © Ray Powell, James Powell

Topic 3 Concentrated markets
1 Water companies such as Thames Water are pure monopolies in the supply of tap water since their customers have no other companies from which they can buy tap water. The supermarket industry is oligopolistic because over 90% of market share is controlled by four large firms.
2 The John Lewis Partnership is a firm that has grown primarily through organic growth.Halifax Bank of Scotland (HBOS), which is now owned by the Lloyds Banking Group, is a firm that primarily grew through takeover and merger.
3 British Gas and Thames Water. Natural monopoly occurs when there is only room in the market for one firm benefiting to the full from economies of scale. In the past, utility industries such as water, gas, electricity and the telephone industries were regarded as natural monopolies. Because of the nature of their product, utility industries experience a particular marketing problem. The industries produce a service that is delivered through a distribution network or grid of pipes and cables into millions of separate businesses and homes. Competition in the provision of distribution grids is extremely wasteful, since it requires the duplication of fixed capacity, therefore causing each supplier to incur unnecessarily high fixed costs. Until quite recently, utility industries were generally monopolies.
4 High barriers to entry prevent new firms from entering the market and competing for profits with the monopoly. Barriers to entry will often take the form of high sunk costs, i.e. billions of pounds of capital investment which enable the firm to operate at the bottom of the long-run average cost (LRAC) curve. Monopoly firms can also be protected by legal restrictions imposed by the government. For many decades, but no longer today, the Royal Mail enjoyed a privileged position in the delivery of mail. Patent and copyright law protects intellectual property rights.
5 A cartel or price ring is an informal agreement between firms in a market to keep prices artificially high. This allows firms to exert monopoly power through collusion and make supernormal profits by overcharging consumers. This allows poorly managed and inefficient firms to continue to make profits and deprives consumers of the lower prices that could be offered by more efficient firms that have more innovative production methods and are less wasteful. Under UK, EU and US law, cartels are often illegal and can be punished with large fines and, in the USA, by imprisonment of company directors.
Cartels can, however, provide benefits to the public. If a cartel can protect firms from the pressures of competition and allow firms to invest in research and development to invent new products, it can be extremely beneficial to the public. Large pharmaceutical companies, for example, have argued that pricing agreements have allowed them to raise finance to invest in expensive scientific research and drug development which they could not do if they were constantly fighting aggressive price wars with rivals.
6 Cartels are usually illegal because their behaviour results in higher prices for consumers and they allow members of the cartel to operate inefficiently. In the case of the cement industry cartel broken up by the European Union competition authorities, firms were able to charge customers artificially high prices for cement, which pushed up the costs of production for the construction and building industry. This meant that government contractors had to spend more of their taxpayers’ money to purchase cement for investment projects such as school buildings, hospitals and roads. Private sector companies also had to pass on higher prices to businesses and households, which depleted levels of household disposable income and reduced households’ ability to spend on other goods and services. Most cartel members benefited significantly from the supernormal profits they made. Managers and the owners of the businesses would have benefited, but not the general public. Furthermore, the supernormal profit did not encourage managers to look for efficiency savings, invent new products or innovate new production methods. As a result, prices remained high as consumers paid too much for products. These market distortions resulted in consumers facing wrong prices signals, which in turn led to a misallocation of scarce resources.
AQA A2 Economics Unit 3 Business Economics and the Distribution of Income 12
Philip Allan, an imprint of Hodder Education © Ray Powell, James Powell

TOPIC 3 Concentrated markets
7 In the original ‘prisoner’s dilemma’, two prisoners are jointly charged with a serious crime such as armed robbery and are held in isolation from each other. The prosecutor, hoping to have his task simplified, knows that a confession from one will convict the other, but he also knows that the available evidence is insufficient to ensure a conviction. If both prisoners plead not guilty, they are likely to go free. Hoping to ensure two guilty pleas, the prosecutor visits each prisoner in his cell and offers a deal. The prosecutor informs each prisoner that he will receive one of two possible outcomes, depending on how he pleads: (i) if both prisoners plead guilty, each will go to prison for one year; and (ii) if one prisoner pleads guilty and the other not guilty, the prisoner pleading guilty will be freed and receive a reward — if he gives evidence to convict the other prisoner — whilst the other prisoner gets a five-year jail sentence. Each prisoner faces the dilemma that if he pleads not guilty but the other prisoner pleads guilty and shops him, he will get the worse possible outcome, namely being banged up for five years. Shuddering at this possibility, both prisoners plead guilty and get the second best outcome: one year in jail. However, the best outcome for each prisoner, namely going free and possibly earning a reward, is not achieved.
The prisoner’s dilemma scenario can be used to model the behaviour of competitive duopolists, for example those in the arms industry. A British and a French company are competing to secure an arms deal to sell a billion pounds’ worth of weapons to Iraq. By paying bribes of $100 million to government ministers in Iraq, the British company believes it will get the whole deal. However, earning £1 billion depends on the actions of the French company, the only other likely supplier of the arms. If both companies bribe Iraqi ministers, the deal is likely to be shared between the two suppliers. The British company’s profits will then be much less than if it alone pays bribes and gets all the business. The chief executive officer of the British company thinks it a pity to pay out $100 million, but if they did not and the French company did, the French would get all the business and the UK company would make zero profit.
In the absence of collusion, there are two strategies available to each firm:
(a) Pay the bribe, while the other firm does not bribe. Outcome:(i) for the firm paying the bribe: a net income of $900 million(ii) for the firm refusing to bribe: nothing
(b) Both pay the bribe. Outcome:The sale is shared: each firm nets $400 million.
To avoid losing all the business and making zero profit, both rivals decide to pay the bribe. In this scenario, paying the bribe is each firm’s dominant strategy, i.e. the strategy to be pursued whatever rival firms do. Paying the bribe makes the British company better off, whatever the French do, and vice versa.
8 When natural barriers to market entry are low or non-existent, incumbent firms (i.e. firms already in the market) may set low prices, known as limit prices, to deter new firms from entering the market. Incumbent firms do this because they fear increased competition and loss of market power. With limit pricing, firms already in the market sacrifice short-run profit maximisation in order to maximise long-run profits, achieved through deterring the entry of new firms. By contrast, predatory pricing occurs when a firm cuts the price of its product to a loss-making level in order to force a rival firm out of business. This strategy is normally used by large firms that can subsidise losses using profits from another part of their business empire to force smaller rivals out of the market.
9 Firms undertake price discrimination in order to maximise profits. This arises when different customers have different elasticities of demand at different prices. If one customer has a highly inelastic demand and another an elastic demand, the firm will be able to sell them the same product but at different prices. Train companies will typically price discriminate by charging different fares to different
AQA A2 Economics Unit 3 Business Economics and the Distribution of Income 13
Philip Allan, an imprint of Hodder Education © Ray Powell, James Powell
TOPIC 3 Concentrated markets
customers and also varying the price of a ticket at different times of the day to send price signals and create incentives and disincentives to travel.
Price discrimination occurs when firms charge different prices to different customers based on differences in the customers’ ability and willingness to pay. Those customers who are prepared to pay more are charged a higher price than those who are only willing to pay a lower price. Price discrimination allows firms to increase profit by taking consumer surplus away from consumers and converting it into extra monopoly profit or supernormal profit. Providing the increase in sales revenue resulting from price discrimination is greater than the extra costs incurred when charging different prices to different customers, it is in firms’ interest to indulge in this form of pricing.
10 The gamer’s consumer surplus is £40, being the difference between the maximum price he was prepared to pay and the actual price he paid. The store owner’s producer surplus is £2, being the difference between the lowest price he was prepared to accept and the actual price paid.
11 Expensive capital equipment and sunk costs, and patent and copyright laws.
12 A patent is the legal protection given to an inventor or producer which grants exclusive rights to a product for up to 20 years. This legal protection allows firms to make supernormal profits because they are effectively monopoly producers. Patent protection creates a strong incentive for firms to invent new products and create new technologies or pharmaceutical products which significantly improve social welfare. Thus patent protection drives dynamic efficiency. Invention and new product design frequently require high levels of research and development which burden firms with significant sunk costs and risk bankruptcy if the new product fails. Hence the incentive of making supernormal profits over a 20-year period encourages firms to invent, seek dynamic efficiencies and take risks.
Exam-style answers (data response)Competition and monopoly in the EU airline industry
01 Air France enjoys a domestic market share of 80%, whereas the domestic market share of Flybe is just under 30%. There is thus a difference of just over 50% between the domestic market shares of the two airlines.
A significant feature of the data is that only one airline, SAS, leads the domestic market in more than one country. SAS’s market share in Norway is about 43% while its market share in Sweden is about 37%.
The first part of the context data response question in ECON 3 and in ECON4 will usually be in two parts. The first part requires a calculation (often a percentage calculation). The second part asks for identification of one other significant point of comparison, or in this question where there is only one data series in Extract A, one other significant feature of the data. Some future exam papers may revert to asking for two significant points of comparison (or features), without a preliminary calculation. For this question, the answer picks up 3 marks for the calculation and 3 marks for identifying a significant feature in the data, constrained to the maximum mark of 5 available for the question.
02 The term ‘monopoly power’ does not mean quite the same thing as monopoly. Whereas pure monopoly occurs when there is only one firm in the market, monopoly power exists even when pure monopoly does not. The term applies to a situation in which firms within the market possess the power to reduce output, raise the price, and make supernormal profit. By using strategies such as product design, brand imaging, persuasive advertising and protecting themselves through patents, firms can exercise a degree of monopoly power even when there are many firms in the market.
Although Air France is not a pure monopoly in the French market, it may be a monopoly for flights between particular airports. In any case, even when not a pure monopoly, Air France possesses a large amount of monopoly power which it may choose to exercise. As the diagram below shows, on routes
AQA A2 Economics Unit 3 Business Economics and the Distribution of Income 14
Philip Allan, an imprint of Hodder Education © Ray Powell, James Powell

TOPIC 3 Concentrated markets
where its monopoly power is complete, it may hike up the price it charges to P2, compared to a competitive market price of P1. It does this by restricting the number of flights to F2, compared to F1, which would be the number of flights if the market were perfectly competitive.
In the latter case, market equilibrium would be determined at point A on the diagram. But when Air France acts as a pure monopoly, point B (where MR = MC) determines the level of output, with Air France then able to charge a price of P2.
Air France could also use its monopoly power in other ways. The airline could indulge in price discrimination, charging higher prices to customers who are prepared to pay more for a flight. Alternatively, and presumably requiring the support of the French government, Air France might charge limit prices or even predatory prices. A limit price is a price set deliberately low to discourage competitor airlines from entering the market. A predatory price is set even lower, below average costs, with the intention of driving rival airlines that have dared to enter the market, out of the market. However, perhaps the main way Air France might exercise its monopoly power is by gaining control of landing and take-off slots at French airports, to make it uneconomic or impossible for rivals to use the airports.
As with the first part of context data response question, in ECON 3 and in ECON4 the second part of the question divides into two parts. The first part (worth 4 marks) asks candidates to explain the meaning of an economic term (in this case ‘monopoly power’). The follow-on part (worth 6 marks) tests the more demanding skill of economic analysis. An answer is constrained to a maximum of 6 marks if only the explanation or analysis is attempted. This answer is more than sufficient to earn all 10 marks. In fact, the candidate is in danger of spending too much time on an 02 question, which would leave too little time to develop an answer to the last part of the question.
03 A cartel is a collusive agreement by firms, usually to fix prices. Sometimes output may also be fixed. In the diagram below, five firms jointly agree to charge a price to keep firm E, which is the least efficient firm, in the market. In a competitive market, firm E would have to reduce costs or go out of business. Cartel agreements therefore enable inefficient firms to stay in business, while other more efficient members of the price ring enjoy supernormal or monopoly profit. By protecting the inefficient and enabling firms to enjoy an easy life protected from competition, cartels display the disadvantages of monopoly (high prices and restriction of choice) without the benefits that monopoly can sometimes bring, namely economies of scale and improvements in dynamic efficiency. Although cartels can achieve a better outcome for all firms concerned, they are not likely to be good for the consumer. For this reason, cartel agreements are usually illegal and judged by governments as being anti-competitive and against the public interest. Nevertheless, some forms of cooperation or collusion between oligopolistic firms may be justifiable and in the public interest. These include joint product development and cooperation to improve health and safety within the industry, or to ensure that product and labour standards are maintained. Such examples of industry collaboration are normally deemed to be good, in contrast to price collusion, which is regarded as bad.
AQA A2 Economics Unit 3 Business Economics and the Distribution of Income 15
Philip Allan, an imprint of Hodder Education © Ray Powell, James Powell

TOPIC 3 Concentrated markets
Currently, within the European Union, cartels are usually deemed to be illegal, both by national competition authorities such as the Competition Commission in the UK, and by EU competition policy. In both national and EU competition policy, a cartel agreement is treated as an anti-competitive trading restrictive practice, collectively undertaken by the member firms of the cartel. Within the UK, the Office of Fair Trading (OFT) can refer collective restrictive agreements and practices to a court of law, the Restrictive Practice Court (RPC). Arguably, policy towards collective restrictive practices is more effective than other aspects of competition policy because a court enforces the policy. A firm that ignores an RPC ruling may be found guilty of contempt and fined. Nevertheless, the punishments that the RPC can hand out are quite weak — usually a fine of just a few thousand pounds. Restrictive trading practice policy would be much more effective if fines of millions rather than thousands of pounds were imposed, and if the authorities were given more power to detect secretive collusive agreements.
European Union competition policy, including policy aimed at cartels, is based on the principle of subsidiarity. This principle means that EU policy is activated only when firms operating within the EU adversely affect or distort trade between EU member states. Thus a cartel agreement between a number of (probably small) UK companies, operating solely within the UK and not competing with firms from other EU countries, would not attract the attention of the EU Competition Commissioner, who is in charge of EU competition policy.
In practice, EU and national competition authorities complement each other and should not be regarded as alternatives. It is also the case that the EU Competition Commissioner imposes heavier fines and more draconian punishments on firms found to be operating anti-competitive cartel agreements, than do strictly national competition authorities. This is evidenced by the case study in Extract C in the question. The case study reported that the EU fined 11 national airlines about €800 million for fixing the price of air cargo between 1999 and 2006. British Airways was fined €104 million, Air France-KLM €340 million and Cargolux Airlines €79.9 million. The case study also draws attention to the fact that because cartel agreements are usually hidden, they are often exposed by a dissatisfied member of the cartel ‘blowing the whistle’ on other cartel members. Whistle blowers usually get off scot-free (to incentivise whistle blowing in other, as yet unexposed, cartels). Meanwhile, the other cartel members are heavily punished. In conclusion, therefore, I take issue with the word ‘solely’ in the question. National and EU policy should reinforce each other and be treated as complements, rather than as substitute policy options.
Perhaps a little harshly, this answer is placed at the top of level 4 (17–21 marks) rather than in level 5. The evaluation is certainly good enough for level 5. However, the analysis is on the thin side. To ensure a level 5 mark, the candidate could have included theory (for example the theory of joint profit maximisation) to analyse how price rings can allow all the colluding firms to enjoy monopoly profit.
Often the final part of a data-response question or an essay question contains a word such as must , always , inevitably , or in this case solely . Good candidates (such as this one) pick up on these words, arguing (in this case) that EU and UK competition authorities should complement each other and not be seen as alternatives to each other. This is good evaluation.
AQA A2 Economics Unit 3 Business Economics and the Distribution of Income 16
Philip Allan, an imprint of Hodder Education © Ray Powell, James Powell

Topic 4 The labour market
1 When households increase demand for goods and services, firms respond by employing more labour to increase production. Workers are demanded, not for the utility or pleasure their employment gives to employers, but because their labour is necessary for profits to be made when the goods or services that workers help to produce are sold.
2 Perfect competition in the labour market is both similar to, and different from, perfect competition in the goods market. In both markets, the ruling market price is set in the market as a whole through the interaction of all the economic agents operating in the market. However, in a labour market, the ruling market price is in fact the ruling market wage, paid by firms and received by workers. This difference illustrates role reversal in the two sets of markets. Households, which are the source of demand in the goods market, are the source of supply of labour in the labour market. Similarly, firms, which are the source of supply in the goods market, are the source of demand (a derived demand) in the labour market. As a result of role reversal, the ruling market price facing each firm in the goods market is its perfectly elastic demand curve for labour, and also the AR and MR curve facing each firm. By contrast, the ruling market wage facing each employer in the labour market is a perfectly elastic supply curve of labour, and also the average cost of labour (ACL) curve and the marginal cost of labour (MCL) curve facing each employer.
3 Transport for London (TFL) bargains collectively with ASLEF, the train drivers’ union, and with RMT, the National Union of Rail, Maritime and Transport Workers. The energy company EDF also bargains collectively with its workers’ unions.
4 In 1999, the national minimum wage (NMW) came into force in the UK at a rate of £3.60 an hour for workers aged 22 and over. The current rates (from 1 October 2012) are: £6.19, the main rate for workers aged 21 and over; £4.98, the 18–20 rate; £3.68, the 16–17 rate for workers above school leaving age but under 18; £2.65, the apprentice rate, for apprentices under 19 or 19 or over and in the first year of their apprenticeship.
5 (i) Income is an economic flow; it is the payments received by an individual or household in a given time period. Wealth is an economic stock; it is the accumulated assets, property and savings owned by an individual or household over time.
(ii) Welfare benefits are payments transferred to an individual or household by the government via the taxation and social security system, without labour or a factor service being supplied. Earned income is payments received by an individual or household in exchange for labour or interest on saving or the rent of an asset.
Exam-style answers (essay)01 Income is a flow while wealth is a stock. Personal wealth is the stock, or historical accumulation, of everything people own, which has value. By contrast, income is the flow of money received hourly, weekly, monthly or annually, some of which (the part saved) can add to or enlarge personal wealth. This is one of the links between income and wealth. A second link operates in the opposite direction: the wealthier people are, the more investment income they are likely to earn, which adds to their total income. Indeed, the rich benefit from a virtuous circle: wealth increases income, which allows the wealthy to save, and saving adds to wealth, and so on. By contrast, many of the poor suffer a vicious circle: low income means the poor have to borrow, borrowing adds to personal debt, income is then spent on debt repayment, consumption falls, and any wealth the poor possess disappears. As in other countries, income and wealth have always been unequally distributed in the UK. Even when economic growth creates full employment, the incomes of the rich tend to increase faster than those of the poor.
Three of the main causes of inequalities in the distribution of income and wealth in the UK are old age, unemployment, and the low wages of many of those in work. Old age causes income inequality (and also
AQA A2 Economics Unit 3 Business Economics and the Distribution of Income 17
Philip Allan, an imprint of Hodder Education © Ray Powell, James Powell

TOPIC 4 The labour market
poverty) largely because many old people rely on the state pension and lack a private pension. Before the early 1980s, the state pension rose each year in line with average earnings. This meant that pensioners, albeit from a lower base, shared in the increase in national prosperity delivered by economic growth and higher real earnings. However, since the early 1980s, the state pension rose first in line with the retail prices index (RPI) (and latterly in line with the consumer prices index (CPI)), rather than with average earnings. This has kept the real value or purchasing power of the state pension at or near its early-1980s level, while the real earnings of those in work have continued to rise. Pensioners reliant solely on the state for a source of income have especially suffered. The state pension is now regarded very much as a ‘poverty income’. Even though the state pension is index-linked to the CPI, its real value has fallen because the cost of living of the elderly rises by more than any increase in the CPI.
Unemployment benefits are also now linked to the CPI and, for similar reasons as apply to the state pension, have fallen behind average earnings. Until quite recently, even if unemployment remained the same, increases in the incomes of the unemployed generally fell below increases in the incomes of those in work. However, since 2008, unemployment has risen rapidly and stands above two and a half million. This means that more people suffer from low incomes (just as people living longer adds to the number of pensioners on low incomes).
(Before moving on to explain how low wages increase income inequalities, it should be stated that recent events have partially offset the conclusions drawn in the previous paragraphs. Since 2009, the wages and salaries of much of the UK population in work have hardly changed at all, but the state pension and unemployment benefits have risen by rather more, albeit from a lower starting point. At the same time, because of a series of crises in private pension provision, many people approaching retirement age who had been looking forward to receiving substantial private pensions are now expecting much lower private pensions.)
Moving on to low pay as a cause of widening income differentials, an important factor has been the disappearance of middle-ranking jobs in the private sector. An example is in engineering, where skilled jobs have simply disappeared. Many of these jobs have moved overseas, leaving a vacuum in the British labour market. There is now a worrying gap between low-skilled, low-paid jobs (so called McJobs) at the bottom of the pile, and highly-paid jobs in industries such as investment banking where the rate of pay has risen astronomically in recent years, in both real and nominal terms.
This answer scores 14 out of the 15 marks available. It earns the two marks available for definitions. (Because definitions pick up marks, it is always a good idea to provide two relevant definitions in the answer to the first part of an essay question, or to the second part of a context data-response question). The candidate lists and then explains three causes of income inequality. The effects of old age and unemployment are explained well. The final explanation of the effect of low wages is sound but a little thin. It would have benefited from graphical analysis, showing for example that the widening difference between high and low wages is partially caused by different demand and supply conditions in different labour markets:
AQA A2 Economics Unit 3 Business Economics and the Distribution of Income 18
Philip Allan, an imprint of Hodder Education © Ray Powell, James Powell
TOPIC 4 The labour market
02 A tax is progressive if, as income rises, a greater proportion of income is paid in tax. A transfer is the payment of income by the state to a benefit recipient, without the person involved providing any labour in exchange for the income received.
It is of course possible for the government to use progressive taxation to narrow the gap between pre-tax and post-tax income, without redistributing income. The tax revenue could for example be spent on tanks and guns. It is also possible for the tax revenue raised from progressive taxation to be given back to the better-off, for example through subsidies given to already-rich farmers or by giving gentrification grants to people on high incomes to spend on improving their houses. However, usually when we think of progressive taxation and transfers, the implicit assumption is that the rich are taxed more than the poor and that much of the tax revenue is transferred and given as welfare benefits to the poor.
There is no doubt that progressive taxation and transfers provide an obvious way to reduce inequalities in the distribution of income and wealth. Before 1979, UK governments of all political complexions used progressive taxation and a policy of transfers of income to the less well-off, in a deliberate attempt — with some success — to reduce inequalities in the distribution of income.
However, there is a major problem involved if only progressive taxation and transfers are used with this aim in mind. The reason for this relates to the conflict between two of the principles or canons of taxation: equity and efficiency. Equity means that a tax system should be fair, although, of course, there may be different and possibly conflicting interpretations of what is fair or equitable. Specifically, a particular tax should be based on the taxpayer’s ability to pay. This principle is one of the justifications of progressive taxation, since the rich have a greater ability to pay than the poor. Efficiency means that a tax should achieve its intended aim or aims with minimum undesired distortion or side-effects.
Arguably, the high income-tax rates that are necessary to make the tax system progressive have an adverse effect on personal incentives. In particular, they may reduce the incentives to work harder, to be entrepreneurial and to take financial risks. Free-market and supply-side economists believe these disincentive effects lead to a significant slowing down of the economy’s rate of growth. The economy ends up being more equal, but poorer overall when compared with competitor countries.
Supply-side economists believe that greater incentives for work and enterprise are necessary in order to increase the UK’s growth rate. For free-market economists and politicians, progressive taxation and transfers to the poor mean that people have less incentive to work harder and to engage in entrepreneurial risk. Moreover, the ease with which the poor can claim welfare benefits and the level at which they are available creates a situation in which the poor rationally choose unemployment and state benefits in preference to low wages and work. In this so-called dependency culture, the unwaged are
AQA A2 Economics Unit 3 Business Economics and the Distribution of Income 19
Philip Allan, an imprint of Hodder Education © Ray Powell, James Powell

TOPIC 4 The labour market
effectively ‘married to the state’, but some of the poor, obviously not enjoying this marriage, drift into antisocial behaviour, attacking bus shelters and other public property, as well as privately owned property.
Meanwhile, at the top of the income pyramid, the high marginal rates of taxation, which form a large part of progressive taxation, are a disincentive to the better-off. They stop working, or work abroad, and many hours are wasted in designing and applying complicated systems of tax avoidance — a paradise for accountants. Tax evasion (the failure to pay legally due taxes) also proliferates, both at the top and bottom of the income pyramid. Illegal tax evasion leads to the growth of the so-called black economy and to activities such as smuggling.
Supply-side economists believe that tax and benefit cuts, which are the opposite of progressive taxation and transfers, alter the labour/leisure choice in favour of supplying labour, particularly for benefit claimants who lack the skills necessary for high-paid jobs. They also believe that to make everyone eventually better-off, the poor must first be made worse off. Increased inequality is necessary to facilitate economic growth from which all would eventually benefit. Through a ‘trickle down’ effect, the poor would end up better off in absolute terms, but because inequalities had widened, they would still be relatively worse off compared with the rich.
Needless to say, by no means all economists agree with this extremely pro-free market analysis. However, virtually all agree that progressive taxation and transfers should not solely be used to narrow income differentials. Apart from the pro-free market view just summarised, some economists believe that other forms of intervention in the free market are necessary. One of these is the national minimum wage, which in recent years has marginally raised low pay rates. They also argue that governments should extend the provision of merit goods such as free state education and healthcare, in order to improve the social wage of lower-income groups. The social wage is that part of a worker’s standard of living received as goods and services provided at zero price or as ‘income in kind’ by the state, being financed collectively out of taxation. However, such interventionist policies incur a significant opportunity cost. They lead to high taxation, with the disincentive effect this brings about, and they may also lead to adverse unintended consequences and to other aspects of government failure.
It is important to read the question carefully. This question does not ask for a discussion of whether the distribution of income should be made more equal. Unfortunately, the answer deflects a little too much in this direction. Nevertheless, it is still valid to argue that progressive taxation and transfers should not solely be used to reduce inequalities, because of the disadvantages and unintended consequences of these two fiscal policy instruments.
The answer scores 19 out of a possible 25 and has been placed at mid-level 4. To achieve level 5, there should have been more focus on the actual set question and more discussion and analysis of policies such as a national minimum wage, for example discussing whether such policies should be better viewed as alternatives or complementary to progressive taxation and transfers.
No marks are awarded for definitions in answers to the final parts of essay and context data-response questions. Nevertheless, it is still a good idea to define key concepts at the beginning of the answer as this acts as a good launching pad for developing the subsequent analysis and evaluation.
AQA A2 Economics Unit 3 Business Economics and the Distribution of Income 20
Philip Allan, an imprint of Hodder Education © Ray Powell, James Powell

Topic 5 Government intervention in the market
1 A public good has three characteristics: it is non-excludable, non-diminishable (non-rival) and non-rejectable. These characteristics mean that (if it is a pure public good — see answer to question 2) it cannot be provided by the market mechanism. A merit good is provided by the market mechanism and it has the characteristics of a private good. It is excludable, diminishable (rival) and rejectable. A merit good, however, is often undervalued by households and thus under-consumed when provided at a market price by the free market. There are two reasons for this. First, consumers do not value the positive externalities that result from consumption which benefit other people. Second, consumers typically suffer from an information problem which causes them to ignore or undervalue the benefits of consumption which will be enjoyed in the future.
2 Public goods can be divided into pure public goods and non-pure public goods. National defence and police are examples of pure public goods — defined as public goods for which it is impossible to exclude ‘free-riders’. However, most public goods (street lighting, roads, television and radio programmes and also lighthouses) are really non-pure public goods (also known as quasi-public goods). Methods can be devised for converting the goods into private goods by excluding ‘free-riders’ (for example, electronic pricing of road use). Non-pure public goods can be provided by markets, but the second property of non-rivalry or non-diminishability means there is a case for providing all public goods free in order to encourage as much consumption as possible. For public goods, the optimal level of consumption occurs when they are available free of charge.
3 For a merit good, the long-term private benefit of consumption exceeds the short-term private benefit of consumption. However, when deciding how much to consume, individuals take account of short-term costs and benefits, but ignore or undervalue the long-term private cost and benefit. Preventative dentistry provides a good example. Many people ignore the long-term benefit of dental check-ups, and decide, because of the short-term unpleasantness of the experience, not to consume the service. Unfortunately, these people can end up later in life with rotten teeth or gum disease, saying: ‘If only I had visited the dentist more often when I was younger’. Likewise, school children who undervalue the long-term private benefit of education say later in life: ‘If only I had worked harder at school, I would now have a better, more enjoyable job with more pay.’
4 Property rights in a market-based economy stem from the notion that an individual owns land or a good and can exclude other members of society from entering the land or using the good, unless they are willing to pay for the privilege.
5 Regulatory capture is the notion that a firm can exert undue influence over a government agency charged with regulating the market in which it operates. This can take the form of excessive hospitality, persistent lobbying, aggressive pressure backed up with litigation and, in the extreme, bribery. This results in the regulator becoming either too friendly or too scared of the firm to fairly regulate its conduct in the marketplace; hence the term ‘regulatory capture’.
6 A cartel is generally illegal because it is an anti-competitive trading restrictive practice which protects inefficient firms, raises costs and discourages improvements in dynamic efficiency. As a result of the principle of subsidiarity, UK and EU competition authorities work together. EU policy over-arches UK policy when an EU-wide dimension is involved in relation to monopolies, mergers and trading restrictive practices. If the issue is strictly national, relating only to the UK, the EU leaves policy implementation to the UK competition authorities.
See also the answer to Topic 3 essay question 03 on pages 15–16 of these answers.
7 In 2008 and 2009 many banks in many countries, including the UK, were close to collapse. Some banks did collapse, such as Lehman Brothers in the USA. Banks faced the danger of possible collapse as a result of an unexpected fall in the value of their assets, stemming from the credit crunch and the
AQA A2 Economics Unit 3 Business Economics and the Distribution of Income 21
Philip Allan, an imprint of Hodder Education © Ray Powell, James Powell

TOPIC 5 Government intervention in the market
sub-prime mortgage problem, which particularly affected US banks. The assets owned by the banks were now much less than their liabilities.
Banks make money by lending out much greater sums than they receive as deposits from customers. Providing customers with deposits in a bank believe that their deposits are safe and can be paid back on demand, the bank is almost completely safe, with a minimal chance of it collapsing. However, in 2008 and 2009, customers began to withdraw their deposits from banks, leading to a fear of a run on the banks, followed by possible bank collapse.
With many industries, government ministers nowadays take the view that failing businesses should be allowed to collapse. However, this is not generally their view with regard to banks. Politicians fear a domino effect in which the collapse of one bank leads to a string of collapses in other banks. This fear, let alone actual collapse, can have a devastating effect on confidence in the economy, which may in turn lead to a collapse in aggregate demand and the creation of recessionary conditions. Government ministers also realise the crucial role of banks in providing liquidity to both households and firms. When the banking system froze in 2007–08, firms found they were unable to borrow from banks. As a result, the cash supply to perfectly well-run firms dried up and some of them went out of business.
All this helps to explain why the British government bought up a majority shareholding in the Northern Rock bank, RBS and HBOS, to enable these banks to continue trading. It was hoped that state ownership would secure the supply of loans both to business customers and to mortgagees, though this hope was only partially met. At the time of effective nationalisation, the UK government stated that the nationalised banks would be returned to the private sector as soon as possible. Part of the Northern Rock bank — the so-called ‘good bank’ but not the ‘bad bank’ element which is still state-owned — has been returned to the private sector, rebranded as a part of Virgin Money.
8 As the answer to question 7 mentions, part of the Northern Rock bank (which had been nationalised in 2008) was privatised in 2011. Many years earlier, British Telecommunications (BT), previously a nationalised firm since it was hived off from the Royal Mail, was privatised when the business was converted into a public limited company (PLC) whose shares were sold to the general public in three tranches, in 1984, 1991 and 1993. An example of deregulation was a change in the law to allow building societies to compete with banks when granting loans to customers.
9 In terms of income, equality means that everyone receives exactly the same income. Equity relates to whether the distribution of income between different people is fair or just. Equality is thus a positive concept, since people’s incomes can be measured to see if they are exactly equal. Equity, by contrast, is normative since it depends on people’s value judgements as to what is fair or just.
10 In the poverty trap, also known as the earnings trap, low-waged people who pay income tax and national insurance contributions (NICs) to the government and who lose welfare benefits, become trapped in relative poverty when their wages rise. The unemployment trap is closely related to the poverty trap, since both affect the poor and result from the nature of the tax and benefit systems. But people caught in the unemployment trap are out of work — at least in terms of officially declared employment. The unemployment trap contains un-waged social security claimants who ‘choose’ unemployment because they are better off out of work, living on benefits, than in low-paid jobs paying income tax and NICs and losing some or all of their right to claim means-tested benefits.
11 Fuel poverty is defined as existing among households who spend more than 10% of their income on fuel. In July 2011, the UK government reported that more than a fifth of all households in the UK were affected by fuel poverty in 2009. Higher fuel bills meant the number of homes affected rose by one million, or 22%, to 5.5 million, according to the Department of Energy and Climate Change.
AQA A2 Economics Unit 3 Business Economics and the Distribution of Income 22
Philip Allan, an imprint of Hodder Education © Ray Powell, James Powell

TOPIC 5 Government intervention in the market
Exam-style answers (data response)The impact of climate change on the UK economy
01 Asian countries emitted 0.9 billion tonnes of carbon pollutants in 1990. This is forecast to rise to 5.1 billion tonnes in 2050, an increase of 4.2 billion tonnes. This is a forecast increase of 467%.
One significant feature of the data is that, after 2010, the carbon emissions of emerging market countries is expected to continue to rise, whereas the rate of increase of the emissions of richer advanced countries (OECD countries) is expected to slow down (flatten), though not to fall. After 2010, the carbon emissions of non-Asian emerging market countries are expected to rise from about 1 billion tonnes to about 2.7 billion tonnes. OECD emissions are expected to rise from about 3.5 billion tonnes to about 3.7 billion tonnes over the same period.
Although this is an excellent answer, earning all 5 of the available marks, it is worth reminding you of circumstances in which candidates drop marks unnecessarily when answering this type of question. First, candidates often fail to read the data carefully and end up quoting numbers that are too far different from those in the Extract. Second, even when the numbers quoted are accurate, candidates fail to include units of measurement (billion tonnes for both parts of this question, and a % sign for the % change in the first part of the answer). Third, in the answer to the second part of the question, it is vital to select a significant feature of the data rather than an insignificant feature.
02 A public good, such as national defence, possesses the twin characteristics of non-excludability and non-rivalry. Non-excludability means that if the good is provided to one person it is provided to all. It is impossible to exclude free-riders, i.e. people who get the benefits without paying for the public good. Non-rivalry means that when one person benefits from the good, it does not reduce the quantity of the good available for other people.
The gases and pollutants that are emitted into the atmosphere and lead to global warming are both externalities and a form of public ‘bad’. (A public ‘bad’ is the opposite of a public good. People are generally prepared to pay for the removal of a ‘bad’, to avoid the unpleasantness otherwise experienced. But in the case of public ‘bads’, such as rubbish or garbage, payment can be avoided by dumping the ‘bad’ in a public place, or on someone else’s property.) Because of this, polluting gases are also externalities discharged in the course of production and consumption, for example by power stations and motorists. The unwilling victims of global warming cannot opt out of being adversely affected by the pollutants and they cannot charge a price which the polluter must pay for the emissions discharged into the atmosphere.
Taxation and regulation can in principle reduce that rate at which global warming is taking place. However, as Extract B explains, the emission of global-warming gases is different from the emission of many other negative externalities, for example traffic congestion. In the first place, the emission is international. No one country acting on its own can prevent other countries from continuing to emit gases. In the second place, the problem is historical. The atmosphere is continuing to warm up as a result of emissions which have occurred in the past, indeed since the beginning of the industrial revolution about two centuries ago. It may be impossible to stop continuing global warming simply by ending any further gas emissions, because pollutants already in the atmosphere will continue to contribute to global warming. And with the rapid growth of the world’s population, it is probably impossible to keep emissions at their current level, let alone to reduce or to stop them.
This is a well-balanced answer, easily earning maximum marks — 4 marks for the snappy explanation of the meaning of a public good and 6 marks for the subsequent analysis of the issue posed by the question. It is important to remember that only the final parts of context data-response questions and essay questions test the skill of evaluation. Evaluation is not required in the answers to earlier sections of the
AQA A2 Economics Unit 3 Business Economics and the Distribution of Income 23
Philip Allan, an imprint of Hodder Education © Ray Powell, James Powell
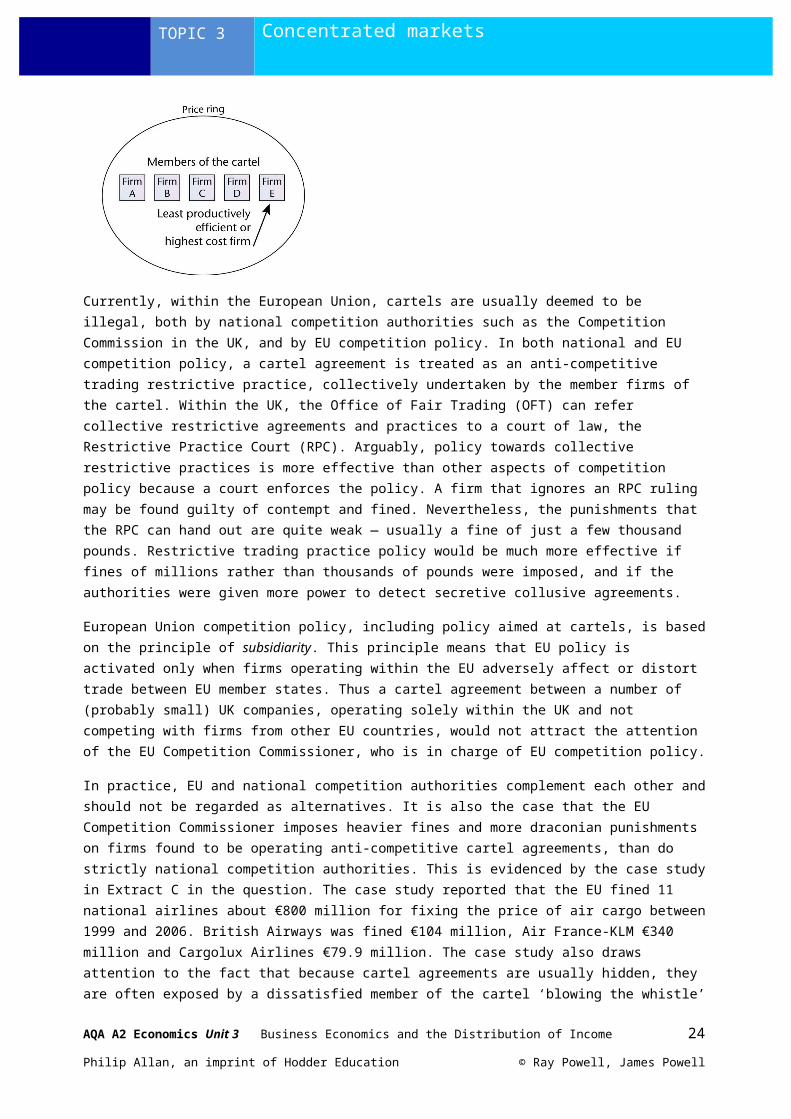
TOPIC 5 Government intervention in the market
questions, including this part. Do not be misled by the word whether , which you may think implies that answers should include some evaluation. This is not the case.
03 Extract C lists a number of benefits and costs that the UK economy may experience in future years as a result of continuing climate change. The first of these is flash flooding. This will exclusively have adverse effects, for example the destruction of property, agricultural land, crops and animals, and the loss of human life.
The second is a decrease in heating bills. If this occurs it will benefit every UK household, though as Extract C states, the benefits are likely to be offset by the increased use of energy to provide the power for air-conditioning systems which will grow in use if the climate becomes stiflingly hot in summer.
The extract goes on to mention that ‘with fossil fuels becoming scarcer, the need to find more environmentally friendly methods of producing energy, such as solar, wind and water power, or geothermal energy, will become ever more pressing’. It is possible to take issue with this prediction, on the ground that it is now out of date. In one important way, fossil fuels are not becoming scarcer. Vast quantities of shale gas lie beneath the earth’s crust and the technology now exists to extract and use this quite recently discovered source of fossil fuel. Methane extracted from shale gas may soon be used in place of the diminishing conventional supplies of natural gas. Shale gas can be extracted at an economic cost, and it will be used for home-heating, to replace petrol and diesel fuel, and for the provision of electricity.
But is this a benefit or a cost? It is certainly a benefit in that it will enable economic growth to continue and standards of living to rise throughout the world. But it must always be remembered that shale gas is a fossil fuel. Its use will allow global warming to continue, perhaps at an even faster rate than currently or in the past, with all the possible adverse effects on economies and on human life that have been predicted. Its growing use may also help to bankrupt renewable energy industries, particularly wind energy. If this is so, shale gas will bring to a stop, or at least slow down, attempts to reduce dependency on fossil fuels. Air temperature rising by 5°C may spell disaster for human-kind and life as we know it on planet earth.
Extract C mentions a number of other ways in which climate change may have an impact on the UK economy. These include the decline of ski resorts in Scotland, the growth of hotel resorts in the south of the UK, and the effects on clothing sales, everyday food purchases, the construction industry, the types of crops grown in the UK, agricultural methods of production, and on how water is used and stored. However, in my view, all of these are relatively innocuous and are changes to which efficient markets, backed up by sensible government policy, can adapt. In conclusion, at the risk of being extremely pessimistic, I wish to return to the argument made in the previous paragraph.
Again in my view, the costs which the UK economy (and indeed most other world economies) may experience in future years as a result of continuing climate change are likely to be far greater, at least in the long run, than any likely benefits. Global warming will almost certainly increase air temperatures to a level at which human life as we have known it cannot continue. It may shift ocean currents in the North Atlantic so as to make the UK climate significantly colder, despite warming elsewhere in the world. Water shortages, if not occurring in the UK, may lead to attempted mass migration of people from poor to rich countries and to wars which destroy economic activity as countries fight over water and other resources and fight against inward migration of people trying to escape growing poverty and seeking a better life for themselves. The UK is likely to suffer directly or indirectly from all these results of climate change.
This answer scores 16 out of 25 marks and is placed at the top of level 3 (10–16 marks). Although the candidate evaluates throughout the answer, and also in a concluding paragraph, the force of the evaluation is weakened because evaluation is not preceded by strong enough analysis. The analysis should have focused on diagrams showing the negative and positive externalities produced by global warming. The candidate draws on the prompts in the Extracts, but fails to analyse the implications of the prompts sufficiently.
AQA A2 Economics Unit 3 Business Economics and the Distribution of Income 24
Philip Allan, an imprint of Hodder Education © Ray Powell, James Powell
TOPIC 5 Government intervention in the market
The answer veers on the side of being too superficial. Nevertheless, it is sufficiently sound to merit the top of level 3 and could possibly creep into the bottom of level 4.
The grade descriptor for level 3 is:
A2Levels mark scheme
AO1 Knowledge and understanding of theories, concepts and terminology
AO2 Application of theories, concepts and terminology
AO3 Analysis of economic problems and issues
AO4 Evaluation of economic arguments and evidence, making informed judgements
Level 310–16 marks(mid-point 13)
Reasonable including some correct analysis but very limited evaluation
Satisfactory but some weaknesses shown
Reasonable application to issuesWhere appropriate, reasonable use of data to support answer
Reasonably clear but may not be fully developed and is perhaps confused in places with a few errors presentThe answer is quite well organised with some logical development
Superficial, perhaps with some attempt to consider both sides of the issue(s)
AQA A2 Economics Unit 3 Business Economics and the Distribution of Income 25
Philip Allan, an imprint of Hodder Education © Ray Powell, James Powell