
Economics and Human Biology - uchile.cl
14
Harsh parenting during early childhood and child development Matias Berthelon a, *, Dante Contreras b , Diana Kruger c , María Isidora Palma b a Escuela de Negocios, Universidad Adolfo Ibáñez and CEPR, Av. Padre Hurtado 750, Viña del Mar, Chile b Departamento de Economía, FEN, Universidad de Chile, Diagonal Paraguay 257, Santiago, Chile c Escuela de Negocios, Universidad Adolfo Ibáñez, CEPR and IZA, Av. Padre Hurtado 750, Viña del Mar, Chile A R T I C L E I N F O Article history: Received 23 May 2019 Received in revised form 12 November 2019 Accepted 25 November 2019 Available online 26 November 2019 JEL classification: O15 J12 J13 I31 Keywords: Harsh parenting Violence toward children Spanking Corporal punishment Child development Cognitive and socio-emotional outcomes Chile A B S T R A C T We study the relationship between harsh parenting strategies, including psychological and physical aggressions that do not constitute abuse, on early childhood cognitive and socio-emotional development. We estimate a value-added model that controls for a rich set of child, mother, and family characteristics, from a nationally representative sample of Chilean children aged 52–83 months. We find harsh parenting is significantly associated with lower verbal skills (Peabody Picture Vocabulary Test) of a magnitude of 0.06 standard deviations, and with increased behavioral problems (Child Behavior Check List), by 0.11 standard deviations, including internalization, externalization, and sleep problems. We also find that the more systematic (persistent) harsh parenting is, the stronger the association; the association is similar for boys and girls; reaches its peak at about 5 years of age; and it is stronger for children with less educated mothers. © 2019 Elsevier B.V. All rights reserved. 1. Introduction Most children in the world are exposed to violence, either physical or psychological, and in many cases to both. Of particular concern for their development and well-being is the fact that the majority of the violence they experience originates in their own family environment, typically exercised by parents or other family members. Using comparable data for 63 countries or areas, UNICEF (2014a) reports that on average about four in five children between ages 2 and 14 are subject to some form of violent discipline in their homes. Although in recent years there seems to be some decline in mother’s endorsement of physical discipline in the U.S. (Ryan et al., 2016), and several countries have prohibited all corporal punishment of children even within the household, the use of some forms of violence is still highly prevalent in most countries in the world—regardless of their income or develop- ment level. Furthermore, parental use of violence is legal in more than seventy five percent of countries in the world (Global Initiative, 2017). Violence towards children can take several forms. For instance, physical violence can be severe, putting the physical integrity of the child at risk—also referred as child abuse or maltreatment—or it can take the form of lack of care, referred to as neglect. 1 Parental disciplinary practices can also reach lower levels of severity, including physical or corporal punishment that do not endanger the child’s physical integrity. 2 It can also include verbal or psychological aggressions, which can take the form of threats, * Corresponding author. E-mail addresses: [email protected] (M. Berthelon), [email protected] (D. Contreras), [email protected] (D. Kruger), [email protected] (M.I. Palma). 1 There is a large literature in psychology, social work, and other related fields, which analyzes the effects of child abuse/maltreatment or neglect, finding associations with a wide range of psychosocial, behavioral and cognitive outcomes (Cicchetti and Barnett, 1991; Margolin, 2000; Waldinger et al., 2001; Hildyard and Wolfe, 2002; Walker et al., 2011). Among others child abuse has been found to have deleterious effects on brain development (De Bellis et al., 2002; Teicher et al., 2003), educational achievement and attainment (Leiter and Johnsen, 1997; Romano et al., 2015) and can negatively affect the ability to acquire or demonstrate skills (Delaney- Black et al., 2002). 2 For instance Gershoff and Groga-Kaylor (2016) define physical punishment as “noninjurious, openhanded hitting with the intention of modifying child behavior”. Within this category belongs spanking, usually defined as mild open-handed strike to the buttocks or extremities (Ferguson, 2013). http://dx.doi.org/10.1016/j.ehb.2019.100831 1570-677X/© 2019 Elsevier B.V. All rights reserved. Economics and Human Biology 36 (2020) 100831 Contents lists available at ScienceDirect Economics and Human Biology journa l homepage: www.e lsevier.com/locate/ehb
Transcript of Economics and Human Biology - uchile.cl

Economics and Human Biology 36 (2020) 100831
Harsh parenting during early childhood and child development
Matias Berthelona,*, Dante Contrerasb, Diana Krugerc, María Isidora Palmab
a Escuela de Negocios, Universidad Adolfo Ibáñez and CEPR, Av. Padre Hurtado 750, Viña del Mar, ChilebDepartamento de Economía, FEN, Universidad de Chile, Diagonal Paraguay 257, Santiago, Chilec Escuela de Negocios, Universidad Adolfo Ibáñez, CEPR and IZA, Av. Padre Hurtado 750, Viña del Mar, Chile
A R T I C L E I N F O
Article history:Received 23 May 2019Received in revised form 12 November 2019Accepted 25 November 2019Available online 26 November 2019
JEL classification:O15J12J13I31
Keywords:Harsh parentingViolence toward childrenSpankingCorporal punishmentChild developmentCognitive and socio-emotional outcomesChile
A B S T R A C T
We study the relationship between harsh parenting strategies, including psychological and physicalaggressions that do not constitute abuse, on early childhood cognitive and socio-emotional development.We estimate a value-added model that controls for a rich set of child, mother, and family characteristics,from a nationally representative sample of Chilean children aged 52–83 months. We find harsh parentingis significantly associated with lower verbal skills (Peabody Picture Vocabulary Test) of a magnitude of0.06 standard deviations, and with increased behavioral problems (Child Behavior Check List), by 0.11standard deviations, including internalization, externalization, and sleep problems. We also find that themore systematic (persistent) harsh parenting is, the stronger the association; the association is similar forboys and girls; reaches its peak at about 5 years of age; and it is stronger for children with less educatedmothers.
© 2019 Elsevier B.V. All rights reserved.
Contents lists available at ScienceDirect
Economics and Human Biology
journa l homepage: www.e lsev ier .com/ locate /ehb
1 There is a large literature in psychology, social work, and other related fields,which analyzes the effects of child abuse/maltreatment or neglect, findingassociations with a wide range of psychosocial, behavioral and cognitive outcomes(Cicchetti and Barnett, 1991; Margolin, 2000; Waldinger et al., 2001; Hildyard andWolfe, 2002; Walker et al., 2011). Among others child abuse has been found to havedeleterious effects on brain development (De Bellis et al., 2002; Teicher et al., 2003),
1. Introduction
Most children in the world are exposed to violence, eitherphysical or psychological, and in many cases to both. Of particularconcern for their development and well-being is the fact that themajority of the violence they experience originates in their ownfamily environment, typically exercised by parents or other familymembers. Using comparable data for 63 countries or areas,UNICEF (2014a) reports that on average about four in five childrenbetween ages 2 and 14 are subject to some form of violentdiscipline in their homes. Although in recent years there seems tobe some decline in mother’s endorsement of physical discipline inthe U.S. (Ryan et al., 2016), and several countries have prohibitedall corporal punishment of children even within the household,the use of some forms of violence is still highly prevalent in mostcountries in the world—regardless of their income or develop-ment level. Furthermore, parental use of violence is legal in more
* Corresponding author.E-mail addresses: [email protected] (M. Berthelon),
[email protected] (D. Contreras), [email protected] (D. Kruger),[email protected] (M.I. Palma).
http://dx.doi.org/10.1016/j.ehb.2019.1008311570-677X/© 2019 Elsevier B.V. All rights reserved.
than seventy five percent of countries in the world (GlobalInitiative, 2017).
Violence towards children can take several forms. For instance,physical violence can be severe, putting the physical integrity ofthe child at risk—also referred as child abuse or maltreatment—orit can take the form of lack of care, referred to as neglect.1 Parentaldisciplinary practices can also reach lower levels of severity,including physical or corporal punishment that do not endangerthe child’s physical integrity.2 It can also include verbal orpsychological aggressions, which can take the form of threats,
educational achievement and attainment (Leiter and Johnsen, 1997; Romano et al.,2015) and can negatively affect the ability to acquire or demonstrate skills (Delaney-Black et al., 2002).
2 For instance Gershoff and Groga-Kaylor (2016) define physical punishment as“noninjurious, openhanded hitting with the intention of modifying child behavior”.Within this category belongs spanking, usually defined as mild open-handed striketo the buttocks or extremities (Ferguson, 2013).

2 M. Berthelon et al. / Economics and Human Biology 36 (2020) 100831
shouts, or insults. In this paper, we study the effect of harshparenting (HP), i.e., parental strategies that incorporate theselesser forms of violence and aggressions towards children, on earlychildhood cognitive and socio-emotional development.
Overall, there is a broad consensus on the negative effects ofsevere forms of child abuse/neglect towards children, yet there isan ongoing debate on the effects of the lesser forms of violence. Forinstance, studies have analyzed the association between physicalpunishment and children's outcomes, with some commonfindings, which include increased child compliance followingcorporal punishment, and increasing negative effects with age andwith frequency of punishment (Larzelere, 2000; Gershoff, 2002;Benjet and Kazdin, 2003; Larzelere and Kuhn, 2005; Ferguson,2013; Gershoff and Grogan-Kaylor, 2016).
In economics, child abuse has received relatively little atten-tion.3 Using US state-level panel data, Paxon and Waldfogel (1999,2002) show that states with more absent fathers and workingmothers have higher rates of child maltreatment. In terms of itseffects, Currie and Tekin (2012) find that maltreated children aremore likely to engage in crime, and Currie and Widom (2010) findthat children that were subject to child abuse and/or neglect havelower education, employment, earnings, and assets in theiradulthood. Pieterse (2015) finds that childhood maltreatment isassociated with lower numeracy test scores and higher dropoutamong children in one city in South Africa.
Even less attention has been devoted to understanding howparenting styles can affect child development (MacMillan andMikton, 2017), although it is already known that householdinvestments and structure during early childhood play a significantrole in the development of cognitive and socio-emotional skills(Cunha and Heckman, 2007; Doyle et al., 2009; Chan and Fung,2018), and that early skill formation has a significant impact onlater outcomes, including schooling, wages, occupation, andproductivity, among others (Heckman et al., 2006; Hanushekand Woessmann, 2008; Cunha et al., 2006; Cunha and Heckman,2008, 2009; Gertler et al., 2014; Almond et al., 2017). Additionally,the formation of child cognitive skills has been shown to beassociated with socioeconomic characteristics of their household,child’s health, and their parental cognitive development (Paxonand Schady, 2007; Schady, 2011; Schady et al., 2015; Contreras andGonzález, 2015; Contreras et al., 2014; Galasso et al., 2017).However, less is known about how parenting strategies are relatedto child development (Pinquart, 2017; MacKenzie et al., 2014;Coneus et al., 2012). One exception is Paxon and Shady (2007),whom in the context of analyzing children’s cognitive develop-ment in Ecuador find that parenting quality—including harshparenting—is negatively correlated with cognitive development.
In this context, our study seeks to contribute to the literature onthe association between harsh forms of parenting—not reachingthe level of abuse or maltreatment—and early childhood cognitiveand socio-emotional development. We use data from a nation-wide survey on early infancy with a sample of children aged 4–7years-old (specifically 52–83 months). Cognitive development ismeasured using the Spanish version of the Peabody PictureVocabulary Test (PPVT) and socio-emotional development isassessed using the Child Behavioral Checklist (CBCL). We are ableto expand the existing literature because we have longitudinal datathat follows children over a two year period, which allows us to
3 More attention has been devoted to intimate partner violence. See amongothers: McElroy and Homey, 1981; Tauchen et al., 1991; Tauchen and Witte, 1995;Farmer and Tiefenthaler,1996; Bloch and Vijayendra, 2002; Pollak, 2004; DeRiviere,2008; Card and Dahl, 2011; Anderberg and Rainer, 2013; Bobonis et al., 2013;Hidrobo and Fernald, 2013; Anderberg et al., 2016; Hsu, 2017; Cools and Kotsadam,2017; Kim et al., 2017; and McCarthy, 2019.
estimate the association of harsh parenting with child develop-ment within a value-added framework.
A second contribution is that we provide estimates of theassociation using two different measures of harsh parenting, onethat is self-reported by the child’s mother, and another that uses adirect observational measure of harsh parenting.4 In addition toasking care takers about their use of several forms of parenting thatcan be classified as harsh parenting (shouting, criticizing or hittingthe child), the survey collected information on observationsprovided by surveyors/test enumerators. They filled out the HomeObservation for Measurement of the Environment (HOME)questionnaire, reporting several measures of maternal attitudestowards the child during the visit, including verbal and/or physicalaggressions. We use these two measures—one self-reported andone observed—to capture the potential effects of parentalaggressions on development. The self-reported measure wouldcapture the effect of a more structural or permanent parentalstrategy, and the observed measure would capture the contempo-raneous or immediate association between exposure to harshparenting and the child’s test performance.
Our results show that exposure to harsh parenting—i.e., beingexposed to verbal aggressions or milder forms of physical violence,or both—is significantly associated with lower development ofverbal skills (our cognitive outcome), and with a larger number ofbehavioral problems (our socio-emotional outcome). Results aresimilar for both measures of harsh parenting, and in some cases,we find a stronger association between child’s outcome andconcurrent aggressions, i.e. for the observed measure of harshparenting. Exposure to harsh parenting is also associated with anincreasing likelihood that the child falls into a category of lowverbal skills development and in a clinical range of behavioralproblems. Furthermore, harsh parenting affects different types ofbehaviors, including the three broadband behavior scales intowhich CBCL behaviors are grouped: internalization, externaliza-tion, and sleep problems.
We also analyze systematic exposure to harsh parenting overtime, and find that it affects child development: the morepersistent harsh parenting is, the worse children fare in bothdimensions of child development. Finally, we study heterogeneouseffects along child’s sex, age, and maternal education level. We finda similar association for both boys and girls; that the association isstrongest when children are 5 years old; and that harsh parentingis associated with diminished verbal skills only for children withless educated mothers, but it is negatively associated with socio-emotional development irrespective of mother’s education level.Overall, our findings reveal that less severe, but more commonforms of violence are associated with lower levels of developmentduring early childhood.
The remainder of the article is organized as follows: Section 2describes the methodology; Section 3 describes the data andvariables; Section 4 presents the results; and Section 5 summarizesand provides a discussion on the implications of our study.
2. Empirical methodology
To estimate the association of harsh parenting and children’scognitive and socio-emotional outcomes, we estimate a model ofthe contemporaneous effect of harsh parenting, controlling forpast levels of the outcomes variables and (predetermined)characteristics of the child, pregnancy, mother and household.
In this model, the inclusion of past test scores allows us tocontrol for baseline development levels due to initial conditions,
4 Paxon and Shady (2007) also use observational measures of parentingstrategies.

6 The percentage of main caregivers who are the biological mother was 99.1 and98.4 in the 2010 and 2012 rounds, respectively.
7 Test scores were standardized at mean 100 and standard deviation of 15. Theperformance classification for PPVT results was as follows (test score range inparentheses): extremely low (55 – 70), moderately low (71 – 85), below average (86– 95), average (96 – 103), above average (104 - 115), moderately high (116 – 130),and extremely high (131 – 145).
M. Berthelon et al. / Economics and Human Biology 36 (2020) 100831 3
which include the effect of past exposure to harsh parenting andthe effects of unobserved mother and child characteristics. It alsoallows us to estimate the association between child developmentand individual and family-level characteristics that are time-invariant, such as personality traits of the mother, among others.However, as these estimates use the cross-sectional variationbetween children, we cannot interpret them as causal estimates ofthe effect of harsh parenting. The model for each outcome can berepresented as follows:
yi; t ¼ b0 þ Y0i;t�1b1 þ b2HPi;t þ C
0i;t�1b3 þ P
0i;t�1b4 þ M
0i;t�1b5
þ H0i;t�1b6 þ ei;t ð1Þ
where yi; t is a contemporaneous measure of cognitive or socio-emotional development. Our measures of child development areresults from the Peabody Picture Vocabulary Test (PPVT) forcognition, and from the Child Behavior Checklist (CBCL) for socio-emotional development. Yi;t�1 is a vector that includes past levelsof both outcome variables. HPi;t is our variable of interest thatmeasures harsh parenting in period t, and Ci;t�1, Pi;t�1, Mi;t�1 andHi;t�1 are vectors of predetermined child, pregnancy, mother andhousehold characteristics, respectively. Child controls in Ci;t�1
include age of the child, child's sex, height-for-age z-score, heightand weight at birth, whether he or she was premature, and adummy variable that takes value 1 if the child is indigenous.Pregnancy variables (Pi;t�1) include information on mother andchild’s health during pregnancy and delivery: whether the fetuswas diagnosed with health problems, the number of medicalproblems that occurred during delivery of the child, whether it wasa preterm delivery, whether the mother was diagnosed withmental problems during pregnancy, whether the mother wasdiagnosed with postpartum depression, and whether she smoked,consumed alcohol or drugs while pregnant.
Mothers’ characteristics (Mi;t�1) includes her years of schooling,total number of children, whether she has a husband/partner,whether she is head of the household, and her age (and agesquared). It also includes controls for mother’s cognitive ability,measured by the Wechsler Adults Intelligence Scale (WAIS), andher personality traits as measured by the Big Five personality test(BFI). WAIS is separated into numerical and vocabulary skills andthe BFI is separated into five personality traits: agreeableness,extraversion, conscientiousness, neuroticism, and openness toexperience. We also control for a parenting style index thatcaptures three dimensions: whether the mother does not speak,does not praise, and/or does not caress the child during theinterview using information from the HOME questionnaire.
Finally, household characteristics (Hi;t�1) include whether thehousehold is urban or rural and its income per capita in the firstround of the survey. We also incorporate a series of regionaldummies to control for systematic differences across the fifteenadministrative regions of the country.
3. Data
Our data comes from two rounds of the Early ChildhoodLongitudinal Survey (ELPI for its Spanish acronym) carried out in2010 and 2012 in Chile.5 ELPI is a longitudinal survey designed tobe nationally representative of the population of children. We usedata from the 2010 round that included children aged between 6
5 The Spanish name of the survey is Encuesta Longitudinal de Primera Infancia(ELPI). For more information on the sampling framework see Observatorio Social,Ministerio de Desarrollo Social, Chile (2019)(http://observatorio.ministeriodesar-rollosocial.gob.cl/elpi.php).
and 58 months, and we follow them in the 2012 round when theywere aged 36–83 months.
Each year, the survey was carried out in two phases. On a firstvisit to each household, a sociodemographic survey was taken,which collected information on socio-economic characteristics ofthe household, its demographic composition, parental employ-ment status, health of the child, medical conditions of the motherand child during pregnancy, among others. On a second visit,several developmental tests were applied to the child and her maincaretaker—who was overwhelmingly the mother.6 The testsassessed cognitive, socioemotional and physical development ofthe child, as well as the cognitive and socioemotional state of themother.
3.1. Children’s cognitive and socio-emotional tests
We focus on two widely-known instruments to measure earlychild development: the Spanish version of the Peabody PictureVocabulary Test (PPVT) and the Child Behavior Checklist (CBCL) forpre-school children.The PPVT measures auditoryvocabularyandhasbeen widely used in several international studies as a measure ofcognitive development (Contreras and Gonzalez, 2015; Coddingtonet al., 2014; Paxon and Schady, 2007); it is an important predictor offuture cognitive outcomes (Case and Paxson, 2008; Cunha andHeckman, 2007). The test consists of showing children a slide withfour images and asking them out loud which image corresponds to agiven object or action. The child receives a score of 1 if the answer iscorrect and 0 if incorrect; the test continues until 6 wrong answersare given consecutively. Raw scores are then converted tostandardized test scores; the testing agency also reports categoriesof performance based on the standardized scores.7
The CBCL assesses behavior of the child as reported by theparents or guardians, and can be used to identify problematic areasin child development (Achenbach and Rescorla, 2000). In ourcontext, parents were asked to assess whether and how intenselytheir child engages in a list of problematic behaviors using a Likertscale (0=Not true/never, 1=Sometimes, 2=Often or Very Often); ahigher score means greater socioemotional difficulties.8 Rawscores were converted to standardized scores, and the testingagency also reported performance categories.9
The data reports a total score based on answers for all behaviorproblems; additionally, categories of behaviors can be grouped intoseven clinical syndromes according to the Diagnostic and StatisticalManual of the American Psychiatric Association, DSM-5.10 Further-more, syndromes are grouped into three broad-band behavior scalesinto which CBCL behaviors are grouped: internalization, externali-zation, and sleep problems. The internalization scale includesproblems related with the child herself and incorporates four of theseven syndromes: emotional reactivity, anxiety/depression, somaticcomplaints, and autism. The externalization scale includes problemsthat involve conflicts between the child and others, and expectations
8 Online Appendix 1 includes the full list of questions asked to parents/guardiansin 2012.
9 Test scores were standardized at mean 60 and standard deviation 10. Thecategories for the CBCL were as follows (test score range in parentheses): normal (<60), at risk (60–63), and clinical range (>63).10 The syndromes include: emotional reactivity, anxiety/depression, somaticcomplaints, withdrawn, sleep problems, attention problems, and aggressivebehavior.

Table 1Descriptive statistics (2010 and 2012).
2010 2012a
Variables: Mean S.D. Mean S.D.
PPVT (T-score) 104.3 15.3 106.2 18.8Low PPVT (fraction) 0.08 0.27 0.13 0.34CBCL (T-score) 60.0 9.9 55.0 11.6Clinical Range CBCL (fraction) 0.36 0.48 0.24 0.42Child Characteristics
Male 0.50 0.50Indigenous descent 0.11 0.32Age (months) 41.0 6.89 66.9 6.95Height-for-age (z-score) 0.021 1.036 0.125 1.029
Pregnancy CharacteristicsFetus had prob. during pregnancy 0.12 0.33Num. Prob. During Delivery 0.32 0.61Preterm birth 0.02 0.14Height at birth (cm.) 49.8 2.04Weight at birth (grams) 3,412 485Mother had mental health problem during Pregnancy 0.10 0.30Mothers' Post-Partum Depression 0.10 0.31Num. Prob. During Pregnancy 3.29 4.91Smoked during pregnancy 0.09 0.29Alcohol during pregnancy 0.07 0.25Drugs during pregnancy 0.01 0.09
Mother CharacteristicsYears of Schooling 11.4 3.0 11.5 3.0Number of Children 2.00 1.00 2.11 0.99Has a partner 0.72 0.45 0.72 0.45Head of Household 0.13 0.33 0.19 0.39Age (years) 30.3 7.05 32.4 7.03Numeric WAIS 6.91 2.73Vocabulary WAIS 8.18 3.53BFI agreeableness 3.83 0.59BFI exteriorization 3.48 0.74BFI responsibility 4.00 0.57BFI neuroticism 3.06 0.81BFI openness to experience 3.78 0.64Parenting Style Index (0–3) 0.57 0.84 0.84 0.97
Household CharacteristicsUrban 0.88 0.32 0.88 0.32Income per capita 2010 (CL$ 000) 466.6 838 518.9 482
Number of observations 4073
Notes: Authors’ calculations using 2010 and 2012 ELPI surveys.a Time invariant variables are only reported in 2010.
11 It is also possible that observed harsh parenting over-reports its true incidenceif parents threaten or spank their child to elicit good behavior in the presence of thesurveyor. We thank an anonymous referee for pointing out these possible biases.
4 M. Berthelon et al. / Economics and Human Biology 36 (2020) 100831
about the child. It groups two syndromes: attention problems andaggressive behavior. The sleep problems syndrome stands alone.
Descriptive statistics of the outcome variables are reported inTable 1. Our final sample includes 4073 children aged 52–83months in 2012 (who were aged between 30 and 58 months in2010). We also analyzed developmental categories reported forboth PPVT and CBCL variables, which indicate whether the child isat risk in terms of her development; distributions of developmen-tal categories are reported in Online Appendix 2.
In our sample, a child has low achievement level on the PPVT ifresults are classified in the extremely low and moderately lowcategories: 8 and 13 percent of the sample belonged to these lower-achievement categories in 2010 and 2012, respectively. For theCBCL, we analyze whether children are in a clinical range, with 36and 24 percent of children classified in this category in 2010 and2012, respectively.
3.2. Measures of harsh parenting
Most of the literature on harsh parenting relies on self-reports byparents of their disciplining behaviors. Although measures ofobserved parental behaviors are less frequent, some surveys thatinvolve home visits ask the surveyors to observe and record parents’behaviors towards their children during the survey visit, from whichit ispossible to construct measures ofobservedharsh parenting. Bothmeasures are subject to different types of measurement error. If
parents perceive harsh parenting as socially unacceptable, self-reported measures are likely to underreport their true incidence;likewise, observed harsh parenting can underreport its trueincidence if parents alter their behavior because of the presenceof the surveyor/test enumerator (assuming it is socially unaccept-able), or because the home visit occurs during a relatively shortperiod of time.11 Since our data allows us to construct both types ofharsh parenting measures, we conduct our analysis with bothmeasures because we cannot ascertain which error is smaller, andbecausetheyallow usto assess whetherourresults are robust to bothmeasures of harsh parenting. Furthermore, we analyze bothmeasures because it is likely that the effect of self-reported harshparenting reflects the effect of more systematic or permanentparental strategy, whereas the effect of observed parental aggres-sions reflect an immediate response by the child to the parents’behavior during the day of the developmental test.
Our self-reported measures—available only in the 2012 wave—were obtained from questions answered by mothers regarding howoften they scold, shout at, threaten, or hit the child if she/hemisbehaves. From their response we construct a dichotomousvariable that is equal to 1 if a mother answered almost always or
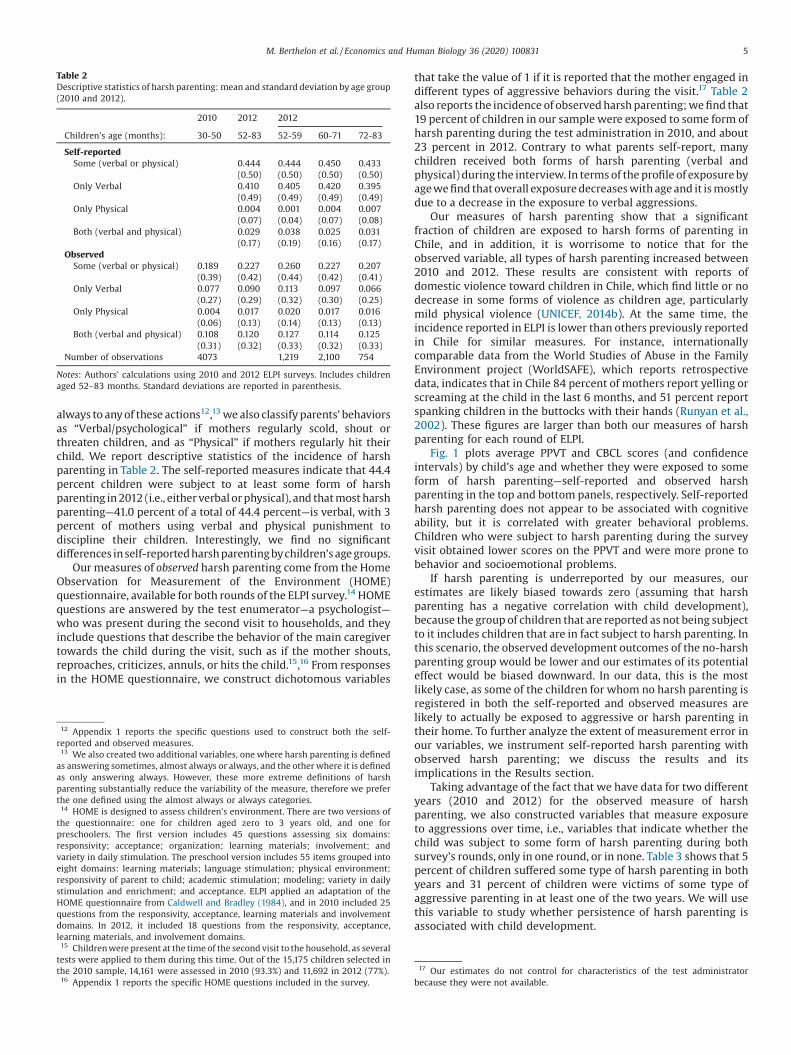
Table 2Descriptive statistics of harsh parenting: mean and standard deviation by age group(2010 and 2012).
2010 2012 2012
Children's age (months): 30-50 52-83 52-59 60-71 72-83
Self-reportedSome (verbal or physical) 0.444 0.444 0.450 0.433
(0.50) (0.50) (0.50) (0.50)Only Verbal 0.410 0.405 0.420 0.395
(0.49) (0.49) (0.49) (0.49)Only Physical 0.004 0.001 0.004 0.007
(0.07) (0.04) (0.07) (0.08)Both (verbal and physical) 0.029 0.038 0.025 0.031
(0.17) (0.19) (0.16) (0.17)Observed
Some (verbal or physical) 0.189 0.227 0.260 0.227 0.207(0.39) (0.42) (0.44) (0.42) (0.41)
Only Verbal 0.077 0.090 0.113 0.097 0.066(0.27) (0.29) (0.32) (0.30) (0.25)
Only Physical 0.004 0.017 0.020 0.017 0.016(0.06) (0.13) (0.14) (0.13) (0.13)
Both (verbal and physical) 0.108 0.120 0.127 0.114 0.125(0.31) (0.32) (0.33) (0.32) (0.33)
Number of observations 4073 1,219 2,100 754
Notes: Authors’ calculations using 2010 and 2012 ELPI surveys. Includes childrenaged 52–83 months. Standard deviations are reported in parenthesis.
M. Berthelon et al. / Economics and Human Biology 36 (2020) 100831 5
always to any of these actions12,13 we also classify parents’ behaviorsas “Verbal/psychological” if mothers regularly scold, shout orthreaten children, and as “Physical” if mothers regularly hit theirchild. We report descriptive statistics of the incidence of harshparenting in Table 2. The self-reported measures indicate that 44.4percent children were subject to at least some form of harshparenting in 2012 (i.e., either verbal or physical), and that most harshparenting—41.0 percent of a total of 44.4 percent—is verbal, with 3percent of mothers using verbal and physical punishment todiscipline their children. Interestingly, we find no significantdifferences in self-reportedharsh parenting bychildren’s age groups.
Our measures of observed harsh parenting come from the HomeObservation for Measurement of the Environment (HOME)questionnaire, available for both rounds of the ELPI survey.14 HOMEquestions are answered by the test enumerator—a psychologist—who was present during the second visit to households, and theyinclude questions that describe the behavior of the main caregivertowards the child during the visit, such as if the mother shouts,reproaches, criticizes, annuls, or hits the child.15,16 From responsesin the HOME questionnaire, we construct dichotomous variables
12 Appendix 1 reports the specific questions used to construct both the self-reported and observed measures.13 We also created two additional variables, one where harsh parenting is definedas answering sometimes, almost always or always, and the other where it is definedas only answering always. However, these more extreme definitions of harshparenting substantially reduce the variability of the measure, therefore we preferthe one defined using the almost always or always categories.14 HOME is designed to assess children’s environment. There are two versions ofthe questionnaire: one for children aged zero to 3 years old, and one forpreschoolers. The first version includes 45 questions assessing six domains:responsivity; acceptance; organization; learning materials; involvement; andvariety in daily stimulation. The preschool version includes 55 items grouped intoeight domains: learning materials; language stimulation; physical environment;responsivity of parent to child; academic stimulation; modeling; variety in dailystimulation and enrichment; and acceptance. ELPI applied an adaptation of theHOME questionnaire from Caldwell and Bradley (1984), and in 2010 included 25questions from the responsivity, acceptance, learning materials and involvementdomains. In 2012, it included 18 questions from the responsivity, acceptance,learning materials, and involvement domains.15 Children were present at the time of the second visit to the household, as severaltests were applied to them during this time. Out of the 15,175 children selected inthe 2010 sample, 14,161 were assessed in 2010 (93.3%) and 11,692 in 2012 (77%).16 Appendix 1 reports the specific HOME questions included in the survey.
that take the value of 1 if it is reported that the mother engaged indifferent types of aggressive behaviors during the visit.17 Table 2also reports the incidence of observed harsh parenting; we find that19 percent of children in our sample were exposed to some form ofharsh parenting during the test administration in 2010, and about23 percent in 2012. Contrary to what parents self-report, manychildren received both forms of harsh parenting (verbal andphysical) during the interview. In terms of the profile of exposure byage we find that overall exposure decreases with age and it is mostlydue to a decrease in the exposure to verbal aggressions.
Our measures of harsh parenting show that a significantfraction of children are exposed to harsh forms of parenting inChile, and in addition, it is worrisome to notice that for theobserved variable, all types of harsh parenting increased between2010 and 2012. These results are consistent with reports ofdomestic violence toward children in Chile, which find little or nodecrease in some forms of violence as children age, particularlymild physical violence (UNICEF, 2014b). At the same time, theincidence reported in ELPI is lower than others previously reportedin Chile for similar measures. For instance, internationallycomparable data from the World Studies of Abuse in the FamilyEnvironment project (WorldSAFE), which reports retrospectivedata, indicates that in Chile 84 percent of mothers report yelling orscreaming at the child in the last 6 months, and 51 percent reportspanking children in the buttocks with their hands (Runyan et al.,2002). These figures are larger than both our measures of harshparenting for each round of ELPI.
Fig. 1 plots average PPVT and CBCL scores (and confidenceintervals) by child’s age and whether they were exposed to someform of harsh parenting—self-reported and observed harshparenting in the top and bottom panels, respectively. Self-reportedharsh parenting does not appear to be associated with cognitiveability, but it is correlated with greater behavioral problems.Children who were subject to harsh parenting during the surveyvisit obtained lower scores on the PPVT and were more prone tobehavior and socioemotional problems.
If harsh parenting is underreported by our measures, ourestimates are likely biased towards zero (assuming that harshparenting has a negative correlation with child development),because the group of children that are reported as not being subjectto it includes children that are in fact subject to harsh parenting. Inthis scenario, the observed development outcomes of the no-harshparenting group would be lower and our estimates of its potentialeffect would be biased downward. In our data, this is the mostlikely case, as some of the children for whom no harsh parenting isregistered in both the self-reported and observed measures arelikely to actually be exposed to aggressive or harsh parenting intheir home. To further analyze the extent of measurement error inour variables, we instrument self-reported harsh parenting withobserved harsh parenting; we discuss the results and itsimplications in the Results section.
Taking advantage of the fact that we have data for two differentyears (2010 and 2012) for the observed measure of harshparenting, we also constructed variables that measure exposureto aggressions over time, i.e., variables that indicate whether thechild was subject to some form of harsh parenting during bothsurvey’s rounds, only in one round, or in none. Table 3 shows that 5percent of children suffered some type of harsh parenting in bothyears and 31 percent of children were victims of some type ofaggressive parenting in at least one of the two years. We will usethis variable to study whether persistence of harsh parenting isassociated with child development.
17 Our estimates do not control for characteristics of the test administratorbecause they were not available.

Fig. 1. PPVT and CBCL scores by Harsh Parenting type and age (2012).Notes: Authors’ calculations using 2012 ELPI surveys. Includes children aged 52–83 months in 2012.
Table 3Persistence of observed harsh parenting by type (percentages).
Type of Harsh Parenting: None Once Both
Some (verbal or physical) 63.7 31.0 5.3Only Verbal 65.1 30.2 4.7Only Physical 76.6 21.9 1.5Both (verbal and physical) 78.5 20.2 1.3
Notes: Authors’ calculations using 2010 and 2012 ELPI surveys. The number ofobservations is 4073 children aged 52–83 months in 2012.
18 In PPVT, higher values are associated with higher cognitive development. Sincethe CBCL measures problem behaviors, higher values mean worse socio-emotionaldevelopment. For the binary outcome we report results of a linear probabilitymodel, although we also estimated probit regressions that yielded similar results.Results of the probit estimates are available upon request.19 Effects of the test scores are obtained dividing the point estimates by thestandard deviation of the dependent variable. For categorical outcomes, the effectsare obtained dividing point estimates by the average of the dependent variable.
6 M. Berthelon et al. / Economics and Human Biology 36 (2020) 100831
3.3. Mother’s cognitive and socioemotional development and othercontrol variables
In ourestimates, we also control forcognitive and socioemotionaldevelopment of the mother, as it has been shown that theysignificantly affect their children's development (Contreras andGonzalez, 2015). Thus, as control variables we include results for theWechsler Adults Intelligence Scale (WAIS) and the Big Five Inventory(BFI) tests applied to mothers. We include both WAIS test resultsavailable—one that measures mothers’ digit span and anothermeasuring her vocabulary—which provide measures of mothers’cognitive ability. In turn, the BFI assesses personality traits separatedin five different categories: extraversion, agreeableness, responsi-bility, neuroticism, and openness to experience (John and Srivastava,1999). A Parenting Style Index is also constructed by analyzing threequestions of the HOME questionnaire that characterize therelationship between the mother and the child during the visit.The questions include whether the mother does not speak, praise,and/or caress her child; thus our variable takes values between 0 and3, with higher values indicating more uninvolved or detachedparenting styles (Jones et al., 2014). Descriptive statistics forvariables that describe the child, pregnancy, mother, and household(detailed in Section 2) are reported in Table 1.
4. Results
We measured the effects of harsh parenting on children’scognitive and socio-emotional development in 2012 controlling foreach child’s initial development in 2010, by estimating Eq. (1) forboth developmental areas—cognitive and socio-emotional—withboth measures of harsh parenting. For each developmental area,we included test scores and a discrete variable that indicateswhether children have low cognitive development (for PPVTscores) or clinical behavior problems (for CBCL scores) asdependent variables. We analyze the latter measures to have asense of the importance of the effect, i.e., whether exposure toharsh parenting increases the likelihood of at-risk categories ofdevelopment. Results are reported in Table 4.
Exposure to harsh parenting is significantly associated withlower PPVT test scores: self-reported and observed harshparenting reduce PPVT scores by 1.1 and 1.8 points, which areequivalent to 0.06 and 0.9 standard deviations, respectively(columns 1 and 2). Furthermore, children exposed to harshparenting during the survey visit were 3.6 percentage points—or28 percent—more likely to have “Low” performance in the PPVTtest.18,19
In terms of socio-emotional development, harsh parenting issignificantly associated with increases in children’s behavioral

Table 4Effects of harsh parenting (HP) on cognitive and socio-emotional outcomes (2012).
Cognitive Outcome: PPVT Socio-emotional Outcome: CBCL
Test-scores Low PPVT Category Test-scores Clinical CBCL Category
Variables/Statistics: (1) (2) (3) (4) (5) (6) (7) (8)
Self-reported HP �1.060** 0.00892 1.247*** 0.0425***(0.536) (0.0105) (0.333) (0.0128)
Observed HP �1.786*** 0.0364*** 3.177*** 0.0749***(0.664) (0.0135) (0.385) (0.0161)
PPVT 2010 0.401*** 0.399*** �0.0164 �0.0135(0.0196) (0.0196) (0.0116) (0.0116)
PPVT 2010 Low Category 0.184*** 0.183*** 0.00987 0.00783(0.0262) (0.0261) (0.0263) (0.0263)
CBCL 2010 �0.148*** �0.149*** 0.390*** 0.390***(0.0308) (0.0308) (0.0192) (0.0191)
CBCL 2010 Clinical Risk 0.0135 0.0132 0.232*** 0.232***(0.0121) (0.0121) (0.0156) (0.0156)
Male �2.234*** �2.196*** 0.0333*** 0.0324*** 0.660** 0.588* 0.0365*** 0.0349***(0.530) (0.530) (0.0102) (0.0102) (0.327) (0.325) (0.0125) (0.0125)
Mother's Mental Prob. in Pregnancy �0.237 �0.200 0.0167 0.0157 �0.0820 �0.159 0.0107 0.00915(0.926) (0.928) (0.0183) (0.0184) (0.609) (0.608) (0.0239) (0.0239)
Num. Prob. During Pregnancy 0.0856 0.0826 �0.00166* �0.00164 0.101*** 0.104*** 0.00301** 0.00314**(0.0532) (0.0532) (0.00100) (0.00100) (0.0347) (0.0346) (0.00133) (0.00133)
Alcohol during pregnancy 1.586 1.491 �0.0287 �0.0274 0.400 0.535 �0.0179 �0.0141(0.967) (0.967) (0.0190) (0.0189) (0.666) (0.659) (0.0246) (0.0245)
Mother's education 0.576*** 0.564*** �0.00794*** �0.00770*** �0.385*** �0.366*** �0.0145*** �0.0140***(0.114) (0.114) (0.00219) (0.00220) (0.0671) (0.0667) (0.00255) (0.00255)
Number of Children �1.023*** �0.993*** 0.00728 0.00662 �0.139 �0.193 0.00707 0.00570(0.322) (0.322) (0.00672) (0.00668) (0.195) (0.194) (0.00,759) (0.00758)
Mother has a partner �0.412 �0.393 �0.00449 �0.00469 �1.441*** �1.467*** �0.0394** �0.0401**(0.667) (0.667) (0.0134) (0.0134) (0.405) (0.401) (0.0162) (0.0162)
Mother is Head of Household �2.246*** �2.201** 0.0355** 0.0348** �0.875* �0.944* �0.0260 �0.0279(0.854) (0.855) (0.0176) (0.0176) (0.498) (0.497) (0.0191) (0.0190)
Mothers' WAIS Numeric �0.0698 �0.0840 �0.00128 �0.00106 �0.0232 �0.00250 �0.000414 0.000209(0.111) (0.111) (0.00202) (0.00202) (0.0674) (0.0671) (0.00255) (0.00255)
Mothers' WAIS Vocabulary 0.326*** 0.334*** �0.00586*** �0.00598*** �0.120** �0.133** �0.00207 �0.00236(0.0922) (0.0923) (0.00183) (0.00184) (0.0553) (0.0550) (0.00213) (0.00211)
Mothers' BFI Agreeableness �0.0933 �0.0495 �0.00136 �0.00192 �0.440 �0.500 0.00238 0.000552(0.503) (0.504) (0.00990) (0.00989) (0.310) (0.306) (0.0123) (0.0122)
Mothers' BFI Extraversion 0.799** 0.763** �0.00657 �0.00625 �0.208 �0.166 �0.0155* �0.0140(0.383) (0.382) (0.00750) (0.00751) (0.240) (0.239) (0.00924) (0.00921)
Mothers' BFI Conscientiousness �0.188 �0.0688 0.000358 �0.00148 �0.467 �0.649** �0.0288** �0.0338***(0.516) (0.515) (0.0101) (0.0101) (0.318) (0.317) (0.0122) (0.0121)
Mothers' BFI Neuroticism 0.289 0.304 0.00191 0.00114 0.675*** 0.627*** 0.0457*** 0.0451***(0.397) (0.396) (0.00725) (0.00721) (0.240) (0.238) (0.00896) (0.00894)
Mothers' BFI Openness to experience 0.344 0.349 �0.00159 �0.00144 0.711** 0.715** 0.0246** 0.0245**(0.452) (0.452) (0.00898) (0.00897) (0.292) (0.290) (0.0109) (0.0109)
Parenting Style Index �1.276*** �1.202*** 0.0161*** 0.0146*** 1.332*** 1.204*** 0.0326*** 0.0295***(0.269) (0.269) (0.00559) (0.00557) (0.175) (0.174) (0.00673) (0.00673)
Observations 4073 4073 4073 4073 4073 4073 4073 4073R-squared 0.244 0.245 0.09 0.092 0.236 0.246 0.168 0.171Mean Dep. Variable 106.2 106.2 0.129 0.129 55.04 55.04 0.235 0.235Mean HP 0.44 0.23 0.44 0.23 0.44 0.23 0.44 0.23
Source: estimates using ELPI survey data from 2010 and 2012. Includes children aged 52–83 months. Other control variables measured in 2010 that are not reported hereinclude child's age in 2010 (months), child is of indigenous descent, z-score height for age, fetus had problems during pregnancy, number of problems during delivery,premature, height at birth, weight at birth, mothers' post-partum depression, smoked during pregnancy, drugs during pregnancy, mothers' age, mothers' age squared, urbanhousehold, household income per capita 2010, and a series of categorical variables for region of residency. Robust standard errors in parentheses *** p < 0.01, ** p < 0.05, *p < 0.1.
M. Berthelon et al. / Economics and Human Biology 36 (2020) 100831 7
problems for both self-reported and observed aggressive parent-ing, and for test scores as well as the likelihood of falling into aclinical category. Point estimates indicate that harsh parentingincreases CBCL scores by 0.11 and 0.27 standard deviations for self-reported and observed harsh parenting, respectively; and by 18and 33 percent for the likelihood of clinical behavioral problemsfor self-reported and observed harsh parenting, respectively.
At the same time, results show that other control variables areassociated to cognitive and socio-emotional development in theexpected relations. Initial levels of cognitive and socio-emotionaldevelopment (child’s PPVT and CBCL test scores in 2010) indicatethat children with higher initial cognitive development obtainbetter cognitive results in 2012, and children with more initialbehavioral problems tend to have more problems two years later.
These results point towards significant persistence of early childdevelopment levels, highlighting the importance of early inter-ventions to reduce inequality across children.
Among other results, girls have better scores in the languagetest (PPVT) and present lower levels of behavior problems (CBCL)relative to boys, and mother’s years of schooling is significantlyassociated with both areas of development. It is interesting to pointout that mother’s cognitive abilities and personality traits aresignificantly associated with children’s outcomes. Her verbal skills(WAIS vocabulary) are significantly associated with both types ofchild development (not her numeracy skills), and we find asignificant association between mother’s extraversion and child’scognitive development, which suggest that mother’s communica-tion skills are relevant. In turn, higher levels of neuroticism of the

Table 5Persistence of observed harsh parenting (HP) on cognitive and socio-emotional outcomes (2012).
Cognitive Outcome:PPVT
Socio-emotional Outcome: CBCL
Test-scores Low PPVT Category Test-scores Clinical CBCL CategoryVariables/Statistics: (1) (2) (3) (4)
Some HP in both surveys �2.903** 0.0412 2.762*** 0.108***(1.326) (0.0262) (0.723) (0.0303)
Some HP in one survey �0.632 0.0209* 1.532*** 0.0365**(0.576) (0.0114) (0.358) (0.0142)
Observations 4073 4073 4073 4073R-squared 0.244 0.091 0.238 0.169Mean Dep. Variable 106.2 0.129 55.04 0.235Fraction HP: Two times 0.0530 0.0530 0.0530 0.0530Fraction HP: One time 0.310 0.310 0.310 0.310F-test Equality (p-value) 0.0939 0.452 0.0968 0.0232
Source: estimates using ELPI survey data from 2010 and 2012. Includes children aged 52–83 months. Other control variables measured in 2010 that are not reported hereinclude PPVT and CBCL scores, child’s sex, child's age (months), z-score height for age, child is of indigenous descent, fetus had problems during pregnancy, number ofproblems during delivery, premature, height at birth, weight at birth, mother's mental problems during pregnancy, num. prob. during pregnancy, smoked during pregnancy,alcohol during pregnancy, drugs during pregnancy, mother's education, number of children, mother has a partner, mother is head of household, mothers' age, mothers' agesquared, mothers' WAIS numeric, mothers' WAIS vocabulary, mothers' BFI agreeableness, mothers' BFI extraversion, mothers' BFI conscientiousness, mothers' BFIneuroticism, mothers' BFI openness to experience, parenting style index care in 2012 (0–3), urban household, household perc capita income and a series of categoricalvariables for region of residency. Robust standard errors in parentheses *** p < 0.01, ** p < 0.05, * p < 0.1.
8 M. Berthelon et al. / Economics and Human Biology 36 (2020) 100831
mother are associated with children having more behavioralproblems, which highlights the importance of maternal mentalhealth in child development.20
A possible concern with these estimates is the extent to whichunobservables could be biasing them. To analyze this possibilitywe estimate Oster bounds (Oster, 2019) for each of the estimationsreported in Table 4. These bounds allow us to evaluate the possibledegree of omitted variable bias under the assumption that theselection on the observed controls is proportional to the selectionon the unobserved controls. Following Oster (2019), and using amaximum r-squared that is 30 percent higher than the oneobtained in our fully-controlled estimates, we estimate that all thecalculated Oster bounds are within the confidence interval of ourestimated coefficients and that all the identified sets defined by theOster bounds exclude the zero, both of which indicate that ourvariables are robust to the inclusion of omitted variables(estimations are summarized and reported in Appendix 2).21
4.1. Persistence of harsh parenting and child development
Next, we take advantage of the two rounds of the survey toinvestigate if persistence of observed harsh parenting over time isrelevant. We construct two categorical variables indicatingwhether the child was exposed to some aggression during theinterview in both years or whether he or she was exposed onlyonce (the comparison group is children that were not exposed toharsh parenting in either rounds). Results reported in Table 5indicate that persistent exposure to harsh parenting harms childdevelopment in both cognitive and socio-emotional outcomes.Children that were exposed to some form of aggression in at leastone year (around 30 percent of children) have a higher probabilityof falling into a low-level developmental category and morebehavioral problems than children that were not exposed.
20 Regressions are estimated including the full set of control variables described inSection 2. For brevity we report a subset of variables; however, a table with the fullset of control variables is available in Online Appendix 2.21 Another concern is measurement error in our harsh parenting variables, whichwould result in attenuation bias in our estimates. We addressed this issue byinstrumenting self-reported harsh parenting with observed harsh parenting. Our IVresults confirm the negative association between harsh parenting and children’sdevelopment, and they also suggest that measurement error is present. In thiscontext, our OLS estimates can be interpreted as a lower bound of the true effect ofharsh parenting on children’s outcomes. IV estimates are available upon request.
Furthermore, children exposed to harsh parenting in both rounds(around 5 percent of children) have even lower developmentallevels both in terms of language development and behavioralproblems, and the negative effects are observed in both their testscores and problem categories. These results reveal that exposureto systematic aggressive parent strategies over time is detrimentalto child development, and highlights the importance of effortsconducive to reducing violence towards children as early aspossible.
4.2. Harsh parenting and types of aggression
An additional question that we can explore with our data iswhether verbal and physical aggressions have different effects onchild development. To answer this question, we estimate Eq. (1)separating the type of parental aggression to which children areexposed into only verbal, and physical and verbal violence.22
Results are reported in Table 6 and they show that for languagedevelopment, once we separate harsh parenting by type, it isverbal aggressions that are correlated with lower test scores(columns 1, 2 and 4). We also find that both types of violenceincrease children’s behavior problems (columns 5 through 8). Pointestimates suggest that verbal aggressions might have largernegative effects, but a test for equality in these points estimates(reported at the bottom of the table) cannot reject the null thatthey are statistically the same from all but one estimate (column 6).Thus, our data suggests that harsh parenting reduces childdevelopment, and that both forms of harsh parenting have similareffects.
4.3. Harsh parenting and socio-emotional development
As described previously, the CBCL measures behaviors relatedto seven syndromes that can be classified into three broadcategories of problems: internalization, externalization, and sleepproblems. We explore the effect of aggressive parenting on each ofthese categories and report our results in Table 7 and find that it
22 Theoretically, three categories exist: only verbal, only physical, and both formsof aggression. However, only a very small fraction (between 0.4 and 1.7 percent) ofchildren are subject to only physical aggressions, since 87 percent of childrenexposed to physical aggressions are also subject to verbal ones. For this reason, wepooled the last two types (only physical and both) into one category.

Table 6Effects of harsh parenting (HP) on cognitive and socio-emotional outcomes by type of aggression (2012).
Cognitive Outcome: PPVT Socio-emotional Outcome: CBCL
Test-scores Low PPVTCategory
Test-scores Clinical CBCL Category
Variables/Statistics: (1) (2) (3) (4) (5) (6) (7) (8)
Self-reported HPOnly Verbal �1.066* 0.00954 1.204*** 0.0400***
(0.550) (0.0107) (0.338) (0.0130)Physical and Verbala �0.993 0.00105 1.808* 0.0748*
(1.352) (0.0285) (1.004) (0.0390)
Observed HPOnly Verbal �3.049*** 0.0549*** 4.569*** 0.101***
(0.965) (0.0208) (0.521) (0.0244)Physical and Verbala �0.937 0.0240 2.241*** 0.0571***
(0.830) (0.0163) (0.489) (0.0198)Observations 4073 4073 4073 4073 4073 4073 4073 4073R-squared 0.244 0.245 0.090 0.092 0.236 0.248 0.168 0.171Mean Dep. Variable 106.2 106.2 0.129 0.129 55.04 55.04 0.235 0.235Mean Verbal HP 0.41 0.0904 0.41 0.0904 0.41 0.0904 0.41 0.0904Mean Both HP 0.0339 0.137 0.0339 0.137 0.0339 0.137 0.0339 0.137F-test Equality (p-value) 0.958 0.079 0.767 0.218 0.549 0.000 0.377 0.137
a Includes children with only physical aggressions and children with both verbal and physical.Source: estimates using ELPI survey data from 2010 and 2012. Includeschildren aged 52–83 months. Other control variables measured in 2010 that are not reported here include PPVT and CBCL scores, child’s sex, child's age (months), z-scoreheight for age, child is of indigenous descent, fetus had problems during pregnancy, number of problems during delivery, premature, height at birth, weight at birth, mother'smental problems during pregnancy, num. prob. during pregnancy, smoked during pregnancy, alcohol during pregnancy, drugs during pregnancy, mother's education, numberof children, mother has a partner, mother is head of household, mothers' age, mothers' age squared, mothers' WAIS numeric, mothers' WAIS vocabulary, mothers' BFIagreeableness, mothers' BFI extraversion, mothers' BFI conscientiousness, mothers' BFI neuroticism, mothers' BFI openness to experience, parenting style index care in 2012(0–3), urban household, household perc capita income and a series of categorical variables for region of residency. Robust standard errors in parentheses *** p < 0.01, **p < 0.05, * p < 0.1.
Table 7Effects of harsh parenting (HP) on socio-emotional outcomes by CBCL categories(2012).
Test-scores Clinical CBCL Category
Variables/Statistics: (1) (2) (3) (4)
CBCL: InternalizationSelf-reported HP 0.877*** 0.0293**
(0.335) (0.0137)Observed HP 2.818*** 0.0610***
(0.386) (0.0169)Observations 4073 4073 4073 4073R-squared 0.176 0.185 0.131 0.134Mean Dep. Variable 56.17 56.17 0.283 0.283Mean HP 0.444 0.227 0.444 0.227
CBCL: ExternalizationSelf-reported HP 1.459*** 0.0501***
(0.333) (0.0119)Observed HP 3.395*** 0.0942***
(0.389) (0.0154)Observations 4073 4073 4073 4073R-squared 0.221 0.232 0.137 0.143Mean Dep. Variable 53.46 53.46 0.182 0.182Mean HP 0.444 0.227 0.444 0.227CBCL: Sleep Problems
Self-reported HP 0.992* 0.00668(0.513) (0.00649)
Observed HP 1.530** 0.00670(0.623) (0.00878)
Observations 2,854 2,854 2,854 2,854R-squared 0.099 0.100 0.040 0.040Mean Dep. Variable 65.17 65.17 0.0326 0.0326Mean HP 0.448 0.236 0.448 0.236
Source: estimates using ELPI survey data from 2010 and 2012. Includes childrenaged 52–83 months. For sleep problems estimates include children aged 52–71months. Other control variables measured in 2010 that are not reported hereinclude child's age in 2010 (months), child is of indigenous descent, z-score heightfor age, fetus had problems during pregnancy, number of problems during delivery,premature, height at birth, weight at birth, mothers' post-partum depression,smoked during pregnancy, drugs during pregnancy, mothers' age, mothers' agesquared, urban household, household income per capita 2010, and a series ofcategorical variables for region of residency. Robust standard errors in parentheses*** p < 0.01, ** p < 0.05, * p < 0.1.
M. Berthelon et al. / Economics and Human Biology 36 (2020) 100831 9
has a negative association with all three syndromes, withparticularly strong effects on internalization and externalizationproblems. The main conclusion from these results is that harshparenting can hinder development of a wide range of behaviors inchildren, and that its consequences are not confined to one specificarea of development.
4.4. Heterogeneous effects of harsh parenting
We also study whether the effects of harsh parenting varyaccording to the child’s sex, age, and maternal education. Resultsby child’s sex are reported in Table 8. Interestingly, the levels ofexposure to harsh parenting (both self-reported and observed) arenot largely different between boys and girls (see bottom row ineach panel). For instance, 43.5 percent of girls are exposed to some(self-reported) harsh parenting compared with 45.3 for boys. Ingeneral, results from the estimations show no significant differ-ences in the association of harsh parenting and child developmentby sex, except for the case of the effect of (self-reported) harshparenting and PPVT (columns 1), and for the likelihood of fallinginto clinical CBCL category (column 8), where the negativeassociation is concentrated among boys. Therefore, our mainconclusion from this exercise is that harsh parenting is associatedwith lower levels of development for both girls and boys in similarmagnitudes, and that there might be stronger effects on boys forsome outcomes.
One possible avenue of further research related to potentialdifferentiated effects would be to assess the intensity ofaggressions, as it could be possible that boys might be exposedto harsher parenting strategies than girls, for instance, they couldbe exposed to stronger shouts or spanked harder, which is notregistered in our data.
As the speed at which children develop changes over time, weare also interested in studying whether the effect of harshparenting varies depending on the age of the child. We classifiedchildren into three groups according to their age in 2012: 4-yearolds (52–59 months in our sample), 5-year olds (60–71 months)

Table 8Effects of harsh parenting (HP) on cognitive and socio-emotional outcomes by sex of the child (2012).
Cognitive Outcome: PPVT Socio-emotional Outcome: CBCL
Variable/Statistics: Test-scores Low PPVTCategory
Test-scores Clinical CBCL Category
(1) (2) (3) (4) (5) (6) (7) (8)
Girls:Self-reported HP �0.583 0.00948 1.130** 0.0360**
(0.752) (0.0141) (0.476) (0.0182)Observed HP �1.940** 0.0430** 2.148*** 0.0149
(0.971) (0.0192) (0.568) (0.0230)Observations 2,023 2,026 2,023 2,026 2,030 2,033 2,030 2,033R-squared 0.266 0.267 0.105 0.108 0.255 0.258 0.163 0.162Mean Dep. Variable 107.6 107.6 0.109 0.110 54.44 54.44 0.212 0.212Mean HP 0.435 0.211 0.435 0.211 0.435 0.211 0.435 0.211
Boys:Self-reported HP �1.665** 0.0110 1.367*** 0.0498***
(0.773) (0.0155) (0.471) (0.0183)Observed HP �1.586* 0.0321* 4.226*** 0.134***
(0.919) (0.0190) (0.525) (0.0225)Observations 2,060 2,063 2,060 2,063 2,064 2,067 2,064 2,067R-squared 0.230 0.230 0.090 0.092 0.235 0.254 0.182 0.195Mean Dep. Variable 104.7 104.7 0.148 0.148 55.69 55.69 0.261 0.260Mean HP 0.453 0.243 0.453 0.243 0.452 0.243 0.452 0.243
Source: estimates using ELPI survey data from 2010 and 2012. Includes children aged 52–83 months. Other control variables measured in 2010 that are not reported hereinclude PPVT and CBCL scores, child's age (months), z-score height for age, child is of indigenous descent, fetus had problems during pregnancy, number of problems duringdelivery, premature, height at birth, weight at birth, mother's mental problems during pregnancy, num. prob. during pregnancy, smoked during pregnancy, alcohol duringpregnancy, drugs during pregnancy, mother's education, number of children, mother has a partner, mother is head of household, mothers' age, mothers' age squared, mothers'WAIS numeric, mothers' WAIS vocabulary, mothers' BFI agreeableness, mothers' BFI extraversion, mothers' BFI conscientiousness, mothers' BFI neuroticism, mothers' BFIopenness to experience, parenting style index care in 2012 (0–3), urban household, household perc capita income and a series of categorical variables for region of residency.Robust standard errors in parentheses *** p < 0.01, ** p < 0.05, * p < 0.1.
Table 9Effects of harsh parenting (HP) on cognitive and socio-emotional outcomes by age of the child (2012).
Cognitive Outcome: PPVT Socio-emotional Outcome: CBCL
Test-scores Low PPVT Category Test-scores Clinical CBCL Category
Variable/Statistics: (1) (2) (3) (4) (5) (6) (7) (8)
Child's Age in Months: 52-59Self-reported HP 0.531 �0.00364 1.067 0.0132
(1.378) (0.0292) (0.746) (0.0294)Observed HP �1.053 0.0278 2.699*** 0.0682*
(1.583) (0.0329) (0.869) (0.0353)Observations 756 757 756 757 761 762 761 762R-squared 0.238 0.236 0.116 0.118 0.268 0.276 0.249 0.254Mean Dep. Variable 103.2 103.2 0.187 0.188 55.58 55.57 0.235 0.235Mean HP 0.444 0.262 0.444 0.262 0.445 0.262 0.445 0.262Child's Age in Months: 60-71
Self-reported HP �1.811** 0.0116 0.993** 0.0255(0.754) (0.0145) (0.468) (0.0171)
Observed HP �3.587*** 0.0479** 3.644*** 0.0994***(0.922) (0.0190) (0.535) (0.0223)
Observations 2,110 2,113 2,110 2,113 2,064 2,067 2,064 2,067R-squared 0.238 0.242 0.099 0.102 0.272 0.285 0.168 0.176Mean Dep. Variable 53.97 53.98 0.211 0.211 55.69 55.69 0.261 0.260Mean HP 0.449 0.226 0.449 0.226 0.452 0.243 0.452 0.243Child's Age in Months: 72-83
Self-reported HP �0.719 0.00573 1.781*** 0.0809***(0.922) (0.0170) (0.605) (0.0254)
Observed HP 1.037 0.0261 2.488*** 0.0310(1.190) (0.0220) (0.740) (0.0318)
Observations 1,222 1,224 1,222 1,224 1,223 1,225 1,223 1,225R-squared 0.306 0.307 0.123 0.125 0.227 0.229 0.206 0.199Mean Dep. Variable 108.6 108.6 0.0949 0.0948 56.66 56.66 0.282 0.282Mean HP 0.435 0.206 0.435 0.206 0.433 0.207 0.433 0.207
Source: estimates using ELPI survey data from 2010 and 2012. Includes children aged 52–83 months. Other control variables measured in 2010 that are not reported hereinclude PPVT and CBCL scores, child's sex, child's age (months), z-score height for age, child is of indigenous descent, fetus had problems during pregnancy, number ofproblems during delivery, premature, height at birth, weight at birth, mother's mental problems during pregnancy, num. prob. during pregnancy, smoked during pregnancy,alcohol during pregnancy, drugs during pregnancy, mother's education, number of children, mother has a partner, mother is head of household, mothers' age, mothers' agesquared, mothers' WAIS numeric, mothers' WAIS vocabulary, mothers' BFI agreeableness, mothers' BFI extraversion, mothers' BFI conscientiousness, mothers' BFIneuroticism, mothers' BFI openness to experience, parenting style index care in 2012 (0–3), urban household, household perc capita income and a series of categoricalvariables for region of residency. Robust standard errors in parentheses *** p < 0.01, ** p < 0.05, * p < 0.1.
10 M. Berthelon et al. / Economics and Human Biology 36 (2020) 100831

Table 10Effects of harsh parenting (HP) on cognitive and socio-emotional outcomes by mother's education (2012).
Cognitive Outcome: PPVT Socio-emotional Outcome: CBCL
Test-scores Low PPVT Category Test-scores Clinical CBCL Category
Variable/Statistics: (1) (2) (3) (4) (5) (6) (7) (8)
Mothers' Education: less than or equal to 12 yearsSelf-reported HP �1.292** 0.0120 1.228*** 0.0393***
(0.603) (0.0124) (0.384) (0.0152)Observed HP �1.802** 0.0421*** 3.492*** 0.0846***
(0.749) (0.0156) (0.429) (0.0186)Observations 3,190 3,196 3,190 3,196 3,197 3,203 3,197 3,203R-squared 0.231 0.232 0.100 0.102 0.205 0.206 0.078 0.079Mean Dep. Variable 104.3 104.3 0.145 0.145 55.92 55.92 0.267 0.266Mean HP 0.453 0.236 0.453 0.236 0.452 0.236 0.452 0.236Mothers' Education: more than 12 years
Self-reported HP �0.663 0.0131 1.194* 0.0522**(1.197) (0.0189) (0.683) (0.0227)
Observed HP �1.917 0.0274 1.825** 0.0549*(1.461) (0.0243) (0.854) (0.0303)
Observations 893 893 893 893 897 897 897 897R-squared 0.218 0.231 0.154 0.158 0.296 0.297 0.210 0.208Mean Dep. Variable 112.8 112.8 0.0717 0.0717 52.04 52.04 0.129 0.129Mean HP 0.413 0.196 0.413 0.196 0.414 0.196 0.414 0.196
Source: estimates using ELPI survey data from 2010 and 2012. Includes children aged 52–83 months. Other control variables measured in 2010 that are not reported hereinclude PPVT and CBCL scores, child's sex, child's age (months), z-score height for age, child is of indigenous descent, fetus had problems during pregnancy, number ofproblems during delivery, premature, height at birth, weight at birth, mother's mental problems during pregnancy, num. prob. during pregnancy, smoked during pregnancy,alcohol during pregnancy, drugs during pregnancy, mother's education, number of children, mother has a partner, mother is head of household, mothers' age, mothers' agesquared, mothers' WAIS numeric, mothers' WAIS vocabulary, mothers' BFI agreeableness, mothers' BFI extraversion, mothers' BFI conscientiousness, mothers' BFIneuroticism, mothers' BFI openness to experience, parenting style index care in 2012 (0–3), urban household, household perc capita income and a series of categoricalvariables for region of residency. Robust standard errors in parentheses *** p < 0.01, ** p < 0.05, * p < 0.1.
24 One of the main reasons for the lack of agreement is that most studies cannotinfer causal a relationship between exposure to milder forms of violence and
M. Berthelon et al. / Economics and Human Biology 36 (2020) 100831 11
and 6-year olds (72–83 months). It is noteworthy that exposure to(self-reported) harsh parenting does not significantly vary with ageacross these three groups, as reported by the mean of harshparenting at the bottom of each panel in Table 9. Observedaggression decreases with age, particularly with 6-year olds. Interms of the estimates for cognitive development, results indicatethat the association is stronger for the group of 5-year old children,with no significant association for the other two groups. Forbehavioral problems, we observe statistically significant associa-tions for all three age groups.
Finally, we study whether the effects of violence varydepending on the level of education of the mother (i.e., hereducation in 2010). We use mother's education as proxy forpermanent income of the household, because current incomelevels could be affected by child behavior or cognitive develop-ment.23 We generate two categories of education: mothers with12 years of completed education or less, and mothers with morethan 12 years (i.e. more than high school). We observe that thereis slightly less harsh parenting in the group of relatively moreeducated mothers, but a large fraction of children in both groupshave parents that use aggressive parenting strategies (Table 10).Our results reveal that the association between harsh parentingand cognitive development is driven by children with lesseducated mothers. For behavioral problems, we find that theassociation is present for both groups and for both measures ofharsh parenting. These results suggests that access to a bettereconomic environment may ameliorate the negative effects ofharsh parenting for cognitive development but not for socio-emotional development.
23 Income measures might be correlated with child development, as for instancemothers could choose not to participate in the labor market if they observebehavioral problems or a lagging cognitive development in their children.
5. Conclusions
There is ample consensus on the harmful effects of severe formsof child abuse and neglect on children’s outcomes. However, theconsensus diminishes when lesser forms of violence towardschildren are analyzed, including verbal violence or corporalpunishment, (MacMillan and Mikton, 2017).24 In this paper, wecontribute to this limited literature in economics by providingestimates of the association between harsh parenting andcognitive and socio-emotional development in early childhood.
First, by taking advantage of a rich, nation-wide longitudinaldata set of children, we estimate a value-added model that allowsus to describe the association between harsh parenting and childdevelopment. In this model, we are able to control for previouschild development levels and past individual and family character-istics. We are also able to estimate the effects of both self-reportedand observed harsh parenting. To our knowledge, no other study ineconomics has used this methodology in the context of non-harmful violence towards children; therefore, we provide resultsthat advance our previous understanding of the consequences ofaggressive parental styles for child development.
Second, we study the effects of harsh parenting on two differenttypes of outcomes: cognitive and socio-emotional development,using PPTV for cognitive development and the CBCL for socio-
children's outcomes. First, studies do not use experimental data because of obviousethical objections to the use of randomized control studies when looking at theeffects of violence. Additionally, most studies are composed of small samples.Although there are no randomized control studies on the effects of violence, there isa growing literature that analyzes the effect of intervention programs to prevent orreduce the incidence of child maltreatment, including programs designed asrandomized controlled trials. For recent reviews on the literature analyzing theeffectiveness of intervention programs see, among others, Euser et al (2015); Chenand Chan (2016) and Vlahovicova et al. (2017).

12 M. Berthelon et al. / Economics and Human Biology 36 (2020) 100831
emotional development. Third, we study whether different typesof violence toward children—verbal and/or physical—have differ-ent effects on development. We also take advantage of thelongitudinal data to study whether systematic exposure toaggressive parenting over time affects child development.
Our estimates indicate that exposure to harsh parenting isassociated with lower language development (our cognitiveoutcome) and more behavioral problems in children. At the sametime, harsh parenting significantly increases the probability thatchildren fall into categories deemed as risky or in clinical ranges intheir behavior. Interestingly, our estimates suggest that there is nodifference in the effects of verbal and physical aggressions, butwhat matters is exposure to either of them.
In addition, we studyheterogeneouseffects on different groups ofchildren finding that the association between harsh parenting andchild development holds for both girls and boys. In terms ofheterogeneity in children’s age we find that the negative associationbetween parental aggression and language development is strongerfor 5-year old children, but it exists for the whole range of ages in oursample (4to 6-yearold children) for the behavioral problems. Finally,we find that children from lower-income households—proxied bylower mother’s education—have stronger negative associations forlanguage development, than children from higher-income families.However, for behavioral problems, the negative association is similarin both groups. Interestingly, our data suggests that the heterogene-ity is not driven by differences in the prevalence of harsh parentingacross groups, but rather from probable differences in how exposureto aggressions affects different children and the coping mechanismsin these different groups.
According to our results, the size of the associations are relevantand informative at least in three dimensions. First, the estimatesindicate the associations of harsh parenting and child developmentare much larger for socio-emotional development (CBCL) than forvocabulary development (PPVT). Second, when comparing theeffects of harsh parenting on verbal skills and socio-emotionaldevelopment, the estimated parameters are large relative to othersocio-economic characteristic of the household, such as maternaleducation or maternal cognitive development. For instance, theeffects of an additional year of education on cognitive and socio-emotional development are about 0.04 and 0.02 standarddeviations, respectively. The effects of maternal vocabularydevelopment are 0.02 and 0.01 standard deviations, respectively.These results compare with the effect of harsh parenting, which forvocabulary development ranges from 0.06 to 0.09 standarddeviations, and for socio-emotional development ranges from0.11 to 0.27 standard deviations.
Third, the estimates on harsh parenting could be also comparedwith the effects of some policies that are aimed at improving childdevelopment at different age stages, for instance, the effect ofdifferent educational policies implemented in Chile. According toGallegos (2013), increasing competition in the educational marketthrough rising access to private voucher schools is associated with0.1 increases in the standard deviation in test scores. On the otherhand, Bellei (2009) examines the effects related to an extension ofthe school day. The author reports an increase in educationalachievement between 0.05 and 0.12 standard deviation due to thispolicy. Finally, Valenzuela et al. (2013) show that a policy thatincreases the voucher for socio-economically vulnerable studentsis associated with an increase in education achievement between0.04 and 0.07 standard deviations. Thus, our reported estimates onthe association of harsh parenting and child development arefound to be large in comparison with evidence related to theimpact of different educational policies implemented in Chile thathave been previously reported in literature.
As expected, given the inherent difficulties in measuringexposure to harsh parenting, our estimates have limitations. Our
measures of harsh parenting do not fully capture the intensity ofaggressions suffered by children. Although we are separatingverbal from physical aggression, our measures do not allow us toaccount for the degrees to which both verbal and physical violencecan be exerted. In addition, we are not fully capturing howsystematic or repetitive parental aggression is, although again, weattempt to capture this dimension (at least partially) by using twoseparate observations over time in our analysis of persistence.These limitations are also present when we estimate heteroge-neous effects, as, for instance, we have no information regardinghow harshness or frequency varies between boys and girls(although our measures indicate no significant differences in theincidence of harsh parenting between these two groups).
All these limitations reveal the need for further research in thisarea. Generating better measures of parental quality, includingmore detailed information on exposure, intensity and persistenceof aggressions suffered by children, as well as a better characteri-zation of parenting styles, including disciplining strategies, wouldprovide answers to the unanswered questions in this area ofresearch. The evidence in this paper reveals that parental qualitymatters. Aggression towards children does not need to reach levelsof abuse in order to harm children’s early childhood development,and therefore highlights the need for educational programs andinterventions to train parents, especially among lower-income,lower educated families.
Acknowledgements
Diana Kruger and Dante Contreras acknowledge the financialsupport provided by the Centre for Social Conflict and CohesionStudies (CONICYT/FONDAP/15130009). Contreras also acknowl-edges the financial support provided by the Millennium Nucleus ofSocial Development, which is supported by the MillenniumScientific Initiative of the Ministry of Economy, Developmentand Tourism (Chile). We thank an anonymous referee, as well asJere Behrman, Juan Eberhard, Marigen Narea, Javier Nuñez, andparticipants at Universidad Adolfo Ibáñez CEPR, Oregon StateUniversity, Pontificia Universidad Católica de Chile (School ofPsychology), and Universidad de Chile (Economics Department)seminars, as well as participants at the Colloquium on CurrentTopics in Psychology at the School of Psychology of the UniversidadCatólica de Chile, the 3rd Mental Health Day at the School ofPsychology of the Universidad Adolfo Ibáñez, 7th NorthwestDevelopment Workshop, 2018 Meeting of the Chilean EconomicSociety, and 3rd IZA Workshop on Gender and Family Economicsfor helpful comments. All errors are our own.
Appendix A. Supplementary data
Supplementary material related to this article can be found, in theonline version, at doi:https://doi.org/10.1016/j.ehb.2019.100831.
References
Achenbach, T.M., Rescorla, L.A., 2000. Manual for the ASEBA Preschool Forms &Profiles. University of Vermont, Research Center for Children, Youth, & Families,Burlington, VT.
Anderberg, D., Rainer, H., 2013. Economic abuse: a theory of intrahouseholdsabotage. J. Public Econ. 97, 282–295.
Anderberg, D., Rainer, H., Wadsworth, J., Wilson, T., 2016. Unemployment anddomestic violence: theory and evidence. Econ. J. 126 (597), 1947–1979.
Almond, D., Currie, J., Duque, V., 2017. Childhood Circumstances and AdultOutcomes: Act II. NBER Working Paper No. 23017, January. doi:http://dx.doi.org/10.3386/w23017.
Bellei, C., 2009. Does lengthening the school day increase students’ academicachievement? Results from a natural experiment in Chile. Econ. Educ. Rev. 28(5), 629–640.
Benjet, C., Kazdin, A.E., 2003. Spanking children: the controversies, findings, andnew directions. Clin. Psychol. Rev. 23, 197–224.

M. Berthelon et al. / Economics and Human Biology 36 (2020) 100831 13
Bloch, F., Vijayendra, R., 2002. Terror as a bargaining instrument: a case study ofdowry violence in Rural India. Am. Econ. Rev. 92 (4), 1029–1043.
Bobonis, G., González-Brenes, M., Castro, R., 2013. Public transfers and domesticviolence: the roles of private information and spousal control. Am. Econ. J. Econ.Policy 5 (1), 179–205.
Caldwell, B., Bradley, R., 1984. Home Observation for Measurement of theEnvironment (HOME) - Revised Edition. University of Arkansas, Little Rock.
Card, D., Dahl, G., 2011. Family violence and football: the effect of unexpectedemotional cues on violent behavior. Q. J. Econ. 126, 103–143.
Case, A., Paxson, C., 2008. Stature and status: height, ability, and labor marketoutcomes. J. Polit. Econ. 116 (3), 499–532.
Chan, K.H., Fung, K.W.T., 2018. The effect of social fathers on the cognitive skills ofout-of-wedlock children in the U. S. Econ. Human Biol. 28, 146–159. doi:http://dx.doi.org/10.1016/j.ehb.2017.09.007.
Chen, M., Chan, K.L., 2016. Effects of parenting programs on child maltreatmentprevention: a meta-analysis. Trauma Violence Abuse 17 (1), 88–104. doi:http://dx.doi.org/10.1177/1524838014566718.
Cicchetti, D., Barnett, D., 1991. Attachment organization in maltreated preschoolers.Dev. Psychopathol. 3 (4), 397–411. doi:http://dx.doi.org/10.1017/S0954579400007598.
Coddington, C.H., Rashmita Mistry, S., Alison Bailey, L., 2014. Socioeconomic statusand receptive vocabulary development: Replication of the parental investmentmodel with Chilean preschoolers and their families. Early Childhood ResearchQuarterly 0885–2006. doi:http://dx.doi.org/10.1016/j.ecresq.2014.06.004.
Contreras, D., González, S., 2015. Determinants of early child development in Chile:health, cognitive and demographic factors. Int. J. Educ. Dev. 40, 217–230. doi:http://dx.doi.org/10.1016/j.ijedudev.2014.06.010.
Coneus, K., Laucht, M., Reuß, K., 2012. The role of parental investments for cognitiveand noncognitive skill formationßEvidence for the first 11 years of life,Economics &. Econ. Human Biol.10 (2),189–209. doi:http://dx.doi.org/10.1016/j.ehb.2011.01.003.
Cools, S., Kotsadam, A., 2017. Resources and intimate partner violence in Sub-Saharan Africa. World Dev..
Cunha, F., Heckman, J., 2007. The technology of skill formation. Am. Econ. Rev. 97 (2),31–47.
Cunha, F., Heckman, J., 2008. Formulating, identifying and estimating thetechnology of cognitive and noncognitive skill formation. J. Hum. Resour. 43 (4),738–782.
Cunha, F., Heckman, J., 2009. The economics and psychology of inequality andhuman development. J. Eur. Econ. Assoc. 7 (2–3), 320–364.
Cunha, F., Heckman, J.J., Lochner, L.J., Masterov, D.V., 2006. Interpreting the evidenceon life cycle skill formation. In: Hanushek, E.A., Welch, F. (Eds.), Handbook of theEconomics of Education, , pp. 697–812 chap. 12, North-Holland, Amsterdam.
Currie, J., Tekin, E., 2012. Understanding the cycle childhood maltreatment andfuture. J. Hum. Resour. 47 (2), 509–549. doi:http://dx.doi.org/10.3368/jhr.47.2.509.
Currie, J., Widom, C.S., 2010. Long-term consequences of child abuse and neglect onadult economic well-being. Child Maltreat. 15 (2), 111–120. doi:http://dx.doi.org/10.1177/1077559509355316.
De Bellis, M., Keshavan, M., Shifflett, H., Iyengar, S., Beers, S., Hall, J., Moritz, G., 2002.Brain structures in pediatric maltreatment-related posttraumatic stressdisorder: a sociodemographically matched study. Biol. Psychiatry 52, 1066–1078.
Delaney-Black, Virginia, Covington, Chandice, Ondersma, Steven J., et al., 2002.Violence exposure, trauma, and IQ and/or reading deficits among urbanchildren. Arch. Pediatr. Adolesc. Med. 156 (3), 280–285. doi:http://dx.doi.org/10.1001/archpedi.156.3.280 2002.
DeRiviere, L., 2008. Do economists need to rethink their approaches to modelingintimate partner violence? J. Econ. Issues 42 (3), 583–606.
Doyle, O., Harmon, C.P., Heckman, J.J., Tremblay, R.E., 2009. Investing in early humandevelopment: Timing and economic efficiency. Econ. Human Biol. 7 (1), 1–6.doi:http://dx.doi.org/10.1016/j.ehb.2009.01.002.
Euser, S., Alink, L., Stoltenborgh, M., Bakermans-Kranenburg, M.J., van IJzendoorn,M.H., 2015. A gloomy picture: a meta-analysis of randomized controlled trialsreveals disappointing effectiveness of programs aiming at preventing childmaltreatment. BMC Public Health 15 (1), 1068. doi:http://dx.doi.org/10.1186/s12889-015-2387-9.
Farmer, A., Tiefenthaler, J., 1996. Domestic violence: the value of services as signals.Am. Econ. Rev. 86 (2), 274–279 Papers and Proceedings of the Hundredth andEighth Annual Meeting of the American Economic Association San Francisco,CA.
Ferguson, Christopher J., 2013. Spanking, corporal punishment and negative long-term outcomes: a meta-analytic review of longitudinal studies. Clin. Psychol.Rev. 33 (1), 196–208.
Galasso, E., Weber, A., Fernald, L., 2017. Dynamics of child development: analysis of alongitudinal cohort in a very low income country. World Bank Econ. Rev. doi:http://dx.doi.org/10.1093/wber/lhw065.
Gallegos, F., 2013. When does inter-school competition matter? Evidence from theChilean "Voucher" system. B.E. J. Econ. Anal. Policy (Adv.) 13 (2), 525–562. doi:http://dx.doi.org/10.1515/bejeap-2012-0032.
Gershoff, Elizabeth, 2002. Corporal punishment by parents and associated childbehaviors and experiences: a meta-analytic and theoretical review. Psychol.Bull. 128 (4), 539–579. doi:http://dx.doi.org/10.1037//0033-2909.128.4.539.
Gershoff, Elizabeth T., Grogan-Kaylor, Andrew, 2016. Spanking and child outcomes:Old controversies and new meta-analyses. J. Fam. Psychol. 30 (4), 453–469. doi:http://dx.doi.org/10.1037/fam0000191.
Gertler, P., Heckman, J., Pinto, R., Zanolini, A., Vermeersch, C., Walker, S., Chang, S.,Grantham-Mcgregor, S., 2014. Labor market returns to an early childhoodstimulation intervention in Jamaica. Science 344 (6187), 998–1001. doi:http://dx.doi.org/10.1126/science.1251178.
Global Initiative, 2017. Welcome to the Global Initiative to End All CorporalPunishment (n.d.), Retrieved April 14th, 2017 from. . http://www.endcorporalpunishment.org/.
Hanushek, E., Woessmann, L., 2008. The role of cognitive skills in economicdevelopment. J. Econ. Lit. 46 (3), 607–668. doi:http://dx.doi.org/10.1257/jel.46.3.607.
Heckman, J., Stixrud, J., Urzua, S., 2006. The effects of cognitive and noncognitiveabilities on labor market outcomes and social behavior. J. Labor Econ. 24 (3),411–482. doi:http://dx.doi.org/10.1086/504455.
Hidrobo, M., Fernald, L., 2013. Cash transfers and domestic violence. J. Health Econ.32 (1), 304–319.
Hildyard, K., Wolfe, D.A., 2002. Child neglect: developmental issues and outcomes.Child Abuse Negl. 26, 679–695.
Hsu, L., 2017. The timing of welfare payments and intimate partner violence. Econ.Inq. 55 (2), 1017–1031. doi:http://dx.doi.org/10.1111/ecin.12413.
John, O., Srivastava, S., 1999. The Big Five trait taxonomy: history, measurement, andtheoretical perspectives. In: Pervin, L., John, O. (Eds.), Handbooks of Personality:Theory and Research. Guilford Press, New York, pp. 102–138.
Jones Harden, B., Denmark, N., Holmes, A., Duchene, M., 2014. Detached parentingand toddler problem behavior in early head start families. Infant Ment. Health J.35, 529–543. doi:http://dx.doi.org/10.1002/imhj.21476.
Kim, I., Byeon, J., Lee, D., 2017. Violent crime and female victimization: evidencefrom metropolitan regions in South Korea. Appl. Econ. 1 (16) .
Larzelere, Robert E., 2000. Child outcomes of nonabusive and customary physicalpunishment by parents: an updated literature review. Clin. Child Fam. Psychol.Rev. 3 (4) .
Larzelere, Robert E., Kuhn, Brett R., 2005. Comparing child outcomes of physicalpunishment and alternative disciplinary tactics: a meta-analysis. Clin. ChildFam. Psychol. Rev. 8 (1) doi:http://dx.doi.org/10.1007/s10567-005-2340-z.
Leiter, Jeffrey, Johnsen, Matthew C., 1997. Child maltreatment and schoolperformance declines: an event-history analysis. Am. Educ. Res. J. 34 (3), 563–589. doi:http://dx.doi.org/10.3102/00028312034003563.
MacKenzie, M., Nicklas, E., Brooks-Gunn, J., Waldfogel, J., 2014. Repeated exposureto high-frequency spanking and child externalizing behavior across the firstdecade: a moderating role for cumulative risk. Child Abuse Negl. 38 (12), 1895–1901.
MacMillan, H., Mikton, C., 2017. Moving research beyond the spanking debate. ChildAbuse Negl. 71 (September), 5–8. doi:http://dx.doi.org/10.1016/j.chiabu.2017.02.012.
Margolin, G., Gordis, Elana B., 2000. The effects of family and community violenceon children. Annu. Rev. Psychol. 51, 445–479.
McCarthy, A.S., 2019. Intimate partner violence and family planning decisions:experimental evidence from rural Tanzania. World Dev.114,156–174. doi:http://dx.doi.org/10.1016/j.worlddev.2018.09.027.
McElroy, M., Homey, M., 1981. Nash-bargained household decisions: toward ageneralization of the theory of demand. Int. Econ. Rev. 22 (2), 333–349.
Ministerio de Desarrollo Social, Chile, 2019. Observatorio Social URL:. http://observatorio.ministeriodesarrollosocial.gob.cl/elpi.php.
Oster, E., 2019. Unobservable selection and coefficient stability: theory andevidence. J. Bus. Econ. Stat. 37 (2), 187–204. doi:http://dx.doi.org/10.1080/07350015.2016.1227711.
Paxon, C., Schady, N., 2007. Cognitive development among young children inEcuador the roles of wealth, health, and parenting. J. Hum. Resour. 42 (1), 49–84.doi:http://dx.doi.org/10.3368/jhr.XLII.1.49.
Paxon, C., Waldfogel, J., 1999. Parental resources and child abuse and neglect. Am.Econ. Rev. 89 (2), 239–244. doi:http://dx.doi.org/10.1257/aer.89.2.239.
Paxon, C., Waldfogel, J., 2002. Work, welfare, and child maltreatment. J. Labor Econ.20 (3), 435–474.
Pieterse, D., 2015. Childhood maltreatment and educational outcomes: evidencefrom South Africa. Health Econ. 24 (7), 876–894. doi:http://dx.doi.org/10.1002/hec.3065.
Pinquart, Martin, 2017. Associations of parenting dimensions and styles withexternalizing problems of children and adolescents: an updated meta-analysis.Dev. Psychol. 53 (5), 873–932. doi:http://dx.doi.org/10.1037/dev0000295.
Pollak, R., 2004. An intergenerational model of domestic violence. J. Popul. Econ. 17,311–329. doi:http://dx.doi.org/10.1007/s00148-003-0177-7.
Romano, Elisa, Babchishin, Lyzon, Marquis, Robyn, Frechette, Sabrina, 2015.Childhood maltreatment and educational outcomes. Trauma Violence Abuse 16(4), 418–437. doi:http://dx.doi.org/10.1177/1524838014537908.
Runyan, D., Wattam, C., Ikeda, R., Hassan, F., Ramiro, L., 2002. Child abuse andneglect by parents and other caregivers. In: Krug, E.G., Dahlberg, L.L., Mercy, J.A.,Zwi, A.B., Lozano, R. (Eds.), World Report on Violence and Health. World HealthOrganization, Geneva.
Ryan, R.M., Kalil, A., Ziol-Guest, K.M., Padilla, C., 2016. Socioeconomic gaps inparents’ discipline strategies from 1988 to 2011. Pediatrics 138 (6) .
Schady, N., 2011. Parental education, vocabulary, and cognitive development inearly childhood: longitudinal evidence from Ecuador. Am. J. Public Health 101(12), 2299–2307.
Schady, N., Behrman, J., Araujo, M.C., Azuero, R., Bernal, R., Bravo, D., Lopez-Boo, F.,Macours, K., Marshall, D., Paxson, C., Vakis, R.J., 2015. Wealth gradients in earlychildhood cognitive development in five latin american countries. J. Hum.Resour. 50 (2), 446–463. doi:http://dx.doi.org/10.3368/jhr.50.2.446.
14 M. Berthelon et al. / Economics and Human Biology 36 (2020) 100831
Tauchen, H., Witte, A., 1995. The dynamics of domestic violence. Am. Econ. Rev. 85(2), 414–418 Papers and Proceedings of the Hundredth and Seventh AnnualMeeting of the American Economic Association Washington, DC.
Tauchen, H., Witte, A., Long, S., 1991. Domestic violence: a nonrandom affair. Int.Econ. Rev. 32, 491–511.
Teicher, M., Andersen, S., Polcari, A., Anderson, C., Navalta, C., Kim, D., 2003. Theneurobiological consequences of early stress and childhood maltreatment.Neurosci. Biobehav. Rev. 27, 33–44.
United Nations Children’s Fund, 2014a. Hidden in Plain Sight: a Statistical Analysisof Violence Against Children. UNICEF, New York.
United Nations Children’s Fund, 2014b. 4to Estudio de Maltrato Infantilen Chile: Analisis Comparativo 1994-2000-2006-2012. UNICEF, Santiagode Chile.
Valenzuela, J., Villarroel, G., Villalobos, C., 2013. Ley de Subvención EscolarPreferencial (SEP): algunos resultados preliminares de su implementación[Preferential School Subsidy Law (SEP): some preliminary results of itsimplementation]. Revista Pensamiento Educativo 50 (2), 113–131.
Vlahovicova, K., Melendez-Torres, G.J., Leijten, P., Knerr, W., Gardner, F., 2017.Parenting programs for the prevention of child physical abuse recurrence: asystematic review and meta-analysis. Clin. Child Fam. Psychol. Rev. 20 (3), 351–365. doi:http://dx.doi.org/10.1007/s10567-017-0232-7.
Waldinger, R.J., Toth, S.L., Gerber, A., 2001. Maltreatment and internalrepresentations of relationships: core relationship themes in the narratives ofabused and neglected preschoolers. Soc. Dev. 10 (1), 41–58.
Walker, S.P., et al., 2011. Inequality in early childhood: risk and protective factors forearly child development. Lancet 378 (9799), 1325–1338.


![María E. Martínez arXiv:2004.01070v1 [math.AP] 2 Apr 2020 ... · maria.martinez.m@uchile.cl∗ April 3, 2020 Abstract We are interested in the long time asymptotic behavoir of solutions](https://static.fdocuments.us/doc/165x107/5ede01bfad6a402d66694402/mara-e-martnez-arxiv200401070v1-mathap-2-apr-2020-mariamartinezm.jpg)


