Thomas Songer, PhD with acknowledgment to several slides provided by
Upload
duane-riceCategory
view
214download
0
Economics and Health
Thomas Songer, PhD
South Asian CardiovascularResearch Methodology Workshop
Economics and Health
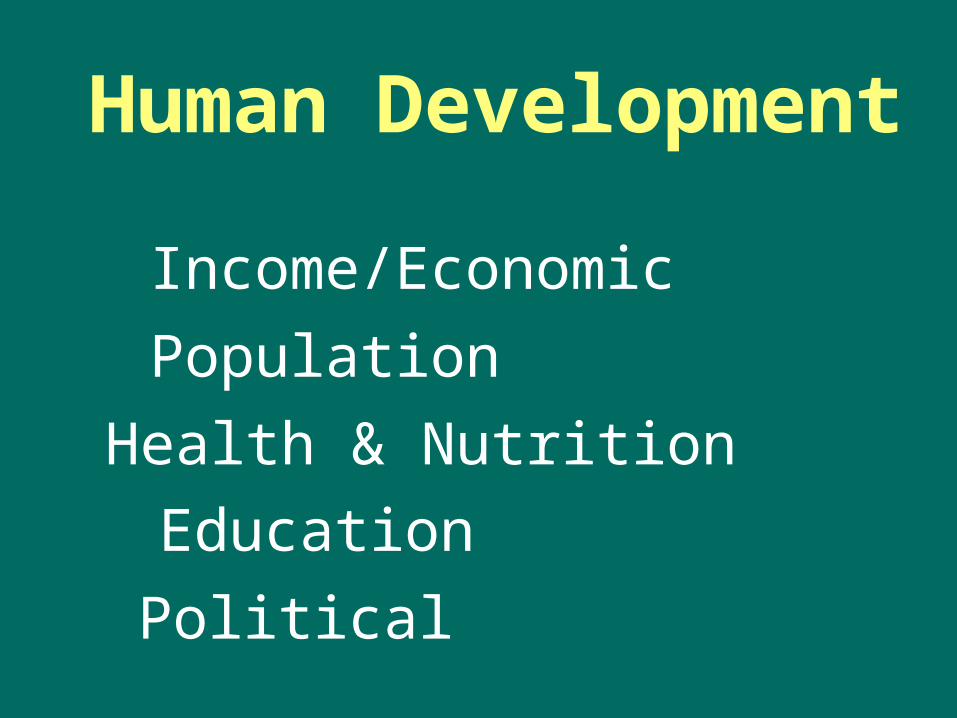
Human Development
Income/Economic
Population
Health & Nutrition
Education
Political
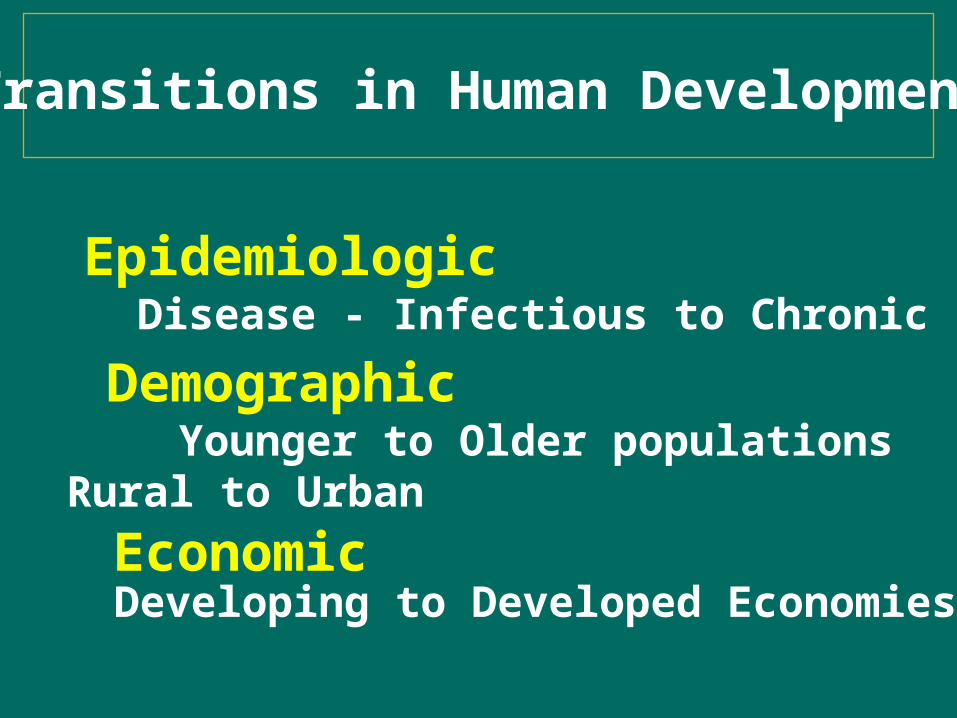
Transitions in Human Development
Epidemiologic Disease - Infectious to Chronic
Demographic Younger to Older populationsRural to Urban
Economic Developing to Developed Economies
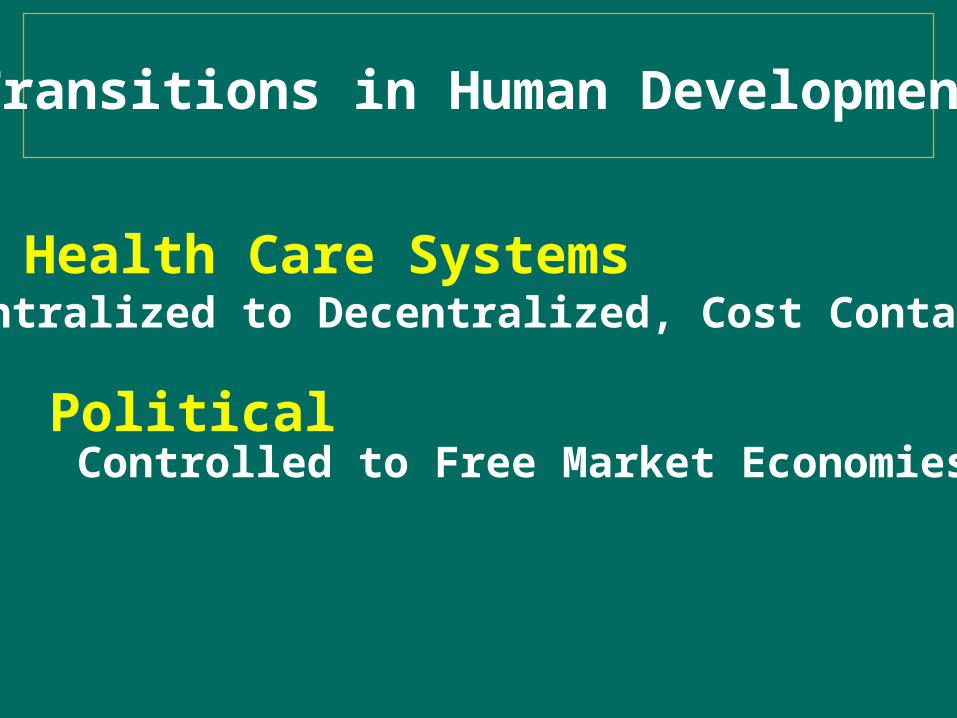
Transitions in Human Development
Political Controlled to Free Market Economies
Health Care Systems Centralized to Decentralized, Cost Containment
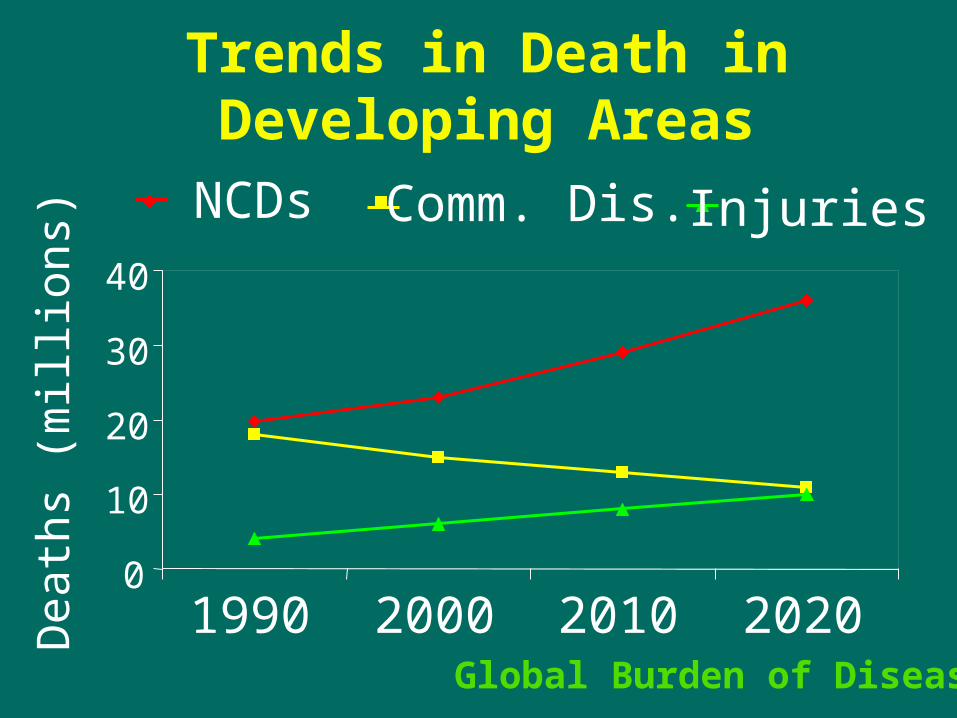
Trends in Death in Developing Areas
0
10
20
30
40
1990 2000 2010 2020
Dea
ths
(mil
lion
s)
NCDs Comm. Dis. Injuries
Global Burden of Disease

DALYs in Developing Areas
1990 2020
Infectious Disease NCDs Injury

Economic Transition

Economic Growth• Many Differing ways of defining growth• Goods and services produced
• GNP - money value of all goods and services produced
• GNP per capita; reflects the average income of a country’s citizens
• GNP per capita; outlines general standard of living

Gross National Product, per capita
1991$
Average AnnualGrowth Rate,1980-91(%)
Sub-Saharan Africa 350 - 1.2East Asia & Pacific 650 6.1
South Asia 320 3.1Europe & C.Asia 2,670 0.9Mideast/N.Africa 1,940 - 2.4Latin America 2,390 - 0.3
OECD members 21,530 2.3World 4,010 1.2

GNP per capita
Monetary value of goods and services
population

GNP per capitaImpact of Population Changes
• An increasing population makes it more difficult to increase GNP per capita
• With a stable population, increases in GNP will increase GNP per capita
How does the development level of an
economy relate to health?

Economics and Health
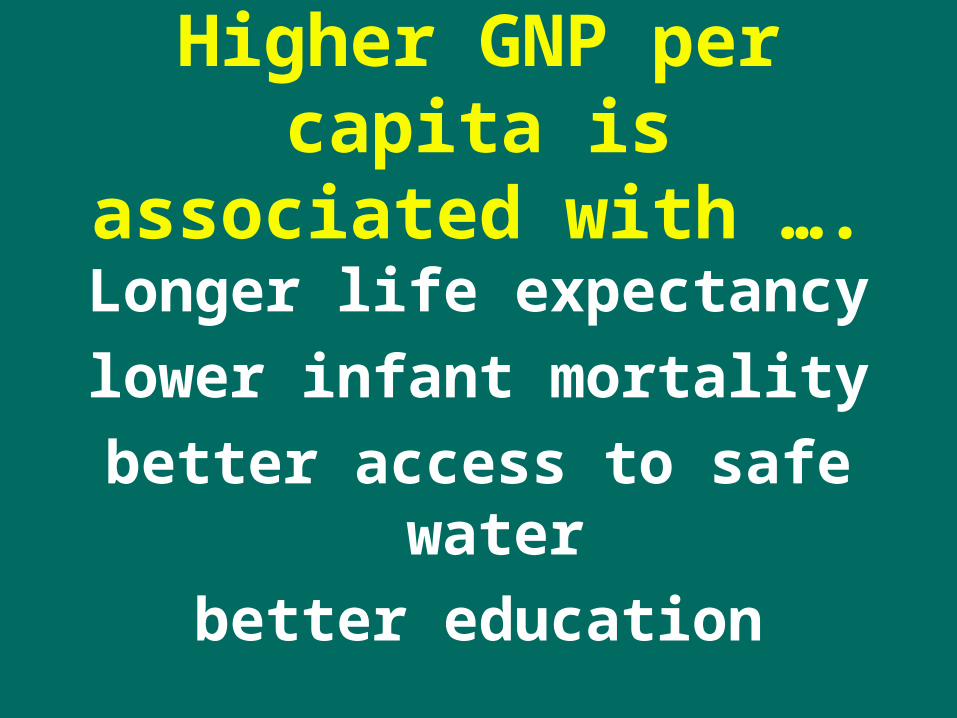
Higher GNP per capita is associated with ….
Longer life expectancy
lower infant mortality
better access to safe water
better education

Sha
re o
f G
DP
spe
nt o
n he
alth
GDP per capita (1991 dollars)
2
4
6
8
10
12
0 5000 10000 15000 20000 25000
Income and Health SpendingWorld Bank Development Report
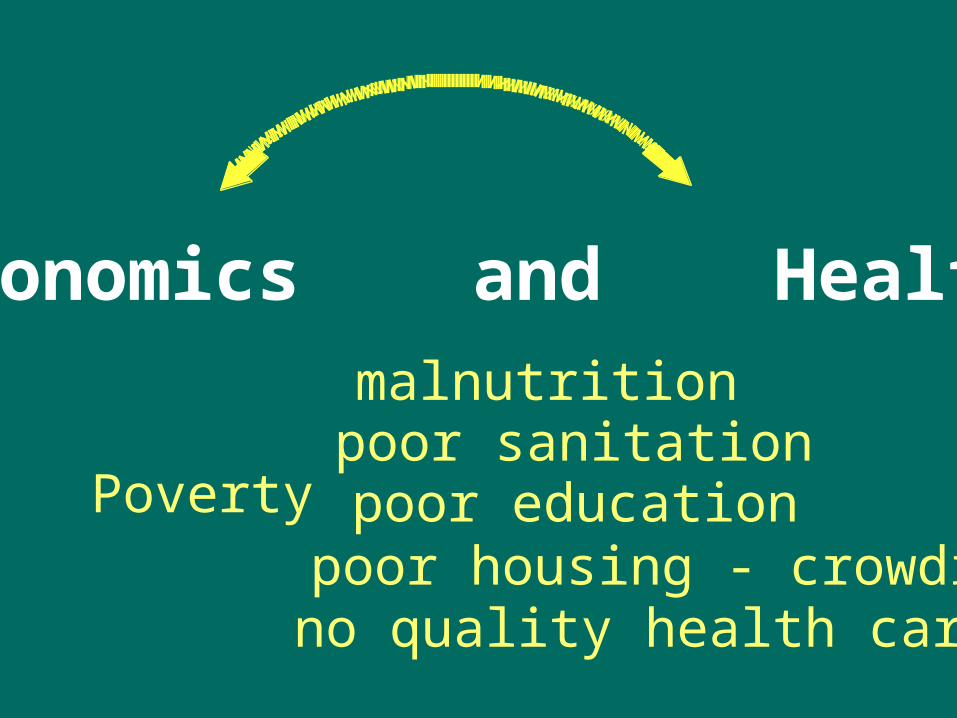
Poverty
malnutritionpoor sanitation
poor housing - crowdingno quality health care
Economics and Health
poor education
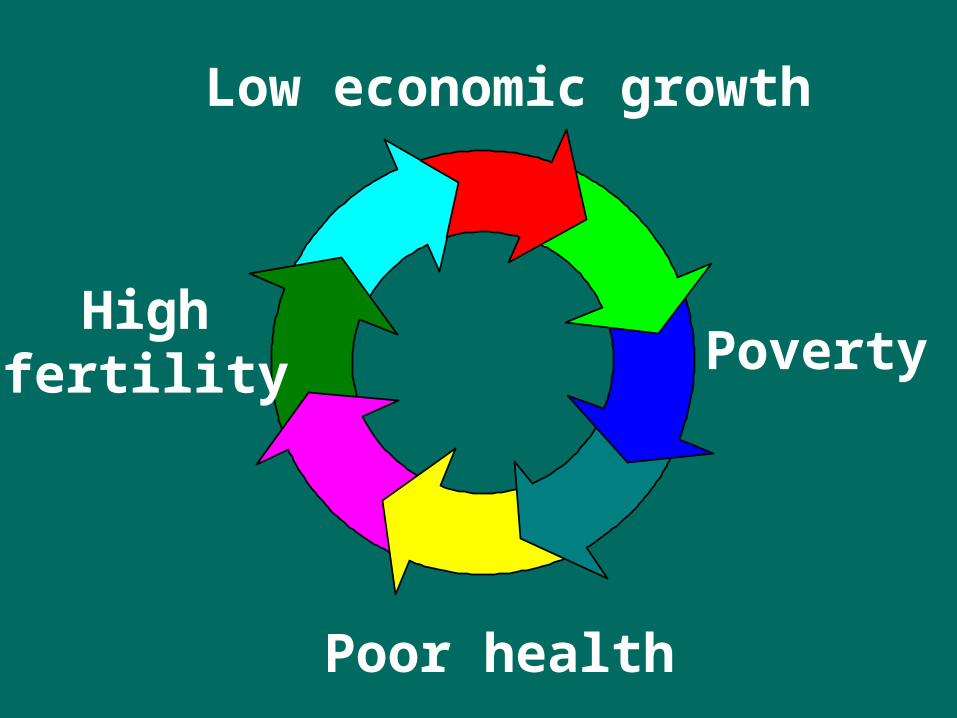
Low economic growth
Poverty
Poor health
Highfertility

UNDP Poverty Report 2000
OVERCOMING HUMAN POVERTY

Increased productivity
Risingincomes
Better health
Lowfertility

Economic growth
Economic development

Economic growthincrease in the amount of goods and
services produced
Economic developmentcombines economic growth with an
improvement in living standards

Economic growth does not always translate to economic
development

In the 1950s and 1960s, a large number of 3rd world countries
achieved UN growth targets, yet the levels of living for most
remained unchanged
GNP per capita is a narrow definition of growth and development
Todaro 1997
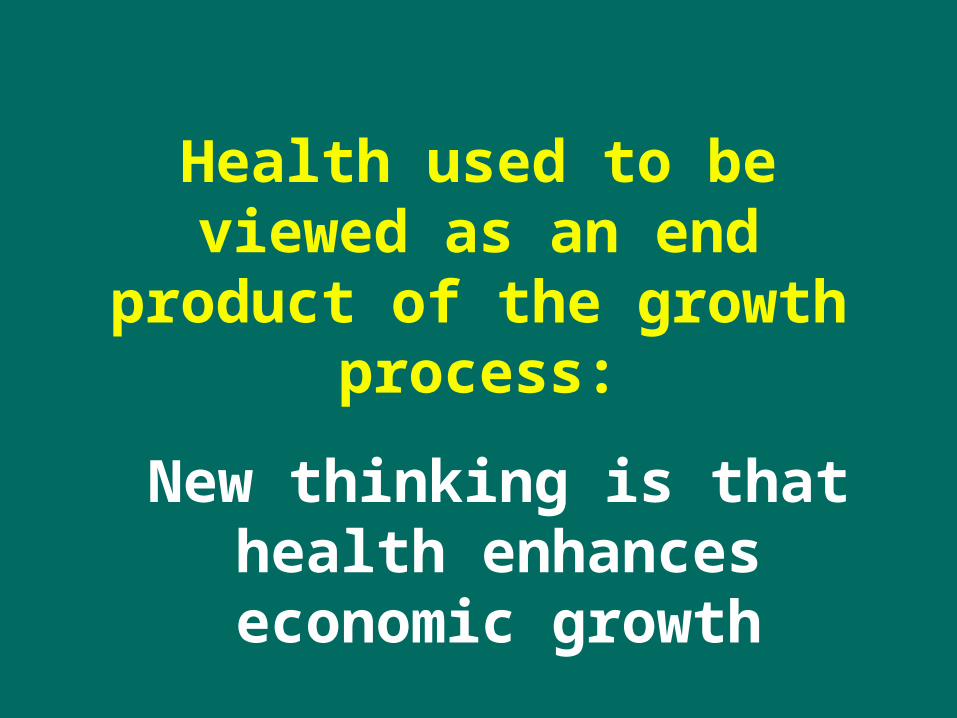
Health used to be viewed as an end product of the growth
process:
New thinking is that health enhances economic growth

Economics and Health

Economics and Health
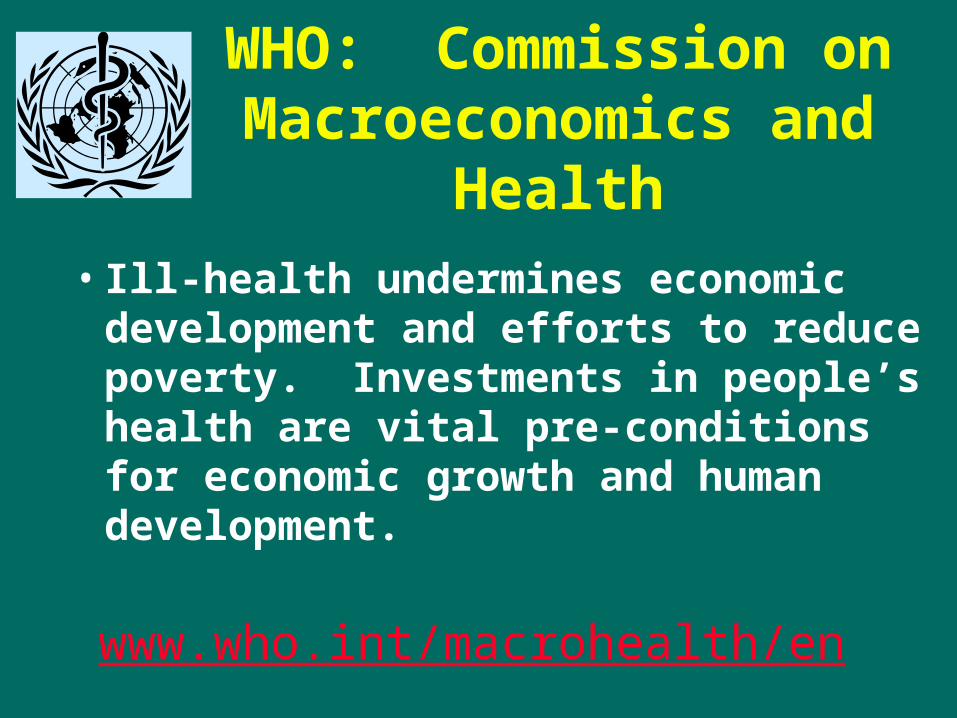
WHO: Commission on Macroeconomics and Health
• Ill-health undermines economic development and efforts to reduce poverty. Investments in people’s health are vital pre-conditions for economic growth and human development.
www.who.int/macrohealth/en
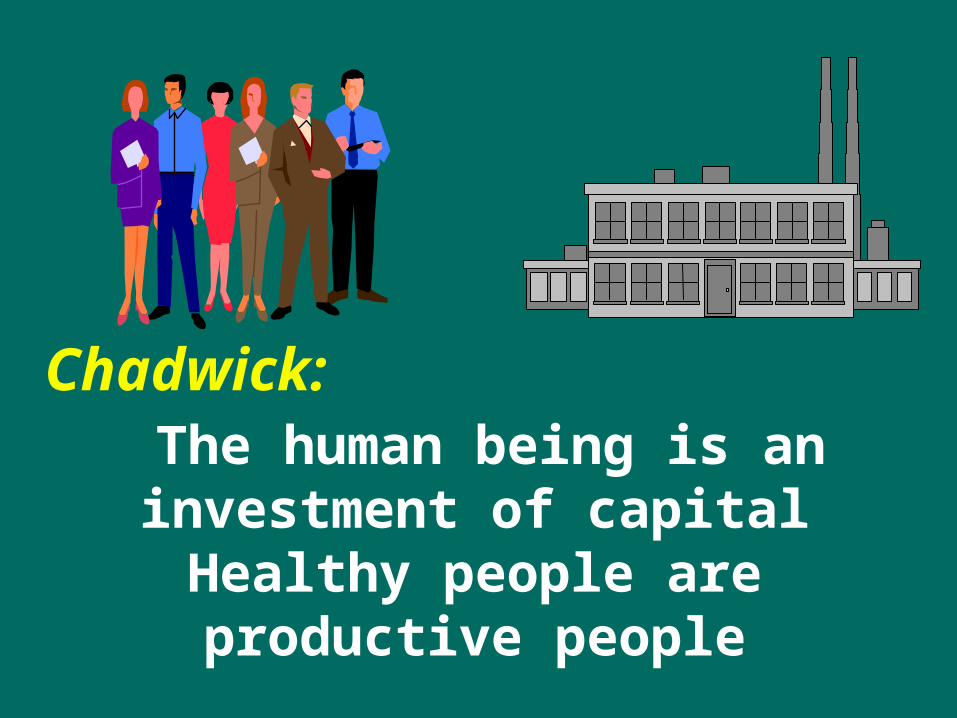
The human being is an investment of capital
Healthy people are productive people
Chadwick:

Chadwick:
The human being is
Healthy people are productive people
Better sanitation is a good investment
Prevention of disease is a good investment
an investment of capital
• established in January 2000
• Mandate: To examine the links betweeninvestment in health, economic development and poverty reduction
• CMH Structure: 6 working groups, 18Commissioners, hundreds of experts in public health, finance and economics.
The Commission on Macroeconomics and Health

Summary of key CMH findings• Ill health undermines economic development and efforts for poverty reduction
• A few health conditions account for most of the avoidable deaths in low / middle-income countries
• HIV/AIDS, TB, malaria, maternal & child health, and tobacco-related illness
• The HIV/AIDS pandemic is a “distinct and unparalleled catastrophe” not only in its human dimension but in its implications for economic development

HIV/AIDS and Economic Development
• High HIV/AIDS prevalence leads to…– decline in labor force participation
– decline in productivity
– decline in human capital
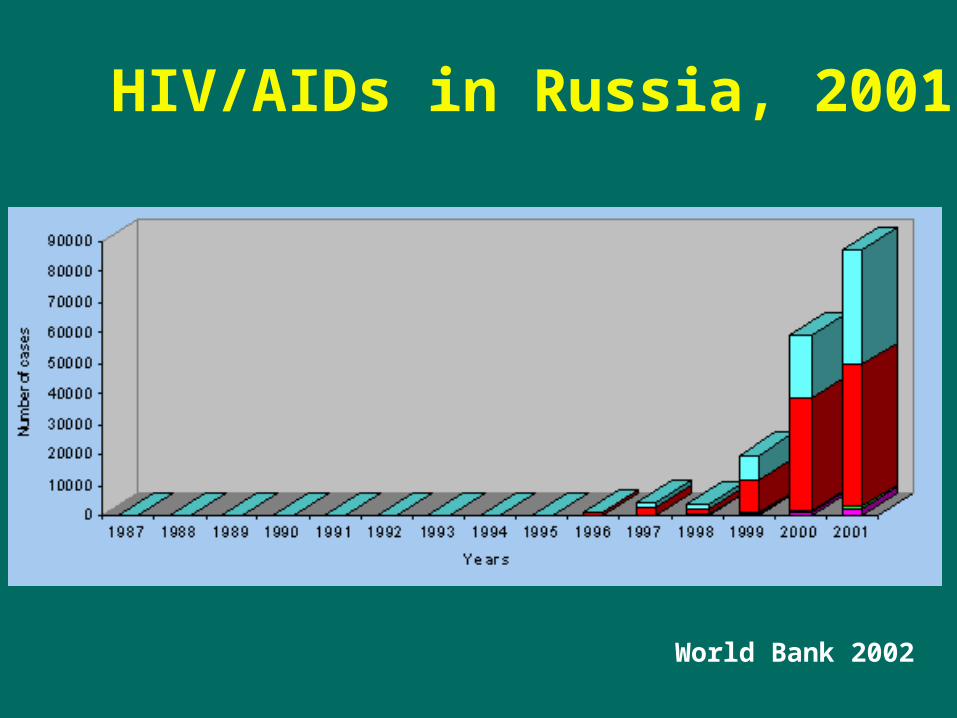
HIV/AIDs in Russia, 2001
World Bank 2002
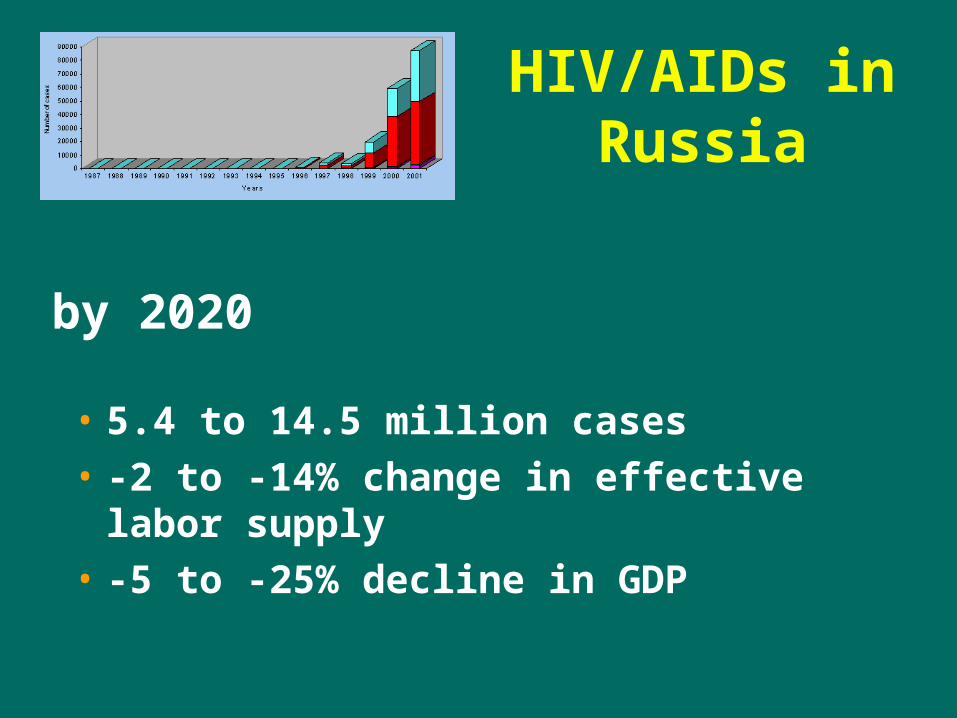
HIV/AIDs in Russia
• 5.4 to 14.5 million cases
• -2 to -14% change in effective labor supply
• -5 to -25% decline in GDP
by 2020
Health Economics
Why is there an interest inhealth economics?
Economics and health are related
Rising costs of health care
Limited resources for health care
Variations in health outcomes exist
Economic data influence governmentdecisions regarding health care

Economic Approaches in Health Care
DescriptiveCost studies
EvaluativeCost-Benefit AnalysisCost-Effectiveness Analysis
Cost-Utility Analysis
ExplanatoryDemand/Supply issuesRegulation/Taxation

Cost Effectiveness Analysis
• Primary form of economic analysis of health care interventions
• Very often included in clinical trials that are testing new interventions
• A method for evaluating the outcomes and costs of interventions designed to improve health.
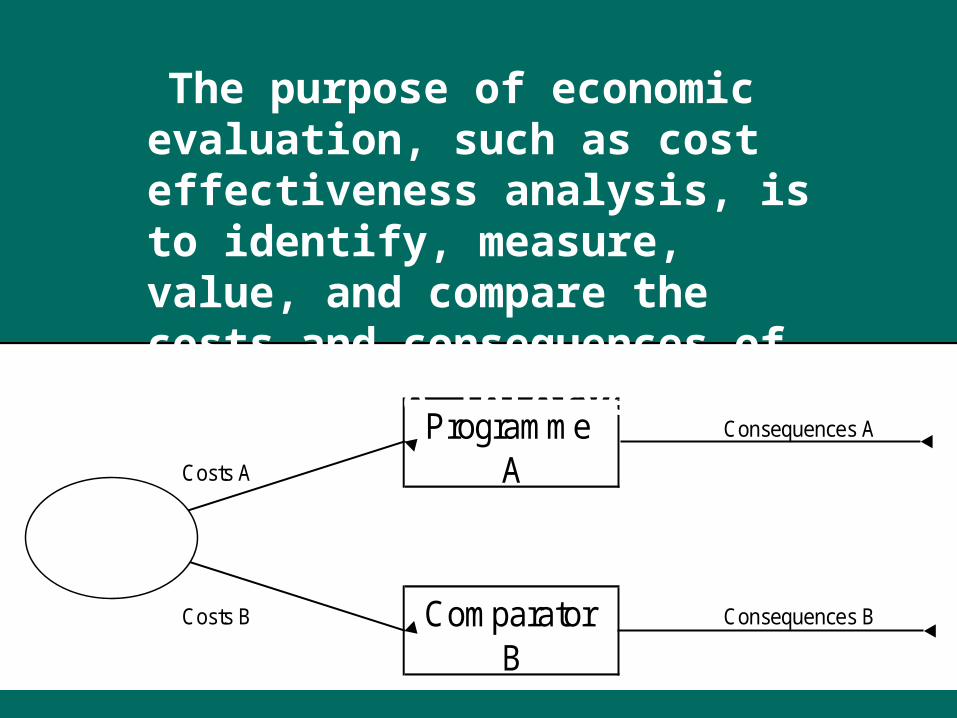
Programme Consequences A
Costs A A
Costs B Comparator Consequences B
B
Choice
The purpose of economic evaluation, such as cost effectiveness analysis, is to identify, measure, value, and compare the costs and consequences of alternative interventions.

Cost Effectiveness Calculation
Comparison of interventions examines differences in cost by the differences in
benefits gained
Cost with intervention [A] - Cost with intervention [B]Cost with intervention [A] - Cost with intervention [B]Benefit with [A] - Benefit with [B]Benefit with [A] - Benefit with [B]
Δ CostCostΔ BenefitBenefit
in other wordsin other words
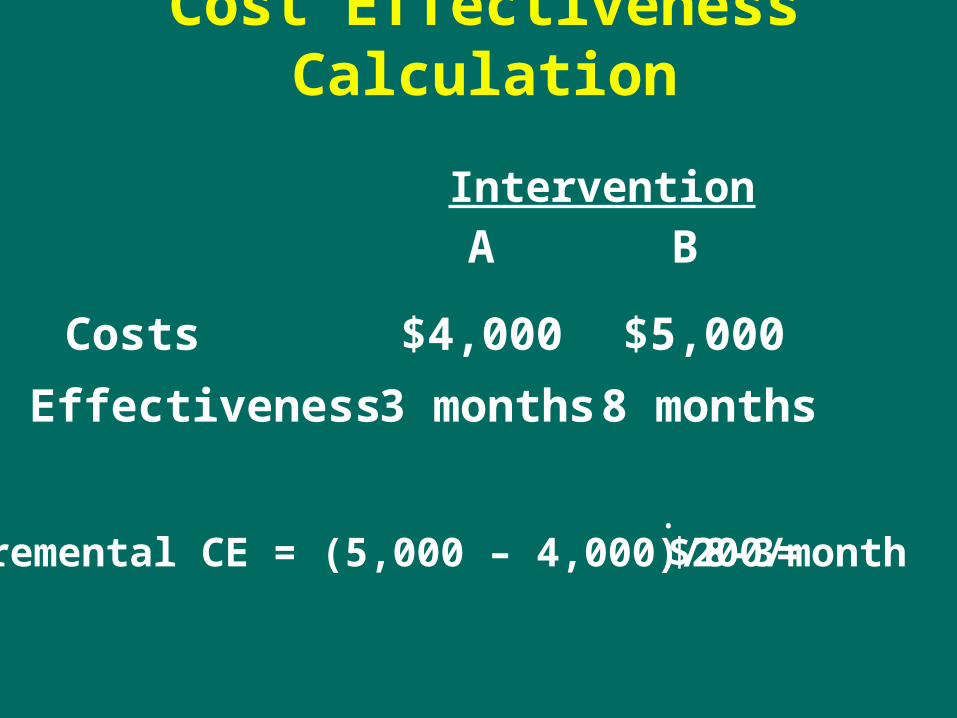
Cost Effectiveness Calculation
A B
Costs $4,000 $5,000
Effectiveness 3 months 8 months
Incremental CE = (5,000 – 4,000)/8-3= $200/month.
Intervention
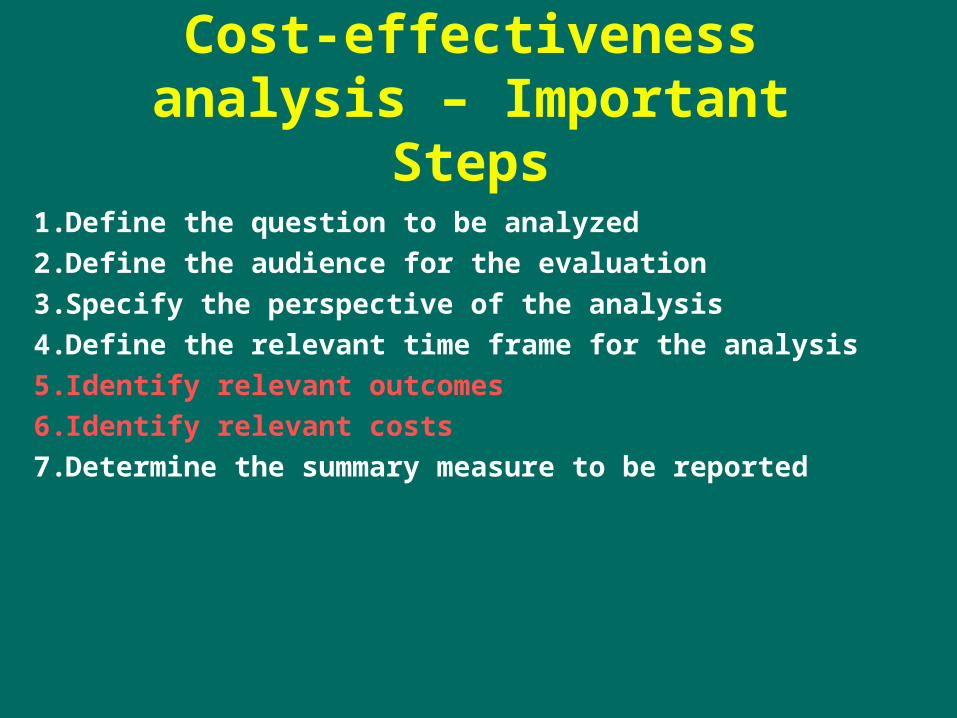
Cost-effectiveness analysis – Important Steps
1. Define the question to be analyzed
2. Define the audience for the evaluation
3. Specify the perspective of the analysis
4. Define the relevant time frame for the analysis
5. Identify relevant outcomes
6. Identify relevant costs
7. Determine the summary measure to be reported

Defining interventions or the question to be assessed
• Major increase or decrease in an existing activity
Or
• Adding a new activity to replace an existing one or adding a new activity when there is no current activity
Mulligan/Mills
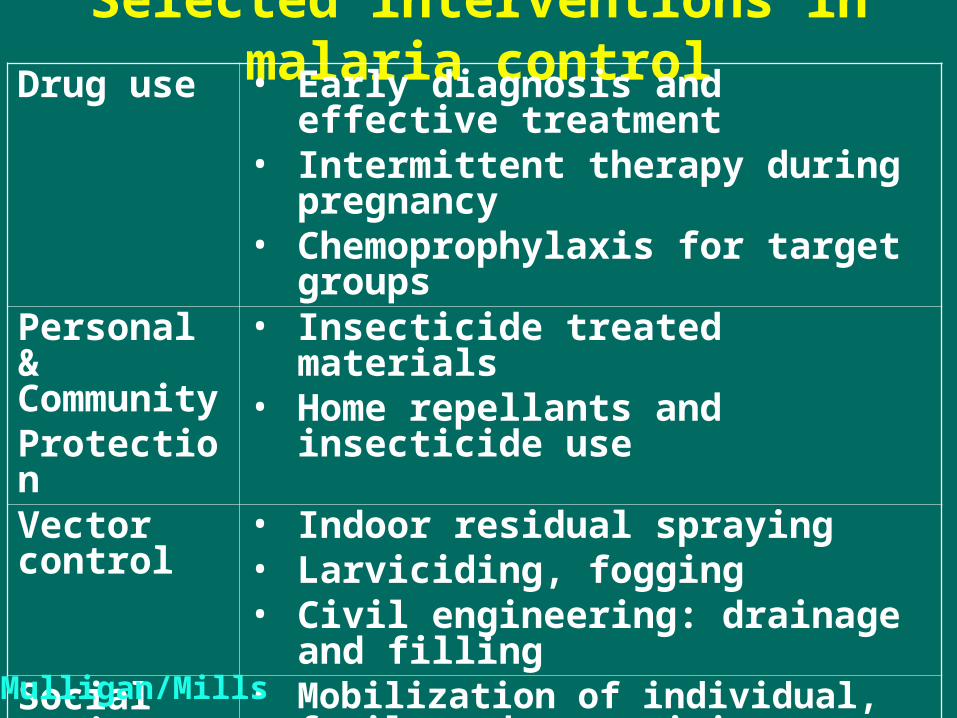
Selected interventions in malaria controlDrug use • Early diagnosis and effective treatment
• Intermittent therapy during pregnancy• Chemoprophylaxis for target groups
Personal & CommunityProtection
• Insecticide treated materials• Home repellants and insecticide use
Vector control
• Indoor residual spraying• Larviciding, fogging• Civil engineering: drainage and filling
Social Action/ Management effectiveness
• Mobilization of individual, family and communities
• Health Education• Surveillance of infection and disease• Monitoring and evaluation of programsMulligan/Mills

Defining the Audience and Perspective of the study
• Health care payers
• Health care providers
• Patients
• Government health plans
• Society
• among others
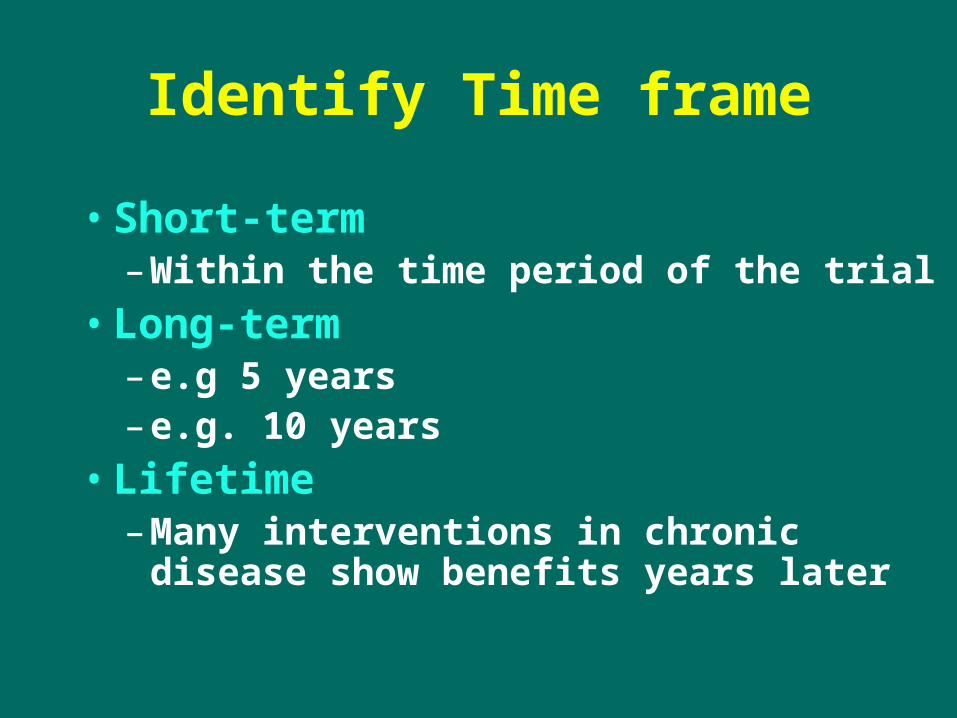
Identify Time frame
• Short-term– Within the time period of the trial
• Long-term– e.g 5 years– e.g. 10 years
• Lifetime– Many interventions in chronic disease show
benefits years later

Summary Outcome Measures• Quality-adjusted Life Years
Survival weighted by patients’ value of health-related quality of life
Patients value health states on a 0 (death) to 1 (optimal health) scale
Recommended as a gold standard
• Other Clinical Outcomes: pain, test results
• Non-Clinical Outcomes: health status, patient satisfaction

Logan et al. (1981) Hypertension mmHg Hypertension 3:2:211-18 treatment blood pressure
reduction
Hull et al. (1981) Diagnosis of deep cases of DTV NEJM 304:1561-67 vein thrombosis detected
Sculpher and Buxton (1993) Asthma episode-free PharmacoEconomics 4:5:345-52 days
Mark et al. (1995) Thrombolysis years of life NEJM 332:21:1418-24 gained
Examples of outcome measuresExamples of outcome measures

Cost-Effectiveness Analysis in the TODAY (Treatment Options for Diabetes in
Adolescents and Youth) Study
• Results expressed as– Cost per change in HbA1c– Cost per unit of treatment failure
• e.g. cost per day of treatment failure avoided– Cost per unit of clinical improvement
• e.g. change in weight, BMI, obesity– Cost per quality-adjusted life year (QALY)