Economic Survey
294
CHAPTER 1 GROWTH OF GDP AND OTHER MACRO AGGREGATES 1.2 Following the slowdown induced by the global financial crisis in 2008-09, the Indian economy responded strongly to fiscal and monetary stimulus and achieved a growth rate of 8.6 per cent and 9.3 per cent respectively in 2009-10 and 2010-11 (Table 1.1). However, with the economy exhibiting inflationary tendencies, the Reserve Bank of India (RBI) started raising policy rates in March 2010. High rates as well as policy constraints adversely impacted investment, and in the subsequent two years viz. 2011-12 and 2012-13, the growth rate slowed to 6.2 per cent and 5.0 per cent respectively. Nevertheless, despite this slowdown, the compound annual growth rate (CAGR) for gross domestic product (GDP) at factor cost, over the decade ending 2012-13 is 7.9 per cent. 1.3 The moderation in growth is primarily attributable to weakness in industry (comprising the mining and quarrying, manufacturing, electricity, gas and water supply, and construction sectors), While India's recent slowdown is partly rooted in external causes, domestic causes are also important. The strong post-financial-crisis stimulus led to stronger growth in 2009-10 and 2010-11. However, the boost to consumption, coupled with supply- side constraints, led to higher inflation. Monetary policy was tightened, even as external headwinds to growth increased. The consequent slowdown, especially in 2012-13, has been across the board, with no sector of the economy unaffected. Falling savings without a commensurate fall in aggregate investment have led to a widening current account deficit (CAD). Wholesale price index (WPI) inflation has been coming down in recent months. However, food inflation, after a brief slowdown, continues to be higher than overall inflation. Given the higher weightage to food in consumer price indices (CPI), CPI inflation has remained close to double digits. Another consequence of the slowdown has been lower-than-targeted tax and non-tax revenues. With the subsidies bill, particularly that of petroleum products, increasing, the danger that fiscal targets would be breached substantially became very real in the current year. The situation warranted urgent steps to reduce government spending so as to contain inflation. Also required were steps to facilitate corporate and infrastructure investment so as to ease supply. Several measures announced in recent months are aimed at restoring the fiscal health of the government and shrinking the CAD as also improving the growth rate. With the global economy also likely to recover somewhat in 2013, these measures should help in improving the Indian economy's outlook for 2013-14. State of the Economy and Prospects http://indiabudget.nic.in
-
Upload
amitabh-meena -
Category
Documents
-
view
149 -
download
7
description
ECONOMIC SURVEY 12-13
Transcript of Economic Survey

CHAPTER
1
GROWTH OF GDP AND OTHERMACRO AGGREGATES
1.2 Following the slowdown induced by the globalfinancial crisis in 2008-09, the Indian economyresponded strongly to fiscal and monetary stimulusand achieved a growth rate of 8.6 per cent and 9.3per cent respectively in 2009-10 and 2010-11(Table 1.1). However, with the economy exhibitinginflationary tendencies, the Reserve Bank of India(RBI) started raising policy rates in March 2010.High rates as well as policy constraints adversely
impacted investment, and in the subsequent twoyears viz. 2011-12 and 2012-13, the growth rateslowed to 6.2 per cent and 5.0 per cent respectively.Nevertheless, despite this slowdown, the compoundannual growth rate (CAGR) for gross domesticproduct (GDP) at factor cost, over the decade ending2012-13 is 7.9 per cent.
1.3 The moderation in growth is primarilyattributable to weakness in industry (comprisingthe mining and quarrying, manufacturing, electricity,gas and water supply, and construction sectors),
While India's recent slowdown is partly rooted in external causes, domestic causes
are also important. The strong post-financial-crisis stimulus led to stronger growth
in 2009-10 and 2010-11. However, the boost to consumption, coupled with supply-
side constraints, led to higher inflation. Monetary policy was tightened, even as
external headwinds to growth increased. The consequent slowdown, especially in
2012-13, has been across the board, with no sector of the economy unaffected. Falling
savings without a commensurate fall in aggregate investment have led to a widening
current account deficit (CAD). Wholesale price index (WPI) inflation has been coming
down in recent months. However, food inflation, after a brief slowdown, continues
to be higher than overall inflation. Given the higher weightage to food in consumer
price indices (CPI), CPI inflation has remained close to double digits. Another
consequence of the slowdown has been lower-than-targeted tax and non-tax revenues.
With the subsidies bill, particularly that of petroleum products, increasing, the danger
that fiscal targets would be breached substantially became very real in the current
year. The situation warranted urgent steps to reduce government spending so as to
contain inflation. Also required were steps to facilitate corporate and infrastructure
investment so as to ease supply. Several measures announced in recent months are
aimed at restoring the fiscal health of the government and shrinking the CAD as
also improving the growth rate. With the global economy also likely to recover
somewhat in 2013, these measures should help in improving the Indian economy's
outlook for 2013-14.
State of the Economyand Prospects
http://indiabudget.nic.in

2 Economic Survey 2012-13
0.1 KEY INDICATORS
Data categories and components Units 2007-08 2008-09 2009-10 2010-11 2011-12 2012-13
1. GDP and Related Indicators
GDP (current market prices) ` Crore 4987090 5630063 6477827 77953132R 89749471R 100,28,118AE
Growth Rate % 16.1 12.9 15.1 20.3 15.1 11.7
GDP (factor cost 2004-05 prices) ` Crore 3896636 4158676 4516071 49370062R 52435821R 5503476AE
Growth Rate % 9.3 6.7 8.6 9.3 6.2 5.0
Savings Rate % of GDP 36.8 32.0 33.7 34.0 30.8 na
Capital Formation (rate) % of GDP 38.1 34.3 36.5 36.8 35.0 naPer Capita Net National Income(factor cost at current prices) ` 35825 40775 46249 54151 61564 68747
2. Production
Food grains Million tonnes 230.8 234.5 218.1 244.5 259.3 250.1a
Index of Industrial Production b
(growth) % 15.5 2.5 5.3 8.2 2.9 0.7c
Electricity Generation(growth) % 6.3 2.7 6.6 5.5 8.1 4.6c
3. Prices
Inflation (WPI) (average) %change 4.7 8.1 3.8 9.6 8.9 7.6d
Inflation CPI (IW) (average) %change 6.2 9.1 12.4 10.4 8.4 10.0d
4. External Sector
Export Growth ( US$) %change 29.0 13.6 -3.5 40.5 21.3 -4.9d
Import Growth (US$) %change 35.5 20.7 -5.0 28.2 32.3 -0.0d
Current Account Balance (CAB)/GDP % -1.3 -2.3 -2.8 -2.8 -4.2 -4.6e
Foreign Exchange Reserves US$ Bn. 309.7 252.0 279.1 304.8 294.4 295.5f
Average Exchange Rate ` /US$ 40.26 45.99 47.44 45.56 47.92 54.47g
5. Money and Credit
Broad Money (M3) (annual) %change 21.4 19.3 16.8 16.0 15.6 11.2h
Scheduled Commercial Bank Credit(growth) %change 22.3 17.5 16.9 21.5 15.9 15.1h
6. Fiscal Indicators (Centre)
Gross Fiscal Deficit % of GDP 2.5 6.0 6.5 4.8 5.7i 5.1j
Revenue Deficit % of GDP 1.1 4.5 5.2 3.2 4.3i 3.5j
Primary Deficit % of GDP -0.9 2.6 3.2 1.8 2.6i 1.9j
7. Population Million 1138 1154 1170 1210k na na
na: not available.
1R: 1st Revised Estimates, 2R: 2nd Revised Estimates, AE: Advance Estimates.a Second advance estimates.b The Index of Industrial Production has been revised since 2005-06 on base (2004-05=100).c April-December 2012.d 2012-13 (April-January).e CAB to GDP ratio for 2012-13 is for the period April-September 2012.f At end January, 2013.g Average exchange rate for 2012-13 (April 2012- January 2013).h Provisional (up to December 28, 2012).i Fiscal indicators for 2011-12 are based on the provisional actuals (unaudited).j Budget estimates.k Census 2011.
http://indiabudget.nic.in

3State of the Economy and Prospects
Table 1.1 : Growth in GDP at Factor Cost at 2004-5 prices (per cent)2005-06 2006-07 2007-08 2008-09 2009-103R 2010-112R 2011-121R 2012-13AE
Agriculture, forestry & fishing 5.1 4.2 5.8 0.1 0.8 7.9 3.6 1.8Mining & quarrying 1.3 7.5 3.7 2.1 5.9 4.9 -0.6 0.4Manufacturing 10.1 14.3 10.3 4.3 11.3 9.7 2.7 1.9Electricity, gas, & water supply 7.1 9.3 8.3 4.6 6.2 5.2 6.5 4.9Construction 12.8 10.3 10.8 5.3 6.7 10.2 5.6 5.9Trade, hotels, & restaurants, transport &communication 12.0 11.6 10.9 7.5 10.4 12.3 7.0 5.2Financing, insurance, real estate &business services 12.6 14.0 12.0 12.0 9.7 10.1 11.7 8.6Community, social & personal services 7.1 2.8 6.9 12.5 11.7 4.3 6.0 6.8
GDP at factor cost 9.5 9.6 9.3 6.7 8.6 9.3 6.2 5.0
Source : Central Statistics Office (CSO).Notes: 1R : First Revised Estimate, 2R: Second Revised Estimate, 3R: Third Revised Estimate, AE : AdvanceEstimate.
which registered a growth rate of only 3.5 per centand 3.1 per cent in 2011-12 and 2012-13 respectively.The rate of growth of the manufacturing sector waseven lower at 2.7 per cent and 1.9 per cent for thesetwo years respectively. Growth in agriculture has alsobeen weak in 2012-13, following lower-than-normalrainfall, especially in the initial phases (months ofJune and July) of the south-west monsoon.
1.4 After achieving double-digit growth continuouslyfor five years and narrowly missing double digits inthe sixth (between 2005-06 and 2010-11), the growthrate of the services sector also declined to 8.2 percent in 2011-12 and 6.6 per cent in 2012-13. In 2011-12 the sector that particularly slowed within theservices sector was Trade, Hotels, and Restaurants,Transport and Communications, and its growth furtherdeclined in 2012-13. Activities in this sector, beingforms of derived demand, tend to grow at a slowerrate with the slowdown of economic activity in theindustry and agriculture sectors.
1.5 Why has the economy slowed down so rapidlydespite recovering strongly from the global financialcrisis? A number of factors are responsible. First,the boost to demand given by monetary and fiscalstimulus following the crisis was large. Finalconsumption grew at an average of over 8 per centannually between 2009-10 and 2011-12. The resultwas strong inflation and a powerful monetaryresponse that also slowed consumption demand.Second, starting in 2011-12, corporate andinfrastructure investment started slowing both as aresult of investment bottlenecks as well as the tightermonetary policy. Thirdly, even as the economyslowed, it was hit by two additional shocks: a slowing
global economy, weighed down by the crisis in theEuro area and uncertainties about fiscal policy inthe United States, and a weak monsoon, at least inits initial phase.
1.6 As growth slowed and government revenuesdid not keep pace with spending, the fiscal deficitthreatened to breach the target. With governmentsavings falling, and private savings also shrinking,the CAD--which is the investment that cannot befinanced by domestic savings and has to be financedfrom abroad--also widened. In the rest of this chapter,the statistical underpinnings of the macroeconomyare analysed followed by the rationale behind thegovernment's policy for macroeconomic stabilizationand restoring growth, in addition to themacroeconomic outlook and possible risks to theoutlook.
1.7 The Economic Survey does not just analysethe economy; it is also a detailed record of majordevelopments in the economy. So themacroeconomic analysis will be followed by asummary tour of the other chapters in the Survey.
ASPECTS OF GROWTH
1.8 In the last decade, growth has increasinglycome from the services sector, whose contributionto overall growth of the economy has been 65 percent, while that of the industry and agriculture sectorshas been 27 per cent and 8 per cent respectively.Figure 1.1 shows the contributions of these sectorsto the overall growth of the economy from 2003-04to 2012-13.
http://indiabudget.nic.in

4 Economic Survey 2012-13
1.9 Figure 1.1 suggests that for achieving an annualgrowth rate of 9 per cent or higher, all the three majorsectors of the economy have to perform well. Growthin agriculture, while small in overall contribution, doesdistinguish years of strong overall growth from yearsof more moderate growth. The two larger sectorsare, of course, important to overall growth. In thehigh growth years of 2005-06 to 2007-08 as well asin 2009-10 and 2010-11, the rate of growth of boththe industry and services sectors was over 9 percent. Within the industry sector, the manufacturingsector in particular, outperformed most other sectorsof the economy in these years. Its growth averaged11.6 per cent between 2005-06 and 2007-08 and 10.5per cent for the years 2009-10 and 2010-11. It isclear from the foregoing analysis that for growth tobe strong, the contribution from the industry sector,and in particular from the manufacturing sector, hasto increase in the years to come. This is also
important from the point of view of absorbing surpluslabour from the agriculture sector (see Chapter 2).1.10 The general pattern over recent years has beenthat, in years of sharply higher growth, GDP growthat market prices exceeds GDP at factor cost and thereverse is true in years of slow growth (Figure 1.2).
1.11 GDP at factor cost is GDP at market pricesless indirect taxes plus subsidies. Part of the reasonfor the differences in growth at factor costs and atmarket prices lies in the fact that the growth of indirecttaxes tends to fall in a slowdown while theexpenditure on subsidies often increases. Thisreduces the growth of net indirect taxes, which isthe difference between the two items, in a slowdown.For example, the net indirect taxes to GDP ratiodeclined from an average of 8.1 per cent between2003-04 and 2007-08 to an average of 5.7 per centin 2008-09 and 2009-10, which is why GDP growth
Note : Data for 2012-13 is as per Advance Estimates released by CSO.
http://indiabudget.nic.in

5State of the Economy and Prospects
Table 1.2 : Growth in GDP at Constant Market Prices (per cent)
2005-06 2006-07 2007-08 2008-09 2009-10 2010-112R 2011-121R 2012-13AE
1. Total final consumptionexpenditure 8.7 7.7 9.4 7.7 8.4 8.1 8.1 4.1
1.1 Private final consumptionexpenditure 8.6 8.5 9.4 7.2 7.4 8.6 8.0 4.1
1.2 Government final consumptionexpenditure 8.9 3.8 9.6 10.4 13.9 5.9 8.6 4.1
2. Gross capital formation 16.2 13.4 18.1 -5.2 17.3 15.2 0.5 3.9 2.1 Gross fixed capital formation 16.2 13.8 16.2 3.5 7.7 14.0 4.4 2.5 2.2 Changes in stocks 26.7 31.6 31.3 -51.4 67.7 29.7 -30.6 47.6 2.3 Valuables -1.6 13.7 2.9 26.9 57.6 32.4 6.6 -18.1
3. Exports 26.1 20.4 5.9 14.6 -4.7 19.7 15.3 5.1
4. Less imports 32.6 21.5 10.2 22.7 -2.1 15.8 21.5 5.7
Growth in GDP at 2004-05 marketprices 9.3 9.3 9.8 3.9 8.5 10.5 6.3 3.3
Source : CSO.Notes: 1R: First Revised Estimate, 2R: Second Revised Estimate, AE: Advance Estimate. Totals may not tallydue to adjustment for errors and omissions.
Table 1.3 : Quarterly Estimate of GDP Growth (year-on-year in per cent) 2010-11 2011-12 2012-13
Sector Q1 Q2 Q3 Q4 Q1 Q2 Q3 Q4 Q1 Q2
1. Agriculture, forestry & fishing 3.1 4.9 11.0 7.5 3.7 3.1 2.8 1.7 2.9 1.2Industry 8.3 5.7 7.6 7.0 5.6 3.7 2.5 1.9 3.6 2.8
2. Mining & quarrying 6.9 7.3 6.1 0.6 -0.2 -5.4 -2.8 4.3 0.1 1.93. Manufacturing 9.1 6.1 7.8 7.3 7.3 2.9 0.6 -0.3 0.2 0.84. Electricity, gas & water supply 2.9 0.3 3.8 5.1 8.0 9.8 9.0 4.9 6.3 3.45. Construction 8.4 6.0 8.7 8.9 3.5 6.3 6.6 4.8 10.9 6.7
Services 10.0 9.1 7.7 10.6 10.2 8.8 8.9 7.9 6.9 7.26. Trade, hotels, transport &
communication 12.6 10.6 9.7 11.6 13.8 9.5 10.0 7.0 4.0 5.57. Financing, insurance, real estate,
business services 10.0 10.4 11.2 10.0 9.4 9.9 9.1 10.0 10.8 9.48. Community, social, & personal services 4.4 4.5 -0.8 9.5 3.2 6.1 6.4 7.1 7.9 7.5
9. GDP at factor cost (total 1 to 8) 8.5 7.6 8.2 9.2 8.0 6.7 6.1 5.3 5.5 5.3
Source : CSO.
at factor cost was higher in 2008-09 than GDP growthat market prices.
1.12 As per the Advance Estimates released bythe CSO, the rate of growth in terms of GDP at marketprices (at 2004-05 prices) is expected to be 3.3 percent for 2012-13 as against 6.3 per cent in 2011-12(Table 1.2). The growth rate declined significantly onaccount of the reduction in investment rate and lowergrowth of exports vis-à-vis that of imports. The rateof growth of consumption expenditure and particularlythat of private final consumption expenditure has
generally been more stable than investment, exceptin 2012-13.
QUARTERLY ESTIMATES OF GROWTHOF GDP1.13 Table 1.3 gives the quarterly growth rates ofGDP at factor cost (at constant 2004-05 prices) inmajor sectors of the economy for 2010-11, 2011-12,and the first two quarters of 2012-13. The slowdownwas broad-based in 2011-12 and has become moreso in the first half of 2012-13.
http://indiabudget.nic.in

6 Economic Survey 2012-13
1.14 Quarterly GDP growth rate in India declinedin each of the successive quarters between the fourthquarter of 2010-11 and the fourth quarter of 2011-12.Growth in H1 of the current year works out to 5.4 percent, while the CSO's Advance Estimate for growthfor 2012-13 is 5.0 per cent. Let us now analyse someof the key elements of aggregate demand to seewhy the economy has slowed.
PRIVATE FINAL CONSUMPTIONEXPENDITURE
1.15 Private final consumption expenditureaccounts for about three-fifths of GDP at marketprices. An increase in people's disposable incometends to reduce the share of food in total consumption(the National Sample Survey Organization's [NSSO]Survey on Consumption Expenditure provides clearevidence of the downward trend in share of food intotal consumption). Expectedly, therefore, the growthrate of expenditure on the food, beverages, andtobacco group is lower than that of total private finalconsumption expenditure, resulting in a reduction inits share from 40 per cent in 2004-05 to 31.2 percent in 2011-12 (Table 1.4).
1.16 In the current year, private final consumptionexpenditure has slowed considerably, from 8 per centin 2011-12 to 4.1 per cent in 2012-13 (Table 1.2).The rate of growth of production of a large number ofconsumer durables declined significantly, e.g. privatevehicles from 23.2 per cent in April-November 2011to - 5.6 per cent in April-November 2012. Similarly,the growth rate of production of consumer durablesfor mass consumption declined from 12.2 per centin April-November 2011 to 3.3 per cent in April-November 2012.
1.17 Part of the reason for the general slowdownin consumption could be that higher inflation tendsto reduce real disposable incomes of households.Growth of durable goods consumption (under theassumption that growth of consumption for theseitems would not be significantly different from thegrowth in production) may have slowed even furtherrecently, because high interest rates and resultinghigh monthly instalments restrained purchases. Atthe same time, the seasonally adjusted consumernon-durable index of industrial production (IIP),which is typically a smoother series than durablegoods production, has been picking up since August2012.
Table 1.4 : Private Final Consumption Expenditure : Annual Growth and Shares at 2004-05 prices
2004-05 2006-07 2007-08 2008-09 2009-10 2010-111R 2011-122R
Annual growth (per cent)Food, beverages, & tobacco 3.4 6.4 3.3 0.4 5.9 5.8Clothing & footwear 23.3 5.0 5.0 14.9 20.2 -3.9Gross Rent, fuel, & power 3.8 4.7 3.6 6.0 4.2 6.2Furniture, furnishings, etc. 17.1 16.1 12.2 9.0 16.6 6.2Medical care & health services 8.7 4.5 6.9 8.9 7.6 6.2Transport & communication 9.1 7.9 7.7 12.1 10.0 9.8Recreation, education, & cultural services 8.4 9.8 6.8 4.0 11.8 8.1Miscellaneous goods & services 21.1 28.6 20.2 15.7 7.9 19.1Total private consumption expenditure 8.7 9.2 7.1 7.5 8.7 7.9
Share in total (per cent)Food, beverages, & tobacco 40.0 37.3 36.3 35.0 32.7 31.8 31.2Clothing & footwear 6.6 8.3 8.0 7.8 8.4 9.3 8.2Gross Rent, fuel, & power 13.8 12.6 12.1 11.7 11.5 11.1 10.9Furniture, furnishings, etc. 3.4 3.9 4.1 4.3 4.4 4.7 4.6Medical care & health services 5.0 5.0 4.8 4.8 4.8 4.8 4.7Transport & communication 19.3 18.9 18.7 18.8 19.6 19.8 20.2Recreation, education, & cultural services 3.0 3.0 3.0 3.0 2.9 3.0 3.0Miscellaneous goods & services 8.9 11.0 13.0 14.6 15.7 15.6 17.2Total private consumption expenditure 100.0 100.0 100.0 100.0 100.0 100.0 100.0Source: CSO. Notes: 1R: First Revised Estimate, 2R: Second Revised Estimate.
http://indiabudget.nic.in

7State of the Economy and Prospects
Table 1.5 : Ratio of Investment to GDP (at current market prices per cent)
2004-05 2006-07 2007-08 2008-09 2009-10 2010-112R 2011-121R
1. Gross capital formation 32.8 35.7 38.1 34.3 36.5 36.8 35.0(investment)
Public sector 7.4 8.3 8.9 9.4 9.2 8.4 7.9
Private sector 23.8 26.4 28.1 24.8 25.4 26.5 24.9
Corporate sector 10.3 14.5 17.3 11.3 12.1 13.4 10.6
Household sector 13.4 11.9 10.8 13.5 13.2 13.1 14.3
2. Gross fixed capital formation 28.7 31.3 32.9 32.3 31.7 31.7 30.6
Stocks 2.5 3.4 4.0 1.9 2.8 3.1 2.1
Valuables 1.3 1.2 1.1 1.3 1.8 2.1 2.7
3. Gross domestic savings 32.4 34.6 36.8 32.0 33.7 34.0 30.8
4. Saving-investment gap (3-1) -0.4 -1.1 -1.3 -2.3 -2.8 -2.8 -4.2
Source: CSO. Notes : 1R: First Revised Estimate, 2R: Second Revised Estimate. Totals may not tally due toadjustment for errors and omissions.
INVESTMENT1.18 The growth rate of the economy since 2003-04 has been strongly correlated with investment rate.The investment rate averaged 34.5 per cent between2003-04 and 2011-12, much higher rate than before.As can be seen from Tables 1.1 and 1.2, the realgrowth rate in the economy averaged 9.5 per centper annum during 2005-06 to 2007-08, which werealso the years when the growth rate of investment inreal terms averaged around 16 per cent. Similarly,the average growth rate of the economy was closeto 9 per cent per annum in 2009-10 and 2010-11,with the growth rate of investment averaging around16.2 per cent in these two years. The rate of growthof GDP was lower in the years when growth rate ofinvestment was low, as was the case in 2008-09and 2011-12.
1.19 As can be seen from Table 1.5, the privatesector is the major source of investment in thecountry. Within the private sector there are twocategories of investors, viz. the private corporatesector and household sector. Figure 1.3 gives theshare of these sectors, along with the investment ofthe public sector and valuables, in total investment.1.20 Since 2004-05, the year when the overallinvestment rate in the economy first exceeded 30per cent, the share of public investment in totalinvestment (excluding valuables) has remained fairlystable at around 24 per cent for all the years, exceptin 2008-09 and 2009-10 when it was 27.6 per centand 26.5 per cent respectively. The increase in theseyears could be attributed to the fiscal stimulusprovided by the government in order to overcome theslowdown in the economy in 2008-09 following theglobal slowdown.
http://indiabudget.nic.in

8 Economic Survey 2012-13
1.21 As per the First Revised Estimates releasedby the CSO in January 2013, gross domestic capitalformation as a ratio of GDP at current market prices(investment rate) is estimated to be 35.0 per cent in2011-12 as against 36.8 per cent in 2010-11. Bothpublic and private investment declined as a share ofGDP. Within private investment, investment by theprivate corporate sector registered a sharper decline.
1.22 The reduction in private investment could beattributed to a number of factors. First is the increasein policy rates (to combat inflation and inflationaryexpectations). Between March 2010 and October2011, the RBI raised the repo rate by 375 basis points(bps), thus raising the cost of borrowings in a bid toreduce demand. Another reason for lower privateinvestment could be lower demand for Indian exports
Box 1.1 : Recent Investment Trends: A Case of Rising Stalled Projects and Falling Project StartsTwo trends in investments stand out--rising stalled projects and falling project starts. To study these, we use data from theCapex database of the Centre for Monitoring Indian Economy (CMIE), which tracks investments at a project-specific level.
Rising Stalled Projects: There has been a surge in projects where implementation has stalled. Both in value and volumeterms, stalled projects have been rising since early 2009. As of December 2012, six sectors accounted for about 80 per cent ofall stalled projects--electricity, roads, telecommunication services, steel, real estate, and mining.
Source: CMIE CapEx.
Falling Project Starts: New investment projects have been drying up across sectors, partly as a consequence of rising stalledprojects which reduce the ability of firms to start new ones. New projects of both private sector and government have beenfalling. Government projects peaked in March 2010 and private-sector projects peaked two quarters later. Ever since, private-sector investment levels have been lagging government investments by about six months.
Causes of slowdown: Several factors are believed to have caused the stalling of investments and drying up of new investment.A CMIE study1 shows that in 2011-12, 20 projects accounted for almost 70 per cent of total cost of shelved projects. Ananalysis of these 20 individual projects suggests difficulties in land acquisition, coal linkages, and mining bans as majorcauses. Analysis of other stalled projects suggests that policy issues such as in telecom spectrum allocations have alsoplayed a role. Several sectors such as consumer non-durables, which are less subject to the type of permissions describedabove and are more driven by demand conditions and GDP growth, are also seeing a slowdown in new investments. Forexample, there is a slowdown in new investments in manufacturing food and agro-based products. Lack of growth andslowdown in investment are feeding into each other, with causation flowing both ways. High interest rates have contributedto the depressed investment climate as well. However, given the stability in the repo rate between April and December 2012,the latest quarterly data suggest that interest costs of companies have moderated slightly.
Way forward: The government has taken some steps to kick-start investments. The Cabinet Committee on Investments(CCI) has been set up to fast-track projects more than ` 1,000 crore. The Land Acquisition and Rehabilitation andResettlement (LARR) Bill, which has been cleared by the Cabinet, could bring greater clarity, reduce uncertainty, and therebyaid investments. Investments by cash-rich public-sector units (PSU) have the potential of crowding-in the private sector.Progress on the Delhi-Mumbai Industrial Corridor has the potential of providing a fillip to the investment climate of thecountry. Policy rate cuts by the RBI and improving business sentiments could also support a revival in investments.
1 “Sharp Increase in Projects Shelved”, CMIE, May 2012.
http://indiabudget.nic.in

9State of the Economy and Prospects
from the rest of the world, particularly the advancedcountries. A third possible reason for lower corporateinvestment is policy bottlenecks (such as obtainingenvironmental permissions, fuel linkages, or carryingout land acquisition, see Box 1.1), which led to anumber of large projects becoming stalled, whichmay in turn have discouraged new investment. Inwhat follows, the recent trends in various componentsof investment are discussed to understand thedecline in overall investment rate.
1.23 Between 2004-05 and 2011-12, on an average,the share of the household sector and the privatecorporate sector in total private investment has beenmore or less equal. However, there are largefluctuations from year to year, with the share of theprivate corporate sector being significantly higher inthe high growth years of 2005-06 to 2007-08 andmuch lower in the years when growth was lower,particularly in 2008-09 and 2011-12. Investment bythe private corporate sector, at current prices, waslower by nearly ` 90,000 crore in 2011-12 ascompared to 2010-11. Consequently, the share ofprivate corporate investment in total investmentdeclined to 29.8 per cent in 2011-12 as against 36.1per cent in 2010-11. Parenthetically, the magnitudeof decline was much larger in 2008-09, when privatecorporate investment declined by nearly ̀ 2,25,000crore as compared to 2007-08.
1.24 Further analysis of the data reveals that thereduction in investment by the private corporate sectorin 2011-12 was on account of a drawdown of thestocks. Unlike in 2008-09, when the gross fixedinvestment in the private corporate sector declinedby nearly ` 1,30,000 crore vis-à-vis 2007-08, thegross fixed capital formation by the private corporatesector registered a marginal increase in 2011-12 vis-à-vis 2010-11. Of course, in real terms as well as interms of percentage of total investment, gross fixedinvestment of the private corporate sector alsodeclined in 2011-12 as against 2010-11. Given thatconsumption grew strongly in 2009-12 even whileproductive investment slowed, it is not surprising thatthe economy has become increasingly supplyconstrained.
1.25 Investment in the form of valuables increasedby nearly ̀ 80,000 crore in 2011-12 vis-à-vis that in2010-11. Valuables include works of art, preciousmetals, and jewellery carved out of such metals andstones. At current prices, investment in the form ofvaluables registered a nearly 4.5-fold increase
between 2007-08 and 2011-12 and their share in totalinvestment increased from 2.8 per cent in 2007-08to 7.6 per cent in 2011-12. A part of the increase inthis share can be explained by the surge in the pricesof gold and other valuables. However, even atconstant prices, the share of valuables increasedfrom 2.9 per cent in 2007-08 to 6.2 per cent in 2011-12, thereby pointing to larger acquisition of valuables,including gold. Advance Estimates of CSO for 2012-13 suggest that acquisition of valuables may havedeclined in real terms.
1.26 To summarize, overall investment would haveslowed further were it not for non-productiveinvestment such as in valuables. Particularlyworrisome is the sharp slowing of corporateinvestment, which is the source of future supply(needed to quell inflation) and of future growthpotential. Policies to remove investment bottlenecksas well as structural reforms to encourage productiveinvestment and its financing are essential, as is moreaccommodative monetary policy, as inflation abates.
NET EXPORTS
1.27 Growth in net exports can be an importantsource of demand. Unfortunately for India, netexports growth has been low because of globalweakness. The World Economic Outlook (WEO)Update released by the IMF in January 2013 put therate of growth of world output at 3.9 per cent in 2011and 3.2 per cent in 2012, down from 5.1 per cent in2010. For the advanced economies, the growth ratewas much lower at 3 per cent, 1.6 per cent, and 1.3per cent for 2010, 2011 and 2012 respectively. Thegrowth rate in the faster growing emerging economiesalso fell over this period. Figure 1.4 gives growthrates for select advanced and emerging economiesfor 2010 and 2012 (based on information availablefrom the WEO).
1.28 As a result of weak growth in trading partnercountries, Indian exports also declined (see Box 7.1in Chapter 7). In the first half of FY 2012-13 (April-September 2012), there was a steep decline inexports (Table 1.6). Imports did not decline as muchin percentage point terms. Inelastic oil imports werethe primary reason for the relatively smaller declineof imports. But gold imports, which have surged inrecent years on the back of higher perceived returnson gold holdings, contributed significantly to imports,even though they declined in value over the previousyear (Box 1.2). The net result was an increase in
http://indiabudget.nic.in

10 Economic Survey 2012-13
the trade deficit to 10.8 per cent of GDP in H1 of2012-13 vis-à-vis 9.9 per cent of GDP in H1 of2011-12.
1.29 The net invisibles balance (in which net serviceexports and remittances are prominent) usuallyoffsets the trade deficit. However, it also declined indollar terms in H1 of 2012-13 relative to H1 of 2011-12. The increased outflow of investment income toforeigners has also played a part in reducing netinvisibles. As a result of the widening of the tradedeficit and moderation in net invisibles surplus, theCAD worsened to 4.6 per cent of GDP during H1 of2012-13 as compared to 4.0 per cent of GDP in H1of 2011-12.
1.30 With investment, consumption, and netexports all slowing in 2012-13, only an increase ingovernment spending could hold up economicgrowth. But the government deficit had already shot
up as a result of past expansionary policy to pullIndia out of the post global financial crisis slump.And it increased further as slow growth diminishedrevenues.
PUBLIC FINANCE
1.31 Following the global financial crisis and theslowdown in aggregate demand that followed, fiscalstimulus was injected in 2008-09 and 2009-10 andthe fiscal deficit of the centre increased to 6.0 percent and 6.5 per cent of GDP respectively. Fiscalconsolidation resumed in 2010-11 with a partialwithdrawal of the fiscal stimulus. With growth in GDPrecovering sharply in 2010-11, the fiscal deficit ofthe centre declined to 4.8 per cent of GDP. A largepart of this was on account of the growth in nominalGDP in excess of 20 per cent.
1.32 This momentum could not be sustained in2011-12 as growth faltered. The fiscal deficit of thecentre widened to 5.7 per cent of GDP in 2011-12(as per the Provisional Actuals). The dynamic natureof the relationship between macroeconomic outcomeand the fiscal outcome was manifest thus: the sharpslowdown in industrial output led to a slowdown inoverall GDP growth affecting tax revenues,particularly corporate income tax--the hitherto mostbuoyant source; the persistence of inflation thatnecessitated a tight monetary policy stance to reinin demand also dampened investment; subduedfinancial markets that hampered the planneddisinvestment programme, resulting in slippage overBudget Estimates (BE); and continued high levelsof global prices of crude oil and fertilizers with
Table 1.6 : Current Account BalanceItems 2011-12 2012-13
H1(April- H1(April-September 2011) September 2012)
US$ billionExports 158.2 146.5Imports 247.7 237.2Trade deficit 89.5 90.7Net invisibles 53.1 51.7CAD 36.4 39.0
Memo items as per cent of GDPTrade deficit 9.9 10.8Net invisibles 5.9 6.2CAD 4.0 4.6
http://indiabudget.nic.in

11State of the Economy and Prospects
Box 1.2 : The Gold Rush1
1. Demand for gold has been rising worldwide : The global financial crisis, turned debt crisis, has seen a steep rise incommodity prices, especially gold. This, now in hindsight, rather unsurprising fact, has mostly been driven by themeteorically increasing demand for safe havens to park the world's savings. Global gold prices, as denominated in US$,have doubled since 2008, and increased three times as denominated in Indian rupees.
2. India has traditionally been a major absorber of world gold : The last three years have seen a substantial rise in goldimports (the value of gold imports increased nine times between January 2008 and October 2012), contributing significantlyto the current account deficit along with oil (Figure 2).
3. Gold imports are positively correlated with inflation : High inflation reduces the return on other financial instruments.This is reflected in the negative correlation between rising imports and falling real rates (Figure 1). Even though real rateshave started rising, they are barely in the positive territory.
Source : CEIC Data Company.
Source : CEIC Data Company.(Contd...)
http://indiabudget.nic.in

12 Economic Survey 2012-13
4. Reduce Gold Purchases to curb CAD : Given soaring energy and transportation needs, since there seems to be little wecan do to temper oil imports, gold is the component that needs to be contained to bring the CAD back to a comfort zone.
5. The demand for gold as an investment tool has been increasing over time : Gold has been a combination ofinvestment tool and status symbol in India. With limited access to financial instruments, especially in the rural areas, goldand silver are popular savings instruments. The recent economic uncertainty has seen people across the board buy gold.Almost all of India's demand for raw gold is met through imports2. Figure 3 shows that the composition of gold has seena steady movement towards non jewellery items. Anecdotally, this can be construed as a rising demand for pureinvestment, predominantly in the urban and semi-urban areas. In the last quarter, non-jewellery constituted 40 per centof the total demand. This observation, in line with global trends, is easily explained by the declining real returns on thegamut of financial instruments available to the investor and soaring ones on gold (23.7 per cent annual average returnbetween April 07 and March 2012 versus 7.3 per cent return on Nifty and 8.2 per cent on savings deposits, Sehgal et. al.,2012).
Source : World Gold Council.
6. The longer term way to address the rising demand for gold : The overarching motive underlying the gold rush is highinflation and the lack of financial instruments available to the average citizen, especially in the rural areas. The risingdemand for gold is only a "symptom" of more fundamental problems in the economy. Curbing inflation, expandingfinancial inclusion, offering new products such as inflation indexed bonds, and improving saver access to financialproducts are all of paramount importance.
1. Prepared by Mr. Rohit Lamba and Dr. Prachi Mishra. We would like to thank Amresh Acharya at the World GoldCouncil, Suresh Phadnis at PMEAC, Sneha Arora and Arun Narendhranath at ISB for many discussions.
2. There are three active gold mines, which meet less than 1 per cent of domestic demand.
ReferencesSehgal, Sanjay Muneesh Kumar, Wasim Ahmad and Priyanshi Gupta, 2012, "The gold rush and policy options: Anempirical study", Department of Financial Studies, University of Delhi.
inadequate pass through to domestic consumptionled to higher-than-budgeted subsidy outgo. Thus,the slippage in fiscal deficit in 2011-12 resulted fromslippage of 35 per cent in revenue receipts, 23 percent in disinvestment receipts and recovery of loans,and 42 per cent in expenditure outgo.
1.33 These macroeconomic developments broadlycontinued through the first half of the current fiscal.
Concerns were raised in many quarters about thedeterioration in the fiscal position for a second yearin a row and the credibility of the fiscal policy stance.Recognizing that some of the assumptions made atthe time of budget formulation needed to be reviewedand corrective policy measures put in place, thegovernment appointed a committee headed by DrVijay Kelkar to chalk out a roadmap for fiscalconsolidation.
Box 1.2 : The Gold Rush1 (Contd...)
http://indiabudget.nic.in

13State of the Economy and Prospects
1.34 Following its recommendations, thegovernment unveiled a revised fiscal consolidationroadmap in October 2012. It targeted a fiscal deficitof 4.8 per cent of GDP for 2013-14 and through acorrection of 0.6 percentage point each yearthereafter, a fiscal deficit of 3.0 per cent of GDP in2016-17. Controlling the expenditure on subsidieswill be crucial. Domestic prices of petroleumproducts, particularly diesel and liquefied petroleumgas (LPG) need to be raised in line with the pricesprevailing in international markets. A beginning hasalready been made with the decision in September2012 to raise the price of diesel and again in January2013 to allow oil marketing companies to increaseprices in small increments at regular intervals. Thenumber of subsidized gas cylinders has also beencapped at nine. Efforts will also have to be made tocontain subsidies through better targeting (see Box1.3 on the rationale for capping gas cylinders), limitother expenditures, and raise revenues over time soas to take the revenue to GDP ratio to 2007-08 levels.The disinvestment process has also been speededup. Taking all these measures into account, the Mid-Year Economic Analysis 2012-13 indicated a likelyslippage in the fiscal deficit for the current fiscal byonly 0.2 percentage point.
1.35 The Budget for 2012-13 estimated a fiscaldeficit of ̀ 5,13,590 crore. As per the data on uniongovernment finances made available by theController General of Accounts, the fiscal deficit isplaced at 78.8 per cent of BE, significantly belowthe five-year average of 85.9 per cent and last year'slevel of 92.3 per cent. Revenue deficit at the sametime is placed at 85.1 per cent of BE, well belowthe level achieved in the recent past. This has largelybeen made possible by a moderation in growth oftotal expenditure in April-December 2012 to 10.6per cent as against BE of 14.8 per cent for 2012-13(over provisional actuals of 2011-12). This moderationin growth is in spite of the fact that subsidies haveburgeoned in April-December 2012 to reach a figureof ` 1,66,824 crore (92.9 per cent of BE). Therestraint in expenditure could largely offset the lowerlevels of non-debt receipts in April-December 2012.
1.36 Gross tax revenue was budgeted at` 10,77,612 crore for 2012-13. As a proportion ofBE, gross tax revenue in April-December 2012 was63.2 per cent, lower than the last five-years' averageof 69.0 per cent. The growth in gross tax revenue inApril-December 2012 was 15.0 per cent, comprisinga growth of 17.4 per cent in union excise duties; 6
per cent in customs; 22.5 per cent in personal incometax; 33 per cent in service tax; and 10.6 per cent incorporate income tax.
1.37 In terms of the implied year-on-year growthenvisaged by BE 2012-13 over provisional actuals of2011-12, there is slippage in the first nine months ofthe current fiscal in corporate income tax by 4.9percentage points, customs by 18.9 percentagepoints, and central excise by 16 percentage points.There is overperformance in service tax collectionby 5.9 percentage points and personal income taxby 7.6 percentage points. In terms of overall grosstax revenue there is slippage of 6 percentage pointsin April-December 2012. Going forward, therealization in the fourth quarter will determine theextent of shortfall for the year over BE.
1.38 The outcome in terms of the fiscal deficit ofthe centre broadly indicates that the slippage will belimited to 0.2 percentage point on account of theexpenditure measures that could help offset theshortfall in non-debt receipts. The crucial lesson thatemerges from the fiscal outcome in 2011-12 and2012-13 is that in times of heightened uncertainties,there is need for continued risk assessment throughclose monitoring and for taking appropriate measuresfor achieving better fiscal marksmanship. Open-ended commitments such as uncapped subsidiesare particularly problematic for fiscal credibilitybecause they expose fiscal marksmanship to thevagaries of prices.
1.39 It is better to achive fiscal consolidation partlythrough a higher tax-GDP ratio than merely throughreduction in the expenditure to GDP ratio, in view oflarge unmet development needs. After reaching apeak of 11.9 per cent in 2007-08, the tax-GDP ratiohad declined to 9.6 per cent in 2009-10 and wasplaced at 9.9 per cent in 2011-12. Therefore, raisingthe tax-GDP ratio to above the 11 per cent level iscritical for sustaining the process of fiscalconsolidation in the long run. Of course, it is muchbetter to achieve a higher tax-GDP ratio bybroadening the base which is taxed rather thanincreasing marginal tax rates significantly--higher andhigher tax rates impinge more and more on incentivesto undertake taxable activity, while encouraging taxevasion.
1.40 Finally, higher fiscal deficits usually lead torising public debt. India's central governmentliabilities-GDP ratio has in fact come down since2002-03 because high nominal GDP growth has
http://indiabudget.nic.in

14 Economic Survey 2012-13
Box 1.3 : Who Gets LPG Subsidies?*Subsidies should be well targeted at the poor. The reach of subsidies on LPG is highly unequal amongst the poor and rich inrural and urban areas. While there is a significant inequality in the proportion of subsidies received by the poorest and richesthouseholds in rural areas, the distribution is more equitable across urban households. However, in both cases, the proportionof subsidies that go to the poor is low.
The proportion of LPG subsidies received by each quintile across rural and urban households
To calculate the distribution of subsidies across households, we use the 64th Round of NSS data and categorize all rural (andurban) households into quintiles based on their per capita household expenditure. Furthermore, we use the reportedhousehold expenditure on LPG to calculate the share of each quintile in the total expenditure on LPG. The share in expenditureon LPG for any quintile therefore reflects the proportion of subsidies received by that quintile.
From the above graph, we see a highly unequal distribution of subsidies across rural households. The proportion of subsidiesthat go to the poorest quintile is only 0.07 per cent as compared to 52.6 per cent for the richest quintile. In urban areas, thoughthe proportion of subsidies that go to the poor is still low (around 8.2 per cent), there is a more equitable distribution acrossthe remaining quintiles (19 per cent, 24 per cent, 25 per cent and 23 per cent respectively).
*Prepared by Abhijit Banerjee and Gaurav Chiplunkar.
offset both the new borrowing as well as the nominalinterest payments creditors have demanded. Putdifferently, India has been able to borrow at low realinterest rates even while the government has runfiscal deficits. Such a sequence of events cannot berelied upon, which is yet another reason for bringingdown the fiscal deficit.
1.41 Another way of looking at the slippage in publicfinances is to see it in the context of domesticsavings, which is the safest way of financinginvestment. Large fiscal deficits may imply lowerpublic savings, lower domestic savings, and given alevel of investment, larger CADs. Of course, private
savings can increase to make up the shortfall in publicsavings. Unfortunately, after moving up in 2008-09and 2009-10, private savings have declined sharply,compounding the decline in public savings.
DOMESTIC SAVINGS
1.42 The volume and composition of domesticsavings in India have undergone significant changesover the years. The savings rate (gross domesticsavings as percentage of gross domestic product atmarket prices) averaged 18.6 per cent in the 1980sand 23 per cent in the 1990s. The savings rateexceeded 30 per cent for the first time in 2004-05
http://indiabudget.nic.in

15State of the Economy and Prospects
and has remained above that level ever since. Itpeaked in 2007-08 at 36.8 per cent and reached aneight-year low of 30.8 per cent in 2011-12 (the latestperiod for which we have complete figures)(Table 1.7).
1.43 Savings come from three sources, viz.households, the private corporate sector, and thepublic sector. On average, households accountedfor nearly three-fourths of gross domestic savingsduring the period 1980-81 to 2011-12. The sharedeclined somewhat in recent years, and in the periodfrom 2004-05 to 2011-12, it averaged 70.1 per centof total savings. Savings of the private corporatesector accounted for 15 per cent of total savings onan average between 1980-81 and 2011-12. However,during the years 2004-05 to 2011-12, their shareincreased to 23.2 per cent. The public sectoraccounted for 10 per cent of total savings on average
between 1980-81 and 2011-12. It has beenprogressively declining and during 2004-05 to 2011-12, public savings as a ratio of total savings averaged6.7 per cent. Figure 1.5 shows the trends incontribution of the household, private corporate, andpublic sectors to total savings since 1980-81.
1.44 Within households, the share of financialsavings vis-à-vis physical savings has been decliningin recent years. Financial savings take the form ofbank deposits, life insurance funds, pension andprovident funds, shares and debentures, etc.Financial savings accounted for around 55 per centof total household savings during the 1990s. Theirshare declined to 47 per cent in the 2000-10 decadeand it was 36 per cent in 2011-12. In fact, householdfinancial savings were lower by nearly ̀ 90,000 crorein 2011-12 vis-à-vis 2010-11. Some possibleexplanations for the reduction in the share of financialsavings are discussed in Box 1.4.
Table 1.7 : Ratio of Savings to GDP (at current market prices per cent)
2004-05 2006-07 2007-08 2008-09 2009-10 2010-112R 2011-121R
Gross domestic saving 32.4 34.6 36.8 32.0 33.7 34.0 30.8Public sector 2.3 3.6 5.0 1.0 0.2 2.6 1.3
Private sector 30.1 31.0 31.8 31.1 33.5 31.5 29.5
Household sector 23.6 23.2 22.4 23.6 25.2 23.5 22.3
Financial saving 10.1 11.3 11.6 10.1 12.0 10.4 8.0
Saving in physical assets 13.4 11.9 10.8 13.5 13.2 13.1 14.3
Private corporate sector 6.6 7.9 9.4 7.4 8.4 7.9 7.2
Source : CSO.Notes : 1R : First Revised Estimate, 2R : Second Revised Estimate.
http://indiabudget.nic.in

16 Economic Survey 2012-13
Box 1. 4 : Reduction in Financial SavingsMuch of the financial savings of the household sector are in the form of bank deposits (around 30 per cent in the 2000s), lifeinsurance funds (22 per cent in the 2000s as against 9.6 per cent in the 1980s), and pension and provident funds (16.5 per centin the 2000s as against 23.6 per cent in the 1980s). There has been a decline in the proportion of pension and provident funds,particularly since the late 1990s. This trend continued till 2007-8. These were also the years when the real rate of interest wasgenerally declining. There has been some upward movement in the share of pension and provident funds during 2008-9 and2009-10, partly due to the increase in disposable income of government servants who are significant contributors to thesefunds, on account of higher pay and arrears arising from the implementation of the recommendations of the Sixth PayCommission.
Shares and debentures accounted for 8.3 per cent of total financial savings in the1980s; their share increased to nearly 13 percent in the 1990s before declining to 4.8 per cent in the 2000s. The reasons for such a trend could be the behaviour of shareprices, as reflected by the Bombay Stock Exchange (BSE) Sensex, and depicted in the following Table.
1980s 1990s 2000s
Average of BSE Sensex 448 3120 8612
Return on BSE Sensex (%) CAGR - 21.4 10.7
Coefficient of Variation 42.3 33.2 60.1
Note : These have been calculated from the information available in the RBI’s Handbook of Statistics on IndianEconomy.
The increase in the proportion of shares and debentures in total financial savings in the 1990s could be ascribed to higherreturns (21.4 per cent per annum on an average for the decade) along with lower volatility as reflected by a lower coefficientof variation that declined from 42.3 in 1980s to 33.2 in the 1990s. The returns on the BSE Sensex halved to 10.7 per cent in the2000s and volatility increased as can be seen from the higher value of the coefficient of variation at 60.1. Thus a combinationof lower returns and higher volatility in the 2000s vis-à-vis the 1990s could have contributed to the reduced share of sharesand debentures in total financial savings. This, coupled with high inflation, could also be one of the reasons why gold hasbecome a ‘safe haven’ investment in recent times (see boxes 1.2 and 7.2). Acquisition of gold by the households in the countrytends to have a negative impact on savings and on household financial investments.
1.45 One of the reasons for the increasing shareof the private corporate sector in total savings couldbe that there has been an increase in the total profitto output ratio from 3.5 per cent for the 1980s to 5.4per cent in the 1990s and further to 7.7 per cent inthe 2000s in the factories sector (estimated fromthe information available from the Annual Survey ofIndustries). There has also been a reduction incertain costs, that is emoluments, interestpayments, and fuels as a ratio of total value of output,as can be seen from Table 1.8. This reduction hascontributed to profits and consequently highersavings of the corporate sector.1.46 A slowdown in the industrial sector has animpact on private corporate savings, as was the casein 2008-09 and again in 2011-12, and the revival ofthis form of savings depends on how fast industryrecovers.1.47 Public-sector savings include savings by (a)public authorities comprising governmentadministration and quasi-government bodies anddepartmental commercial enterprises and (b) non-
departmental commercial enterprises. The share ofpublic savings in total savings progressively declinedfrom over 20 per cent in the 1980s to 7.3 per cent inthe 1990s and further to 3.3 per cent in the 2000s.Within public savings, the share of non-departmentalPSUs on an average remained in the range of 12-13per cent during each of the three sub-periods. Theshare of public authorities in total savings declinedby nearly 16 percentage points from a positivecontribution of 7.4 per cent in the 1980s to a negativecontribution of 8.7 per cent in the 2000s. Publicauthorities have generally been dis-savers since1987-88, with large dis-savings since 1998-99.
1.48 Despite a long-term trend decline in savingsby public authorities, there have been periods ofimprovement. On the back of strong growth inrevenues and the Fiscal Responsibility and BudgetManagement Act of 2003, the combined fiscal deficitof both the central and state governments declinedfrom 9.6 per cent of GDP in 2002-03 to 4 per cent ofGDP in 2007-08. Public-sector savings as a ratio ofGDP increased from - 0.3 per cent of GDP in 2002-03
http://indiabudget.nic.in

17State of the Economy and Prospects
to 5 per cent in 2007-08, before declining followingthe fiscal stimulus in 2008-09. The significantimprovement in domestic savings rate between 2003-04 and 2007-08 owed to a great extent to theincreased public savings, stemming from fiscalconsolidation.
1.49 As Table 1.5 suggests, gross fixed capitalformation has fallen by over 2 percentage pointsbetween pre-crisis 2007-08 and 2011-12. However,gross domestic savings have fallen by about 6percentage points over the same period. So even aswe have to raise investment, especially corporateinvestment, raising domestic savings is the safestway of financing the increase without putting pressureon the current account balance. A large part of thefuture increase in savings will have to come fromincreased public savings. This will entail graduallyreducing the central government's fiscal deficit from5.8 per cent in 2011-12 to the 3 per cent projectedfor 2016-17 as per the fiscal roadmap (see previoussection for details).
1.50 Household savings will also have to be raised.The financial savings of the household sector arelikely to improve with lower inflation, especially asthe real rate of return on financial savings rises. Agreater variety of reliable financial savingsopportunities (such as inflation-indexed bonds) andrelative ease of access to them could also help inraising the share of financial savings in total savings,reducing the attractiveness of alternatives like gold.
1.51 Let us now turn to two importantconsequences of macroeconomic imbalances--prices and the balance of payments or externalposition.
PRICES AND MONETARYMANAGEMENT
1.52 Headline WPI inflation remained relativelysticky around 7 to 8 per cent in the current financial
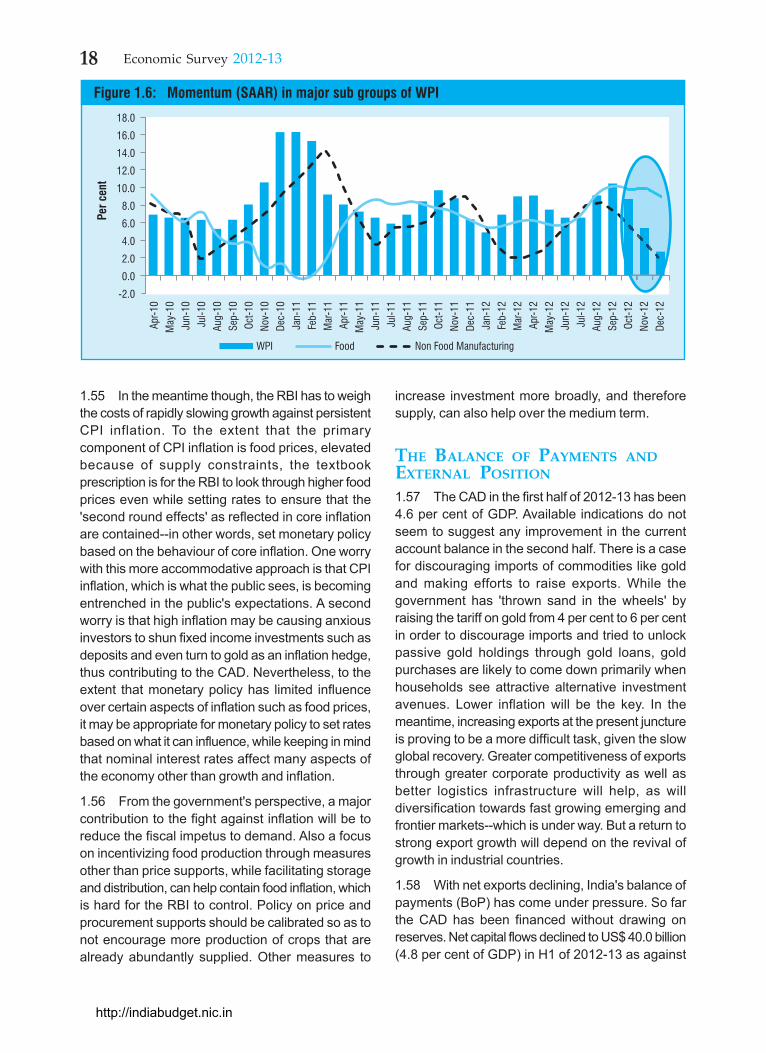
year and moderated to a three-year low of 7.18 percent in December 2012. Average headline WPIinflation in 2012 (April-December) moderated to 7.55per cent from 9.35 per cent in the correspondingperiod of the previous year. The momentum basedon seasonally adjusted annualized rate (SAAR) hasalso been showing a declining trend in the last coupleof months for major subgroups of the WPI (Figure1.6). The decline is mainly due to moderation in non-food manufacturing inflation (core as defined by theRBI). Core inflation remains muted and declined to4.24 per cent in December 2012 from its peak of8.35 per cent in November 2011. Apart from monetarymeasures taken by the RBI, softening of internationaland domestic prices of metals, chemicals, andtextiles products also contributed to the moderationof core inflation.
1.53 Elevated food inflation, however, remains anarea of concern with inflation gradually inchingupwards to double digits in December 2012. Unlikethe previous year, when food inflation was mainlydriven by higher protein food prices, this year thepressure has been coming mainly from cereals.Inflation in cereals has increased to 17.05 per centin the third quarter of 2012-13 from 6.36 per cent inthe first quarter mainly on account of an increase inprices of wheat, rice, and maize. Besides an increasein the minimum support price (MSP) for wheat andrice, inadequate open market availability relative todemand, particularly for wheat, has also resulted ina build-up of price pressure and hardening of inflationfor cereals. The recent increase in onion prices inDecember 2012- January 2013 may also put somepressure on primary food articles inflation. However,milk and other protein items witnessed moderationin inflation in the second and third quarters of2012-13.
1.54 Rising food inflation has also widened the gapbetween inflation measured in terms of CPIs andWPI to 3.91 percentage points in December 2012from 1.55 percentage points in May 2012. However,global commodity prices have remained relativelybenign with both energy and non-energy pricesregistering a decline until recently. As per the WorldBank's Global Economic Prospects, except formetals, most global commodity prices are expectedto decline further in 2013 and 2014, a silver lining inthe tepid global recovery. The impact of benigninflationary expectations internationally will have amoderating impact on domestic prices.
Table 1.8 : Cost of certain inputs as a Ratioof Value of Output (per cent)
1980s 1990s 2000sTotal emoluments 9.2 6.7 4.3
Fuel cost 8.3 7.4 6.7
Interest paid 5.1 5.5 2.6
Material consumed 60.8 59.4 62.2Source : Based on Annual Survey of Industries, FactorySector.
http://indiabudget.nic.in
18 Economic Survey 2012-13
1.55 In the meantime though, the RBI has to weighthe costs of rapidly slowing growth against persistentCPI inflation. To the extent that the primarycomponent of CPI inflation is food prices, elevatedbecause of supply constraints, the textbookprescription is for the RBI to look through higher foodprices even while setting rates to ensure that the'second round effects' as reflected in core inflationare contained--in other words, set monetary policybased on the behaviour of core inflation. One worrywith this more accommodative approach is that CPIinflation, which is what the public sees, is becomingentrenched in the public's expectations. A secondworry is that high inflation may be causing anxiousinvestors to shun fixed income investments such asdeposits and even turn to gold as an inflation hedge,thus contributing to the CAD. Nevertheless, to theextent that monetary policy has limited influenceover certain aspects of inflation such as food prices,it may be appropriate for monetary policy to set ratesbased on what it can influence, while keeping in mindthat nominal interest rates affect many aspects ofthe economy other than growth and inflation.
1.56 From the government's perspective, a majorcontribution to the fight against inflation will be toreduce the fiscal impetus to demand. Also a focuson incentivizing food production through measuresother than price supports, while facilitating storageand distribution, can help contain food inflation, whichis hard for the RBI to control. Policy on price andprocurement supports should be calibrated so as tonot encourage more production of crops that arealready abundantly supplied. Other measures to
increase investment more broadly, and thereforesupply, can also help over the medium term.
THE BALANCE OF PAYMENTS ANDEXTERNAL POSITION
1.57 The CAD in the first half of 2012-13 has been4.6 per cent of GDP. Available indications do notseem to suggest any improvement in the currentaccount balance in the second half. There is a casefor discouraging imports of commodities like goldand making efforts to raise exports. While thegovernment has 'thrown sand in the wheels' byraising the tariff on gold from 4 per cent to 6 per centin order to discourage imports and tried to unlockpassive gold holdings through gold loans, goldpurchases are likely to come down primarily whenhouseholds see attractive alternative investmentavenues. Lower inflation will be the key. In themeantime, increasing exports at the present junctureis proving to be a more difficult task, given the slowglobal recovery. Greater competitiveness of exportsthrough greater corporate productivity as well asbetter logistics infrastructure will help, as willdiversification towards fast growing emerging andfrontier markets--which is under way. But a return tostrong export growth will depend on the revival ofgrowth in industrial countries.
1.58 With net exports declining, India's balance ofpayments (BoP) has come under pressure. So farthe CAD has been financed without drawing onreserves. Net capital flows declined to US$ 40.0 billion(4.8 per cent of GDP) in H1 of 2012-13 as against
http://indiabudget.nic.in

19State of the Economy and Prospects
US$ 43.5 billion (4.8 per cent of GDP) in H1 of 2011-12 (Table 1.9). Net foreign direct investment (FDI) toIndia decreased but net portfolio flows includingforeign institutional investments (FII) increased, withearly estimates suggesting an even larger inflow ofUS$ 9.9 billion in the third quarter as compared toUS$ 5.8 billion in the second quarter. Non-residentIndian (NRI) deposits remained robust as did netflows of trade credit. Despite the large CAD, therefore,there was net accretion to reserves (on BoP basis)during H1 of 2012-13 at US$ 0.4 billion. This was,however, lower than the US$ 5.7 billion accretion inH1 of the previous year.
1.59 In the current fiscal, foreign exchange reserveshave fluctuated between US$ 286.0 billion and US$295.6 billion. At end January 2013, reserves stood
at US$ 295.5 billion, indicating a marginal increasefrom US$ 294.4 billion at end March 2012. The rupee,however, has been more volatile. Between April 2012and January 2013, the monthly average value of therupee per US dollar fluctuated significantly, touchingan all-time low of ̀ 57.22 per US dollar on 27 June2012, thus depreciating by 10.6 per cent from ̀ 51.16per US dollar on 30 March 2012. In the subsequentmonths of July to September 2012, the rupeeappreciated, touching ` 51.62 per US dollar on 5October 2012. It began depreciating again thereafterand the monthly average exchange rate has sincebeen in the range of ̀ 53.02 to ̀ 54.78 per US dollarduring October 2012 to January 2013 (Figure 1.7).1.60 The real effective exchange rate, which takesinto account domestic inflation in India, and is animportant determinant of the competitiveness ofIndian exports, has depreciated by about 11 per centsince mid - 2011.1.61 India's external debt stock stood at US$ 365.3billion at end-September 2012, recording an increaseof about US$ 20.0 billion (5.8 per cent) over the end-March 2012 level. This increase has been primarilyon account of higher NRI deposits, short-term debt,and ECBs. These three components togethercontributed 94.7 per cent of the total increase in thecountry's external debt.1.62 The maturity profile of India's external debtcontinues to be dominated by long-term loans. Atend-September 2012, long-term external debt at US$280.8 billion, accounted for 76.9 per cent of totalexternal debt, while the remaining 23.1 per cent wasshort-term debt. Government (sovereign) externaldebt stood at US$ 81.5 billion, while non-government
Table 1.9 : Performance of BoPItems 2011-12 2012-13
H1(April- H1(April-Sept 2011) Sept 2012)
US$ billionCAD 36.4 39.0Capital account 43.5 40.0Net FDI 15.7 12.8Net portfolio(including FIIs) 1.3 5.8NRI deposits 3.9 9.4 ECB 8.4 1.7Trade credit 5.9 9.5
Memo items as per cent of GDPCAD 4.0 4.6Net capital flows 4.8 4.8Note : ECB is external commercial borrowings.
http://indiabudget.nic.in

20 Economic Survey 2012-13
debt amounted to US$ 283.9 billion at end-September 2012. India's external debt has remainedwithin manageable limits as indicated by the externaldebt-GDP ratio of 19.7 per cent and debt serviceratio of 6.0 per cent in 2011-12. But the trends insize, source, maturity, and hedging of external debtbear careful monitoring. In particular, regulators willhave to be careful about the tendency of some Indiancorporations or entities without substantial foreignexchange earnings to leave foreign exchangeborrowings un-hedged so as to get 'cheap' foreignfinancing. Low un-hedged foreign interest rates canbe deceptively enticing, leaving the borrower exposedto significantly higher repayments if the rupeedepreciates unexpectedly.1.63 In this context, regulators have to maintain abalance between what is of public importance andwhat is prudential. Areas of public importance, suchas infrastructure, do deserve substantial support.However, these areas of activity may also be risky.Support should be given by de-risking the areas(policy to speed up infrastructure projects and easetheir completion), through financial development(creating new financing institutions, attracting newinvestors), or fiscal means (interest subventions, taxbreaks) but not by relaxing prudential norms (lowercapital requirements, allowing un-hedged foreignborrowing) or riskier capital structures (allowinggreater debt ratios). Ultimately, riskier financing forprojects of public importance builds up greater riskfor the country because if these projects fail to takeoff, they impinge on both growth and the financialsystem at the same time, at a time when thegovernment has fewer resources to cope.
ASSESSMENT AND POLICY MEASURES
1.64 The strong post-financial-crisis fiscal andmonetary stimulus in India led to spectacular growthin the immediate aftermath of the crisis. But withcorporate and infrastructural investment not keepingpace, and food production constrained, the boost toconsumption eventually led to higher inflation. Andfalling savings, partly as a result of governmentspending and partly as a result of high inflation, haveled to a widening CAD. Monetary policy has beentightened, even as global headwinds to growth haveincreased. India has been caught in a vicious circleof falling growth and stimulus withdrawal that couldwell exacerbate the decline. Of some concern isIndia's increased dependence on foreign borrowingeven as growth has slowed.
1.65 Because of the slowdown and high levels ofleverage, some industry and infrastructure sectorsare experiencing an increase in non-performingassets (NPAs). Overall gross NPAs of the bankingsector increased from 2.36 per cent of total creditadvanced in March 2011 to 3.57 per cent of totalcredit advanced in September 2012. The increase isparticularly sharp for the industry and infrastructuresectors. Sub-sectors particularly under stress includetextiles, chemicals, iron and steel, food processing,construction, and telecommunications. The increasein gross NPAs is also significantly higher for public-sector banks, which are typically more exposed tothe distressed sectors.
1.66 Some of the reasons for the increase in NPAsare technical (a switch to system-based identificationby public-sector banks), but stress also stems fromslow growth and project delays. A revival of growthwill help contain NPAs, but going forward, moreattention will have to be paid to whether projects areadequately capitalized up front given the risks, andto whether distress resolution systems workeffectively in recapitalizing distressed assets andputting them back to work, while excising ineffectivepromoters from management and imposing losseson those who contracted to take the risk.
1.67 The way out, and the hope for starting avirtuous circle, lies in shifting national spending fromconsumption to investment, removing the bottlenecksto investment, growth, and job creation, in partthrough structural reforms, combating inflation boththrough monetary and supply-side measures,reducing the costs for borrowers of raising financing,and increasing the opportunities for savers to getstrong real investment returns.
1.68 In practical terms for government policy, thistranslates into containing the fiscal deficit especiallyby shrinking wasteful and distortionary subsidies. Itmeans working on reducing the impediments toinvestment such as delays in getting permissions,clarifying difficult and non-transparent processes forland acquisition, and increasing access to goodinfrastructure such as power and roads. It warrantsreworking the regulatory and incentive structure thatkeeps small businesses tiny and prevents them fromcreating good productive jobs. It calls for reducingthe barriers to entry in various areas of businessand allowing FDI, even while ensuring domesticcompanies are not disadvantaged. It entails providingthe incentives and means for the farmer to increase
http://indiabudget.nic.in

21State of the Economy and Prospects
production, even while improving the managementand the logistics of food procurement anddistribution. And it necessitates continuing financial-sector reform to increase the entry of new institutions,reduce transactions costs for investors, increaseaccess for borrowers and savers to one another, andimprove the quality of regulation.
1.69 The government has already taken someimportant steps in this direction, some of which wehave already alluded to. In addition, two helpfulpotential developments are in sight, one on therevenue side and the other on the expenditure side.The goods and services tax (GST), if approved, wouldreplace a number of state and central taxes, makeIndia more of a national integrated market, and bringmore producers into the tax net. By improvingefficiency as well as revenues, it can add substantiallyto growth as well as helping government finances.On the expenditure side, the direct benefit transferscheme that will allow the transfer of governmentbenefits directly to targeted recipient bank accountscan help reduce transactions costs, preventduplication, leakage, and fraud, and improve choicesfor the poor. By translating a number of subsidiesinto equivalent cash transfers, it can avoid pricedistortions and can target subsidies better to thetruly deserving. This will help contain expenditure.
1.70 The government has also taken a number ofsteps to revive investment and growth. Thesecomprise setting up the CCI headed by the PrimeMinister to fast-track mega projects of over ̀ 1,000crore; a scheme for restructuring the debts of statepower distribution companies, which includesincentives for them to charge reasonable tariffs sothat they do not get over-indebted again; movementtowards a land acquisition bill that will clarify andmake the process of land acquisition fairer; permittingFDI in a number of areas including multibrand retail,power exchanges, and civil aviation; increasinginvestment in irrigation, storage and cold storagenetworks; and undertaking programmes to improvethe production of protein foods.
1.71 Steps have also been taken on financial-sectorreform. The Banking Laws (Amendment) Act 2012strengthens the regulatory powers of the RBI andpaves the way for grant of new bank licences by theRBI. The Financial Sector Legislative ReformsCommission is examining the laws governing thefinancial sector with a remit to suggest ways ofmodernizing them. A number of steps have beentaken by the government, together with the financial-
sector regulators, for easing savings and investmentin the country, both for domestic and foreigninvestors. These are detailed in Chapter 5.
1.72 More generally, India's situation is difficult butsteps have been taken to bring the macroeconomyback into balance and growth on track. What isimportant is to recognize that a lot needs to be doneand the slowdown is a wake-up call for increasingthe pace of actions and reforms.
PROSPECTS, SHORT TERM ANDMEDIUM TERM
1.73 The revival of growth in the advanced countriesis expected to be slow and uncertain at least in thenear future, despite the measures being taken onmonetary and fiscal fronts. In Europe, in particular,this is also being accompanied by changes in theinstitutional framework. With the ongoing private-sector deleveraging and government fiscalconsolidation, most analysts have projected only avery moderate global recovery in 2013, which couldgather steam in 2014. At the same time, if the UnitedStates can deal with its fiscal overhang, the potentialupside to global growth could be substantial, giventhe health of US corporations, continuing innovation,low energy costs, and the improving finances ofhouseholds. Emerging markets can alsocompensate a little for tepid growth in industrialeconomies, and the changing direction of Indianexports towards emerging markets (see Chapter 7)can help their revival.
1.74 Nevertheless, it is unlikely that the support toIndian growth from the global economy will besignificant. Indeed, there are two sources ofdownside risk. First, India is exposed to shifts in therisk tolerance of international investors. Second,India's import bill is strongly tied to the price of oil.Of course, one reason for rising oil prices would beimprovements in the global economy, which wouldmean stronger exports. The more worrisome situationwould be if the oil prices rise because of geopoliticalrisks, which would mean increasing investor anxietyand slow world growth.
1.75 The bottomline is that India cannot take theexternal environment for granted, and has to movequickly to restore domestic balance. The governmentis committed to fiscal consolidation. This along withdemand compression and augmented agriculturalproduction should lead to lower inflation, giving theRBI the requisite flexibility to reduce policy rates.
http://indiabudget.nic.in

22 Economic Survey 2012-13
Lower interest rates could provide an additional fillipto investment activity for the industry and servicessectors, especially if some of the regulatory,bureaucratic, and financial impediments toinvestment are eased.
1.76 Given such a scenario, where all the threemajor sectors of the economy perform better in 2013-14 as compared to 2012-13, the overall economy isexpected to grow in the range of 6.1 to 6.7 per centin 2013-14. Of course, these projections assume anormal monsoon, further moderation in inflation asexpected (to induce further relaxation of the tightmonetary stance), and mild recovery of global growthas anticipated. Forecasting at potential turning pointsis difficult, hence the relatively wide range this time.
1.77 While the current environment is difficult, thefuture holds promise, provided we can answer thequestion that is probably foremost in the minds ofIndia's young population: 'Where will my job comefrom?' In Chapter 2, we look at this question in somedepth. India is creating jobs in industry but mainly inlow productivity construction and not enough formaljobs in manufacturing, which typically are higherproductivity. The high productivity service sector isalso not creating enough jobs. As the number ofpeople looking for jobs rises, both because of thepopulation 'dividend' and because share of agricultureshrinks, these vulnerabilities will become important.Because good jobs are both the pathway to growthas well as the best form of inclusion, we have tothink of ways of enabling their creation. Chapter 2examines possible avenues.
1.78 Let us now turn to summary outlines of thechapters in the survey that focus on different sectorsand aspects of the complex economy that India is.
AGRICULTURE AND FOODMANAGEMENT
1.79 Indian agriculture has performed remarkablywell in terms of output growth, despite weather andprice shocks in the past few years. Althoughagriculture, including allied activities, accounted foronly 14.1 per cent of the GDP in 2011-12, its role inthe country's economy is much bigger with its sharein total employment as high as 58.2 per centaccording to the 2001 census. The declining shareof the agriculture and allied sector in the country'sGDP is consistent with the normal developmenttrajectory of any fast growing economy (see
Chapter 2), but fast agricultural growth remains vitalfor jobs, incomes, and food security.
1.80 Average annual growth of the agriculture andallied sector during the Eleventh Five Year Plan at3.6 per cent fell short of the target of 4 per cent butwas higher than the average annual growth of 2.5and 2.4 per cent achieved during the Ninth and TenthPlans respectively. An important reason for thedynamism of the agriculture sector has been a step-up in the gross capital formation (GCF) relative toGDP of this sector. Overall GCF in agriculture(including the allied sector), more than doubled inthe last 10 years and registered an average annualgrowth of 8.1 per cent. During the Eleventh Planperiod, foodgrains production witnessed anincreasing trend, except in 2009-10. During 2011-12, total foodgrains production reached a record of259.3 million tonnes. Better agricultural performancein the Eleventh Plan is a result of: a) farmers'response to better prices; b) continued technologygains; and c) appropriate and timely policies comingtogether, e.g. increased credit at concessional rates.However, the production of 2012-13 kharif crops islikely to be adversely affected by deficiency in thesouth-west monsoon and resultant acreage losses.The output for all the major crops is expected todecline.
1.81 Owing to good production of foodgrains inrecent years and remunerative MSPs, even statesthat were traditionally not procuring sufficientfoodgrains, e.g. Bihar, Madhya Pradesh, Bihar,Chhattisgarh, and West Bengal showed significantincrease. In recent years, the policy impetus providedby the government has also provided much requiredstability to agricultural exports.
1.82 India does not fare well, however, in terms ofagricultural yields or productivity. Improvement inyields holds the key for India to remain self-sufficientin foodgrains. Another challenge is how to maximizeagricultural income while adopting a moresustainable agricultural strategy. The concerns hereare land and water degradation due to soil erosion,soil salinity, waterlogging, excessive application ofnutrients, and overexploitation of water resources insome parts of the country. Better managementpractices for rehabilitation of degraded land and waterresources hold the key. Expenditure on agriculturalresearch also needs to be raised in the Twelfth FiveYear Plan.
http://indiabudget.nic.in

23State of the Economy and Prospects
1.83 A notable feature of the Indian agriculturalsector is the domination of small farmers with smalllandholdings. This poses a challenge for the adoptionof farm mechanization and generating productiveincomes from farm operations. Land-related issuesand implementation of land reforms require to beattended to on priority basis to revitalize theagriculture sector. Declining per capita availability offoodgrains is another major concern in India. Forensuring nutritional security, it is not only importantto increase per capita availability of foodgrains butalso to ensure the right amounts of food items in thefood basket of the common man. A thrust onhorticulture products and protein-rich items isrequired for ensuring nutritional security.
1.84 Another critical issue is supply-chainmanagement in agricultural marketing in India. It isnecessary to evolve mechanisms for linkingwholesale processing, logistics, and retailing withfarm-production activities so as to generate enhancedefficiency, better farm prices, etc. Recently thegovernment allowed FDI in retail, which can pavethe way for investment in new technology andmarketing of agricultural produce in India.
1.85 There is need for stable and consistent policieswhere markets play an appropriate role, privateinvestment in infrastructure is stepped up, the publicdistribution system (PDS) is revamped, food priceand food stock management improves, and apredictable trade policy is adopted for agriculture.These initiatives need to be coupled with skilldevelopment and better research and development(R&D) along with improved delivery of credit, seeds,etc.
INDUSTRY AND INFRASTRUCTURE
1.86 The capital goods sector remained weak forthe second consecutive year. Negative growth wasnot only experienced across the sub-sectors of thecapital goods segment but was also more persistentwith only two months in the last twelve monthsrecording positive growth. The production of keycapital goods such as machinery and equipment ,electrical machinery, and transport segmentscontracted owing to deceleration in investment, adecline in new projects, and import competition. Highinterest rates and slower growth in household or retailcredit resulted in slower growth in consumerdurables.
1.87 Sluggish industrial performance also affectedcorporate performance. The rate of growth of salesof the listed manufacturing companies in the privatesector declined from an average of 28.8 per cent inthe first quarter of 2010-11 to 11.4 per cent in thesecond quarter of 2012-13. Interest expenditureincreased significantly. Together with a decelerationin the rate of growth of sales, the ratio of net profit tosales also declined.
1.88 The aggregate resource flow to industry,including credit disbursed by the banks and moneyraised in domestic and overseas market through otherinstruments, however, has been showing some signsfor optimism. The total flow of financial resources tothe commercial sector in the current financial yearso far (up to 11 January 2013) has been highercompared to the corresponding period of the previousyear.
1.89 The eight core infrastructure industriesregistered a growth of 3.3 per cent during April-December 2012 compared to 4.8 per cent duringthe same period of the previous year. The decline ingrowth in the current year so far is mainly on accountof negative growth witnessed in the production ofcoal, natural gas, and fertilizers. Among infrastructureservices, freight traffic by railways has beencomparatively higher during the first eight months ofthe current year. In the road sector the NationalHighways Authority of India (NHAI) achieved 17.3per cent growth in widening and strengthening ofhighways during April-November 2012.
1.90 A large number of major central-sector projectscosting ` 150 crore and more are delayed withrespect to their latest scheduled dates of completion.Delays in land acquisition, municipal permission,supply of materials, award of work, operationalissues, etc. continue to bog down projectimplementation.
SERVICES SECTOR
1.91 The services sector is the dominant sector inmost developed economies of the world and in somedeveloping economies such as India. The CAGR ofthe services sector GDP was 10 per cent for theperiod 2004-05 to 2011-12. It has clearly outgrownboth the industry and agriculture sectors. In 2011-12 and 2012-13, in tune with the general moderationin the economy, the growth rate of the services sectoralso declined. The services sector is providing
http://indiabudget.nic.in

24 Economic Survey 2012-13
employment to more people, but employment growthis probably below the desired pace, given howproductive service jobs are (see Chapter 2).
1.92 The slowdown in the rate of growth of servicesin 2011-12, and particularly in 2012-13, from thedouble-digit growth of the previous six years,contributed significantly to slowdown in the overallgrowth of the economy. While some slowdown couldbe attributed to the lower growth in agriculture andindustrial activities, given the backward and forwardlinkages with services, lower demand from the restof the world could also have played a part.
FINANCIAL INTERMEDIATION
1.93 The existence of well-developed and efficientfinancial markets is critical for achieving realeconomic growth. The country now has a vibrantand transparent financial market in terms of marketefficiency, transparency, and price discoveryprocess.
1.94 As far as the banking sector is concerned,the focus continues to be on reform initiatives whichwill facilitate the flow of credit to critical sectors ofthe economy including agriculture, infrastructure,micro, small and medium enterprises, housing, andexport. Financial inclusion and improvedaccessibility of banking infrastructure remain highon the list of priorities of the government. Theperformance of Indian banks during 2011-12 wasconditioned to a large extent by the fragile recoveryof the global financial markets as well as achallenging operational environment on the domesticfront, with persistent high inflation and muted growthperformance. Net profit growth of banks slowed down.Though Indian banks remained well-capitalized,concerns regarding growing NPAs persisted.
1.95 In the overall context of the evolvingmacroeconomic situation in the country and globalfinancial developments, the government in closecollaboration with the RBI and Securities andExchange Board of India (SEBI) has recently takena number of initiatives to meet the growing capitalneeds of the Indian economy. Some of the initiativestaken in this regard are launching of the Rajiv GandhiEquity Savings Scheme (RGESS) and SMEexchange / platform, expansion of the QualifiedForeign Investors (QFIs ) Scheme to facilitate theiraccess to the Indian capital market, progressiveenhancement in the quantitative limits for FIIs'
investments in various debt categories, allowingrefinancing rupee loans through ECB route for Indiancompanies in the power sector, reduction in thewithholding tax on interest payments on ECBs, andintroducing a new ECB scheme for companies inthe manufacturing and infrastructure sector.
1.96 Investment sentiment started improving in thelast few months with foreign investors reposing moreconfidence in the Indian economy in general andmarkets in particular. During the current financial year(up to 31 December 2012), the rise in the indicesstood at 11.62 per cent for the Sensex and 11.51per cent for Nifty. The economic and politicaldevelopments in the Euro-zone area and UnitedStates had an impact on markets around the worldincluding India. The temporary resolution of the 'fiscalcliff' in the US had a positive impact on the markets.Further, the reform measures initiated by thegovernment recently have been received well by themarkets.
HUMAN DEVELOPMENT
1.97 Economic growth though important cannot bean end in itself. The Twelfth Five Year Plan, with itsfocus on 'Faster, More Inclusive and SustainableGrowth', puts the growth debate in the rightperspective. The government's targeted policies forthe poor, with the prospect of fewer leakages, canhelp better translate outlays into outcomes.
1.98 Expenditure on social services by thegeneral government (centre and states combined)has increased in recent years reflecting the higherpriority given to this sector. Expenditure on socialservices increased considerably in the TwelfthPlan, with the education sector accounting for thelargest share, followed by health. As a proportionof GDP, expenditure on social services increasedfrom 5.9 per cent in 2007-08 to 6.8 per cent in2010-11 and further to 7.1 per cent in 2012-13(BE).Nevertheless, India's expenditure on health as aper cent of GDP is lower than in many otheremerging and developed countries and the shareof the public sector still lower.
1.99 Poverty has declined in the country, thoughprecisely how poverty is measured is currentlybeing examined. Based on the methodologysuggested by the Tendulkar Committee, thepercentage of people living below the poverty linein the country declined from 37.2 per cent in 2004-
http://indiabudget.nic.in

25State of the Economy and Prospects
05 to 29.8 per cent in 2009-10. Even in absoluteterms, the number of poor people declined by 52.4million during this period. Of this, 48.1 million arerural poor and 4.3 million urban poor. Thus povertyhas declined on an average by 1.5 percentagepoints per year between 2004-05 and 2009-10.The annual average rate of decline during the period2004-05 to 2009-10 is twice the rate of declineduring the period 1993-94 to 2004-05.1.100 In the last few years public expenditure onsocial programmes increased dramatically. In theEleventh Plan period nearly ̀ 7 lakh crore has beenspent on the 15 major flagship programmes. Anumber of legislative steps have also been taken tosecure the rights of people, like the Right toInformation Act, the Mahatma Gandhi National RuralEmployment Guarantee Act (MGNREGA), the ForestRights Act, and the Right to Education (RTE).However, there are also pressing governance issueslike programme leakages and funds not reachingthe targeted beneficiaries that need to be addressed.Direct benefit transfer (DBT) with the help of theUnique Identification (UID) number can help plugsome of these leakages.
SUSTAINABLE DEVELOPMENT ANDCLIMATE CHANGE
1.101 Though multilateral efforts on sustainabledevelopment and climate change have led to severalpositive outcomes, there are still areas of concern
where further work is needed to safeguard theinterests of developing countries. The key questionto be addressed is equity in the evolvingarrangements. It has to be ensured that domesticgoals continue to be nationally determined even aswe contribute to the global efforts according to theprinciple of common but differentiated responsibilities(CBDR). More importantly, equity, fair burden sharing,and equitable access to global atmosphericresources have to be protected and addressed moreadequately.
1.102 With the Twelfth Plan's focus on'environmental sustainability', India is on the righttrack. However, the challenge for India is to makethe key drivers and enablers of growth – be itinfrastructure, the transportation sector, housing, orsustainable agriculture – grow sustainably. This leadsus to the most vital issue: of raising additionalresources for meeting the need for economic growthwith greater environmental sustainability. More often,it is the resource crunch which is the stumbling blockfor developing countries like India. While it makesefforts to efficiently and expeditiously bring pricesignals and other policy instruments into play, Indiacould do much more if new and additional financeand technology were made available through themultilateral processes. There is a case for greatercooperation, action, and innovation, provision offinance and technology for developing countries, andinstitutions and mechanisms for capacity building.
http://indiabudget.nic.in

Seizing theDemographic Dividend CHAPTER
2
2.1 Growth optimists are confident in India'sdemographic dividend--the fact that India'sdependency ratio, as measured by the share ofthe young and the elderly as a fraction of thepopulation, will come down more sharply in thecoming decades (see Figure 2.1). More workingage people will mean more workers, especially
in the productive age groups, more incomes,more savings, more capital per worker, and moregrowth. Also, because demographic change isassociated with fertility declines, the transitionperiod may be accompanied by greaterfemale part ic ipat ion in the labour force(Bailey, 2006).
Policymakers are usually focused on short-run economic management issues. Butthe short run has to be a bridge to the long run. The central long-run question facingIndia is where will good jobs come from? Productive jobs are vital for growth. Anda good job is the best form of inclusion. More than half our population depends onagriculture, but the experience of other countries suggests that the number of peopledependent on agriculture will have to shrink if per capita incomes in agriculture areto go up substantially. While industry is creating jobs, too many such jobs are low-productivity non-contractual jobs in the unorganized sector, offering low incomes,little protection, and no benefits. Service jobs are relatively high productivity, butemployment growth in services has been slow in recent years. India's challenge is tocreate the conditions for faster growth of productive jobs outside of agriculture,especially in organized manufacturing and in services, even while improvingproductivity in agriculture. The benefit of rising to the challenge is decades of stronginclusive growth.
Sources : World Bank (2012) and authors' calculations.Note : Population dependency ratio is defined as 100-[Population ages 15-64 (% of total)]. This definition follows IMF (2006).
http://indiabudget.nic.in

27Seizing the Demographic Dividend
2.2 Every fast-growing Asian economy in recentyears has accelerated as it underwent ademographic transition (see Figure 2.2). In Indiaitself, Aiyar and Mody (2011) document that the highgrowth states (Tamil Nadu, Karnataka, and Gujarat)in the period 1991-2001 had a dependency ratiowhich was 8.7 percentage points lower than that ofthe low growth states (Bihar, Madhya Pradesh, andUttar Pradesh) and an average annual growth ratethat was 4.3 percentage points higher. Looking ahead,they argue, the low growth states will benefit morefrom the demographic dividend, as higher incomesand lower fertility alter demographics. Indeed, overthe period 2001-11, the hitherto laggard states havegrown at an average of around 5 per cent annually.The difference between their growth and the growthof the leaders in the period 2001-11 is just 1.5percentage points. So demographic transition seemsto be correlated with growth, with some reasons tobelieve that causality flows both ways--lowerdependency ratios increase growth and higher growthreduces fertility and consequently dependencyratios.
2.3 Growth optimists point to another reason forcheer. Cross-country evidence suggests thatproductivity is an increasing function of age, withthe age group 40-49 being the most productivebecause of work experience (Feyrer 2007). Nearlyhalf the additions to the Indian labour force over theperiod 2011-30 will be in the age group 30-49, evenwhile the share of this group in China, Korea, and
the United States will be declining. That India will beexpanding its most productive cohorts even whilemost developed countries and some developingcountries like China will be contracting theirs in thecoming decades can be another source of advantage.
2.4 Growth pessimists are not convinced. A largerworkforce translates into more workers only if thereare productive jobs for it. Will there be enoughproductive jobs? One way to make progress inanswering this question is to understand thecommonalities as well as the differences betweenIndia's growth path and that of other populous fast-growing Asian economies. By comparing where Indiais today, with where those countries were at similarstages in their development, as well as by lookingat what they did next, we might get a betterperspective on what India might need to do. Ofcourse, any such analysis has to be accompaniedby two important caveats. First, countries differ anddo not necessarily follow similar trajectories. Second,the global environment has changed. Theopportunities India faces now are different from thosethat previous fast growers faced when they were ata similar stage of development. Blindly replicatingtheir trajectory may be unwise.
COMPARATIVE GROWTH AND TRADE
2.5 In what follows, we start by analysing variouseconomic outcomes for selected Asian countriesaround their dates of initial 'takeoff' into periods of
Sources : World Bank (2012) and authors' calculations.Notes : Population dependency ratio is defined as 100-[Population ages 15-64 (% of total)]. Per capita income is measuredby Gross Domestic Product (GDP) per capita in 2000 US dollars. The scatter plot drops observations with negative percapita income growth. Selected Asian economies include China, India, Indonesia, and Korea.
http://indiabudget.nic.in

28 Economic Survey 2012-13
high growth. We identify the year of takeoff forcomparator Asian countries based on IMF (2006)1.The dates are 1979, 1973, and 1967 for China,Indonesia, and Korea respectively. For India, wedefine the year of takeoff as 1991, when majoreconomic reforms began. Figures 2.3-2.4 weavetogether the following narrative:
Figure 2.3a shows that India was growing atsimilar rates as other Asian economies beforetakeoff. After takeoff, it kept pace with Indonesia,but China and Korea grew faster.
In Figure 2.3b, we set date 0 as the year thecountry's per capita GDP in 2000 US dollars
1 IMF (2006) defines the takeoff date for China as the year when major economic reforms began. For NewlyIndustrialized Economies (which includes Korea) and for ASEAN-4 (which includes Indonesia), the date isdefined as the year when the 3-year moving average of constant price export growth first exceeded10 per cent.
Sources : World Bank (2012) and authors' calculations.Notes : Takeoff year 0 is defined as the year the country's per capita income crossed $500. The takeoff years are defined as1993, 2003, 1988, and 1951 for China, India, Indonesia, and Korea respectively. Per capita income is measured by GDP percapita in 2000 US dollars.
Sources : World Bank (2012) and authors' calculations.Notes : Takeoff year 0 is defined as 1979, 1991, 1973, and 1967 for China, India, Indonesia, and Korea respectively. Percapita income is measured by GDP per capita in 2000 US dollars.
http://indiabudget.nic.in

29Seizing the Demographic Dividend
crossed $500; in Figure 2.3c, the year thatthe country's dependency ratio fell below 40per cent. China's growth is more robust underboth these alternatives, while India's matchesthat of Indonesia. Korea's trajectory is similarto India's in the initial years after takeoff, thoughafter 10 years the slope of its trajectoryincreases steeply.
In Figure 2.4, we plot an index of a country'sshare of world trade, with year 0 based on ourfirst takeoff definition (1979, 1973, 1967, and1991 for China, Indonesia, Korea, and Indiarespectively). Interestingly, India's growth in
its share of world trade is similar to China's andgreater than Indonesia's at similar periods aftertakeoff. India's openness is also evidenced bythe trade to GDP ratio, which exceeded 55 percent in 2011. By contrast, this ratio is only31 per cent for the United States.
2.6 The takeaway from the evidence we haveexamined thus far is that India's growth performancehas been similar to that of some fast-growing Asianeconomies at similar stages after takeoff, but not asspectacular as China's. Interestingly, despite beingseen as a trade laggard, India has grown more opento trade at about China's pace.
Sources : IMF (2011) and authors' calculations.Notes : Takeoff year 0 is defined as 1979, 1991, 1973, and 1967 for China, India, Indonesia, and Korea respectively. Sharein world trade is measured by the sum of a country's exports and imports of goods and services as a ratio of world trade(measured by the average of world exports and imports).
Sources : World Bank (2012) and authors' calculations.Notes : Takeoff year 0 is defined as the year the country's dependency ratio fell below 40 per cent. The takeoff years aredefined as 1981, 1996, 1990, and 1977 for China, India, Indonesia, and Korea respectively. Per capita income is measuredby GDP per capita in 2000 US dollars.
http://indiabudget.nic.in

30 Economic Survey 2012-13
Sources of Growth
2.7 What have been the sources of growth in India,and how does it compare with other fast growingAsian economies? Growth in per capita income isdriven by growth in labour productivity (what theaverage worker produces), growth in working agepopulation (fewer the people who are in the dependentage group in the population, greater the output),growth in the fraction of those who can work thatactually look for work ( labour force participation rate),and growth in those looking for work who actuallyfind it (employment rate). Because accurateemployment data are hard to find for developingcountries, studies typically ignore the employmentrate in decomposing the sources of growth.
2.8 A decomposition of per capita income growthduring the 20 years after takeoff (see Figure 2.5)suggests that across countries, much of the increasein per capita income comes from greater labourproductivity. Interestingly, except for Korea, labourforce participation (LFP) has fallen on an averageannual basis, so it subtracts from growth. Finally,the increase in the share of working age population(WAP) seems to add only a little to growth. Sincethe increase in working age population is what wecall the demographic dividend, the fact that itcontributes so little to growth (on average, 0.5percentage points for India in the 20 years since1991) may seem a puzzle.
2.9 The resolution to the puzzle is quite simple.The increase in the fraction of people working isprobably not the main consequence of the
demographic dividend. Instead, the effects of thedemographic dividend are channelled through theincrease in labour productivity, which comes frommore physical capital employed per worker (in turnresulting from greater saving and investment), morehuman capital per worker (which comes from moreeducation as smaller families lead to greaterspending on education per child), and greater totalfactor productivity (TFP). TFP measures howproductive the job intrinsically is, capturing aspectssuch as the technology used, efficiency with whichthe work is carried out, and use of hard-to-measureaspects of work such as tacit knowledge,organizational capabilities, and trust.
2.10 It is therefore useful to see how much each ofthese factors contributed to labour productivity. AsFigure 2.6 suggests, better human capital accountsfor only a small part of the growth in labour productivityfor Asian fast growers. Instead, the two biggestcontributors are the growth in capital deployed perworker and growth in TFP. Indonesia and Korea reliedmuch more on capital deepening. India did not haveas much growth in capital per worker as thesecountries but had stronger growth in TFP. Finally,China grew both because of more capital deployedas well as strong increases in TFP.
2.11 Interestingly, as Figure 2.7 suggests, in theyears beyond the 20th year after takeoff which Indiais now entering, capital deepening slowed for bothIndonesia and Korea but it increased for China. Moreinterestingly, TFP slipped considerably for Indonesiaand was not large for Korea to begin with. However,it increased for China.
Source : Authors'calculations.Note : Takeoff year 0 is defined as 1979, 1991, 1973, and 1967 for China, India, Indonesia, and Korea respectively.
http://indiabudget.nic.in

31Seizing the Demographic Dividend
2.12 In sum, the underpinnings for continued strongChinese growth in the years beyond the seconddecade after takeoff are a robust investment rate aswell as substantial increases in the intrinsicproductivity of jobs. If India were to follow a similarpath, it would need to increase savings andinvestment, both of which will follow from thedemographic transformation. But it will also have toincrease the intrinsic productivity of jobs, that is TFP.
Increasing Labour Productivity and SectoralReallocation
2.13 IMF (2006) suggests that a significant portionof China's increase in TFP has come as workersmigrate from low-productivity sectors like agricultureto high-productivity sectors like manufacturing. Whatlies ahead for India? To see how TFP in India can beincreased, consider Figure 2.8 from Hasan et al.
Sources : Authors' calculations from a standard growth decomposition exercise. Capital stock data are from Nehru andDhareswar (1993) extended using perpetual inventory method and a depreciation rate of 5 per cent. Labour share isassumed to be 0.65. Human capital is related to average years of schooling assuming 7per cent returns to schooling(following Bosworth and Collins 2003).Note : Takeoff year 0 is defined as 1979, 1991, 1973, and 1967 for China, India, Indonesia, and Korea respectively.
Sources : Authors' calculations from a standard growth decomposition exercise. Capital stock data are from Nehru andDhareswar (1993) extended using perpetual inventory method and a depreciation rate of 5 per cent. Labour share isassumed to be 0.65. Human capital is related to average years of schooling assuming 7per cent returns to schooling(following Bosworth and Collins 2003).Note : Takeoff year 0 is defined as 1979, 1991, 1973, and 1967 for China, India, Indonesia, and Korea respectively.
http://indiabudget.nic.in

32 Economic Survey 2012-13
2 While this section focuses on the experience of Asian countries since takeoff, another interesting examplefrom Africa is that of the Mauritian miracle, where clear sectoral shifts fuelled high growth (Box 2.6).
(2012). Eleven sectors of the Indian economy arearranged by labour productivity in 2009. The heightof the rectangle indicates the productivity of thesector, while the width indicates the share of thelabour force it employs. Agriculture is very lowproductivity but employs over half the labour force.In contrast, financial and brokerage services are themost productive sector in the economy, but employa tiny share of the labour force.
2.14 That so many continue to be dependent onagriculture is one reason that the government hasfocused on improving productivity in agriculture, evenwhile attempting to support incomes of both farmersand workers through various programmes.Agricultural productivity remains low probablybecause too many agricultural workers work withrelatively fixed and limited amounts of productiveassets--land and capital (irrigation, technology,tractors, machinery, and the like). One way toincrease labour productivity, therefore, is to increaseinvestment (and thus capital per employee) acrossall sectors, including agriculture.
2.15 An equally effective way of increasing laborproductivity might be to increase TFP--by movingsome of those dependent on low-productivityagriculture to higher-productivity jobs in industry orservices. This would also allow those who remain in
agriculture to farm larger, more viable plots,employing more mechanized equipment to improvelabour productivity. Clearly, more investment inworker-receiving sectors will be needed to keep upthe capital per employee, but the typically greaterTFP in those sectors will also mean much greateroutput per capita. Continuing reallocation of workersout of low-productivity sectors into higher-productivitysectors is akin to increasing TFP and can thereforebe a growth engine2.
2.16 How has India done on reallocating workers?We plot sectoral shares of employment and sharesof value added in the years since takeoff. First takeagriculture. India certainly has a bigger share ofemployment in agriculture today than the other Asiancountries, but perhaps only because it has not hadas many years since takeoff. Figures 2.9a and 2.9bsuggest employment share and value added sharein agriculture in India is coming down at a similarpace as in the other Asian economies (though Koreaseems to have a lower share of people in agriculturefrom the time we have data). Extrapolating into thefuture, if India followed China's or Indonesia's path,about a 10 percentage point share of overallemployment would move out of agriculture in thenext 10 years, bringing the share of employment inagriculture down to about 40 per cent.
Source : Hasan et al. (2012).Notes : UNREG: Unregistered manufacturing, CONST: Construction, CSP: Community, social and personal services, WRT:Wholesale—retail trade and restaurants—hotels, TSC: Transport, storage and communications, GOV: Government services,MIN: Mining and quarrying, REGMFG: Registered manufacturing, PU: Public utilities, FIRE: Finance, insurance and realestate.
http://indiabudget.nic.in

33Seizing the Demographic Dividend
2.17 Turning next to industry, we see greaterdifferences (see Figures 2.10 a and 2.10 b). Whilethe growth in India's share of employment in industryseems to be on par with the growth of other Asianeconomies at similar stages (with the exception ofKorea), the surprising fact is that India's share ofvalue added in industry has not grown to keep pacewith its share of employment--it has in fact recentlyfallen. Contrast this picture with China's where theshare of value added in industry has always beenvery high relative to its share of employment, or
Indonesia's and Korea's where the share of valueadded has kept increasing as the share ofemployment has increased (e.g. for Indonesia) oreven decreased (e.g for Korea). The alarmingconclusion is that while workers are being added toindustry in India, the productivity of the jobs they aregoing into has not been high. In part, this is becausethe data we work with treats low-productivityconstruction as a part of industry, and the boomingconstruction sector has accounted for a large shareof the jobs created in industry. However, an additional
Sources : World Bank (2012) and authors' calculations.Note :Takeoff year 0 is defined as 1979, 1991, 1973, and 1967 for China, India, Indonesia, and Korea respectively.
Sources : World Bank (2012) and authors' calculations.Note : Takeoff year 0 is defined as 1979, 1991, 1973, and 1967 for China, India, Indonesia, and Korea respectively.
http://indiabudget.nic.in

34 Economic Survey 2012-13
problem is that few of the jobs in industry are formalor being created by the comparatively moreproductive large firms (see discussion below).
2.18 Finally, consider services in Figures 2.11 aand 2.11 b. Here the picture for India is mixed. Whilethe share of employment in services has beengrowing very slowly, the share of value added issignificantly higher than in other Asian economies.Indeed, China has a similar share of employment inservices at a similar time from takeoff even thoughits share of value added is much lower. A big factor
in India's larger services share is that services startedout at the time of take-off with a much larger share,but growth has also been strong.
2.19 These sectoral pictures across countriessuggest several important messages:
Unlike the conventional wisdom, India does nothave more people in agriculture than other Asiancountries at similar stages of development. Theshare of workers dependent on agriculture hasbeen shrinking at a similar pace.
Sources : World Bank (2012) and authors' calculations.Note ; Takeoff year 0 is defined as 1979, 1991, 1973, and 1967 for China, India, Indonesia, and Korea respectively.
Sources : World Bank (2012) and authors' calculations.Note : Takeoff year 0 is defined as 1979, 1991, 1973, and 1967 for China, India, Indonesia, and Korea respectively.
http://indiabudget.nic.in

35Seizing the Demographic Dividend
However, the pace of shrinkage is set to increaseif India is to follow the trajectory of these othercountries.
One problem is that while industry is creatingjobs, these have been relatively low-productivityjobs. As a result, per capita income in India hasnot benefited as much from inter-sectoralmigration of workers out of agriculture as otherAsian countries have.
A second problem is that the high-productivityservices sector is not able to create employmentcommensurate with its growth in value added.
How many jobs will be missing?2.20 Clearly, there is a coming transition of workersout of agriculture if we follow the path of other Asiancountries. In addition, the demographic dividend willensure more workers joining the labour force. Howmany workers will industry and services have toabsorb in the next decade? How many will theyabsorb if they continue creating jobs as they have inthe past? Could the demographic dividend turn intoa demographic curse as some have argued?
2.21 In order to answer this question, we build afew simple scenarios using data from the World
Sources : World Bank (2012) and authors' calculations.Note : Takeoff year 0 is defined as 1979, 1991, 1973, and 1967 for China, India, Indonesia, and Korea respectively.
Sources : World Bank (2012) and authors' calculations.Note : Takeoff year 0 is defined as 1979, 1991, 1973, and 1967 for China, India, Indonesia, and Korea respectively.
http://indiabudget.nic.in

36 Economic Survey 2012-13
Development Indicators (WDI) and UN PopulationDivision. In the baseline (Table 2.1, column I), weassume that employment in industry and serviceswill grow during 2010-20 at the same rate as duringthe previous decade. The share of employment inagriculture will fall to 40 per cent by 2020 (the samelevel as that of China in 2010). Population in theworking age group will grow based on projections bythe UN Population Division. We assume the labourforce participation rate and the unemployment rateto be unchanged at 2010 levels. Under this baselinescenario, 2.8 million jobs will be missing by 2020.To put this in perspective, this will only be 0.5 percent of the labour force. While any shortfall in jobsis problematic, there does not seem an immediatecause for alarm.
2.22 A large number of assumptions go into thisestimate. For instance, labour force participation ispegged at the 56 per cent rate, the same as in 2010.If instead more women enter the labour force,reversing the declining trend since 2000, the labourforce participation rate could plausibly increase to58 per cent by 2020. This is lower than the 60 percent rate in 2000, but even with this conservativeassumption, the number of missing jobs increasesto 16.7 million (see Table 2.1, Column II), roughlysix times that in the baseline scenario, and 3.7 percent of overall employment in 2010. Finally, if theofficial unemployment is projected to decrease, sayby 2 percentage points, over the next decade, again
that would imply the need to employ a larger numberof workers (see Table 2.1, Column III). The numberof missing jobs in 2020 under this higher expectedemployment scenario is estimated at 11.8 million orfour times that in the baseline scenario.
2.23 The back-of-the-envelope calculations justdone should be taken as just that--a starting pointfor more careful investigation. While a simpleextrapolation of existing trends suggests India canabsorb the labour exiting agriculture even if exitsincrease to the level experienced by China, there isno room for complacency. Minor changes inassumptions lead to tens of millions of additionaljobs needed. So even while policymakers focus onmaking jobs more productive, India also needs morejobs than suggested by current trends so as to havea sufficient buffer.
WHY IS BUSINESS NOT CREATINGMORE PRODUCTIVE JOBS?2.24 In India, too many small firms stay small andunproductive and are not allowed to die gracefully.Too many large profitable firms prefer relying ontemporary contract labour and machines than ontraining workers for longer-term jobs. This sectionhas two parts--in the first, we will examine theimpediments to the formalization and growth of smallbusinesses. In the second, we will examine thesituation of labour, and why large formal businesses
Table 2.1 : How Many Jobs Will be Missing? Alternative Scenarios2000 2010 2020
[I] [II] [III]Baseline High Labor Low
Force Unemploy-Participation ment Rate
Share of employment in agriculture (%) 60 51 40 40 40Share of employment in industry (%) 16 22Share of employment in services (%) 24 27Labor force participation rate (%) 60 56 56 58 56Population (15+) (in millions) 688 850 1,010 1,010 1,010Labor force (in millions) 409 473 561 586 561Employment (in millions) 392 456 541 565 552Employment/labor force (in %) 96 96 96 96 98Employment in agriculture (in millions) 234 233 217 226 221Employment in industry (in millions) 63 102 165 165 165Employment in services (in millions) 94 121 154 154 154
Missing jobs (in millions) 2.8 16.7 11.8
Sources : World Development Indicators, UN Population DivisionNotes : LFP rate in WDI defined as labor force /population 15+
http://indiabudget.nic.in

37Seizing the Demographic Dividend
may be so averse to hiring. We use the term'business' advisedly because similar problems mayexist in construction, manufacturing, and services,though to differing degrees.
Impediments to the emergence and growthof business2.25 As a group, it is estimated that micro, small,and medium enterprises (MSMEs)3 employ 81million people in 36 million units across the country4.Yet, many of these firms are unable to grow and/oreven shut down. Hsieh and Klenow (2011) indicatethat as compared to surviving small firms in the UnitedStates, which grow spectacularly, surviving small firmsin Mexico grow moderately, while surviving smallfirms in India shrink. Productivity is commensuratelylower in India. Indeed, within the MSME group, thereis a strong concentration of small enterprises andnear non-existence of medium enterprises (seeFigure 2.12). And that is the real challenge of theMSME sector--to be able to not just start up, butalso continue to grow, thereby becoming a sourceof sustainable jobs and value creation.
2.26 Too many firms in India stay small,unregistered, unincorporated, largely informal, or inthe unorganized sector because they can avoidregulations and taxes. These firms have littleincentive to invest in upgrading skills of largelytemporary workers or in investing in capital equipment
that could bring them into the tax net, so theirproductivity stays low. Low productivity gives themlittle incentive to grow, completing the vicious circle.Figure 2.13 indicates some of the key challengesfaced by these firms while starting up and at everylevel of growth.
Regulations
2.27 The regulatory environment plays an importantrole in the lifecycle--birth, growth, and death--ofMSMEs. According to the World Bank's DoingBusiness 2013 data, India ranks 132 out of 185countries in ease of doing business. Starting abusiness where India ranks 173, takes about 12procedures, 27 days, and a paid up capital of 140per cent of per capita income. By contrast, it takesonly 7 procedures, 19 days, and 18 per cent of percapita income on average for our neighbours in SouthAsia.
2.28 After getting done with the initial procedures,entrepreneurs have to obtain a number of clearanceswhen applying for building/occupancy permits andutility connections. These require separate visits tovarious authorities whose employees often inspectthe site. It takes as long as 1.5 months to obtain anelectricity connection in 7 out of the 17 benchmarkedIndian cities. Many processes especially at statelevel remain complex, forcing companies to hire aconsultant, thereby adding to the costs.
3 The criterion of investment in plant and machinery is used to categorize MSMEs—micro enterprises haveinvestment ceiling of 25 lakh, small enterprises of 5 crore, and medium enterprises of 10 crore.
4 These data are from the Ministry of Micro, Small, and Medium Enterprises and include registered andunregistered units across manufacturing and services (including wholesale/retail trade, legal, educational,and social services, hotels and restaurants, transport, and storage and warehousing).
Sources : Fourth All India Census of Micro, Small and Medium Enterprises, 2006-07: Registered Sector; PlanningCommission, 12th Five Year Plan Draft.
http://indiabudget.nic.in

38 Economic Survey 2012-13
2.29 The MSME ecosystem needs an easierprocess of exit, where the claims of workers andfinanciers are quickly resolved and the assets of thefailed firm put to better use. According to World Bank(2009), across 17 Indian cities, the insolvencyprocess takes on average 7.9 years, costs 8.6 percent of the estate value (mostly due to attorney fees,newspaper publication costs, liquidator's fees, andpreservation costs), and the recovery rate is only
13.7 per cent. The process is slower even than inother South Asian countries where, in the same year,it took on average five years and creditors couldexpect to recover on average 19.9 per cent. Lowasset recovery in failed firms feeds into lower levelsof financing for Indian MSMEs.
2.30 The government has tried to compensate forsome of these impediments by offering MSMEs
Source : Ministry of Micro, Small, and Medium Enterprises
http://indiabudget.nic.in

39Seizing the Demographic Dividend
incentives and concessions. But schemes andinterventions based on tightly defined classificationscreate an incentive structure that might prevent firmsfrom growing. Service tax exemptions for firms withless than Rs 10 lakh revenue and exemption fromcentral excise duty for firms with an annual turnoverof less than Rs 1.5 crore are examples of theseschemes. The jump from 'small' to 'medium'enterprise especially entails loss of several perks(see Figure 2.14).
2.31 There are, however, also many good practicesand enabling regulations strewn over different citiesof India, which, if standardized and adopted acrossthe country, can improve the business climateenormously. Indeed, World Bank (2009) has shownthat if a hypothetical city called 'Indiana' were toadopt best practices found in several benchmarkedcities (e.g. lowering number of procedures to startbusiness to Patna levels, days to start a businessto Mumbai levels, procedures around constructionpermits to Ahmedabad levels, days to enforce acontract to Guwahati levels, and recovery rate forclosing a business to Hyderabad levels), it wouldrank a much improved 67 out of the 181 economiesmeasured by Doing Business 2009.
Getting funding
2.32 Banks and other financial institutions are waryof lending to MSMEs because they lack adequatecredit histories or collateral. A cluster-centricapproach is one way of addressing this because itreduces transactions costs for the lender, whilerepeated interactions for a lender with clustermembers increases the scope for building trust.While there have been efforts to facilitate these, theircoverage is still small. Schemes such as creditguarantees by the Small Industry Development Boardof India (SIDBI) have been useful, but there are gaps.
2.33 Angel investors, venture capital funds, andimpact investors are still at a nascent stage andsmall compared to global peers. Most of theseinvestments are biased towards services, especiallytechnology and e-commerce. Government funds(through grants and seed funding programmes suchas Technopreneur Promotion Programme andTechnology Development Board) are often availableafter extensive paperwork and slow processing.Moreover, the experience from other countries is thatnew venture finance is often an activity better left tothe private sector, with the government facilitatingthe way or piggy-backing on private funding ratherthan actually taking the lead.
2.34 Large banks with remote central offices tendto have bureaucratic procedures for loan approvals,and limit discretionary authority for branch officers.As a result, small and medium enterprises, whichtend to have short and largely informal track records,find it hard to fulfil the norms for obtaining credit (seeBerger et al., 2005). Moreover, conversations withbankers and business people suggest that largebanks exert less effort in trying to help a small troubledfirm than they would a larger client. As a result, incountries with more varied banking systems, smallfirms tend to migrate to smaller banks for assistance(see Berger et al., 2005). More small local banks inIndia could help MSMEs.
2.35 Finally, a vibrant corporate bond market couldalso help. Even though the MSMEs will typically notbe able to issue bonds, the fact that large firms andinfrastructure projects will be able to access (typicallycheaper) bond financing for their long-term needs,will free up space on bank balance sheets for MSMEloans.
Getting access to quality infrastructure
2.36 The absence of quality infrastructure—roads,utilities, real estate, logistics—increases transactioncosts disproportionately for MSMEs which typicallycannot create customized alternatives such asaccess roads and captive power plants which largerfirms can. Lack of this supporting infrastructurecauses greater cash burn and distraction ofmanagement from core business operations. Oneconstraint in creating infrastructure or setting upbusinesses is land acquisition. A number of reformsare needed or on the anvil (see Box 2.1) to ensurethat land is less of an impediment to growth.
2.37 Going forward there is hope that massiveinfrastructure projects like the Delhi-MumbaiIndustrial Corridor (DMIC) (Box 2.2) will providerelatively light regulation, and heavy infrastructure,where businesses have easy access to the land theyneed and workers can live in a safe healthy township.
2.38 We have described the major non-labourimpediments for a small business to become formaland grow large, as well as some steps the governmentis taking. There is evidence that these constraintsaffect industrial performance. Classifying industriesaccording to their intensity of use of infrastructure,or dependence on external finance, Gupta et al.(2008) find that post delicensing, industries moredependent on infrastructure grew less as compared
http://indiabudget.nic.in

40 Economic Survey 2012-13
Box 2.1 : Land ReformsLand is probably the single most valuable asset in the country today. Not only could greater liquidity for land allow moreresources to be redeployed efficiently in agriculture, it could ease the way for land-utilizing businesses to set up. Perhaps asimportant, it could allow land to serve as collateral for credit. Three important needed steps are: to map land carefully andassign conclusive title, to facilitate land leasing, and to create a fair but speedy process of land acquisition for publicpurposes.
The National Land Records Modernization Programme (NLRMP) which started in 2008 aims at updating and digitizingland records by the end of the Twelfth Plan. Eventually the intent is to move from presumptive title—where registration ofa title does not imply the owner’s title is legally valid—to conclusive title, where it does. Digitization will help enormously inlowering the costs of land transactions, while conclusive title will eliminate legal uncertainty and the need to use thegovernment as an intermediary for acquiring land so as to ‘cleanse’ title. Given the importance of this programme, its rolloutin various states needs to be accelerated. Easier and quicker land transactions will especially help small and mediumenterprises that do not have the legal support or the management capacity that large enterprises have.
Widespread prohibition of land leasing raises the cost to rural-urban migration as villagers are unable to lease their land, andoften have to leave the land untilled or leave a family member behind to work the land. Lifting these restrictions can help thelandless (or more efficient landowners) get land from those who migrate, even while it will allow landowners with educationand skills to move to industry or services. Compulsory registration of leaseholds and of the owner’s title would providetenants and landowners protection. Of course, for such a leasing market to take off, owners should be confident that long-term tenancy would not lead to their losing ownership. With a vibrant leasing market, and clear title, there should be littlereason for not strengthening ownership rights.
For large projects with a public purpose—such as the proposed National Industrial and Manufacturing Zones, which willfacilitate the setting up of small and medium enterprises—large-scale land acquisition may be necessary. Given that thepeople currently living on the identified land will suffer significant costs including the loss of property and livelihoods, abalance has to be drawn between the need for economic growth and the costs imposed on the displaced. The Right to FairCompensation and Transparency in Land Acquisition, Rehabilitation and Resettlement Bill 2011, currently before Parliament,attempts to draw such a balance. As experience is gained with large-scale land acquisition, the institutions set up by the billcan be fine-tuned to achieve its aims.
Finally, encouragement needs to be given to land readjustment schemes, where when an area is identified for development,owners participate by giving up some of their land for infrastructure creation, but get back the rest, with the benefit that itsvalue is enhanced by the infrastructure. Small and medium enterprise clusters can benefit especially from such schemes.Given that large-scale land acquisition is still at a nascent stage, central schemes should allow room for states to experimentand should be modified in light of state experiences.
Box 2.2 : The DMIC: An Integrated Approach to Industrial Growth and Development*
The DMIC is being developed by the Government of India with a view to using the high-capacity western Dedicated FreightCorridor as a backbone for creating a global manufacturing and investment destination. The project seeks to develop a seriesof futuristic infrastructure-endowed smart industrial cities that can compete with the best international manufacturing andindustrial regions. The master plan has a vision for 24 manufacturing cities. Potential production sectors include generalmanufacturing, IT/ITES components, electronics, agro and food processing, heavy engineering, pharmaceuticals,biotechnology, and services. Investment is pegged at $90 billion. The DMIC was conceived by the Ministry of Economy,Trade, and Industry (METI) of Japan and the Ministry of Commerce and Industry (MoCI) of India.
Possible socio-economic impact: The DMIC Project Influence Area of 436,486 sq. km is about 13.8 per cent of India’sgeographical area. It extends over seven states and two union territories, viz. Delhi, Uttar Pradesh, Haryana, Rajasthan,Madhya Pradesh, Gujarat, Maharashtra, Daman and Diu, and Dadra and Nagar Haveli. Around 17 per cent of the country’stotal population will be affected. The project goals are to double employment potential in 7 years, triple industrial output in9 years, quadruple exports from the region in 8-9 years, and target 13-14 per cent growth per annum for the manufacturingsector on a sustained basis over next three years.
Urban governance: The innovative urban governance framework corporatizes the urbanization process. The central governmentwill create a corpus fund, the DMIC Project Implementation Revolving Fund, as a trust administered by a board of trustees.The fund will contribute debt and equity to the special purpose vehicles (SPVs) on a case-by-case basis. The state governmentwill make land available. The city SPVs will be vested with the responsibilities of planning and development and the powerto levy user fees. The SPVs are to be companies under the Companies Act. The valuation increases from urbanization anddevelopment will accrue to the city-level SPVs, and will be reinvested in the cities. The initial construction of the cities will bedone through project managers with global experience, who will control, monitor, review, and supervise the detailedengineering.
Financing: The basic provision of trunk infrastructure is unlikely to be commercially viable. This would require governmentfunding. Such internal infrastructure projects include land improvement, road works, earthworks, sewerage, storm waterdrainage, flood management, and solid waste management. Once such infrastructure is in place, the subsequent additionsto the cities will be commercially viable and can be implemented through public private partnerships (PPPs). For major
(Contd....)
http://indiabudget.nic.in

41Seizing the Demographic Dividend
Box 2.2 : The DMIC: An Integrated Approach to Industrial Growth and Development* (Contd...)
Source: Delhi-Mumbai Industrial Corridor Development Corporation Limited
infrastructure activities such as power plants, integrated townships, and highways, PPP projects are planned. Varioussources of finance including multilateral, bilateral, and domestic government funding are planned.
Physical infrastructure: At the heart of the infrastructure is the Multi-modal High Axle Load Dedicated Freight Corridor(DFC), a high-capacity railway system. It will cover 1483 km and will have nine junction stations along which other railroadnetworks will connect allowing the system to extend its reach across a wide swathe. Other infrastructure plans includelogistic hubs, feeder roads, power generation facilities, up-gradation of existing ports and airports, developing greenfieldports, environment protection mechanisms, and social infrastructure.
Industrial infrastructure: The project seeks to upgrade existing industrial clusters and also develop new industrialfacilities. These will be developed on the concept of node-based development based on Investment Regions (IRs) andIndustrial Areas (IAs). These are proposed as self-sustaining industrial townships with world-class infrastructure includingdomestic/international air connectivity, reliable power, and competitive business environment. IRs will have a minimumarea of 200 sq. km and IAs 100 sq. km. In all 24 manufacturing cities (IRs and IAs) are planned. Seven major manufacturingcities are being planned for the first phase. These will serve as the key nodes for overall growth and development.
Skill development: The skill-building strategy underlying the DMIC is based on a hub-and-spoke model. There will be oneSkill Development Centre in every state with subsidiary institutions linked to it. Curricula will be based on the types ofindustries located in the region and identified regional strengths.
Land acquisition: Land acquisition appears to be a major challenge. Different state governments are adopting diverseapproaches for dealing with the issue. Gujarat has a land-pooling model whereby 50 per cent of the land is acquired while theremaining 50per cent is left with the original owners giving them a stake in the upsides generated by land monetization.Maharashtra allows for negotiated purchase involving various stakeholders. In Haryana and Rajasthan, trunk and industrialinfrastructure are created by the state governments but private developers directly participate in the other activities. Thevalue increase is captured by the states through development fees. Furthermore, in the initial DMIC master-planning process,the attempt was made to identify large, easy-to-acquire land parcels that were either barren or government owned.
Environmental clearances: The master-planning process has been applied for a general Terms of Reference clearance, whichhas already been obtained. This has reduced the compliance load for individual project clearances. The individual projectswill now need to get their draft impact assessments cleared by the respective state pollution control authorities.
Power infrastructure: Power for the industrial and residential zones is an essential requirement. The provision of world classpower infrastructure will require 24X7 good quality supply. The major power inputs will come from six gas-based projectsof around 1000-1200MW each. Other power options include the use of renewable energy sources integrated through a smartgrid.
Water management: The DMIC passes through relatively arid parts of the country. The various industrial hubs are to haveintegrated water resource management plans drawing upon lessons from countries such as Singapore. It is proposed tomake each manufacturing city self-reliant and sustainable in terms of its water requirements. Recycling is a major strategyin all the industrial nodes.
*Prepared by Supriyo De. Thanks are due to Amitabh Kant, Chief Executive Officer and Managing Director andAbhishek Chaudhary, Vice-President, Delhi-Mumbai Industrial Corridor Development Corporation Limited forvaluable insights.
Delhi-Mumbai Industrial Corridor and its influence area
http://indiabudget.nic.in

42 Economic Survey 2012-13
to industries which are not as dependent oninfrastructure; and the gain in manufacturing-sectoroutput in these industries has been especially smallin states with inferior infrastructure. They further showthat industries more dependent on external financehave witnessed slower growth as opposed to thoseless dependent on external finance, and have faredmuch worse in terms of new factories, employmentgeneration, as well as new investment. There istherefore need to take steps for improvinginfrastructure, access to finance, as well as theoverall business environment. Box 2.3 summarizessteps that could be taken to improve the businessenvironment.
Labour Practices as Possible Impedimentsto Growth2.39 Thus far we have not examined labourpractices directly. India has a number of labourpractices that, economists have argued, furtherimpede the creation of productive jobs in the large-
scale organized sector. There exists considerablevariation in hiring practices across firms of differentsizes in India. Dougherty (2008) uses a methodologysimilar to Davis et al. (1998) and data up to 2004 toestimate the employment dynamics in the organizedmanufacturing sector in India. The study finds thatthe job creation rate is much bigger for small firmsthan for large ones; on the other hand the jobdestruction rate is higher in large firms, with the resultthat the net employment rate in large firms is negativeand strikingly smaller than in small firms.
2.40 Similarly, organized industry creates few jobscompared to unorganized industry (which isdominated by small firms) (see Figure 2.15). Growthin unorganized industry jobs in 2009-10 is primarilyexplained by a dramatic growth in construction.Based on data from National Sample SurveyOrganization (NSSO) surveys, employment inconstruction increased by 70 per cent between 2004and 2009. One recent development is also the
Box 2.3 : The Nuts and Bolts of Improving Business Climate for Small Businesses*There are several regulatory changes that can be made to improve the business climate for MSMEs.
Formulate a common policy on business development and regulation: There are a vast number of business regulationsthat often overlap and sometimes contradict each other. A common policy and an institutional architecture overseeing allbusiness regulations will help consolidate and enact changes.
Help business facilitation: Establish independent facilitation and coordination agencies as PPP service companies withmandate from the state government, staffed with specialists and responsible for getting work done through various departmentsfor starting up and running of businesses. These agencies will also help arrange services such as financing, finding rawmaterial suppliers, and marketing products. They will charge a fee for some of the services provided, and be financially self-sufficient.
Simplify registrations for starting up: Create a one-stop online registration system for time-bound registrations forstarting a business. The applicant will need to file a single application on the website, with the required information beingpicked up by each government department. Over time, this process can be extended to other activities such as trading acrossborders and paying taxes. This will require detailed mapping exercises and setting up of a ‘best practices’ framework.
Ease burden of compliance as the firm grows: Enable compliance ratings of MSMEs (through ISO-like common standards)and allow easier compliance norms to firms with higher ratings. Easier norms can take the form of simpler procedures (suchas self-certification) across government departments. For instance, a company with a good history of tax compliance shouldbe treated as a good citizen when it deals with the pollution control board. Over time, high compliance ratings could also actas a signal to financiers and enable easier access to credit.
Allow for easy exits: The arduous process of exit for unsuccessful companies needs to be made simpler, faster, and cheaper.
Transform employment exchanges to enable effective job matching: Transform the 1,000-odd employment exchangesacross states into career centres offering counselling, assessments, apprenticeships, training, and jobs.
Improve value/benefits from statutory pre-emptions: Currently for low wage workers in formal employment, the plethoraof statutory pre-emptions, especially for provident fund and health insurance, can lead to very low net salary and act asdisincentive to formal employment. The value and benefits received from these pre-emptions can be improved by encouragingcompetition between different pension and health schemes.
Reduce attractiveness of staying small: Growing bigger is unattractive because some of the benefits targeted at MSMEs arewithdrawn even while new regulations and obligations kick in. Innovative approaches are needed for giving MSMEs theincentive to grow. For instance, new regulations could be kept in abeyance for a period after the MSME crosses the sizethreshold that would require it to meet the regulation.
* Prepared by Pranjul Bhandari.
http://indiabudget.nic.in

43Seizing the Demographic Dividend
Source : Economic Survey (various years); Employment and Unemployment Situation in India (various years), NSSO,Ministry of Statistics and Programme Implementation (MOSPI); Census of India.Notes : Industry includes manufacturing, construction, mining, and utilities. Organized-sector employment is obtained fromthe Economic Survey. The organized sector consists of non-agricultural establishments in the private sector that have 10workers or more, and all establishments irrespective of size in the public sector. For the other subsectors within industry,the organized sector essentially refers to all companies and government administrations. Unorganized-sector employmentis estimated by deducting estimates of organized employment from total employed workforce. Total employment is generatedby multiplying the worker population ratio (from the NSSO Employment-Unemployment Surveys) by the estimated populationof India as per Census sources.
significant pickup in growth in organized industry-sector jobs in 2009-10. However, two points may beof note. First, this growth is characterized by addingmostly to 'informal' jobs within the formal sector withlittle increase in productivity (see Box 2.5 for details).Second, despite the recent pickup in organized-sectorjob growth, unorganized-sector employment stillconstitutes more than 95 per cent of overall industryemployment; specifically within manufacturing,unorganized-sector employment comprises 70 percent of overall employment (see Box 2.4 for details).
2.41 Why is large organized manufacturing notcreating more jobs? There are several possibleexplanations. First, strict labour laws may havehindered the growth of organized large-scalemanufacturing (see the evidence in Box 2.4suggesting labour regulations may be keyimpediments to manufacturing growth). The labourlaws India has on the books are more rigid than inmost countries--the employment protection legislation(EPL) laws are stricter than in all but two OECDcountries. However, very few workers are actuallycovered by these laws. Indeed, India may suffer theconsequences of strong worker protection (lowflexibility for employers and strong reluctance to offerworkers formal jobs) without giving most workers thebenefits. Although the direct impact of India's labourregulations has been a subject of intense debate,there is a substantial body of evidence described in
Box 2.4, using variation across states' stance onregulations, which suggests that rigid labourregulations have played a significant role inexplaining low organized manufacturing output andemployment and high informal manufacturing output.
2.42 Some economists however, dispute theevidence that establishes the importance of labourregulations in determining economic outcomes. Inthe case of India, for example, one of the first andmost frequently cited studies on the topic, Besleyand Burgess (2004), has come under criticism, mostextensively from Bhattacharjea (2006). While morework has been done that addresses some of thesecriticisms, the evidence on the effects of labourregulations outside of India is also mixed. Accordingto World Bank (2013), ‘A careful review of the actualeffects of labor policies in developing countries yieldsa mixed picture. Most studies find that impacts aremodest— certainly more modest than the intensityof the debate would suggest.’
2.43 If indeed labour laws constrain firms, theywould respond in predictable ways, (i) relying moreon capital instead of labour, (ii) resorting to informalarrangements / limiting their scale in order to remainoutside of the formal sector altogether, and/or (iii)hiring contractual labor. The increased use of capital-intensive techniques is reflected in a steeply risingcapital/labour ratio for the organized economy
http://indiabudget.nic.in
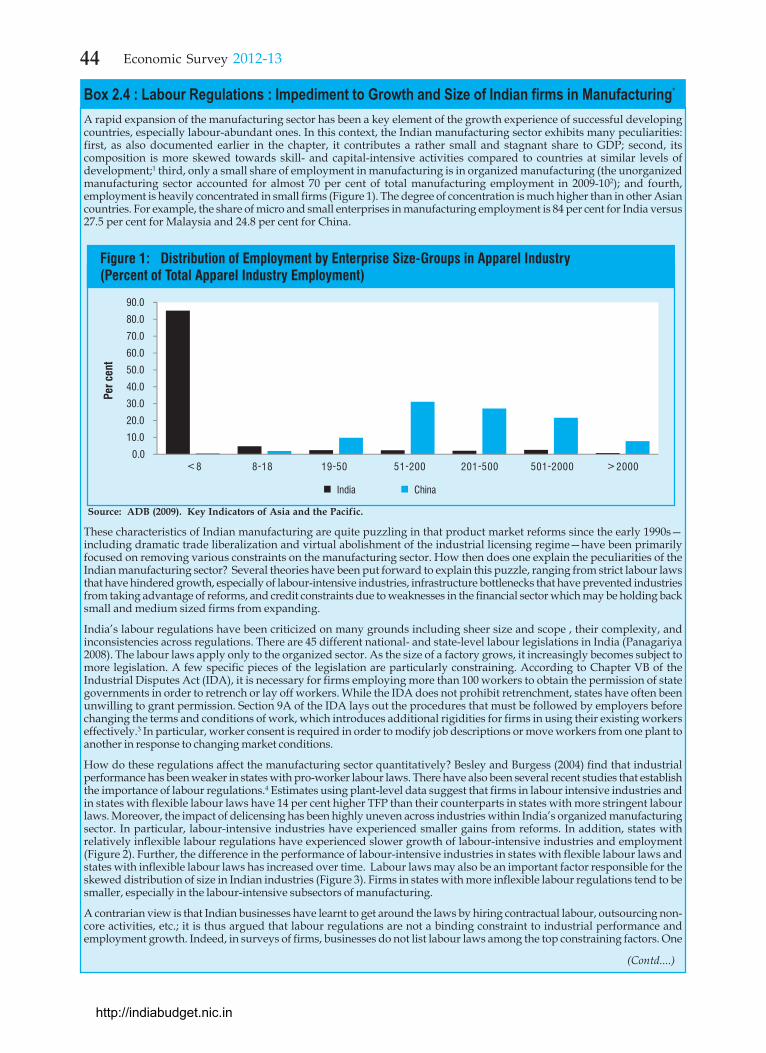
44 Economic Survey 2012-13
Box 2.4 : Labour Regulations : Impediment to Growth and Size of Indian firms in Manufacturing*
A rapid expansion of the manufacturing sector has been a key element of the growth experience of successful developingcountries, especially labour-abundant ones. In this context, the Indian manufacturing sector exhibits many peculiarities:first, as also documented earlier in the chapter, it contributes a rather small and stagnant share to GDP; second, itscomposition is more skewed towards skill- and capital-intensive activities compared to countries at similar levels ofdevelopment;1 third, only a small share of employment in manufacturing is in organized manufacturing (the unorganizedmanufacturing sector accounted for almost 70 per cent of total manufacturing employment in 2009-102); and fourth,employment is heavily concentrated in small firms (Figure 1). The degree of concentration is much higher than in other Asiancountries. For example, the share of micro and small enterprises in manufacturing employment is 84 per cent for India versus27.5 per cent for Malaysia and 24.8 per cent for China.
Source: ADB (2009). Key Indicators of Asia and the Pacific.
These characteristics of Indian manufacturing are quite puzzling in that product market reforms since the early 1990s—including dramatic trade liberalization and virtual abolishment of the industrial licensing regime—have been primarilyfocused on removing various constraints on the manufacturing sector. How then does one explain the peculiarities of theIndian manufacturing sector? Several theories have been put forward to explain this puzzle, ranging from strict labour lawsthat have hindered growth, especially of labour-intensive industries, infrastructure bottlenecks that have prevented industriesfrom taking advantage of reforms, and credit constraints due to weaknesses in the financial sector which may be holding backsmall and medium sized firms from expanding.
India’s labour regulations have been criticized on many grounds including sheer size and scope , their complexity, andinconsistencies across regulations. There are 45 different national- and state-level labour legislations in India (Panagariya2008). The labour laws apply only to the organized sector. As the size of a factory grows, it increasingly becomes subject tomore legislation. A few specific pieces of the legislation are particularly constraining. According to Chapter VB of theIndustrial Disputes Act (IDA), it is necessary for firms employing more than 100 workers to obtain the permission of stategovernments in order to retrench or lay off workers. While the IDA does not prohibit retrenchment, states have often beenunwilling to grant permission. Section 9A of the IDA lays out the procedures that must be followed by employers beforechanging the terms and conditions of work, which introduces additional rigidities for firms in using their existing workerseffectively.3 In particular, worker consent is required in order to modify job descriptions or move workers from one plant toanother in response to changing market conditions.
How do these regulations affect the manufacturing sector quantitatively? Besley and Burgess (2004) find that industrialperformance has been weaker in states with pro-worker labour laws. There have also been several recent studies that establishthe importance of labour regulations.4 Estimates using plant-level data suggest that firms in labour intensive industries andin states with flexible labour laws have 14 per cent higher TFP than their counterparts in states with more stringent labourlaws. Moreover, the impact of delicensing has been highly uneven across industries within India’s organized manufacturingsector. In particular, labour-intensive industries have experienced smaller gains from reforms. In addition, states withrelatively inflexible labour regulations have experienced slower growth of labour-intensive industries and employment(Figure 2). Further, the difference in the performance of labour-intensive industries in states with flexible labour laws andstates with inflexible labour laws has increased over time. Labour laws may also be an important factor responsible for theskewed distribution of size in Indian industries (Figure 3). Firms in states with more inflexible labour regulations tend to besmaller, especially in the labour-intensive subsectors of manufacturing.
A contrarian view is that Indian businesses have learnt to get around the laws by hiring contractual labour, outsourcing non-core activities, etc.; it is thus argued that labour regulations are not a binding constraint to industrial performance andemployment growth. Indeed, in surveys of firms, businesses do not list labour laws among the top constraining factors. One
(Contd....)
http://indiabudget.nic.in

45Seizing the Demographic Dividend
way of reconciling this response with the systematic empirical evidence discussed here is that firms have learned to adapt tothe labour laws—by either not hiring permanent workers or by staying below the threshold of these laws—and therefore theydo not see them as a constraint. As pointed out in Krueger (2007), the counterfactual of whether labour laws would constrainfirms that would emerge in the absence of strict labour laws cannot be captured in the surveys. Moreover, the adverseconsequences of the labour laws can be inferred from the low rate of job creation in the formal sector, low productivity in theinformal sector, and small firm size, especially in labour-intensive industries and states with more inflexible labour laws.
* Prepared by Poonam Gupta and Rana Hasan. The Box draws heavily on Gupta and Kumar (2011), and Hasan andJandoc (2012).
1 See for example Panagariya (2004), Kochhar et al. (2006), and Hasan et al. (2012).2 Report of the Working Group on Employment, Planning and Policy for the Twelfth Five Year Plan.3 An employer must give a notice of three weeks in writing to the workers of any change in the working conditions
including change in shift work, grade classification, rules of discipline, technological change that may affect thedemand for labour, and changes in process or department. See Datta-Chaudhuri (1996) and Debroy (2010) for details.
4 See for example, Dougherty et al. (2011) and Gupta et al. (2009).
Box 2.4 : Labour Regulations : Impediment to Growth and Size of Indian firms in Manufacturing*
Source: Mishra (2013).
(Figure 2.16). This raises the obvious questionwhether it is justifiable for a relatively labour abundantcountry like India with low wages to be increasinglyresorting to more capital-intensive technology. Of
course, as we have argued earlier, countries woulduse more capital per worker as they get richer, butthe capital intensity is higher and has increased ata much faster rate for large firms than for small firms
http://indiabudget.nic.in

46 Economic Survey 2012-13
in India, even while they have created fewer jobs(Dougherty 2008).
2.44 As argued earlier, firms would also resort toinformality if labour laws were overly constraining.The extent of informality in India stands out relativeto countries at similar levels of development (seeBox 2.5 on the extent, causes, and consequencesof informal employment in India). Roughly 85 percent of the workforce in India is engaged in theinformal sector (all unincorporated enterprisesoperated on a proprietary or partnership basis andwith less than 10 employees). The prevalence ofinformal employment (workers in either the informalsector or in the formal sector but lackingemployment or social security benefits) is evenhigher; 95 per cent of jobs are informal and 80 per
cent of non-agriculture wage workers work withouta contract.
2.45 Before suggesting the way forward, it isimportant to emphasize the advantage of formalemployment via contracts for worker training andlearning, especially if contracts have a significantprobability of being rolled over into the long term.Experience is important for skill development. Witha paucity of technical/vocational training institutions(say like the German model) in India, on-the-joblearning is one of the easiest and most viable modelsof human capital accumulation. Employment that islikely to endure provides incentives to the firm fornurturing skill building and to the worker for developingskills. These contracts necessitate backloading ofpay and incentives--compensation increases with
Box 2.5 : Informality of Employment in India: Stylized Facts and Policy Implications*
Extent of Informality
Despite impressive economic growth over the past 20 years, the vast majority of Indian workers continue to toil in informalemployment. Roughly 85 per cent of the workforce is engaged in the informal sector.1 Even after excluding the agriculturalsector, the share of the workforce in the informal sector remains at 70 per cent.
The prevalence of informal employment – workers in either the informal or formal sector who lack employment or socialsecurity benefits—is even higher. While precise estimates of the extent of informal work arrangements are hard to come by,a detailed study by the National Statistical Commission reveals that as of 2004-5, 95 per cent of jobs are informal and theseare not limited to the informal sector (Figure 1). Even in the public sector, a third of all jobs in India are informal (Kolli andSinharay, 2011).2 Among wage employees outside of agriculture, more than three-quarters have no written contract, 70 percent are not eligible for any paid leave, and 74 per cent are not covered by social security benefits. Along all of these measuresof informality, India saw an uptick over time.3
While high levels of informality are not uncommon in South Asia (Figure 2), India (along with the rest of the region) standsout from an international perspective. Using lack of pension coverage as a proxy for informal employment, 91 per cent of thelabour force in South Asia is informal, surpassed only by Africa (Nayar et. al. 2012). Compared to countries at a similar levelof development, India’s very low usage of written contracts for its non-agricultural employees, 80 per cent of whom workwithout a contract, also stands out (Figure 3). This figure is higher than for, for example, China, Pakistan, Ghana, and SouthAfrica. This is despite the fact that India’s share of employment in the informal sector is roughly in line with that of its peers(Figure 4) and confirms the significant prevalence of informal arrangements within the formal sector.
(Contd....)
http://indiabudget.nic.in

47Seizing the Demographic Dividend
Source : Authors’ calculations, based on World Bank data.
Causes of Informality
Informal employment results both from workers being excluded from formal jobs and from workers or firms voluntarilyopting out of formal employment. The ‘exclusion’ view of informality emphasizes the dual nature of labour markets, inwhich a highly productive formal sector coexists with a subsistence informal sector, which absorbs excess labour. Constraintsto the expansion of the formal sector (such as insufficient capital accumulation and natural resources as in the Lewis [1954]model, or overly burdensome costs of registering as in De Soto [1989] lead to persistent informal employment.
According to the ‘voluntary’ view, firms and workers decide on whether to become formal by comparing the perceived costsof being formal with its perceived benefits. In this setting, labour institutions, taxation, and regulations primarily explain theprevalence of informal employment, by effectively increasing the costs of formality. At a cross-country level, countries withmore burdensome entry regulations have larger informal sectors (Djankov et al. 2002). India’s labour laws may also leadfirms to resort to informal arrangements, rely more on capital instead of labour, or limit their scale in order to remain outsideof the formal sector altogether (see Box 2.4 on labour regulations in India).
Consequences of Informality
India’s high rate of informality is a drag on its economic development and a source of considerable inequity. Productivitydifferences between workers in the formal and informal sectors are large (Figure 5, Panel A), suggesting that moving a workerfrom an informal to a formal firm would bring about sizeable gains from improved allocation of resources. In fact, rough
Source : World Bank (2012) More and Better Jobs in South Asia,’ Chapter 1, Overview, Figure 1.13, p. 13 for PanelA and authors’ calculations based on National Statistical Commission (2012) for Panel B.
Box 2.5 : Informality of Employment in India: Stylized Facts and Policy Implications* (Contd...)
(Contd....)
http://indiabudget.nic.in

48 Economic Survey 2012-13
estimates suggest that an informal job in the formal sector has double the value added than an informal job in the informalsector. And importantly, the value added per worker in a formal job within the formal sector is almost ten times that in aninformal job in the formal sector (Figure 5, Panel B). Therefore, loosely speaking, the benefits of moving into contracts withinthe formal sector are likely to be substantial and significantly higher than the gains from moving an informal-sector workerinto an informal job within the formal sector.4
Besides earning less, informal workers are also more vulnerable to violations of basic human rights such as reasonableworking conditions and safety at work. With little job security and limited access to safety nets, most of the informallyemployed remain extremely vulnerable to shocks such as illnesses and loss of income. Not surprisingly, a strong correlationexists between informality and poverty in India (NCEUS 2009).
From the point of view of firms, informal work arrangements bring benefits: lower price and greater flexibility in adjusting thequantity of labour in response to fluctuating demand. Yet, these benefits are partly offset by costs, such as low worker loyaltyand inadequate incentive to invest in worker skill building. Moreover, any net benefits need to be weighed against the socialcosts to the workers and the economy as a whole.
Finally, persistently high levels of informality come at a significant fiscal cost in terms of forgone fiscal revenue (Levy 2008).In 2004-5, the unorganized sector contributed roughly half of India’s GDP (National Statistical Commission 2012, p. 30),implying a significant expansion of the tax base if the informal sector were to join the formal economy. The high prevalenceof informality also hampers the ability of economic policies to have direct and quick impact on the economy.
* Prepared by Prachi Mishra, David Newhouse, and Petia Topalova.1 As of 2009-10. The informal sector is defined by the National Commission for Enterprises in the Unorganized
Sector as all unincorporated enterprises operated on a proprietary or partnership basis and with less than10 employees.
2 The incidence of informal jobs in the formal sector is highest among the non-informal household sector,where Kolli and Sinharay (2011) estimate 95 per cent of jobs to be informal.
3 Estimates are from National Sample Survey (2012).4 These rough estimates provide an upper bound of the difference in value added across formal and informal
jobs, since informal workers may not be as productive as formal-sector workers for reasons unrelated totheir employment status, such as lack of education or skills. The causality could also go the other way iffirms that are less productive are more likely to employ informal workers.
experience--so that workers do not avail of thetraining and leave. In contrast, informal andtemporary contracts are in fact flat and sometimeseven frontloaded, absolutely the inverse of the desiredarchitecture. Long-lasting employment does notmean tenure for life, which is the other extreme ofthe contract space commonly found in India.Permanent employment not only limits firm flexibility,it also reduces some workers' incentives to learn orexercise effort. An intermediate structure that existsin most countries is contracts that allow terminationin situations of firm distress or for poor workerperformance, but with carefully designed and effectiveredressal mechanisms if the employee is fired withoutcause, as well as compensation for severance andunemployment benefits.
2.46 Regardless of what one believes aboutcauses, the fact is that India is not creating enoughproductive jobs. Moreover, India has the dubiousdistinction of having some of the most comprehensivelabour laws in the world, even while having one ofthe largest fractions of the working populationunprotected. Not only do informal workers have lowerproductivity and earn less, but they are also more
vulnerable to violations of basic workers' rights suchas reasonable working conditions and safety at work.Paradoxically, Boxes 2.4 and 2.5 suggest that itmay be the stringent protection that is afforded byexisting regulations that is responsible for both thepaucity of good jobs as well as the inadequateprotection that most workers have. In India reformsare typically implemented only after they have beensubject to a lot of debate and after some sort ofpolitical consensus is reached on them. It is thereforeimperative that consensus building on labour marketreforms should start soon. India needs many morefirms in the formal sector, especially firms thatcontinue growing and creating productive jobs. Box2.6 presents the case of Mauritius and discusseshow this country undertook reforms that improvedemployment.
2.47 It may take time to build political consensusfor fundamental reforms. In the meantime, statescould be allowed more flexibility to experiment withoutcoming into conflict with central statutes. As bestpractices evolve, success in job growth will resolvetheoretical debates more easily than a thousandpapers. If indeed rigid labour laws are determined to
Box 2.5 : Informality of Employment in India: Stylized Facts and Policy Implications* (Contd...)
http://indiabudget.nic.in

49Seizing the Demographic Dividend
Box 2.6 : The Mauritian Miracle*
As Mauritius was assuming self-rule from the British, two noted intellectuals (and to be Nobel laureates), James Meade(economics) and V.S. Naipaul (literature) prophesied a bleak future for this small island. In the 1960s, Mauritius was heavilydependent on one crop—sugar, was prone to terms-of-trade shocks, and was undergoing rapid increase in population. Whatfollowed though was counter to their predictions. Between 1977 and 2006, real GDP grew by an average of 5.2 per cent perannum. Per capita GDP growth averaged 4.2 per cent versus 0.7 per cent for the rest of Africa. From 1970 to 2008, lifeexpectancy increased from 62 to 73 and infant mortality dropped from 64 per 1000 births to 15.
What explains this performance? A leading factor in the first two decades of turnaround is the creation and efficientmanagement of EPZs. Some major characteristics of the Mauritius EPZ were:
1. It was not a geographical zone. Any firm could opt into the regulatory scheme.
2. As Romer (1992) notes, the main policies were ease of inputs and materials imports, no restriction on repatriation ofprofits, a 10-year income tax holiday for foreign investors, a policy of centralized wage setting, and an implicit assurancethat labour unrest would be minimized and wage increases moderate.
3. It allowed firms to constantly adjust labour force through layoffs and realistic compensation packages and allowedgreater flexibility in work hours.
4. It had relaxed laws so that women could participate to a greater extent.
Figure 1 below delineates the effect of these on structural transition. The first stage was motivated by a productive structuralshift and ensuring full employment. By 1990, about one-third of the labour force on the island, 90,000 people, was employedin the EPZs. Jobs added in the EPZs accounted for two-thirds of the total increase in employment between 1970 and 1990.Increased per capita incomes from this transition eventually fuelled more human capital build-up, allowing furtherdiversification into services.
* Prepared by Rohit Lamba
be the key constraining factor in the creation ofproductive jobs, win-win reforms are easily available.Existing permanent workers can continue tillretirement with their privileges left untouched. Theremaining workers could be encouraged to move intocontractual employment that can be terminated, butwhich gives the worker some protections includingseverance pay, unemployment insurance, and theright to reverse unfair dismissal through appeal.
2.48 In the meantime, the government shouldcontinue to create a minimum safety net for informalworkers (in the informal sector and in informal work
arrangements in the formal sector) by, for example,extending the reach of national-level schemes suchas the Rashtriya Swasthya Bima Yojana and theNew Pension Scheme and introducingunemployment insurance schemes (e.g.Supplementary Unemployment Benefits Fund to becreated by automotive companies).
WHY ARE SERVICES NOT CREATINGJOBS?2.49 As has been discussed earlier, while the shareof employment in services was relatively high at take-
http://indiabudget.nic.in

50 Economic Survey 2012-13
off, its growth has since then been slow. At thesame time, the share in value added, which washigh at take-off, has continued to rise quickly. Thisimplies that while productivity in the sector hasbeen high, the services sector is not creating manyjobs--the opposite of the problem with industry.
2.50 Some impediments to business creationsuch as regulatory hurdles and access to fundingand infrastructure may be common betweenservices and industry. Labour regulations are alsolikely to constrain creation of jobs in services. Forexample, 27 per cent of retail stores in India reportlabour regulations as a problem for their businesses(Amin 2008)5. But what stands out for the servicessector is the importance of education and skilling.Suitable higher education is important for high-endservices such as information technology, softwaredevelopment, and finance. Mid-level services suchas retail trade, hotels, and restaurant services alsorequire adequate skilling of the labour force.
2.51 Schemes such as the formal apprenticeshipprogramme of the government, which placesemployers at the heart of education, can play apowerful role in imparting job-relevant skills and alsoretraining, preparing, and upgrading the labour force.In its current form, the Act and the rules governingapprenticeships are outdated and rigid from both theperspective of employers and employees. Box 2.7discusses the current Act/rules and suggests changesthat need to be made.
2.52 The challenge is to address both quality andquantity issues in skill development and training soas to correct the mismatch between employers whodo not get people with requisite skills and millions ofjob seekers who do not get employment. To this end,the National Skill Development Mission aims to impartemployment-oriented vocational training to 8 crorepeople over the next five years by working with stategovernments/State Skill Missions and incorporating
5 Labour regulations for India’s retail sector are contained in the Shops and Establishment Act (SEA), whichincludes minimum wages, regulation of hours of work, and rules for employment and termination ofservice.
Box 2.7 : Formal Apprenticeships: An Idea Whose Time Has Come*
Why is Apprenticeship important?Equipping the labor force with productive skills lies at the heart of tapping the demographic dividend. Apprenticeships arean effective way of ensuring that entry-level workers have the skills required to join the formal workforce by ‘learning on thejob’ and even ‘earning while learning’. It has been amongst the oldest social institutions in India. However, it needs to beformalized and scaled up.In the current environment, India’s educational system is overburdened by sheer demand for quality education. Accordingto TeamLease (2012), 80 per cent of India’s higher education system of 2030 is yet to be built and is grappling with thethreefold problem of cost, quality, and scale. This is compounded by the inability of much of the current education systemto produce ‘work-ready’ labour. In fact, the disconnect between the formal educational system and requirements of theemployers becomes even more acute in times of rapid structural and technological change.In this environment, company-led apprenticeship programmes, that place employers at the heart of education, can play apowerful role in imparting job-relevant skills and also repairing, preparing, and upgrading the labour force. They can aid fiveimportant transitions that the labour force is currently making--from agriculture to non-agriculture, from rural to urban,from the unorganized sector to the organized, from school to work, and from subsistence self-employment to wage employment.Several countries have benefited greatly from focused programmes on skilling the workforce on the job, including Japan, US,UK, and Germany. Germany, in particular, has a well-known dual education system that combines classroom/onlinecourses at a vocational school with workplace experience at a company. School authorities are responsible for the formerwhile the company is responsible for the latter. More than 75 per cent of Germans below the age of 22 have attended anapprenticeship programme.Training apprentices also benefits corporates. A 2005 Task Force Report on Apprentices in the UK, demonstrated that thebenefits of apprenticeships were numerous, including increased productivity, lower net costs of training (versus training nonapprentices), greater staff retention, and a more highly motivated workforce.What does India already have?Apprenticeship programmes in India are governed by The Apprentice Act 1961 and the Apprenticeship Rules 1992. Theorganizational structure and rules and regulations overseeing it are complex and burdensome. The Ministry of Labour andEmployment oversees ‘trade apprentices’ through six regional offices. The Ministry of Human Resource Developmentoversees ‘graduate, technician, and technician (vocational) apprentices’ through four boards located in different cities. Thereare strict norms on permissions, trades permitted, training duration, stipend levels, apprentice/employee ratio, and trainingfacilities. It is onerous to create new apprenticeship positions, and there are several vacancies even in positions that havealready been created. As a consequence, India only has under 3,00,000 formal apprentices.
(Contd....)
http://indiabudget.nic.in

51Seizing the Demographic Dividend
Box 2.7 : Formal Apprenticeships: An Idea Whose Time Has Come* (Contd...)One of the reasons for tightly regulating apprenticeships was to prevent companies from hiring cheap labour under the guiseof an apprenticeship programme. A simpler set of provisions to streamline regulation and incentivize corporates whileprotecting the interest and well-being of apprentices may now be needed.How can it be made to work?The rules and regulations overseeing apprenticeships need to be changed such that employers and prospective apprenticescan choose each other freely by just requiring information on what will be learnt on the job and a minimum wage. Somerecommendations including those from the 2009 Planning Commission taskforce are described below:1. Simpler regulation: A single window mechanism is needed to clear company applications for pan-India apprenticeship
programmes. Currently, companies need to approach each state apprenticeship adviser separately. Partnerships betweencompanies and industry federations should be facilitated by giving timely permissions.
2. Wider reach: Apprentices are only allowed in specified trades. Majority of graduates are not currently covered underformal Apprenticeships. In addition, the procedure to include new trades especially services, which are largely excluded,is complex and can take many months. A fully deregulated list is needed for apprenticeships to remain dynamic and inline with the changing needs of the workplace.
3. Flexibility to companies: Currently many schemes are required to be unnecessarily long (up to four years), and have rigidrequirements on worker to apprentice ratio. Moreover, the penal provisions for companies, even for small violations of therules, are very severe. Certain relaxation of rules can help give flexibility to companies. For example, the duration ofapprenticeship training can be allowed to vary across trades and companies. Short-duration programmes (less than 12months) can be freed from much of the oversight provided they pay minimum wages. Relaxing the rigid requirements onthe ratio of apprentices to workers could also accelerate capacity creation.
4. Dual system of training: Partnerships between companies and educational institutions should be encouraged. Like theGerman model, corporates can be allowed to outsource theoretical training, and educational institutions can be allowedto outsource practical training.
5. Active exchanges: There should be active exchanges and portals, matching prospective apprentices to employers.
* Prepared by Pranjul Bhandari.
the private sector (through PPPs and for-profitvocational training) and NGOs. Basic education isalso an important input for enhancing human capital.
Recent government initiatives to expand access toquality primary education are important; however,more needs to be done (see Box 2.8).
Box 2.8 : Using Evidence for Better Policy:The Case of Primary Education in India*Investments in education both contribute to aggregate economic growth as well as enable citizens to broadly participate inthe growth process through improved productivity, employment, and wages, and are therefore a critical component of the;inclusive growth' agenda of the Government of India. The past decade has seen substantial increases in education investmentsunder the Sarva Shiksha Abhiyan (SSA), and this additional spending has led to considerable progress in improving primaryschool access, infrastructure, pupil-teacher ratios, teacher salaries, and student enrollment. Nevertheless, student learninglevels and trajectories are disturbingly low, with nationally representative studies showing that over 60 per cent of childrenaged 6-14 are unable to read at second-grade level. Further, these figures have shown no sign of improving over time (andmay even be deteriorating--see ASER study discussed in Box 13.4).
The past decade has also seen a number of high-quality empirical studies on the causes and correlates of better learningoutcomes based on large samples of data and careful attention paid to identification of causal relationships. This researchhas identified interventions/inputs that do not appear to contribute meaningfully to improved education outcomes, as wellas interventions that are highly effective. In particular, the research over the past decade suggests that increasing inputs toprimary education in a 'business-as-usual' way is unlikely to improve student learning meaningfully unless accompanied bysignificant changes in pedagogy and/or improvements in school governance. It is therefore imperative that education policyshifts its emphasis from simply providing more school inputs in a 'business-as-usual' way and focuses on improvingeducation outcomes.
School Inputs
Analysis of both administrative and survey data shows considerable improvements in most input-based measures ofschooling quality. But there is very little impact of these improvements in school facilities on learning outcomes. This is notto suggest that school infrastructure does not matter for improving learning outcomes (they may be necessary but notsufficient), but the results highlight that infrastructure by itself is unlikely to have a significant impact on improving learninglevels and trajectories. Similarly, while there may be good social and humanitarian reasons for mid-day meal programmes(including nutrition and child welfare), there is no evidence to suggest that they improve learning outcomes.
(Contd....)
http://indiabudget.nic.in

52 Economic Survey 2012-13
Box 2.8 : Using Evidence for Better Policy:The Case of Primary Education in India* (Contd...)
Even more striking is the fact that no credible study on education in India has found any significant positive relationshipbetween teachers possessing formal teacher training credentials and their effectiveness for improving student learning.Similarly, there is no correlation between teacher salary and its effectiveness for improving student learning, and at best thereare very modest positive effects of reducing pupil-teacher ratios on learning outcomes. As discussed further, these very starkfindings most likely reflect weaknesses in pedagogy and governance which are key barriers in translating increased spendinginto better outcomes.
The results summarized so far can be quite discouraging. Fortunately, the news is not all bad, because the evidence of thepast decade also points consistently to interventions that have been highly effective for improving learning outcomes, and areable to do so in much more cost-effective ways than the status-quo patterns of spending.
Pedagogy
A key determinant of how schooling inputs translate into learning outcomes is the structure of pedagogy and classroominstruction. Getting aspects of instruction right is particularly challenging in a context such as that of India where severalmillions of first-generation learners have joined a rapidly expanding national schooling system. In particular, standardcurricula, textbooks, and teaching practices that may have been designed for a time when access to education was morelimited may not fare as well under the new circumstances, since the default pedagogy is one of 'completing the textbook',which increasingly does not reflect the learning levels of children in the classroom, who are considerably further behind wherethe textbook expects them to be.
Evidence that 'business-as-usual' pedagogy can be improved is found in several randomized evaluations finding largepositive impacts of supplemental remedial instruction in early grades that are targeted to the child's current level of learning(as opposed to simply following the textbook). These positive results have been found consistently in programmes run bynon-profit organizations in several locations (including UP, Bihar, Uttaranchal, Gujarat, Maharashtra, and Andhra Pradesh).Second, the estimated impact from these interventions (whose instructional time is typically only a small fraction of theduration of the scheduled school year) is considerable--often exceeding the learning gains from a full year of schooling. Third,these interventions are typically delivered by modestly paid community teachers, who mostly do not have formal teachertraining credentials. Finally, these supplemental remedial instruction programmes are highly cost effective and deliversignificant learning gains at much lower costs than the large investments in standard inputs.
Governance
Beyond pedagogy, another explanation for the low correlation between increases in spending on educational inputs andimproved learning outcomes may be the weak governance of the education system and limited effort on the part of teachersand administrators to improve student learning levels. The most striking symptom of weak governance is the high rate ofteacher absence in government-run schools. While teacher absence rates were over 25 per cent across India in 2003, an all-India panel survey that covered the same villages surveyed in 2003 found that teacher absence in rural India was still around24 per cent in rural India in 2010. The fiscal cost of teacher absence was estimated at around Rs 7,500 crore per yearsuggesting that governance challenges remain paramount. There is evidence that even modest improvements in governancecan yield significant returns. Improving monitoring and supervision of schools is significantly correlated with reductions inteacher absence, and investing in improved governance by increasing the frequency of monitoring could yield an eight- totenfold return on investment in terms of reducing the fiscal cost of teacher absence.
The evidence also points to the importance of motivating teachers by rewarding good performance. Rigorous evaluations ofcarefully designed systems of teacher performance pay in Andhra Pradesh show substantial improvements in studentlearning in response to even very modest amounts of performance-linked pay for teachers (that was typically not more than3 per cent of annual pay). Evidence from a long-term follow up shows that teacher performance pay was 15 to 20 more timesmore effective for raising student learning than reductions in pupil-teacher ratios. More broadly, these results suggest thatthe performance of front-line government employees depends less on the level of pay and more on its structure.
From Evidence to Policy
Three immediate policy implications of this body of research are summarized below1.
1) Make learning outcomes an explicit goal of primary education policy and invest in regular and independent high-qualitymeasurement of learning outcomes: While independently measuring and administratively focusing on learning outcomeswill not by itself lead to improvement, it will serve to focus the energies of the education system on the outcome thatactually matters to millions of first-generation learners, which is functional literacy and numeracy.
2) Launch a national campaign of supplemental instruction targeted to the current level of learning of children (as opposedto teaching to the textbook) delivered by locally hired teacher assistants, with a goal of reaching minimum absolutestandards of learning for all children: There is urgent need for a mission-like focus on delivering universal functionalliteracy and numeracy that allow children to 'read to learn'. The evidence strongly supports scaling up supplementalinstruction programmes using locally hired short-term teaching assistants that are targeted to the level of learning of thechild, and the cost-effectiveness of this intervention also makes it easily scalable.
(Contd....)
http://indiabudget.nic.in

53Seizing the Demographic Dividend
CONSEQUENCES AND CONCLUSION
2.53 Recent economic history is replete withexamples of economies that were supposed to havegreat potential but ultimately did not achieve rapideconomic growth and improvements in standards ofliving. At the same time, we have instances ofeconomies classified as basket cases that achievedrapid turnarounds. India's achievement in the post-reform period and South Korea's rapid transformationsurely fall in this latter category. But India's continuingon a rapid growth path is not preordained. Besidesfavourable circumstances, it requires deftpolicymaking and a broad vision of the future, possiblerisks, and opportunities. We stand at a crossroadswhere we need to develop a clear strategy forcontinued inclusive growth. Let us consider whatmight happen under different scenarios. These arehypothetical scenarios, and based on informedestimates, but reflect the forces that will be at play.
Business as usual: Some improvement ininfrastructure but only slow improvement in education,and no change in institutional structure such asbusiness regulation and labour laws. Somemovement from agriculture to low skill services suchas construction and household work, as well as toinformal manufacturing, but too few quality jobs. GDPgrowth settles into a comfortable 6-7 per cent, thenew "normal". There is growing presence ofunprotected workers in manufacturing and thepossibility of rising labour frictions. There is immensepressure on education to make students job-worthy,but with organized manufacturing playing little rolein training workers and imparting skills on the job,
there is a continuing mismatch between employerneeds and worker capabilities. Growth is slower thanit could be and inequality higher than it ought to be.
Reforms: Vast improvements in infrastructure,education, as well as in business regulation andlabour laws. As fewer workers depend on agriculture,larger holdings and more investment in capital andtechnology create a much healthier agriculturalsector, with significant rural entrepreneurshipsurrounding activities like horticulture, dairyproducts, and meat. The manufacturing sectorbecomes a training ground for workers, absorbingmore students with a middle or high schooleducation. India moves into niches vacated by Chinasuch as semi-skilled manufacturing, even whileenhancing its advantage in skilled manufacturing andservices. India experiences faster and more equitablegrowth. Social frictions are minimized as bothagriculture and manufacturing create betterlivelihoods.
Decline: No improvement in infrastructure, education,or institutions: As fewer jobs are created outside ofagriculture, more stay in agriculture, increasing thepressure on land and lowering incomes. Smallagricultural plots do not provide enough income, norcan they be leased out. More families break up, withmales seeking work elsewhere, and labourparticipation increases. There is large-scale migrationto overburdened cities. More supports are given toagriculture and transfers are made to rural areas soas to prevent further migration. The strain ongovernment finances increases. Income inequalitybetween good service jobs in cities and marginal
Box 2.8 : Using Evidence for Better Policy:The Case of Primary Education in India* (Contd...)
3) Pay urgent attention to issues of teacher governance including better monitoring and supervision as well as teacherperformance measurement and management: A basic principle of effective management of organizations is to have cleargoals and to reward employees for contributing towards meeting those goals. The extent to which the status quo does notdo this effectively is highlighted in the large positive impacts found from even very modest improvements in thealignment of employee rewards with organizational goals. There can be potentially large returns of implementing theseideas in education and beyond.
The next ten years will see the largest ever number of citizens in the school system at any point in Indian history (or future),and it is critical that this generation that represents the demographic dividend be equipped with the literacy, numeracy, andskills needed to participate fully in a rapidly modernizing world. In a fiscally constrained environment, it is also imperativeto use evidence to implement cost-effective policies that maximize the social returns on any given level of public investment.The growing body of high-quality research on primary education in the past decade provides opportunity for putting thisprinciple into practice.
* Prepared by Karthik Muralidharan.1See Muralidharan (2012) for a more detailed discussion and for references to the studies summarized here.
http://indiabudget.nic.in

54 Economic Survey 2012-13
agricultural jobs in rural areas increasestremendously. Social strains grow.
2.54 These scenarios are clearly caricatures andshould be seen as indicative rather than conclusivein any way. The key policy message from thischapter is that India has to focus on an agenda tocreate productive jobs outside of agriculture, whichwill help us reap the demographic dividend and alsoimprove livelihoods in agriculture. We need to
examine carefully whether regulations constrainbusinesses excessively and, if so, strip away theexcess regulation while ensuring adequate protectionand minimum safety nets for workers. Buildinginfrastructure and expanding access to finance willalso help. While the government is clearly engagedin this process, some further steps need greaterdebate and action. Hopefully, this chapter will helpinform that debate.
ReferencesAmin, Mohammad (2008), 'Labor Regulation and Employmentin India's Retail Stores', Social Protection and Labor DiscussionPaper Number 0816, World Bank.
Asian Development Bank (2009), Key Indicators 2009:Enterprises in Asia: Fostering Dynamism in SMEs, Manila.
Aiyar, S. and A. Mody (2011), 'The Demographic Dividend:Evidence from the Indian States', IMF Working Paper.
Bailey, M.J. (2006), 'More Power to the Pill: The Impact ofContraceptive Freedom on Women's Life Cycle Labor Supply',Quarterly Journal of Economics, 121:289-320.
Berger, Allen, Nathan Miller, Mitchell Petersen, Rajan, Raghuram,and Jeremy Stein (2005), 'Does Function Follow OrganisationalForm? Evidence from the Lending Practices of Large and SmallBanks' Journal of Financial Economics,76: 237-69.
Besley, T. and R. Burgess (2004), 'Can Regulation HinderEconomic Performance? Evidence from India.' Quarterly Journalof Economics, 119 (1): 91-134
Bhattacharjea, A (2006), ‘Labour market regulation and industrialperformance in India: A critical review of the empirical evidence.’Indian Journal of Labour Economics 49 (2): 211–232.
Bosworth, M. and S. M. Collins (2003), 'The Empirics of Growth:An Update', Brookings Papers on Economic Activity.
Datta-Chaudhuri, M. (1996). 'Labor markets as social institutionsin India', IRIS-India Working Paper No. 10, University of Maryland-College Park.
Davis, Steve, John C. Haltiwanger, and Scott Schuhh (1998),Job Creation and Destruction, MIT Press, Cambridge.
Debroy, B. (2010), 'Segmentation and Unification in the People'sRepublic of China's Labor Market: Lessons for India' in K.Gerhaeusser, Y. Iwasaki, and V. B. Tulasidhar (eds.), ResurgingAsian Giants: Lessons from the People's Republic of Chinaand India. Manila: Asian Development Bank, pp. 167-200.
De Soto, H. (1989), The Other Path, Harper and Row Publishers,New York.
Djankov, S., R. La Porta, F. Lopez-de-Silanes, and A. Schleifer(2002), 'The Regulation of Entry', Quarterly Journal ofEconomics, 117(1):1-37.
Dougherty, S. (2008), 'Labor Regulation and EmploymentDynamics at the State Level in India', OECD EconomicsDepartment Working papers No. 624.
Dougherty, S., V. C. Frisancho Robles, and K. Krishna (2011),'Employment Protection Legislation and Plant-Level Productivityin India', NBER Working Paper No. 17693.
Feyrer, J. (2007), 'Demographics and Productivity, Review ofEconomics and Statistics, 89 (1): 100-9.
Gupta, P. and U. Kumar (2011), 'Explaining the Growth ofManufacturing in India: Role of Labor Regulations andInfrastructure', Handbook on Indian Economy, Oxford UniversityPress, Delhi.
Gupta, P., R. Hasan, and U. Kumar (2008), 'Big Reforms butSmall Payoffs: Explaining the Weak Record of Growth in IndianManufacturing', In S. Bery, B. Bosworth, and A. Panagariya(eds.), India Policy Forum, vol. 5, Sage, Delhi: 59-108.
Hasan, R., K. Robert, and L. Jandoc (2012), 'Labor Regulationsand the Firm Size Distribution in Indian Manufacturing', ColumbiaProgram on Indian Economic Policies, Working Paper No. 2012-3.
Hasan, R., D. Mitra, and A. Sundaram (2012), 'What Explainsthe High Capital Intensity of Indian Manufacturing?' IndianGrowth and Development Review.
Hasan, R., S. Lamba, and A. Sen Gupta (2012), 'Growth,Structural Change, and Poverty Reduction in India', WorkingPaper, India Resident Mission, Asian Development Bank.
Hsieh, C. and P. J. Klenow (2011), 'The Life Cycle of Plants inIndia and Mexico', Chicago Booth Research Working Paper No.11-38.
IMF, World Economic Outlook (2006), 'Asia Rising: Patterns ofEconomic Development and Growth', Chapter 3.
IMF, World Economic Outlook Database (2011), September 2011.
Kochhar, K., U. Kumar, R. Rajan, A. Subramanian, and I. Tokatlidis(2006), "India's Pattern of Development: What Happened, WhatFollows?', Journal of Monetary Economics 53: 981-1019.
Kolli, R. and A. Sinharay( 2011), 'Share of Informal Sector andInformal Employment in GDP and Employment', Journal of Income
http://indiabudget.nic.in

55Seizing the Demographic Dividend
and Wealth, 33(2), July-December 2011.
Krueger, A. O. (2007), 'The Missing Middle', Stanford Centerfor International Development Working Paper No. 343.
Lewis, A. (1954), 'Economic Development with UnlimitedSupplies of Labour', The Manchester School of Economic andSocial Studies, May.
Levy, S. (2008), Good Intentions, Bad Outcomes: Social Policy,Informality and Economic Growth in Mexico, Washington:Brookings Institution Press.
Ministry of Labour and Employment, Government of India (2002),Second National Commission on Labour, Report.
Mishra, P. (2013), 'Has India's Growth Story Withered?',Economic and Political Weekly, forthcoming.
Muralidharan, K. (2012), 'Priorities for Primary Education Policyin India's 12th Five-year Plan', in NCAER-Brookings India PolicyForum 2012-2013, NCAER, New Delhi.
National Sample Survey (2012), 'Informal Sector and Conditionsof Employment in India', Report No. 539, January 2012.
National Statistical Commission (2012), 'Report of the Committeeon Unorganised Sector Statistics', Government of India,February 2012.
Nayar, R., P. Gottret, P. Mitra, G. Betcherman, Y. Lee, I. Santos,M. Dahal, M. Shrestha (2012), More and Better Jobs in SouthAsia, World Bank.
National Commission for Enterprises in the UnorganisedSectors, (2009), The Challenge of Employment in India: AnInformal Economy Perspective, New Delhi.
Nehru, V. and A. Dhareswar (1993), 'A New Database onPhysical Capital Stock: Sources, Methodology and Results',Revisita de AnalisisEconomico, 8 (1): 37-59.
Panagariya, A. (2008), India: The Emerging Giant, New York:Oxford University Press.
Panagariya, A. (2004), 'India's Trade Reform', in S. Bery, B.Bosworth, and A. Panagariya (eds.), India Policy Forum, vol. 1,pp. 1-57, New Delhi.
Romer, P. (1992), 'Two Strategies for Economic Development:Using Ideas and Producing Ideas', Proceedings of the WorldBank Annual Conference on Development Economics.
TeamLease (2012), 'India Labor Report (2012), Massifying IndianHigher Education: The Access and Employability Case forCommunity Colleges', TeamLease and Indian Institute of JobTraining.
United Nations Population Division,(2010), Revision of WorldPopulation Prospects.
World Bank (2013), World Development Report.
World Bank (2013), Doing Business: Measuring BusinessRegulations.
World Bank (2009), Doing Business in India.
World Bank (2012), World Development Indicators, July.
http://indiabudget.nic.in

Public Finance CHAPTER
3
The fiscal outcome of the Central government in 2012-13 so far indicates significantimprovement over 2011-12. The fiscal outcome in 2011-12 was affected bymacroeconomic developments of growth slowdown, high global crude oil prices,and sluggish financial market conditions for effecting the budgeted disinvestmentprogramme. These developments continued through the first half of the current year.The government then pushed harder for reforms. An initial step was to set up theKelkar Committee. Following its recommendations, the government unveiled a revisedfiscal consolidation roadmap. The fiscal position of states has continued to progresswith fiscal deficit budgeted at 2.1 per cent of gross domestic product (GDP). Stayingon the indicated fiscal consolidation path is critical to sustaining the desirablemacroeconomic outcomes not only in terms of higher growth in real GDP and lowerinflation, but also in easing the financing of the widening current account deficit(CAD), for which India’s sovereign credit rating is important. Widening of the taxbase and prioritization of expenditure are key factors in effecting the desired reductionin the Central government’s fiscal deficit over the medium term, and in reducing thekey risks to fiscal marksmanship (the difference between actual outcomes andbudgetary estimates as a proportion of GDP).
3.2 Latest available data indicate nascent signsof a turnaround in the macroeconomic environment.The stress witnessed in 2011-12 continued throughthe first half of the current year delaying the recoveryprocess. This was manifest with growth continuingto be below 5.5 per cent, inflation moderatingsomewhat but continuing to be above 7 per cent,and only a brief moderation in the global crude oilprices. A pickup in financial markets, which gainedsteam as reforms were rolled out, the moderationin WPI inflation to 6.6 per cent in January 2013 anda bottoming out of industrial slowdown are broadindications of the turnaround. Indicating the trendsin fiscal outcome in the first half of the current fiscal,the Mid-Year Economic Analysis 2012-13, pointedout that the mid-year threshold benchmarks in termsof fiscal responsibility and budget management(FRBM) rules had not been met and with thecorrective measures proposed, fiscal deficit waslikely to exceed budget estimates by 0.2 percentage
point. The seriousness of the challenge can be seenby comparing the assumptions that were madewhen the Budget was presented with the actualoutcome so far.
3.3 The Budget for 2012-13 was presented on16 March 2012 in an atmosphere of uncertaintyabout the global and domestic economic outlook.The continued high levels of global crude oil pricesand domestic pressures that were manifest inpersistent inflation, which necessitated keepinginterest rates high, had their impact on aggregatedemand (both consumption and investment). TheBudget for 2012-13 attributed India’s growthslowdown in 2011-12 to weak industrial growth andunderscored the recovery in core sectors at thattime which was seen as a sign of gradual recovery.Real GDP thus was projected to grow at around7.6 per cent with inflation moderating on year-on-year basis. The fiscal slippage in 2011-12 was due
http://indiabudget.nic.in

57Public Finance
to lower realization in direct tax revenues and underprovisioning of subsidies. Recognizing the need forfunding the higher levels of outgo on subsidies onaccount of elevated levels of global crude oil prices,higher provision was made for the same in Budget2012-13. However, as part of the fiscal consolidationprocess, the Budget also announced the intent torestrict expenditure on central subsidies to under2 per cent of GDP.
3.4 The Budget for 2012-13 introducedamendments to the FRBM Act as part of the FinanceBill. These amendments contained two importantfeatures of expenditure reforms. First is theintroduction of the concept of effective revenuedeficit, which excludes from the conventional revenuedeficit, grants for the creation of capital assets. Thisis an important development for the reason that whilethe revenue deficit of the consolidated generalgovernment fully reflects total capital expenditureincurred, in the accounts of the centre, thesetransfers are shown as revenue expenditure.Therefore the mandate of eliminating the conventionalrevenue deficit of the centre becomes problematic.With this amendment, the endeavour of thegovernment under the FRBM Act would be toeliminate the effective revenue deficit. Similarly, atstate level also, some of the capital transfers tolocal bodies or parastatals could get reflected asrevenue expenditure. By understating capitalexpenditure, this might lead to a divergence betweenthe national accounts data on capital formation onthe government accounts and the conventional publicfinance data that is gleaned from the Budgets.
3.5 The second important feature is theintroduction of the provision for 'Medium TermExpenditure Framework Statement’ in the FRBMAct. This medium-term framework provides for rollingtargets for expenditure, imparting greater certainty,and encourages prioritization of expenditure.Together with the measures proposed to raise thetax-GDP ratio, the expenditure reforms are expectedto yield better fiscal marksmanship, therebymitigating key fiscal risks.
FISCAL MARKSMANSHIP
3.6 Post the FRBM Act but prior to global financialcrisis, significant fiscal consolidation was achievedwith the fiscal deficit of the centre declining rapidlyto 2.5 per cent of GDP in 2007-8, which was muchbelow the threshold target of 3 per cent set in the
FRBM Act (Table 3.1). However, the government’sfiscal policy is evaluated not only on overall fiscalmarksmanship in terms of fiscal and revenue deficitswhich are in effect-derived indicators, but also onmarksmanship in terms of key revenue andexpenditure targets.
3.7 It is useful to note that in the immediate post-FRBM period, fiscal marksmanship of the centralgovernment had a series of overperformances to itscredit except in 2008-9 and in 2011-12(Figure 3.1). While the overshooting of the deficittargets in 2008-9 was a conscious decision toobviate the adverse impact of the global financialcrisis, the large slippage in 2011-12 owed to aconfluence of adverse economic outcomes arisingfrom global and domestic factors. It was on accountof lower receipts (which explains about 58 per centof total slippage) due to a sharp deceleration in realGDP growth, particularly in the industry sector,elevated levels of inflation, subdued financial marketconditions for generating the required disinvestmentreceipts, and overshooting of expenditure(accounting for the remaining 42 per cent of slippage)mainly on account of persistently high levels of globalcrude oil and fertilizer prices which were not passedthrough to the domestic price setting. Thus the risks
Table 3.1 : Trends in Deficits of CentralGovernment
Year Revenue Fiscal Primary RevenueDeficit Deficit Deficit Deficit as
per centof Fiscal
Deficit
(As per cent of GDP) Enactment of FRBM 2003-4 3.5 4.3 0.0 79.7 2004-5 2.4 3.9 0.0 62.3 2005-6 2.5 4.0 0.4 63.0 2006-7 1.9 3.3 -0.2 56.3 2007-8 1.1 2.5 -0.9 41.4 2008-9 4.5 6.0 2.6 75.2 2009-10 5.2 6.5 3.2 81.0 2010-11 3.2 4.8 1.8 67.5 2011-12(BE) 3.4 4.6 1.6 74.4 2011-12(P) 4.3 5.7 2.6 75.5 2012-13(BE) 3.5 5.1 1.9 68.2
Sources : Union Budget documents and ControllerGeneral of Accounts.BE : Budget Estimates.P: Provisional Actuals (Unaudited).Notes: The ratios to GDP at current market prices (CMP)
are based on the Central Statistics Office’s (CSO)National Accounts 2004-5 series.
http://indiabudget.nic.in

58 Economic Survey 2012-13
to the fiscal outcome are in realizing the budgetedrevenues and underprovisioning of key expenditureitems; both of which were exacerbated in 2011-12and 2012-13 (April-September).
3.8 Fiscal outcome is also affected by theunderlying assumption regarding the nominal GDP.Declining fiscal deficit as a ratio of GDP may be anoutcome of either declining growth of fiscal deficitover time or increasing growth of GDP over time orboth. In the post-FRBM period prior to 2008-9, thedeclining fiscal deficit to GDP ratio was mainly anoutcome of a decline in the growth of the fiscal deficit(Table 3.2). In the year 2011-12 a suddenovershooting of the growth of the fiscal deficit ascompared to growth in GDP over the previous yearcaused a higher fiscal deficit to GDP ratio.
NON-DEBT RECEIPTS
3.9 At the time of the annual budget, fiscaladjustment is essentially about the assumptionsregarding the growth in total non-debt receipts andtotal expenditure of the Central government. TheBudget for 2012-13 envisaged a growth of 22.7 percent in non-debt receipts (revenue receipts plus non-debt capital receipts) and in total expenditure of13.1 per cent over 2011-12 (revised estimates [RE]).Revenue receipts were estimated at ̀ 9,35,685 crorein BE 2012-13, which comprised net tax revenue of` 7,71,071 crore and non-tax revenue of` 1,64,614 crore. Together with recoveries of loansof ` 11,650 crore and disinvestment receipts of ̀ 30,000 crore, the Budget for 2012-13 placed non-debt receipts for the year at ̀ 9,77,335 crore. Beforeevaluating the assumptions for the current fiscal, itwould be instructive to analyse the outcome in2011-12 vis-à-vis assumptions behind the 2011-12(budget estimates [BE]).
3.10 The Budget for 2011-12 had estimated a year-on-year growth of 3.6 per cent in non-debt receiptscomprising a growth of 18.5 per cent in gross taxrevenue and (-) 43.0 per cent in non-tax revenueover 2010-11 (RE). After adjusting for onetimereceipts from the auction of 3G-spectrum in2010-11(RE), year-on-year growth in 2011-12 (BE)of non-debt receipts and non-tax revenue wereplaced at 19.1 per cent and 9.9 per cent respectively.The actual outcome as per the provisional data ofthe Controller General of Accounts indicates a growthof (-)3.3 per cent, 13.2 per cent and (-) 43.5 percent in 2011-12 for non-debt receipts, gross taxrevenue, and non-tax revenue respectively over2010-11(RE). Adjusting for onetime receipts of
Table 3.2 : Trends in Fiscal Deficit andGDP
Year Fiscal Growth GDP at GrowthDeficit in Fiscal current in
Deficit market GDPprices
( `̀̀̀̀ crore)(Per cent) ( `̀̀̀̀ crore)(Per cent)
2004-5 125794 2.0 3242209 14.2 2005-6 146435 16.4 3693369 13.9 2006-7 142573 -2.6 4294706 16.3 2007-8 126912 -11.0 4987090 16.1 2008-9 336992 165.5 5630063 12.9 2009-10 418482 24.2 6477827 15.1 2010-11 373592 -10.7 7795314 20.3 2011-12(P) 509732 36.4 8974947 15.1 2012-13(BE) 513590 0.8 10028118 11.7
Sources : Union Budget documents and ControllerGeneral of Accounts and Central Statistics Office.BE : Budget Estimates.P: Provisional Actuals (Unaudited).
http://indiabudget.nic.in

59Public Finance
auction of 3G-spectrum in 2010-11(RE), year-on-year growth in 2011-12 (Provisional Actuals) ofnon-debt receipts and non-tax revenue are placedat 11.2 per cent and 8.9 per cent respectively.
3.11 While the BE had estimated revenue receiptsat ` 7,89,892 crore and total expenditure at` 12,57,729 crore, the provisional actuals were` 7,56,193 crore and ̀ 12,98,444 crore respectively,leaving a fiscal deficit of ̀ 5,09,732 crore as against` 4,12,817 crore budgeted (Appendix Table 2.19).As indicated earlier, the actual fiscal outcome wasaffected by certain adverse macroeconomicdevelopments in 2011-12. A somewhat longer-horizon analysis of the growth in non-debt receiptsand expenditure indicates a mixed outcome. A widegap can be observed between the non-debt receiptsto GDP ratio and total expenditure to GDP ratiowhich essentially reflects the extent of the fiscaldeficit (Table 3.3). As a proportion of GDP, totalexpenditure in the post crisis period is significantly
lower [Figure 3.2(a)]. On the other hand, non-debtreceipts to GDP ratio remained volatile in the postcrisis period, it has nonetheless been estimated toimprove in 2012-13 (BE) as compared to the previousyear. It is further to be observed that since 2008-9the growth of total expenditure has been generallydeclining except for the BE of 2012-13. The highergrowth of total expenditure in 2012-13 (BE) wouldhave to be compensated by much higher growth inrevenue receipts [Figure 3.2(b)]. This would in effectmean a higher tax buoyancy which was premisedon a turnaround in macroeconomic environmentenvisaged at the time of BE 2012-13.
3.12 Tax buoyancy is a measure of theresponsiveness of tax receipts with respect to GDPor National Income. A tax is buoyant when revenuesincrease by more than 1 per cent for a 1 per centincrease in GDP. In the post FRBM period, bothdirect and indirect taxes remained buoyant exceptin the crisis years (2008-9 and 2009-10) and
Table 3.3 : Receipts and Expenditure of the Central Government
2007-8 2008-9 2009-10 2010-11# 2011-12 2011-12 2012-13(BE) (P) (BE)
(As per cent of GDP)
1. Revenue receipts (a+b) 10.9 9.6 8.8 10.1 8.8 8.4 9.3(a) Tax revenue (net of states’ share) 8.8 7.9 7.0 7.3 7.4 7.0 7.7(b) Non-tax revenue 2.1 1.7 1.8 2.8 1.4 1.4 1.6
2. Revenue expenditure 11.9 14.1 14.1 13.4 12.2 12.7 12.8of which: (a) Interest payments 3.4 3.4 3.3 3.0 3.0 3.0 3.2(b) Major subsidies 1.3 2.2 2.1 2.1 1.5 1.6 1.8(c) Defence expenditure 1.1 1.3 1.4 1.2 1.1 1.1 1.1
3. Revenue deficit (2-1) 1.1 4.5 5.2 3.2 3.4 4.3 3.54. Capital receipts 3.4 6.1 7.0 5.2 5.2 6.0 5.5
of which: (a) Recovery of loans 0.1 0.1 0.1 0.2 0.2 0.2 0.1(b) Other receipts (mainly CPSEs 0.8 0.0 0.4 0.3 0.4 0.2 0.3
disinvestment)(c) Borrowings and other liabilities $ 2.5 6.0 6.5 4.8 4.6 5.7 5.1
5. Capital expenditure 2.4 1.6 1.7 2.0 1.8 1.8 2.06. Non-debt receipts 11.7 9.7 9.4 10.6 9.4 8.8 9.77. Total expenditure [2+5=7(a)+7(b)] 14.3 15.7 15.8 15.4 14.0 14.5 14.9
of which: (a) Plan expenditure 4.1 4.9 4.7 4.9 4.9 4.6 5.2(b) Non-plan expenditure 10.2 10.8 11.1 10.5 9.1 9.9 9.7
8. Fiscal deficit (7-6) 2.5 6.0 6.5 4.8 4.6 5.7 5.19. Primary deficit [8-2(a)] -0.9 2.6 3.2 1.8 1.6 2.6 1.9
Sources : Union Budget documents and Controller General of Accounts.CPSEs Central Public Sector Enterprises.# Based on provisional actuals for 2010-11. $ Does not include receipts in respect of the Market Stabilization Scheme, which will remain in the
cash balance of the central government and will not be used for expenditure.Notes : 1. The ratios to GDP at current market prices are based on the CSO’s National Accounts 2004-5 series.
2. The figures may not add up to the total due to rounding/approximations.
http://indiabudget.nic.in

60 Economic Survey 2012-13
2011-12 (Figure 3.3). During 2011-12, both directand indirect tax revenues grew at a lower rate thanwhat the BE envisaged as well as the 2010-11growth rate (Table 3.4) mainly because of economicslowdown, weak market sentiment, slow investmentgrowth, global uncertainty, and persistent highinflation. This led to a sharp fall in tax buoyancy in2011-12. The decline has been more in corporatetaxes than personal income taxes. During thisperiod, direct tax buoyancy (ratio of direct taxesgrowth to nominal GDP growth) also declined andhas been less than 1. This may be on account oflower profitability of corporates considering higherinflation.
3.13 The Budget for 2012-13 estimated higher taxrevenues on the strength of several measuresannounced like widening of the base of service taxthrough a single negative list (of exemptedcategories), a new schedule of rates and slab for
personal income tax, raising of the standard rate ofexcise duty as well as merit rates and the peakrate of customs duty of 10 per cent that had beenleft unchanged notwithstanding the pickup in importdemand. The details of the trends in differentcomponents of tax revenue and non-tax revenue arediscussed in the following paragraphs.
DIRECT TAXES
3.14 As is evident from Table 3.4, there has beena compositional change in gross tax revenues since2007-8. As a proportion of GDP, direct taxesaccounted for 5.5 per cent in 2011-12, well belowthe peak of 5.9 per cent in 2007-8. The Budget for2012-13 envisaged a growth of 13.9 per cent indirect taxes over 2011-12 (RE). Continuing with thepolicy of moderation of tax rates, the Budget hasfurther broadened the slabs for individual taxpayers.The exemption limit for individual taxpayers below
http://indiabudget.nic.in

61Public Finance
the age of 60 years has been enhanced from` 1,80,000 to ̀ 2 lakh. The income slab for 20 percent tax rate has been broadened for all individualtaxpayers irrespective of their age and will now beapplicable to total income between ` 5 lakh and` 10 lakh instead of the earlier slab of ` 5 lakh and` 8 lakh. The tax rate of 30 per cent will now beapplicable to total income exceeding ` 10 lakh.Securities transaction tax on certain transactionsin specified securities has been reduced from theexisting 0.125 per cent to 0.1 per cent.
3.15 The two specific measures aimed atexpanding the direct tax base in the Budget for
2012-13 were the introduction of the provisions ofGAAR in the Income Tax Act and extending theprovisions of alternate minimum tax (AMT) to allnon-company assessees. In an environment ofmoderate rates of tax, it is necessary that the correcttax base be subject to tax in the face of aggressivetax planning and use of opaque low tax jurisdictionsfor residence as well as for sourcing capital. Theneed for making statutory provisions for codifyingthe doctrine of ‘substance over form’ has beenrealized by introducing the chapter on GAAR.However, in view of the apprehensions raised aboutthe Rules and the recommendations of the ShomeCommittee, the provisions have been deferred.
Table 3.4 : Sources of Tax Revenue
2007-8 2008-9 2009-10 2010-11 2011-12 2011-12 2012-13(BE) (P) (BE)
( `̀̀̀̀ crore)Direct (a) 295938 319859 367648 438477 525151 489312 564337Personal income tax 102644 106046 122475 139069 164526 165276 189866Corporation tax 192911 213395 244725 298688 359990 323250 373227Indirect(b) 279031 269433 244737 344530 397250 392273 504423 Customs 104119 99879 83324 135813 151700 149489 186694 Excise 123611 108613 102991 137701 163550 145205 193729 Service tax 51301 60941 58422 71016 82000 97579 124000Gross tax revenue # 593147 605299 624528 793072 932440 890622 1077611
Tax revenue as a percentage of gross tax revenue
Direct (a) 49.9 52.8 58.9 55.3 56.3 54.9 52.4Personal income tax 17.3 17.5 19.6 17.5 17.6 18.6 17.6Corporation tax 32.5 35.3 39.2 37.7 38.6 36.3 34.6Indirect(b) 47.0 44.5 39.2 43.4 42.6 44.0 46.8 Customs 17.6 16.5 13.3 17.1 16.3 16.8 17.3 Excise 20.8 17.9 16.5 17.4 17.5 16.3 18.0 Service tax 8.6 10.1 9.4 9.0 8.8 11.0 11.5
Tax revenue as a percentage of gross domestic product
Direct(a) 5.9 5.7 5.7 5.6 5.8 5.5 5.6Personal income tax 2.1 1.9 1.9 1.8 1.8 1.8 1.9Corporation tax 3.9 3.8 3.8 3.8 4.0 3.6 3.7Indirect(b) 5.6 4.8 3.8 4.4 4.4 4.4 5.0 Customs 2.1 1.8 1.3 1.7 1.7 1.7 1.9 Excise 2.5 1.9 1.6 1.8 1.8 1.6 1.9 Service tax 1.0 1.1 0.9 0.9 0.9 1.1 1.2Gross tax revenue # 11.9 10.8 9.6 10.2 10.4 9.9 10.7
Sources : Union Budget documents and Controller General of Accounts.# includes taxes referred in (a) & (b) and taxes of Union Territories and ‘other’ taxes.Notes: 1. Direct taxes also includes taxes pertaining to expenditure, interest, wealth, gift, and estate duty.
2. The ratios to GDP at current market prices are based on the CSO’s National Accounts 2004-5series.
http://indiabudget.nic.in

62 Economic Survey 2012-13
3.16 Besides the above, in order to widen the taxbase, the provisions regarding AMT have beenextended to all non-company assessees and it isprovided that a person other than a company thathas claimed deduction under any section (other thansection 80P) included in Chapter VI-A under theheading 'C – Deductions in respect of certainincomes’ or under section 10AA, shall be liable topay AMT at the rate of 18.5 per cent. In order tobring about greater certainty and to reduce litigationin matters related to transfer pricing and internationaltaxation, the advance pricing agreement (APA)scheme has been notified. APA is an agreement inadvance between a taxpayer and the revenuedepartment on an appropriate transfer-pricingmethodology for a set of transactions over a fixedperiod of time in the future. APAs therefore offer
better assurance on transfer-pricing methods andare conducive for providing certainty and unanimityof approach.
3.17 The modernization of the business processesof the tax administration through extensive use ofinformation technology is continuing, viz. along withe-filing of income tax returns, various forms, auditreports, and statements of tax deduction at sourcehave been made compatible with electronic filingand computerized centralized processing. Thesemeasures would enable tax administration to functionin a more efficient and automated environment.
INDIRECT TAXES
3.18 The Budget for 2012-13 estimated revenuefrom indirect taxes to grow by 26.7 per cent over
Box 3.1 : Sector-Specific Proposals in Central Excise1. CEMENT: The excise duty structure on cement manufactured and cleared in packaged form rationalized. The graded
retail selling price (RSP) slabs for the purpose of charging of duty on cement manufactured and cleared in packagedform done away with. The duty rates on cement and cement clinkers revised as follows:
Description Revised rate of duty1. Cement manufactured and cleared in packaged form:-
(a) from mini cement plants 6% + ` 120 per tonne(b) from other than mini cement plants 12% + ` 120 per tonne
2. Cement cleared other than in packaged form. 12%3. Cement clinker 12%
Cement also notified under section 4A, that is RSP-based assessment with an abatement of 30 per cent on RSP.
2. PRECIOUS METALS: (i) Excise duty on gold jewellery sold from export-oriented units (EOUs) into domestic tariffarea (DTA) increased from 5 per cent to 10 per cent; (ii) Excise duty on refined gold increased from 1.5 per cent to 3per cent; (iii) Excise duty on gold produced from copper smelting increased from 2 per cent to 3 per cent; (iv) Exciseduty on silver produced from copper smelting reduced from 6 per cent to 4 per cent; (v) Gold coins of 99.5 per cent andabove purity and silver coins of 99.9 per cent and above purity manufactured out of duty paid gold fully exemptedfrom excise duty; (vi) Articles of gold /silver jewellery exempted from excise duty.
3. MASS CONSUMPTION ITEMS: (i) Refills and inks used for the manufacture of writing instruments of value notexceeding ` 200 per piece fully exempted from excise duty subject to actual user condition;(ii) Exemption limit onfootwear enhanced from ` 250 per pair to ̀ 500 per pair. Footwear above ̀ 500 per pair to attract excise duty of 12 percent; (iii) Excise duty on iodine reduced from 10 per cent to 6 per cent.
4. ENVIRONMENT-FRIENDLY GOODS: (i) Excise duty reduced from 10 per cent to 6 per cent on battery packssupplied to manufacturers of electric vehicles for use as spares and original equipment manufacturers subject to end-use condition; (ii) Excise duty reduced from 10 per cent to 6 per cent on specific parts of hybrid vehicles supplied tomanufacturers of hybrid vehicles subject to end-use condition; (iii) Excise duty on LED lamps reduced to 6 per cent.
5. PETROLEUM: The rate of cess leviable on indigenous petroleum crude oil under the Oil Industry (Development) Act1974 increased from ` 2500 per metric tonne to ` 4500 per metric tonne.
6. TEXTILES: For the purpose of charging excise duty on ready-made garments bearing a brand name or sold under abrand name, the level of abatement from RSP increased from 55 per cent to 70 per cent.
7. MISCELLANEOUS: (i) Full exemption from excise duty provided to food preparations containing fruits and vegetablesfalling under Chapter 20, which are prepared in a hotel, restaurant, or retail outlet, whether or not such food isconsumed in such hotels/restaurants/retail outlets; (ii) The composite rate applicable to automobile chassis convertedinto an ad valorem rate and fixed at 14 per cent for diesel driven buses, lorries, and trucks; (iii) Excise duty on parts ofmobile phones, other than those cleared to a manufacturer of mobile phones, reduced from 10 per cent to 2 per cent,provided no Cenvat credit is taken; (iv) Excise duty reduced from 10 per cent to 6 per cent on matches manufacturedby semi-mechanized units and processed food products of soy; (v) Full exemption from excise duty withdrawn frommega/ultra mega power projects except 113 specified projects.
http://indiabudget.nic.in

63Public Finance
2011-12 (RE) on the strength of assumed economicrecovery. In so far as union excise duties areconcerned, the BE 2012-13 envisaged a growth of29.1 per cent in revenue over 2011-12 (RE). Anincrease in the effective rate of excise duty onnon-petroleum products from 10 per cent earlier to12 per cent in BE 2012-13 and a pickup in themanufacturing sector were the bases for theseassumptions. The Budget for 2012-13 also madethe following other changes: raised the concessionalrate of excise duty on non-petroleum products from5 per cent to 6 per cent; increased the lower rate onnon-petroleum products without Cenvat Credit from1 per cent to 2 per cent with the exception of coaland fertilizers; enhanced the rate of excise duty from22 per cent to 24 per cent and from '22 per cent+` 15,000 per vehicle’ to 27 per cent on certaincategories of automobiles; increased the rates ofspecific excise duty on cigarettes (both filter andnon-filter) of length exceeding 65mm; raised theexcise duty on cigars, cheroots, and cigarillos to'12 per cent or ̀ 1,370 per thousand, whichever is
higher’; increased the basic excise duty on hand-rolled bidis from ` 8 to ` 10 per thousand and onmachine-rolled bidis from `19 to ` 21 perthousand (See Box 3.1 for sector-specificdetails).
3.19 In so far as revenue from customs isconcerned, the Budget for 2012-13 envisaged agrowth of 22.0 per cent over 2011-12 (RE). The twoimportant general reductions in customs duties werethe exemption of education cess and secondaryand higher education cess from the CVD portion ofcustoms duty so as to avoid computation of suchcesses twice; the duty-free allowance under thebaggage rules has been increased for adultpassengers of Indian origin from ` 25,000 to` 35,000 (returning after stay abroad of more thanthree days) and from ̀ 12,000 to ̀ 15,000 (returningafter stay abroad of three days or less). Continuingwith the practice of sectoral changes in duty rates,Budget 2012-13 announced many sector-specificmeasures (Box 3.2).
Box 3.2 : Sector-specific changes in Customs:1. AGRICULTURE/AGRO PROCESSING/PLANTATION SECTOR: (i) Basic customs duty on sugarcane planter, root
or tuber crop-harvesting machine and rotary tiller and weeder and parts and components for their manufacture reducedfrom 7.5 per cent to 2.5 per cent; (ii) At present, project import status available for installation of mechanized handlingsystems and pallet racking systems in mandis or warehouses for foodgrains and sugar, with concessional rate of basiccustoms duty of 5 per cent. Such systems also exempt from additional duty of customs (CVD) and special additionalduty of customs (SAD). The same dispensation extended to such systems installed in mandis or warehouses forhorticultural produce; (iii) Project import status granted to greenhouses set up for protected cultivation of horticultureand floriculture produce with concessional basic customs duty of 5 per cent; (iv) Basic customs duty reduced from 10per cent/7.5 per cent to 5 per cent (until March 2014) on specified coffee plantation and processing machinery;(v) Basic customs duty reduced from 10 per cent to 5 per cent (until March 2014) on coffee brewing and vendingmachines (commercial type). Basic customs duty also reduced to 2.5 per cent on parts required for manufacture of suchcoffee- brewing and -vending machines; (vi) Basic customs duty reduced on specified soluble fertilizers and liquidfertilizers, other than urea, from 7.5 per cent to 5 per cent and from 5 per cent to 2.5 per cent respectively.
2. AUTOMOBILES: Basic customs duty on completely built units (CBUs) of large cars/ MUVs/ SUVs permitted forimport without type approval (value exceeding US $ 40,000 and engine capacity exceeding 3000 cc for petrol and 2500cc for diesel) increased from 60 per cent to 75 per cent.
3. METALS: (i) Basic customs duty on coating material for manufacture of electrical steel reduced from 10 per cent to 5per cent subject to actual user condition; (ii) Basic customs duty on ammonium meta-vanadate used in the manufactureof ferro-vanadium reduced from 7.5 per cent to 2.5 per cent; (iii) Nickel oxide/ hydroxide and nickel ore/ concentratefully exempted from basic customs duty; (iv) Exemption from SAD currently available to CRGO steel restricted toprime quality of such steel; (v) Basic customs duty on flat rolled products (HR and CR) of non-alloy steel increased from5 per cent to 7.5 per cent.
4. PRECIOUS METALS: (i) Basic customs duty on standard gold bars and platinum increased from 2 per cent to 4 percent; (ii) Basic customs duty on non-standard gold increased from 5 per cent to 10 per cent; (iii) Additional customsduty on gold ore/concentrate and bars for refining increased from 1 per cent to 2 per cent; (iv) Basic customs duty of 2per cent imposed on cut and polished coloured gemstones.
5. CAPITAL GOODS/INFRASTRUCTURE: (i) Basic customs duty on capital goods, plant, and equipment importedfor setting up or substantial expansion of iron ore pellet plants or iron ore beneficiation plants reduced from 7.5 per centto 2.5 per cent; (ii) Full exemption from basic customs duty until March 2015 provided for initial setting up andsubstantial expansion of fertilizer projects; (iii) Steam coal fully exempted from basic customs duty. CVD reducedfrom 5 per cent to 1 per cent on such coal (valid up to 31.3.2014); (iv) Natural gas/liquefied natural gas imported forpower generation by a power generation company fully exempted from basic customs duty; (v) Full exemption from
(Contd...)
http://indiabudget.nic.in

64 Economic Survey 2012-13
basic customs duty provided to uranium concentrate, sintered natural uranium dioxide, sintered uranium dioxidepellets for generation of nuclear power; (vi) Full exemption from basic customs duty, CVD and SAD extended toequipment imported for road construction projects awarded by metropolitan development authorities; (vii) Full exemptionfrom basic customs duty and CVD presently available to tunnel boring machines and parts for hydel and road projectsextended to all infrastructure projects without end-use condition; (viii) Full exemption from basic customs duty andCVD extended to tunnel excavation and specified lining equipment also; (ix) Full exemption from basic customs dutyextended to coalmining projects; (x) Basic customs duty for machinery and instruments for surveying and prospectingreduced and unified at 2.5 per cent; (xi) Basic customs duty on railway safety (train protection and warning system)equipment and railway track-laying machines reduced from 10 per cent to 7.5 per cent.
6. AIRCRAFT AND SHIPS: (i) Full exemption from basic customs duty and CVD provided to new and retreaded aircrafttyres; (ii) Full exemption from basic customs duty and CVD extended to parts of aircraft and testing equipment formaintenance and repair of aircraft imported by maintenance, repair, and overhaul (MRO) units; (iii) Customs duties onforeign-going vessels on conversion for coastal trade now to be charged on proportionate basis depending on the periodfor which they operate as coastal vessels in India; (iv) Full exemption from SAD extended to import of dredgers.
7. ENVIRONMENT PROTECTION: (i) Equipment for setting up of solar projects fully exempted from SAD; (ii)Concessional rate of 5 per cent basic customs duty extended to raw materials for the manufacture of intermediates,parts, and sub-parts of blades for rotors for wind energy generators; (iii) Full exemption from basic customs dutyextended to tri band phosphor for use in the manufacture of compact fluorescent lamps; (iv) Full exemption from basiccustoms duty and SAD along with 6 per cent CVD available to specified parts for the manufacture of hybrid vehiclesextended to some additional parts; (v) The customs duty regime of 6 per cent CVD and nil SAD extended to lithium ionbatteries for the manufacture of battery packs for supply to electric or hybrid vehicle manufacturers.
8. HEALTH/NUTRITION: (i) Basic customs duty reduced from 5 per cent to 2.5 per cent on iodine; (ii) Basic customsduty reduced on isolated soya protein and soya protein concentrate from 15 per cent and 30 per cent respectively to 10per cent; (iii) Basic customs duty reduced from 10 per cent to 5 per cent on probiotics; (iv) Customs duty on six specifiedlifesaving drugs/vaccines and their bulk drugs reduced from 10 per cent to 5 per cent with nil CVD; (v) A concessionalimport duty regime of 2.5 per cent basic customs duty with 6 per cent CVD/excise duty and nil SAD prescribed forspecified raw materials for the manufacture of syringes, needles, catheters, cannulas subject to actual user condition.(vi) A concessional import duty regime of 2.5 per cent basic customs duty with 6 per cent CVD and nil SAD extendedto parts and components for the manufacture of blood pressure monitors and blood glucose monitoring systems(glucometers); (vii) Full exemption from basic customs duty and CVD extended to steel tube and wire, cobalt chromiumtube, Hayness Alloy-25, and polypropylene mesh for the manufacture of coronary stents/coronary stent systems andartificial heart valves subject to actual user condition.
9. TEXTILES: (i) Basic customs duty on new shuttle-less looms, along with parts and components for their manufacturereduced from 5 per cent to nil; (ii) Basic customs duty on new automatic silk-reeling and -processing machinery and rawsilk testing equipment reduced from 5 per cent to nil; (iii) The concessional rate of basic customs duty of 5 per centrestricted only to new textiles machinery; (iv) Basic customs duty on wool waste and wool tops reduced from 10 percent and 15 per cent respectively to 5 per cent; (v) Basic customs duty on titanium dioxide reduced from 10 per cent to7.5 per cent; (vi) Full exemption from basic customs duty extended to Aramid yarn and fabric when used in themanufacture of bulletproof helmets for supply to defence and police.
10. ELECTRONICS/ HARDWARE: (i) Full exemption from basic customs duty provided to LCD and LED TV panels of19 inches and above; (ii) LEDs required for the manufacture of LED lamps exempted from SAD; (iii) The scope of fullexemption from basic customs duty, CVD, and SAD extended to parts of memory cards until March 2013; (iv) Fullexemption from basic customs duty currently available to copper, brass, phosphor bronze strips, and similar itemsimported for the manufacture of connectors withdrawn; (v) Full exemption from basic customs duty currently availableto poly-laminated aluminum tape and poly-laminated steel tape if imported for the manufacture of cables andconductors for telecom use withdrawn.
11. EXPORT PROMOTION: (i) Basic customs duty reduced from 10 per cent to 5 per cent on marine seawater pumps withfibre impellers and automatic fish/prawn feeders for aquaculture; (ii) Basic customs duty on artemia reduced from 30per cent to 5 per cent.
12. PAPER: Waste paper fully exempted from basic customs duty.
13. SAD: Brass scrap and timber logs fully exempted from SAD.
14. MISCELLANEOUS: (i) A basic customs duty of 10 per cent imposed on digital still cameras of certain specifications;(ii) Basic customs duty on boric acid increased from 5 per cent to 7.5 per cent; (iii) Basic customs duty on boiler qualitytubes and pipes for the manufacture of boilers reduced from 10 per cent to 7.5 per cent subject to end-use condition; (iv)A concessional customs duty of 5 per cent basic customs duty + 6 per cent CVD+ nil SAD prescribed for imports ofhydrophilic non-woven, hydrophobic non-woven, and super absorbent polymer for manufacture of adult diaperssubject to actual user condition; (v) Full exemption from customs duty withdrawn from mega/ultra mega powerprojects except 113 specified projects.
Box 3.2 : Sector-specific changes in Customs: (Contd..)
http://indiabudget.nic.in

65Public Finance
COLLECTION RATES
3.20 Given the large number of exemptions to theapplication of statutory rate of customs, the increasein value of imports does not necessarily imply similarmagnitude in customs revenue. Collection rates arean indicator of overall incidence of customs tariffsincluding countervailing and special additional dutiesof imports. These are computed as the ratio ofrevenue collected from these duties to the aggregatevalue of imports in a year (or period) and thusrepresent trade-weighted tariffs. The trends in therates for important commodity groups as well as forall commodities taken together over the years areshown in Table 3.5. A major reason for the fall inrates has been the lower levels of duties on manyitems including on petroleum, oil, and lubricants(POL), which has significant import value and ofcourse the impact of the various exemptions. Atoverall level, the effective rate of taxes at around 6per cent in 2011-12 as against the level of simpleaverage tariff rates of basic customs duties and theCVD indicates the impact of exemptions.
SERVICE TAX
3.21 In 2011-12, growth in service tax revenue was37.4 per cent amounting to ` 97,579 crore, which
indicated that service tax has been emerging as animportant source of revenue. Budget 2012-13envisaged a growth of 30.5 per cent in the revenuefrom service tax vis-à-vis 2011-12 (RE). This wasbased on the increase in the rate from the existing10 per cent to 12 per cent and a change in the taxbase (Table 3.6). As against the usual practice ofexpanding the list of services, the Budget for2012-13 introduced a 'negative list’ approach effective1 July 2012. For operationalizing the negative listapproach, a number of changes have been made inChapter V of the Finance Act 1994 (when servicetax was initially introduced). Service of transportationof passengers with or without accompaniedbelongings by railways in first class or an airconditioned coach and services by way oftransportation of goods by railways has beensubjected to service tax effective October 1, 2012.Following the revision in the rate of service tax,changes have also been made in specific andcompounding rates of tax for services in relation topurchase and sale of foreign currency includingmoney changing; promotion, marketing, organizing,or in any manner assisting in organizing lottery; andreversal of Cenvat credit under rule 6(3)(i).
3.22 A number of amendments in the Finance Act1994 and changes in the rules governing the levy of
Table 3.5 : Collection Rates for Selected Import Groups*(in per cent)
Sl. Commodity 2006-7 2007-8 2008-9 2009-10 2010-11 2011-12No. Groups
I POL 5 6 3 2 6 3II Non-POL 12 13 9 8 9 7
of which:1. Food products 23 19 4 3 3 32. Chemicals 22 22 16 14 17 143. Man-made fibres 28 30 17 22 30 224. Paper & newsprint 10 10 8 8 8 75. Natural fibres 12 13 6 4 5 36. Metals 24 24 17 17 22 207. Capital goods 14 16 13 11 13 128. Others 6 6 4 4 4 4
III Total 10 10 7 6 8 6
Source : Department of Revenue, Ministry of Finance* Collection rate is defined as the ratio of revenue collection (basic customs duty + countervailing duty) to value of importsunadjusted for exemptions, expressed in percentage.
Notes : S.No. 1 includes cereals, pulses, tea, milk and cream, fruits, vegetables, animal fats, and sugar.S.No. 2 includes chemical elements, compounds, pharmaceuticals, dyeing and colouring materials, plastic, and rubber.S.No. 4 includes pulp and waste paper, newsprint, paperboards and manufactures, and printed books.S.No. 5 includes raw wool and silk. S.No. 6 includes iron and steel and non-ferrous metals.S.No. 7 includes non-electronic machinery and project imports, electrical machinery.
http://indiabudget.nic.in

66 Economic Survey 2012-13
service tax have been made. These include: thePlace of Provision of Service Rules 2012; new reversecharge mechanism; Cenvat Credit Rules 2004;Service Tax Rules 1994; and Point of Taxation Rules2011 (Box 3.3).
TAX EXPENDITURE
3.23 There is significant divergence between thestatutory rates of taxes as notified in the variousschedules and the actual or effective rate of taxation,which is essentially a simple ratio of tax revenuecollected to the tax base. This arises on account ofthe exemptions to the tax rate specified in theschedule. As indicated earlier in the section oncollection rates, the magnitude of revenue foregone(tax expenditure) is indeed high. In the ReceiptsBudget for 2012-13, tax foregone on account ofexemptions under corporate income tax for2010-11 and 2011-12 was estimated at ` 57,912crore and ̀ 51,292 crore respectively net of MAT. Inthe case of corporate taxpayers, deduction onaccount of accelerated depreciation, deduction forexport profits of export-oriented units located inspecial economic zones (SEZs) and profits ofbusinesses in the power and telecom sectors weresome of the major incentives. The absolute amountof deductions has decreased as a result of phasingout of profit-linked deductions. Further, the levy of
MAT has led to a higher effective rate of taxation inthe case of corporates from 20.55 per cent for2006-7 to 24.1 per cent for financial year 2010-11.Tax forgone on account of exemptions underpersonal income tax for individual taxpayers wasestimated at ` 30,653 crore and ` 35,698 crorerespectively in 2010-11 and 2011-12. The bulk ofthe revenue foregone under personal income tax wason account of the exemptions given for certaininvestments and payments under section 80 C ofthe Income Tax Act.
3.24 In so far as indirect taxes are concerned,revenue forgone is defined as the difference betweenduty that would have been payable but for the issueof exemption notification and actual duty paid interms of the relevant notification. The revenue forgonefor financial year 2011-12 in respect of excise dutiesis estimated at ̀ 2,12,167 crore including ̀ 12,880crore on account of area-based exemptions. Dutyforgone for the year 2010-11 on account of all theexemption notifications on customs was estimatedat ` 2,30,131 crore as against the duty forgone of` 2,33,950 crore in 2009-10. This is projected to riseto ` 2,76,093 crore in 2011-12. All these estimatesare based on certain assumptions and have to beinterpreted with caution and the actual outcome indynamic markets with different elasticities fordifferent products may turn out to be very different.
Table 3.6 : Service Tax: A Growing Revenue Source
Year No. of services Tax rate in Revenue Growth overper cent (` crore) previous
year in per cent
2004-5 75 10 14200 80.0
2005-6 78 10 23055 62.4
2006-7 92 12 37598 63.1
2007-8 98 12 51301 36.4
2008-9 106 12* 60941 18.8
2009-10 109 10 58422 -4.1
2010-11 117 10 71016 21.6
2011-12(P) 119 10 97579 37.4
2012-13 Negative list# 12 80927 33.0(April- December)@
Source : Receipts Budget and Controller General of Accounts.* Reduced to 10% w.e.f. 24 February 2009.@ Growth for 2012-13 (April-December) is over corresponding period previous year.# Shifted to negative list approach w.e.f 1 July 2012.
http://indiabudget.nic.in

67Public Finance
Box 3.3 : Changes in Service Tax1. PLACE OF PROVISION OF SERVICES RULES 2012: An important component of the changes is the introduction of
the Place of Provision of Services Rules 2012. The new rules have replaced the existing Export of Services Rules 2005 andthe Taxation of Services (Provided from Outside India and Received in India)Rules 2006. Rule 5 of the export rules hasbeen incorporated in Service Tax Rules.
2. AMENDMENTS IN THE FINANCE ACT 1994: Chapter V of the Finance Act 1994 has been amended to: (i) Prescribethat the value of taxable service (particularly in the case of import and export of taxable services)and the rate of taxshall be determined in terms of Point of Taxation Rules 2011; (ii) Introduce provisions relating to special audit in theservice tax law on the lines of the Central Excise Act 1944. Now special audit can be ordered under specified circumstances.Consequently, section 14AA has been omitted from section 83; (iii) Increase the one-year time limit for issuance ofnotice for specified category of offences prescribed under section 73(1)of the Finance Act 1994 to 18 months. A new sub-section (1A)has been inserted in section 73 of the Finance Act 1994 to prescribe that follow-on notices issued on the samegrounds need not repeat the grounds but only state the amount of service tax chargeable for the subsequent period.Statement of tax due for the subsequent period, served on the assessees with reference to the earlier demand notice, willbe deemed as a notice under section 73(1)of the Finance Act 1994; (iv) Make Settlement Commission provisionsapplicable to service tax in line with the similar provisions contained in the Central Excise Act 1944; (v) Make therevision mechanism prescribed in section 35EE of the Central Excise Act 1944 applicable to service tax to the extentpossible; (vi) Amend sections 85 and 86 on the lines of sections 35 and 35E of the Central Excise Act so as to harmonizethe limitation for filing assessee's appeal before Commissioner (Appeals)and revenue appeal before the Tribunal; (vii)Obtain powers (a) to provide for the manner of compounding and to specify the amount of compounding of offencesalong the lines of Central Excise (Compounding of Offences)Rules 2005; (b) to provide for rules for settlement of casesalong the lines of Central Excise.
3. NEW REVERSE CHARGE MECHANISM: (i) Section 68(2) of the Finance Act,1994 has been amended to put the onusof payment of service tax on reverse charge basis partly on service provider and partly on service receiver. The schemehas been made applicable on three specific services, i.e. hiring of means of transport; construction; and manpowersupply and security services; (ii) Consequent to the above change, suitable amendment has also been made in theconcept of 'person liable to pay' provided in Rule 2(1)(d) of Service Tax Rules 1994.
4. RENTING OF IMMOVABLE PROPERTY SERVICE: Constitutional validity of the levy of service tax on renting ofimmovable property had been the subject matter of litigation leading to pronouncement of court judgments favourableto revenue, including those of Hon'ble Delhi High Court and Hon'ble Supreme Court. Taking an overall view, thegovernment has decided to waive the penalty for those taxpayers who pay the service tax due on the renting ofimmovable property service (as on 6.3.2012), in full along with interest. For this purpose, a new section 80A has beeninserted in the Finance Act 1994. This scheme of penalty waiver was open only for a period of six months from the dateof enactment of the Finance Bill 2012.
5. AMENDMENTS IN RULES: (i) Cenvat Credit Rules 2004 have been amended as follows: (a) Existing rule 5 replacedwith a new rule to simplify the procedure for refund of unutilized credit on account of exports; (b) Credit allowed onmotor vehicles (except those under heading nos 8702, 8703, 8704, 8711 and their chassis). The credit of tax paid on thesupply of such vehicles on rent, insurance, and repair is also allowed; (c) Credit of insurance and service station serviceis allowed to insurance companies in respect of motor vehicles insured and re-insured by them; and manufacturers inrespect of motor vehicles manufactured by them; (d) Rules 4(1)and 4(2)amended to allow a service provider to takecredit of inputs or capital goods whenever the goods are delivered to him, subject to specified conditions. (e) Rule 7 forinput service distributors amended to provide that credit of service tax attributable to service used wholly in a unitshould be distributed only to that unit and that the credit of service tax attributable to service used in more than one unitshould be distributed prorata on the basis of the turnover of the concerned unit to the sum total of the turnover of allthe units to which the service relates. (f) Rule 9(1)(e)amended to allow availment of credit on the tax payment challanin case of payment of service tax by the service receiver on reverse charge basis.(ii) Service Tax Rules, 1994 has been amended as follows: (a) The time period provided in rule 4A for issuance of
invoice increased to 30 days. For banks and financial institutions providing banking and other financial services, theperiod is 45 days; (b) Rule 6(4A)amended to allow unlimited amount of permissible adjustments. (c) In case ofexport and individuals and firms rendering eight specified services, the point of taxation shifted from the Point ofTaxation Rules to the Service Tax Rules. (d) In case of exporters, the period extended by the Reserve Bank of India(RBI)on specific requests included in the period for which the tax liability is allowed to be deferred. (e) The optionof deferred payment allowed for all service providers rather than for specific services. The facility is available onlyto individuals and partnership firms (including limited liability partnership)up to a turnover of taxable services of` 50 lakh subject to the condition that their turnover of taxable services in previous year was below ̀ 50 lakh. Forcomputing the above limits, the turnover of the whole entity is required to be summed up and not any singleregistration.
(iii) Point of Taxation Rules 2011 have been amended to : (a) Change the definition of continuous supply of service tocapture the entire dimension of the concept, viz. the recurrent nature of services and the obligation for paymentperiodically or from time to time; (b) Omit rule 6 in respect of continuous supply of service and merge it with rule3. Rules 4 and 5, which deal with situations covering change in effective rate of tax and taxation of new services, arenow applicable to continuous supply of services also; (c) Define the date of payment; (d) Give an option todetermine the point of taxation in respect of advances up to ̀ 1000 received in excess of the amount indicated in theinvoice, on the basis of invoice or completion of service rather than payment; and (e) Incorporate a new residual ruleto ascertain point of taxation in cases where the same could not be ascertained by the rules prescribed.
http://indiabudget.nic.in

68 Economic Survey 2012-13
Nevertheless, there is merit in limiting the exemptionsor their grandfathering on a case-by-case basis soas to realize fuller tax potential through a wider taxbase.
NON-TAX REVENUE
3.25 Non-tax revenues grew at a compound annualrate of 7.6 per cent in the 10 years ending 2009-10.The spurt in 2010-11 owed to higher-than-budgetedrealization from the proceeds of auction of telecom3G/broadband wireless access spectrum. As againstthe estimated revenue of ` 1,25,435 crore in2011-12 (BE), the realization fell marginally short at` 1,24,307 crore notwithstanding the fact that theauctions of telecom spectrum and phase III FM Radiowhich were to bring in ̀ 14,600 crore could not takeplace. Budget 2012-13 estimated a growth of 32.0per cent over 2011-12 (RE) in non-tax revenue mainlyon account of estimated receipts of ̀ 40,000 crorefrom the telecom spectrum auction. As the 2Gtelecom spectrum auction elicited lukewarmresponse on account of the high reserve price in thecurrent year, the government has revised thereserve price downwards. As such, the proceedsfrom this component are as yet an important risk tothe actual fiscal outcome for 2012-13.The other main component is dividends and profits,which have also in the past exhibited sluggishgrowth.
NON-DEBT CAPITAL RECEIPTS
3.26 Recoveries of loans and disinvestment arethe two key receipts of the non-debt capital variety.As against ` 16,897 crore in 2011-12 (provisionalactuals), Budget 2012-13 has placed recoveries ofloans at ̀ 11,650 crore this year. The 12th FinanceCommission’s recommendation against loanintermediation from the centre to states coupled withthe fact that such recoveries of loan have become aminor source in the receipts side has resulted indisinvestment assuming greater importance incomparison. As against ` 40,000 crore budgetedunder disinvestment in 2011-12, actual receipts were` 15,622 crore on account of the subdued financialmarket conditions. The Budget for 2012-13 hasestimated that ̀ 30,000 crore would accrue in 2012-13. In April-December 2012, receipts under this headwere ` 8,178 crore. The government has takenseveral steps to expedite the process ofdisinvestment. The Cabinet Committee on Economic
Affairs has approved disinvestment in thefollowing:—
(a) Disinvestment of 9.33 per cent paid up equityof Minerals and Metals Trading Corporation(MMTC) Ltd out of the Government of India’sholding of 99.33 per cent through an offer forsale of shares through stock exchanges, asper the Securities and Exchange Board of India(SEBI) Rules and Regulations.
(b) Disinvestment of 10 per cent paid up equity ofOil India Ltd. (OIL) out of the Government ofIndia’s holding of 78.43 per cent through anoffer for sale of shares through stockexchanges as per SEBI Rules andRegulations.
(c) Disinvestment of 12.15 per cent paid up equityin National Aluminium Company Limited.
(d) Disinvestment of 9.59 per cent equity inHindustan Copper Limited.
(e) Disinvestment of 9.50 per cent paid up equitycapital in the National Thermal PowerCorporation (NTPC) Ltd out of the Governmentof India’s shareholding of 84.50 per cent. TheCabinet Committee on Economic Affairs hasapproved disinvestment of 9.50 per cent equityof NTPC Ltd, out of its holding of 84.50 percent through an offer for sale of shares throughstock exchanges as per SEBI Rules andRegulations.
(f) Exchange-traded fund (ETF) for the stocks ofthe listed central public-sector enterprises(CPSEs) is also being proposed.
ACTUAL REVENUE OUTCOME IN2012-13 VIS-À-VIS BUDGET ESTIMATES
3.27 Against the estimated growth in non-debtreceipts discussed in the previous section in termsof various taxes, non-tax revenue, and disinvestmentreceipts, the actual outcome in the first nine monthsof the current fiscal indicates the challenge inmarksmanship for this year (Table 3.7). Gross taxrevenue in April-December 2012 has grown year-on-year by 15 per cent to reach ` 6,81,345 crore.While this level of growth is much higher than thatof 12.2 per cent in April-December 2011, it fallssignificantly short of the growth envisaged by BE2012-13. As a proportion of BE, gross tax revenue
http://indiabudget.nic.in

69Public Finance
in April-December 2012 was 63.2 per cent, lowerthan the last five-years’ average of 69.0 per cent.This level of growth in April-December 2012 comprisesa growth of 17.4 per cent in union excise duties; 6per cent in customs; 22.5 per cent in personalincome tax; 33 per cent in service tax; and 10.6 percent in corporate income tax. In terms of the impliedyear-on-year growth envisaged by BE 2012-13 overprovisional actuals of 2011-12, there is slippage inthe first nine months of the current fiscal in corporateincome tax by 4.9 percentage points, customs by18.9 percentage points, and central excise by16 percentage points. There is overperformance inservice tax collection by 5.9 percentage points andpersonal income tax by 7.6 percentage points. Interms of overall gross tax revenue the slippage is6 percentage points in April-December 2012. Based
on the observed collection in the last quarter of theprevious year, the slippage in tax revenue collectioncould be lowered with some additional efforts.
3.28 Apart from these, non-tax revenue inApril-December 2012 is placed at ` 86,380 crore,which is 52.5 per cent of BE, well below the last fiveyears’ average. This outcome is because of the lowerrealization from auction of 2G spectrum thus far. Innon-debt capital receipts, there is significant shortfallas of April-December 2012 on account ofdisinvestment receipts, as only ̀ 8,178 crore of thebudgeted amount of ` 30,000 crore has beenrealized. Thus the overall outcome in terms of non-debt receipts was ̀ 5,86,424 crore in April-December2012, which is 60.0 per cent of the BE, indicatingthe stiff challenge in the fourth quarter of the currentfiscal for better marksmanship.
Table 3.7 : Central Government FinancesBudget April-December Col.(4) as Per cent
Estimates % of (2) change2012-13 2011-12 2012-13 2012-13 over 2011-12
(BE) Col.(4) over (3)(1) (2) (3) (4) (5) (6)
( `̀̀̀̀ crore) 1. Revenue receipts [(ii)+(iii)] 935685 498491 570536 61.0 14.5
(i) Gross tax revenue 1077612 592348 681345 63.2 15.0(ii) Tax (net to Centre) 771071 420414 484156 62.8 15.2(iii) Non-tax revenue 164614 78077 86380 52.5 10.6
2. Capital receipts 555241 397870 420587 75.7 5.7(i) Recovery of loans 11650 14115 7710 66.2 -45.4(ii) Other receipts 30000 2743 8178 27.3 198.1(iii) Borrowings and other Liabilities 513590 381012 404699 78.8 6.2
3. Total receipts (1+2) 1490925 896361 991123 66.5 10.6 4. Non-Plan expenditure [(i)+(ii)] 969900 619457 695233 71.7 12.2
(i) Revenue account 865596 550692 625598 72.3 13.6of which:Interest payments 319759 179429 201959 63.2 12.6Major subsidies 179554 104181 166824 92.9 60.1Pensions 63183 40454 44839 71.0 10.8
(ii) Capital account 104304 68765 69635 66.8 1.3 5. Plan expenditure (i)+(ii) 521025 276904 295890 56.8 6.9
(i) Revenue account 420513 233903 242975 57.8 3.9(ii) Capital account 100512 43001 52915 52.6 23.1
6. Total expenditure [(4)+(5)=(i)+(ii)] 1490925 896361 991123 66.5 10.6(i) Revenue expenditure 1286109 784595 868573 67.5 10.7
of which:Grants for creation of capital assets 164672 84149 74283 45.1 -11.7
(ii) Capital expenditure 204816 111766 122550 59.8 9.67. Revenue deficit 350424 286104 298037 85.1 4.28. Effective revenue deficit 185752 201955 223754 120.5 10.89. Fiscal deficit 513590 381012 404699 78.8 6.2
10. Primary deficit 193831 201583 202740 104.6 0.6
Source : Controller General of Accounts, Ministry of Finance.
http://indiabudget.nic.in

70 Economic Survey 2012-13
EXPENDITURE TRENDS
3.29 Given the large unmet minimum needs ofdevelopment, and factoring in the resourceavailability, the annual budgets estimate theexpenditure to be incurred for the year with dueconsideration to the level of fiscal deficit that isrequired under the FRBM mandate. Rapid reductionin expenditure as part of fiscal consolidation isconstrained by the level of committed expenditureon interest payments, defence, civil service pay andpensions, etc., which appropriate large part of therevenue receipts on the one hand, and the need tostep up development expenditure that is so criticalfor raising the level of welfare of the masses on theother. Thus the annual budget has to maintain adelicate balance between the need to reduce theexpenditure that is perceived as non-developmental,given the structural rigidities in the key expenditurecomponents and the needs for raising the levels ofdevelopment expenditure for inclusive growth. It isin this context successive budgets have focusedon reprioritization of expenditure.
3.30 In the post-FRBM period prior to the globalcrisis, total expenditure as a proportion of GDP wasbrought down from 15.4 per cent in 2004-5 to 13.6per cent in 2006-7. Following the global crisis andthe fiscal stimulus that followed, this proportion rosein excess of 15.7 per cent in 2008-9 and 15.8 percent in 2009-10. Notwithstanding the significantfiscal consolidation achieved in 2010-11 when thestimulus measures were partially rolled back, totalexpenditure as a proportion of GDP was placed at15.4 per cent, which was possible due to the one-off nature of surge in non-tax revenues from 3G/BWA telecom spectrum auction/proceeds as wellas high levels of nominal GDP. Going forward, fiscalmarksmanship in expenditure will depend on theemerging trends in key components that arediscussed in the following paragraphs.
SUBSIDIES
3.31 As indicated earlier, while the Budget for2011-12 had estimated total expenditure to becontained at 14.0 per cent of GDP, there was anovershooting on account of the high global oil pricesand the insufficient pass through to domestic oiland fertilizer prices. The overshooting of expenditureon subsidies was also because of the accountingchanges which placed all subsidies 'above the line’.
The Budget for 2012-13 estimated growth in totalexpenditure at 13.1 per cent over 2011-12 (RE) andsought to restrict expenditure on subsidies to 2 percent of GDP. As against a provision of ̀ 23,640 crorein 2011-12 for oil subsidies, the Budget for 2012-13provisioned an amount of ̀ 43,580 crore assuminga certain level of global crude oil price. It must benoted that oil subsidies are paid to the oil marketingcompanies (OMC) on a calendar-year basis becauseonly after quarterly results are declared is thesubsidy released.
3.32 In the event, the Indian basket crude oil was$107.52 per bbl (April-December) in 2012 and evenwith the pass through effected in the course of theyear, under-recoveries of OMCs surged and wereestimated at ̀ 1,24,854 crore during April-December2012-13. As the bulk of the under-recoveries isaccounted for by two subsidized products, viz. dieseland LPG, the government raised diesel prices by` 5 per litre and capped the subsidized cylinders atsix per connection per year in September 2012. Withcontinued rise in prices, on January 17, 2013 thegovernment further permitted OMCs to raise dieselprices in small measures periodically. However, inorder to protect household budgets, it simultaneouslyraised the annual LPG cap from six to nine cylindersper connection.
3.33 The high level of global crude oil prices alsohas a significant bearing on the level of fertilizersubsidies because it is not only a key input asfeedstock, but also because there is inadequatepass through in urea (the major domestic fertilizer)prices. Subsidy on fertilizers had increasedsubstantially from ̀ 32,490 crore in 2007-8 to reach` 67,199 crore in 2011-12 (RE). It is budgeted at` 60,974 crore in 2012-13. The government hasbeen calibrating pricing policies to address the issueof burgeoning fertilizer subsidies. One of theimportant decisions taken was to fix per tonnesubsidy on key non-nitrogenous fertilizers, therebylimiting the increase in subsidy outgo to the extentof increase in consumption.
3.34 Another major subsidy outgo in recent years,growing at an annual average rate of 25.4 per centin the last five years ending 2011-12, is on accountof food. While the targeted public distribution system(TPDS) accounts for the bulk of the food subsidyoutgo, there are other welfare schemes under whichfood subsidy is provided. A part of the subsidy outgo
http://indiabudget.nic.in

71Public Finance
Box 3.4 : Direct Benefit Transfer (DBT)The DBT plan was introduced on 1 January 2013 with seven schemes in 20 districts. India has embarked on a DBT schemein selected districts wherein it has been envisaged that benefits such as scholarships, pensions, and MGNREGA (MahatmaGandhi National Rural Employment Guarantee Act) wages will be directly credited to the bank or post office accounts ofidentified beneficiaries. The DBT scheme will not substitute entirely for delivery of public services for now. It will replaceneither food and kerosene subsidies under the TPDS nor fertilizer subsidies. The DBT is designed to improve targeting,reduce corruption, eliminate waste, control expenditure, and facilitate reforms. Electronic transfer of benefits is a simpledesign change and transfers that are already taking place through paper and cash mode will now be done through electronictransfers. This has been enabled by rapid roll out of Aadhar (Unique Identity) now covering 200 million people and rapidlygrowing to cover 600 million (nearly half of our population), with the National Population Register covering the other halfof the populace. The DBT in tandem with such unique identification will ensure that the benefits reach the target groupsfaster and minimize inclusion and exclusion errors as well as corruption that are associated with manual processes.
also owes to the carrying cost of the buffer stock,which has mounted in recent years. In terms of themerits of subsidization, priority needs to be accordedto food subsidy in view of the under-consumption ofbasic food by the poor and the extent of malnutritionin the country. The government has sought to correctthis through the National Food Security Act(see Chapter 8), though concerns have beenexpressed that this will lead to a higher subsidyoutgo. However, as indicated earlier, it is a part ofthe challenge of prioritization to provide for this basicminimum need even as other items of expenditureare minimized. Further, there is need for bettertargeting of subsidies and for reducing leakagesinvolved in their delivery. Direct benefit transfer (DBT)(Box 3.4) is one such initiative.
INTEREST PAYMENTS
3.35 The cumulative impact of the level of deficitand debt is reflected in the interest payments outgo.As a proportion of GDP, interest payments fell inthe post FRBM period and have continued to below at around 3.1 per cent in recent yearsnotwithstanding the rise in fiscal deficit. A part ofthis owed to lower growth in interest payments vis-à-vis nominal GDP. As against an average annualgrowth of 12.7 per cent in interest payments in thelast five years ending 2011-12, annual averagenominal GDP growth was 15.9 per cent. It would beinstructive to note that the base for interest paymentsis the cumulative debt in the previous year plus theincremental assumption of debt in the current year.The average cost of borrowing thus measured isplaced at 7.9 per cent in 2011-12 (RE) and wasbudgeted to remain at the same level in 2012-13(Table 3.8)
PAY ALLOWANCES AND PENSION
3.36 Pay and allowances constituted 0.9 per centof GDP in 2007-8, rising to 1.4 per cent of GDP in2009-10 on account of the implementation of the
Table 3.8 : Interest on Outstanding InternalLiabilities of Central Government
Outstanding Interest AverageInternal on Cost of
Liabilities Internal Borrowings(end-March) Liabilities (per cent
( `̀̀̀̀ crore) per annum)
2004-5 1603785 105176 7.2 2005-6 1752403 111476 7.0 2006-7 1967870 128299 7.3 2007-8 2247104 149801 7.6 2008-9* 2565991 170388 7.6 2009-10 2874683 192567 7.5 2010-11 3212521 212707 7.4 2011-12(RE) 3738151 253995 7.9 2012-13(BE) 4284660 296940 7.9
Source: Union Budget documents. Notes: * Excludes ` 563 crore towards premium on
account of domestic debt-buyback schemeand prepayment of external debt.
1. Average cost of borrowing is thepercentage of interest payment in year ‘ t’to outstanding liabilities in year ‘t-1’.
2. Outstanding internal liabilities excludeNational Small Savings Funds (NSSF) loansto states,with no interest liability on the partof the centre.
3. The figures for interest payments reportedin the earlier issues may differ as thesefigures are net of interest payments onNSSF paid by the government since 1999-2000, i.e. the constitution of the NSSF.
http://indiabudget.nic.in

72 Economic Survey 2012-13
award of the Sixth Central Pay Commission. At1.1 per cent of GDP in 2011-12 (BE), there has beensome moderation. Similarly, pension constituted 0.5per cent of GDP in 2007-8 and rose to 0.9 per centin 2009-10; it is placed at 0.6 per cent in 2011-12. Alonger time trend analysis reveals that growth inpensions was very modest prior to 2004-5 andsubsequently picked up due to the impact of thecontributory scheme introduced for fresh entrantsto government service in addition to the outgo underthe earlier pension scheme with undefinedcontribution. In tandem with pay and allowances,pensions also grew sharply in 2008-9 and 2009-10,reflecting the impact of the Sixth Pay Commission.
CENTRAL PLAN OUTLAY
3.37 Plan outlay comprises gross budget support(GBS) for Plan (central Plan plus central assistanceto states/ union territories [UTs]) and internal andextra budgetary resources of the central public-sector enterprises (CPSEs). The Twelfth FiveYearPlan envisages GBS of 5.25 per cent of GDP. TheBudget for 2012-13 placed Central Plan outlay at` 6,51,509 crore as against ̀ 5,58,172 crore in 2011-12 (RE). GBS for Plan is placed at ̀ 3,91,027 crorein BE 2012-13.
3.38 Broad sector-wise, the following are theallocations as a proportion of the total outlay: energy(23.8 per cent); social services (27.5 per cent);transport (19.2 per cent); communication (2.4 percent); rural development (7.8 per cent); agricultureand allied activities (2.7 per cent); and irrigation andflood control (0.2 per cent). Central assistance tostate and UT plans is placed at ̀ 1,29,998 crore inBE 2012-13. Reprioritization of expenditure from non-Plan to Plan would be critical in meeting theproposed Twelfth Plan outlay.
SUPPLEMENTARY DEMANDS FORGRANTS
3.39 Given the constitutional provision that noexpenditure can be incurred without Parliamentarysanction, additionalities of expenditure over BE haveto be made through supplementary demands forgrants. Supplementary demands for grants arise onaccount of two factors, viz. fresh proposals that werenot envisaged at the time of the BE and the additionalexpenditure arising out of underprovisioning in theBE under various heads. A part of the additionalitiesare met through re-appropriations from one budget
head to another, which implies no net cash outgo,and through additional demands entailing cashoutgo. The extent of the latter has implications foroverall fiscal marksmanship.
3.40 In recent years, underprovisioning ofpetroleum and fertilizer subsidies has been animportant reason for supplementary demands forgrants with a cash outgo. In 2011-12, out of thethree supplementary demands for grants with cashoutgo that were presented, about 60.7 per cent wason account of petroleum and fertilizer subsidies. In2012-13, only one supplementary demand for grantshas been presented. Of the demands involving netcash outgo of ` 30,804.13 crore, ` 28,500 crorewas the outgo on account of compensation for theunder-recoveries of the OMCs and ̀ 2,000 crore onaccount of equity infusion for the Turn Around Planand Financial Restructuring Plan of Air India.
ECONOMIC AND FUNCTIONALCLASSIFICATION
3.41 While the conventional analysis of the trendsin expenditure, revenue, and deficits is useful forunderstanding the trends in public finances, themacroeconomic impact of fiscal policies is bestunderstood in terms of a national accountingframework. But the latter comes out with some timelag. It is here that the economic and functionalclassification of the central government Budget isuseful. Such an analysis of the central governmentBudget indicates that out of the total expenditure of` 12,88,763 crore in 2011-12 (RE), consumptionexpenditure was ̀ 2,56,898 crore and expenditureon gross capital formation ` 70,050 crore(Appendix Table 2.21). Financial investments andloans to the rest of the economy were ` 46,149crore. With the rest of the expenditure being transferpayments, such financial transfers were 71.0 percent of total expenditure. In 2012-13 (BE), out oftotal estimated expenditure of ` 14,97,636 crore,consumption expenditure is placed at ` 2,90,124crore and gross capital formation ` 94,906 crore.Transfer payments to the rest of the economy at` 10,10,950 crore constituted 67.5 per cent of thetotal expenditure.
3.42 In terms of classification by functional heads,social and economic services (broadly covering thetotal development outlays) at ` 6,41,944 croreconstituted 42.9 per cent of the total expenditure of` 14,97,636 crore in 2012-13 (BE). Expenditure on
http://indiabudget.nic.in

73Public Finance
general services is estimated at ` 3,49,199 crore,constituting 23.3 per cent of the total. Such itemsas statutory grants-in-aid to states, non-Plan grantsto UTs, food and other consumer subsidies, intereston public debt, pension, and aid to other nationsconstitute the unallocable category accounting for33.8 per cent of the total expenditure. The salientfeature of the economic and functional classificationof the Central Budget 2012-13 is the estimatedgrowth in capital formation (including financialassistance for capital formation) which is placed at22.9 per cent and growth of 16.2 per cent in socialservices in 2012-13 (BE) over 2011-12 (RE),indicating the thrust of the Budget on higherinvestment and an inclusive development agenda.
EXPENDITURE OUTCOME IN 2012-133.43 As against implied year-on-year growth of 14.8per cent envisaged by BE 2012-13 (over provisionalactuals of 2011-12), growth in total expenditure inApril-December 2012 has been 10.6 per cent only(see Table 3.7). Non-Plan revenue expenditure inApril-December 2012 is placed at 72.3 per cent ofBE, which is well below the five-year average of 77.7per cent. Similarly expenditure on both Plan revenueas well as Plan capital expenditure in April-December2012 is well below the five-year average asproportions of BE. However, major subsidies haveburgeoned in April-December 2012 to reach a figureof ` 1,66,824 crore (92.2 per cent of BE). Theexpenditure restraint has helped keep deficits lowerin April-December 2012.
DEFICIT OUTCOME IN 2012-133.44 The Budget for 2012-13 estimated a deficitlevel of ̀ 5,13,590 crore. The net outcome of slippagein non-debt receipts and expenditure restraint fedinto the outcome in terms of the desired indicatorsof revenue deficit as well as fiscal deficit in April-December 2012. As a proportion of BE, fiscal deficitis placed at 78.8 per cent, significantly below thefive-year average of 85.9 per cent and last year’slevel of 92.3 per cent. Similarly, revenue deficit isplaced at 85.1 per cent, well below the level achievedin the recent past. However, the indicator effectiverevenue deficit is placed at 120.5 per cent in April-December 2012. Though it is below last year’s levelin the same period, it is a slippage and owes tolower outgo of grants for creation of capitalassets.
GOVERNMENT DEBT
3.45 The high levels of fiscal deficit in the post-crisis period added to the overall debt burden of thecentral government. Prolonged fiscal deficits leadto accumulation of debt beyond levels sustainablefor an economy and can result in higher real andnominal interest rates, slower growth in capitalformation, and potentially lower the rate of outputgrowth. The outstanding liabilities of the centralgovernment were placed at ` 44,68,714 crore,equivalent of 49.8 per cent of GDP at end-March2012 (Table 3.9). As a proportion of GDP, outstandingliabilities (adjusted) of the centre peaked at 67.0per cent in 2002-3 and have fallen subsequentlynotwithstanding the rise in fiscal deficit in the post-crisis years. This is on account of the fact that growthin incremental assumption of liabilities has beenlower than that of nominal GDP and the debt toGDP ratio dynamics is aided by the differentialbetween nominal GDP growth and nominal interestrates, which makes it possible to achieve a greaterreduction through a given primary balance.
3.46 The total liabilities for the Government of Indiainclude debt and liabilities accounted for in theConsolidated Fund of India (technically defined aspublic debt) as well as liabilities accounted for inthe public account. Public debt constitutes 76.3 percent of total liabilities at end March 2012. It is furtherclassified into internal and external debt. Internaldebt, constituting 90.9 per cent of public debt, largelyconsists of fixed tenor, fixed coupon dated securities(72.1 per cent) and treasury bills (10.2 per cent).State governments are not allowed to directly borrowexternally hence their entire debt is domestic. Overtime, there is a compositional shift towardmarketable debt, while the public account liabilitieshave seen a commensurate decline. The share ofmarketable debt to total internal liabilities, whichwas about 30 per cent in the beginning of the 1990s,increased to 40 per cent in the beginning of the2000s and is budgeted to increase to 67.5 per centby end-March 2013. The share of public accountliabilities on the other hand is estimated to declineto 22.8 per cent in 2012-13 (BE) from about 30 percent in 2001-2 and about 46 per cent in the beginningof the 1990s.
3.47 A greater dependence on domestic debtinsulates the debt portfolio from volatility ininternational capital markets. It also minimizescurrency risk. Apart from this, internal debt of the
http://indiabudget.nic.in

74 Economic Survey 2012-13
Government of India has the following favourablefeatures which provide some comfort.
(a) Weighted average maturity of outstandinggovernment securities at 9.8 years is highcompared to international standards. At end-March 2012, the proportion of debt maturing inless than one year was only 3.5 per cent and30.2 per cent of outstanding stock had a residualmaturity of up to five years. This implies thatover the next five years, on an average, about6.0 per cent of outstanding stock needs to berolled over every year. Thus the rollover risk inthe debt portfolio remained low.
(b) Most of the public debt in India is at fixedinterest rates. Of the total outstanding datedsecurities, only 1.8 per cent was on floatingrate. Thus interest payments are largelyinsulated from interest rate volatility, impartingstability to the Budget.
(c) The average cost of the debt (interest payments/debt ratio) and interest payments as apercentage of revenue receipts are on a seculardecline, though some rise was seen in the pasttwo years. Ratio of interest payments torevenue receipts has declined to around 36 per
cent in 2011-12 from about 50 per cent in thebeginning of the 2000s.
(d) A relatively stable weighted average yield ofprimary issuance indicates stability in interestpayments/revenue receipts and interestpayments/debt ratios, pointing towards thesustainability of the debt in the country.
3.48 Government debt could also arise from theassumption of l iabilit ies associated withrecapitalizing public-sector enterprises including thebanking sector. It is, therefore, customary to lookat their finances.
PERFORMANCE OF DEPARTMENTALENTERPRISES OF THE CENTRALGOVERNMENT
Railways3.49 The Twelfth Five Year Plan (2012-17) envisionsan integrated approach for the transport sector as awhole. It states that the vision for the transport sectorshould be guided by a modal mix that will lead to anefficient, sustainable, economical, safe, reliable,environmentally friendly, and regionally balancedtransport system. The rail network would also haveto develop a strategy to be part of an effective multi-
Table 3.9 : Outstanding Liabilities of the Central GovernmentEnd-March
2007-8 2008-9 2009-10 2010-11 2011-12 2012-13(RE) (BE)
(As per cent of GDP) 1. Internal liabilities 54.6 53.9 52.4 48.5 47.9 48.3
a) Internal debt# 36.1 35.9 35.9 34.2 35.7 37.3i) Market borrowings 22.1 23.8 27.0 26.6 27.9 29.8 ii) Others 13.9 12.1 9.0 7.6 7.7 7.5
b) Other internal liabilities 18.6 18.1 16.5 14.3 12.2 11.0 2 External debt(outstanding)* 2.2 2.2 2.1 2.0 1.9 1.8 3 Total outstanding liabilities 56.9 56.1 54.5 50.5 49.8 50.1
Memorandum items a) External debt @ 4.2 4.7 3.8 3.6 3.6 3.3b) Total outstanding
liabilities(adjusted)** 58.9 58.6 56.3 52.1 51.5 51.7
Sources : Union Budget documents, Controller of Aid Accounts and Audit and Reserve Bank of India.# Internal debt includes net borrowing of `̀̀̀̀ 29,062 crore for 2005-6, `̀̀̀̀ 62,974 crore for 2006-7,
`̀̀̀̀ 1,70,554 crore for 2007-8, `̀̀̀̀ 88,773 crore for 2008-9, `̀̀̀̀ 2,737 crore for 2009-10, and `̀̀̀̀ 20,000 crore for2011-12(BE) under the Market Stabilisation Scheme.
* External debt figures represent borrowings by central government from external sources and arebased upon historical rates of exchange.
@ Converted at year end exchange rates. For 2006-7, the rates prevailing at the end of March 2007, for2007-8, the rates prevailing at the end of March 2008, and so on.
** Internal liabilities and external debt (converted at year end exchange rates).Note : The ratios to GDP at current market prices are based on the CSO’s National Accounts 2004-5 series.
http://indiabudget.nic.in

75Public Finance
modal transport system. The Twelfth Plan identifiessafety, modernization, and capacity augmentationas the focus areas, for which initiatives are underwayin Indian Railways to supplement its internalresources judiciously through public-privatepartnerships (PPP), cost sharing with stategovernments and other stakeholders, and marketborrowings.
3.50 Freight loading by Indian Railways duringfiscal 2011-12 was placed at 969.8 million tonnesagainst 921.7 million tonnes in 2010-11, registeringan increase of 5.2 per cent with an incrementalloading of 48.1 million tonnes over 2010-11 levels.The freight traffic target for 2012-13 (BE) has beenfixed at 1,025 million tonnes, an increase of 5.7 percent over the previous year. During April-November2012, Indian Railways has carried 647.11 milliontonnes of revenue-earning freight traffic. The freightcarried shows an increase of 29.06 million tonnesover the freight traffic of 618.05 million tonnesactually carried during the corresponding period ofthe previous year, translating into an increase of 4.7per cent.
3.51 Freight earnings at ̀ 69,547.59 crore during2011-12 exceeded the revised target by ̀ 927 crore,registering a growth of 10.7 per cent over 2010-11.Passenger earnings (including other coachingearnings) during 2011-12 stood at ̀ 30,962.96 croreas against ` 28,263 crore in 2010-11, an increaseof 9.6 per cent. The overall traffic revenue for2011-12 at ` 1,04,153 crore registered a growth of10.2 per cent over 2010-11. Taking into accountfurther accumulation of ` 43 crore to the trafficoutstanding, the gross traffic receipts of theRailways for 2011-12 stood at ` 1,04,110 crore.Gross traffic receipts for 2012-13 have been budgetedat ̀ 1,32,552 crore.
3.52 Ordinary working expenses at ` 74,537.4crore during 2011-12 show an increase of 9.4 percent over 2010-11. The total working expensesincluding appropriations to the Depreciation ReserveFund and Pension Fund at ` 98,667.41 crorerecorded an increase of 10.3 per cent over 2010-11.Ordinary working expenses are budgeted at ̀ 84,400crore for 2012-13 while the total working expensesare ̀ 1,12,400 crore.
3.53 Taking into account the net variation of themiscellaneous receipts and miscellaneousexpenditure, Railways’ net revenue in 2011-12 was` 6,781.60 crore. After fully discharging the dividend
liability of ` 5,656.03 crore for the fiscal, Railwaysduring 2011-12 generated an excess of around`1,125.57 crore. Dividend liability during 2012-13has been budgeted at ` 6,676 crore. There was amarginal deterioration of the operating ratio(percentage of total working expenses to gross trafficearnings) of the Railways, which stood at 94.9 percent in 2011-12 as against 94.6 per cent in2010-11. The operating ratio for 2012-13 has beentargeted at 84.9 per cent in the Rail Budget. Thenet revenue as a proportion of capital-at-charge andinvestment from Capital Fund for the fiscal stood at4.2 per cent in 2011-12. The target for 2012-13 (BE)is 12.1 per cent.
3.54 The Plan Outlay for 2011-12 (provisional) stoodat ` 45,499 crore including internally generatedresources of ̀ 8,934 crore (i.e. 19.6 per cent of thePlan outlay) and market borrowings of ̀ 15,228 crore(i.e. 33.5 per cent of the Plan outlay) by the IndianRailway Finance Corporation (IRFC), which alsoincludes borrowings of ` 108 crore for Rail VikasNigam Limited. The Annual Plan outlay for 2012-13has been budgeted at ` 60,100 crore, which is thehighest ever Plan investment. The Plan has beenbudgeted to be financed through GBS of ` 24,000crore (40.0 per cent), internal resources of ̀ 18,050crore (30.0 per cent), ̀ 2,000 crore from the RailwaySafety Fund (3.3 per cent) and extra-budgetaryresources of ̀ 16,050 crore (26.7 per cent) includingmarket borrowings of ̀ 15,000 crore through IRFC.
Department of Posts3.55 The gross receipts in 2011-12 of theDepartment of Posts were placed at ` 7,899.35crore. The gross and net working expenses duringthe year were ` 14,163.91 crore and ` 13,705.27crore respectively, yielding a deficit of ` 5,805.92crore. In the current fiscal as per BE 2012-13, grossreceipts are budgeted to go up to ̀ 7,793.31 crorewith gross and net working expenses estimated at` 14,379.71 crore and ̀ 13,714.66 crore respectively.The deficit is projected to be ̀ 5,921.35 crore.
3.56 The government has approved the ITModernization Project of the Department of Postsfor computerization of all the non-computerized postoffices, mail offices, administrative and other offices,establishment of required IT infrastructure, anddevelopment of required software applications. Thecontinuation of the IT modernization project involvingoperating and maintenance (O&M) costs of ̀ 4,909.00crore has been approved on 22 November 2012.
http://indiabudget.nic.in

76 Economic Survey 2012-13
Broadcasting3.57 The expenditure of Prasar Bharati in 2011-12was ̀ 3,340.57 crore (provisional) excluding chargeson account of space segment and spectrum chargesand interest and depreciation costs. The totalrevenue earned in 2011-12 was ` 1,409.54 crore(subject to reconciliation).
3.58 The government has proposed severalschemes for the Twelfth Five Year Plan to beimplemented through All India Radio (AIR) andDoordarshan which include the scheme forDigitalization of Transmitters, Studios, andConnectivity. The scheme inter alia envisagesdigitalization of 98 studios and connectivity andinstallation of 100-watt FM Digital CompatibleTransmitters at 100 locations. As such, the schemefor Digitalization of the AIR/Doordarshan Networkcontinues to be one of the Major Thrust Areas of theTwelfth Plan. Auction of 839 additional private FMchannels in 294 cities is also likely to be completedin 2013-14. An allocation of ` 2,047.35 crore hasbeen made in 2012-13 (BE) to cover the resource
gap in the operating cost of Prasar Bharati.Inaddition, as part of the financial restructuringpackage for Prasar Bharati, the government hasrecently approved various measures which includemeeting 100 per cent expenses towards salary andsalary-related establishment expenses during thenext five years from 2012-13 to 2016-17 while allother items of operating expenses are to be borneby Prasar Bharati from its internal resources.
STATE-LEVEL FINANCES3.59 While there has been some stress in centralgovernment finances in recent years, the financesof states are in fine fettle. The combined gross fiscaldeficit of states did not exceed 3.0 per cent of GDPeven in the years of global crisis. After reaching alevel of 1.5 per cent of GDP in 2007-8, the fiscaldeficit of states rose to 2.9 per cent in 2009-10 buthas moderated to 2.1–2.3 per cent subsequently(Table 3.10). As a proportion of GDP, tax receiptsmoderated in 2008-9 and 2009-10 and together withstable non-tax receipts helped in fiscal consolidation
Table 3.10 : Receipts and Disbursements of State and Consolidated General Government
Item 2007-8 2008-9 2009-10 2010-11 2011-12 2012-13 (RE) (BE)
(As per cent of GDP)State governmentsI. Total receipts (a+b) 15.4 15.8 15.6 15.1 15.9 16.3
a) Revenue receipts (1+2) 12.5 12.3 11.9 12.0 12.7 13.31. Tax receipts 8.8 8.6 8.2 8.7 9.0 9.42. Non-tax receipts 3.7 3.8 3.7 3.3 3.7 3.8
b) Capital receipts 2.8 3.5 3.7 3.1 3.2 3.0 II. Total disbursements 15.1 15.7 15.7 14.9 16.0 16.3
a) Revenue 11.6 12.1 12.3 12.0 12.7 12.8b) Capital 3.2 3.3 3.1 2.7 2.9 3.2c) Loans and advances 0.3 0.3 0.3 0.2 0.4 0.3
III. Revenue deficit -0.9 -0.2 0.5 0.0 -0.1 -0.4IV. Gross fiscal deficit 1.5 2.4 2.9 2.1 2.3 2.1General governmentI. Total receipts (a+b) 27.2 27.8 28.5 27.6 28.3 28.3
a) Revenue receipts (1+2) 21.3 19.8 18.7 20.3 19.5 20.71. Tax receipts 17.6 16.5 15.2 16.0 16.2 17.12. Non-tax receipts 3.7 3.4 3.5 4.2 3.3 3.5
b) Capital receipts 5.9 8.0 9.8 7.4 8.8 7.6II. Total disbursements 26.4 28.4 28.6 27.5 28.1 28.3
a) Revenue 21.5 24.1 24.4 23.5 23.8 23.7b) Capital 4.5 3.9 3.8 3.4 3.6 4.1c) Loans and advances 0.4 0.4 0.4 0.6 0.6 0.5
III. Revenue deficit 0.2 4.3 5.7 3.2 4.3 3.1
IV. Gross fiscal deficit 4.0 8.3 9.3 6.9 8.1 7.2
Source: Reserve Bank of India.Notes : (1) The ratios to GDP at current market prices are based on the CSO’s National Accounts 2004-5 series.
(2) Disinvestment proceeds are inclusive of miscellaneous capital receipts of the states.(3) Negative (-) sign indicates surplus in deficit indicators.(4) Capital receipts include public accounts on a net basis.(5) Capital disbursements are exclusive of public accounts.
http://indiabudget.nic.in

77Public Finance
notwithstanding a small rise in 2011-12 (RE). Withthe exception of 2009-10, the combined position ofstates in terms of revenue deficit has been one ofsurplus. Besides, what is noteworthy is that therehas been an improvement in the quality of expenditurewith a rise in capital expenditure to GDP ratio anddevelopment expenditure. However, as with manyother economic indicators, there are large inter-statevariations in the attainments in terms of fiscaloutcome. Another concern arising from statefinances is that there is incomplete information onextra-budget activities and quasi-fiscal activities.The RBI’s study of state budgets 2012-13 hasindicated that notwithstanding the information gap,fiscal transparency at state government levels hasincreased. One of the main problems with states’finances is in the financial health of the power
distribution companies, which continue toaccumulate losses estimated at ` 1,90,000 croreat end-March 2011. This is mainly on account ofnon-revision of tariffs, subsidy arrears, highaggregate and technical losses and the high costof buying short-term power. Thus, continued reforminitiatives are critical for maintaining sound financesof the states.
CONSOLIDATED GENERALGOVERNMENT3.60 As indicated earlier, fiscal deficit of the centrewidened from 4.8 per cent of GDP in 2010-11 to 5.9per cent in 2011-12 (RE). With the fiscal deficit ofstates exhibiting a modest deterioration to 2.3 percent of GDP, the fiscal outcome in terms of centreand states combined was placed at 8.1 per cent in
Box 3.5 : Terms of Reference of 14th Finance CommissionThe following are the broad Terms of Reference and the matters to be taken into consideration by the 14th Finance Commissionin making the recommendations:1. (i) the distribution between the union and states of the net proceeds of taxes which are to be, or may be, divided between
them under Chapter I, Part XII of the Constitution and the allocation between the states of the respective shares ofsuch proceeds;
(ii) the principles which should govern the grants-in-aid of the revenues of the states out of the Consolidated Fund ofIndia and the sums to be paid to the states which are in need of assistance by way of grants-in-aid of their revenuesunder article 275 of the Constitution for purposes other than those specified in the provisos to clause (1) of thatarticle; and
(iii) measures needed to augment the Consolidated Fund of a state to supplement the resources of the panchayats andmunicipalities in the state on the basis of the recommendations made by the Finance Commission of the state.
2. The Commission has been mandated to review the state of finances, deficit, and debt levels of the union and states andsuggest measures for maintaining a stable and sustainable fiscal environment consistent with equitable growth includingsuggestions to amend the FRBMAs currently in force. The Commission has been asked to consider and recommendincentives and disincentives for states for observing the obligations laid down in the FRBMAs.
3. In making its recommendations, the Commission inter alia is required to consider: the resources of the central governmentand the demands on the resources of the central government; the resources of the state governments and demands onsuch resources under different heads, including the impact of debt levels on resource availability in debt-stressed states;the objective of not only balancing the receipts and expenditure on revenue account of all the states and the union butalso generating surpluses for capital investment; the taxation efforts of the central government and each state governmentand the potential for additional resource mobilization; the level of subsidies required for sustainable and inclusivegrowth and equitable sharing of subsidies between the central and state governments; the expenditure on the non-salarycomponent of maintenance and upkeep of capital assets and the non-wage-related maintenance expenditure on Planschemes to be completed by 31 March 2015 and the norms on the basis of which specific amounts are recommended forthe maintenance of capital assets and the manner of monitoring such expenditure; the need for insulating the pricing ofpublic utility services like drinking water, irrigation, power ,and public transport from policy fluctuations throughstatutory provisions; the need for making public-sector enterprises competitive and market oriented; listing anddisinvestment; relinquishing of non-priority enterprises; the need to balance management of ecology, environment, andclimate change consistent with sustainable economic development; and the impact of the proposed goods and servicestax on the finances of the centre and states and the mechanism for compensation in case of any revenue loss.
4. The Commission is required to generally take the base of population figures as of 1971 in all cases where population isa factor for determination of devolution of taxes and duties and grants-in-aid; however, the Commission may also takeinto account the demographic changes that have taken place subsequent to 1971.
5. The Commission is to review the present public expenditure management systems in place including budgeting andaccounting standards and practices; the existing system of classification of receipts and expenditure; linking outlays tooutputs and outcomes; best practices within the country and internationally and to make appropriate recommendationsthereon.
6. The Commission is to review the present arrangements as regards financing of Disaster Management with reference tothe funds constituted under the Disaster Management Act 2005(53 of 2005) and make appropriate recommendationsthereon.
7. The Commission is to indicate the basis on which it has arrived at its findings and make available the state-wiseestimates of receipts and expenditure.
http://indiabudget.nic.in

78 Economic Survey 2012-13
2011-12 (RE) as against 6.9 per cent in 2010-11(Table 3.10). In 2012-13 (BE), fiscal deficit isbudgeted to come down to 7.2 per cent of GDP.While there is a likely slippage of 0.2 percentagepoint in terms of the centre’s target, the over-performance in states might help in achieving thebudgeted levels in the overall fiscal outcome in2012-13.
3.61 The 14th Finance Commission wasconstituted on 2 January 2013 under theChairmanship of Dr Y.V.Reddy, former RBI Governor.Other members of the commission are (i) ProfessorAbhijit Sen (ii) Ms Sushma Nath (iii) Dr M.GovindaRao (iv) Dr Sudipto Mundle. The Commission’smandate is detailed in Box 3.5.
OUTLOOK
3.62 It might be recalled that the Mid-YearEconomic Analysis 2012-13 sought to allay
concerns about the fiscal outcome for 2012-13through allusion to the measures taken andindicated that the fiscal deficit for the year would becontained at 5.3 per cent of GDP. The outcome inApril-December 2012 in terms of fiscal deficit broadlyindicates that this is likely to happennotwithstanding the significant shortfall in revenue.The overall shortfall in non-debt receipts could becontained with ongoing greater efforts at mobilizationand reforms already in place. The longer-termoutlook has already been outlined in terms of thefiscal consolidation roadmap leading to a fiscal deficitof 3.0 per cent of GDP in 2016-17. As indicatedearlier in the chapter, addressing the key fiscal riskof petroleum subsidies is critical in better fiscalmarksmanship. With the recent reforms in dieselprices and efforts at expenditure reprioritization, themedium-term fiscal consolidation plan is credibleand could yet again yield macroeconomic dividendsin terms of higher growth and price stability.
http://indiabudget.nic.in

Prices and MonetaryManagement CHAPTER
4
Inflation, as measured by the Wholesale Price Index (WPI), has remained above 7
per cent since December 2009. Food inflation has been particularly elevated over
this period, contributing to an average of one third of total inflation. Consumer
price inflation, with higher weights on food, have been generally higher than the
headline WPI inflation. A moderation in WPI inflation is now clearly visible, but
the moderation has largely been due to deceleration in the rate of inflation of non-
food manufactured products. Inflation pressures have eased globally. Global
consumer prices rose at a 3.7 percent annualized rate at the end of 2012. Inflation
for developing countries also moderated to a 5.4 percent annualized rate in the
three months through November 2012, from an average 7.2 percent in 2011. Benign
inflation in global commodity prices, with inflation for energy and non-energy
commodities in base line scenario expected to be around (-) 2.6 per cent and (-) 2.0
per cent respectively in 2013, will check the inflation of tradeable commodities even
in India. Apart from monetary policy attempting to control demand, supply side
responses will be necessary to bring down inflation in a sustained way, and ongoing
policy initiatives need to be pursued.
INFLATION-BROAD TRENDS
4.2 The financial year 2012-13 started with aheadline Wholesale Price Index (WPI) inflation of7.50 per cent. It has remained in the 7.18 to 8.07per cent range in the nine months up to December2012. Consumer price inflation for the majorindices, which had declined to the range of 4.92to 7.65 per cent in January 2011, however, startedwitnessing an increase since then. For most ofthe current year, inflation measured in terms ofConsumer Price Index for industrial workers (CPI-IW) and the new series of CPI has remained indouble digits. CPIs for agricultural and rurallabourers have also inched up to double digit levelin the last two months (Table 4.1).
WPI INFLATION-TRENDS AT THELEVEL OF BROAD COMMODITY GROUPS
4.3 Headline WPI inflation which averaged 9.56per cent in 2010-11 and 8.94 per cent in 2011-2012decelerated to 7.55 per cent in the first nine monthsof 2012-13 (Apr-Dec). Although in December 2012,inflation was at a three year low of 7.18 per cent, ithas been in the range of 7-8 per cent in last thirteenmonths. Relative importance of different commoditygroups contributing to this persistent inflation,however, changed over time. The persistentlyelevated prices for animal products (eggs, meat andfish), the rise in the prices of cereals and vegetables,along with the increase in international prices offerti l izers (non-urea) and the increase inadministered prices of diesel have contributed toinflation in differing degrees over time. The build-up
http://indiabudget.nic.in

80 Economic Survey 2012-13
in price pressures seems to have tapered off inrecent months, as headline WPI has remainedsteady. Month-over-month price changes in mostcommodity groups have been small, indicating thatthe pressure on generalized inflation has fallen, ashas the momentum of inflation, as measured by theseasonally adjusted annualized rate of inflation(SAAR) of the WPI index (Figure 4.1).
4.4 The level of inflation and its movement acrossthree major commodity groups varied significantly.Inflation of primary articles having a weight of 20.12
per cent in the WPI, after declining to 6.7 per centin Q4 of 2011-12, increased in first three quarters ofthe current year and was 10.6 per cent in December2012. Inflation for commodities in the group ‘fuel &power’, with a weight of 14.91 per cent in the WPIwitnessed some moderation in the current year.Apart from the base effect, deceleration in theinflation of non-administered petroleum productscontributed to the moderation. This helped containthe effects of the increase in administered prices ofdiesel effected in September 2012. Finally, thedeceleration in inflation of manufactured products,
Table 4.1 : Annual Inflation as per Different Price Indices
Month WPI CPI-IW CPI-NS CPI-AL CPI-RL2011-12 2012-13 2011-12 2012-13 2011-12 2012-13 2011-12 2012-13 2011-12 2012-13
Apr 9.74 7.50 9.41 10.22 - 10.26 9.11 7.84 9.11 8.01
May 9.56 7.55 8.72 10.16 - 10.36 9.63 7.77 9.63 8.11
Jun 9.51 7.58 8.62 10.05 - 9.93 9.32 8.03 9.14 8.54
Jul 9.36 7.52 8.43 9.84 - 9.86 9.03 8.61 9.03 8.94
Aug 9.78 8.01 8.99 10.31 - 10.03 9.52 9.18 9.71 9.34
Sep 10.00 8.07 10.06 9.14 - 9.73 9.43 9.43 9.25 9.93
Oct 9.87 7.32 9.39 9.60 - 9.75 9.36 9.85 9.73 9.84
Nov 9.46 7.24 9.34 9.55 - 9.90 8.95 10.31 9.14 10.47
Dec 7.74 7.18P 6.49 11.17 - 10.56 6.37 11.33 6.72 11.31
Jan 7.23 5.32 7.65 4.92 5.27
Feb 7.56 7.57 8.83 6.34 6.68
Mar 7.69 8.65 9.38 6.84 7.19
Average 8.94 7.55* 8.39 10.00* - 10.04* 8.19 9.17* 8.35 9.41*
Source: Office of the Economic Adviser, Labour Bureau, Central Statistics Office (CSO).*: Average (Apr-Dec) P: Provisional CPI : Consumer Price Index; IW : Industrial Workers;AL : Agricultural Labourers; RL : Rural Labourers; NS: New Series.
http://indiabudget.nic.in

81Prices and Monetary Management
with a weight of 64.97 per cent in WPI, was relativelysharp (Table 4.2).
4.5 A disaggregation of WPI inflation in terms ofcomposite groups indicates that food inflation,comprising primary food articles and manufacturedfood products (24.31 per cent weight in the WPI) at9.05 per cent in Q3 of 2012-13 was significantlyhigher than the 5.30 per cent in Q4 of 2011-12. Foodinflation had once in fact declined to 1.45 per centin January 2012 before inching upward to 10.39 percent in December 2012. Non-food non-manufacturing inflation did moderate over the currentyear, but remains high, in the double digits, largelybecause of higher inflation for oilseeds and thecommodities in the group ‘fuel and power’. Coreinflation which corresponds to inflation for non-foodmanufactured products, and is a central focus for
the Reserve Bank of India (RBI), however, continuedto show moderation from its peak in Q3 of 2011-12.The contribution of this composite group to overallinflation also declined from over 43 per cent in Q3 of2011-12 to around 30 per cent in Q3 of 2012-13(Figure 4.2). Apart from monetary measures takenby the RBI, softening of international and domesticprices of metals, chemicals and textile productsalso contributed to the moderation in core inflation.
Distribution of Commodities in terms ofPrice Range4.6 The distribution of inflation acrosscommodities included in the WPI indicates that therehas been a sharp reduction in the number ofcommodities experiencing inflation of over 20 percent. As against 72 commodities with a weight of
Table 4.2 : Quarterly Inflation in Major Group of the WPI (%)
Major Groups/ Weight Average 2011-12 2012-13Composite groups (%) (Apr-Mar)
2010 2011 Q1 Q2 Q3 Q4 Q1 Q2 Q3P-11 -12
All Commodities 100.0 9.56 8.94 9.60 9.71 9.01 7.50 7.54 7.87 7.25Primary Articles 20.12 17.75 9.80 13.09 12.05 7.76 6.70 9.87 10.32 9.27Fuel & Power 14.91 12.28 13.96 12.74 12.99 15.08 14.94 11.90 9.72 10.34Manufactured Prod. 64.97 5.70 7.26 7.38 7.87 7.95 5.89 5.29 6.23 5.46Composite groupsAll food 24.31 11.10 7.24 8.36 8.81 6.60 5.30 9.12 9.07 9.05Non-FoodNon-Manufacturing 20.69 15.67 14.51 16.20 14.97 13.72 13.33 10.52 10.79 10.37Non FoodManufacturing 55.00 6.11 7.29 7.35 7.80 8.13 5.92 5.15 5.71 4.64
Source: Office of the Economic Adviser. P : Provisional
http://indiabudget.nic.in

82 Economic Survey 2012-13
13.8 per cent, which reported above 20 per centinflation in Q2 of 2011-12, the number of suchcommodities declined to 29 with a weight of 5.5 percent in Q2 of 2012-13. Nearly two thirds of thecommodities with over half of the weight in WPI nowexperience inflation of 5 percent or less (Table 4.3).This distributional shift seems to have plateauedin the last three quarters. The small number ofcommodities in the inflation range of 20 per centand above suggests that besides economy widemeasures like monetary and fiscal policies,strategies focused on specific commodities mayalso have high payoffs in further containinginflation.
WPI- Food Inflation4.7 Inflation for both primary food articles andmanufactured food products have moved togethersince 2011-12. Overall food inflation declined to 5.30per cent in Q4 of 2011-12, its lowest quarterly levelin the last seven quarters. Inflation in both primaryfood articles and manufactured food products wasalso at its lowest during this quarter (Table 4.4). Anincrease in inflation has been observed for both thesegroups in the current year. Within primary foodarticles, however, inflation in protein foods hasmoderated, especially so in the case of milk andanimal products, where it has been significant andsequential. For pulses too, a sharp decline ininflation in Q3 of 2012-13 is observed. Cereals have,however, emerged as the major contributor to anincrease in the inflation in food articles in first three
quarters of the current year. Inflation in cereals whichhad moderated to a level of 2.73 per cent in Q3 of2011-12 increased to 17.05 per cent in Q3 of 2012-13 mainly contributed by wheat, rice and maize.There has also been an increase in inflation in fruitsand vegetables partly because of the increase ininflation in onions and potatoes. While in the caseof potatoes, the current increase in prices may be acorrection as prices had declined below the baselevel prices of 2004-05 in January 2012, an upsurgein onion prices and inflation has been observed inthe last two months.
4.8 In the manufactured food products group, asequential and sharp moderation in inflation has beenobserved in dairy products from Q4 of 2011-12. Thisdecline in inflation is sharper and more pronouncedthan the inflation in milk. Grain mill products havewitnessed an increase in inflation largely becauseof an upsurge in wheat prices, the key ingredient forthese commodities. Sugar inflation had also shownan upward trend, after having remained at moderatelevels in 2010-12. Prices have been particularlybuoyant in the second and third quarter of the currentyear. In last two months, however, there has beensome moderation in sugar prices. Futures pricesalso suggesting a softening trend of a moderate level.While inflation in edible oils has remained stablethough elevated, there has also been increase ininflation in oil cakes in the current financial year.Momentum of food inflation as observed from theseasonally adjusted monthly WPI series indicatesa mild upward trend (Figure 4.3).
Table 4.3 : Frequency distribution of WPI commodities in terms of inflation range
2010-11 2011-12 2011-12 2012-13Q1 Q2 Q3 Q4 Q1 Q2 Q3P
Headline inflation 9.56 8.94 9.60 9.71 9.01 7.50 7.54 7.87 7.25Number of Commoditiesin inflation range Negative 141 126 137 122 133 146 131 94 900 to 5 per cent 240 243 222 220 220 276 310 349 3526 to 20 per cent 235 257 248 262 259 217 202 204 201Above 20 per cent 60 50 69 72 64 37 33 29 33Weights of the Commoditiesin inflation rangeNegative 13.96 13.99 16.69 13.56 15.96 17.13 14.18 10.11 8.550 to 5 per cent 29.96 31.39 27.82 25.43 24.53 33.16 31.37 44.01 45.906 to 20 per cent 47.82 42.77 41.49 47.19 46.50 40.95 47.44 40.38 38.26Above 20 per cent 8.26 11.85 13.99 13.81 13.01 8.77 7.01 5.50 7.29
Source : Office of the Economic Adviser. P : Provisional
http://indiabudget.nic.in

83Prices and Monetary Management
Table 4.4 : Sub components of WPI food inflation (%)
Components / Weight Average 2011-12 2012-13Sub components (%) (Apr-Mar)
2010- 2011- Q1 Q2 Q3 Q4 Q1 Q2 Q3P11 12
FOOD INFLATION 24.31 11.10 7.24 8.36 8.81 6.60 5.30 9.12 9.07 9.05(A) Food Articles 14.34 15.60 7.30 8.83 9.14 6.34 5.05 10.82 9.18 8.76Non-Protein food 7.97 12.33 4.79 11.50 9.50 1.96 -2.88 8.00 6.23 7.54
Cereals 3.37 5.26 3.87 5.08 4.83 2.73 2.90 6.36 11.06 17.05Fruits & Vegetables 3.84 16.44 6.45 16.11 14.93 1.71 -5.26 14.40 5.30 3.98Other Food(Tea & Coffee) 0.18 -7.25 18.97 22.62 20.90 18.43 14.21 10.01 15.25 13.10Condiments & Spices 0.57 33.56 -2.65 14.47 0.49 -3.83 -18.07 -18.18 -12.48 -15.99
Protein food 6.37 19.78 10.32 5.78 8.72 11.75 14.85 14.28 12.66 10.13Pulses 0.72 3.20 2.52 -8.32 -3.03 12.95 9.65 16.2 30.68 18.84Milk 3.24 20.13 10.31 6.84 10.15 11.02 13.08 11.56 7.05 6.13Eggs, Meat & Fish 2.41 25.51 12.73 9.17 10.64 12.32 18.55 17.12 14.63 12.47
(B) Food Products 9.97 3.72 7.12 7.52 8.19 7.07 5.76 6.02 8.85 9.59Dairy Products 0.57 9.56 12.85 6.04 12.11 17.94 15.28 9.38 4.09 -1.13Processed Food 0.36 5.05 9.72 7.22 8.87 10.55 12.15 8.12 2.47 1.15Grain Mill Products 1.34 5.67 0.27 2.80 0.81 -0.30 -2.10 -0.55 3.90 9.48Bakery Products 0.44 8.60 0.75 -0.58 0.40 1.43 1.74 2.12 2.13 3.62Sugar, Gur &Khandsari 2.09 -0.88 4.50 3.74 5.41 5.49 3.36 5.27 14.50 14.29Edible Oils 3.04 5.43 12.55 14.92 14.45 12.22 9.00 10.35 10.82 9.59Oil Cakes 0.49 0.79 3.95 3.91 6.85 1.60 3.63 12.60 25.90 24.41Processed Tea &Coffee 0.71 3.48 4.55 11.19 4.77 -3.16 6.11 -1.98 -0.71 7.77Salt 0.05 2.67 0.84 -6.70 1.47 3.73 5.42 5.51 5.51 1.72Other Food Products 0.88 4.72 11.54 9.22 13.92 14.48 8.69 6.15 1.89 3.57
Source : Office of the Economic Adviser. P : Provisional
http://indiabudget.nic.in

84 Economic Survey 2012-13
WPI- Non-food non-manufacturing inflation4.9 The composite non-food non-manufacturinggroup is a heterogeneous mix of commodities andcomprises non-food primary articles includingminerals as well as commodities in the broadgroup of ‘fuel and power’. Inflation in this compositegroup at aggregate level has shown somemoderation from its peak in Q1 of 2011-12, thoughit has remained in double digits overall. Withinthis composite group, inflation differed widelyacross commodity groups. In case of non-foodprimary articles, inflation witnessed a sharpdownturn and a nearly ‘V’ shaped rebound. Thedrivers for the downturn and the rebound, however,were different. Fibres led by cotton witnessedinflation of 62.7 per cent in Q1 of 2011-12, butthis turned negative by Q4 of the same year. Asharp increase in cotton production in 2010-12and recessionary global conditions affected prices.In other non-food primary articles, inflation surgedin 2010-11 largely because of increase in pricesof sugarcane and rubber. In 2011-12, guar seed,used in variety of industrial application, becamethe main driver of inflation in this group with an
average inflation of 155 per cent. Oilseeds alsowitnessed a sustained increase in prices. Inflationin minerals followed the prices of crude petroleum.For commodities in the ‘fuel and power’ group anincrease in the price of electricity across statespushed up the inflation in Q2 and Q3 of the currentyear. The prices of non-administered petroleumproducts tracked international prices andwitnessed moderation in inflation from its peak inQ3 of 2011-12. The increase in inflation ofadministered petroleum products in Q3 of 2012-13 was due to increase in the prices of diesel(Table 4.5). Diesel prices have been revised againin January and inflationary impact of this revisionwould be reflected in the WPI for January 2013.While this will add to inflation, it will also reducesuppressed inflation, and through its contributionto fiscal consolidation, have a moderating effectin the long run.
4.10 Momentum of inflation in this heterogeneousgroup based on SAAR indicates a downwardtrajectory. Stable or moderately rising crude oilprices and a benign inflationary outlook for otherproducts suggests grounds for some optimism(Figure 4.4)
Table 4.5 : Sub components of WPI Non-food inflation (%)
Components / Weight Average 2011-12 2012-13Sub components (%) (Apr-Mar)
2010- 2011- Q1 Q2 Q3 Q4 Q1 Q2 Q3P11 12
Non-Food Non-Manufacturing 20.69 15.67 14.51 16.20 14.97 13.72 13.33 10.52 10.79 10.37
(A) Non-Food Articles 4.26 22.33 9.65 22.23 16.16 4.15 -0.89 5.64 12.60 12.88
Fibres 0.88 41.69 10.09 62.69 29.78 1.39 -26.05 -20.84 1.04 -1.77
Oil Seeds 1.78 4.71 12.33 11.64 15.08 10.79 11.86 18.11 27.84 29.18
Other Non-Food Articles 1.39 37.26 10.52 14.72 12.20 7.93 7.77 16.07 6.82 6.19
(B) Minerals 1.52 24.82 26.60 25.48 24.48 23.67 32.52 11.66 13.51 6.61
Metallic Minerals 0.49 44.70 10.10 11.70 7.00 4.91 16.74 9.70 12.51 6.33
Crude Petroleum 0.90 11.82 45.19 40.60 43.76 44.93 51.02 12.85 13.44 5.23
(C) Fuel & Power 14.91 12.28 13.96 12.74 12.99 15.08 14.94 11.90 9.72 10.34
Coal 2.09 5.68 15.52 13.25 13.25 13.25 21.97 13.92 13.92 13.92
Mineral Oils 9.36 16.00 16.85 16.05 16.49 18.84 16.02 12.23 7.20 8.93
Administered POL 6.32 15.12 10.43 8.99 10.94 10.87 10.85 10.00 2.67 11.73
Non-administered POL 3.04 17.47 27.43 27.62 26.18 32.36 23.89 15.35 14.17 4.95
Electricity 3.45 5.38 1.64 0.27 -0.32 2.63 4.00 8.56 16.52 13.16
Source : Office of the Economic Adviser. P : Provisional.
http://indiabudget.nic.in

85Prices and Monetary Management
WPI- Non-Food Manufacturing Inflation4.11 Non-food manufacturing (NFM) inflation,defined as core inflation by the RBI, has declinedfrom 8.35 per cent in November 2011 to 4.24 percent in December, 2012. Within the non-foodmanufacturing group, beverages and tobaccoproducts, wood and wood products, chemical andchemical products witnessed inflation of over 6 percent in Q3 of 2012-13. Deceleration in inflation waswitnessed across all major segments ofmanufacturing. However, inflation in machinery andtransport equipment has generally remained low(Table 4.6).
4.12 SAAR of non-food manufacturing (Figure 4.5)also shows a downward momentum. Non-foodmanufactured products, except urea, are fullytradeable and as such are significantly influencedby global price trends. With global commodity priceswitnessing a decline in 2013 and a near stability in2014 (Box 4.3), non-food manufacturing inflation maysee some further moderation.
4.13 Within core inflation, inflation in capital goodscontinued to remain muted. Inflation in consumerdurables, though generally above core inflation, hasstarted showing signs of moderation from Q3 of 2011-12 and has since been gradually converging to the
Table 4.6 : Sub components of WPI Non-food Manufacturing inflation (%)
Components / Weight Average 2011-12 2012-13Sub components(%) (Apr-Mar)
2010- 2011- Q1 Q2 Q3 Q4 Q1 Q2 Q3P11 12
Non-Food Manuf. (Core) 55.00 6.11 7.29 7.35 7.80 8.13 5.92 5.15 5.71 4.64
Beverages & Tobacco Prod. 1.76 7.36 11.67 10.01 13.23 13.32 10.21 7.79 6.76 7.89
Textiles 7.33 12.08 7.46 15.78 9.69 6.14 -0.78 -2.78 2.86 4.49
Wood & Wood Products 0.59 3.97 8.09 5.87 8.88 8.91 8.70 6.67 5.92 6.03
Paper & Paper Products 2.03 5.33 5.39 7.51 5.53 5.30 3.30 2.21 2.86 3.35
Leather & Leather Products 0.84 -0.99 2.32 0.16 0.91 2.71 5.61 3.73 3.98 2.18
Rubber & Plastic Products 2.99 6.68 5.97 8.56 7.70 5.67 2.23 1.88 2.85 3.24
Chemicals & Products 12.02 5.34 8.61 7.45 8.71 9.93 8.36 7.24 7.63 6.09
Non-Metallic Mineral Prod. 2.56 2.68 5.73 3.91 4.12 7.65 7.23 7.13 9.22 5.44
Basic Metals, Alloys & Prod. 10.75 8.67 11.06 8.46 11.58 13.19 10.97 10.62 8.39 4.68
Machinery & its Tools 8.93 2.82 3.11 2.96 3.20 3.41 2.88 2.50 2.91 2.52
Transport, Equipment 5.21 3.02 3.52 2.16 4.07 4.54 3.34 3.83 3.80 4.34
Source : Office of the Economic Adviser. P : Provisional
http://indiabudget.nic.in

86 Economic Survey 2012-13
levels of core inflation (Figure 4.6). Moderation ininflation in consumer durables, where demand isinterest sensitive, probably reflects the impact ofmonetary policy.
CONSUMER PRICE INDICES (CPIS)CPI-IW-Inflation4.14 In India, most attention, including frompolicymakers, is devoted to headline WPIinflation. WPI series have a wider commoditybasket, with commodity weights derived fromthe National Accounts, reflect the underlyingeconomy-wide inflation better. Some economists,however, would prefer the central bank to targetconsumer price inflation rather than the NFMWPI inflation (or WPI headline), because theformer is what each consumer experiences.Moreover, generalized and persistent CPI inflationcould generate high inflationary expectationsamongst the public.
4.15 There have been 3 consumer price indices,before the Central Statistics Office launched the newCPI series in January 2011, each for a specific classof consumers. The CPI for industrial workers (CPI-IW), which is primarily used for wage indexation,however, has been the CPI index preferred by manyeconomists. Inflation during August 2010 to March2012 appears to follow a more or less similar trendirrespective of whether it is measured in terms ofthe WPI or CPI-IW. However, a nearly 2-percentagepoint gap has emerged in recent months betweenthese two measures. The momentum of the CPI-IW, as measured by its deseasonalized series, inrecent months is consistent with WPI-food inflation(Figure 4.7).
4.16 Turning to components of CPI-IW, inflationfor the food group, after declining to 4.52 per cent inQ4 of 2011-12, started showing an increasethereafter and has been in double digits in last threequarters of 2012-13. Inflation in the fuel and lightand broad group pan supari and tobacco has alsoremained in double digit in the last seven quarters.
http://indiabudget.nic.in

87Prices and Monetary Management
Inflation in housing has declined since Q1 of 2011-12 (Table 4.7).
4.17 The Central Statistics Office in the Ministryof Statistics and Programme Implementation started
Table 4.7 : Inflation in Consumer Price Index for Industrial Workers (CPI-IW)Major groups Weights 2010-11 2011-12 2012-13
Q1 Q2 Q3 Q4 Q1 Q2 Q3
General 100 10.45 8.91 9.16 8.39 7.17 10.14 9.76 10.1
Food group 46.2 9.89 7.58 7.29 6.05 4.52 10.57 11.49 11.41
Pan, supari, tobacco &intoxicants 2.27 12.42 13.91 15.23 16.87 15.21 14.9 15.13 14.94
Fuel & light 6.43 9.81 13.73 14.17 15.37 17.82 18.97 12.06 12.8
Housing 15.27 21.12 12.17 10.95 10.95 8.96 8.96 6.73 6.73
Clothing, bedding & footwear 6.57 6.73 12.94 14.43 15.61 13.11 10.79 9.35 8.44
Miscellaneous group 23.26 5.26 6.75 7.73 8.03 7.05 7.35 7.57 8.61
Non-food 53.8 11 10.23 11.01 10.75 9.77 9.73 8.11 8.84Source : Labour Bureau.
Table 4.8 : Quarterly inflation in Consumer Price Index for New series (CPI-NS) (2010=100)
Areas Groups Weights (%) 2011-12 2012-13Q4 Q1 Q2 Q3
Rural General 100.00 8.11 9.63 9.82 10.20Food 56.59 6.01 10.10 11.62 12.27Non-food 43.41 10.86 9.03 7.53 7.59
Urban General 100.00 9.33 11.02 10.00 9.86Food 35.81 6.76 11.13 12.16 11.74Non-food 64.19 10.81 10.95 8.79 8.81
Combined General 100.00 8.62 10.18 9.87 10.07Food 47.57 6.25 10.47 11.81 12.10Non-food 52.43 10.8 9.92 8.13 8.26
Source : CSO.
http://indiabudget.nic.in

88 Economic Survey 2012-13
a new series of CPI in January 2011. The new serieshas a wide geographical spread and covers 310towns and 1181 villages. With a weighting schemederived from the Consumer Expenditure Survey Data(2004-05), the new series has an all India character.Since the series is fairly new, inflation numbers areavailable only for 12 months so far. Broad food andnon-food weights of the new CPI series more or lessmatch those on CPI-IW. Though the points ofinflection are common, the new series shows higheroverall food inflation than the CPI-IW (Table 4.8).
Why has inflation persisted?4.18 Inflation in protein foods, particularly eggs,meat and fish, and in fruits & vegetables haspersisted because of changes in dietary habits andsupply constraints. Long time series data fromNational Accounts on private final consumptionexpenditure (PFCE) indicate a structural shift in percapita consumption (Table 4.9). The share of foodconsumption in total consumption has declined over
time, from an average of 51.34 per cent during 1950-60 to an average of 27.17 per cent during 2007-2012. Average annual growth in per capita foodconsumption at 0.94 per cent during 1950-2012 hasbeen significantly lower than the overall growth inconsumption averaging 1.84 per cent. Theconsumption of protein foods, though increasingmore slowly than the increase in PFCE, had agrowth of 1.50 per cent during 1950-2012, higherthan the growth of overall expenditure on food.Therefore, the share of protein foods within overallfood expenditure increased from 26.28 per centduring 1950-60 to 33.71 per cent during 2007-2012(Figure 4.8).
4.19 A secular decline in expenditure on foodrelative to that in other commodities and servicesas expected has been associated with rising incomelevels (Figure 4.9). Average annual growth of percapita expenditure during 1950-2011 was 2.40 percent for non-food group. Within non-foodcommodities and services, average annual growth
Table 4.9 : Change in consumption patternAverage Annual Consumption per capita at Trend Growth Rates
2004-05 prices (Rupees)1950-91 1992-97 1997-02 2002-07 2007-12 1950-2012 1950-1991 1991-2012
Food 4550 5803 6123 6066 6700 0.94 0.83 0.88
Protein Food (Pulses;Milk; Eggs, Meat & Fish) 1090 1654 1881 1962 2258 1.50 0.65 2.09
Cereals 1560 1705 1634 1578 1586 0.22 0.46 -0.55
Others 1900 2444 2608 2525 2856 1.10 1.25 0.92
Non-Food 4623 7206 9192 12015 17957 2.48 1.36 5.79
clothing & footwear 555 951 1083 1312 2062 3.05 3.13 4.61medical care & healthservices 255 404 620 879 1172 3.64 3.46 7.09
transport &communication 523 1703 2402 3396 4796 5.57 4.41 7.09
Other Non-food 3290 4147 5087 6428 9927 1.64 0.49 5.35Private FinalConsumptionExpenditure (PFCE)in domestic market 9174 13009 15315 18081 24657 1.84 1.10 3.99
Share of Food in PFCE (%) 49.6 44.61 39.98 33.55 27.17Share of Food Groups intotal Food Consumption (%)Protein foods 23.96 28.51 30.72 32.35 33.71
Cereals 34.29 29.39 26.68 26.01 23.67Others 41.75 42.11 42.60 41.63 42.63
Source : National Accounts Statistics (NAS) various issues.Note : Last 4 periods correspond to Plan Periods.
http://indiabudget.nic.in

89Prices and Monetary Management
was 5.53 per cent, 3.97 per cent, 3.60 per cent and3.42 per cent for transport and communication;recreation and education; medical and health care;
and miscellaneous goods and services, respectively.Growth in expenditure for these sub sectorssignificantly exceeded the growth in expenditure on
http://indiabudget.nic.in

90 Economic Survey 2012-13
food. Post reform period (1992-93 to 2010-11) hasshown a faster shift in consumption expenditure.
4.20 An increase in income made this desirableshift in consumption feasible. At national level, percapita income, adjusted for inflation continued torise. There was also a significant increase in ruralwages. Rural wages in nominal terms went up byan average of over 18 per cent from 2008-09. Inflation-adjusted rural wages also went up by 7.5 per centduring this period. (Figure 4.10)
4.21 The input costs for producers in both the foodand non-food segments, as reflected in the pricesof feed, fodder and other inputs also increased. Anincrease in Minimum Support Price (MSP), whilenecessary to ensure remunerative returns tofarmers, raised the floor prices and also contributedto the rise in input prices.
Commodities under price pressure andpolicy initiatives4.22 As indicated earlier, a few commodities havecontributed disproportionately to inflation. In Q2 of
2012-13, 19 commodities (commodity groups) witha 28.68 per cent weight in WPI contributed 64.38per cent to total inflation (Table 4.10). Thecontribution of each of these commodities to inflationin Q2 or Q3 of 2012-13 exceeded their weight by1.5 times.
4.23 Inflation in India, as in other countries stemsfrom a traditional mismatch between demand andsupply. The relative magnitude of the imbalance,which varies across sectors, leads to relatively highor low inflation. Also, a change in controlled prices,as with diesel, can lead to inflation.
4.24 Two factors contributed to an increase ininflation in cereals. Besides an increase in the MSPfor wheat and rice, there has been a mismatchbetween open market availability and demand,particularly for wheat. A sharp increase inprocurement of wheat in particular, reduced its openmarket availability pushing prices upwards. Whilein normal circumstances, higher procurement raisesthe ratio of stock to use and may lead to pricestabilization, a higher procurement which reduced
Table 4.10 : Weighted Contribution to Headline WPI Inflation: Items to be watchedMajor groups Weights 2010-11 2011-12 2012-13
FY Q1 Q2 Q3 Q4 Q1 Q2 Q3PFood Products 13.03 9.44 12.91 14.79 11.03 14.02 22.99 30.24 35.37Rice 1.79 1.33 0.66 0.84 0.68 0.68 1.61 2.77 4.02Wheat 1.12 0.44 -0.01 -0.14 -0.52 -0.47 1.06 1.96 3.57Maize 0.22 0.27 0.84 0.59 0.44 0.62 0.29 0.41 0.75Gram 0.33 -0.06 0.25 0.82 1.77 1.89 2.44 2.96 1.95Potatoes 0.20 -1.2 0.00 0.25 -0.38 -0.08 1.50 1.64 1.63Onions 0.18 0.79 0.20 0.76 -2.09 -3.40 -0.24 -0.65 0.74Fish (inland+ marine) 1.30 5.47 2.29 2.96 4.12 6.79 5.64 4.70 4.20Black Pepper 0.03 0.14 0.33 0.31 0.41 0.41 0.36 0.37 0.24Tea (primary+ manufacturing) 0.80 0.04 0.94 0.31 -0.39 0.48 0.17 0.37 0.93Oil seeds+ edible oils+ oilcake 5.32 2.47 6.27 6.89 5.64 6.26 8.84 11.96 13.22Sugar 1.74 -0.25 1.14 1.20 1.35 0.84 1.32 3.75 4.12Manufactured Products 1.45 3.67 3.97 4.74 6.69 7.55 6.91 6.71 4.33Non-Urea Fertilizer 1.08 0.83 1.01 1.39 2.90 3.41 3.33 4.00 2.81Gold, Sliver & gold ornaments 0.37 2.84 2.96 3.35 3.79 4.14 3.58 2.71 1.52Other products 14.2 18.3 23.01 24.37 30.23 38.8 28.65 23.65 24.68Crude Petroleum 0.90 1.54 5.39 5.61 6.43 8.74 2.79 2.79 1.24Coal 2.09 1.49 3.38 3.29 3.48 7.12 4.68 4.41 4.72Non Administered Mineral Oil 3.04 6.63 10.92 10.20 13.73 13.18 9.01 7.84 3.17Electricity 3.45 1.59 0.08 -0.09 0.80 1.40 2.89 5.31 4.66Gaur Seed 0.05 0.04 0.25 0.50 0.68 2.40 3.99 1.28 0.85High Speed Diesel 4.67 7.01 2.99 4.86 5.11 5.96 5.29 2.02 10.04
Source: Office of the Economic Adviser. P : Provisional
http://indiabudget.nic.in

91Prices and Monetary Management
non-PDS availability in a significant manner createdinflationary pressures. Higher international pricesand reduced global availability also pushedinternational prices upwards. This created spacefor exports of wheat and again reduced privateavailability of wheat. While the FCI has undertakenopen market sales for domestic use and exports,these operations have so far had limited impact ondomestic prices. Perhaps more aggressive openmarket sales may be necessary to cool down themarket, though with MSP providing a high floor tomarket prices, there is limited room. An increase inMSPs of wheat and rice also partly contributed tohigher domestic prices. The difference between retailprices of wheat and its MSP widened from July,2012. In case of rice also, difference widened duringMarch-October, 2012 and again in December, 2012(Figure 4.11(a) and 4.11(b)). In pulses too an upsurgein prices has largely been due to persistentmismatch in demand and domestic availability. Inthe long run, containment of inflation in pulses wouldrequire an increase in the supply of pulses throughimproved productivity.
4.25 Prices of vegetables have remained volatilein the recent past. Apart from a demand and supplymismatch, inefficient intermediation and the loss inthe value of vegetables at different stages of theirmovement from farm to mouth have contributed toan increase in prices, high volatility, and significantdispersion across locations. All these could bereduced considerably with improvements in thesupply chain. The existence of a large number ofintermediaries between the farmer and theconsumers and time delays due to their activitiesleads to intermediation costs and value losses.
Organised marketing and greater private sectorparticipation is critical for improving this state ofaffairs but it requires reforming the APMC legislation.The Inter Ministerial Group on Inflation (IMG)(seebox 4.1) had suggested exempting perishables fromthe purview of APMC Act, providing farmers thefreedom to make direct sales to aggregators andprocessors, introducing electronic auction platformsfor all mandis and replacing licenses of the APMCmarket with open registration backed by bankguarantees. Electronic display of prices for shortduration vegetable crops could reduce theasymmetry in information flow and provideappropriate marketing signals to producers. Acommittee set up by Planning Commission toencourage investment in supply chains has alsosuggested exempting perishables from the purviewof APMC.
4.26 There have been some developments alongthese recommended lines. To develop integratedvalue chains, the government has emphasized theneed for exempting vegetables from the levy of marketfees. The States of Madhya Pradesh and WestBengal have recently waived the market fee on fruitsand vegetables. Such waivers are expected topromote investment in development of backendinfrastructure by private sector. The Ministry ofAgriculture in collaboration with Forward MarketsCommission is facilitating display of spot and futuresprices on price ticker boards in around 1700 mandisin different states. Recently, the government haspermitted Foreign Direct Investment (FDI) in multi-brand retail trading. This will help consumers andfarmers by improving the logistical facilitiesconnecting the two.
http://indiabudget.nic.in

92 Economic Survey 2012-13
Box 4.1 : Inter-Ministerial Group (IMG) on InflationAn Inter-Ministerial Group (IMG) on inflation was set up on 2 February, 2011, on the recommendation of the Prime Minister,under the chairmanship of Chief Economic Adviser, Ministry of Finance to review the overall inflation situation, withparticular reference to primary food articles. The IMG has so far had eight meetings between 15 February, 2011 and 31January, 2012 covering various aspects, including information system on all aspects of price monitoring, Foreign DirectInvestment (FDI) in multi-brand retail, reform in APMC Act, policy options for diesel pricing and inflation in protein richproducts among others.
In the sixth and seventh meetings of IMG held on 28 May, 2012 and 14 September, 2012, IMG had discussed policy optionsto reduce the distortions in the prices between diesel and other petroleum product. It was suggested that in a gradual mannersubsidy on diesel may be shifted to fixed per litre basis and price adjustment could be more frequent, and with regularintervals, may be on a monthly basis. It was also mentioned that any revision in diesel prices would have a direct and indirectimpact on inflation, which continues to be at elevated levels. The revision, therefore, needs to be calibrated.
IMG further recommended a long term credible policy intervention for augmenting supplies of primary products. MSP basedincentives without a breakthrough in productivity level, may not be sufficient. Productivity of pulses could be increased withthe use of genetic seeds and a proper regulatory environment.
4.27 The persistence of high inflation in animalproducts has partly been due to the regionalconcentration of production centres, rising inputcosts which raised the floor price and lowerproductivity. While in some cases, there has beenan increase in availability, typically it has been at ahigher cost. Further, due to limited organizedmarketing (even in case of milk it is around 15 percent of total milk produced) back end infrastructuresuch as a seamless cold chain has not beenestablished, reducing quality and increasingwastage.
4.28 There was an upsurge in sugar prices in firsthalf of the current year with domestic and globalprices showing a divergent trend. An increase inprices in July 2012 has partly been due to theimposition of import duty. While there are no pricecontrols per se (90 per cent of sugar production isfor free sale), a regulated release mechanismrestricts availability and may often distort prices.The quantum of non-levy sugar to be released everyquarter for domestic consumption is decided by theCentral Government taking into consideration theproduction, stock, requirement and prices of sugarin the country. Though this mechanism is meant toensure price stability, sugar prices on the contrary,have demonstrated a high degree of volatility. TheRangarajan Committee, after studying the problemsof the sugar industry, has recommendedderegulation of the sugar industry and dismantlingof the regulated release mechanism together withthe levy obligations. These recommendations areunder consideration of the Department of Food andPublic Distribution.
4.29 Except some of the primary food articles, ureaand administered petroleum products, the rest ofthe components in WPI are fully tradeable and noneof these products are under an administered priceregime. Domestic prices for these products aregoverned both by global commodity prices and theirdomestic availability. A stable rupee and moderateglobal prices, both relatively exogenous factors, maybe important in keeping the prices of these productsstable.
4.30 The inflation picture is further complicated inIndia because of a shifting consumption basket towhich the supply of proteins and micro-nutrients likefruits and vegetables has not responded quickly.Interest rates are probably an inappropriate tool toshift people’s preferences. This is why it may bereasonable for the RBI to look through the rise infood prices (which is what it does by focusing onNFM “core” inflation, which puts lower emphasis onfood prices), while trying to ensure that food inflationdoes not feed into wages and generalized inflation.However, food is a large part of a worker’sconsumption basket, and higher food prices do feedinto higher wage demands. What can be done?Government’s efforts to create the conditions forgreater protein supply (some of which are describedearlier) are important. Tempering governmentinterventions that raise wage increases aboveproductivity increases may also be worth exploring.
Measures to contain inflation4.31 Inflation has been a major cause of concernfor both the government and the RBI. They havetaken a number of measures to contain it as
http://indiabudget.nic.in

93Prices and Monetary Management
Box 4.2 : Measures Taken and Proposed by the Government to Contain Price Rise1. Fiscal measures
Import duties for wheat, onions, pulses, and crude palmolein were reduced to zero and 7.5 per cent for refined vegetable& hydrogenated oils.
Duty-free import of white/raw sugar was extended up to 30 June 2012; presently the import duty has been fixed at 10per cent.
2. Administrative measures
Ban on exports of onions was imposed for short periods of time whenever required. Exports of onions were calibratedthrough the mechanism of minimum export prices (MEP).
Futures trading in rice, urad, tur, guar gum and guar seed was suspended.
Exports of edible oils (except coconut oil and forest-based oil) and edible oils in blended consumer packs up to 5 kg witha capacity of 20,000 tons per annum and pulses (except Kabuli chana and organic pulses and lentils up to a maximumof 10,000 tonnes per annum) were banned.
I Stock limits were imposed from time to time in the case of select essential commodities such as pulses, edible oil, andedible oilseeds and in respect of paddy and rice up to 30 November 2013.
3. The government has undertaken various measures to insulate the vulnerable sections of society from price rise.
The central issue prices (CIP) for rice (at Rs 5.65 per kg for below poverty line [BPL] and Rs 3 per kg for Antodaya AnnaYojana [AAY] families) and wheat (at Rs 4.15 per kg for BPL and Rs 2 per kg for AAY families) have been maintainedsince 2002.
Under the targeted PDS (TPDS) allocation of foodgrains is being made to 6.52 crore AAY and BPL families at 35 kg perfamily per month at a highly CIP.
The government has allocated rice and wheat under the Open Market Sales Scheme (OMSS).
The scheme for imports of pulses which envisaged imports for distribution to BPL households through the PDS with asubsidy of Rs 10 per kg operated from November 2008 to June 2012. The government has decided to implement a variedform with a subsidy element of Rs 20 per kg per month for BPL cardholders for the residual part of the current year. Thetargeted BPL cardholders will be as estimated by the Department of Food and Public Distribution.
The Scheme for Distribution of Subsidized Imported Edible Oils has been implemented since 2008-9 through state/union territory (UT) governments for distribution of 1 litre per ration card per month with a central subsidy of Rs 15 perkg. The scheme has been extended up to 30 September 2013.
4. Budgetary and other measures
A number of measures were announced in Union Budget 2012-13 to augment supply and improve storage andwarehousing facilities. The government launched a National Mission for Protein supplements in 2011-12 with anallocation of Rs 300 crore. To broaden the scope of production of fish to coastal aquaculture, apart from fresh wateraquaculture, the outlay in 2012-13 was stepped up to Rs 500 crore. Recently the government permitted FDI in multi-brand retail trading. This will help consumers and farmers as it will improve the selling and purchasing facilities.
5. Monetary measures
The RBI had also taken suitable steps to contain inflation with 13 consecutive increases by 375 basis points (bps) in policyrates from March 2010 to October 2011.
indicated in Box 4.2. The measures could beclassified as those that contain demand (such ashigher interest rates), those that improve supply(such as incentives for producers), those that shieldvulnerable consumers (such as targeted subsidiesfor below poverty line (BPL) families), those thatprotect all against a price rise (such as subsidizingdiesel prices), and those that shut down marketsso as to suppress price signals (such as shutting
down commodity futures markets) or to quell priceincreases (such as export bans).
4.32 Given that inflation has been persistent, itsuggests a significant mismatch between demandand supply. In the short run, curbing demandmoderately so as to allow supply to catch up canbe an effective tool, while in the long run, measuresto increase supply are the only way to have non-
http://indiabudget.nic.in

94 Economic Survey 2012-13
inflationary growth. For some articles such as food,where demand is hard and probably unwise to curb,supply increases have to be the primary solution.The government can curb demand through fiscalconsolidation, while the RBI does so through highpolicy rates and tight liquidity. These measures mayhave an adverse effect on growth, but that isprecisely how they curb inflation. Given that Indiafaces a number of constraints on supply, such aslow agricultural productivity, poor infrastructure, anda limited skill base, the growth-friendly way to dealwith inflation is to focus on boosting the supply side,as a number of government initiatives attempt. Andbecause the vulnerable segments of society maybe adversely affected before supply side measureskick in, some targeted support is reasonable.However, broader support (such as a diesel subsidy)tends to suppress price signals, boosts demandexcessively, expands the fiscal deficit, and makesthe fight against inflation harder. Such short termpalliatives need to be avoided. Equally counter-productive are periodic bans of exports, impositionand removal of tariffs, and repeated closure of futuresmarkets. These tend to make it harder for producersto plan, reduces their incentives to produce bylimiting their remuneration, and inhibits theproduction increases that are needed to bring pricesunder more sustained control.
Trends in Global Commodity Prices4.33 Global commodity prices peaked in Q3 of2008-9. Prices started decelerating thereafter andthis trend continued until January 2009, since thenprices have firmed up. The increase was particularlysharp in 2010 and Q1 of 2011, both for energy andnon-energy commodities. While non-energy pricesbegan to moderate from Q2 of 2011-12 and inflationbegan to turn negative for most of the commoditygroups, the moderation in energy prices began alittle later (Table 4.11 and Figure 4.12). In the firstthree quarters of the current year, both energy andnon-energy prices registered a decline. This waspartly because of the base effect and partly becauseof a decline in prices, particularly for beverages andbasic metals.
4.34 Global supply shortages in food grains in 2012-13, particularly in wheat and coarse grains resultedin sharp increase in prices in wheat and maize,pushing up the commodity index for the broad groupof grains. In Q2 of 2012-13, fats and oils alsowitnessed an increase in prices because of the food,feed and fuel leakages. Prices for fats and oilsmoderated thereafter and remained range bound inQ3.
4.35 The benign inflationary trend is expected tocontinue and the World Bank in its Global Economic
Table 4.11 : Inflation in Global Commodity GroupsMajor groups 2010-11 2011-12 2011-12 2012-13
Q1 Q2 Q3 Q4 Q1 Q2 Q3
Index (2005=100)Energy 154.5 193.0 197.6 187.2 186.6 200.8 183.7 183.2 182.1Non-energy 188.4 202.8 217.2 212.3 188.8 192.9 189.3 191.0 186.9Beverages 194.1 196.2 218.7 210.7 183.7 171.7 162.7 169.7 160.8Grains 189.7 236.8 245.8 245.4 229.3 226.8 227.1 263.9 258.9Fats & Oils 202.2 216.7 227.1 220.4 202.5 216.9 231.1 250.2 221.9Base Metals 181.0 185.1 203.8 194.4 164.1 178.2 166.2 162.1 167.7Precious Metals 294.2 385.7 370.2 404.5 382.0 386.1 363.6 372.7 390.7Inflation YOY (%)Energy 21.10 24.94 38.35 35.12 20.02 10.80 -7.05 -2.14 -2.41Non-energy 24.82 7.63 32.70 24.52 -4.62 -12.93 -12.83 -10.02 -1.01Beverages 17.47 1.08 24.33 12.61 -5.09 -21.91 -25.61 -19.43 -12.46Grains 14.14 24.87 65.93 45.07 10.31 -2.87 -7.63 7.53 12.87Fats & Oils 18.22 7.20 36.78 20.96 -7.78 -9.93 1.76 13.54 9.57Base Metals 30.08 2.27 27.41 19.35 -13.90 -15.40 -18.44 -16.59 2.16Precious Metals 31.02 31.12 41.02 50.20 21.75 16.61 -1.77 -7.85 2.27
Source : World Bank Pink Sheet.
http://indiabudget.nic.in

95Prices and Monetary Management
Box 4.3 : Global Commodity Prices : ForecastTable : Nominal Price Indices- actual and forecasts (2005=100)
Forecast Rate ofchange (%)
2008 2009 2010 2011 2012 2013 2014 2012-13 2013-14
Energy 183 115 145 188 187 183 183 -2.6 0.1Non-Energy 182 142 174 210 190 186 180 -2.0 -3.2Metals 180 120 180 205 174 176 176 1.3 0.1Agriculture 171 149 170 209 194 188 180 -3.2 -4.4Food 186 156 170 210 212 205 192 -3.2 -6.4Grains 223 169 172 239 244 239 225 -2.1 -6.0Fats and oils 209 165 184 223 230 220 206 -4.2 -6.5Other food 124 131 148 168 158 153 143 -3.1 -6.6Beverages 152 157 182 208 166 158 155 -4.7 -2.0Raw Materials 143 129 166 207 165 162 162 -2.2 0.4Fertilizers 399 204 187 267 259 245 232 -5.6 -5.3Precious Metals 158 175 272 372 378 378 353 0.0 -6.7Crude oil ($/bbl) 97 62 79 104 105 102 102 -2.9 0.2Gold ($/toz) 872 973 1225 1569 1670 1600 1550 -4.2 -3.1
Source : World Bank
The broad assessment of inflation for commodity groups by the World Bank is as under:
• Nominal oil prices are expected to average US $102/bbl in 2013 and 2014 as supplies accommodate moderate demandgrowth. Over the longer term, oil prices are projected to fall in real terms, due to growing supply, efficiency gains, and asubstitution away from oil. While OPEC may continue to limit production, it probably will not let prices rise too high, forfear of inducing a search for alternative oil supplies or energy sources that alters the long-term price of oil.
• Overall metal prices, except copper are expected to increase. Aluminum prices may increase by 3 percent in 2013 andremain at that level in the two subsequent years due to rising power costs, and the fact that current prices have pushedsome producers at or below production costs. Copper prices may decline mostly due to substitution pressures, andslowing demand. Although there are no physical constraints in metal markets, declining ore grades, environmentalissues, and rising energy costs may force prices higher.
• Assuming that there are no major shifts for biofuels, agricultural prices are projected to decline in 2013. Specifically,wheat and maize prices are expected to be lower than their 2012 levels. Soybean and palm oil prices are also expected tobe lower because of adequate availability.
http://indiabudget.nic.in
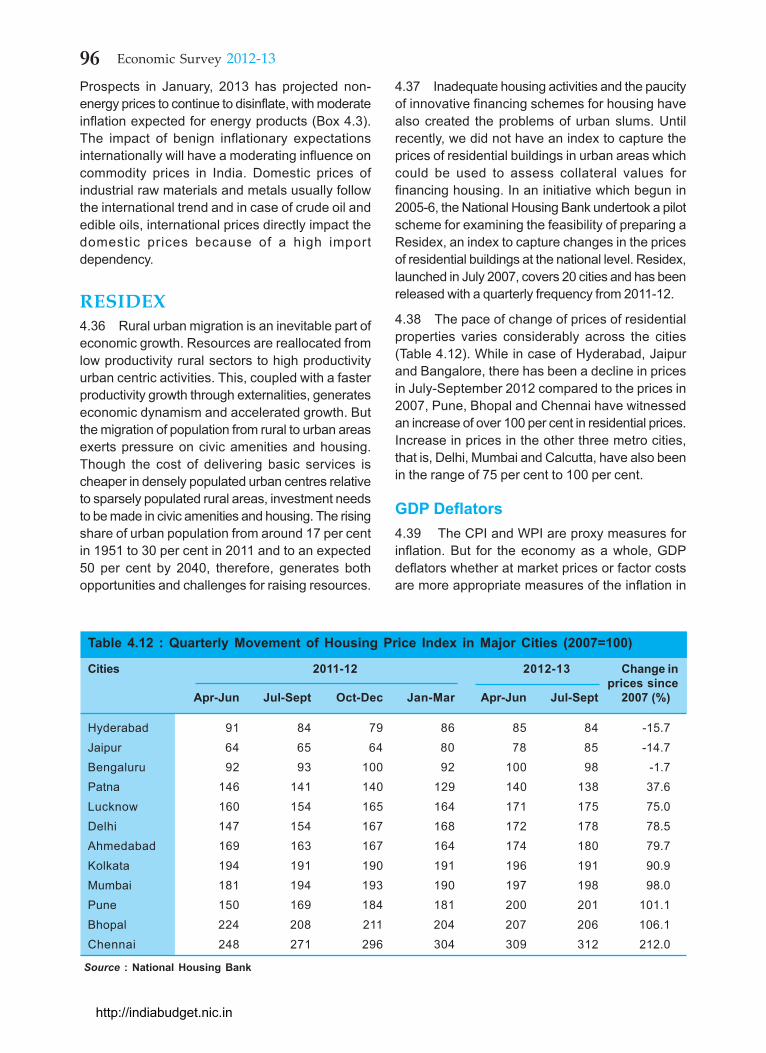
96 Economic Survey 2012-13
Prospects in January, 2013 has projected non-energy prices to continue to disinflate, with moderateinflation expected for energy products (Box 4.3).The impact of benign inflationary expectationsinternationally will have a moderating influence oncommodity prices in India. Domestic prices ofindustrial raw materials and metals usually followthe international trend and in case of crude oil andedible oils, international prices directly impact thedomestic prices because of a high importdependency.
RESIDEX4.36 Rural urban migration is an inevitable part ofeconomic growth. Resources are reallocated fromlow productivity rural sectors to high productivityurban centric activities. This, coupled with a fasterproductivity growth through externalities, generateseconomic dynamism and accelerated growth. Butthe migration of population from rural to urban areasexerts pressure on civic amenities and housing.Though the cost of delivering basic services ischeaper in densely populated urban centres relativeto sparsely populated rural areas, investment needsto be made in civic amenities and housing. The risingshare of urban population from around 17 per centin 1951 to 30 per cent in 2011 and to an expected50 per cent by 2040, therefore, generates bothopportunities and challenges for raising resources.
4.37 Inadequate housing activities and the paucityof innovative financing schemes for housing havealso created the problems of urban slums. Untilrecently, we did not have an index to capture theprices of residential buildings in urban areas whichcould be used to assess collateral values forfinancing housing. In an initiative which begun in2005-6, the National Housing Bank undertook a pilotscheme for examining the feasibility of preparing aResidex, an index to capture changes in the pricesof residential buildings at the national level. Residex,launched in July 2007, covers 20 cities and has beenreleased with a quarterly frequency from 2011-12.
4.38 The pace of change of prices of residentialproperties varies considerably across the cities(Table 4.12). While in case of Hyderabad, Jaipurand Bangalore, there has been a decline in pricesin July-September 2012 compared to the prices in2007, Pune, Bhopal and Chennai have witnessedan increase of over 100 per cent in residential prices.Increase in prices in the other three metro cities,that is, Delhi, Mumbai and Calcutta, have also beenin the range of 75 per cent to 100 per cent.
GDP Deflators4.39 The CPI and WPI are proxy measures forinflation. But for the economy as a whole, GDPdeflators whether at market prices or factor costsare more appropriate measures of the inflation in
Table 4.12 : Quarterly Movement of Housing Price Index in Major Cities (2007=100)
Cities 2011-12 2012-13 Change inprices since
Apr-Jun Jul-Sept Oct-Dec Jan-Mar Apr-Jun Jul-Sept 2007 (%)
Hyderabad 91 84 79 86 85 84 -15.7Jaipur 64 65 64 80 78 85 -14.7Bengaluru 92 93 100 92 100 98 -1.7Patna 146 141 140 129 140 138 37.6Lucknow 160 154 165 164 171 175 75.0Delhi 147 154 167 168 172 178 78.5Ahmedabad 169 163 167 164 174 180 79.7Kolkata 194 191 190 191 196 191 90.9Mumbai 181 194 193 190 197 198 98.0Pune 150 169 184 181 200 201 101.1Bhopal 224 208 211 204 207 206 106.1Chennai 248 271 296 304 309 312 212.0
Source : National Housing Bank
http://indiabudget.nic.in

97Prices and Monetary Management
Table 4.13 : Revision in Policy Rates (per cent)Effective date Repo rate Reverse repo rate CRR SLR MSF rate*
2010-1120 Apr. 2010 5.25 3.75 5.75 25.0024 Apr. 2010 5.25 3.75 6.00 25.002 Jul. 2010 5.50 4.00 6.00 25.0027 Jul. 2010 5.75 4.50 6.00 25.0016 Sep. 2010 6.00 5.00 6.00 25.002 Nov. 2010 6.25 5.25 6.00 25.0018 Dec. 2010 6.25 5.25 6.00 24.0025 Jan. 2011 6.50 5.50 6.00 24.0017 Mar. 2011 6.75 5.75 6.00 24.002011-123-May-11 7.25 6.25 6.00 24.009-May-11 7.25 6.25 6.00 24.00 8.2516 Jun. 2011 7.50 6.50 6.00 24.00 8.5026 Jul. 2011 8.00 7.00 6.00 24.00 9.0016 Sep. 2011 8.25 7.25 6.00 24.00 9.2525 Oct. 2011 8.50 7.50 6.00 24.00 9.5028 Jan. 2012 8.50 7.50 5.50 24.00 9.5010 Mar. 2012 8.50 7.50 4.75 24.00 9.502012-1317 Apr. 2012 8.00 7.00 4.75 24.00 9.0018 Jun. 2012 8.00 7.00 4.75 24.00 9.0011 Aug. 2012 8.00 7.00 4.75 23.00 9.0022 Sep. 2012 8.00 7.00 4.50 23.00 9.0003 Nov. 2012 8.00 7.00 4.25 23.00 9.0018 Dec. 2012 8.00 7.00 4.25 23.00 9.0029 Jan. 2013 7.75 6.75 4.25 23.00 8.7509 Feb 2013 7.75 6.75 4.00 23.00 8.75
Source : Reserve Bank of India (RBI). * Note: The MSF commenced from 9 May 2011.
goods and services produced. These alternatemeasures match WPI but diverge somewhat fromCPI-IW. In the case of CPI-IW, moderation in inflationin Q2 of 2009-10 is insignificant, largely becausefood inflation remained elevated during this period.
MONETARY MANAGEMENT
Monetary Developments During 2011-124.40 The RBI’s monetary policy stance hascontinued to focus on the twin objectives ofcontaining inflation and facilitating growth (a flowchart depicting the transmission of monetary policyis at Box 4.4). Mounting inflationary pressuresduring January 2010 to October 2011 requiredadoption of a tight monetary policy by the ReserveBank of India (RBI). During this period, RBI raised
policy rates (repo rates) by 375 basis points, from4.75 per cent to 8.5 per cent. There was a moderationin inflation from its peak of 10.9 per cent in April2010, to an average of 7.6 per cent during April-December 2012. However, increasing risks to growthfrom external as well as domestic sources and tightmonetary policy in face of persistent inflationarypressures has contributed to a sharper slowdownof the economy than anticipated. There has been ashift in the policy stance of RBI since October 2011wherein it has attempted to balance growth andinflation dynamics. It reduced repo rates by 50 basispoints in April, 2012 and again in January 2013 by25 basis points and reduced the Cash Reserve Ratio(CRR) and Statutory Liquidity Ratio (SLR) to improveliquidity conditions (Table 4.13).
4.41 As per the assessment of RBI, globaleconomic and financial conditions have continued
http://indiabudget.nic.in

98 Economic Survey 2012-13
Box 4.4 : Transmission of Monetary Policy
Box 4.4: Transmission of Monetary Policy
Policy Rates
Expectations Money Market Interest Rates
Money Credit
Asset Prices
Bank Rates
Exchange Rate
Wage and price-setting
Supply and demand in goods and labour markets
Domestic Prices Import Prices
Price developments
Shocks outside the control of the Reserve Bank
Changes in bank capital
Changes in the global economy
Changes in fiscal policy
Changes in commodity prices
http://indiabudget.nic.in

99Prices and Monetary Management
to remain too fragile to provide any external growthstimulus to the economy. On the other hand,inflationary pressures originating from within thecountry and outside, particularly the depreciatingrupee exerting its pressure on tradables, may makeany reduction in policy rates counterproductive.Furthermore, tight liquidity conditions emerged asa risk to adequate flow of credit to productive sectors.Monetary policy therefore has continued to follow acautious stand, which, while keeping liquiditycomfortable to support growth, had to pause in itspolicy rate reduction during April-December 2012due to persistent inflation risks. This cautiousmonetary policy stance was also considerednecessary by RBI in view of mounting subsidiesand deteriorating fiscal situation. Government inSeptember 2012, however, announced a road mapof fiscal consolidation with a clearly defined midtermfiscal target. It also attempted to improve theinvestor perception and create a favourableenvironment for investment. In January 2013, theGovernment also announced an increase in dieselprices to indicate its resolve to reduce fiscal deficitconsistent with the medium term fiscal targetannounced earlier in September, 2012. There hasbeen some moderation in inflation in the Q3 of 2012-13 and with the expected fiscal consolidation, thecurrent macroeconomic situation creates room fora somewhat accommodative monetary policy.
4.42 The monetary policy stance of Reserve Bankof India in the current year was based on itsprojection of macroeconomic parameters for 2012-13. In its Monetary Policy Statement 2012-13released on April 17, 2012, RBI expected GDPgrowth at 7.3 per cent and WPI inflation to gradually
moderate to 6.5 per cent by March 2013. In its FirstQuarter Review of July 31, 2012 while the growthprojection was revised downwards to 6.5 per cent,the WPI inflation projection was revised upwards to7.0 per cent. Consistent with this growth and inflationexpectation, it set a target of M3 and non-food creditgrowth of 15 per cent and 17 per cent, respectively.In its Second Quarter Review on October 30, 2012,RBI reduced its projection of GDP growth further to5.8 per cent and revised its inflation projectionupwards to 7.5 per cent. The indicative targets ofM3 and credit growth, therefore, were reviseddownwards to 14 per cent and 16 per cent,respectively. RBI in its Third Quarter Review ofmonetary policy on January 29, 2013 reduced itsGDP projection to 5.5 per cent with expected inflationalso moderating to 6.8 per cent by March 2013.Further, M3 growth projections were lowered to 13.0per cent even though credit growth was retained at16.0 per cent. Movement of the monetaryaggregates, however, indicate that the growth ofbroad money and credit have been below theindicative levels set by RBI.
4.43 The moderation in growth and nearly flatinflation at around 7-8 per cent in the current yearalso affected the growth of aggregate deposits, froman average of 17.4 per cent in Q1 of 2011-12 to 12.9per cent in Q3 of 2012-13. The rate of growth ofbank credit also moderated from its peak of 21.7%in Q1 of 2011-12 to around 16-17% in the last 2quarters. A lower deposit growth, notwithstandingthe moderation in credit growth has given rise to anasset-liability gap, which is also indicated by theincrease in the credit-deposit ratio (Table 4.14)Moderating growth and deceleration in capital
Table 4.14 : Movement of Key Monetary Aggregates (y-o-y growth rates in per cent)
2010- 2011- 2011-12 2012-13 11 12 Q1 Q2 Q3 Q4 Q1 Q2 Q3
GDP (at current market prices) 18.8 15.4 18.9 16.6 14.8 12.2 12.2 11.3 -
Reserve Money (Mo) 21.5 14.1 17.6 15.9 14.7 8.7 7.3 6.5 4.3
Broad Money (M3) 16.2 15.8 17.3 16.8 15.4 13.8 14.2 13.6 12.6
Aggregate Deposits 15.7 16.2 17.4 17.2 16.0 14.3 14.7 14.0 12.9
Bank Credit 21.3 18.7 21.7 19.6 17.6 16.4 18.1 16.8 16.5
Investments 9.4 14.3 10.3 15.5 15.5 15.7 16.1 14.4 15.2
Velocity of Money (M3/GDP) 1.28 1.27 1.22 1.20 1.31 1.35 1.20 1.17 -
Money Multiplier (M3/M0) 5.0 5.0 4.92 5.03 5.07 5.12 5.24 5.37 5.44
CD Ratio (per cent) 73.3 74.7 74.3 73.5 74.3 76.4 76.5 75.4 76.7
Source : RBI
http://indiabudget.nic.in

100 Economic Survey 2012-13
formation, however, increased the flow of bankingsector funds to investment in government and othersecurities.
Reserve Money (M0)4.44 The rate of growth of reserve moneycomprising currency in circulation and deposits withRBI (bankers and others) decelerated from anaverage of 17.6% in Q1 of 2011-12 to 4.3% in Q3 of2012-13. Almost the entire increase in the reservemoney of ̀ 2381 billion between Q3 of 2011-12 andQ3 of 2012-13 consisted of increase in currency incirculation. As sources of reserve money, net RBIcredit to Government and increase in net financialassets of RBI contributed to the growth of basemoney. The rate of growth of base money was mutedlargely because of an increase in non-monetaryliabilities of RBI which increased from ̀ 1572 billionin 2011-12 to ̀ 3596 billion between Q3 of the currentyear to Q3 of 2011-12. Though net foreign exchange
assets constituted more than 100% of the basemoney, rate of growth of acquisition of NFA hasmoderated considerably, and was 1.6% in Q3 of2012-13. Increase in net monetary liabilities of RBIwas particularly sharp in 2011-12 and first 2 quartersof the current year. Currency constituted nearly 3/4th of the base money.
Broad money (M3)4.45 The rate of growth of broad money (M3) wasnot only lower than the indicative growth set by theReserve Bank of India but also it witnessedcontinuous and sequential deceleration in the last7 quarters. Overall M3 growth moderated to 11.2%in December, 2012. Aggregate deposits with thebanks were the major component of broad moneycounting for over 85% of total M3 and this sharehas almost remained stable. The sources of broadmoney are net bank credit to the Government andto the commercial sector. These two together
Table 4.15 : Component and Sources of Reserve Money (y-o-y growth rates in per cent) 2011-12 2012-13
2010-11 2010-12 Q1 Q2 Q3 Q4 Q1 Q2 Q3
Reserve Money 21.5 14.1 17.6 15.9 14.7 8.7 7.3 6.5 4.3Components of Reserve MoneyCurrency in circulation 19.2 14.1 17.1 14.6 12.8 12.3 12.3 13.3 11.7Bankers’ Deposits with RBI 29.1 14.8 19.5 20.0 20.9 0.9 -6.4 -11.0 -15.5Currency as % of Mo 73.1 73.2 73.4 72.1 72.6 74.5 76.9 76.7 77.8Sources of Reserve MoneyNet foreign exchange assets of RBI 0.9 11.9 9.1 11.1 19.1 8.2 14.4 9.0 1.6Currency Liabilities to the Public 13.0 6.4 10.2 4.7 5.3 5.5 8.3 14.3 13.6Net Non-Monetary liabilities of RBI -8.7 45.7 25.0 32.2 71.4 51.8 74.1 49.9 19.0FE assets as % to Mo 107 105 100 106 111 102 106 108 108Source : RBI
http://indiabudget.nic.in

101Prices and Monetary Management
Table 4.16 : Components and Sources of Broad Money
2010- 2011- 2011-12 2012-13 Rs Billion 11 12 Q1 Q2 Q3 Q4 Q1 Q2 Q3
Broad Money 16.2 15.8 17.3 16.8 15.5 14.0 14.3 13.9 12.7Components of Money StockCurrency with the public 19.2 14.0 16.9 14.4 12.6 12.2 12.1 13.1 11.7Aggregate deposits with banks 15.7 16.2 17.4 17.2 16.0 14.3 14.7 14.0 12.9Aggregate deposits with banksas % to M3 85.8 86.1 85.6 86.3 86.3 86.0 85.9 86.4 86.4Sources of M3Bank Credit to Government 21.5 21.8 18.9 22.1 23.1 23.1 22.1 20.2 17.7Bank credit to Commercial Sector 20.6 18.7 21.6 19.6 17.7 16.6 18.2 17.0 16.4Net FEA of the banking sector 0.9 11.4 9.6 10.2 17.5 8.3 14.4 9.1 1.4Net Currency Liability to the public 13.0 6.4 10.2 4.7 5.3 5.5 8.3 14.3 13.6FE Assets as % to M3 22.3 21.5 21.1 21.6 22.5 20.6 21.1 20.7 20.3Credit to Commercial Sectoras % to M3 63.0 64.6 63.9 63.8 64.5 66.1 66.1 65.5 66.6
Source : RBI
accounted for nearly 100% of the broad money in2012-13 compared to 89% in 2009-10. The rate ofgrowth of the bank credit to the commercial sector,however, declined from an average of 21.6% in Q1of 2011-12 to 16.4% in Q3 of 2012-13. The rate ofgrowth of bank credit to Government continued tobe sticky at over 20% until Q2 of 2012-13 beforemoderating to 17.7% in Q3. Though the rate ofgrowth of foreign exchange assets of the bankingsector witnessed a decelerating trend, their sharein overall broad money continued to remain ataround 20%.
4.46 At end March 2012, the money multiplier(ratio of M3 to M0) was 5.2, higher than end-March
2011, aided by the cumulative 125 basis pointreduction in CRR cut effected in Q4 of 2011-12.During the current financial year 2012-13, the moneymultiplier has generally stayed high reflecting theCRR cuts. As on December 28, 2012, the moneymultiplier was 5.5 compared with 5.2 on thecorresponding date of the previous year.
LIQUIDITY MANAGEMENT
4.47 One of the objectives of the monetary policyis to provide adequate liquidity to the economy. Aliquidity deficit, however, is considered necessaryfor quicker and correct signaling of the monetary
http://indiabudget.nic.in

102 Economic Survey 2012-13
policy stance. The medium term trend indicates awidening liquidity deficit, requiring liquidity injectionoften exceeding the 1 per cent level of net demandand time liabilities considered comfortable by RBI(Figure 4.15). During 2011-12, liquidity conditionshad remained benign until mid-November, butpressures intensified in the subsequent part of theyear, with average net borrowing under the liquidityadjustment facility (LAF) reaching as high as ̀ 1,570billion in March 2012, with an all-time high of ̀ 2,028billion on March 30, 2012. Both structural andfrictional factors – such as foreign exchange marketinterventions by the RBI, divergence between creditand deposit growth and build-up of government cashbalances with RBI– contributed to the liquiditypressures. Responding to the tight liquidityconditions, the RBI had conducted open marketoperations (OMOs) aggregating ̀ 1.3 trillion betweenNovember 2011 and March 2012, besidessequentially reducing CRR, injecting thereby primaryliquidity of around ` 0.8 trillion into the bankingsystem.
4.48 Liquidity conditions eased gradually duringthe first half of 2012-13. The turnaround in liquidityconditions was due to a decline in government’scash balances, injection of liquidity of about ` 860billion by way of OMOs purchases of securities andincreased use of the export credit refinance facilityby banks. Reduction in SLR by one percentage pointalso improved the access of banks to potentialliquidity. In September and October 2012 liquidityconditions, however, tightened taking the averagenet LAF borrowing to ` 904 billion since October15, 2012, which was well above the (+/-) one percent of net demand and time liabilities (NDTL)
comfort level for liquidity. On the basis of prevailingmacroeconomic situation, the Reserve Bank (in theSecond Quarter Review of Monetary Policy 2012-13, announced on October 30, 2012) reduced thecash reserve ratio (CRR) of scheduled banks by 25basis points from 4.50 per cent to 4.25 per cent oftheir net demand and time liabilities (NDTL) effectivefrom the fortnight beginning November 3, 2012.Consequently, an estimated amount of aroundRs.175 billion of primary liquidity was injected intothe banking system. The average daily net liquidityinjection under the LAF increased to around Rs.670billion in October 2012 from around Rs.520 billion inSeptember 2012. The liquidity stress continued inNovember 2012 with average daily net liquidityinjection under the LAF increasing to Rs.940 billion.The liquidity conditions tightened further in thesecond-half of December 2012 on account ofquarterly advance tax outflows, and the average dailynet liquidity injection under the LAF increasedsignificantly to around Rs.1230 billion during themonth.
4.49 The liquidity conditions remained above theReserve Bank’s comfort zone during most of thethird quarter of 2012-13. Consistent with the stanceof monetary policy and based on the currentassessment of prevailing and evolving liquidityconditions, the Reserve Bank resumed Open MarketOperations (purchase of government securities) onDecember 4, 2012 after a gap of nearly five months.Total purchase under OMO auctions stood at aroundRs.1060 billion during 2012-13 so far (till January 7,2013), while total purchases through the anonymoustrading platform (NDS-OM) stood at around Rs.228.7billion during this period. Although the Reserve Bank
http://indiabudget.nic.in

103Prices and Monetary Management
lowered the cash reserve ratio, CRR, successivelyin September and October 2012, and carried outopen market operations (OMO) injecting systemicliquidity of ‘470 billion during December and Januaryto augment liquidity, the average net LAF borrowingsat ‘929 billion in January were above the ReserveBank’s comfort level. This tightness could potentiallyhurt credit flow to productive sectors of the economy.The structural deficit in the system provided a strongcase for injecting permanent primary liquidity intothe system. Accordingly, the RBI lowered the CRRfrom 4.25 per cent to 4.0 per cent in its third quarterreview of Monetary Policy, effective from February9, 2013. By the end of first week of February, LAFborrowings had declined to the RBI’s comfort level.
MONEY MARKET
4.50 Money markets have remained orderly during2012-13 so far. As a result of the reduction in thepolicy (repo) rate in the Annual monetary policystatement 2012-13 (released on April 17, 2012) andimprovement in liquidity conditions, the average dailycall money rate declined to 7.92 per cent inSeptember 2012 from 8.14 per cent in June 2012(9.17 per cent in March 2012). Call money rates inlatter months have moved in a narrow range (Fig 4.16). Interest rates on commercial paper andcertificate of deposits also peaked in March 2012and decelerated thereafter in line with the moderationin interest rates for other instruments.
4.51 Banks and primary dealers remained themajor groups of borrowers in the collateralized
segments, while mutual funds (MFs) remained themajor group of lenders in the collateralized borrowingand lending obligation (CBLO) segment. But,recently, the share of MFs in total lending hasdeclined in the market repo segment, andnationalized banks have emerged as the major groupof lenders in this segment. The collateralizedsegment continued to remain the predominantsegment of the overnight money market; its sharewas around 78 per cent during the financial year (tillDecember 2012).
4.52 Certificates of Deposit (CD) - The amount ofoutstanding CD declined from around Rs.4195 billionat end-March 2012 to around Rs.3030 billion at mid-December 2012, which indicates decline in netissuances. The weighted average effective interestrate (WAEIR) of CDs declined to 8.6 per cent atmid-December 2012 from 11.1 per cent at end-March 2012.
4.53 Commercial paper (CP)- During 2012-13 sofar, the commercial paper (CP) market also pickedup and the average size of fortnightly issuanceincreased significantly to ` 317 billion (till endDecember 2012). The weighted average discountrate decreased to 9.04 per cent in December 2012from 12.2 per cent in March 2012.
CHALLENGES AND OUTLOOK
4.54 The headline WPI inflation has remainedmuted in the current financial year and declined toa three year low of 6.62 per cent in January 2013
http://indiabudget.nic.in

104 Economic Survey 2012-13
backed by moderation in the non food manufacturingsector. However, CPI inflation has shown a risingtrend in the past couple of months mainly onaccount of higher food inflation leading to a highergap between WPI and CPI. Unlike last year whenthe food price inflation was mainly driven by higherprotein food items, this year the pressure has beenmounting in cereals. On the other hand milk andother protein items have shown a welcome decline.The recent increase in onion prices in January 2012and revision in diesel prices may put some pressureon headline inflation. However, with moderation innon food manufacturing sector and global commodityprices, the headline WPI inflation may decline to6.2 to 6.6 per cent in March 2013.
4.55 Inflation has eased in almost all majoradvanced and emerging market economies in thecurrent year. The positive effect of continuous policyeasing by the major advanced and developingcountries could pose a higher risk to inflationexpectations and may be considered as an upsiderisk to inflation forecast. However, in the short run,given weak growth sentiments, the impact of policyeasing may not lead to a surge in inflation andinflation expectations may remain anchored aroundcurrent target inflation rates.
4.56 As per the World Bank’s global economicprospects, January 2013, except for metals, mostglobal commodity prices are expected to declinefurther in 2013 and 2014. The impact of benigninflationary expectations internationally will have amoderating impact on domestic prices. Given thatIndia faces a number of constraints on the supplyside, in the short run, curbing demand moderatelyto catch up with supply may be an effective tool.However, in the long run, measures to improve supplyare the only way to have non-inflationary growth.
4.57 The RBI’s monetary policy stance hascontinued to focus on the twin objectives ofcontaining inflation and facilitating growth. Increasingrisks to growth from external as well as domesticsources and tight monetary policy in face ofpersistent inflationary pressures have contributedto a sharper slowdown of the economy thananticipated. There has been some moderation ininflation in Q3 of 2012-13 and with the expectedfiscal consolidation the current macroeconomicsituation creates room for a more accommodativemonetary policy. Further, with a significant part ofinflation getting generated because of poor supplyresponses, a further shift in the policy stance ofRBI, coupled with improving access to credit withmoderation in its cost, would be desirable.
Table 4.17 : Volume in Money market
(in `̀̀̀̀ billion)
Month LAF Average CP Out- CP Out-of the month standing standing
(as on last (as on lastday of the reporting
Call money Market Repo CBLO month) friday)2011 2012 2011 2012 2011 2012 2011 2012 2011 2012 2011 2012
January -929 -1292 78 173 115 89 448 280 1018 1499 3776 3909February -786 -1405 104 142 132 122 423 331 1013 1618 4185 4029March -810 -1574 113 175 151 112 432 380 803 912 4247 4195April -188 -1029 134 250 144 143 562 377 1250 1310 4474 4448May -546 -986 110 185 159 151 409 339 1212 1498 4333 4394June -741 -913 116 152 167 180 413 376 1047 1258 4238 4252July -438 -481 115 146 117 173 410 382 1337 1732 4122 4155August -407 -462 113 129 148 183 391 459 1488 1879 4057 4030September -559 -517 138 143 139 185 451 502 1446 1706 3835 3572October -541 -671 129 150 132 218 416 436 1688 1941 3859 3531November -916 -941 110 141 133 207 329 368 1735 1994 3784 3066December -1167 -1231 149 142 99 147 265 398 1341 1818 4030 3031
Source : RBI
http://indiabudget.nic.in

Financial IntermediationCHAPTER
5
BANK CREDIT
5.2 Banks as financial intermediaries collectdeposits from savers and on-lend these to investorsand others. The deposits of banks form the basis oftheir lending operations. Aggregate deposits of thebanking sector increased from an average of` 48,019.8 billion in 2010-11 to ` 64,362.3 billionduring Q3 of 2012-13. Year-on-year growth ofaggregate deposits, however, moderated from anaverage of 17.9 per cent in Q1 of 2011-12 to 12.87in Q3 of 2012-13. This decline in the rate of growthof aggregate deposits also moderated the rate ofgrowth of credit, from an average of 21.73 per centin Q1 of 2011-12 to 16.49 per cent in Q3 of 2012-13.While the growth of food credit which is primarily
Efficient intermediation by financial markets leads to higher economic growth by
increasing savings and their optimal allocation for productive uses. A shift of our
growth trajectory to the pre-crisis level of over 8 per cent and above critically dependson efficient financial intermediation between savers and borrowers. Historically,
banks have played this role. However, with the start of the reform process beginning
1990s, the importance and nature of financial intermediation has undergone atransformation with other intermediaries including non-banking financial companies
(NBFCs), insurance and pension funds, and mutual funds(MF) emerging as the new
mechanisms for channelling savings to investments. These developments have alsobeen accompanied by the emergence of equity and debt markets, financial products
like forwards, futures and other derivatives instruments which have the capacity of
reallocating risks and putting capital to more efficient use. However, keeping inview India's growing integration with global financial markets, external-sector
vulnerabilities have an increasingly large impact on India through the trade and
capital account channels. It is therefore important that the development of an efficientand healthy financial market should also be accompanied by an effective regulatory
mechanism that keeps track of external vulnerabilities. This chapter summarises the
recent developments in the financial sector in India and the challenges andopportunities it faces in the context of developments in the global financial market.
advanced for food procurement, and constitutesaround 2 per cent of total credit, fluctuated, growthin non-food credit had a near secular decline(Table 5.1).
5.3 Banks use their deposits for advancing creditor for making investment in government and othersecurities. The ratio of their investment in approvedsecurities to aggregate deposits has remained rangebound at around 30 per cent, significantly higherthan the minimum required under the statutoryliquidity ratio (SLR). The higher allocation togovernment securities may be either because of ahigher risk perception or non-availability of qualitylending opportunities to the private sector or both.The ratio of credit to deposits, however, increased
http://indiabudget.nic.in

106 Economic Survey 2012-13
from 74.3 per cent in Q1 of 2011-12 to 76.7 per centin Q3 of 2012-13, allowing the banks to maintain ahigher credit growth than would otherwise have beenfeasible given the growth in deposits (Figure 5.1).
Interest Rates5.4 Monetary policy started becoming a little moreaccommodative in 2012-13. A moderation in inflationcreated space for the Reserve Bank of India (RBI) toreduce policy rates and take other measures forimproving liquidity in the system. The policy rateswere cut during 2012-13, including a reduction of 75basis points (bps) in the repo rate in two steps (50bps in April 2012 and 25 bps in January 2013), areduction of 100 bps in the SLR in August 2012, anda 75 bps cut in the cash reserve ratio (CRR) in threesteps (25 bps effective 22 September 2012, 25 bpseffective 3 November 2012 and 25 bps effective 9February 2013). Taking a cue from these cuts, severalbanks reduced their deposit and lending rates duringthe year. Though the impact of these policy measuresis still unfolding, the transmission of the policy rate
to deposit and lending rates of banks is relativelyless pronounced compared to money market rates,reflecting the presence of structural rigidities in thecredit market.
Domestic Deposit Rates
5.5 The modal term deposit rates for banks acrossall maturities declined by 15 bps to 7.27 per centduring 2012-13 (as on 15 December 2012). Thedecline was noted across all bank groups and mostlyfor maturities up to one year (Table 5.2).The rates ofinterest on savings deposits, which were deregulatedby the RBI effective October 2011, however weregenerally stable. Eighteen scheduled commercialbanks (SCBs) with a market share of 5.5 per cent inaggregate deposits, increased their savings depositrates in the range of 100-300 bps for savings depositbalances up to ̀ 1 lakh and 100-680 bps for balancesabove ` 1 lakh. So far, none of the public-sectorbanks has increased its savings deposit rates, sincethe deregulation of these rates by the RBI.
Table 5.1 : Growth Rate of Deposits, Credit, and Investments (y-o-y per cent)
2010-11 2011-12 2011-12 2012-13
Q1 Q2 Q3 Q4 Q1 Q2 Q3
Aggregate deposits 15.69 16.51 17.92 17.59 16.25 14.51 14.62 13.91 12.87
Bank credit 21.27 18.71 21.73 19.63 17.61 16.37 18.07 16.79 16.49
Food credit 15.85 33.02 24.72 42.52 35.64 29.80 56.99 35.28 33.76
Non-food credit 21.36 18.48 21.69 19.29 17.32 16.14 17.45 16.46 16.17
Investments in approvedsecurities 9.42 14.26 10.26 15.45 15.46 15.74 16.09 14.45 15.18
http://indiabudget.nic.in

107Financial Intermediation
Table 5.2 : Deposit and Lending Rates of SCBs(per cent)
Item Dec.- 11 Mar.- 12 Jun. -12 Sept.-12 Dec.-12#(A) Domestic deposit rates
(i) Public-sector banksUp to 1 year 1.00-9.55 1.00-9.75 4.00-9.25 4.00-9.25 4.00-9.001 - 3 years 8.55-9.75 9.00-9.75 8.75-9.50 8.50-9.30 8.50-9.25Above 3 years 8.00-9.50 8.50-9.50 8.00-9.50 8.50-9.30 8.50-9.10
(ii) Private-sector banksUp to 1 year 3.00-9.25 3.00-9.50 3.00-9.25 3.00-9.25 3.00-9.001 - 3 years 8.00-10.50 8.00-10.50 8.00-10.00 8.00-9.75 8.00-9.75Above 3 years 8.00-10.10 8.00-10.10 8.00-10.00 8.00-9.50 8.00-9.50
(iii) Foreign banksUp to 1 year 3.50-10.00 3.50-11.80 3.50-9.25 2.43-9.25 2.21-9.001 - 3 years 3.50-9.75 3.50-9.75 3.50-9.75 3.50-9.75 3.50-9.75Above 3 years 4.25-9.50 4.25-9.50 3.75-9.50 3.75-9.50 4.35-9.50
SCBsModal deposit rate (all tenors) 7.46 7.42 7.40 7.29 7.27(B) Base Rate
Public-sector banks 10.00-10.75 10.00-10.75 10.00-10.50 9.75-10.50 9.75-10.50Private-sector banks 10.00-11.25 10.00-11.25 9.75-11.25 9.75-11.25 9.75-11.25Foreign banks 6.25-10.75 7.38-11.85 7.38-11.85 7.25-11.75 7.20-11.75SCBs
Modal base rate 10.75 10.75 10.50 10.50 10.50(C) Median lending rate*
Public-sector banks 10.25-15.25 10.60-15.35 10.50-15.50 10.50-15.38 -Private-sector banks 10.00-15.50 10.50-15.50 10.63-15.38 10.20-15.63 -Foreign banks 9.50-14.38 10.00-14.50 10.00-14.50 9.95-14.50 -
Source : RBI.*: Median range of interest rate on advances at which at least 60 per cent business has been contracted.Notes: #: As on 15 December 2012.
Interest Rates on NRI Deposits
5.6 The modal interest rate on non-resident(external) rupee (NRE) deposits of banks declinedby 37 bps during 2012-13 (up to December 15) to8.71 per cent, reflecting subdued demand for exportcredit in the economy. Interest rates on foreigncurrency non-resident (bank) account (FCNR [B])deposits continue to be regulated by the RBI. Witha view to augmenting foreign currency inflows intothe economy, effective 5 May, 2012 the interest rateceiling on FCNR (B) deposits was raised to LIBOR/Swap rates plus 200 bps for 1-3 year maturity andLIBOR/Swap rates plus 300 bps for 3-5 year. Theinterest rate ceiling on overseas line of credit arrangedby banks for exporters has also remained regulatedby the RBI. At present, the prescribed ceiling in thisregard is at six-month LIBOR/EURO LIBOR/
EURIBOR plus 250 bps, subject to review as andwhen warranted.
Lending Rates
5.7 Following the reduction in the repo rate in April2012 and the calibrated liquidity easing measuresannounced by the RBI during 2012-13, the modalbase rate of banks declined by 25 bps to 10.50 percent during the current fiscal (Table 5.2). The medianlending rates on bank advances (at which 60 percent or more business was contracted), other thanexport credit, ranged between 9.50 and 15.75 percent in November 2012, showing a moderation of25-50 bps compared to the rates which prevailed inMarch 2012. The median lending rates on pre-shipment rupee export credit up to 180 days rangedbetween10.55-13.00 per cent in November 2012compared to 10.75-12.88 per cent in March 2012.
http://indiabudget.nic.in

108 Economic Survey 2012-13
Table 5.3 : Sectoral Deployment of Credit
2010-11 2011-12 2011-12 2012-13
Q1 Q2 Q3 Q4 Q1 Q2 Q3
Credit disbursed (`̀̀̀̀ billion)Total credit 33359 39506 37525 38299 39957 42244 44190 44610 46386Food credit 546 726 625 678 769 832 949 950 1018Agriculture & allied activities 4159 4561 4524 4388 4459 4874 5217 5266 5479Industry 14461 17656 16541 17121 17964 18999 19772 19890 20752Services 7859 9298 8903 8943 9395 9950 10405 10383 10617Personal loans 6333 7255 6932 7129 7369 7588 7847 8121 8520Shares of the broad sectors in credit disbursed (per cent)Food credit 1.64 1.84 1.66 1.77 1.93 1.97 2.15 2.13 2.20Agriculture & allied activities 12.47 11.55 12.06 11.46 11.16 11.54 11.81 11.80 11.81Industry 43.35 44.69 44.08 44.70 44.96 44.98 44.74 44.59 44.74Services 23.56 23.53 23.73 23.35 23.51 23.55 23.55 23.28 22.89Personal loans 18.99 18.36 18.47 18.61 18.44 17.96 17.76 18.20 18.37 Average annual rate of growth (per cent) Total credit 20.84 18.43 21.19 19.43 17.15 16.38 17.76 16.48 16.09Food credit 16.03 32.91 19.63 39.00 39.48 33.46 51.95 40.01 32.38Agriculture & allied activities 19.82 9.67 12.54 10.27 6.63 9.39 15.32 20.02 22.86Industry 26.48 22.10 24.82 22.57 21.21 20.24 19.54 16.17 15.52Services 19.55 18.30 22.23 19.93 16.76 15.02 16.87 16.10 13.01Personal loans 11.96 14.54 17.78 15.45 13.27 12.13 13.19 13.92 15.61Source : RBI.
Table 5.4 : Particulars of Priority Sector Advances
(` crore)
Public Sector Banks Private Sector Banks Foreign Banks
Mar-10 Mar-11 Mar-12 Mar-10 Mar-11 Mar-12 Mar-10 Mar-11 Mar-12
Total Priority sector Advances 863777 1021496 1129993 214669 249099 286420 59959 66737 80559
Advances to Agriculture# 372463 414973 475148 90737 92146 100900 121 56 111
Advances to Micro andSmall enterprises 276318 369930 396343 64824 88115 110513 21147 20981 21760
Advances to weaker sections 211376 240321 293960 25532 28575 38929 0 .00 0.00 0.00
Advances to Exports NA NA NA NA NA NA 35167 43322 51742
Priority Sector Advances as percentage of total advances
Total Priority sector Advances 41.50 40.90 37.40 45.80 46.60 39.40 36.00 39.70 40.90
Advances to Agriculture# 17.90 16.60 15.70 19.30 17.20 13.80 0.00 0.00 0.00
Advances to Micro andSmall enterprises 13.20 14.80 13.10 13.80 16.50 15.20 12.70 12.40 11.00
Advances to weaker sections 10.10 9.60 9.70 5.40 5.30 5.30 0.00 0.00 0.00
Advances to Exports 21.10 25.70 26.20
Source: RBI.Note: # Indirect agriculture is reckoned only up to 4.5 per cent of the ANBC or credit equivalent of off-balancesheet exposures, whichever is higher; NA-Not Applicable
http://indiabudget.nic.in

109Financial Intermediation
Foreign Currency Export Credit
5.8 The interest rate on export credit in foreigncurrency was deregulated effective 5 May 2012 toincrease foreign currency loans to exporters. Themodal lending rate (at which 60 per cent or morebusiness was contracted) for the reporting banks onpre-shipment credit in foreign currency declined by20 bps to 4.03 per cent between November 2012and June 2012 in line with decline in LIBOR rateduring the period. On the assets side, trade creditfor importers has also remained regulated and atpresent, all-in-cost ceilings on trade credit for importsfor maturity period up to five years is at six-monthsLIBOR (for the respective currency of credit) plus350 bps effective 11 September, 2012.
Sectoral Deployment of Credit
5.9 Details of sectoral deployment of credit aremaintained by the RBI on a regular basis for 47scheduled banks accounting for nearly 95 per centof total credit flow. Industry has remained thedominant sector accounting for around 45 per centof total credit disbursed by the banks. While foodcredit, primarily advanced for food procurement, hasfluctuated, credit to the agriculture and allied sectorhas grown after Q3 of 2011-12. While the growth ofcredit for the industry and services sectors hasdeclined, growth in personal loans appears to havebottomed out and some recovery is visible in Q3 of2012-13 (Table 5.3). Inflation affected theconsumption of non-food items. Sectoral shares inthe credit flow have generally remained stable.
Priority-sector Lending
5.10 In view of the need to ensure adequateinstitutional credit flow to the vulnerable sectors, theRBI has mandated that banks should lend aminimum of 40 per cent of their advances to thepriority sectors. Priority sector broadly includesadvances to agriculture, small scale industries,weaker section, exports, education, SHGs, etc.Details of priority sector are provided in Appendix4.6 . Revised guidelines issued by the RBI on prioritysector lending (PSL) on 20 July 2012, mandatescommercial banks and foreign banks with 20 or morebranches to allocate 40 per cent of their adjustednet bank credit (ANBC) or credit equivalent amountof off-balance sheet exposures (OBE), whichever ishigher, to the priority sector. Within this, sub-targetsof 18 per cent and 10 per cent of ANBC or creditequivalent amount of OBE have been mandated for
lending to agriculture and the weaker sectionsrespectively. For foreign banks with less than 20branches, the target PSL is 32 per cent of ANBC orcredit equivalent amount of OBE, whichever is higher.Foreign banks have been given a period of 5 yearsbeginning April 2013 to achieve their PSL target. Theiraction plan, however, is required to be approved bythe RBI.5.11 The total outstanding priority-sector advancesof public-sector banks (PSB) increased from` 10,21,496 crore as on the last reporting Friday ofMarch 2011 to ` 11,29,993 crore as on the lastreporting Friday of March 2012, showing a growth of10.6 per cent. The achievement of PSBs as a groupwas 37.4 per cent as on the last reporting Friday ofMarch 2012. The outstanding priority-sectoradvances of private-sector banks grew by 14.9 percent in 2011-12 and these were 39.4 per cent oftheir total advances as on the last reporting Fridayof March 2012.The outstanding priority-sectoradvances of foreign banks had reached the targetedlevel of 40 per cent as on March 2012, though theseadvances have largely been in export sector(Table 5.4).
RURAL INFRASTRUCTUREDEVELOPMENT FUND5.12 The Rural Infrastructure Development Fund(RIDF) was instituted in the National Bank forAgriculture and Rural Development (NABARD)through an announcement in Union Budget 1995-6with the objective of giving low cost fund support tostates and state-owned corporations for quickcompletion of ongoing projects relating to mediumand minor irrigation, soil conservation, watershedmanagement, and other forms of rural infrastructure.Allocation to the RIDF is made from the shortfall inmeeting PSL targets by the banks. From theinception of the RIDF in 1995-6 to March 2012,462,229 projects have been sanctioned with asanctioned amount of ` 143,230 crore. Of thecumulative RIDF loans sanctioned to stategovernments, 42 per cent have gone to theagriculture and allied sector, including irrigation andpower; 15 per cent to health, education, and ruraldrinking water supply; while the share of rural roadsand bridges has been 31 per cent and 12 per cent,respectively. The annual allocation of funds underthe RIDF has gradually increased from ̀ 2,000 crorein 1995-6 (RIDF I) to ` 20,000 crore in 2012-13(RIDF XVIII).
http://indiabudget.nic.in

110 Economic Survey 2012-13
5.13 As against the total allocation of ` 1,72,500crore, encompassing RIDF I to XVIII, sanctionsaggregating ̀ 1,51,154 crore have been accorded tovarious state governments and an amount of` 1,00,051 crore disbursed up to the end of November2012. Nearly 55 per cent of allocation has been madeto southern and northern regions. The National RuralRoads Development Agency (NRRDA) has disbursedthe entire amount of ̀ 18,500 crore sanctioned for it(under RIDF XII-XV) by March 2010. During 2012-13(up to end November 2012), ` 5,829 crore wasdisbursed to the states under the RIDF (Table 5.5).
FINANCIAL INCLUSION
Micro-Finance: Self Help Group-BankLinkage Programme
5.14 Though there are different models for pursuingmicro-finance, the Self-Help Group (SHG)-BankLinkage Programme has emerged as the majormicro-finance programme in the country. It is beingimplemented by commercial banks, regional ruralbanks (RRBs), and cooperative banks. Under theSHG-Bank Linkage Programme, as on 31 March2012, 79.60 lakh SHG-held savings bank accountswith total savings of ̀ 6,551 crore were in operation.By November 2012 another 2.14 lakh SHGs hadcome under the ambit of the programme, taking thecumulative number of savings-linked groups to 81.74.As on 31 March 2012, 43.54 lakh SHGs had
outstanding bank loans of ̀ 36,340 crore (Table 5.6).During 2012-13 (up to November 2012), 3.67 lakhSHGs were financed with an amount ̀ 6,664.15 crore.
Extension of Swabhimaan scheme
5.15 Under the Swabhimaan financial inclusioncampaign, over 74,000 habitations with populationin excess of 2,000 had been provided bankingfacilities by March 2012, using various models andtechnologies including branchless banking throughbusiness correspondents (BCs). The FinanceMinister in his Budget Speech of 2012-13 hadannounced that Swabhimaan would be extended tohabitations with population more than 1,000 in thenorth-eastern and hilly states and population morethan 1,600 in the plains areas as per Census 2001.Accordingly, about 45,000 such habitations had beenidentified for coverage under the extendedSwabhimaan campaign. As per the progress receivedthrough the convenors of State Level Bankers'Committee (SLBC), out of the identified habitations,10,450 have been provided banking facilities by endof December, 2012. This will extend the reach ofbanks to all habitations above a threshold population.
Setting up of Ultra Small Branches
5.16 Considering the need for close supervision andmentoring of the business correspondent agents(BCAs) by the respective banks and in order to ensurethat a range of banking services are available to theresidents of such villages, ultra small branches
Table 5.5 : Sanctions and Disbursements under the RIDF and Bharat Nirman (Rural RoadsComponents)
(` crore) 2012-13 (up to November 2012) Cumulative up to November 2012
Region Target Achievement Achievement Sanction Disbursement* Disbursement(%) as % of
sanction
South 3775 1420 37.6 37899 26529 70.0West 2170 1134 52.3 22149 15693 70.9North 4850 1810 37.3 44668 30092 67.4Central 1480 356 24.1 13080 8078 61.8East 3800 863 22.7 26600 15625 58.7NER & Sikkim 725 145 20.0 6758 4034 59.7Sub total 16800 5728 34.1 151154 100051 66.2Warehousing - 101 - 2512 1208 48.1Bharat Nirman - - - 18500 18500 100.0Grand total 16800 5829 34.7 172166 119759 70.0
Source : NABARD.Note: NER is north-eastern region.
http://indiabudget.nic.in

111Financial Intermediation
Table 5.6 : Progress of Micro-finance ProgrammeYear SHGs Financed by Banks Bank Loan Outstanding
during the year*No. (lakh) Amount Growth (%) No. (lakh) Amount Growth (%)
(` ` ` ` ` crore) (` ` ` ` ` crore)
2007-08 12.28 8849.26 - 36.26 16999.90 -2008-09 16.09 12256.51 38.50 42.24 22679.85 33.41
2009-10 15.87 14453.30 17.90 48.52 28038.28 23.62
2010-11 11.96 14547.73 0.65 47.87 31221.17 11.35
2011-12 11.48 16534.77 13.66 43.54 36340.00 16.40
Source: NABARD.Note: *Includes new as well as repeat loans to SHGs.
(USBs) are being set up in all villages covered throughBCAs under financial inclusion. These USBs willcomprise a small area of 100-200 sq. feet where theofficer designated by the bank will be available witha laptop on pre-determined days. While cash serviceswill be offered by the BCAs, the bank officer will offerother services, undertake field verification, and followup banking transactions. The periodicity and durationof visits can be progressively enhanced dependingupon business potential in the area. A total of over40,000 USBs have so far been set up in the country.
Roll out of Direct Benefit Transfer
5.17 The Government of India has decided tointroduce a Direct Benefit Transfer (DBT) schemewith effect from 1 January 2013. To begin with,benefits under 26 schemes will directly be transferredinto the bank accounts of beneficiaries in 43 identified
districts across respective states and union territories(UT). Banks will ensure that all beneficiaries in thesedistricts have a bank account. All PSBs and RRBshave made provision so that the the data collectedby the Departments/Ministries/Implementing agencyconcerned can be used for seeding the bank accountdetails in the core banking system (CBS) of bankswith Aadhaar. All PSBs have also joined the AadhaarPayment Bridge of the National Payment Corporationof India for smooth transfer of benefits.
Agricultural Credit
5.18 As against the target of ` 4, 75,000 crorefixed for 2011-12, ̀ 5, 11,029.09 crore was disbursedto the agricultural sector, thereby exceeding thetarget by 8 per cent. While commercial banks andRRBs together extended credit to 99.65 lakh newfarmers during 2011-12, cooperative banks extended
Table 5.7 : Agency-wise Credit Disbursed to the Agriculture Sector between 2006-07 and2012-13
(` ` ` ` ` crore)
Sl No. Agency 2006-07 2007-08 2008-09 2009-10 2010-11 2011-12^ 2012-13 *
1 Cooperative banks $ 42480 48258 46192 63497 78121 87963 64664
Share (%) 18.52 18.95 15.30 16.51 16.68 17.21 26.99
2 RRBs 20435 25312 26765 35218 44293 54450 32127
Share (%) 8.91 9.94 8.87 9.16 9.46 10.65 13.41
3 Commercial banks 166485 181088 228951 285799 345877 368616 142838
Share (%) 72.57 71.11 75.83 74.33 73.86 72.13 59.61
Total (1+2+3) 229400 254658 301908 384514 468291 511029 239629
Source: Commercial Bank data – Indian Banks Association (IBA)/RBI, Cooperative Banks and RRBs data–NABARD.Notes: $ Including others, ^ Provisional, * Up to September 2012.
http://indiabudget.nic.in

112 Economic Survey 2012-13
credit to 21.52 lakh new farmers during the sameperiod, thus taking the total number of new farmersbrought under the banking system to 121.17 lakh.The total number of agricultural loan accountsfinanced as on March 2012 was 6.47 crore. Thecredit flow to agriculture during 2012-13 bycommercial banks, cooperative banks, and RRBstogether was ̀ 2,39,629 crore till September 2012,accounting for 42 per cent of the annual target of ̀5,75,000 crore set for 2012-13 (Table 5.7).
Kisan Credit Card Scheme
5.19 The Kisan Credit Card (KCC) has been animportant initiative for universal access of farmers
to institutional credit . The number of operative KCCsissued by cooperative banks and RRBs in thecountry as on 31 August 2012 was 406 lakh againstwhich the outstanding loan amount was` 1,12,333.90 crore. During 2012-13 (April 2012 toAugust 2012), 16 lakh (approximately) KCCs wereissued by cooperative banks and RRBs againstwhich the outstanding loan amount was ` 8,238crore. As reported by the RBI, Commercial banks,had issued a total of 547.49 lakh cards (cumulativesince inception) as on 31 March 2012, with asanctioned amount of ` 3,53,144.82 crore(Table 5.8).
Table 5.8 : Agency-wise KCCs Issued and Amount Sanctioned(As on 31 August 2012)
Agency Cards Issued (lakh) Amount Sanctioned (` ` ` ` ` crore)
2009-10 2010-11 2011-12 2012-13* 2009-10 2010-11 2011-12 2012-13**
Cooperative banks 17.43 28.12 29.59 9.75 7606 10719 10642 4111
RRBs 19.50 17.74 19.96 6.2 10132 11468 11516 4127
Commercial banks 53.13 55.83 68.03 NA 39940 50438 69518 NA
Total 90.06 101.69 117.58 15.95 57678 72625 91676 8238
Source: NABARD and RBI.Notes: NA-Not Available* Up to 31 August 2012** Amount outstanding against cards issued during the year 2012-13 up to 31 August 2012
Box 5.1 : Interest Subvention Scheme 2012-13The Interest Subvention Scheme 2012-13 for short-term crop loans up to ̀ 3 lakh is being made available during 2012-13 withthe following stipulations:
(i) Interest subvention of 2 per cent per annum to PSBs, cooperative banks, and RRBs on their own funds used for short-term crop loans up to ̀ 3,00,000 per farmer provided the lending institutions make available short-term credit at theground level at 7 per cent per annum. Interest subvention is calculated on the crop loan amount from the date of itsdisbursement/drawal up to the date of actual repayment, subject to a maximum period of one year.
(ii) An additional interest subvention of 3 per cent is available to the prompt-paying farmers from the date of disbursementof the crop loan up to the actual date of repayment or up to the due date fixed by bank for repayment of crop loan,whichever is earlier, subject to a maximum period of one year from the date of disbursement.
(iii) Further, in order to discourage distress sales, post-harvest benefit of interest subvention was made available in the year2011-12 to small and marginal farmers holding KCCs for a further period of up to six months on the same rates asavailable to crop loans against negotiable warehouse receipts for keeping their produce in warehouses. This has beencontinued in 2012-13 as well.
(iv) In order to provide relief to farmers, it was also decided that in cases where crop loans were restructured due to droughtduring 2012-13, the interest subvention of 2 per cent per annum which is already available for short-term crop loans toPSBs, RRBs, and rural cooperative credit institutions will continue to be available for the current financial year on thefull restructured loan amount. However, the restructured loans will attract normal rate of interest from the nextfinancial year onwards.
http://indiabudget.nic.in

113Financial Intermediation
Interest Subvention Scheme
5.20 The Interest Subvention Scheme is beingimplemented by the Government of India since 2006-7 to make short-term crop loans up to ̀ 3 lakh for aperiod of one year available to farmers at the interestrate of 7 per cent per annum. The Government ofIndia has since 2009-10 been providing additionalinterest subvention to farmers who repay their loansin time. The additional subvention which was 1percent in 2009-10 was gradually increased to 2 percent in 2010-11 and 3 per cent in 2011-12 and2012-13 (see Box 5.1).
FINANCIAL PERFORMANCE OF BANKS
5.21 Performance of Indian banks during the year2011-12 was conditioned to a large extent by fragilerecovery of the global financial markets as well as achallenging operational environment on the domesticfront, with persistent high inflation and muted growthperformance. In addition, stressed financialconditions of some State Electricity Boards andairline companies added to the deterioration in assetquality of banks. The consolidated balance sheet ofSCBs grew at a slower pace during 2011-12 ascompared to the previous year due to slower growthof credit as well as deposits. In addition, net profit ofbanks slowed down. Though Indian banks remainedwell-capitalized, concerns regarding growing non-performing assets (NPAs) persisted.
5.22 The operating performance of the SCBs asshown in Table 5.9 can be summed up as follows: PSBs had a dominant share and accounted for
72 per cent of the total income of the SCBs and72.8 per cent of aggregate assets.
In 2011-12, there was a sharp increase in theexpenditure on provisioning and contingencies;the rate of growth, however, varied across thebank categories. While contingency andprovisioning expenses recorded a growth of 16.1per cent for all commercial banks, the rate ofgrowth was 21.3 per cent for PSBs and only 3per cent for the new private-sector banks. Aspercentage of PSB assets, the provisioningexpenditure increased from 1.04 per cent in 2010-11 to 1.11 per cent in 2011-12.
PSBs were able to increase their interest spreadfrom 2.55 per cent in 2010-11 to 2.59 per cent in2011-12. The interest spread declined for oldprivate-sector banks and foreign banks. Anincrease in interest spread for all SCBs during
2011-12 with a relatively moderate growth incredit disbursement is significant.
Net profit as percentage of assets remainedsticky at 0.98 per cent in 2010-11 and 2011-12.However, in case of the PSBs, this declined from0.85 per cent in 2010-11 to 0.82 per cent in2011-12. Foreign banks and old and new private-sector banks, however, were able to increasethe ratio of net profit to assets.
Capital Adequacy Ratio5.23 Following the uncertainties prevailing in thedomestic market and relatively subdued performanceof the equity market during the first half of 2011-12,banks abstained from raising resources throughpublic issues during 2011-12. During 2011-12, banks'resource mobilization through private placementsalso slowed down as compared to the previous year.However, this reduction was seen in the case ofPSBs, while private-sector banks continued to raiseresources through private placements.
5.24 The capital to risk-weighted assets ratio(CRAR) remained well above the RBI's stipulated 9per cent for the system as a whole as well as for allbank groups during 2011-12, indicating that Indianbanks remained well-capitalized. Also, the CRAR atsystem level improved marginally compared to theprevious year. The CRAR (under Basel II) at system-wide level stood at 14.24 per cent as at end-March2012, as compared to 14.19 per cent as at end-March 2011.
5.25 As capital is a key measure of banks' capacityfor generating loan assets and is essential for balancesheet expansion, the Government of India hasregularly invested additional capital in the PSBs tosupport their growth and keep them financially soundso as to ensure that the growing credit needs of theeconomy are adequately met. A sum of ` 12,000crore was infused in seven PSBs during 2011-12 toenable them to maintain a minimum Tier-I CRAR of8 per cent and also to increase shareholding of theGovernment of India in these PSBs.
5.26 In 2012-13 also, the Government has infusedcapital in PSBs to augment their Tier-I capital sothat they maintain their Tier-I CRAR at a comfortablelevel and remain compliant with the stricter capitaladequacy norms under BASEL-III. This will alsosupport internationally active PSBs in their nationaland international banking operations undertakenthrough their subsidiaries and associates. For this
http://indiabudget.nic.in

114 Economic Survey 2012-13
Table 5.9 : Operating Parameters of Commercial Banks
(`̀̀̀̀ crore)
Items Income Interest Expen- Interest Provisions Net TotalIncome diture Expended and Profit Assets
contin-gencies
2010-11
PSBs 414099 366135 369199 231153 55080 44901 5294006
Foreign banks 39505 28493 31786 10623 8595 7719 491175
Old private-sector banks 26328 23299 23226 14768 2858 3101 309011
New private-sector banks 91259 73414 76649 42381 12261 14610 1089206
All SCBs 571191 491341 500860 298925 78795 70331 7183398
2011-12PSBs 535098 484740 485584 328539 66831 49514 6037982
Foreign banks 47223 36340 37797 15195 9056 9426 583600
Old private-sector banks 35975 32592 32051 22506 3005 3924 375015
New private-sector banks 122503 101387 103709 64279 12626 18794 1302786
All SCBs 740799 655059 659141 430519 91517 81658 8299383
As percentage to Assets2010-11
PSBs 7.82 6.92 6.97 4.37 1.04 0.85 2.55
Foreign banks 8.04 5.80 6.47 2.16 1.75 1.57 3.64
Old private-sector banks 8.52 7.54 7.52 4.78 0.92 1.00 2.76
New private-sector banks 8.38 6.74 7.04 3.89 1.13 1.34 2.85
All SCBs 7.95 6.84 6.97 4.16 1.10 0.98 2.68
2011-12PSBs 8.86 8.03 8.04 5.44 1.11 0.82 2.59
Foreign banks 8.09 6.23 6.48 2.60 1.55 1.62 3.62
Old private-sector banks 9.59 8.69 8.55 6.00 0.80 1.05 2.69
New private-sector banks 9.40 7.78 7.96 4.93 0.97 1.44 2.85
All SCBs 8.93 7.89 7.94 5.19 1.10 0.98 2.71
purpose an amount of ` 12, 517 crore has beenallocated in the Revised Estimates (RE) 2012-13under Plan.
5.27 The High Level Committee to assess thecapitalization of PSBs in the next 10 years, headedby the Finance Secretary has inter aliarecommended various options for funding of PSBs.Given the budgetary constraints, it may not befeasible for the government to infuse huge sums intothe PSBs. The High level Committee has, therefore,recommended the formation of a non-operating
financial holding company (HoldCo) under a specialact of Parliament with the following key objectives:
to act as an investment company for theGovernment of India;
to hold a major portion of the Government ofIndia's holdings in all PSBs;
to raise long-term debt from domestic andinternational markets to infuse equity into PSBs;and
to service the debt from within its sources.
http://indiabudget.nic.in

115Financial Intermediation
Recapitalisation of RRBs to improve theirCRAR5.28 RRBs have played a pivotal role in creditdelivery in rural areas, particularly to the agriculturesector. To enhance their outreach and provide bankingservices more effectively to rural masses, RRBs needto undertake a continuous process of technologyand capital upgradation. With a view to bringing theCRAR of RRBs up to at least 9 per cent, Dr K.C.Chakrabarty Committee inter alia recommendedrecapitalization support to the extent of ̀ 2,200 croreto 40 RRBs in 21 States. Pursuant to therecommendation of the Committee, recapitalizationamount is to be shared by the stakeholders inproportion to their shareholding in RRBs, i.e. 50 percent central government, 15 per cent concernedstate government, and 35 per cent the concernedsponsor banks. The central government share worksout to ̀ 1,100 crore. The, recapitalisation process,which started in 2010-11, was to be completed by2011-12. Although the central government releasedan amount of ̀ 468.9 crore during 2010 and 2011-12to 21 RRBs, the process of recapitalisation couldnot be completed in 2011-12 as all the stategovernments did not release their share towardsrecapitalisation. The recapitalisation scheme hastherefore been extended up to March 2014. A provisionof ̀ 200 crore was made for the purpose in the Budgetfor 2012-13 and the entire provision has beenreleased. Thus, till 31 December 2012, a total sumof ` 668.9 crore had been released by thegovernment to 27 RRBs.
Amalgamation of RRBs5.29 With a view to minimising overhead expensesand optimizing the use of technology in RRBs, the
government, in consultation with NABARD, theconcerned state government, and sponsor banks,has initiated amalgamation of geographicallycontiguous RRBs in a state. This will enhance thecapital base and area of operation of theamalgamated RRBs and increase their exposure.Thus the amalgamated entities will have sustainablefinancial health and will be able to serve their areabetter with absorption of technology and improvedmanagement. Till 1 January 2013, 22 RRBs hadalready been amalgamated into 9 RRBs.
Improving recovery in PSBs5.30 Because of the slowdown and high levels ofleverage, some industry and infrastructure sectorsare experiencing a rise in NPAs. Overall NPAs ofthe banking sector increased from 2.36 per cent oftotal credit advanced in March 2011 to 3.57 per centof total credit advanced in September 2012 (Figure5.2). While there has been an across-the-boardincrease in NPAs, the increase has been particularlysharp for the industry and infrastructure sectors, withNPAs as a percentage of credit advanced increasingfrom 1.91 per cent in March 2011 to 3.44 per cent asin September 2012. Sectors particularly under stressinclude textiles, chemicals, iron and steel, foodprocessing, construction, and telecommunications.
5.31 As per RBI data, gross NPAs (GNPA) ofPSBs have shown a rising trend during the last threeyears from ̀ 59,972 crore ( March, 2010) to ̀ 71,080crore (March, 2011), ̀ 1,12,489 crore (March, 2012),and ` 1,44,437 crore (September, 2012). As apercentage of credit advanced, NPAs were at a levelof 4.01 per cent in September 2012 compared to2.09 per cent in 2008-9. Although GNPAs have
http://indiabudget.nic.in

116 Economic Survey 2012-13
increased at system level, the GNPA ratios of PSBsare still at manageable levels. However, given theirrapid growth, albeit partly for technical reasons, theyneed to be closely monitored.
5.32 The main reasons for increase in NPAs ofbanks are (a) switchover to system-basedidentification of NPAs by PSBs; (b) currentmacroeconomic situation in the country; (c) increasedinterest rates in the recent past; (d) lower economicgrowth; and (e) aggressive lending by banks in thepast, especially during good times. Some recentinitiatives taken by the government to address therising NPAs include (a) appointment of nodal officersin banks for recovery at their head offices/ zonaloffices/ for each Debts Recovery Tribunal (DRT); (b)thrust on recovery of loss assets by banks; (c) closewatch on NPAs by picking up early warning signalsand ensuring timely corrective steps by banks; (d)directing the state-level Bankers' Committee to beproactive in resolving issues with the stategovernments; and (e) designating assetreconstruction companies (ARCs) resolution agentsof banks. Pursuant to the second review of theMonetary Policy, the RBI has also announced thefollowing remedial measures:
the provision for restructured standard accountsis to be raised from the existing 2 per cent to2.75 per cent;
the sanction of fresh loans/ad-hoc loans from1st Jan 2013 will be made on the basis of sharingof information among banks;
banks will conduct sector- /activity-wise analysisof NPAs; banks will put in place a robustmechanism for early detection of sign of distress,amendments in recovery laws, and strengtheningof credit appraisal and post credit monitoring.
5.33 Steps taken by the government and the RBIhave resulted in improvement in recovery of NPAsby the PSBs which has increased from ̀ 9,726 croreas on March 2010 to ` 13,940 crore as on March2011 and ̀ 17,043 crore as in March 2012.
NON-BANKING FINANCIALINSTITUTIONS (NBFIS)Financial Institutions (FIs)5.34 As at end-March 2012, there were fourinstitutions, viz. EXIM Bank, NABARD, NationalHousing Bank (NHB), and the Small Industries
Development Bank of India (SIDBI) regulated by theRBI as all-India financial institutions (FIs). Theoutstanding resources mobilized at any point of timeby an FI, including funds mobilized under the'umbrella limit' comprising term deposits, termmoney borrowings, certificates of deposit (CD),commercial paper (CP), and inter-corporate loans,as prescribed by the Reserve Bank, should notexceed 10 times its net-owned funds (NOF) as perits latest audited balance sheet. However, in view ofthe difficulties expressed by the NHB and EXIM Bank,their aggregate borrowing limit has been reviewed.Accordingly, EXIM Bank's aggregate borrowing limithas been enhanced to 12 times its NOF for a periodup to 31 August 2013 and for the NHB to 11 times ofNOF for a period up to 30 September 2012. The'umbrella limit' for aggregate borrowings through thesespecified instruments should not at any time exceed100 per cent of NOF of the FI concerned as per itslatest audited balance sheet. However, in view of thedifficulties expressed by the NHB, SIDBI, EXIM Bankand NABARD, their borrowing under 'umbrella limit'was enhanced from 100 per cent of NOF to 150 percent of NOF for a period of one year (for NHB, SIDBI,and EXIM Bank up to 30 June 2012 and for NABARDup to 31 December 2012), subject to review.
5.35 Resources raised by FIs during 2011-12 wereconsiderably higher than those raised during theprevious year. While the long-term resources andshort-term resources raised witnessed a sharp riseduring 2011-12 as compared to a year earlier, foreigncurrency resources raised declined during the sameperiod of time. The NHB mobilised the largest amountof resources, followed by NABARD and SIDBI(Table 5.10).
5.36 Total sources/deployment of funds of FIsincreased 42.8 per cent to ̀ 4, 25,182 crore during2011-12. A major part of the funds was raisedinternally, followed by external sources. A large partof the funds raised was used for fresh deployments,followed by repayment of past borrowings. Otherdeployments including interest payments formed acomparatively small part of the funds of FIs(Table 5.11).
5.37 The NBFCs as a whole account for 12.7 percent of the assets of the total financial system. Withthe growing importance assigned to financialinclusion, NBFCs are being regarded as importantfinancial intermediaries particularly for the small-scale and retail sectors. There are two broad
http://indiabudget.nic.in

117Financial Intermediation
Table 5.10 : Resources Mobilized by Financial Institutions(Amount in ` crore)
EXIM Bank NABARD NHB SIDBI Total
Long Term 2010-11 11,132 9,741 7,538 11744 401552011-12 10,100 17,914 9814 14648 52476
Short Term 2010-11 1,538 18,532 3380 5958 2947082011-12 4205 9,035 5215 4250 22705
Foreign Currency 2010-11 11,456 - - 1700 131562011-12 9,122 - 93 1980 11195
Total 2010-11 24,126 28,273 10918 19402 827192011-12 23427 26,949 15122 20878 86376
Total Outstanding 2011 47,192 33,891 22765 46331 150179(end March) 2012 54,655 42,299 26980 53785 177719
Source: Respective FIs.Notes: - Nil/Negligible;Long-term rupee resources comprise borrowings by way of bonds/debentures; and short-term resourcescomprise CP, term deposits, Inter Corporate Deposits, CDs and borrowing from term money. Foreigncurrency resources largely comprise bonds and borrowings in the international market.
categories of NBFCs based on whether they acceptpublic deposits, viz. deposit-taking NBFCs (NBFCs-D) and non-deposit-taking NBFCs (NBFCs-ND). Thetotal number of NBFCs registered with the RBIwitnessed a continuous decline mainly due tocancellation of certificates of registration and theirexit from deposit-taking activities. The number ofnon-deposit-taking systemically important NBFCs
(NBFCs-ND-SI) with asset size ` 100 crore andabove), however, increased (Table 5.12). The ratioof deposits of reporting NBFCs [includingresiduary non-banking companies (RNBCs)] to theaggregate deposits of SCBs dropped to 0.15 percent as on 31 March 2012 from 0.21 per cent inthe previous year mainly due to the decline indeposits of RNBCs.
Table 5.11 : Pattern of Sources and Deployment of Funds of Financial Institutions(` crore)
Item 2011 2012 Increase inValue Per cent Value Per cent per cent
Share Share
A -Sources of funds 297784 100.0 425182 100.0 42.78Internal 163197 54.8 262263 61.7 60.7External 119072 40.0 149529 35.2 25.57Others@ 15515 5.2 13390 3.2 -13.69B- Deployment of funds 297784 100.0 425182 100.0 42.78Fresh deployment 174674 58.7 273914 64.4 56.81Repayment of past borrowings 83971 28.2 129044 30.4 53.67Other deployment 39139 13.1 22222 5.2 -43.22Of which: interest payments 14227 4.8 14504 3.4 1.94
Source: RBI-Respective FIs (EXIM Bank, NABARD, NHB and SIDBI).@ Includes cash and balances with the RBI and others banks.Percentage variation could be slightly different due to rounding off.
http://indiabudget.nic.in

118 Economic Survey 2012-13
Table 5.12 : Number of NBFCs Registeredwith the RBI
End June Number of Number of NumberRegistered NBFCs-D of
NBFCs NBFCs-ND-SI
2006 13014 428 1492007 12968 401 1732008 12809 364 1892009 12740 336 2342010 12630 308 2602011 12409 297 3302012 12385 271 370
Source: RBI.
NBFCs-D5.38 The total assets of NBFCs-D (includingRNBCs) increased to ` 1,24,419 crore as on31 March 2012 from ` 1,16,897 crore in thepreceding year. Public deposits held by NBFCs-Dand RNBCs together declined by 15.5 per cent to` 10,106 crore as on 31 March 2012 from ̀ 11,964crore in the previous year. NOFs witnessed 25.4 percent growth for the year ended March 2012 and stoodat ̀ 22,544 crore. The consolidated balance sheetof NBFCs-D (excluding RNBCs) recorded 10.8 percent growth for the year ended March 2012 (asagainst 11.9 per cent growth in the previous year).Borrowings, which is the major source of funds forNBFCs-D, increased by 15.9 per cent during theyear. On the assets side, loans and advanceswitnessed a growth of 12.1 per cent while investmentsdeclined by 24.8 per cent for the year ended March2012.
5.39 During 2011-12, there was significant increasein the GNPAs to total advances of NBFCs-D.Category-wise, GNPA and net NPA ratios of assetfinance companies and loan companies deterioratedduring 2011-12 as compared to the previous year.CRAR norms were made applicable to NBFCs-D in1998, whereby every NBFC-D is required to maintaina minimum capital, consisting of Tier-I and Tier-IIcapital, of not less than 15 per cent (12 per cent upto 31 March 2011) of its aggregate risk-weightedassets. As on 31 March 2012, 187 out of 198reporting NBFCs-D had CRAR of more than 15 percent as against 199 out of 204 NBFCs-D in theprevious year.
NBFCs-ND-SI5.40 The balance sheet size of the NBFCs-ND-SIsector increased by 21 per cent to ̀ 9,21,321 croreas on 31 March 2012 (against ` 7,61,282 crore inthe previous year). Significant increase in balancesheet size of the NBFCs-ND-SI sector is mainlyattributed to sharp increase in owned funds,debentures, bank borrowings. Owned funds (whichaccounted for 26.1per cent of total liabilities)increased by 21.5 per cent during 2011-12. Totalborrowings (secured and unsecured) of the sectorincreased sharply by 29.3 per cent to ` 6,39,830crore and formed 69.4 per cent of total liabilities ason 31 March 2012. During the period ended June2012, total borrowings further increased by 4.0 percent to ̀ 6,65,728 crore. The pattern of deploymentof funds by the NBFCs-ND-SI sector for the yearending March 2012 remained broadly in line with thepattern witnessed in the previous year. Secured loanscontinued to constitute the largest share (48.7 percent of total assets), followed by unsecured loanswith a share of 15.3 per cent, hire purchase assets(6.8 per cent), investments (17.3 per cent), cashand bank balances (3.9 per cent), and other assets(7.9 per cent) during the year ended March 2012.
5.41 The financial performance of the NBFCs-ND-SI sector deteriorated marginally as reflected in thedecline in net profit during 2011-12. Return on assets(net profit as a percentage of total assets) of thesector stood at 1.5 per cent as on 31 March 2012(2.1 per cent in the previous year). Both gross andnet NPA ratios of the NBFCs-ND-SI sector increasedfor the year ended March 2012 indicating overalldeterioration in asset quality of the sector. The GNPAratio of the sector stood at 1.48 per cent for the yearended March 2012 (1.28 per cent in the previousyear), while net NPAs remained at 0.88 per cent(0.51 per cent in the previous year) during the sameperiod.
5.42 CRAR norms were made applicable toNBFCs-ND-SI w.e.f. April 2007. In terms of the extantinstructions, every NBFC-ND-SI is required tomaintain a minimum capital, consisting of Tier-I andTier-II capital, of not less than 15 per cent of itsaggregate risk-weighted assets. As on March 2012,barring a few, most of reporting companiesmaintained the stipulated minimum norm of 15 percent CRAR.
Major Policy Developments5.43 The regulatory and supervisory framework ofNBFCs continued to focus on prudential regulations
http://indiabudget.nic.in

119Financial Intermediation
with specific attention to the NBFCs-ND-SI. Someof the important developments have been thefollowing:(i) NBFC-Micro Finance Institutions (NBFC-
MFIs): Provisioning Norms—Extension ofTime and Modifications: Taking into accountthe difficulties faced by the MFI sector and therepresentation received by banks from them, itwas decided to defer the implementation of assetclassification and provisioning norms for NBFC-MFIs to 1 April 2013.
(ii) Lending against Security of Single Product--Gold Jewellery: Since NBFCs that arepredominantly engaged in lending against thecollateral of gold jewellery have inherentconcentration risk and are exposed to adversemovement of gold prices, as a prudentialmeasure it was decided that all such NBFCsshall: hereafter maintain a loan-to-value (LTV) ratio
not exceeding 60 per cent for loans grantedagainst the collateral of gold jewellery and
disclose in their balance sheet thepercentage of such loans to their totalassets;
maintain a minimum Tier l capital of 12 percent by 1 April 2014;
not grant any advance against bullion /primary gold and gold coins.
(iii) Core Investment Companies (Reserve Bank)Directions 2011 Clarification on CICs IssuingGuarantees: Systemically important coreinvestment companies (CIC) with total assetsnot less than ` 100 crore, either individually orin aggregate along with other CICs in the group,and that raise or hold public funds, shall applyto the RBI for grant of certificate of registration(CoR).
(iv) Infrastructure Debt Funds (IDFs): The RBI on21 November 2012 issued detailed guidelineswith regard to the regulation of IDF-NBFCs. Interms of the guidelines, for the purpose ofcomputing capital adequacy, IDF-NBFCs arepermitted to assign a risk weight of 50 per centon bonds covering Public PrivatePartnership(PPP) and post commercialoperations date (COD) projects in existence overa year of commercial operation. In order to bringuniformity in regulations in this regard, thisreduction in risk weight is extended to allinfrastructure finance companies (IFCs) for
assets covering PPP and post COD projectsthat have completed at least one year ofsatisfactory commercial operations.
(v) The Non-Banking Financial Company-Factors (Reserve Bank) Directions 2012:Factoring business refers to the acquisition ofreceivables by way of assignment of suchreceivables or financing, there against either byway of loans or advances or by creation ofsecurity interest over such receivables but doesnot include normal lending by a bank againstthe security of receivables etc. A new categoryof NBFCs, viz. non-banking financial company-factors, has been introduced and separatedirections have been issued in this regard bythe RBI. These directions include a mention thatevery company intending to undertake factoringbusiness shall make an application for grant ofCoR as NBFC-factor to the RBI. Existing NBFCsthat satisfy all the conditions enumerated inthese directions can also apply for change intheir classification. An NBFC-factor, will need tocommence business within six months from thedate of grant of CoR. NOF for every companyseeking registration as NBFC-factor has beenfixed at a minimum of ` 5 crore.
(vi) Revisions to the Guidelines onSecuritization Transactions: Securitisation isa process by which assets are sold to abankruptcy remote special purpose vehicle(SPV) in return for an immediate cash payment.The cash flow from the underlying pool of assetsis used to service the securities issued by theSPV. While there is sale of single asset or poolof assets to a 'bankruptcy remote' SPV in returnfor an immediate cash at the first stage ofSecuritisation, the second stage involvesrepackaging and selling the security interestsrepresenting claims on incoming cash flowsfrom the asset or pool of assets to third partyinvestors by issuance of tradable debt securities.In order to prevent unhealthy practicessurrounding securitization, viz. origination ofloans for the sole purpose of securitization andin order to align the interest of the originator withthat of the investors and with a view toredistributing credit risk to a wide spectrum ofinvestors, it was felt necessary that originatorsshould retain a portion of each securitizationoriginated and ensure more effective screeningof loans. In addition, a minimum period ofretention of loans prior to securitization was also
http://indiabudget.nic.in

120 Economic Survey 2012-13
considered desirable, to make the investors morecomfortable regarding due diligence exercisedby the originator.
CAPITAL MARKET
Primary Market5.44 During financial year 2012-13 (up to31 December, 2012) resource mobilization throughprimary market (equity issue) witnessed anupward movement (Table 5.13). The cumulativeamount mobilised as on 31 December 2012through equity public issues stood at ` 13,050crore. During 2012-13, 20 new companies [initialpublic offers (IPOs)] with resource mobilisationamounting to ` 6,043 crore were listed at theNational Stock Exchange (NSE) and BombayStock Exchange (BSE) with mean IPO size of` 302 crore. However, in the public issue ofcorporate debt category, ` 4,974 crore wasmobilised through debt issue in 2012-13 comparedto ` 35,611 crore in 2011-12.
Mutual Funds
5.45 After two years of redemption pressures,mutual funds (MF) mobilized ̀ 1,20,269 crore fromthe market in 2012-13 (Table 5.14). The market valueof their assets under management stood at` 7,59,995 crore as on 31 December 2012 comparedto ̀ 5, 87,217 crore as on 31 March 2012, indicatingan increase of 29.4 per cent.
Secondary Market5.46 Indian benchmark indices, i.e. the BSE andNSE closed at 19426.7 and 5905.1 (as on 31December 2012), gaining 25.70 per cent and 27.70per cent respectively over the closing value of 15454.9(Sensex) and 4624.3 (Nifty) on 30 December 2011(Table 5.15). On 9 February 2013, the HonourableFM inaugurated the trading in equity and equityderivative segment by MCX-SX and the Exchangeofficially commenced trading in these segments on11 February 2013.5.47 Further, during the current financial year (upto 31 December 2012), the rise in the indices stood
Table 5.13 : Resource Mobilization through the Primary Market(` crore)
Mode 2009-10 2010-11 2011-12 2012-13#
1. Debt 2500 9451 35611 4974
2. Equity 46736 48654 12857 13050
Of which IPOs 24696 35559 5904 6043
Number of IPOs 39 53 34 20
Mean IPO size 633 671 174 302
3. Private placement 212635 218785 261282 263644
4. Euro issues (ADR/GDR) NA NA NA NA
Total (1+2+3+4) 261871 276890 309750 281667Source: Securities and Exchange Board of India (SEBI) and RBI (for Euro issues).Notes: NA indicates Not Available;# as on 31 December 2012 (Provisional); the Equity issues are considered only equity public issues; ADRis American Depository Receipts and GDR is Global Depository Receipts.
Table 5.14 : Trends in Resource Mobilization (net) by Mutual Funds(` crore)
Sector 2009-10 2010-11 2011-12 2012-13#
1. UTI 15653 -16636 -3184 106172. Public 12499 -13555 -3394 87463. Private 54928 -19215 -22024 100906
Total (1+2+3) 83080 -49406 -28602 120269
Source : SEBI. Note : # As on December 31, 2012.
http://indiabudget.nic.in

121Financial Intermediation
at 11.62 per cent for the Sensex and 11.51 per centin case of Nifty. Among the major Asian and markets,Indian markets have been the best performing interms of returns. Annual movement of BSE and NSEindex is provided in figure 5.3.
5.48 Reinvigorated foreign institutional investor (FII)inflows into the country during the year 2012 helpedthe Indian markets become one of the best performingin the world in 2012, recovering sharply from theirdismal performance in 2011. The calendar year-wisetrend in FII flows is provided in Figure 5.4.
5.49 FIIs make investments in markets on the basisof their perceptions of expected returns from suchmarkets. Their perceptions among other things areinfluenced by the prevailing macroeconomicenvironment, the growth potential of the economy,and corporate performance in competing countries.At the end of December 2012, 1,759 FIIs wereregistered with SEBI, with the number of registeredsub-accounts increasing to 6,359. The total net FIIflows to India in 2012 stood at US $ 31.01 billion.These flows were largely driven by equity inflows
Table 5.15 : Performance of Major Markets in the World (level and percentage change)
Index Last trading day Last trading day Last trading day % change inof 2010 of 2011 of 2012 2012 over 2011
(31 Dec. 2010) (30 Dec. 2011) (31 Dec. 2012)
BSE SENSEX 20509.09 15454.92 19426.71 25.7
NSE NIFTY 6134.5 4624.3 5905.1 27.7
S&P 500 1257.64 1257.6 1426.19 13.4
DAX 6914.19 5898.35 7612.39 29.1
FTSE 100 5899.94 5572.28 5897.81 5.8
NIKKEI 225 10228.92 8455.35 10395.18 22.9
HANG SENG 23035.45 18434.39 22656.92 22.9
BRAZIL BOVESPA 69304.81 56754.08 60952.08 7.4
KOSPI 2051 1825.74 1997.05 9.4
DJIA 11577.51 12217.56 13104.14 7.3
Straits Times 3190.04 2646.35 3167.08 19.7
SHANGHAI SE COMPOSITE 2808.077 2199.417 2269.128 3.2
CAC 40 3804.78 3159.81 3641.07 15.2
Source : Bloomberg.
http://indiabudget.nic.in

122 Economic Survey 2012-13
Table 5.16 : Market Turnover
(` crore)
Market 2009-10 2010-11 2011-12 2012-13#
BSE
Cash 1378809 1105027 667498 410230
Equity derivatives 234 154 808476 5741593
NSE
Cash 4138024 3577410 2810893 1973624
Equity derivatives 17663665 29248221 31349732 22879486
Source: BSE and NSE.Note: # as on 31 December 2012.
(80 per cent of total flows) which remained buoyant,indicating FII confidence in the performance of theIndian economy in general and Indian markets inparticular. The economic and political developmentsin the Euro zone area and United States had theirimpact on markets around the world including India.The resolution of the 'fiscal cliff' in the US had apositive impact on the market worldwide including inIndia. Further, the reform measures recently initiatedby the government have been well received by themarkets.
5.50 Market turnover has also increased during thecurrent year. In the cash segment of the equitymarket, the total turnover of the BSE and NSE stoodat ` 4,10,230 crore and ` 19,73,624 crore during2012-13 (April-December) as compared to ̀ 6,67,498
crore and ̀ 28,10,893 crore respectively in 2011-12(Table 5.16).
5.51 In the equity derivatives segment, the NSEwitnessed a total turnover of ` 2,28,79,486 croreduring 2012-13 (April-December) as compared to` 3,13,49,732 crore during 2011-12. The total turnoverin the equity derivatives segment of the BSE stoodat ̀ 57,41,593 crore in 2011-12 (April-December).
5.52 In the currency derivatives segment, the NSEwitnessed a turnover of ̀ 37,25,842 crore in 2012-13 (April-December). The turnover in the currencyderivatives segment of the Multi-CommodityExchange (MCX-SX) stood at ̀ 23,63,819 crore in2012-13 (April-December) . Further, the United StockExchange (USE) witnessed a turnover of ̀ 32,109crore during the same period (Table 5.17).
http://indiabudget.nic.in

123Financial Intermediation
Volatility in the equity and currencyderivatives market5.53 Together with an increase in the turnover inthe securities markets, there was also a decline involatility of both the Nifty and Sensex. Volatility whichhad increased in 2010-12 (two years), moderatedconsiderably (Table 5.18).
MAJOR POLICY INITIATIVES
5.54 In the overall context of the evolvingmacroeconomic situation in the country and globalfinancial developments, the government in closecollaboration with the RBI and SEBI has recentlytaken a number of initiatives to meet the growingcapital needs of the Indian economy. Some of theinitiatives are as follows:
Primary Market5.55 SEBI (Alternative Investment Funds)Regulations 2012: With a view to extending thereach of regulation to unregulated funds, ensuringsystemic stability, increasing market efficiency,encouraging new capital formation, and providinginvestor protection, SEBI has notified new regulationscovering alternate investment funds (AIFs) under threebroad categories:
Category 1 : AIFs with positive spillover effectson the economy, for which certain incentives orconcessions might be considered by SEBI orthe Government of India or other regulators inIndia; and which shall include venture capitalfunds, small and medium enterprises (SME)funds, social venture funds, and infrastructurefunds.
Category 2 : AIFs for which no specificincentives or concessions are given by thegovernment or any other regulator; which shallnot undertake leverage other than to meet day-to-day operational requirements as permitted inthese regulations
Category 3 : AIFs with funds (including hedgefunds) that are considered to have negativeexternalities.
5.56 The recent initiatives taken to develop theIndian corporate bond markets are summarized inBox 5.2.
5.57 Financial Literacy: With the objective ofpromoting financial education in a synergisticmanner, under the aegis of the Financial Stabilityand Development Council (FSDC) Sub-Committeea draft National Strategy on Financial Education hasbeen formulated and public consultation on the samehas been undertaken. The document is in the stageof finalization.
5.58 Two-way fungibility in Indian DepositoryReceipts (IDRs): Pursuant to the budgetannouncement of 2012-13, the Ministry of CorporateAffairs (MCA) [1 October 2012], the RBI, and SEBI(28 August 2012) have carried out amendments tothe existing legal framework to facilitate two-wayfungibility in Indian depository receipts.
Table 5.17 : Trends in Currency DerivativesYear NSE MCX- SX USE
2011-12 2012-13# 2011-12 2012-13# 2011-12 2012-13#
No. of contracts (lakh) 9733 6772 7703 4272 3153 57
Trading value (`̀̀̀̀ crore) 4674990 3725842 3732446 2363819 1488978 32109
Average daily tradingvalue (`̀̀̀̀ crore) 18775 20140 14990 12777 5980 174
Source: NSE, MCX-SX and USE.Note: # as on 31 December 2012.
Table 5.18 : Volatility of weekly returns onIndian Equity Markets
Index 2009-10 2010-11 2011-12 2012-13#
Nifty 3.8 2.5 2.9 1.8
Nifty Junior 4.5 2.7 2.9 2.0
Sensex 3.6 2.5 2.9 1.8
BSE 500 3.9 2.4 2.8 1.8
Source : BSE and NSE.Note : # As on 31 December 2012.
http://indiabudget.nic.in

124 Economic Survey 2012-13
Secondary MarketRajiv Gandhi Equity Savings Scheme
5.59 On 23rd November 2012, the governmentnotified a new tax saving scheme called the RajivGandhi Equity Savings Scheme (RGESS),exclusively for first-time retail investors in thesecurities market. This scheme provides 50 per centdeduction of the amount invested from taxableincome for that year to new investors who invest upto ̀ 50,000 and whose annual income is below ̀ 10lakh. The operational guidelines were issued bySEBI on 6 December 2012 (Box 5.3).
Electronic Voting Facility made mandatory fortop listed companies
5.60 As mandated in the Union Budget 2012-13for top listed companies to offer electronic votingfacility to their shareholders, SEBI has come outwith the necessary amendments in this regard on13 July 2012, to be incorporated in the equity listingagreement by stock exchanges. To make abeginning, based on market capitalization, electronicvoting is now mandatory for the top 500 listedcompanies at the BSE and NSE, in respect of thosebusinesses to be transacted through postal ballot.
SME Exchange / Platform
5.61 Separate trading platforms for SMEs werelaunched and became functional at the BSE and
NSE in March 2012 and September 2012respectively. As on 14 January 2013, the number ofequities listed on the BSE and NSE SME platformsis 12 and 2 respectively.
Reduced Securities Transaction Tax for cashdelivery transactions
5.62 Following the announcement in Union Budget2012-13, the rate of the securities transaction tax(STT) has been revised downwards by 20 per centto 0.1 per cent from 0.125 per cent for delivery-basedtransactions in the cash market, effective 1 July2012.
Regulatory framework for governance andownership of stock exchanges, clearingcorporations, and depositories
5.63 Based on the recommendations of the Dr.Bimal Jalan Committee, new Securities Contracts(Regulation) (Stock Exchanges and ClearingCorporations) Regulations 2012 were notified on20 June 2012 to regulate recognition, ownership,and governance in stock exchanges and clearingcorporations. Further, the Securit ies andExchange Board of India (Depositories andParticipants) (Amendment) Regulations 2012 havebeen brought into effect from 11 September 2012to regulate ownership and governance norms ofdepositories.
Box 5.2 : Recent Initiatives for further Development of Corporate Bond Markets To permit banks to take limited membership in SEBI-approved stock exchanges for the purpose of undertaking
proprietary transactions in the corporate bond markets.
To enhance liquidity in the corporate bond markets the Insurance Regulatory and Development Authority (IRDA) haspermitted insurance companies to participate in the repo market. The IRDA has also permitted insurance companies tobecome users of credit default swap (CDS).
In consultation with the Technical Advisory Committee on Money, Foreign Exchange, and Government SecuritiesMarkets, it has been decided to reduce the minimum haircut requirement in corporate debt repo from the existing 10 percent/12per cent/15per cent to 7.5 per cent/8.5per cent/10 per cent for AAA/AA+/AA-rated corporate bonds.
MFs have been permitted to participate in CDS in corporate debt securities, as users. MFs can participate as users inCDS for eligible securities as reference obligations, constituting from within the portfolio of only fixed maturity plans(FMP) schemes having tenor exceeding one year.
Revised guidelines on CDS for corporate bonds by the RBI provide that in addition to listed corporate bonds, CDS shallalso be permitted on unlisted but rated corporate bonds even for issues other than infrastructure companies.
Users shall be allowed to unwind their CDS-bought position with the original protection seller at a mutually agreeableor Fixed Income Money Market and Derivatives Association of India(IMMDA) price. If no agreement is reached, thenunwinding has to be done with the original protection seller at FIMMDA price.
CDS shall be permitted on securities with original maturity up to one year like CPs, certificates of deposit, and non-convertible debentures with original maturity less than one year as reference/deliverable obligations.
http://indiabudget.nic.in

125Financial Intermediation
Initiatives to attract foreign investment andExternal Commercial Borrowings
Expansion of Qualified Foreign Investors(QFIs ) Scheme
5.64 In Budget 2011-12, the government, for thefirst time, permitted qualified foreign investors (QFIs),who meet the know-your-customer (KYC) norms,to invest directly in Indian MFs. In January 2012,the government expanded this scheme to allow QFIsto directly invest in Indian equity markets. Takingthe scheme forward, as announced in Budget 2012-13, QFIs have also been permitted to invest incorporate debt securities and MF debt schemessubject to a total overall ceiling of US$ 1 billion. In
May 2012, QFIs were allowed to open individual non-interest-bearing rupee bank accounts withauthorized dealer banks in India for receiving fundsand making payment for transactions in securitiesthey are eligible to invest in. In June 2012, thedefinition of QFI was expanded to include residentsof the member countries of the Gulf CooperationCouncil (GCC) and European Commission (EC) asthe GCC and EC are the members of the FinancialAction Task Force (FATF).
Initiatives to attract FII Investment
5.65 As regards FII investment in debt securities,there has been progressive enhancement in thequantitative limits for investments in various debt
Box 5.3 : RGESSThe Rajiv Gandhi Equity Saving Scheme (RGESS) will give tax benefits to new investors whose annual income is up to ̀ 10lakh for investments up to a maximum of ̀ 50,000. The investor will get 50 per cent deduction of the amount invested fromtaxable income for that year. Salient features of the scheme are as follows:
The scheme is open to new retail investors identified on the basis of their permanent account numbers (PAN).
The tax deduction allowed will be over and above the ̀ 1 lakh limit permitted allowed under Section 80 C of the IncomeTax Act.
In addition to the 50 per cent tax deduction for investments, dividend income is also tax free.
For investments up to ̀ 50,000 in the sole RGESS demat account, if the investor opts for a basic service demat account,annual maintenance charges for the demat account are zero and for investments up to ` 2 lakh, ` 100.
Stocks listed under BSE 100 or CNX 100, or stocks of public-sector undertakings (PSUs) that are Navratnas, Maharatnas,and Miniratnas will be eligible under the scheme. Follow-on public offers (FPOs) of these companies will also be eligible.
IPOs of PSUs, which are scheduled to get listed in the relevant financial year and whose annual turnover is not less than` 4,000 crore for each of the immediate past three years, will also be eligible.
Exchange-traded funds (ETFs) and MFs that have RGESS-eligible securities as their underlying and are listed andtraded in the stock exchanges and settled through a depository mechanism have also been brought under the RGESS toprovide the advantage of diversification and consequent risk minimization.
To benefit the small investors, investments are allowed in instalments in the year in which tax claims are made.
The total lock-in period for investments will be three years including an initial blanket lock-in of one year.
After the first year, investors will be allowed to trade in the securities. Investors are free to trade / churn their portfoliosfor around 90 days in each of the years following the first year of investment.
Investors would, however, be required to maintain their level of investment during these two years at the amount forwhich they have claimed income tax benefit or at the value of the portfolio before initiating a sale transaction, whicheveris less, for at least 270 days in a year.
The general principle under which trading is allowed is that whatever is the value of stocks / units sold by the investorfrom the RGESS portfolio, RGESS-compliant securities of at least the same value are credited back into the accountsubsequently. However, the investor is allowed to take benefit of the appreciation of his RGESS portfolio, provided itsvalue remains above the investment for which he has claimed income tax benefit.
In case the investor fails to meet the conditions stipulated, the tax benefit will be withdrawn.
The broad provisions of the Scheme and the income tax benefits under it have already been incorporated as a new Section-80CCG- of the Income Tax Act 1961, as amended by the Finance Act 2012. The operational guidelines were issued by SEBIon 6 December 2012.
http://indiabudget.nic.in

126 Economic Survey 2012-13
Table 5.19 : Sovereign Ratings assigned by Rating Agencies as on 15.1.2013
Rating agency Date of Foreign currency Local currencyaffirmationof ratings
Ratings Outlook Ratings Outlook
JCRA 30.11.2012 BBB+ Stable No ratings were givenfor local currency
Moody’s 26.11.2012 Baa3 Stable Baa3 (upgraded Stablefrom Ba1)
R&I 22.11.2012 BBB (LT)a-2 (ST) Stable No ratings were givenfor local currency
DBRS 06.08.2012 BBB (low) (LT) Stable BBB (low) (LT) StableFitch 15.06.2012 BBB- (LT)F3 (ST) Negative BBB- StableS&P 25.04.2012 BBB- (LT) A-3 (ST) Negative No ratings were given
for local currency
categories. In June 2012, the FII limit for investmentin G-Secs (government securities) was enhancedby US $ 5 billion, raising the cap to US $ 20 billion.The scheme for FII investment in long-term infra bondshas been made attractive by gradual reduction inlock-in and residual maturity periods criteria. InNovember 2012, the limits for FII investment in G-Secs and corporate bonds (non-infra category) havebeen further enhanced by 5 billion each, taking thetotal limit prescribed for FII investment to US$ 25billion in G-Secs and US$51 billion for corporatebonds (infra+non-infra). FII debt allocation processhas also been reviewed for bringing greater certaintyamong foreign investors and helping them periodicallyre-balance their portfolios in sync with internationalportfolio management practices.
Liberalization in External CommercialBorrowings Policy during 2012-135.66 The important steps taken in the arena ofexternal commercial borrowings (ECB) policyliberalization include: Enhancing the limit for refinancing rupee loans
through ECB from 25 per cent to 40 per cent forIndian companies in the power sector
Allowing ECB for capital expenditure on themaintenance and operation of toll systems forroads and highways so long as they are a partof the original project subject to certainconditions, and also for low cost housing projects
Reducing the withholding tax from 20 per centto 5 per cent for a period of three years (July2012- June 2015) on interest payments on ECBs
Introducing a new ECB scheme of US $10 billionfor companies in the manufacturing andinfrastructure sectors
Permitting the Small Industries DevelopmentBank (SIDBI) as an eligible borrower foraccessing ECB for on-lending to the micro,small, and medium enterprises (MSME) sectorsubject to certain conditions
Permitting the National Housing Bank (NHB)/Housing Finance Companies to avail themselvesof ECBs for financing prospective owners of lowcost / affordable housing units
Sovereign Credit Rating of India5.67 India's sovereign debt is usually rated by sixmajor sovereign credit rating agencies (SCRAs)(Table 5.19). These are Fitch Ratings, Moody'sInvestors Service, Standard and Poor's (S&P),Dominion Bond Rating Service (DBRS), JapaneseCredit Rating Agency (JCRA), and Rating andInvestment Information Inc., Tokyo (R&I). Thegovernment is taking a number of steps to improveits interaction with the major SCRAs so that theymake informed decisions.
Financial Stability and Development Council5.68 With a view to strengthening andinstitutionalizing the mechanism for maintainingfinancial stability, enhancing inter-regulatorycoordination, and promoting financial-sectordevelopment, the government has set up an apex-level Financial Stability and Development Council(FSDC) in December 2010, in line with the G 20
http://indiabudget.nic.in

127Financial Intermediation
initiatives. The Council is chaired by the FinanceMinister and has heads of financial-sector regulatoryauthorities, the Finance Secretary and/or Secretary,Department of Economic Affairs, Secretary,Department of Financial Services, and the ChiefEconomic Adviser as members. Without prejudiceto the autonomy of regulators, the Council monitorsmacro-prudential supervision of the economy,including functioning of large financial conglomerates,and addresses inter-regulatory coordination andfinancial-sector development issues. It also focuseson financial literacy and financial inclusion.
INSURANCE AND PENSION FUNDS
Insurance5.69 Since the opening up of the insurancesector, the number of participants in the insuranceindustry has gone up from seven insurers (includingthe Life Insurance Corporation of India [LIC], fourpublic-sector general insurers, one specializedinsurer, and the General Insurance Corporation asthe national re-insurer) in 2000 to 52 insurers as on30 September 2012 operating in the life, non-life,and re-insurance segments (including specializedinsurers, namely the Export Credit GuaranteeCorporation and Agricultural Insurance Company[AIC]). Four of the general insurance companies,viz. Star Health and Alliance Insurance Company,Apollo Munich Health Insurance Company, MaxBUPA Health Insurance Company, and ReligareHealth Insurance Company function as standalonehealth insurance companies. Of the 23 insurancecompanies that have set up operations in the lifesegment post opening up of the sector, 21 are injoint ventures with foreign partners. Of the 21privateinsurers who have commenced operations in the non-life segment, 18 are in collaboration with foreignpartners.
Life Insurance
5.70 From being the sole provider of life insurancetill financial year 1999-2000, LIC is today competingin an industry with 23 private-sector insurers whohave commenced operations over the period 2000-12. The industry which reported an annual growthrate of 19.8 per cent during the period 1996-7 to2000-1 has, post opening up of the sector, reportedan annual growth rate of 18.85 per cent during 2001-2 to 2011-12. The life insurers underwrote new
business of ` 1,13,942 crore during financial year2011-12 as against ̀ 1,26,398 crore during the year2010-11, recording a decline of 9.85 per cent. Of thenew business premium underwritten, the LICaccounted for ` 81,862.25 crore (71.85 per centmarket share) and private insurers for ̀ 32,079.92crore (28.15 per cent market share). The marketshare of these insurers was 68.84 per cent and 31.16per cent respectively in the corresponding period of2010-11.
Non-life Insurance5.71 The industry which reported a growth rate ofaround 10 per cent during the period 1996-7 to 2000-1 has, post opening up of the sector, reported averageannual growth of over 15 per cent over the period2001-2 to 2011-12. In addition, the specializedinsurers Export Credit Guarantee Corporation andAIC are offering credit guarantee and crop insurancerespectively. The premium underwritten by the non-life insurers during 2011-12 was ̀ 52,875.8 crore asagainst ̀ 42,576.5 crore in 2010-11, thus recordinga growth of 24.19 per cent. The growth wassatisfactory, particularly in view of the across-the-board cuts in tariff rates. The private insurersunderwrote premium of ̀ 22,315.03 crore as against` 17,424.6 crore in 2010-11, reporting growth of 28.07per cent vis-a-vis 24.67 per cent in 2010-11. The public-sector insurers, on the other hand, underwrote apremium of ` 30,560.74 in 2011-12 as against` 25,151.8 crore in 2010-11, i.e. a growth of 21.5 percent as against 21.84 per cent in 2010-11. Themarket shares of the public and private insurers are57.80 and 42.20 per cent in 2011-12 as against 59.07and 40.93 in the previous year.
Insurance Penetration5.72 The growth in the insurance sector isinternationally measured based on the standard ofinsurance penetration defined as the ratio of premiumunderwritten in a given year to the gross domesticproduct (GDP). Insurance density is another well-recognized benchmark and is defined as the ratio ofpremium underwritten in a given year to totalpopulation (measured in US dollars for convenienceof comparison). The Indian insurance business hasin the past remained underdeveloped with low levelsof penetration. Post liberalization, the sector hassucceeded in raising the levels of insurancepenetration from 2.7 (life 2.15 and non-life 0.56) in2001 to 4.1 (life 3.4 and non-life 0.7) in 2011.
http://indiabudget.nic.in

128 Economic Survey 2012-13
5.73 Despite the growth in the insurance sectorthat was witnessed during the last few decades,insurance penetration and density remained low ascompared to other developing countries of the world.It was felt that various legislative provisions werearchaic and needed revision in line with the changingmarket conditions. Accordingly, the governmentintroduced the Insurance Laws (Amendment) Bill2008 in the Rajya Sabha on 22 December2008.Based on the recommendations of the StandingCommittee, the official amendments to the InsuranceLaws (Amendment) Bill 2008 are proposed to beintroduced at the earliest.
Pension Sector5.74 The New Pension System (NPS) wasintroduced for the new recruits who join governmentservice on or after 01January 2004. Till 5 January2013 a total of 42.17 lakh subscriptions have beenenrolled with a corpus of ̀ 26,189 crore. From 1May2009, the NPS was opened up for all citizens inIndia to join on a voluntary basis. Although the NPSis perhaps one of the cheapest financial productsavailable in the country, in order to make it affordablefor the economically disadvantaged, the governmentin September 2010 introduced a lower cost version,known as Swavalamban Scheme, which enablesgroups of people to join the NPS at a substantiallyreduced cost. As per existing scheme under NPS,Swavalamban could be availed either in unorganizedsector or in NPS Lite. NPS Lite is a modelspecifically designed to bring NPS within easy reachof the economically disadvantaged sections of thesociety. NPS Lite is extremely affordable and viabledue to its optimized functionalities available atreduced charges. Under the Swavalamban scheme,the government provides subsidy to each NPSaccount holder and the scheme has been extendeduntil 2016-17. A customized version of the core NPSmodel, known as the NPS Corporate Sector Modelwas also introduced from December 2011 to enableorganized-sector entities to move their existing andprospective employees to the NPS under itsCorporate Model. All the PSBs have been asked toprovide a link on their website to enable individualsubscribers to open online NPS Accounts.
CHALLENGES AND OUTLOOK
5.75 India has been a late starter in the process ofreforming financial markets. Nevertheless, beginningthe 1990s, a package of reforms comprising
measures to liberalize, regulate, and develop thecountry's financial sector by adopting bestinternational practices has been initiated. The resultsof these reforms have been encouraging and thecountry now has one of the most vibrant andtransparent capital markets in terms of marketefficiency, transparency, and price discovery process.However, there are still certain challenges in thedevelopment of the Indian financial sector which needto be addressed to make it an important avenue forproductive chanelisation of savings by domesticinvestors and a preferred investment destination forinternational investors.
5.76 A reasonably well-developed corporate bondmarket is very much required in any economy tosupplement banking credit and the equity marketand to facilitate the long-term funding requirement ofcorporate sector as well as infrastructuredevelopment in the country. Though, the developmentof the corporate bond market, has been an importantarea and has received greater policy attention inrecent times,it is yet to take off in a significantmanner. Some of the issues that need to beaddressed in this regard include drawing up a road-map for a structural shift from a bank-dominatedfinancial system to a more diverse financial systemwhere top-rated corporates access finance fromcapital markets, strengthening of the legal frameworkfor regulation of corporate debt by necessaryamendments in rules/regulations, and relaxation ofinvestment guidelines for pension, provident, andinsurance funds to enable the participation of long-term investors in the corporate bond market.Introduction of new products and making nascentproducts such as covered bonds, municipal bonds,credit default swaps, credit enhancements, andsecuritization receipts more attractive may beconsidered for public issuance of bonds at reducedcost. Improving the market infrastructure for enablingliquidity, transparency in price discovery, andstimulating growth in trading volumes also need tobe suitably addressed.
5.77 The need for long-term finance for infrastructureprojects is another issue that needs to be lookedinto in the context of the limitation of banks to financesuch projects. Infrastructure projects, given their longpay-back period, require long-term financing in orderto be sustainable and cost effective. However banks,which have been the main source of funding theseprojects, are unable to provide long-term funding giventheir inherent asset-liability mismatch. Moreover
http://indiabudget.nic.in

129Financial Intermediation
banks are also approaching their exposure limits. Inthis regard, infrastructure development funds (IDF)through innovative means of credit enhancement areexpected to provide long-term low-cost debt forinfrastructure projects by tapping into savings likeinsurance and pension funds which have hithertoplayed a comparatively limited role in financinginfrastructure. By refinancing bank loans of existingprojects, IDFs are also expected to take over a fairlylarge volume of the existing bank debt that will releasean equivalent volume for fresh lending to infrastructureprojects.
5.78 The recent global financial crises have raisedcertain issues relating to governance of financialintermediaries and awareness of investors. Asinvestors' awareness is a precondition for theirprotection, attempts are being made to address thisissue through the financial literacy campaign. Asimultaneous and coordinated effort on both frontsis needed to enable investors, especially the smallinvestors, to take informed decisions and ensureorderly conditions in the market. The ongoing effortsneed to be scaled up in a coordinated way forspearheading financial literacy and promotinginvestors' protection.
5.79 The enactment of the Banking Laws(Amendment) Act 2012 is expected to make theregulatory and supervisory powers of the RBI moreeffective and facilitate banks in raising funds fromthe capital market required for expansion of bankingbusiness. It will also facilitate finalization ofguidelines by the RBI for providing licences for newbanks, which is essential for achieving the objectiveof financial inclusion in the current perspective. Thisneeds to be expedited accordingly.
5.80 Pension reforms in India have generatedwidespread interest internationally. They will not onlyfacilitate the flow of long-term savings fordevelopment but also help establish a credible andsustainable social security system in the country.
Lower levels of financial literacy, particularly amongworkers in the unorganized sector, non-availabilityof even moderate surplus, and lukewarm responseso far from most of the state / UT governments to aco-contributory Swavalamban Scheme are the majorchallenges to universal inclusion of poorer sectionsof Indian society into the pension network. On thesupply side, the lack of awareness about the NPSand of access points for people to open their accountsindividually have been major inhibiting factors whichshould be addressed by the pension regulatorimmediately. As far as the insurance products areconcerned, limited choice and high cost of providingcovers and assessing claims are some of the issuesthat need to be suitably addressed to makeinsurance funds an effective means of channellizingsavings to investments.
5.81 In the global context, the performance of thefinancial sector in India will be influenced by bothshort-term and long-term factors. In the long run, astrong growth in global output will be essential forsustaining investment activities across the globe,including India. In the short run, factors likeexpectation of higher relative returns, risk perceptionof investors, and global liquidity will decide the levelof flow of funds to the domestic equity market.According to the World Bank's Global EconomicProspects (GEP), January 2013, conditions in theglobal financial markets have eased significantlysince July 2012 reflecting substantial progress inimproving fiscal sustainability and the mutual supportmechanism in the European Union. The decline infinancial market tensions is reflected in terms ofinternational capital flows to developing countriesreaching a new high, decline in developing countrybond spreads (EMBIG), and rise in developingcountry stock index. Overall the global economicenvironment remains fragile and prone to furtherdisappointment, although the balance of risk is nowless skewed to the downside than it has been inrecent years.
http://indiabudget.nic.in

Balance of Payments CHAPTER
6
India’s external sector exhibited resilience during the global financial crisis of 2008.
The balance of payments however has been under increasing stress recently. Exportshave declined while imports have not fallen significantly, resulting in increasing
trade and current account deficits. Though capital flows are bridging the gap, the
nature of portfolio capital may lead to greater potential financial fragility andalso rupee volatility. India’s growing external exposures can also be attributed to
the increasing integration of the Indian economy with the rest of the world, which is
reflected in both current and capital account transactions. The combined share ofexports and imports of goods increased from 14.2 per cent of GDP in 1990-91 to
about 43.0 per cent in 2011-12. Two way external sector transactions (i.e, gross
current account plus gross capital account flows) have risen from 30.6 per cent ofGDP in 1990-91 to about 108.0 per cent in 2011-12. Therefore, while the
globalization of Indian economy has helped raise growth, it has also meant greatervulnerability to external shocks. A focus on domestic macroeconomic rebalancing
will help reduce vulnerability.
GLOBAL ECONOMY
6.2 There are early signs of a turnaround in theglobal economy. A series of measures by the eurozone authorities and the European Central Bank haveallayed fears of an imminent meltdown. The fiscalcliff in the US has been deferred, albeit temporarily,and there are green shoots of recovery in China andIndia. As a result, growing investor optimism hastranslated into ‘risk on’ behaviour, which has led toa surge in capital flows to emerging economies. Therenewed confidence has also led to ‘great rotation’,with investors shifting money from ‘safe haven’government securities to equities in search for yield.The change is reflected in the equity market boomin advanced and emerging economies. Howeverdoubts still exist about the sustainability of therecovery. The eurozone still faces problems suchas the continuing recession; the existence of amonetary union without fiscal union; the slowprogress of the proposed European banking union;the continuing need for austerity in many advanced
economies. In addition, fiscal tensions in the UnitedStates might re-surface in the next few months.Japan has still to find a reasonable way out of itsdecade long slump. Emerging markets continue toface problems of overheating. All these cast ashadow on the prospects of the global economy.
6.3 The Indian economy is exhibiting early signsof recovery, as indicated by improvements inpurchasing managers index (PMI), moderation ininflation, return of investor confidence through surgein portfolio investment flows and buoyant equitymarkets. The balance of payments, however, isunder strain with current account deficit (CAD)widening to 4.6 per cent of GDP in the first half of2012-13, after touching 4.2 per cent in 2011-12. TheCAD is being financed by capital flows and not byrunning down reserves. However, a sizeable shareof capital is in the nature of Foreign InstitutionalInvestors (FIIs) investment that could moderate oreven reverse if investors switch to risk-off mode.The balance of payments position therefore is more
http://indiabudget.nic.in
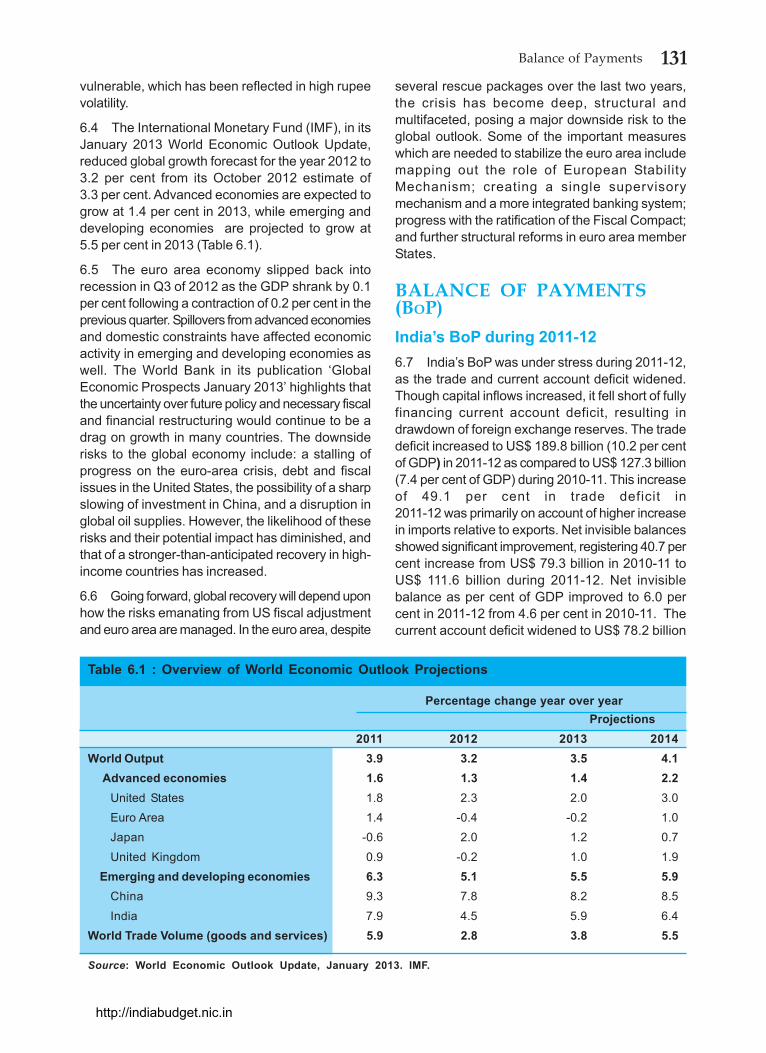
131Balance of Payments
vulnerable, which has been reflected in high rupeevolatility.
6.4 The International Monetary Fund (IMF), in itsJanuary 2013 World Economic Outlook Update,reduced global growth forecast for the year 2012 to3.2 per cent from its October 2012 estimate of3.3 per cent. Advanced economies are expected togrow at 1.4 per cent in 2013, while emerging anddeveloping economies are projected to grow at5.5 per cent in 2013 (Table 6.1).
6.5 The euro area economy slipped back intorecession in Q3 of 2012 as the GDP shrank by 0.1per cent following a contraction of 0.2 per cent in theprevious quarter. Spillovers from advanced economiesand domestic constraints have affected economicactivity in emerging and developing economies aswell. The World Bank in its publication ‘GlobalEconomic Prospects January 2013’ highlights thatthe uncertainty over future policy and necessary fiscaland financial restructuring would continue to be adrag on growth in many countries. The downsiderisks to the global economy include: a stalling ofprogress on the euro-area crisis, debt and fiscalissues in the United States, the possibility of a sharpslowing of investment in China, and a disruption inglobal oil supplies. However, the likelihood of theserisks and their potential impact has diminished, andthat of a stronger-than-anticipated recovery in high-income countries has increased.
6.6 Going forward, global recovery will depend uponhow the risks emanating from US fiscal adjustmentand euro area are managed. In the euro area, despite
several rescue packages over the last two years,the crisis has become deep, structural andmultifaceted, posing a major downside risk to theglobal outlook. Some of the important measureswhich are needed to stabilize the euro area includemapping out the role of European StabilityMechanism; creating a single supervisorymechanism and a more integrated banking system;progress with the ratification of the Fiscal Compact;and further structural reforms in euro area memberStates.
BALANCE OF PAYMENTS(BOP)India’s BoP during 2011-126.7 India’s BoP was under stress during 2011-12,as the trade and current account deficit widened.Though capital inflows increased, it fell short of fullyfinancing current account deficit, resulting indrawdown of foreign exchange reserves. The tradedeficit increased to US$ 189.8 billion (10.2 per centof GDP) in 2011-12 as compared to US$ 127.3 billion(7.4 per cent of GDP) during 2010-11. This increaseof 49.1 per cent in trade deficit in2011-12 was primarily on account of higher increasein imports relative to exports. Net invisible balancesshowed significant improvement, registering 40.7 percent increase from US$ 79.3 billion in 2010-11 toUS$ 111.6 billion during 2011-12. Net invisiblebalance as per cent of GDP improved to 6.0 percent in 2011-12 from 4.6 per cent in 2010-11. Thecurrent account deficit widened to US$ 78.2 billion
Table 6.1 : Overview of World Economic Outlook Projections
Percentage change year over yearProjections
2011 2012 2013 2014World Output 3.9 3.2 3.5 4.1 Advanced economies 1.6 1.3 1.4 2.2
United States 1.8 2.3 2.0 3.0Euro Area 1.4 -0.4 -0.2 1.0Japan -0.6 2.0 1.2 0.7United Kingdom 0.9 -0.2 1.0 1.9
Emerging and developing economies 6.3 5.1 5.5 5.9China 9.3 7.8 8.2 8.5India 7.9 4.5 5.9 6.4
World Trade Volume (goods and services) 5.9 2.8 3.8 5.5
Source: World Economic Outlook Update, January 2013. IMF.
http://indiabudget.nic.in

132 Economic Survey 2012-13
(4.2 per cent of GDP) as compared with US$ 48.1billion (2.8 per cent of GDP) in 2010-11. Net capitalinflows were higher at US$ 67.8 billion (3.6 per centof GDP) in 2011-12 as compared to US$ 63.7 billion(3.7 per cent of GDP) in 2010-11, mainly due to higherFDI inflows and NRI deposits. As the capital accountsurplus fell short of financing current account deficit,there was a drawdown of reserves (on BoP basis) tothe extent of US$ 12.8 billion during 2011-12 asagainst an accretion of US$ 13.1 billion in 2010-11.
6.8 As per the latest available data for the first half(H1- April-September 2012) of 2012-13, India’sbalance of payments continued to be under stress.
This is reflected in the higher current account deficitin H1 (April-September) of 2012-13 than thecorresponding period of the previous year, mainlydue to worsening of trade deficit reflected in sharperdecline in exports than the imports and lowerinvisibles surplus. The net capital flows in absoluteterm, were also lower during H1 of 2012-13 vis-a-visthe corresponding period of 2011-12 (Table 6.2).
Current Account1 during 2011-126.9 During 2011-12, exports crossed the US$ 300billion mark for the first time. The rate of growthhowever, declined to 20.9 per cent to US$ 309.8
Table 6.2 : Balance of Payments : Summary (US$ million)
Sl. Item 2007-08 2008-09 2009-10 2010-11PR 2011-12P 2011-12 2012-13No. H1 (April- H1 (April-
Sept. Sept.2011)PR 2012)P
1 2 3 4 5 6 7 8 9I Current Account1 Exports 166,162 189,001 182,442 256,159 309,774 158,202 146,5492 Imports 257,629 308,520 300,644 383,481 499,533 247,739 237,2213 Trade Balance -91,467 -119,519 -118,203 -127,322 -189,759 -89,537 -90,6724 Invisibles (net) 75,731 91,604 80,022 79,269 111,604 53,103 51,699
A Non-factor Services 38,853 53,916 36,016 44,081 64,098 30,409 29,572B Income -5,068 -7,110 -8,038 -17,952 -15,988 -7,587 -10,510C Transfers 41,945 44,798 52,045 53,140 63,494 30,281 32,637
5 Goods and Services Balance -52,614 -65,603 -82,187 -83,241 -125,661 -59,128 -61,1006 Current Account Balance -15,737 -27,914 -38,181 -48,053 -78,155 -36,433 -38,973II Capital Account
Capital Account Balance 106,585 7,395 51,634 63,740 67,755 43,490 39,989i. External Assistance (net) 2,114 2,439 2,890 4,941 2,296 640 15ii. External Commercial
Borrowings (net) 22,609 7,861 2,000 12,160 10,344 8,388 1,726iii. Short-term debt 15,930 -1,985 7,558 12,034 6,668 5,940 9,511iv Banking Capital (net)] 11,759 -3,245 2,083 4,962 16,226 19,714 14,899
of which:Non-Resident Deposits (net) 179 4,290 2,922 3,238 11,918 3,937 9,397
v Foreign Investment (net) 43,326 8,342 50,362 42,127 39,231 17,087 18,608of which:A FDI (net) 15,893 22,372 17,966 11,834 22,061 15,741 12,812B Portfolio (net) 27,433 -14,030 32,396 30,293 17,170 1,346 5,796
vi Other Flows (net) 10,847 -6,016 -13,259 -12,484 -7,008 -8,278 -4,769III Errors and Omission 1,316 440 -12 -2,636 -2,432 -1,338 -653IV Overall Balance 92,164 -20,080 13,441 13,050 -12,831 5,719 363V Reserves change
[increase (-) / decrease (+)] -92,164 20,080 -13,441 -13,050 12,831 -5,719 -363
Source : RBI. PR : Partially Revised. P : Preliminary.
1 As per the sixth edition of Balance of Payments Manual (BPM 6, 2009) of the IMF, the current account of the BoPincludes all the transaction (other than those in financial items) involving exchange of economic value which takesplace between resident and non-resident entities.
http://indiabudget.nic.in

133Balance of Payments
billion against 40.5 per cent (US$ 256.2 billion) in2010-11. Exports at US$ 158.2 billion performedwell in first half (H1–April-September 2011) of 2011-12 vis-a-vis exports of US$112.0 billion in H1 of 2010-11. There was, however, significant deceleration inexports during second half (H2- October 2011 –March 2012) of 2011-12 to US$ 151.6 billion (US$144.2 billion in H2 of 2010-11). This was on accountof deterioration in global trading conditions reflectingweakening of world demand inter-alia caused by eurozone crisis. Imports valued at US$ 499.5 billion,recorded 30.3 per cent increase in 2011-12 over US$383.5 billion in 2010-11. The growth in imports during2011-12 was mainly due to higher growth in importsof petroleum, oil and lubricants (POL), gold and silverand machinery. Oil imports grew by about 47 percent, while gold and silver registered a growth of 49per cent in 2011-12. Imports of oil and precious metal(gold and silver) together accounted for nearly 45per cent of total imports in 2011-12. The trade deficitincreased to US$ 189.8 billion (10.2 per cent of GDP)in 2011-12 as compared to US$ 127.3 billion (7.4per cent of GDP) during 2010-11. Higher growth inimports than exports was responsible for thewidening of the trade deficit in 2011-12.
6.10 The net invisible balances2 showed significantimprovement, registering 40.7 per cent increase toUS$ 111.6 billion during 2011-12 from US$ 79.3 billionin 2010-11, due to increase in invisibles receipts whileinvisible payments witnessed a decline. The invisiblereceipts increased by 15.1 per cent to US$ 219.2billion in 2011-12 as compared to US$ 190.5 billionduring 2010-11, mainly driven by services exports(comprising travel, transportation, insurance,Government not included elsewhere (GNIE), softwareand non-software), which recorded a growth of 14.2per cent during 2011-12 (as against of 29.8 per centin 2010-11). Invisibles payments decreased by 3.2per cent to US$ 107.6 billion during 2011-12 (US$111.2 billion during 2010-11), mainly reflecting lowerservices payments.
6.11 Services exports increased to US$ 142.3 billionin 2011-12 from US$ 124.6 in 2010-11. Though theincrease in services exports was broad-based, it was
more prominent in case of insurance, transportation,travel and software services. Receipts on account ofsoftware services witnessed a rise, mainly onaccount of improved efficiency and diversified exportsdestinations. Software receipts at US$ 62.2 billion,accounting for nearly 43.7 per cent of total servicesreceipts, showed an increase of 17.1 per cent in2011-12. Payment on account of services importswitnessed a decline from US$ 80.6 billion in2010-11 to US$ 78.2 billion in 2011-12, primarily onaccount of decline in the imports of business andsoftware services.
6.12 Among other components of invisibles,transfers, mainly representing private transfers(secondary income as per BPM 6) recorded asignificant increase while income (primary incomeas per BPM 6) showed a decline. Net private transferreceipts, which basically comprise remittances fromIndians working overseas increased by 18.9 percent to US$ 66.1 billion in 2011-12 from US$ 55.6billion in the previous year. Increase in privatetransfers could be attributed to depreciation of rupeein the recent period. In contrast, income (net)showed an outflow of US$ 16.0 billion albeitmarginally lower than the preceding year. Overall,gross invisible receipts, showed a sharp rise of15.1 per cent in 2011-12. Invisible payments declinedby 3.2 per cent to US$ 107.6 billion in 2011-12 fromUS$ 111.2 billion in 2010-11. The decline inpayments was mainly on account of lower importsof software and business services and investmentincome payments. Net invisible balance as percent of GDP improved to 6.0 per cent in 2011-12from 4.6 per cent in 2010-11.
6.13 The Goods and Services deficit (i.e. TradeBalance plus Services) increased substantially by51.1 per cent to US$ 125.7 billion (6.7 per cent ofGDP) during 2011-12 as compared to US$ 83.2 billion(4.9 per cent of GDP) during 2010-11. The CADwidened to its highest ever level both in absoluteterms as well as a proportion of GDP in 2011-12.The CAD in 2011-12 at US$ 78.2 billion was 4.2 percent of GDP as compared with US$ 48.1 billion or2.8 per cent of GDP in 2010-11 (Figure 6.1).
2 BPM 6 has strengthened the classification between goods and services by solely following the principle of changeof ownership in the case of goods and time of providing in case of services for recording the respective transactionsand accordingly, classified services under 12 heads. While the “goods and services account” shows transactions initems that are outcome of production activities, the income account shows income receivables and payables in returnfor providing temporary use of factors of production (i.e., primary income such as investment income and compensationof employees) and redistribution of income through current transfers (i.e. secondary income, such as personaltransfers and current external assistance). The BPM 6 has introduced two accounts, namely, “primary income account”and “secondary income account”.
http://indiabudget.nic.in

134 Economic Survey 2012-13
Current Account during H1 of 2012-136.14 In the first Half (H1 - April-September 2012) of2012-13, there was a steep decline in exports toUS$ 146.5 billion, registering a 7.4 per cent declineover US$ 158.2 billion in H1 of 2011-12. Commodity-wise data show that growth in exports of engineeringgoods, petroleum products, textile products, gems& jewellery and chemical & related products wereseverely affected as the demand conditions in keymarkets like the US and Europe continued to remainsluggish. During H1 of 2012-13, EU accounted fornearly 27 per cent of the total decline in merchandiseexports, followed by Singapore (19 per cent), China(13 per cent) and Indonesia (6 per cent). Lowergrowth in export oriented Asian economies causedby setbacks to the global recovery has clearlyweighed on India’s external demand from theseeconomies. Detailed analysis is given in the chapteron international trade. Like exports, there was declineof 4.2 per cent in imports to US$ 237.2 billion in H1of 2012-13 from US$ 247.7 billion during thecorresponding period in previous year. The steep fallin exports than that in imports was responsible forwidening of trade deficit to US$ 90.7 billion (10.8 percent of GDP) in H1 of 2012-13 vis-à-vis US$ 89.5billion (9.9 per cent of GDP) in H1 of 2011-12.
6.15 During H1 (April-September 2012) of2012-13, net surplus under invisibles showed adecline of 2.6 per cent as outflows on account ofpayments under invisibles increased considerably.Growth in invisible receipts decelerated to4.7 per cent, mainly due to lower growth in exportsof services, private transfers and decline ininvestment income. Lower growth in exports of
software services accompanied by decline in exportsof travel, transport and insurance services led to agrowth of 4.3 per cent in service exports in H1 of2012-13, substantially lower than 22.7 per cent inthe corresponding period of 2011-12. Lower growthin receipts under invisibles was also caused by lowergrowth in private transfers and decline in incomereceipts. Within income receipts, investment incomedeclined by 19.1 per cent to US$ 3.5 billion duringH1 of 2012-13 reflecting the lower level of interestrates abroad. In contrast to lower growth in receiptsunder invisibles, payments under invisibles recordedan increase of 12.3 per cent in H1 of 2012-13, asagainst a decline of 0.8 per cent in H1 of 2011-12. Inparticular, payment on account of business servicesshowed a sharp increase as compared with a declinein H1 of 2011-12. Investment income payments roseby 17.6 per cent to US$ 14.5 billion during H1 of2012-13 on account of rising external liabilities. Netsecondary income receipts, which primarilycomprise private transfers, increased by 8.2 per centto US$ 32.9 billion during H1 of 2012-13 comparedto US$ 30.4 billion a year ago. During H1 of2012-13, net invisible balance declined to US$ 51.7billion (6.2 per cent of GDP) from US$ 53.1 billion(5.9 per cent of GDP) in H1 of 2011-12.
6.16 Goods and Services deficit at US$ 61.1 billionin H1 of 2012-13 recorded an increase of 3.4 percent from US$ 59.1 billion during H1 of 2011-12. India’sCAD worsened further in H1; CAD was US$ 39.0billion (4.6 per cent of GDP) during H1 of 2012-13 ascompared to US$ 36.4 billion (4.0 per cent of GDP)in H1 of 2011-12. Besides global factors, the increasein the CAD to GDP ratio was also because of slower
http://indiabudget.nic.in

135Balance of Payments
GDP growth and its contraction in dollar terms dueto the depreciation of rupee (Figure 6.2 & Box 6.1).
6.17 As per the latest data available from theMinistry of Commerce, exports of US$ 214.1 billionduring April-December 2012, registered a decline of5.5 per cent over export of US$ 226.6 billion duringthe same period in 2011-12. Imports of US$ 361.3billion recorded a marginal decline of 0.7 per centduring April-December 2012 over the figure of US$363.9 billion during the corresponding period ofprevious year. As a result of steeper decline in
exports than imports, trade deficit increased by 7.2per cent to US$ 147.2 billion during April-December2012 as compared to US$ 137.3 billion in April-December 2011.
Capital Account and Financial Account3
during 2011-126.18 The capital account which includes,inter alia, official transfer, net acquisition of non-produced non-financial assets and other capitalreceipts including migrant transfers showed a small
Box 6. 1 : Impact of Euro Zone Crisis on Current AccountThe unfolding of euro zone crisis, the austerity measures in advanced economies, recession in many euro zone countries, riskon/ risk off behaviour of investors and the uncertainty surrounding the future of euro zone have adversely affected the globaleconomy.The fallout for the Indian economy has been a sharp deceleration in exports and a slowdown in GDP growth. Import demandhowever has remained resilient because of the continued high international oil prices that did not decline, unlike whathappened after the Lehman meltdown of September, 2008. The high value of gold imports, driven mainly by the 'safe haven'demand for gold that has led to a sharp rise in prices, contributed to the high import bill and widening of the trade deficit.The trade deficit, as a result, increased to US$ 189.8 billion in 2011-12, which was 10.2 per cent of the GDP. With invisiblesurplus of US$ 111.6 billion (6.0 per cent of GDP), the current account deficit widened to record 4.2 per cent of GDP. This isunlike the situation during the 2008 crisis, when the high trade deficit of 9.8 per cent of GDP in 2008-09, was partly offset byan invisible surplus of 7.5 per cent, lowering CAD to 2.3 per cent of GDP.The signs of strain on BoP continued in the first half of 2012-13 (April-September 2012) with the trade deficit of US$ 90.7billion increasing to 10.8 per cent of GDP and CAD of US$ 39.0 billion at 4.6 per cent of GDP. The high CAD has hadimplications for rupee volatility and business confidence in the economy. A positive development is that high CAD has latelybeen financed by capital inflows, which explains why the downhill movement of rupee, witnessed till July 2012, has beenlargely arrested. There has however been high dependence on volatile portfolio flows and external commercial borrowings.This makes capital account vulnerable to a 'reversal' and 'sudden stop' of capital, especially in times of stress.
3 According to BPM 6, the capital account comprises capital transfers receivable and payable between residents andnon-residents and the acquisition and disposal of non-produced non-financial assets between residents and non-residents. The financial account records transactions relating to financial assets and liabilities and that take placebetween residents and non-residents. Some of the major components of financial accounts include direct investment,portfolio investment, financial derivates (other than reserves) and employees stock options, other investments, reserveassets (monetary gold), equity and investment fund shares, debt instruments and other financial assets and liabilities.The overall balance on the financial account is called net lending/net borrowing depending on the outflow or inflowof resources.
http://indiabudget.nic.in

136 Economic Survey 2012-13
Box 6. 2 : Risk on/Risk off Behaviour and Capital Flows to India The main fallout of euro zone crisis is global uncertainty. This has led to investors' alternating between risk-on/risk-offbehaviour, with consequent implications for surge and reversal of capital to emerging economies. A risk-on, prompted bynew policy initiatives, creates a favourable disposition towards emerging economy investment, leading to surge in FIIs flowsand vice versa.
While change in investor attitude is generally observable in the long-run, the fallout of euro zone crisis has been quick shiftbetween risk-on/risk-off behaviour that has immediate implications for capital flows. An additional factor has been quantitativeeasing in the US. This increases the supply of liquidity in the system and together with low interest environ and better growthprospects in emerging economies, contributes to increase in capital flows.
A closer look at the global risk-on/off events and FII flows to India shows strong correlation between such events and surgeand reversal of capital. For example, the US credit rating downgrade in early August 2011, together with worsening of eurocrisis, created a risk-off environment. As a result, there was net withdrawal of FII investment of US$ 3.7 billion duringAugust-October, 2011.
The Long Term Refinancing Operation (LTRO) of European Central Bank that injected more than euro 1 trillion in the bankingsystem in two tranche in December, 2011 and February, 2012 again created a risk-on environ. As a result, there was a net FIIinflow of US$ 16.9 billion during December 2011-February 2012. The investor euphoria soon evaporated as the euro crisisworsened and the spectre of Greek exit loomed. Consequently, the investor behaviour again became risk-off, leading to net FIIoutflow of US$ 2.3 billion during March-June 2012.
The investment climate began improving in July, 2012 with (i) announcement by European Central Bank President that theeuro would be saved at all cost; (ii) proposal to set-up Banking Union in the euro zone; (iii) launch of permanent EuropeanStability Mechanism and (iv) launch of QE3 in US. The resulting risk-on atmosphere has seen a net FII inflow of US$ 10.8billion during July-October, 2012.
outflow of US$ 0.06 billion in 2011-12 vis-à-vis inflowof US$ 0.04 billion in 2010-11. In the first half of2012-13, there was also an outflow of US$ 0.5 billion.During 2011-12, both gross inflows of US$ 478.8billion and outflows of US$ 411.1 billion under thecapital account (old format) were lower than thoseof US$ 503.7 billion and US$ 439.9 billion in thepreceding year 2010-11. However, net inflows of US$67.8 billion under the capital account (bifurcated intocapital account and financial account under BPM6)were moderately higher than that of US$ 63.7 billionin 2010-11. This was primarily on account of a revivalin FDI flows to India, a surge in NRI deposits andhigher overseas borrowings by banks. However, therewas a decline in inflows under FII investments, ADRs/GDRs, external assistance, ECBs and short termtrade credit. Risk on/risk off behaviour significantlyinfluenced capital flows (Box 6.2) to India.
6.19 Even though the FDI to India (inward FDI) ofUS$ 33.0 billion in 2011-12 was significantly higherthan US$ 29.0 billion in the preceding year, net inflowson account of portfolio investments at US$ 17.4 billionwere lower as compared to US$ 31.5 billion in2010-11 reflecting trend towards risk aversion amongFIIs due to global economic uncertainty. Rise ininward FDI reflected flows received under BP-Reliance deal of US$ 7.0 billion in 2011-12. Sector-wise, manufacturing, construction, financial services,business services and communication services
received significant amount of inflows. Country-wise,investment routed through Mauritius remained, asin the past, the largest component, followed bySingapore and the UK. FDI by India (i.e., outwardFDI) in net terms moderated by 37.0 per cent toUS$ 10.9 billion in 2011-12 compared to US$ 17.2billion a year ago. Sector-wise, moderation in outwardFDI was observed in agriculture, hunting, forestry &fishing, financial insurance, real estate & businessservices, manufacturing and wholesale, retail trade,restaurants & hotels. Furthermore, sectors, viz.financial, insurance, real estate & business servicesand manufacturing continued to account for morethan 50 per cent of total outward FDI during2011-12. Net FDI (inward FDI minus outward FDI) atUS$ 22.1 billion in 2011-12 showed a significantincrease of about 87.0 per cent as against US$ 11.8billion in 2010-11.
6.20 Among the debt creating capital flows, netflows under NRI deposits of US$ 11.9 billion surgedmore than three-fold in 2011-12 vis-à-vis US$ 3.2billion in 2010-11 because of the higher interest ratesprevailing in India. Net flows under externalcommercial borrowing and trade credit showed adecline in 2011-12 vis-à-vis 2010-11. In net terms,capital inflows increased moderately by 6.4 per centto US$ 67.8 billion (3.6 per cent of GDP) in 2011-12as compared with US$ 63.7 billion (3.7 per cent ofGDP) during 2010-11. Since net capital inflows were
http://indiabudget.nic.in

137Balance of Payments
inadequate to finance the higher CAD recorded during2011-12, there was a net drawdown of foreignexchange reserves to the extent of US$ 12.8 billionduring the same period.
Capital and Financial Account during H1 of2012-136.21 Both gross inflows of US$ 219.5 billion andoutflows of US$ 179.5 billion under the financialaccount were lower in H1 of 2012-13 as comparedwith gross inflow of US$ 246.4 billion and outflow ofUS$ 202.9 billion in the same period a year ago. Innet terms also, financial inflows declined to US$ 40.0billion in H1 of 2012-13 as against US$ 43.5 billionin H1 of 2011-12. As regards the pattern of capitalinflows during H1 of 2012-13, there has been a mixedtrend. Inward FDI to India at US$ 16.2 billion duringH1 of 2012-13 decreased by 26.0 per cent comparedto US$ 21.9 billion in H1 of 2011-12. Outward FDI byIndia was US$ 3.4 billion in April-September 2012as against the US$ 6.1 billion in April-September2011. The net FDI (inward minus outward) to Indiawas US$ 12.8 billion during first half of 2012-13 vis-a-vis US$ 15.7 billion during the corresponding periodof previous year. However, recent measures taken byGovernment regarding liberalisation of FDI limits are
likely to improve investment sentiment and to boostFDI flows into the Indian economy. Scope for furtherliberalization of FDI norms however remains (Box 6.3).
6.22 Net portfolio flows including FIIs showed aquantum jump to US$ 5.8 billion during H1 of2012-13 as against US$ 1.3 billion in H1 of 2011-12.Among debt creating flows, NRI deposits remainedrobust at US$ 9.4 billion in H1 of 2012-13 (US$ 3.9billion in H1 of 2011-12) but net flows under ECBsdeclined sharply by about 80.0 per cent to US$ 1.7billion during H1 of 2012-13 from US$ 8.4 billion inH1 of 2011-12. However, unlike in H1 of 2011-12, netflows under trade credit showed an increase of nearly60 per cent to US$ 9.5 billion during April-September2012 as against US$ 5.9 billion during thecorresponding period of 2011-12. Net accretion toreserves (on a BoP basis) during H1 of 2012-13 at0.4 billion was substantially lower as compared toUS$ 5.7 billion in H1 of previous year. BoP numbersare given at Appendix 6.2 (old format) and 6.3 (newformat)
6.23 As per the latest available information oncapital inflows, FDI flows to India stood at US$ 22.2billion during April-December 2012, which is22.1 per cent lower than US$ 28.5 billion during
Box 6.3 : Liberalization of FDI normsForeign Direct Investment (FDI) is preferred to the foreign portfolio investments primarily because FDI is expected to bringmodern technology, managerial practices and is long term in nature investment. The Government has liberalized FDI normsovertime. As a result, only a handful of sensitive sectors now fall in the prohibited zone and FDI is allowed fully or partiallyin the rest of the sectors.
Despite successive moves to liberalize the FDI regime, India is ranked fourth on the basis of FDI Restrictiveness Index (FRI)compiled by OECD. FRI gauges the restrictiveness of a country's FDI rules by looking at the four main types of restrictionsviz. foreign equity limitations; screening or approval mechanism; restrictions on the employment of foreigners as keypersonnel; and operational restrictions. A score of 1 indicates a closed economy and 0 indicates openness. FRI for India in2012 was 0.273 (it was 0.450 in 2006 and 0.297 in 2010) as against OECD average of 0.081. China is the most restrictivecountry as it is ranked number one with the score of 0.407 in 2012 indicating that it has more restriction than India.
As there is moderation in FDI inflows to India in the current fiscal vis-à-vis last year it is imperative therefore to rationalizeFDI norms further.
At present, defence sector is open to FDI subject to 26 per cent cap. It also requires FIPB approval and is subject to licensingunder Industries (Development & Regulation) Act, 1951 and guidelines on FDI in production of arms & ammunition. Withinthe 26 per cent cap, FII is also permissible subject to the proviso that overall cap is not breached. India needs to open up thedefence production sector to get access and ensure transfer of technology. The existing FDI policy for defence sector providesfor offsets policy. The offsets policy has been revised recently but its direct and indirect benefits have not had visible impacton the domestic defence industry. There is a strong case for a hike in the 26 per cent FDI limit in the defence production sector.By beginning to produce defence goods that advanced countries currently produce, there is scope for productivity improvement,strengthening of manufacturing, generation of employment and lowering of imports in the country.
There is need to review increasing of FDI cap in insurance and public sector banks. By raising cap to 49 per cent in theinsurance sector, there is scope for substantial growth in the coming years. Competition and adoption of best practices couldstrengthen this sector, reduce the premium and expand the services to the vast untapped rural India. This sector could be oneof the major sources of long-term investment in infrastructure. Similarly, FDI limit in public sector banks could be increasedto 26 per cent. Further, there is also a need to review existing approval mechanisms, operational restrictions and conditionsin other sectors to attract foreign investment.
http://indiabudget.nic.in

138 Economic Survey 2012-13
April-December 2011. Up to December 2012, net FIIflows amounted to at US$ 16.0 billion (US$ 2.7 billionduring the corresponding period of 2011-12). FII flowsin recent months witnessed improvement, reflectingthe impact of various reform measures announcedby the Government.
FOREIGN EXCHANGE RESERVES
6.24 India's foreign exchange reserves compriseforeign currency assets (FCA), gold, special drawingrights (SDRs) and reserve tranche position (RTP) inthe International Monetary Fund (IMF). The level offoreign exchange reserves is largely the outcome ofthe Reserve Bank of India (RBI) intervention in theforeign exchange market to smoothen exchange ratevolatility and valuation changes due to movement ofthe US dollar against other major currencies of theworld. Foreign exchange reserves are accumulatedwhen there is absorption of the excess foreignexchange flows by the RBI through intervention inthe foreign exchange market, aid receipts, interestreceipts and funding from the International Bank forReconstruction and Development (IBRD), AsianDevelopment Bank (ADB), International DevelopmentAssociation (IDA) etc.
6.25 Foreign currency assets are maintained inmajor currencies like the US dollar, euro, poundsterling, Canadian dollar, Australian dollar andJapanese yen etc. Both the US dollar and the euroare intervention currencies, though the reserves aredenominated and expressed in the US dollar only,which is the international numeraire for the purpose.
The movement of the US dollar against othercurrencies in which FCA are held, therefore impactsthe level of reserves in US dollar terms. The level ofreserves, denominated in US dollars declines whenUS dollar appreciates against major internationalcurrencies and vice versa. The twin objectives ofsafety and liquidity have been the guiding principlesof foreign exchange reserves management in Indiawith return optimization being embedded strategywithin this framework.
6.26 Beginning from a low level of US$ 5.8 billionat end-March 1991, India's foreign exchange reservesincreased gradually to US$ 25.2 billion by end-March1995, US$ 38.0 billion by end-March 2000, US$113.0 billion by end-March 2004 and US$ 199.2 billionby end-March 2007. The reserves stood at US$314.6 billion at end-May 2008 before declining toUS$ 252.0 billion at the end of March 2009. Thedecline in reserves in 2008-09 was inter alia a falloutof the global crisis and strengthening of the US dollarvis-à-vis other international currencies. Foreignexchange reserves increased to US$ 279.1 billionat end-March 2010, mainly on account of valuationgain as the US dollar depreciated against most ofthe major international currencies. In fiscal 2010-11,the reserves again showed an increasing trend,reaching US$ 304.8 billion at end-March 2011. Infiscal 2011-12, they reached all-time high of US$322.0 billion at end-August 2011. However, theydeclined thereafter and stood at US$ 294.4 billion atend-March 2012. Details of foreign exchangereserves, component wise, since 1950-51 in rupeeand US dollar are given at Appendix 6.1 (A) and 6.1 (B)
Table 6.3 : Summary of Changes in Foreign Exchange Reserves (US$ billion)Sl. Year Foreign exchange Total Increase(+)/ Increase/decrease Increase/decreaseNo. reserves at the decrease (-) in in reserves in reserves due
end of financial reserves on a BoP to valuation year (end March) basis effect
1 2 3 4 5 6
1 2007-08 309.7 110.5 92.2 18.3(83.4) (16.6)
2 2008-09 252.0 - 57.7 -20.1 - 37.6(34.8) (65.2)
3 2009-10 279.1 27.1 13.4 13.7(49.4) (50.6)
4 2010-11 304.8 25.7 13.1 12.6(51.0) (49.0)
5 2011-12 294.4 - 10.4 - 12.8 2.4(123.0) (-23.0)
6 2012-13 294.8 0.4 0.3 0.1(up to Sept. 2012) (75.0) (25.0)
Source : RBI.Note : Figures in parentheses indicate percentage shares of total change.
http://indiabudget.nic.in

139Balance of Payments
Box 6.4 : Building up Foreign Exchange ReservesThe distinction between convertible and non-convertible currencies is important for emerging economies, as most transactionswith the rest of the world are in convertible currencies like US dollar, euro, pound sterling, yen, Swiss Franc etc. The need forincreasing the availability of convertible currency for self-insurance has also been behind the race to build-up foreign exchangereserves (FER) in emerging economies after the Asian Crisis of 1997. Such FER accumulation, however, is constrained by thefact that it is possible only in times of currency appreciation.
Following the BoP crisis of 1990-91 that was essentially due to depletion of foreign exchange reserves, there was a consciouseffort by the RBI to build up FER. This was done through buying foreign currency in the market during periods of surge incapital flows. As a result, FER levels increased from US$ 5.8 billion in 1990-91 to US$ 314.6 billion at end May 2008. The RBIis however following a hands-off policy in foreign exchange market after the 2008 global crisis, with intervention limited tocurbing excess rupee volatility. As a result, during 2009-10 and 2010-11, when rupee was appreciating due to increase incapital flows, there was virtually no intervention to build up FER.
The sharp decline in rupee in 2011-12 however led the RBI to inject foreign exchange to the extent of US$ 20.1 billion to stemthe rupee slide. The pressure on currency has continued in the financial year 2012-13 because of the ongoing euro-zone crisis.The import cover of FER, as a result, has declined from 14.4 months of imports in 2007-08 to 7.1 months in 2011-12. Thereare costs to intervention. The main cost is the release of corresponding rupee liquidity, when RBI intervenes in the market tobuy foreign exchange. This may stoke inflation, which may not appeal in the current inflationary situation.
Past experience however shows that measures like Market Stabilization Scheme (MSS) have been effective in draining excessliquidity from the system. Countries like China and Turkey use cash reserve ratio (CRR) for the same purpose. The cost of aparticular policy, however, has to be weighed against the benefits, which are manifold. First, intervention to buy FER duringsurge in capital leads to build-up of reserves, which provides self-insurance against external vulnerability. Second, the higherreserve levels restore investor confidence and may lead to an increase in foreign direct and portfolio investment flows thatspurs growth and helps bridge the current account deficit. Third, in a scenario of high trade and CAD, as in India, allowingthe currency to appreciate through non-intervention during times of surge in capital, could have further negative fallout forthe BoP by making exports less competitive and imports cheaper. Lastly, buying foreign exchange provides more ammunitionfor intervention when the currency is declining, which could potentially lower currency volatility.
6.27 In 2012-13, the reserves increasedmarginally by US$ 0.4 billion from US$ 294.4 billionat end-March 2012 to US$ 294.8 billion at end-September 2012. Of this total increase, US$ 0.3billion was on BoP basis and US$ 0.1 billion was onaccount of valuation effect. A summary of changesin the foreign exchange reserves since 2007-08, witha breakdown into increase / decrease on BoP basisand valuation effect is presented in Table 6.3.
6.28 In the current fiscal, foreign exchangereserves on month-on-month basis remained in therange of US$ 286.0 billion (at end-May 2012) to US$295.6 billion (at end-December 2012). At end-December 2012, reserves stood at US$ 295.6 billion,indicating a marginal increase of US$ 1.2 billion fromUS$ 294.4 billion at end-March, 2012. At this level,reserves provided about seven months of import cover.Issues relating to build up of foreign exchangereserves are summarized in Box 6.4.
Foreign Currency Assets (FCAs)6.29 FCAs are the major constituent of India'sforeign exchange reserves. FCAs increased by US$1.7 billion from US$ 260.7 billion at end March 2012
to US$ 262.4 billion at end-December 2012. In linewith the principles of preserving the long-term valueof the reserves in terms of purchasing power,minimizing risk and volatility in returns andmaintaining liquidity, the RBI holds FCAs in majorconvertible currencies instruments. These includedeposits of other country central banks, the Bankfor International Settlements (BIS) and top-ratedforeign commercial banks, and in securitiesrepresenting debt of sovereigns and supranationalinstitutions with residual maturity not exceeding10 years, to provide a strong bias towards capitalpreservation and liquidity. The annualized rate ofreturn, net of depreciation, on the multi-currencymulti-asset portfolio of the RBI has shown decliningtrend over the years. It declined from 4.2 per cent in2008-09 to 2.1 per cent in 2009-10, 1.7 per cent in2010-11 and further to 1.5 per cent in 2011-12.
Foreign exchange reserves of othercountries6.30 India continues to be one of the largestholders of foreign exchange reserves. Country-wisedetails of foreign exchange reserves reveal that Indiais the eighth largest foreign exchange reserves holder
http://indiabudget.nic.in
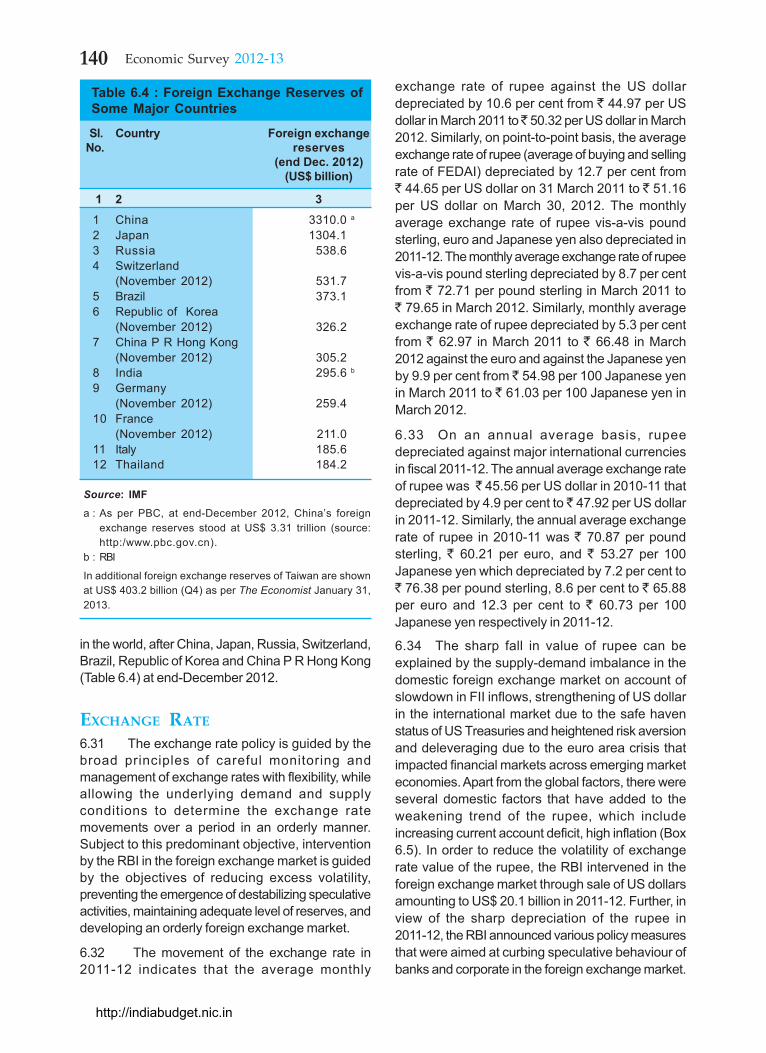
140 Economic Survey 2012-13
in the world, after China, Japan, Russia, Switzerland,Brazil, Republic of Korea and China P R Hong Kong(Table 6.4) at end-December 2012.
EXCHANGE RATE
6.31 The exchange rate policy is guided by thebroad principles of careful monitoring andmanagement of exchange rates with flexibility, whileallowing the underlying demand and supplyconditions to determine the exchange ratemovements over a period in an orderly manner.Subject to this predominant objective, interventionby the RBI in the foreign exchange market is guidedby the objectives of reducing excess volatility,preventing the emergence of destabilizing speculativeactivities, maintaining adequate level of reserves, anddeveloping an orderly foreign exchange market.
6.32 The movement of the exchange rate in2011-12 indicates that the average monthly
exchange rate of rupee against the US dollardepreciated by 10.6 per cent from ` 44.97 per USdollar in March 2011 to ̀ 50.32 per US dollar in March2012. Similarly, on point-to-point basis, the averageexchange rate of rupee (average of buying and sellingrate of FEDAI) depreciated by 12.7 per cent from` 44.65 per US dollar on 31 March 2011 to ̀ 51.16per US dollar on March 30, 2012. The monthlyaverage exchange rate of rupee vis-a-vis poundsterling, euro and Japanese yen also depreciated in2011-12. The monthly average exchange rate of rupeevis-a-vis pound sterling depreciated by 8.7 per centfrom ` 72.71 per pound sterling in March 2011 to` 79.65 in March 2012. Similarly, monthly averageexchange rate of rupee depreciated by 5.3 per centfrom ` 62.97 in March 2011 to ` 66.48 in March2012 against the euro and against the Japanese yenby 9.9 per cent from ̀ 54.98 per 100 Japanese yenin March 2011 to ` 61.03 per 100 Japanese yen inMarch 2012.
6.33 On an annual average basis, rupeedepreciated against major international currenciesin fiscal 2011-12. The annual average exchange rateof rupee was ̀ 45.56 per US dollar in 2010-11 thatdepreciated by 4.9 per cent to ̀ 47.92 per US dollarin 2011-12. Similarly, the annual average exchangerate of rupee in 2010-11 was ` 70.87 per poundsterling, ` 60.21 per euro, and ` 53.27 per 100Japanese yen which depreciated by 7.2 per cent to` 76.38 per pound sterling, 8.6 per cent to ` 65.88per euro and 12.3 per cent to ` 60.73 per 100Japanese yen respectively in 2011-12.
6.34 The sharp fall in value of rupee can beexplained by the supply-demand imbalance in thedomestic foreign exchange market on account ofslowdown in FII inflows, strengthening of US dollarin the international market due to the safe havenstatus of US Treasuries and heightened risk aversionand deleveraging due to the euro area crisis thatimpacted financial markets across emerging marketeconomies. Apart from the global factors, there wereseveral domestic factors that have added to theweakening trend of the rupee, which includeincreasing current account deficit, high inflation (Box6.5). In order to reduce the volatility of exchangerate value of the rupee, the RBI intervened in theforeign exchange market through sale of US dollarsamounting to US$ 20.1 billion in 2011-12. Further, inview of the sharp depreciation of the rupee in2011-12, the RBI announced various policy measuresthat were aimed at curbing speculative behaviour ofbanks and corporate in the foreign exchange market.
Table 6.4 : Foreign Exchange Reserves ofSome Major Countries
Sl. Country Foreign exchange No. reserves
(end Dec. 2012)(US$ billion)
1 2 31 China 3310.0 a
2 Japan 1304.13 Russia 538.64 Switzerland
(November 2012) 531.75 Brazil 373.16 Republic of Korea
(November 2012) 326.27 China P R Hong Kong
(November 2012) 305.28 India 295.6 b
9 Germany(November 2012) 259.4
10 France(November 2012) 211.0
11 Italy 185.612 Thailand 184.2
Source: IMF
a : As per PBC, at end-December 2012, China’s foreignexchange reserves stood at US$ 3.31 trillion (source:http:/www.pbc.gov.cn).
b : RBI
In additional foreign exchange reserves of Taiwan are shownat US$ 403.2 billion (Q4) as per The Economist January 31,2013.
http://indiabudget.nic.in

141Balance of Payments
A number of steps were also taken to facilitate capitalflows and boost exports to augment supply of foreignexchange.
6.35 In the current fiscal, the exchange rate valueof rupee has so far undergone many ups and downs.The monthly average exchange rate of rupee per USdollar mostly remained in the range of ` 54-56 perUS dollar except in the month of April 2012 whenthe rate was ` 51.81 and ` 53.02 in October 2012.In the first quarter of current fiscal 2012-13, monthlyaverage exchange rate of rupee showed depreciatingtrend, going down by 2.9 per cent in April 2012, 4.9per cent in May and 2.8 per cent in June 2012 overthe previous month. In the month of June 2012, therupee touched all-time low of ̀ 57.22 per US dollar(RBI's reference rate) on June 27, 2012 indicating10.6 per cent depreciation over ̀ 51.16 per US dollaron March 30, 2012. In the second quarter of2012-13, monthly average exchange rate of rupeehas appreciated by 1.0 per cent in July 2012 and1.7 per cent in September 2012 over the previousmonth, while in the month of August 2012 it has
marginally depreciated by 0.1 per cent. In the thirdquarter, it appreciated by 3.0 per cent in October2012 and 0.2 per cent in December 2012 while inmonth of November 2012 it depreciated by 3.2 percent over the previous month level.
6.36 The Government of India and the RBI havetaken a number of steps to boost exports andfacilitate capital inflows so as to reduce externalvulnerability. Under the Annual Supplement 2012-13to Foreign Trade Policy 2009-14, the Governmenthas announced initiatives to boost exports. Thegovernment has further liberalised FDI policy,including allowing foreign direct investment in multi-brand retail. Other measures to boost capital inflowsinclude a hike in FII investment in debt securities(both corporate and Government), enhancement ofall-in-cost ceiling for external commercial borrowings(ECBs) between 3-5 year maturity, higher interestrate ceiling for foreign currency non-resident deposits,deregulation of interest rates on rupee denominatedNRI deposits, and administrative steps to curbcurrency speculation.
Box 6.5 : Reasons for High Volatility in Rupee Exchange RateThe rupee has experienced unusually high volatility in the past few months. The currency touched the low of ̀ 57.22 per USdollar on 27th June, 2012, before appreciated to ̀ 51.62 per US dollar on October 05, 2012. It again began declining thereafterand has since been in the range of ` 53-54 per US dollar. Such volatility has introduced a measure of uncertainty in thedomestic market and has impacted business confidence.
The rupee has been under pressure since August 2011, when US sovereign rating was downgraded and the euro zone crisisescalated. The currency went steadily downhill till the end of July, 2012, except for intermitted respite and appreciation inJanuary-February 2012, mainly due to European Central Banks Long Term Refinancing Operation (LTRO) that injected morethan euro 1 trillion in three-year loans to banks and created a risk-on environment.
The rupee fell due to decline in exports on account of euro-zone crisis and widening of trade deficit, as imports remainedresilient due to high oil prices and gold imports. The widening of trade deficit to 10.2 per cent of GDP in 2011-12 had upsetthe supply-demand balance in the domestic foreign exchange market, placing downward pressure on the currency. The tradedeficit has remained high at 10.8 per cent of GDP in the first six months of the current financial year (April-September 2012),with current account deficit at 4.6 per cent of GDP.
Improved capital flows in recent months, particularly FII flows, however have dampened the downward pressure on therupee. Such an increase in portfolio flows is partly due to the risk-on behaviour of investors, following series of policyinitiatives in the euro zone that lowered the 'tail risk' of euro zone disintegration. The launch of quantitative easing (QE3) bythe US Federal Reserve further helped the process. Capital flows have also been attracted by the confidence -inducing effectsof major policy reforms that have been announced recently. The resulting increase in capital flows has more than balanced thewidening current account deficit in recent months, curbing the rupee slide. Volatility however remains high because of highshare of FII flows in total capital flows, and the week-to-week variation in such flows.
Another contributory factor is the fluctuation in the dollar exchange rate vis-a-vis other international currencies. Since bulkof global trade is invoiced and settled in US$ and most capital flows are denominated in US dollar, the volatility in the valueof US dollar exchange rate in the international market has an immediate impact on rupee-US dollar exchange rate. Thus, thefall in the US dollar exchange rate in the international market leads to rupee appreciation, unless offset by widening tradedeficit/ changes in the volume of capital flows and vice-versa.
http://indiabudget.nic.in

142 Economic Survey 2012-13
6.37 Domestic policy measures for attracting FDI,coupled with the announcement of quantitativeeasing by the US Federal Reserve and Bank of Japanin September 2012 contributed to increase in capitalinflows to India leading to strengthening of the rupee.Besides, the RBI sold nearly US$ 3.1 billion during2012-13 (April-December 2012). As a result, the rupeerecovered to ` 51.62 per US dollar on October 05,2012. However, since the second week of October2012, rupee again showed depreciating trend onaccount of concerns relating to high CAD and thedemand for dollars from oil importing firms andcontinued uncertainty in the global financial markets.In December 2012, rupee remained range bound (Rs.54.20-55.09 per US dollar) as FIIs continued to belargely buoyant except on December 21, 2012 whenrupee touched a low of ` 55.09 per US dollar. Themonth-wise exchange rate of the rupee against majorinternational currencies and the RBI's sale/purchaseof foreign currency in the foreign exchange marketduring 2012-13 are shown in Table 6.5.
6.38 The monthly average exchange rate of therupee per US dollar and its appreciation / depreciationduring 2012-13 is depicted in Figure 6.3.
Exchange Rate of Other EmergingEconomies6.39 It may be noted that a depreciatingexchange rate in 2012-13 is not specific to India.The currencies of other emerging economies, suchas Brazilian real, Argentina peso, Russian rouble,and South Africa's rand also depreciated against theUS dollar reflecting the increased demand for dollaras a safe haven asset in the wake of sovereign debtcrisis in the euro zone and due to uncertain globaleconomic environment. On a point-on-pont basisbetween March 30,2012 and December 28, 2012,the Argentina peso has depreciated by 10.9 per cent,Brazilian real by 10.5 per cent, South African randby 9.7 per cent, Indian rupee by 6.7 per cent,Indonesian rupiah by 5.1 per cent and Russian rouble
Table 6.5 : Exchange Rates of Rupee per Foreign Currency and RBI’s Sale/Purchase ofUS Dollar in the Exchange Market during 2012-13
Average exchange rates ( `̀̀̀̀ per foreign currency)a
Month US Dollar Pound Euro Japanese RBI Net sale (-) /sterling Yenb purchase (+)
(US$ million)
1 2 3 4 5 6
2011-12(annual average) 47.9190 76.3809 65.8761 60.7257 (-) 20,138
(-4.9) (-7.2) (-8.6) (-12.3)March 2012 50.3213 79.6549 66.4807 61.0259 -
(-2.3) (-2.5) (-2.1) (2.8)2012-13(monthly average) (-) 3123.0April 2012 51.8121 82.9119 68.1872 63.7934 -275.0
(-2.9) (-3.9) (-2.5) (-4.3)May 2012 54.4736 86.7323 69.6991 68.3286 -485.0
(-4.9) (-4.4) (-2.2) (-6.6)June 2012 56.0302 87.1349 70.3087 70.6743 -50.0
(-2.8) (-0.5) (-0.9) (-3.3)July 2012 55.4948 86.5173 68.2520 70.2809 -785.0
(1.0) (0.7) (3.0) (0.6)August 2012 55.5594 87.3444 68.8750 70.6814 -452.0
(-0.1) (-0.9) (-0.9) (-0.6)September 2012 54.6055 87.8663 70.1263 69.9084 - 10.0
(1.7) (-0.6) (-1.8) (1.1)October 2012 53.0239 85.2128 68.7522 67.2305 - 95.0
(3.0) (3.1) (2.0) (4.0)November 2012 54.7758 87.5374 70.3665 67.6032 - 921.0
(- 3.2) (- 2.7) (- 2.3) (- 0.6)December 2012 54.6478 88.1910 71.6671 65.2805 -50.0
(0.2) (- 0.7) (- 1.8) (3.6)
Source : RBI.Notes : aFEDAI market indicative rates. Data from May 2012 onwards are RBIs reference rates,
bPer 100 Yen; Figures in parentheses indicate appreciation (+) and depreciation (-) over the previousmonth/year in per cent. Figures may not tally due to rounding off.
http://indiabudget.nic.in

143Balance of Payments
by 3.4 per cent. The exchange rate of the rupeevis-à-vis select international currencies since1991-92, year-wise, and during 2012-13, month-wise,is in Appendix 6.4.
Nominal Effective Exchange Rate and RealEffective Exchange Rate6.40 Nominal rupee depreciation, while havingsome adverse effects such as greater importedinflation, is also useful over time in offsetting higherdomestic inflation and ensuring Indian exports remaincompetitive. The nominal effective exchange rate(NEER) and real effective exchange rate (REER)indices are used as indicators of externalcompetitiveness of the country over a period of time.NEER is the weighted average of bilateral nominalexchange rates of the home currency in terms offoreign currencies, while REER is defined as aweighted average of nominal exchange rates,adjusted for home and foreign country relative pricedifferentials. REER captures movements in cross-currency exchange rates as well as inflationdifferentials between India and its major tradingpartners and reflects the degree of externalcompetitiveness of Indian products. The RBI has beenconstructing six currency (US dollar, euro for eurozone, pound sterling, Japanese yen, Chineserenminbi and Hong Kong dollar) and 36 currencyindices of NEER and REER.
6.41 The 6-currency trade-based NEER (base:2004-05=100) depreciated by 9.6 per cent betweenMarch 2011 and March 2012 and by 8.0 per cent
between March 2012 to December 2012. Ascompared to this, the monthly average exchangerate of rupee depreciated by 10.6 per cent betweenMarch 2011 and March 2012, while in current fiscalit depreciated by 7.9 per cent against the US dollarfrom ̀ 50.32 per US dollar in March 2012 to ̀ 54.65per US dollar in December 2012. The 6-currencytrade-based REER (base: 2004-05=100) of the Rupeedepreciated by 5.5 per cent from 115.97 to 109.59between March 2011 and March 2012. During 2012-13 so far (up to December 2012), the 6 currencyindex of 104.56 showed depreciation of 4.6 per centover March 2012 index of 109.59 largely reflectingdepreciation of rupee in nominal terms (Table 6. 6and Appendix 6.5).
US dollar exchange rate in internationalmarket6.42 In so far as international currencies areconcerned, the US dollar appreciated by 2.2 per centagainst the pound sterling, 6.0 per cent against theeuro, and 0.8 per cent against the Japanese yenduring between March 2011 and March 2012.However, it depreciated by 4.2 per cent againstAustralian dollar during the same period. In currentfiscal (up to end-December 2012), the USdollar appreciated by 0.7 per cent against euro,1.4 per cent against Japanese yen and 0.6 per centagainst Australian dollar between March 2012and December 2012. However, US dollardepreciated by 2.0 per cent against pound sterling(Table 6.7).
http://indiabudget.nic.in

144 Economic Survey 2012-13
Table 6.6 : Indices of NEER and REER of the Indian Rupee (Six-Currency Trade- basedWeights) Base 2004-05 (April-March) = 100
Month average NEER Appreciation (+)/ REER Appreciation (+)/depreciation (-) depreciation (-)
NEER over REER over previousprevious period/month
period/month
1 2 3 4 5
March 2011 90.29 115.97
March 2012 81.60 -9.6 109.59 -5.5
2012-13
April 2012 (P) 79.24 -2.9 107.57 -1.8
May 2012 (P) 76.10 -4.0 104.12 -3.2
June 2012 (P) 74.67 -1.9 102.24 -1.8
July 2012 (P) 75.95 1.7 104.16 1.9
August 2012 (P) 75.53 -0.6 104.76 0.6
September 2012 (P) 75.67 0.2 105.75 0.9
October 2012 (P) 77.55 2.5 107.86 2.0
November 2012 (P) 75.33 - 2.9 105.11 - 2.5
December 2012 (P) 75.05 - 0.4 104.56 - 0.5
Source : RBI. P: Provisional
Table 6.7 : Exchange Rate of US Dollar against International Currencies
Month/Year USD/ GBP USD/ Euro JPY /USD USD /AUD
1 2 3 4 5
March 2010 1.5082 1.3543 90.8850 0.9095
March 2011 1.6168 1.3999 81.7936 1.0102
March 2012 1.5817 1.3201 82.4348 1.0543
US$ Appreciation (+) / Depreciation (-)
(March 2011- March 2012) in percent 2.22 6.04 -0.78 -4.182012-13April 2012 1.6009 1.3162 81.4895 1.0350
May 2012 1.5906 1.2800 79.7084 0.9982
June 2012 1.5564 1.2526 79.3214 0.9986
July 2012 1.5589 1.2276 78.9830 1.0293
August 2012 1.5713 1.2400 78.6648 1.0468
September 2012 1.6119 1.2871 78.1678 1.0401
October 2012 1.6083 1.2975 78.9686 1.0293
November 2012 1.5966 1.2820 80.7920 1.0412
December 2012 1.6144 1.3109 83.5778 1.0477
US$ Appreciation (+) /Depreciation (-)
(March 2012-December 2012) in percent -2.03 0.70 1.39 0.63Source: Reserve Bank of India. Note: Exchange rate is based on monthly average.
http://indiabudget.nic.in

145Balance of Payments
EXTERNAL DEBT
6.43 India's external debt stock at end-March2012 stood at US$ 345.4 billion (` 1,765,333 crore)recording an increase of US$ 39.5 billion (12.9 percent) over end-March 2011 level of US$ 305.9 billion(` 1,365,929 crore). Component-wise, long-term debtincreased by 10.9 per cent to US$ 267.2 billion atend-March 2012 from US$ 240.9 billion at end-March2011, while short-term showed an increase of 20.3per cent to US$ 78.2 billion from US$ 65.0 billion atend-March 2011. Appendices 8.4(A) and 8.4(B)present the disaggregated data on India's externaldebt outstanding in Indian rupee and US dollar terms,respectively. India's external debt stock increasedby about US$ 20.0 billion (5.8 per cent) to US$ 365.3billion at end-September 2012 over the level at end-March 2012. The rise in external debt is largely dueto higher NRI deposits, short-term debt andcommercial borrowings. NRI deposits aloneaccounted for 42.1 per cent of the rise in total externaldebt at end-September 2012 over the level of end-March 2012, while short-term debt and commercialborrowings together accounted for 52.6 per cent ofthe rise in debt during the period.
6.44 The maturity profile of India's external debtindicates the dominance of long-term borrowings.Long-term external debt at US$ 280.8 billion at end-September 2012 accounted for 76.9 per cent of thetotal external debt, while the remaining 23.1 per centwas short-term debt. Long-term debt at end-September 2012 increased by US$ 13.6 billion(5.1 per cent) over the level at end-March 2012, whileshort-term debt increased by US$ 6.3 billion
(8.1 per cent). Within long-term, components suchas commercial borrowings, NRI deposits andmultilateral borrowings taken together, accounted for62.1 per cent of total external debt at the end ofSeptember 2012 while other long-term debtcomponents (viz. bilateral borrowings, export credit,IMF and rupee debt) accounted for 14.8 per cent oftotal external debt (Table 6.8).
6.45 The currency composition of India's totalexternal debt shows that the share of US dollardenominated debt continued to be the highest inexternal debt stock at 55.7 per cent at end-September 2012, followed by Indian rupee (22.9 percent), Japanese yen (8.6 per cent), SDR (8.1 percent) and euro (3.2 per cent). The currencycomposition of Government (sovereign) debtindicates pre-dominance of SDR denominated debt(36.6 per cent), which is attributable to borrowingfrom International Development Association (IDA) i.e.,the soft loan window of the World Bank under themultilateral agencies and SDR allocations by theIMF. The share of US dollar denominated debt was26.2 per cent followed by Japanese yen denominated(19.3 per cent), Indian rupee (14.3) and euro (3.6).At end-September 2012, Government (sovereign)external debt was US$ 81.5 billion. It accounted for22.3 per cent of India's total external debt. Non-Government external debt amounted to US$ 283.9billion which was 77.7 per cent of total external debtat end-September 2012.
6.46 Over the years, India's external debt stockhas witnessed structural change in terms ofcomposition. The share of concessional in total debt
Table 6.8 : Composition of External Debt (per cent of total external debt)
Sl. Component March March June SeptemberNo. 2011 PR 2012 PR 2012 PR 2012 QE
1 2 3 4 5 6
1 Multilateral 15.8 14.6 14.3 13.92 Bilateral 8.4 7.7 7.8 7.63 IMF 2.1 1.8 1.7 1.74 Export credit 6.1 5.5 5.5 5.25 Commercial borrowings 28.9 30.4 29.9 29.86 NRI deposit 16.9 17.0 17.5 18.37 Rupee debt 0.5 0.4 0.3 0.48 Long-term debt (1 to 7) 78.8 77.4 76.9 76.99 Short-term debt 21.2 22.6 23.1 23.1
10 Total external debt (8+9) 100.0 100.0 100.0 100.0
Source : Ministry of Finance and RBI. PR : Partially Revised. QE : Quick Estimates.
http://indiabudget.nic.in

146 Economic Survey 2012-13
has declined due to shrinking share of officialcreditors and the Government debt and the surge innon-concessional private debt. The proportion ofconcessional in total debt declined from 42.9 percent (average) during the period 1991-2000 to 28.1per cent in 2001-2010 and further to 13.2 per cent atend-September 2012. The rising share of non-government debt is evident from the fact that suchdebt accounted for 65.6 per cent of total debt duringthe decade of 2000s, vis-a-vis 45.3 per cent in 1990s.Non-Government debt accounted for over 70 per centof total debt in the last five years and stood at 77.7per cent at end-September 2012.
6.47 The key external debt indicators arepresented in Table 6.9. India's foreign exchangereserves provided a cover of 80.7 per cent to thetotal external debt stock at end-September 2012vis-à-vis 85.2 per cent at end-March 2012. The ratioof short-term external debt to foreign exchangereserves was at 28.7 per cent at end-September 2012
as compared to 26.6 per cent at end-March 2012.The ratio of concessional debt to total external debtdeclined steadily and worked out to 13.2 per cent atend-September 2012 as against 13.9 per cent atend-March 2012.
6.48 India's external debt has remained withinmanageable limits as indicated by the external debtto GDP ratio of 19.7 per cent and debt service ratioof 6.0 per cent in 2011-12. The active external debtmanagement policy of the Government of India hashelped in containing rise in external debt andmaintaining a comfortable external debt position. Thepolicy continues to focus on monitoring long andshort-term debt, raising sovereign loans onconcessional terms with longer maturities, regulatingexternal commercial borrowings through end-use,all-in-cost and maturity restrictions; and rationalizinginterest rates on non-resident Indian deposits(Box 6.6).
Table 6.9 : India’s Key External Debt Indicators (per cent)Year External Total Debt- Foreign Concessional Short-term Short-term
debt external service exchange debt to external external(US$ debt to ratio reserves total debt* to debt* to
billion) GDP to total external foreign totalexternal debt exchange debt
debt reserves
1 2 3 4 5 6 7 8
1990-91 83.8 28.7 35.3 7.0 45.9 146.5 10.2
1990-91 83.8 28.7 35.3 7.0 45.9 146.5 10.2
1995-96 93.7 27.0 26.2 23.1 44.7 23.2 5.4
2000-01 101.3 22.5 16.6 41.7 35.4 8.6 3.6
2005-06 139.1 16.8 10.1# 109.0 28.4 12.9 14.0
2006-07 172.4 17.5 4.7 115.6 23.0 14.1 16.3
2007-08 224.4 18.0 4.8 138.0 19.7 14.8 20.4
2008-09 224.5 20.3 4.4 112.1 18.7 17.2 19.3
2009-10 260.9 18.2 5.8 106.8 16.8 18.8 20.1
2010-11 305.9 17.5 4.3 99.6 15.5 21.3 21.2
2011-12 345.4 19.7 6.0 85.2 13.9 26.6 22.6
2012-13
end-June 2012 PR 348.8 - 5.9 83.1 13.5 27.8 23.1
end-Sept. 2012 QE 365.3 - - 80.7 13.2 28.7 23.1
Source : Ministry of Finance and RBI.Notes : - Not worked out for the broken period. PR : Partially Revised QE-Quick Estimates.
*: Short-term debt is based on original maturity.#: Works out to 6.3 per cent, with the exclusion of India millennium deposits (IMDs) repayments of US$ 7.1
billion and prepayment of US$ 23.5 million.Debt-service ratio is the proportion of gross debt servicepayments to external current receipts (net of official transfers).
http://indiabudget.nic.in

147Balance of Payments
Box 6.6 : Risks in Foreign Currency BorrowingsCorporate borrowers in India and other emerging economies are keen to borrow in foreign currency to benefit from lowerinterest and longer terms of credit. Such borrowings however, are not always helpful, especially in times of high currencyvolatility. During good times, domestic borrowers could enjoy triple benefits of (i) lower interest rates, (ii) longer maturityand (iii) capital gains due to domestic currency appreciation. This would happen when the local currency is appreciating dueto surge in capital flows and the debt service liability is falling in domestic currency terms. The opposite would happen whenthe domestic currency is depreciating due to reversal of capital flows during crisis situations, as happened during the 2008global crisis.A sharp depreciation in local currency would mean corresponding increase in debt service liability, as more domesticcurrency would be required to buy the same amount of foreign exchange for debt service payments. This would lead toerosion in profit margin and have mark-to-market implications for the corporate. There would also be 'debt overhang'problem, as the volume of debt would rise in local currency terms. Together, these factors could create corporate distress,especially because the rupee tends to depreciate precisely when the Indian economy is also under stress, and corporaterevenues and margins are under pressure.In this context, it is felt that one of the factors contributing to faster recovery of Indian economy after the 2008 global crisiswas the low level of corporate external debt. As a result, the significant decline in the value of rupee did not have major falloutfor the corporate balance-sheets. Foreign currency borrowings, therefore, have to be contracted carefully, especially when no'natural hedge' is available. Such natural hedge would happen when a foreign currency borrower also has an export marketfor its products. As a result, export receivables would offset, at least to some extent, the currency risk inherent in debt servicepayments. This happens because fall in the value of the rupee that leads to higher debt service payments is partly compensatedby the increase in the value of rupee receivables through exports. When export receivables and the currency of borrowings isdifferent, the prudent approach is for corporations to enter currency swaps to re-denominate asset and liability in the samecurrency to create natural hedge. Unfortunately, too many Indian corporations with little foreign currency earnings leaveforeign currency borrowings unhedged, so as to profit from low international interest rates. This is a dangerous gamble forreasons described above and should be avoided.
Table 6.10 : International Comparison of Top Twenty Developing Debtor Countries, 2011Total Total debt Short-term Foreign
Sl. Countries external to GNI to total exchangeNo. debt stock (per cent) external reserves to
(US$ million) debt total debt(per cent) (per cent)
1 2 3 4 5 6
1 China 685,418 9.4 69.6 467.32 Russian Federation 542,977 31.1 12.9 83.63 Brazil 404,317 16.6 10.4 86.74 India 334,331 18.3 23.3 81.15 Turkey 307,007 40.1 27.3 25.56 Mexico 287,037 25.2 17.9 50.27 Indonesia 213,541 26.0 17.9 49.98 Ukraine 134,481 83.3 24.3 22.69 Romania 129,822 72.3 22.9 33.1
10 Kazakhstan 124,437 77.9 7.2 20.211 Argentina 114,704 26.3 14.5 37.712 South Africa 113,512 28.4 16.6 37.513 Chile 96,245 41.0 17.8 43.614 Malaysia 94,468 34.8 46.3 139.515 Thailand 80,039 24.0 56.2 209.116 Colombia 76,918 24.3 14.1 40.817 Philippines 76,043 33.6 9.2 88.518 Venezuela 67,908 21.8 24.6 14.619 Pakistan 60,182 27.3 4.2 24.120 Vietnam 57,841 49.1 17.2 23.4
Source : World Bank’s International Debt Statistics 2013.Note : Countries are arranged based on the magnitude of debt presented in Column 3 in the Table.
http://indiabudget.nic.in

148 Economic Survey 2012-13
International Comparison6.49 A cross country comparison of external debtof twenty most indebted developing countries, basedon data from the World Bank's 'International DebtStatistics, 2013' which contains the debt numbersfor the year 2011 and has a time lag of two years,showed that in 2011 India was in fourth position interms of absolute external debt stock after China,the Russian Federation and Brazil. The ratio of India'sexternal debt stock to gross national income (GNI)at 18.3 per cent was the third lowest with China'sbeing the lowest at 9.4 per cent (Table 6.10.). Interms of the cover of external debt provided by foreignexchange reserves, India's position was seventhhighest at 81.1 per cent.
CHALLENGES AND OUTLOOK
6.50 The widening of the trade deficit to morethan 10 per cent of GDP and the CAD crossing4 per cent of GDP in 2011-12 and the first half of2012-13 have been matters of concern. In recentyears, net invisible balance reduced the need forfinancing, while capital inflows were sufficient to
finance the CAD safely. In the current fiscal, thegrowth in invisibles is insufficient to narrow thegrowing trade deficit. Besides, the CAD is financedby volatile capital flows, which has led to financialfragility and is reflected in rupee exchange ratevolatility.
6.51 The room to increase exports in the shortrun is limited, as they are dependent upon therecovery and growth of partner countries, especiallyin industrial economies. This may take time. Themain focus has to be on curbing imports, mainly bymaking oil prices more market determined, andcurbing imports of gold. At the same time, furthermeasures to ease the inflow of remittances and stepsto diversify software exports could help reducefinancing needs. Greater emphasis on FDI includingopening up sectors further can help increase thequantum of safe financing. FII flows need to betargeted towards longer term rupee instruments soas to minimize the 'reversal' of capital during risk-offphases. Finally, external commercial borrowingneeds to be monitored carefully so that entitieswithout access to foreign exchange revenues do notleave significant exposures unhedged.
http://indiabudget.nic.in

International TradeCHAPTER
7
After moderating in the two years following the global economic crisis, worldtrade in both goods and services reached and surpassed pre-crisis levels in 2011.However, the deceleration in world growth and trade in 2012 and forecast of onlya gradual upturn in global growth by international institutions, portend a weakand slow recovery for world trade. India's exports, which had surpassed pre-crisislevels within a year in 2010-11 with a record 40.5 per cent growth, continued growingeven in 2011-12, but were finally affected by the global slowdown in 2012-13 withexports declining even more at - 4.9 per cent in the first ten months than the-3.5 per cent recorded during the crisis-ridden year of 2009-10 (full year).
WORLD TRADE
7.2 World merchandise trade value surpassed thepre-crisis (2008) level of US $ 16 trillion, reachingUS $ 18.26 trillion in 2011 after an interregnum oftwo years. However, world trade volume deceleratedsharply to 2.8 per cent in 2012 from 5.9 per cent in2011 and 12.6 per cent in 2010 (Table 7.1).
7.3 World exports fell by 0.2 per cent in the firstthree quarters of 2012 over the corresponding periodsof 2011 as per World Trade Organization (WTO)statistics. As per the January 2013 update of theIMF, world trade volume is projected to grow by 3.8
per cent in 2013 which is down 0.7 percentage pointscompared to its October 2012 update. Import andexport volume growth rates of emerging market anddeveloping economies are however projected to behigher than those of advanced economies. Globaleconomic uncertainty including doubts about theultimate resolution of the crisis in the euro area,doubts about the pace of fiscal withdrawal in theUS, challenges to sustaining growth after theearthquake reconstruction rebound in Japan andtrade disruptions with China, though of a passingnature, continue to cast their shadows on the tradegrowth of emerging and developing economies(EDEs) including India.
Table 7.1 : Trends in growth in trade volumes(per cent change)
Projections
2011 2012 2013 2014
World trade volume (goods and services) 5.9 2.8 3.8 5.5Imports
Advanced economies 4.6 1.2 2.2 4.1Emerging market & developing economies 8.4 6.1 6.5 7.8
ExportsAdvanced economies 5.6 2.1 2.8 4.5Emerging market & developing economies 6.6 3.6 5.5 6.9
Source: International Monetary Fund (IMF), World Economic Outlook Update, January 2013.
http://indiabudget.nic.in

150 Economic Survey 2012-13
INDIA'S MERCHANDISE TRADE
7.4 India's merchandise trade increasedexponentially in the 2000s decade from US$ 95.1billion in 2000-1 to US$ 620.9 billion in 2010-11and further to US$ 793.8 billion in 2011-12. India'sshare in global exports and imports also increasedfrom 0.7 per cent and 0.8 per cent respectively in2000 to 1.7 per cent and 2.5 per cent in 2011 asper the WTO. Its ranking in the leading exportersand importers improved from 31 and 26 in 2000 to19 and 12 respectively in 2011. While India's totalmerchandise trade as a percentage of the grossdomestic product (GDP) increased from 28.2 percent in 2004-5 to 43.2 per cent in 2011-12 as perprovisional estimates, India's merchandiseexports as a percentage of GDP increased from11.8 per cent to 16.5 per cent during the sameperiod.
India's export growth
7.5 Bolstered by the measures taken by thegovernment to help exports in the aftermath of theworld recession of 2008 and also the low base effect,India's export growth in 2010-11 reached an all timehigh since Independence of 40.5 per cent. Though itdecelerated in 2011-12 to 21.3 per cent, it was stillabove 20 per cent and higher than the compoundannual growth rate (CAGR) of 20.3 per cent for theperiod 2004-5 to 2011-12. After registering very highgrowth of 56.5 per cent in July 2011, export growthstarted decelerating with a sudden fall to single digits
in November 2011 as a result of the emerging globalsituation and then to negative figures from March2012. Monthly export growth rates in 2012-13(April-December) were negative except for a marginalpositive growth in April 2012. For three months in2012-13, exports declined YOY by double digits withthe largest decline recorded in July 2012 at -15.1per cent. In January, 2013, there is a marginal positivegrowth of 0.8 per cent.
Export growth and exchange ratechanges
7.6 Export growth in dollar terms was negative at-4.9 per cent in 2012-13 (April-January), comparedto 21.3 per cent growth in 2011-12 (full year). In rupeeterms, it was positive at 9.1 per cent, though heretoo, there was a deceleration from the 28.3 per centin 2011-12 (full year).
7.7 India's export growth has almost continuouslybeen above world export growth in the 2000s decadeand in 2011. One issue that has been a topic ofdebate is whether India's export growth rate isdependent on world growth/trade or exchange rate.There is a strong correspondence between India'sexport growth and world export growth (Figure 7.1and Box 7.1). This is clearly visible in 2009 whenthere was a big dip in both world exports and India'sexports. The relationship between changes in realeffective exchange rate (REER) and India's exportgrowth is not however as clear-cut as that with worldtrade.
http://indiabudget.nic.in

151International Trade
Box 7.1 : How much of recent slowdown in exports is explained by external factors?
Export growth has slowed down considerably in India over the last few quarters. Based on GDP data from the expenditureside, the y-o-y growth for real exports of goods and services has decreased from a peak of 36% in 2011Q1 to 4% in 2012Q3.Merchandise exports have slowed down more; from 34% y-o-y in 2011Q1 to -6% y-o-y in 2012Q3 (based on BOP, deflatedby US CPI to create exports in real terms). Importantly, magnitude of the slowdown for India has been more pronouncedthan that for the world as a whole as well as for China.
Source : CEIC and IMF Direction of Trade Statistics.Notes : Left panel: exports of goods and services are taken from the GDP-expenditure, measured at 2004-05 prices.
Right panel. Real exports are created by deflating exports in US dollars by US CPI.
There are at least two reasons for the decline in export growth: (i) external factors or partner country incomes, (ii) changesin exchange rate. GDP growth of partner countries has also slowed down significantly (from more than 6% y-o-y in 2010Q1to less than 1% in 2012Q3). This would exert a negative effect on India's export growth. On the other hand, the real effectiveexchange rate for India has depreciated, suggesting a positive effect on exports.
Partner country real GDP growth series are weighted average of y-o-y growth of quarterly GDP for India's top 10 tradingpartners (excluding the oil exporters).REER series is from the Information Notice System (INS) database of the IMF. REERindicators are CPI-based, and computed as a weighted geometric average of the level of consumer prices in the homecountry relative to that in its trade partners. The weights are calculated based on bilateral trade with all 184 IMF membercountries.In order to decompose the decline in export growth, the elasticity of exports with respect to external demand and exchangerates has to be calculated. For this, a very simple regression of real exports (in millions of 1985 US dollars) on real effectiveexchange rates and trade-weighted real GDP of India's trading partners using data from 1991-2009 has been done. Allvariables are specified in logs of first differences. The estimates from the preferred specification suggest that a onepercentage point increase in trade-weighted partner country real GDP is associated with a 2.5 percentage point increase in
(Contd....)
http://indiabudget.nic.in

152 Economic Survey 2012-13
India's export growth, while a statistically significant effect of exchange rate changes on India's export growth is not found.The estimates are similar to the studies by Aziz and Chinoy (2010) and IMF (2012).To explain what fraction of the slowdown in Indian exports is due to a slowdown in external demand, the elasticity ofexports with respect to partner country GDP is used. On average, the growth in exports has slowed down by 8.3 percentagepoints between 2011/12 and 2012/13 (first two quarters). Using an elasticity of 2.5, 5.2 percentage point decline can beexplained by the slowdown in partner country GDP, that is, roughly two-thirds of the export slowdown can be explainedby external factors. Since the real exchange rate depreciated over this period, the export slowdown cannot be attributed toexchange rate changes, even if a statistically significant effect were to be found (Table 1).
Table 1 : Slowdown in exports of goods and services
Partner GDP Growthgrowth (in %) India
Average 2011-12 3.1 15.5Average 2012-13 1.0 7.2Slowdown (in pp) 2.1 8.3
Elasticity 2.5; Explained 5.2; Residual 3.1; Percentage explained 62
Source: Study by Shri Rohit Lamba and Dr. Prachi Mishra
Box 7.1 : How much of recent slowdown in exports is explained by external factors? (Contd..)
Trade Quantums and Unit Values
7.8 The very high export growth rate in rupee termsin 2010-11 is due to the high increase in both volumeand unit value indices from the very low base of theprevious year (Table 7.2). While crude materialsinedible except fuels and manufactured goodscontributed to the high increase in unit values,
machinery and transport equipment, mineral fuels,lubricants and related materials, and manufacturedgoods classified chiefly by materials and food andfood articles contributed to the high rise in volumes.The 28.3 per cent export growth in rupee terms in2011-12 was due to the high growth in the unit valueindex of 20.2 per cent besides the 8.9 per cent growthin the volume index. While the high growth in the
Table 7.2 : Trade Performance: Growth in Quantum and Unit Value indices(Annual per cent change)
Exports Imports Terms of Trade Rupee US$ Quantum Unit Rupee US$ Quantum Unit Net Income
terms terms Value terms terms Value
2001-2 2.7 -0.6 0.8 1.0 6.2 2.9 4.0 2.8 -2.1 -1.7
2002-3 22.1 20.3 19.0 2.9 21.2 19.4 5.8 14.3 -9.8 7.8
2003-4 15.0 21.1 7.3 7.5 20.8 27.3 17.4 3.1 3.6 10.4
2004-5 27.9 30.8 11.2 14.9 39.5 42.7 17.2 18.9 -3.5 8.0
2005-6 21.6 23.4 15.1 6.1 31.8 33.8 16.0 14.0 -6.0 8.1
2006-7 25.3 22.6 10.2 13.7 27.3 24.5 9.8 15.1 -1.3 8.7
2007-8 14.7 29.0 7.9 5.1 20.4 35.5 14.1 1.9 2.6 10.9
2008-9 28.2 13.6 9.0 16.9 35.8 20.7 20.2 13.8 2.5 11.3
2009-10 0.6 -3.5 -1.1 1.0 -0.8 -5.0 9.9 -10.0 12.3 11.1
2010-11 35.2 40.5 15.2 13.8 23.4 28.2 8.0 13.0 1.1 16.7
2011-12 28.3 21.3 8.9 20.2 39.3 32.3 -20.9 74.9 -27.2 -20.7
2012-13a 9.1 -4.9 - - 14.5 0.01 - - - -
Source : Directorate General of Commercial Intelligence and Statistics (DGCI&S). a April-January.Note: Quantum and unit value indices of exports and imports are with new base (1999-2000=100)
http://indiabudget.nic.in

153International Trade
unit value index is due to growth in chemicals andrelated products (41.2 per cent), inedible crudematerials other than fuels (41 per cent), and mineralfuels and related materials (36 per cent), growth inthe quantum index of exports is mainly due to growthin food and food articles (35.9 per cent) machineryand transport equipment (28.0 per cent) andmiscellaneous manufactured articles (16.8 per cent).A dissection of country-wise export quantum indicesshows that the high growth in this index in 2011-12is due to the high export quantum growth to Japan(26.8 per cent), Belgium (26 per cent), Bangladesh(20.9 per cent), and the UK (17 per cent).
7.9 Contrary to general belief, the high importgrowth ( in rupee terms) in 2011-12 was not due toquantum increase but due to high unit value increase(74.9 per cent ), with growth in quantum of importseven being in negative figures at - 20.9 per cent in2011-12. The unit value index of imports registeredunusually high growth of 74.9 per cent in 2011-12mainly due to growth in unit values of two highweighted items, machinery and transport equipment(169.2 per cent) due to a sharp rise in prices; andmineral fuels, lubricants, and related materials (28.9per cent) due to the rise in price of crude petroleumand products. The high negative quantum growth ofimports was mainly due to fall in quantum ofmachinery and transport equipment (- 52 per cent)which had become costlier and manufactured goodsclassified chiefly by materials (- 7.9 per cent)
7.10 The net barter terms of trade in 2011-12, whichmeasures the unit value index of exports as aproportion of unit value index of imports, declined to
- 27.2 per cent due to the high growth in the unitvalue index of imports while growth in the unit valueindex of exports was moderate. Income terms oftrade, reflecting the capacity to import, declined forthe first time after 2001-2 by 20.7 per cent, indicatinga very unfavourable terms of trade situation forIndia.(Figure 7.2) In 2001-2, the fall was very marginalwith the relevant component of the indicator alsoshowing marginal increases.
Export performance of India and EDEs
7.11 The share of the select Emerging andDeveloping Economies (EDEs) in the US$ 18 trillionworld exports in 2011 has increased to a sizeable41 per cent with a change in share of 15.6 per centover 2000. If the four newly Industrialized AsianEconomies namely, Singapore, Hong Kong, Taiwanand Republic of Korea, which have now beenclassified under advanced economies by the IMF,are also included then the share would be 50.5 percent. The performance of China is spectacular withits share in world exports increasing by 6.6percentage points between 2000 and 2011,comprising 42.4 per cent of the total increase inEDEs share over this period, while India's rise inshare of 1 percentage point constitutes only 6.5 percent of the total increase. However, China's exportgrowth rate at 20.3 per cent in 2011 was substantiallylower than that of India. India's export growth rate of33.8 per cent in 2011 over and above the 37.3 percent growth of 2010 is one of the highest in the world.
7.12 India's share in world merchandise exportswhich started rising fast from 2004, reached 1.5 per
http://indiabudget.nic.in

154 Economic Survey 2012-13
cent in 2010 and 1.7 per cent in 2011. It declinedmarginally to 1.6 per cent in 2012 (January-October),mainly due to its relatively negative export growth of- 5.1 per cent compared to world export growth of- 0.2 per cent (Table 7.3). In contrast China's shareincreased to 11.2 per cent in 2012 (January -October)with a positive export growth of 7.9 per cent.
7.13 Latest monthly growth rates of exports andimports of some of India's major trading partners havebeen low or negative. The EU's import growth has
been negative for most of the months in 2012. Therehas been a slight but unsteady pick-up in importgrowth in the last two or three months in countrieslike the US, Hong Kong, and Singapore and inDecember 2012 in China.
India's import growth
7.14 After recovering in 2010-11 from the previousyear's fall, India's merchandise imports increasedfurther to US$ 489.2 billion with a growth of 32.3 per
Table 7.3 : Export growth and share in world exports : India and other select countriesValue Growth rate % Share in world exports (%) change in
(US$ CAGR Annual sharesbillion)
2011 2000- 2010 2011 2012 2000 2010 2011 2012 2011/09 (Jan- (Jan- 2000
Oct.) Oct.)
EDEs 7400 12.3 28.8 24.9 1.8 25.4 39.2 41.0 41.7 15.6of whichChina 1899 19.1 31.3 20.3 7.9 3.9 10.4 10.5 11.2 6.6Russia 522 12.5 32.0 30.4 3.1 1.7 2.7 2.9 2.9 1.2Mexico 350 3.6 29.8 17.3 7.0 2.6 2.0 1.9 2.1 -0.7India 303 16.3 37.3 33.8 -5.1 0.7 1.5 1.7 1.6 1.0Malaysia 228 5.4 26.2 14.8 -0.6 1.5 1.3 1.3 1.3 -0.3Brazil 256 12.0 32.0 26.8 -5.2 0.9 1.3 1.4 1.3 0.6Thailand 226 9.2 28.6 15.9 0.8 1.1 1.3 1.3 1.3 0.2Indonesia 201 6.9 32.1 26.9 -6.2 1.0 1.0 1.1 1.0 0.1South Africa 97 8.5 30.7 18.5 -9.8 0.5 0.5 0.5 0.5 0.1NIAEs*Korea, Republic 557 8.6 29.0 19.3 -1.3 2.7 3.1 3.1 3.0 0.4Hong Kong 429 5.2 22.5 9.9 1.4 3.2 2.6 2.4 2.4 -0.8Singapore 410 7.8 30.4 16.4 0.3 2.2 2.3 2.3 2.3 0.1Taiwan 308 3.6 34.8 12.2 NA 2.3 1.8 1.7 NA -0.6World 18033 7.7 22.0 19.4 -0.2 100.0 100.0 100.0 100.0 -
Source : Computed from IMF, International Financial Statistics, January 2013.Note : * Newly Industrialized Asian Economies, NA : Not Available.
Source : Based on Ministry of Petroleum and Natural Gas data.
http://indiabudget.nic.in

155International Trade
Box 7.2 : Gold Imports and Policy MeasuresIndia is one of the largest importers of gold in the world, with import growth of 11.2 per cent in terms of quantity and 39.0per cent in terms of value during 2011-12. Gold is the second major import item of India after POL and constitutes 11.3 ofits imports in 2011-12 in value terms. The rise in imports of gold is one of the factors contributing to India's high trade deficitand CAD in 2011-12, forming 30 per cent of its trade deficit. The RBI in its draft report of the Working Group to Study'Issues Related to Gold Imports and Gold Loans by NBFCs in India' has stated that if gold imports in India had grown by24 per cent (an average of growth in world gold demand during past three years) instead of 39 per cent in 2011-12, the CADwould have been lower by approximately US$ 6 billion and the CAD-GDP ratio would have been 3.9 per cent instead of 4.2per cent. Globally, the demand for gold is rising, mainly due to demand from emerging economies like China and India. Themajor source countries for import of gold include Switzerland, responsible for 52 per cent of the total imports by India ofraw gold during 2011-12 (which has led to an unfavourable bilateral balance of trade for India), followed by the UAE (17.6per cent), and South Africa (11.5 per cent). The rise in gold imports is due to many factors.
The love of Indians for the yellow metal is well known. India is one of the largest consumers of gold in the world withconsumption increasing from 721.9 tonnes in 2006 to 933.4 tonnes in 2011 and 612 tonnes in the first three quarters of 2012,accounting for around 27 per cent of world gold consumption in 2011, and 26.4 per cent in 2012 (total of first threequarters). As per the Annual Report 2011-12 of the Ministry of Mines, domestic production of gold is estimated at only 2.8tonnes in 2011-12 and can meet around 0.3 per cent of the demand. This has inevitably led to its import. Gold is also usedfor trading/investment. Net retail investment constitutes 39.2 per cent of the India's total gold consumption in 2011 and32.5 per cent during the first three quarters of 2012 in terms of quantity. As stated in the RBI report, one of the majorcomponents of gold demand in recent years has been investment demand at global level. Rising gold prices in recent yearshave not deterred the acquisition of gold in India, implying that investment in gold is becoming price inelastic. India alsoimports gold for manufacturing purposes and exports a portion of it as jewellery. In the case of export of gold jewellery, themajor export destinations include the UAE (57.9 per cent), Hong Kong (14.1 per cent), and the USA (12.0 per cent).
International gold price movements which have been volatile in recent years also have a bearing on the value of the country'sgold imports. During the 2000 to 2012 period, international gold prices have grown at a CAGR of 16.2 per cent. In 2011-12 they increased by 23.4 per cent though they moderated to 4.3 per cent during April-November 2012 over the correspondingperiod in the previous year. Even with this moderation, gold prices were at a high level of US$1721 per troy ounce inNovember 2012 and currently at US$ 1672.3 per troy ounce (as on 5th February 2013). As stated by the RBI report, volatilityin international gold prices in recent quarters is positively skewed, implying that it provides fewer large losses and a greaternumber of larger gains. The worsening global situation has also led to a rise in purchase of gold as a safety metal and afurther rise in its price. Fluctuations in international gold prices get automatically reflected in India's gold prices along withthe markup due to duties and taxes. Substantial increase in gold prices seems to have fuelled positive price expectationsalso contributing to sharp rise in the value of gold imports in recent years.
To restrict the rising trend in gold imports which is adversely affecting India's balance of payments, measures were and arebeing taken by the government. In Budget 2012-13, import duty on standard gold and platinum was raised from 2 per centto 4 per cent and non standard gold from 5 per cent to 10 per cent. On 21 January 2013, the Import duty on gold andplatinum was increased from 4 per cent to 6 per cent. It has also been proposed to provide a link between the Gold ETF(Exchange Traded Fund) and Gold Deposit Scheme with the objective of unfreezing or releasing a part of the gold physicallyheld by mutual funds under Gold ETFs and enabling them to deposit the gold with banks under the Gold Deposit Scheme.The value of gold imports during April-December 2012 declined by 14.7 per cent to US $ 38.02 billion and quantity ofimports fell by 11.8 per cent compared to same period of previous year. Total gold consumption has also declined by 23 percent during the first three quarters of 2012. While the supply of gold through organized channels can be constricted, thereis need to be vigilant regarding gold inflows through unauthorized channels. Ultimately, the best way to reduce goldimports in a sustainable way will be to offer the public financial investment opportunities that generate attractive returns.This means bringing down inflation as well as expanding the range of investments investors have easy access to.
Source: Compiled from reports and data of the RBI, EXIM Bank of India and the Gems and Jewellery Export Promotion Council.
http://indiabudget.nic.in

156 Economic Survey 2012-13
cent in 2011-12 (See Appendix Table 7.1 (B)). Thiswas due to the increase in growth of petroleum, oil,and lubricant (POL) imports by 46.2 per cent andnon-POL imports by 26.7 per cent. POL imports (witha share of 31.7 per cent in India's total imports)registered a high growth mainly due to increase inimport price of the Indian crude oil import basket by31.5 per cent in 2011-12 as against 22 per cent in2010-11 (Figure 7.3).7.15 POL import volume growth decelerated from14.9 per cent in 2009-10 to 3.7 per cent in 2010-11and 3.5 per cent in 2011-12. International oil prices(Brent) which reached a high of US$ 132.47/bbl inJuly 2008 declined sharply to US$ 40.35 /bbl inDecember 2008, following the global recession. From2009 onwards, oil price has been increasing withintermittent volatility, reaching US$ 125.33/bbl inMarch 2012 and falling marginally with volatility inthe following months. Currently Brent oil price ishovering around US$110/bbl.
7.16 Gold and silver imports (with a share of 12.6per cent in India's total imports) grew by 44.5 percent in 2011-12. Gold imports alone accounted for91.7 per cent of the total imports of gold and silver.In 2011-12, gold imports grew by 38.8 per cent invalue and 11.2 per cent in volume terms. Non-POLnon-bullion imports increased by 23.3 per cent in2011-12 compared to 29 per cent in 2010-11.7.17 At US$ 406.9 billion imports in 2012-13 (April-January) registered a growth of 0.01 per cent. During2012-13 (April-December), POL imports at US $125.2 billion grew by 12.8 per cent. Non-POL importsat US $ 239.8 billion declined by 5.1 per cent andgold and silver imports at US $ 39.3 billion declinedby 14.7 per cent. Non-POL and non-bullion importswhich basically reflect the imports of capital goodsneeded for industrial activity and imports needed forexports declined by 3.0 per cent.
Trade Deficit7.18 Trade deficit (on customs basis) reached apeak of US$ 184.6 billion in 2011-12 from US$ 118.6billion in 2010-11 with the highest growth of 55.6 percent since 1950-1. Moderate export growth and highimport growth, particularly in POL imports due tohigh prices and high gold and silver imports, led tothe highest-ever trade deficit in India since 1950-1,contributing to a high current account deficit (CAD)of 4.2 per cent of GDP (also see Box 7.2).
7.19 The trade deficit of US $ 167.2 billion for 2012-13 (April-January) was 7.9 per cent higher than theUS $ 154.9 billion in 2011-12 (April- January). While
POL imports grew by 46.2 per cent in 2011-12, POLexport growth was relatively lower at 34 per centdue to lower growth in the quantum of POL exportsby 3.8 per cent, resulting in net POL importsincreasing to US $ 99.3 billion in 2011-12. In 2012-13 (April-November), though POL import growthmoderated to 11.7 per cent, POL export growth wasnegative at - 7.3 per cent which was also due to thedecline in the volume of POL exports by - 0.9 percent. As a result the share of net POL imports intotal imports increased to 23.5 per cent in 2012-13(April-November) compared to 20.3 per cent in 2011-12 (whole year).
Trade Composition
Export composition
7.20 Compositional changes in India's exportbasket have been taking place over the years. Whilethe share of primary products in India's exports fellover the years from 16 per cent in 2000-1, in 2012-13 (April-November) it regained the share of 16 percent mainly due to the export of agricultural itemslike rice and guar gum meal. The share ofmanufacturing exports fell drastically from 78.8 percent in 2000-1 to 66.1 per cent in 2011-12 and furtherto 64.5 per cent in 2012-13(April-November) mainlydue to the fall in shares of traditional items like textilesand leather and leather manufactures even thoughthe share of engineering goods and chemicals andrelated products increased. Share of gems andjewellery fell marginally. Share of petroleum, crude& products exports, which also include refined items,increased from 4.3 per cent in 2000-1 to 18.3 percent in 2011-12 and 18.6 per cent in 2012-13(April-November).
7.21 The destination-wise exports of major itemsto the major trading partners from 2009-10 to 2012-13 (April-November) show great changes in thecomposition of exports to USA and China (Table 7.4).In the case of India's exports to the USA, the shareof exports of primary products has increased from6.8 per cent in 2009-10 to 21.3 per cent in 2012-13(April-November), mainly due to the rise in share ofagriculture and allied products, while the share ofmanufactured goods in India's exports to the USAhas fallen from 89.1 per cent to 74.2 per cent duringthe same period. This decline has been mainly dueto the fall in growth rates of exports of textiles and
http://indiabudget.nic.in

157International Trade
Table 7.4 : Composition of exports by major marketsPercentage share Growth rate*
2000- 2009- 2010- 2011- 2011- 2012- 2009- 2010- 2011- 2011- 2012- 01 10 11 12 12 13 10 11 12 12 13 (Apr.- (Apr.- (Apr.- (Apr.-
Nov.) Nov.) Nov.) Nov.)
I Primary products World 16.0 14.9 13.2 15.2 13.3 16.0 3.8 23.9 39.8 37.2 11.2USA 9.4 6.8 8.0 14.5 11.9 21.3 -13.5 52.8 149.5 123.7 101.6EU 13.1 8.6 8.2 9.7 9.0 9.9 -5.7 22.2 33.8 38.3 -2.0China 45.2 65.7 51.6 55.2 49.5 38.4 26.9 4.7 24.8 7.0 -42.1others 18.9 13.1 11.7 13.1 11.7 14.9 -1.7 31.7 35.7 41.9 17.5
(a) Agri. & allied productsWorld 14.0 10.0 9.7 12.4 10.7 14.0 1.1 36.1 53.9 60.8 21.1USA 9.0 5.8 7.1 13.7 11.0 20.4 -12.1 58.7 165.7 139.3 107.3EU 11.9 7.1 7.1 8.1 7.6 8.7 -6.4 27.7 30.4 37.9 1.3China 18.9 14.8 16.8 26.5 20.4 17.8 122.8 50.6 84.2 79.1 -35.0others 16.8 11.3 10.2 12.0 10.7 13.8 -3.3 33.8 41.9 54.2 18.9
(b) Ores and mineralsWorld 2.0 4.9 3.4 2.8 2.6 2.0 9.9 -1.3 -0.4 -14.3 -29.6USA 0.4 1.0 0.9 0.8 0.9 1.0 -21.1 18.5 24.4 22.0 29.2EU 1.3 1.5 1.2 1.6 1.4 1.2 -2.5 -3.5 54.6 40.7 -20.4China 26.3 50.9 34.8 28.7 29.1 20.6 12.8 -8.7 -3.7 -16.6 -47.2others 2.2 1.8 1.5 1.1 1.0 1.1 9.6 18.6 -7.4 -23.7 1.9
II Manufactured goodsWorld 78.8 67.2 69.0 66.1 66.9 64.5 -5.9 44.2 16.2 27.7 -10.4USA 90.6 89.1 87.4 81.4 83.3 74.2 -8.7 27.0 27.9 35.2 -0.2EU 86.8 73.2 72.1 74.9 73.9 72.6 -15.4 25.8 18.6 34.4 -12.8China 54.6 32.2 42.4 39.2 42.3 58.0 29.5 75.4 7.8 4.3 2.3others 71.4 65.1 67.8 63.5 64.4 60.8 -2.5 53.4 13.6 25.7 -12.6
(a) Textiles incl. RMGWorld 23.6 10.5 9.1 8.7 8.6 8.7 -1.2 21.3 16.9 29.1 -6.4USA 27.2 18.4 17.1 14.1 13.7 12.0 -7.6 20.2 13.0 19.2 -1.7EU 29.2 18.5 16.3 16.3 15.7 14.4 -6.7 12.1 14.6 36.6 -18.7China 9.3 1.8 2.8 4.1 3.7 8.6 47.0 104.2 68.5 51.4 73.6others 20.2 7.4 6.4 6.2 6.3 6.5 6.2 27.1 17.9 27.3 -4.0
(b) Gems & jewelleryWorld 16.6 16.2 16.1 14.7 14.9 15.4 3.7 39.6 10.8 38.6 -4.0USA 29.3 24.2 20.8 19.5 22.3 18.0 2.8 11.7 28.5 52.7 -9.4EU 11.5 6.7 6.8 9.2 9.2 7.1 -26.2 31.4 52.9 90.8 -31.5China 0.0 3.8 0.5 0.7 0.7 0.7 -41.4 -81.0 42.8 25.0 -25.5others 14.4 19.2 19.5 16.6 16.4 18.0 10.7 49.1 3.6 30.5 1.5
(c) Engineering goodsWorld 15.7 18.2 19.8 19.2 19.2 19.3 -18.7 53.0 17.3 15.8 -6.4USA 13.4 17.1 20.2 19.8 20.5 17.1 -33.9 53.0 34.5 37.9 -6.6EU 14.0 20.8 20.9 21.0 20.8 21.5 -25.1 28.6 14.6 26.3 -8.4China 9.9 12.4 25.8 18.8 20.7 24.4 63.6 177.9 -14.8 -21.3 -11.9others 17.5 18.2 18.9 18.6 18.4 18.9 -15.8 53.2 19.3 14.6 -5.2
(d) Chemicals & related productsWorld 10.4 12.8 11.5 12.2 11.8 13.7 0.9 26.0 28.6 35.4 7.4USA 5.7 17.2 17.7 16.9 15.9 17.2 7.4 33.2 30.9 28.9 21.1EU 9.7 12.5 12.8 14.1 13.6 15.1 -11.8 30.9 25.6 36.6 -1.2China 15.5 10.2 9.4 11.1 12.1 15.5 40.8 23.3 37.7 48.5 -4.5others 12.4 12.4 10.4 10.9 10.6 12.4 1.7 22.9 28.2 35.6 8.0
(e) Leather & leather mnfrsWorld 4.4 1.9 1.6 1.6 1.6 1.7 -5.5 16.3 22.6 36.0 -2.8USA 3.7 1.5 1.4 1.3 1.3 1.4 -17.8 17.4 26.6 29.3 20.8EU 11.4 6.3 5.5 5.8 5.9 5.8 -2.1 12.6 20.2 39.7 -12.5China 1.1 0.4 0.5 0.7 0.7 1.1 -2.2 55.5 65.2 74.3 12.9others 1.6 0.7 0.6 0.6 0.6 0.7 -9.9 24.8 24.2 26.4 12.8
(f) Handicrafts includingcarpet handmadeWorld 2.8 0.5 0.5 0.4 0.4 0.4 -10.6 35.7 -12.9 -6.7 7.4USA 6.0 1.5 1.6 1.2 1.2 1.3 -14.6 40.4 2.4 14.6 16.5EU 4.4 1.1 1.0 0.7 0.7 0.8 -7.5 8.4 -12.1 -3.8 -2.9China 0.3 0.1 0.0 0.1 0.1 0.1 106.9 -40.9 40.1 16.3 -2.4others 0.8 0.2 0.3 0.2 0.2 0.2 -13.1 80.1 -29.2 -27.9 8.5
III Petroleum, crude & productsWorld 4.3 15.8 16.5 18.3 18.7 18.6 2.3 47.1 34.0 54.3 -7.3USA 0.0 2.3 3.7 3.5 4.5 3.7 180.3 110.9 30.1 139.9 -8.0EU 0.0 16.9 18.8 15.0 16.5 17.0 45.4 42.7 -9.4 19.2 -8.7China 0.0 0.8 5.3 6.3 8.6 3.2 -8.4 745.2 38.1 608.2 -72.2others 8.1 19.9 19.4 23.5 23.3 23.5 -3.9 43.6 47.0 59.4 -6.5Total exportsWorld 100.0 100.0 100.0 100.0 100.0 100.0 -3.5 40.5 21.3 32.7 -7.0USA 100.0 100.0 100.0 100.0 100.0 100.0 -7.6 29.5 37.4 43.9 12.2EU 100.0 100.0 100.0 100.0 100.0 100.0 -8.4 27.9 14.1 31.4 -11.2China 100.0 100.0 100.0 100.0 100.0 100.0 24.2 33.3 16.8 12.4 -25.4
others 100.0 100.0 100.0 100.0 100.0 100.0 -3.4 47.2 21.3 33.3 -7.6
Source : Computed from DGCI&S data. * Growth rate in US dollar terms.Notes: 1. RMG stands for ready-made garments.
2. Share in a particular item means share of each country in total exports of India to that country.3. Totals may not add up mainly due to some unclassified items.
http://indiabudget.nic.in

158 Economic Survey 2012-13
Box 7.3 : Market vs Product DiversificationIndia has been fairly successful in diversifying its export markets from developed countries like the US and Europe to Asiaand Africa, which has helped to a great extent in weathering the global crisis of 2008 and the recent global slowdown(Table 1).
Table 1 : Region-wise Share of India's Exports:
2000-1 2005-6 2011-12 2012-13(Apr.-Nov.)
1) Europe 25.9 24.2 19.0 18.7
2) Africa 5.3 6.8 8.1 9.6
3) America 24.7 20.7 16.4 19.5
4) Asia 37.4 46.9 50.0 50.4
5) CIS & Baltics 2.3 1.2 1.0 1.3
Source : Computed from DGCI&S data.
However, in terms of product diversification a lot more needs to be done as can be seen from the following:
In the top 100 imports of the world at the four-digit HS level in 2011, India has only 6 items in the top 50; it has only5 items with a share of 5 per cent and above and 18 items with a share of 2 per cent and above (Table 2), with 6 newitems with high export growth (India) entering the list and 3 going out of the list in 2011 compared to 2010. The newitems are medicaments consisting of mixed or unmixed products for therapeutic use; other articles of iron and steel;men's or boys' suits, ensembles; cruise ships, excursion boats, ferry-boats, cargo ships, barges and similar vessels; caneor beet sugar and chemically pure sucrose in solid form; and maize.
Table 2 : Export Items of India with 2 per cent and above Share in Top 100 World Imports at Four-digit level
Rank# HS4 Items India share Growth rate in 2011World in world India World2011 2011 (Export) (Import)
2 2710 Petroleum oils and oils obtained from bituminous minerals, etc. 6.7 49.0 39.4 7 3004 Medicaments consisting of mixed or unmixed products for therapeutic use 2.1 36.0 5.711 2601 Iron ores and concentrates, including roasted iron pyrites 2.3 -32.3 37.814 7102 Diamonds, whether or not worked, but not mounted or set. 23.8 44.7 14.734 7403 Refined copper and copper alloys, unwrought 3.2 -53.7 12.239 8803 Parts of goods of heading no. 88.01 or 88.02. 3.5 45.4 1.251 6403 Footwear with outer soles of rubber 3.1 23.0 9.252 6204 Women's or girls' suits, ensembles, jackets, blazers, dresses 4.9 34.8 9.255 7210 Flat-rolled products of iron or non-alloy steel 2.8 0.8 12.256 7113 Articles of jewellery and parts thereof, of precious metal 28.5 83.6 13.461 2902 Cyclic hydrocarbons. 4.4 47.8 27.868 7326 Other articles of iron or steel. 2.0 97.9 13.969 3902 Polymers of propylene or of other olefins, in primary forms. 2.8 46.0 17.372 6203 Men's or boys' suits, ensembles, jackets, blazers, trousers, etc. 2.3 31.5 16.492 6109 T-shirts, singlets & other vests, knitted or crocheted 6.0 22.1 12.197 8901 Cruise ships, excursion boats, ferry-boats, cargo ships, barges, 2.2 40.0 -25.8
and similar vessels99 1701 Cane or beet sugar and chemically pure sucrose, in solid form. 6.0 123.1 20.1100 1005 Maize 3.4 103.1 34.1
Source: Computed from UN Comtrade data extracted on 9 January 2013.Note: # Rank is in top 100 world imports.
India has a very high export share in world imports in the case of only two four-digit HS items, jewellery anddiamonds. While India can increase its shares further in the other 16 items given in the table, there are many othersimple items in the top 100 world imports with high demand where India has developed its competence. Most of theitems come under the three Es, electronic, electrical, and engineering items and some textiles items. Greater focus onthese items could lead to a perceptible increase in India's share of exports in world imports.
Source: Internal study, Economic Division, Department of Economic Affairs.
http://indiabudget.nic.in

159International Trade
gems and jewellery. In the case of India's exports toChina, the share of primary products has fallen from65.7 per cent in 2009-10 to 38.4 per cent in 2012-13(April-November) due to the fall in share and growthrate of ores & minerals. The share of manufacturesin India's exports to China has increased from 32.2per cent to 58.0 per cent during this period, mainlydue to the rise in share of engineering goods, textiles,and chemicals and related products. In the case ofIndia's exports to the EU, there has been a marginalrise in the share of primary products and petroleumproducts and a fall in the share of manufacturedgoods.
7.22 The reason for India's export growth in 2012-13 (April-November) being more negative than in2009-10 in the aftermath of the global recession canbe seen from India's commodity-country exportperformance. India's exports to EU and China havebeen more negative during the recent global slowdownthan in 2009-10, while its performance to USA hasbeen better for most of the sectors except gemsand jewellery. The performance of India's exports toEU of textiles and readymade garments, gems andjewellery and ores: and to China of manufactures,engineering goods, chemicals gems and jewelleryand ores was worse off in 2012-13(April-November)compared to 2009-10. India's POL export growth toall major markets also decelerated in 2012-13 (April-November) compared to 2009-10. Thus, the EuroZone crisis and the Chinese slowdown have affectedIndia's exports more during the recent slowdown thanin 2009-10
Export diversification
7.23 In 2011, India had a global export share of 1per cent or more in 53 out of a total of 99 commoditiesat the two-digit harmonized system (HS) level. Whilenoticeable changes can be seen in India's marketdiversification, the same is not the case with itsexport basket diversification (Box 7.3).
Import composition
7.24 There have been some significantcompositional changes in India's import basket inrecent years. The share of POL imports increasedfrom 28.7 per cent in 2010-11 to 31.7 per cent in2011-12 (with a very high growth rate) and 34.6 percent in 2012-13 (April-November). The share of goldand silver imports increased from 9.3 per cent in2000-1 to 12.6 per cent in 2011-12 with a high import
growth rate of 44.5 per cent. However, in part due topolicy measures like raising import duty on gold,there was a moderation in gold and silver imports in2012-13 (April-November) with its share falling to 10.5per cent following a negative growth of - 20.4 percent. The import share of pearls, precious and semi-precious stones also fell sharply in 2011-12 to 6.1per cent following a negative growth of -13.3 per centand further to 4.1 per cent in 2012-13 (April-November), with a high negative growth rate of - 32.3per cent. Another important development is relatedto the share of capital goods imports which increasedfrom 10.5 per cent in 2000-1 to 13.6 per cent in 2010-11 and further to 14.1 per cent in 2011-12, decliningthereafter to 11.9 per cent in 2012-13 (April-November)following a negative growth rate of - 6.5 per cent.Among capital goods, the import shares of all itemsmachinery except electrical and machine tools,transport equipment, project goods, and electricalmachinery fell, clearly signaling a slowdown inindustrial activity. The share of electronic goods,which includes both consumer electronics and capitalgoods, also fell in 2012-13 (April-November) (SeeTable 7.5 and Appendix Table 7.2(B).
Direction of Trade
7.25 There has been significant marketdiversification in India's trade. Region-wise, whileIndia's exports to Europe and America have declined,its exports to Asia and Africa have increased (SeeBox 7.3). However, in 2012-13 (April- November), theshare of India's exports to the USA increased to 13.5per cent. Within Asia, while the share of North EastAsia (consisting of China, Hong Kong, Japan) andASEAN (Association of South East Asian Nations)fell from 14.8 per cent and 12.0 per cent in 2011-12to 13.1 per cent and 10.3 per cent respectively in2012-13 (April- November), there was a noticeablerise in the share of West Asia-GCC (Gulf CooperationCouncil) countries from 14.9 per cent in 2011-12 to17.7 per cent in 2012-13 (April- November).
7.26 In 2012-13 (April- November), compared to2000-01, the share of India's imports from Europehas declined to 16.7 per cent from 27.6 per cent,while that from Asia has increased substantially to61.1 per cent from 27.7 per cent. The share of Americain India's imports also increased to 11.5 per centfrom 7.9 per cent. India's top 15 trading partnershave nearly 60 per cent in share in its trade with thetop three contributing nearly half of this share. WhileIran and UK are out of this top 15 list in 2011-12, Iraq
http://indiabudget.nic.in

160 Economic Survey 2012-13
Table 7.5 : Commodity Composition of India’s Imports
Percentage share CAGR Growth ratea
Commodity Group 2000- 2010- 2011- 2011- 2012- 2000-01 2010- 2011- 2011- 2012-01 11 12 12 13 to 11 12 12 13
(Apr. - Nov.) 2009-10 (Apr. - Nov.)
I. Food and allied products, 3.3 2.9 3.1 3.1 3.5 22.7 2.2 44.4 38.0 11.6of which1. Cereals 0.0 0.0 0.0 0.0 0.0 24.3 15.8 -34.2 -46.6 6.8
2. Pulses 0.2 0.4 0.4 0.4 0.4 38.3 -23.1 27.2 11.3 9.2
3. Edible oils 2.6 1.8 2.1 2.1 2.5 17.2 19.0 57.7 55.3 18.0
II. Fuel, of which 33.5 30.9 37.4 34.3 38.0 21.0 22.4 59.7 52.3 9.84. POL 31.3 28.7 31.7 30.7 34.6 21.0 21.6 46.2 50.6 11.7
III. Fertilizers 1.3 1.9 2.4 2.3 2.2 29.0 4.8 72.1 32.2 -6.8IV. Capital goods, of which 10.5 13.6 14.1 12.6 11.9 26.1 19.2 36.9 25.6 -6.5
5. Machinery except electrical 5.9 7.0 7.2 6.7 6.3 24.4 24.0 35.8 28.2 -5.8& machine tool
6. Electrical machinery 1.0 1.0 1.0 1.0 0.9 22.7 25.1 33.1 26.6 -5.5
7. Transport equipment 1.4 3.1 3.0 2.5 2.3 36.4 -0.9 31.8 13.1 -8.3
V. Others, of which 52.5 49.6 49.0 47.6 44.3 19.3 43.2 30.8 29.6 -7.68. Chemicals 5.9 5.2 5.1 5.0 5.1 19.5 29.6 31.8 24.3 1.1
9. Pearls, precious, semi- 9.7 9.3 6.1 6.1 4.1 14.0 116.9 -13.3 4.3 -32.3precious stones
10. Gold & silver 9.3 11.5 12.6 13.0 10.5 23.0 43.0 44.5 59.2 -20.4
11.Electronic goods 7.0 7.1 7.1 7.0 6.5 21.6 28.4 31.7 22.2 -7.7
Total imports 100.0 100.0 100.0 100.0 100.0 21.5 28.2 32.3 36.2 -0.8
Source: Computed from DGCI&S data. a Growth rate in US dollar terms
and Kuwait are the new entrants. The musical chairsfor the top slot among the top three trading partnersseems to be continuing with the USA relegated tothird position in 2007-8 from first, UAE relegated tosecond position from first in 2011-12 by China, andChina in turn relegated to second position by theUAE in 2012-13 (April-November). The final word for2012-13 is not yet out as the USA is inching closerto China with its share increasing by around onepercentage point and that of China falling.
7.27 At 10 per cent in 2011-12 India's trade deficitas a per cent of GDP is one of the highest in theworld. Export-import ratios reflecting the bilateraltrade balance (Table 7.6) show that among its top15 trading partners, India had bilateral trade surpluswith four countries in 2011-12, viz. the UAE, USA,Singapore, and Hong Kong. In 2012-13 (April-November), India's trade balance with the UAE hasturned slightly negative while it has improved furtherwith the USA and Hong Kong. Another important
trend is the growing trade deficit of India with Chinaand Switzerland, increasing from US$ 28 billion andUS$24.1 billion in 2010-11 to US$ 39.4 billion andUS$ 31.3 billion respectively in 2011-12. In 2012-13(April-November), the export-import ratio with Chinaworsened further to 0.23 from 0.31 in 2011-12.
WORLD TRADE IN SERVICES
7.28 Like world merchandise trade, worldcommercial services trade which was badly hit bythe 2008 global crisis, crossed the pre-crisis level in2011 to reach US$ 4.17 trillion after a gap of twoyears. The export growth rate of commercial serviceswhich was at 11 per cent in 2000-5 and becamenegative at -12 per cent in 2009, has taken a full turnto reach 11 per cent again in 2011. As per the WTO'sInternational Trade Statistics, Europe recovered fromits 4 per cent growth of commercial services exportsin 2010 to 11 per cent in 2011, while North America
http://indiabudget.nic.in

161International Trade
Table 7.6 : India's Trade Share and Export-Import Ratio with Major Trading PartnersShare in total trade Export/Import ratioa
Sl. Country 2009-10 2010-11 2011-12 2011-12 2012-13 2009-10 2010-11 2011-12 2011-12 2012-13No. (Apr-Nov.) (Apr-Nov.)
1 China 9.09 9.50 9.52 9.62 8.95 0.38 0.36 0.31 0.29 0.23
2 U A E 9.31 10.72 9.03 8.99 9.74 1.23 1.03 1.00 0.98 0.92
3 U S A 7.82 7.30 7.46 7.29 8.23 1.15 1.26 1.42 1.42 1.51
4 Saudi Arabia 4.50 4.04 4.63 4.57 5.43 0.23 0.23 0.18 0.17 0.28
5 Switzerland 3.27 4.11 4.22 4.30 3.50 0.04 0.03 0.03 0.03 0.04
6 Singapore 3.01 2.73 3.21 3.30 2.53 1.18 1.38 1.96 1.85 1.75
7 Germany 3.37 3.00 3.05 3.02 2.75 0.52 0.57 0.49 0.50 0.48
8 Hong Kong 2.70 3.18 2.97 3.09 2.53 1.67 1.10 1.21 1.09 1.51
9 Indonesia 2.51 2.52 2.68 2.69 2.50 0.35 0.57 0.46 0.38 0.34
10 Iraq 1.61 1.56 2.48 2.49 2.73 0.07 0.08 0.04 0.03 0.07
11 Japan 2.22 2.21 2.32 2.19 2.29 0.54 0.59 0.52 0.46 0.47
12 Belgium 2.09 2.32 2.22 2.21 1.91 0.62 0.67 0.69 0.71 0.52
13 Kuwait 1.93 1.96 2.21 2.02 2.38 0.09 0.18 0.07 0.08 0.06
14 Korea RP 2.57 2.29 2.20 2.20 2.30 0.40 0.36 0.33 0.35 0.29
15 Nigeria 1.86 2.08 2.19 2.19 2.14 0.19 0.19 0.18 0.18 0.20
Total of 15 57.84 59.50 60.40 60.16 59.91 0.56 0.55 0.51 0.49 0.50
countries
India’s trade 100.00 100.00 100.00 100.00 100.00 0.62 0.68 0.62 0.62 0.58
Source : Computed from DGCI&S data.Note : a A coefficient of export and import ratio between 0 and 1 implies that India’s imports are greater
than exports and if the coefficient is greater than one, India exports more than what it imports.
maintained the same growth rate of 9 per cent. TheCommonwealth of Independent States (CIS) was themost dynamic region followed by South and CentralAmerica with 19 per cent and 13 per cent growthrespectively in 2010. Asian economies saw theirgrowth rates more than halved to 11 per cent in 2011from 23 per cent in 2010 due to slower growth intransportation and other commercial services. All thethree broad categories of commercial services,namely transport, travel, and other commercialservices registered reasonably good growth in 2011.In 2012, services trade growth has decelerated asis evident from the WTO’s first quarter to third quarterdata for 2012 which shows that export and importgrowths were zero per cent and 1 per cent in Q2 of2012 and -2 per cent and -1 per cent in Q3 of 2012over corresponding period of the previous year.Europe had a very high negative growth of -7 percent in both exports and imports.
INDIA'S SERVICES TRADE
India's Services Exports
7.29 India's services export growth has been fasterthan that of merchandise exports with the export ofservices growing at a CAGR of 23.6 per cent during2001-2 to 2011-12, while merchandise exports grewat a CAGR of 21.4 per cent during the same period.However, growth in services exports became erraticin the post global crisis period. Reflecting the impactof uncertainty in the global economy and weakgrowth in advanced economies, services exports atUS$ 142.3 billion showed a lower growth of 14.2 percent in 2011-12 as against 29.8 per cent in thepreceding year. Growth in services exportsdecelerated further to 4.3 per cent during H1 of2012-13 as against 22.7 per cent during H1 of 2011-12 (Table 7.7).
http://indiabudget.nic.in

162 Economic Survey 2012-13
7.30 Growth moderation in services exports wasobserved in almost all categories. Miscellaneousservices, accounting for nearly 75 per cent of totalservices exports in H1 of 2012-13, grew by 8 percent during this period as compared to 20.2 per centin corresponding period of the previous year. Withinmiscellaneous services, growth in exports of softwareservices, accounting for nearly 46 per cent of totalservices exports, was in single digit at 9.8 per centin H1 of 2012-13 compared to the 21.8 per cent inH1 of 2011-12. Some categories like travel, transport,and insurance services showed a negative growthrate leading to lower growth in overall servicesexports. For 2012-13, NASSCOM has projected alower export growth in IT and business processmanagement of 8.4 per cent mainly due to reducedspending on technology by US corporations andcontinued crisis in Europe. While the challengesfacing global economic growth persist, Gartner hasprojected that worldwide IT spending will increaseby 4.2 per cent in 2013 (from US$ 3.58 trillion in2012 to US$ 3.73 trillion in 2013). Among non-software services, business services export growthwas high at 23.9 per cent in the first half of 2012-13.However, export growth of this category of services
has been very erratic in recent years. Communicationservices export growth was also high at 16.5 percent.
India's Services Imports
7.31 Services imports at US$ 78.2 billiondeclined by 2.9 per cent in 2011-12, as againstan increase of 34.2 per cent in the preceding year.However, imports of services resurged in H1 of2012-13 and grew sharply by 10.3 per cent ascompared to a decline of 0.5 per cent in H1 of2011-12. This rise in import of services was mainlyon account of higher imports of software andbusiness services which increased by 89.7 percent and 22 per cent respectively during H1 of2012-13 as against a decline of 47.5 per cent and4.4 per cent respectively in H1 of 2011-12.However, financial services showed a decline of34.7 per cent as against an increase of 17.7 percent in H1 of 2011-12, which is perhaps a reflectionof the fragile global financial conditions. Similarly,imports of transportation, travel, insurance alsorecorded a decline in H1 of 2012-13 as againstpositive growth in H1 of 2011-12 (Table 7.8).
Table 7.7 : India's Export of services
Percentage Share CAGR Growth Ratea
Commodity Group 2001- 2011- 2011- 2012- 2001-02 2010- 2011- 2011- 2012-02 12 12 13 to 11 12 12 13
(Apr. - Sept.) 2011-12 (Apr.- Sept.)
Travel 18.3 13.0 11.9 10.7 19.4 33.2 16.9 21.3 -5.9
Transportation 12.6 12.8 13.3 12.1 23.8 27.4 28.0 37.1 -4.8
Insurance 1.7 1.8 1.8 1.6 24.8 22.3 35.3 39.8 -9.3
GNIE 3.0 0.3 0.4 0.4 -0.8 21.3 -10.7 30.6 7.7
Miscellaneous 64.4 72.0 72.6 75.2 25.0 29.8 11.3 20.2 8.0
Software Services 44.1 43.7 43.3 45.6 23.5 6.8 17.2 21.8 9.8
Non-Software Services 20.3 28.3 29.3 29.6 27.8 83.4 3.3 18.1 5.4
Of which:
Business Services 3.0 18.2 17.8 21.2 47.9 112.4 7.7 10.6 23.9
Financial services 1.7 4.2 4.3 3.8 35.2 76.2 -8.3 -6.2 -6.9
Communication Services 4.4 1.1 1.1 1.3 7.8 27.2 2.4 1.1 16.5
Total Services Exports 100.0 100.0 100.0 100.0 23.6 29.8 14.2 22.7 4.3
Source: Computed from RBI data.Notes: a Growth rate is based on values in US dollar terms. GNIE = Government not included elsewhere.
http://indiabudget.nic.in

163International Trade
India's Balance of Trade in Services7.32 Surplus on account of India's services exportshas been a cushioning factor for financing a largepart of the merchandise trade deficit in recent years.During 2006-7 to 2011-12, surplus in services exports,on average, financed around 38 per cent ofmerchandise trade deficit. During 2011-12, netsurplus on account of services exports at US$ 64.1billion stood significantly higher than that in 2010-11and financed 33.8 per cent of trade deficit. DuringH1 of 2012-13, with slower growth in services exportsand rise in services imports, the surplus at US$ 29.6billion was 2.8 per cent lower than in H1 of 2011-12,financing 32.6 per cent of trade deficit. Going forward,downward risks to export of services persist as globaleconomic conditions remain less conducive .
TRADE CREDIT
7.33 Trade credit is a critical component of globaltrade. Internationally active firms rely extensively ontrade credits. As per a recent WTO study usingquarterly country-level data of export credit insurersfrom the Berne Union for the period 2005 to 2011, a1 per cent increase in trade credit granted to a countryleads to a 0.4 per cent increase in real imports ofthat country. This effect does not vary between crisisand non-crisis periods. Thus both availability and
cost of trade credit are important in the currentenvironment of financial uncertainties when thebanking system is likely to be tempted to reduceexposure to cross-border banking.
Trade Credit: Indian scenario
7.34 Reflecting improved global financial conditions,the gross inflow of short-term trade credit (up to 1year) to India reached ` 392,526 crore during endSeptember 2012, which represented a year-on-yearincrease of 24.6 per cent (but a quarter-on-quarterdecline of 1.1 per cent in Q2 of 2012-13). Inflow oftrade credit in H1 of 2012-13 at US$ 57.6 billion was14 per cent higher than in 2011-12 and growth inoutflow of trade credit was lower at 7.7 per cent. Asa result, net trade credit grew by 60.1 per cent in H1of 2012-13 and stood at US$ 9.5 billion as comparedto the decline of 14.4 per cent in H1 of 2011-12.
7.35 Export credit has been decelerating since2011-12. In 2012-13 (up to 30 November 2012), ithas grown by 4.7 per cent over end-March 2012compared to 7.7 per cent in full FY 2011-12. Exportcredit as a per cent of net bank credit which was at9.8 per cent as on 24 March 2000 has beendecelerating almost continuously over the years. Itfurther decelerated in 2012 to 3.7 per cent as on 30November 2012 (Table 7.9). Taking note of the global
Table 7.8 : India's Import of services
Percentage Share CAGR Growth Ratea
Commodity Group 2001- 2011- 2011- 2012- 2001-02 2010- 2011- 2011- 2012-02 12 12 13 to 11 12 12 13
(Apr. - Sept.) 2011-12 (Apr.- Sept.)
Travel 21.8 17.6 19.3 15.2 16.4 18.0 24.8 39.4 -12.9Transportation 25.1 20.9 21.0 18.9 16.8 16.3 18.0 14.5 -1.0Insurance 2.0 1.9 2.0 1.4 18.3 8.9 7.0 3.6 -23.3GNIE 2.0 1.0 1.0 0.8 10.7 56.2 -4.9 9.2 -11.3Miscellaneous 49.0 58.6 56.7 63.7 21.1 44.6 -14.3 -13.4 23.9
Software Services 4.9 1.6 1.7 2.9 6.5 49.5 -42.8 -47.5 89.7Non-Software Services 44.2 56.9 55.0 60.8 22.0 44.4 -13.0 -11.7 21.9Of which:
Business Services 10.9 34.2 33.8 37.4 33.4 53.4 -3.3 -4.4 22.0Financial services 9.1 10.2 10.7 6.4 20.2 61.2 6.7 17.7 -34.7Communication Services 2.7 2.0 2.0 0.6 15.5 -15.0 35.2 42.8 -66.2
Total Services Imports 100.0 100.0 100.0 100.0 18.9 34.2 -2.9 -0.5 10.3
Source: Computed from RBI data.Note: a Growth rate is based on values in US dollar terms. GNIE = Government not included elsewhere.
http://indiabudget.nic.in

164 Economic Survey 2012-13
slowdown and the deteriorating global conditions forexports, the RBI has taken several measures tofacilitate availability of bank credit to exporters (seeBox 7.4)
TRADE POLICY
Recent Trade policy measures
7.36 The government has announced many tradepolicy measures in the Annual Supplement to ForeignTrade Policy (FTP) released on 5 June 2012. Manymeasures were also taken by the government inUnion Budget 2012-13 and the RBI in its monetaryand credit policies during the course of the year tohelp exports (Box 7.4).
Policy for Promoting State-wise Exports
7.37 The top five states in India's exports in 2011-12 were Maharashtra, Gujarat, Tamil Nadu, AndhraPradesh, and Karnataka, accounting for 63.4 percent of India's exports. While in 2011-12, these fivestates had high robust growth (except Gujarat with5.5 per cent growth) in 2012-13 (April-November) all
Table 7.9 : Export CreditOutstanding Export Variations Exportas on credit (Per cent) credit as
(Rs per cent Crore) of NBC
24 Mar. 2000 39118 9.0 9.823 Mar.2001 43321 10.7 9.322 Mar. 2002 42978 -0.8 8.021 Mar. 2003 49202 14.5 7.419 Mar. 2004 57687 17.2 7.618 Mar. 2005 69059 19.7 6.331 Mar. 2006 86207 24.8 5.730 Mar. 2007 104926 21.7 5.428 Mar. 2008 129983 23.9 5.527 Mar. 2009 128940 -0.8 4.626 Mar. 2010 138143 7.1 4.325 Mar. 2011 168841 22.2 4.323 Mar. 2012 181852 7.7 3.930 Nov. 2012 185803 4.7* 3.7Source : RBI.Notes *: Variation over 18 November 2011.
NBC: Net Bank Credit.Data pertain to all scheduled commercial banksexcluding regional rural banks (RRBs) availing ofexport credit refinance from the RBI.
of them had negative growth. In fact all the otherstates in the top 15 except Odisha had positivegrowth in 2012-13 (April-November) with Kerala,Rajasthan, and Punjab having high export growth in2012-13 on top of robust growth in 2011-12. Exportgrowth of Haryana was also relatively high in 2012-13 (April-November) though it was low in 2011-12.The state-wise exports are only indicative as thereare certain weaknesses in the data as stated inEconomic Survey 2011-12.
7.38 The Assistance to States for Developing ExportInfrastructure and Allied Activities (ASIDE) Schemeprovides assistance to state governments / unionterritory (UT) administrations for creating appropriateinfrastructure for development and growth of exports.The budget outlay for financial year 2012-13(R.E.)under the ASIDE scheme is ̀ 655.5 crore of which` 573.22 crore has been sanctioned/ released tillthe end of January 2013. The outlay has twocomponents: state (80 per cent of the total outlay)and central (20 per cent of the total outlay). State-wise allocation under the state component of ASIDEshows that the top five states in terms of allocationin 2012-13 are Gujarat, Maharashtra, Tamil Nadu,Karnataka, and Andhra Pradesh which are also thetop five states in India's exports. Among the north-eastern states, those with significant allocation areAssam, Meghalaya, and Tripura.
Special Economic Zones7.39 Since the Special Economic Zones (SEZ) Actand Rules were notified in February 2006, formalapprovals have been granted for setting up of 579SEZs, of which 384 have been notified. Of the totalemployment provided to 9,45,990 persons in SEZsas a whole, that to 8,11,286 persons is incrementalemployment generated after February 2006 whenthe SEZ Act came into force. This is apart from themillion mandays of employment created by thedeveloper for infrastructure activities. While in 2010-11 physical exports from SEZs were worth `3,15,867.85 crore, in 2011-12 the figure had gone up` 3,64,477.73 crore in 2011-12, registering a growthof 15.4 per cent. The total physical exports fromSEZs in the first half of the current financial yearhave been to the tune of ` 239628.78 croreapproximately, registering a growth of 36 per centover exports in the corresponding period of theprevious year. The total investment in SEZs till 30September 2012 was ` 2,18,795.41 croreapproximately, including ̀ 2,14,759.90 crore in the
http://indiabudget.nic.in

165International Trade
Box 7.4 : Some important trade policy measuresBudget related
Imports of equipment for initial setting up or substantial expansion of fertilizer projects fully exempted from basiccustoms duty of 5 per cent for a period of three years up to 31 March 2015; and basic customs duty on some water-soluble fertilizers and liquid fertilizers other than urea reduced from 7.5 per cent to 5 per cent and from 5 per cent to 2.5per cent.
Concessional import duty available for installation of mechanized Handling Systems and Pallet Racking Systems inmandis or warehouses extended for horticultural produce.
Full exemption from basic customs duty for coal-mining projects. Basic customs duty on plant and machinery imported for setting up or substantial expansion of iron ore pellet plants
or iron ore beneficiation plants reduced from 7.5 per cent to 2.5 per cent. Full exemption from basic customs duty of 5 per cent for automatic shuttle-less looms and reduction in basic customs
duty on wool waste and wool tops from 15 per cent to 5 per cent. Basic customs duty increased on standard gold bars; gold coins of purity exceeding 99.5 per cent and platinum from 2
per cent to 4 per cent and on non-standard gold from 5 per cent to 10 per cent.
Credit related In November 2011, the RBI increased the all-in cost ceilings for External Commercial Borrowings (ECBs) increased to
350 basis points (bps) over 6-months Libor/Euro Libor/Euribor for a maturity period between three and five years and500 bps over 6-months Libor/Euro Libor/Euribor for a maturity period more than five years. Accordingly the all-in costceiling on trade credits has also been increased to 350 bps over 6-months Libor/Euro Libor/Euribor until 31 March 2013.
With effect from 5 May 2012, banks were allowed to determine their interest rates on export credit in foreign currencywith the objective of increasing the availability of funds to exporters.
On 18 June 2012, the RBI enhanced the eligible limit of the export credit refinance (ECR) facility for scheduled banks(excluding regional rural banks [RRB]) from 15 per cent of the outstanding export credit eligible for refinance to 50 percent, with effect from 30 June 2012. The objective was to provide additional liquidity support to banks of over Rs 300billion. The rate of interest charged on the ECR facility was retained at the prevailing repo rate under the liquidityadjustment facility (LAF).
The 2 per cent Interest Subvention Scheme, earlier meant only for handlooms, handicrafts, carpets, and SMEs, wasextended on 1 April 2012 to 31 March 2013 for labour-intensive sectors also, viz. toys, sports goods, processedagricultural products, and readymade garments. This was further extended upto 31 March 2014 and 134 tariff lines ofengineering goods were also included in the scheme.
Foreign Trade Policy Measures in 2012-13
Incentive on Incremental Exports: Incentives to be granted on incremental exports made during the period January-March 2013 over the base period January-March 2012. The incentive to be granted to an Importer and Exporter Code(IEC) holder at the rate of 2 per cent on incremental growth of exports made to the USA, Europe, and Asian countriesduring this particular quarter, i.e. January-March 2013.
Export Promotion Capital Goods (EPCG) Scheme: Zero Duty EPCG Scheme extended up to 31t March 2013 and itsscope enlarged. Export obligation under this scheme to be 25 per cent of the normal export obligation for export ofproducts from north-eastern states and export of specified products through notified Land Customs Stations of thenorth-eastern region provided additional incentive to the extent of 1 per cent of Free on Board (FOB) value of exports.
Support for Export of Green Technology Products: To promote exports of 16 identified green technology products,export obligation for manufacturing of these products under the EPCG Scheme reduced to 75 per cent of the normalexport obligation.
Support for Infrastructure for the Agriculture Sector: Status holders exporting products under ITC (HS) Chapter 1 toChapter 23 (both inclusive) are getting Duty Credit Scrip equivalent to 10 per cent of FOB value of agricultural productsso exported. Import of 14 specified equipments have now been notified in Appendix 37 F for setting up of pack- housesbesides import of capital goods and equipment for cold storage units, pack-houses, etc.
Incentives for Promoting Investment in Labour-intensive Sectors: Status holders issued status holders incentive scrip(SHIS) to import capital goods for promoting investment in upgradation of technology of some specified labour-intensive sectors like leather, textile & jute, handicrafts, engineering, plastics and basic chemicals. Up to 10 per cent ofthe value of these scrips will be allowed to be utilized to import components and spares of capital goods importedearlier.
(Contd....)
http://indiabudget.nic.in

166 Economic Survey 2012-13
Market and Product Diversification: Seven new markets have been added to the Focus Market Scheme (FMS) and sevento the Special Focus Market Scheme (Special FMS). Forty-six new items have been added to the Market Linked FocusProduct Scheme (MLFPS). The MLFPS has been extended till 31 March 2013 for exports to the USA and EU in respectof items falling under Chapter 61 and Chapter 62. Around 100 new items have been added to the Focus Product Scheme(FPS) list. Three new items have been added to the Vishesh Krishi and Gram Udyog Yojana (VKGUY). Additionalmeasures announced as trade facilitation measures by widening and deepening of export incentives under chapter 3 ofFTP in December, 2012 to be made effective from 01.01.2013. These include addition of 5 new markets to FMS, one newmarket to Special FMS, 62 new items to MLFPS and 102 new items to FPS.
Simplification of Procedures: Import under advance authorization (AA) permitted at any of the Electronic DataInterchange (EDI) ports, irrespective of the EDI port in which the AA has been registered. There would be no requirementof Telegraphic Release Advice (TRA). Export shipments from Delhi and Mumbai through post, courier, or e-Commerceto be entitled for export benefits under the FTP.
New 'e-BRC' Initiative: A major EDI initiative the 'e-BRC' launched which would herald electronic transmission offoreign exchange realization from the respective banks to the Directorate General of Foreign Trade (DGFT) server on adaily basis. The exporter will not be required to make any request to the bank for issuance of a bank export andrealization certificate (BRC).
Box 7.4 : Some important trade policy measures (Contd...)
newly notified zones. As per the provisions of theSEZ Act 2005, 100 per cent FDI is allowed in SEZsthrough the automatic route. A total of 160 SEZsare exporting goods and services. Of this 93 are IT/ITES, 17 multi-product and 50 other sector-specificSEZs. The total number of units in these SEZs is3308.
Contingency Trade Policy and Non-TariffMeasures
7.40 Anti-dumping investigations initiated by allcountries, at a high in 2001 declined almost steadilytill 2007. They picked up once again in 2008 butstarted declining to reach a low in 2011. However, in
2012 they have again increased with 114investigations (up to June) compared to 68 in 2011(up to June). In 2011 India topped the list of countriesinitiating such investigations, but in 2012 (up to June)Brazil is at the top followed by Argentina and Canada.India, the US, and EU with seven investigations eachare at fourth spot (Table 7.10)
7.41 During 2012-13 (1.4.2012 to 31.12.2012), 10fresh cases have been initiated by the DirectorateGeneral of Anti-dumping and Allied Duties (DGAD).The countries involved in these investigations areChina PR, the European Union, Korea RP, Malaysia,Mexico, Taiwan, Thailand, Turkey, Saudi Arabia, andthe USA.
Table 7.10 : Investigations initiated by top ten users of Anti-Dumping Measures 1995-2012Country 1995 2001 2002 2003 2005 2007 2008 2009 2010 2011 2011 2012 1995- Jan. -June 2012*India 6 79 81 46 28 47 55 31 41 19 10 7 663
United States 14 77 35 37 12 28 16 20 3 15 9 7 465
European Union 33 28 20 7 24 9 19 15 15 17 8 7 444
Argentina 27 28 14 1 12 8 19 28 14 7 4 10 301
Brazil 5 17 8 4 6 13 23 9 37 16 11 26 258
Australia 5 24 16 8 7 2 6 9 7 18 2 6 241
South Africa 16 6 4 8 23 5 3 3 0 4 1 0 216
China 0 14 30 22 24 4 14 17 8 5 0 4 195
Canada 11 25 5 15 1 1 3 6 2 2 0 10 165
Turkey 0 15 18 11 12 6 23 6 2 2 1 6 154
All countries 157 372 315 234 201 165 213 209 172 155 68 114 4125
Source : WTO *Upto June 2012.
http://indiabudget.nic.in

167International Trade
7.42 While the OECD (Organization for EconomicCooperation and Development) - WTO - UNCTAD(United Nations Conference on Trade andDevelopment) joint report of October 2012 on G-20[Group of 20] Trade and Investment Measures haspointed towards a slowdown in trade-restrictivemeasures, the persistence of the global crisis hasadded to political and economic pressures ongovernments to resort to contingency trade policiesand non-tariff measures (NTMs). Moreover the newmeasures implemented over the past five monthsthat can be considered as restricting or potentiallyrestricting trade add to the restrictions adopted sincethe outbreak of the global crisis. The trade coverageof the restrictive measures put in place since October2008, excluding those that have been terminated, isestimated to be around 3 per cent of worldmerchandise trade and 4 per cent of the trade of G-20 economies.
WTO NEGOTIATIONS AND INDIA
7.43 The Doha Round of trade negotiations in theWTO which began in 2001 remains unfinished dueto differences among members on various issues.The Eighth Ministerial Meeting of the WTO whichwas held in December 2011 in Geneva providedpolitical guidance to the members to resolve theissues involved. However, there was no significantprogress in 2012. Efforts are being made for an earlyharvest on some issues in time for the NinthMinisterial Conference of the WTO (MC9) to be heldin December 2013. India is of the view that any earlyoutcome of the negotiations should invariablyaddress issues of interest to the developingcountries, especially the least developed countries(LDCs) and the small vulnerable economies (SVEs).
7.44 A Draft Consolidated Negotiating Text onTrade Facilitation was worked out by the WTOmembers on 14 December 2009. The Draft Text hassince been revised fourteen times (till December2012) through discussions in the meetings of theNegotiating Group on Trade Facilitation (NGTF). Indiais actively engaged in these negotiations and hasalso tabled a few proposals on 'CustomsCooperation', 'Rapid Alerts System of CustomsUnion', and 'Appeal Mechanism'. The Draft Text,however, lacks internal balance. The developedcountries are holding up the laws and procedures oftheir own countries as benchmarks and want thedeveloping countries to replicate them. Developing
countries have by and large adopted a defensiveapproach in the negotiations. The developed countriesand a few developing countries are making efforts toharvest 'Trade facilitation' for an early outcome, intime for MC9. India along with most of the developingcountries wants issues of market access and tradefacilitation to be balanced with developmental issuessuch as duty free quota, free market access forLDCs, and acceptance of the modalities for reducingcotton subsidies. The G33 group of countries, whichis a coalition of 46 developing countries, includingIndia, has tabled a proposal on food security in theWTO on 16 November 2012. The proposal is for anamendment to certain provisions of the WTOAgreement on Agriculture to allow developingcountries greater flexibility in their public stockholdingoperations for food security purposes. The issue offood security is very important for India and anyconcession on the trade facilitation front needs tobe balanced by acceptance of the G33 proposal inany package deal for MC9.
7.45 During the current year, some of the developedcountry members of the Information TechnologyAgreement (ITA) of WTO viz. the USA, EuropeanUnion, and Japan, have proposed expansion of theagreement (called ITA-2) to increase the coverage ofIT products on which customs duty would be boundat zero, addressing non-tariff measures, andexpanding the number of signatory countries toinclude new signatories such as Argentina, Brazil,and South Africa. The proponents of ITA expansionhave prepared a consolidated list containing around350 IT products (combining products of interest toall proponents of ITA-2) on which tariff reductionsare being sought. This is under active discussion inthe WTO and India is carefully examining theproposal.
7.46 Negotiations in services have continuedprimarily in the plurilateral format. Intensivenegotiations were held in 2009, 2010, and alsotill the first half of 2011.These efforts culminatedin a report by the Chair of the Committee on Tradein Services - Special Session (CTS-SS) and allsubsidiary bodies under the CTS in April 2011.The Chair's report puts forth two views. Thedeveloped countries' view is that further progresson market access could include the binding ofautonomous liberalization where possible,improved levels of access under commercialpresence mode, that is, Mode 3 (includingrestrictions on foreign equity participation and
http://indiabudget.nic.in

168 Economic Survey 2012-13
Box 7.5 : India's Regional Trading Arrangements: Recent Developments
Agreement on South Asia Free Trade Area (SAFTA): The SAFTA Agreement was signed on 6 January 2004 andcame into force on 1 January 2006. Under SAFTA, India has granted zero basic custom duty to all LDCs, viz.Afghanistan, Bangladesh, Bhutan, and Maldives, on all items except 25 items relating to alcohol and tobacco. Under theSAFTA Agreement, India has reduced the SAFTA Sensitive List for non-LDCs from 878 to 614 by reduction of 264 tarifflines w.e.f. 6 September 2012. As per the schedule of Tariff Liberalisation Programme (TLP) under SAFTA, India hasbrought down its peak tariff rates to 5 per cent w.e.f. 1.1.2013
India-Thailand FTA, Early Harvest Scheme (EHS) under the Framework Agreement for establishing India-Thailand FTA: On 9th October 2003, India and Thailand signed a Framework Agreement for establishing an India-Thailand FTA, which includes trade in goods, trade in services, investment, and other areas of economic cooperation, tobe concluded as a single undertaking. Under the EHS, tariff has gradually been eliminated on a list of 82 common itemssimultaneously by both sides between 1 September 2004 and 31 August 2006. Under the India-Thailand FTA, it isproposed to provide ASEAN plus tariff concessions. So far 26 rounds of the India-Thailand Trade NegotiationCommittee (ITTNC) meetings have been held. The last round was held on 26-27November 2012 in New Delhi.
India-ASEAN Comprehensive Economic Cooperation Agreement (CECA): Services and Investment Agreements.The Trade in Goods Agreement, which was signed on 13 August 2009 under the broader framework of the CECAbetween India and ASEAN has already come into force. Conclusions of negotiations for the Services Agreement andInvestment Agreement have been announced during the ASEAN-India Commemorative Summit held on 20 December2012 in New Delhi. Legal scrubbing for these Agreements will be finalized by February,2013. The Agreement will besigned during ASEAN Economic Ministers (AEM)-India Consultations in August 2013.
Regional Comprehensive Economic Partnership (RCEP) Agreement among ASEAN + 6 (Australia, China, India,Japan, Korea, and New Zealand): During the 20th ASEAN Summit held in Cambodia in April 2012, ASEAN Statesagreed to move towards establishing an RCEP involving ASEAN and its FTA partners. The objective of launching RCEPnegotiations is to achieve a modern, comprehensive, high-quality, and mutually beneficial economic partnership agreementamong the ASEAN member States and ASEAN's FTA partners. The RCEP will cover trade in goods, trade in services,investment, economic and technical cooperation, intellectual property, competition, dispute settlement, and otherissues.
India - EU Broad Based Trade and Investment Agreement (BTIA): Fifteen rounds of negotiations and a number ofintersessional and Chief Negotiator level meetings have been held till date. The 15th round was held during 4-7December, 2012 in New Delhi. Chief negotiator level meeting was held on 29-30 January, 2013 in New Delhi.
Global System of Trade Preferences (GSTP): The Agreement establishing the GSTP among developing countries wassigned on 13 April 1988 at Belgrade following the conclusion of the First Round of Negotiations. Forty-three countrieshave ratified the Agreement and become participants. India has offered tariff concessions on 70.08 per cent of dutiabletariff lines with an across-the-board margin of preference (MoP) of 20 per cent on the applied tariffs prevailing on thedate of import. India has also unilaterally offered special concessions to LDC participants by granting an MoP of 25 percent on 77 per cent of all its dutiable tariff lines. The Cabinet Committee on Economic Affairs (CCEA), in its meeting on23 August 2012, has granted approval for implementing India's schedule of concessions. The tariff concessions are tobe implemented thirty days after a minimum of four participants ratify their schedules of concessions. So far India andMalaysia have ratified their schedules.
Source: Department of Commerce, Ministry of Commerce and Industry, Government of India.
forms of commercial presence), as well as a robustand satisfactory outcome in Mode 4 (presence ofnatural persons). The developing countries' viewis that there is an imbalance in market accessnegotiations, as evidenced by the fact thatdeveloping country flexibilities have not beentaken into account in other members' requests,sectors of export interest to developing countriesare not being fully reflected in developed members'offers; developing countries have already made a
significant contribution to the Doha Round; andsome plurilateral requests and recent proposalshave embodied a level of ambition going beyond thatagreed in Annex C of the Hong Kong MinisterialDeclaration. India has already made considerableimprovement in its revised offer (from 37 sub-sectorsin the Uruguay Round to 95 in the Revised Offer).Some of the major developed country members haveshown nil or little movement in their Mode 4 offers,which is an area of interest to us.
http://indiabudget.nic.in

169International Trade
Box 7.6 : Diversifying Technology-intensive Export Products through the Regional ProcessTwo trends in international trade are of great importance in the current global economic environment. One, the growingimportance of technology-intensive exports and two, the increasing role of regional trade.
Tradable products can be classified into five different groups based on the technology intensity. (1) Primary products havevery little technology basis for retaining comparative advantage, (2) resource-based products having competitive advantages,generally arising from local availability of natural resources and using simple and labour-intensive technology, (3) lowtechnology products having simple technologies mainly embodied in capital equipment, with labour constituting a majorelement of cost in competitiveness and operating under low-scale economies with low entry barriers, (4) medium technologyproducts comprising skill- and scale-intensive technologies in capital and intermediate products where product developmenttakes place with complex technologies, involving high level of research and development (R&D) expenditure and whichrequire lengthy learning periods and are subject to high entry barriers, and (5) high technology products having advancedand fast changing technologies with emphasis on product design requiring high R&D investment, sophisticated infrastructures,high levels of specialized technical skills, and close interactions between firms and universities/research institutions. Trendsin global trade indicate that there has been a proliferation of trade in technology-intensive manufacturing products. Amongthe globally dynamic products of trade, a significant proportion of items are high and medium technology-intensive items.India has been diversifying into technology intensive products with a fair amount of success with exports of high technologyand medium technology products growing faster than the total exports of India during 2004-2011 (Table 1). Further,diversifying India's exports to include more technology-intensive product groups is of vital importance.
Table 1 : India's Trade with technology Intensive products
CAGR
2004 to 2007 2007 to 2011 2004 to 2011
1 Primary products 25.3 17.6 20.8
2 Resources based products 32.4 20.0 25.2
3 Low technology products 13.3 14.5 14.0
4 Medium technology products 27.0 20.0 23.0
5 High technology products 26.6 26.9 26.8
Total exports 24.3 18.8 21.2
In the present global trading environment, export promotion is more strategically pursued through the regional approach.India's export compound annual growth rate (CAGR) is faster with most of the 21 RTAs (covering more than 100 countries)considered here (based on India's level of exports with them, India's membership in some of them, and India's engagementwith other continents including Africa), than its overall export CAGR of 19.1 per cent during 1999-2000 to 2010-11 (Table2). Asia is emerging as the most important destination for India's exports through the regional process.
Export potential in medium and high technology-intensive products varies across different RTAs. Decomposition of exportpotential products into their technology intensities in different regional blocs shows possibility of trade diversification forIndia in hi-tech product segments. Empirical evidence suggests that India can diversify its exports of technology-intensiveproducts to RTAs. The EU, NAFTA, RCEP, APTA, ASEAN, IOR-ARC, etc. could be some important export destinationswith sizeable trade opportunities for technology-intensive exports, though some of these regional arrangementsoverlap.
(Contd....)
BILATERAL AND REGIONALCOOPERATION
7.47 While India has always stood for an open,equitable, predictable, non-discriminatory, and rulebased multilateral trading system(MTS), it has alsobeen active in recent years with regional tradingarrangements (RTAs), to serve as 'building blocks'
for achieving trade liberalization and complementingthe MTS. So far, India has signed 10 free tradeagreements (FTAs) and 5 preferential tradeagreements (PTAs) and these FTAs/PTAs arealready in force. Further, India is currently negotiating17 FTAs, including review/expansion of some of theexisting ones. (See Box 7.5)
http://indiabudget.nic.in

170 Economic Survey 2012-13
Table 2: India's Export Performance with Selected RTAs/FTAs
RTA Year Value of Share in Export Trade Share in total opportunities availableof exports export CAG Ropport- in each RTA(%)
Eestabils- (US$ % 2010- unities Primary Resource Low Medium Highhment million) 1999- 2010- 11 over (US$ Products based tech- tech- tech-
2010-11 2000 11 1999 billion nology nology nology2000
1 2 3 4 5 6 7 8 9 10 11 12
With India's membershipIOR-ARC 1997 77097 17.9 30.7 25.1 51.8 22.5 17.5 11.3 28.0 20.6RCEP/EAS 2005 51723 14.7 20.6 22.8 155.3 27.3 18.9 8.5 23.3 22.0BIMST-EC 1997 11673 4.8 4.7 18.6 9.1 38.0 10.8 11.9 24.9 14.4SAARC 1985 11634 3.9 4.6 21.0 2.5 33.1 25.4 9.7 23.1 8.7IBSA 2003 7948 1.1 3.2 30.6 11.2 19.8 17.2 7.9 38.8 16.3With/proposed tradeaAgreementEU 1992 45980 26.2 18.3 15.3 205.2 19.9 17.8 16.6 30.4 15.3GCC 1981 42395 8.7 16.9 26.5 10.0 14.8 17.0 17.1 40.6 10.4ASEAN 1967 25600 6.1 10.2 24.8 35.1 24.7 17.9 9.8 24.5 23.1COMESA 1994 7128 2.3 2.8 21.6 3.8 21.1 29.7 10.5 30.5 8.2MERCOSUR 1991 4730 0.7 1.9 30.4 12.2 14.1 18.6 9.2 41.9 16.2SACU 1969 4118 0.8 1.6 27.2 3.7 22.9 17.8 9.9 34.5 14.9Without trade agreementNAFTA 1992 27538 24.8 11.0 10.6 93.8 17.8 13.1 14.9 33.6 20.6APTA 1975 25887 5.9 10.3 25.4 79.5 25.0 19.6 6.2 24.9 24.3SADC 1992 8158 1.9 3.3 25.3 5.3 19.1 24.1 10.2 34.0 12.6LAIA 1980 7443 1.5 3.0 26.4 28.4 12.1 17.4 12.9 39.2 18.4EAC 1967 3994 0.7 1.6 29.0 0.9 12.9 47.1 7.3 25.3 7.3ECOWAS 1975 3842 1.5 1.5 19.6 3.3 29.8 31.6 12.3 20.6 5.6CIS 1991 2607 2.9 1.0 8.5 14.8 12.3 15.1 14.2 42.0 16.4ECCAS 1985 1122 0.1 0.4 33.6 0.3 13.7 30.0 14.9 33.0 8.3With bilateral trade agreementISLFTA 2000 3503 1.8 3.9 27.7 0.6 20.2 19.1 6.3 20.5 34.0ISCECA 2003 9816 1.4 1.4 19.4 0.1 25.8 30.7 16.1 22.5 4.9
* Year of establishment / entered into force.
Focused product-market diversification trade and marketing strategies should necessarily entail diversifying India's tradebasket, particularly in favour of high and medium technology-intensive products in the targeted RTAs. While this type offocus could also help in avoiding the adverse effects of some RTAs concentrating on primary products involving livelihoodconcerns of a significant portion of our agricultural and rural communities, care should be taken to avoid inverted dutystructures in the 'quid-pro-quo' during RTA negotiations.
Source: Based on study by S. K. Mohanty, (2013), 'Examining Diversification of India's Exports to Developing Countries in aSituation of Partially Affected Global Economy by Recession', Backgrounder for the Economic Survey, MoF, GoI.
Note: The RTAs included in the analysis are: Indian Ocean Rim Association for Regional Cooperation (IOR-ARC), RegionalComprehensive Economic Partnership (RCEP)/ East Asian Summit (EAS), Bay of Bengal Initiative for Multi-sectoral Technical andEconomic Cooperation (BIMST-EC), South Asian Association for Regional Cooperation (SAARC), India-Brazil-South Africa Initiative(IBSA), the European Union (EU), Gulf Cooperation Council (GCC), Association of South East Asian Nations (ASEAN), CommonMarket for Eastern and Southern Africa (COMESA), Southern Common Market (MERCOSUR), South African Customs Union(SACU), North American Free Trade Agreement (NAFTA), Asia-Pacific Trade Agreement (APTA), South African DevelopmentCommunity (SADC), Latin America Integration Association (LAIA), East African Community (EAC), Economic Community ofWestern African States (ECOWAS), Commonwealth of Independent States (CIS), Economic Community of Central African States(ECCAS), India-Sri Lanka Free Trade Agreement (ISLFTA), India-Singapore Comprehensive Economic Cooperation Agreement(ISCECA).
Box 7.6 : Diversifying Technology-intensive Export Products through the Regional Process (Contd..)
7.48 In the current situation when WTOnegotiations are stalled, world trade has sloweddown, and the shadow of protectionist measureslooms large, a strategy of diversifying technology
intensive exports through the regional processcould lead to further trade promotion with tradeliberalization (Box 7.6).
http://indiabudget.nic.in

171International Trade
Box 7.7 : Reviving and Accelerating India's Trade: Micro, Sector- and Port-specific issuesSome trade-related issues and suggested policies at the micro, sector-specific and port-specific levels are as follows:Infrastructure Related: Even the best of Indian ports do not have state-of-the-art technology as in Singapore, Rotterdam,and Shanghai. Port Infrastructure issues include poor road conditions and port connectivity, congestions, vessel berthingdelays, poor cargo handling techniques and equipment., resulting in multiple handlings, increased lead time, high transactioncosts and thus loss of market competitiveness.Port-specific infrastructure issues include restriction in port access points to Chennai Port, various surcharges like congestionsurcharge and Chennai trade recovery charge on the users of Chennai Port, container relocation charges, imbalance surcharge,etc. levied without any legal sanction with the charge on the trade component being very low and port congestion at theJawaharlal Nehru Port Trust (JNPT) Port at Mumbai, entry gates closing prematurely resulting in export consignmentsbeing dumped in the buffer yard at a very high cost and delay in shipments, and many vessels bypassing the JNPT Portcarrying containers to be delivered at their next voyage thereby delaying vital raw materials for the industry.Trade Facilitation Measures: While India is ranked 132 in the 'ease of doing business', on 'trading across borders' India isranked 127 with Singapore at first rank and China at 68th as per the World Bank and IFC 'Doing Business 2013'. Indiarequires 9 export documents to be cleared, while China needs 8, with good practice economies like France needing 2. Timeto export is 16 days for India and five for Denmark. Cost to export is $1120 per container, compared to $580 in China and$435 in Malaysia. Number of import documents that need clearance is 11 in India, 5 in China, and 2 in France. Time toimport is 20 days in India and 4 in Singapore. Cost to import is $1200 per container in India, $615 in China, and $439 inSingapore. There are many trade facilitation measures that can help the export sector without any cost to the governmentexchequer. These include simplification of the multiple documentation procedures as on an average an Indian exporter isrequired to sign at about 130 places to complete an export transaction (from pre-shipment till receiving export relatedbenefits) as per the Federation of Indian Export Organisations (FIEO). These procedures and costs need to be reduced tothe barest minimum.Other procedural and documentation reforms include abolishing the system of printing and certifying export promotion(EP)copies of shipping bills, implementing 24x7 system for Container Freight Stations (CFSs) , reducing unnecessary paperwork related to renewal of letters of undertaking (LUT) for export without payment of duty, discouraging the practice ofinsistence by banks for L/Cs through their branches in foreign countries, merging or streamlining the Market AccessInitiative (MAI) & Marketing Development Assistance (MDA) schemes, removing the annual average export performancecondition under the EPCG scheme, and addressing the issue of trade litigations.Some port-specific trade facilitation measures include addressing the issues of high terminal handling charges (THC) andincrease in cut-off time resulting in containers missing the intended vessels and non-availability of electronic data interchange(EDI) facility inside the International Container Transhipment Terminal (ICTT) in Vallarpadam Port; and streamlining thetiming of the Customs office at the Precious Cargo Customs Clearance Centre (PCCC), Mumbai, as it is open till 1.30 p.m.while the timing for receiving goods/parcels for exporting is till 4.00 p.m..Tax and Customs Duty Related: These include fixing a time limit for disbursal of duty drawback, service tax refunds, andcentral excise rebate claims to the exporters as delays in the release of these claims adversely affect working capital, makingthem less competitive; crediting payment of central excise rebate claims directly to the bank account of the exporter;introducing value added tax (VAT) refund system for purchases in India by foreigners which can increase purchases inIndia by foreign tourists; and reviewing inverted duty structure under the India-Thailand FTA as finished jewellery importsfrom Thailand are cheaper than primary gold (raw material) available in India.
Source: H.A.C. Prasad, (2012). 'Emerging Global Economic Situation: Its impact on India's Trade and some Policy Issues', Workingpaper No 1/2012-DEA, Ministry of Finance.
CHALLENGES AND OUTLOOK
Outlook7.49 The prospects for world trade and India's tradeare still uncertain. Some green shoots seem to haveappeared with the import growth rates of the worldand some of India's important trading partners likethe USA, China, and Hong Kong showing slightupward movement in the last two months. However,
the Baltic Dry Index (BDI), a good proxy for therobustness of world trade, which started falling fromits peak (in the last five years) of 11709 on 19 May2008 has not recovered even halfway. The smallbouts of recovery in the BDI, like the recent recoveryin November-December 2012 which is among thehighs in recent months, can in no way be comparedto the highs of 2008. Even this upswing has beenshort-lived, being succeeded by a downswing in the
http://indiabudget.nic.in

172 Economic Survey 2012-13
beginning of January 2013 causing it to reach a lowof 698 on 2 January2013. There has since been amarginal recovery for the BDI to its current level of792 (28.1.2013).
7.50 This also suggests that the outlook for India'smerchandise trade and shipping services which aredirectly dependent on merchandise trade is stilluncertain. While there has been some pick-up inimport growth rates of some of our trading partnerslike the US, Hong Kong, Singapore and China in thelast two months as stated earlier, a look at theirimport growth rates from India in recent monthsshows a rather mixed picture. While the US's andJapan's imports from India grew by 12.6 per centand 1.8 per cent respectively in 2012 (January-November), China's and Hong Kong's imports fromIndia fell by 19.6 per cent and 17.9 per centrespectively in 2012 (full year) and Singapore'simports from India fell by 8.3 per cent in 2012(January-November).
7.51 Import moderation on the other hand may belimited despite fall in gold imports (as a result of thepolicy measures taken by the government), asinternational gold prices are still high and oil pricescontinue to hover around the US$ 110 per barrelmark.
7.52 Services export growth being equallydependent on global growth and trade has been veryerratic in the post global crisis period. On the otherhand, if imports of services continue to rise and thepositive balance of trade in services continues to fallas in the first half of 2012-13, the cushion availablefor lowering the trade deficit would be limited.
Challenges
7.53 The challenges for India on the trade front aremany. While India has successfully diversified its
export basket, more needs to be done on the productdiversification front. It also has to reposition itself inits traditional areas of strength like textiles and leather& leather manufactures where it has lost considerableground, while at the same time making forays intonew areas. With multilateral trade negotiationsstalled, and RTAs on the rise, India also has to followa strategic regional trading policy focusing on thepotential technology-intensive items in the moreimportant RTAs. Though geopolitical considerationsare important, India may have to bargain more in itsregional trade negotiations, particularly in caseswhere livelihood concerns of large pockets of thepopulation are involved, There is also need to addressthe inverted duty structure in sectors like electronics,textiles, and chemicals and the artificial inverted dutystructure caused by some FTAs/RTAs. On theservices front, a gold mine of opportunity in sectorslike tourism including health tourism is waiting to betapped.
7.54 The recent global slowdown has thrown upnew challenges for India with its export growth beingcontinuously negative since May 2012 compared tovery high growth rates of even above 50 per cent insome months of the previous year. With limited fiscalspace available for the government and withprotectionist measures of trading partners showingsigns of rising, the policy options left are more atthe micro level as indicated in Box 7.7.
7.55 Thus there are many micro, port-specific andsector-specific issues that need urgent attention.These are related to infrastructure, trade facilitation,tax and tariffs, and credit, and can realistically beaddressed in the short and medium term. Addressingthese issues, as is currently being done by thegovernment, can exponentially promote India's exportgrowth.
http://indiabudget.nic.in

Agriculture and FoodManagement CHAPTER
8
Indian agriculture is broadly a story of success. It has done remarkably well in
terms of output growth, despite weather and price shocks in the past few years. Indiais the first in the world in the production of milk, pulses, jute and jute-like fibres,
second in rice, wheat, sugarcane, groundnut, vegetables, fruits and cotton production,
and is a leading producer of spices and plantation crops as well as livestock, fisheriesand poultry. The Eleventh Five Year Plan (2007-12) witnessed an average annual
growth of 3.6 per cent in the gross domestic product (GDP) from agriculture and
allied sector against a target of 4.0 per cent. While it may appear that the performanceof the agriculture and allied sector has fallen short of the target, production has
improved remarkably, growing twice as fast as population. India's agricultural
exports are booming at a time when many other leading producers are experiencingdifficulties. The better agricultural performance is a result of: a) farmers' response
to better prices; b) continued technology gains; and c) appropriate and timely policiescoming together. Yet India is at a juncture where further reforms are urgently required
to achieve greater efficiency and productivity in agriculture for sustaining growth.
There is need to have stable and consistent policies where markets play a deservingrole and private investment in infrastructure is stepped up. An efficient supply chain
that firmly establishes the linkage between retail demand and the farmer will be
important. Retionalization of agricultural incentives and strengthening of food pricemanagement will also help, toegether with a predictable trade policy for agriculture.
These initiatives need to be coupled with skill development and better research and
development in this sector along with improved delivery of credit, seeds, riskmanagement tools, and other inputs ensuring sustainable and climate-resilient
agricultural practices. Finally, while the sharp increase in prices of food articles,
especially proteins, fruits and vegetables, and the growing foodgrains stocks in publicsector continue to be subjects of debate, these may be the pointers towards the need
for both relative price shifts responding to shifts in demand and reconsidering
traditional instruments of food management.
8.2 Although agriculture, including allied activities,accounted for only 14.1 per cent of the GDP atconstant (2004-5) prices in 2011-12, its role in thecountry's economy is much bigger with its share intotal employment according to the 2001 census,continuing to be as high as 58.2 per cent. Thedeclining share of the agriculture and allied sector in
the country's GDP is consistent with normaldevelopment trajectory of any economy, but fastagricultural growth remains vital for jobs, incomes,and the food security. The growth target for agriculturein the Twelfth Five Year Plan remains at 4 per cent,as in the Eleventh Five Year Plan.
http://indiabudget.nic.in

174 Economic Survey 2012-13
PERFORMANCE OF THE AGRICULTURESECTOR
8.3 Average annual growth of the agriculture andallied sector during the Eleventh Five year Plan at3.6 per cent fell short of the 4 per cent growth target.Realised growth, however, has been much higherthan the average annual growth of 2.5 and 2.4 percent achieved during the Ninth and Tenth Plans,respectively. Growth has also been reasonably stabledespite large weather shocks during 2009 (deficientsouth west monsoon), 2010-11 (drought/deficientrainfall in some states), and 2012-13 (delayed and
deficient monsoon). An important reason for thisdynamism has been due to a step-up in the grosscapital formation (GCF) in this sector relative to GDPof this sector, which has consistently been improvingfrom 16.1 per cent in 2007-8 to 19.8 per cent in2011-12 (at constant 2004-5 prices) (Table 8.1).
8.4 Overall GCF in agriculture (including the alliedsector) almost doubled in last 10 years and registereda compound average annual growth of 8.1 per cent(Fig 8.1). Rate of growth of GCF accelerated to9.7 per cent in the Eleventh Plan (2007-12) comparedto a growth of 2.7 per cent during the Tenth Plan
Table 8.1 : Agriculture Sector : Key Indicators(per cent at 2004-5 prices)
Sl. Item 2007-8 2008-9 2009-10 2010-11 2011-12 No. Ist Revision
1 Growth in GDP in Agriculture & Allied Sector 5.8 0.1 0.8 7.9 3.6Share of Agriculture & allied sectors in total GDP 16.8 15.8 14.6 14.5 14.1
Agriculture 14.3 13.4 12.3 12.3 12.0Forestry and logging 1.7 1.6 1.5 1.4 1.4Fishing 0.8 0.8 0.8 0.7 0.7
2 Share of agriculture & allied sectors in totalGross Capital Formation (GCF) 6.4 7.8 7.3 6.2 6.8
Agriculture 5.9 7.2 6.7 5.6 6.2Forestry and logging 0.1 0.1 0.1 0.0 0.1Fishing 0.5 0.5 0.5 0.5 0.5
3 GCF in Agriculture and Allied sectors asper cent to GDP of the sector 16.1 19.4 20.1 18.4 19.8
4 Employment in the agriculture sector asshare of total workers (Census 2001) 58.2
Source : Central Statistics Office, Directorate of Economics & Statistics (Department of Agriculture andCooperation) and Population Census 2001.
http://indiabudget.nic.in

175Agriculture and Food Management
(2002-07). Average annual growth of privateinvestment at 12.5 per cent during Eleventh Plan(first four years) was significantly higher as againstnearly stagnant investment during the Tenth Plan.
Rainfall Distribution during Monsoon 20128.5 The performance of Indian agriculture is stillheavily dependent on rainfall and south westmonsoon (June to September), comprising 75 percent of total annual rainfall, substantially affectsproduction and productivity of agriculture. During2012, south-west monsoon rainfall over the countryas a whole was 8 per cent less than the long periodaverage (LPA). The seasonal rainfall was 93 per centof its LPA over north-west India, 96 per cent overcentral India, 90 per cent over peninsular India, and89 per cent over north-east India. Out of a total of 36meteorological subdivisions in the country, 23received excess/ normal rainfall and in the remaining13 subdivisions rainfall was deficient (Table 8.2).
8.6 With more than half of the cultivated areadependent on monsoon, advance information aboutthe intensity and spread becomes very important.With the objective of improving monsoon forecastsfor the country over all temporal scales (short tomedium and long term), the Earth System ScienceOrganization (ESSO)/ Ministry of Earth Scienceshas initiated the National Monsoon Mission duringthe Twlefth Five Year Plan with an estimated budgetof ` 400 crore. Under this Mission, a dynamicframework for prediction of monsoon over all time
scales will be implemented during the next five years.Joint collaborative research projects will also beundertaken with national and international scientistsinvolved in monsoon research. This is a crucial steptowards improving the reliability of monsoon forecastsfor appropriate and timely policy interventions tosupport farmers and food management.
CROP PRODUCTION
8.7 During the Eleventh Plan period, foodgrainsproduction in the country recorded an increasingtrend, except in 2009-10 when total foodgrainsproduction declined to 218.1 million tonnes due tosevere drought experienced in various parts of thecountry. During 2011-12, total foodgrains productionreached an all-time high of 259.32 million tonnes.However, the production of 2012-13 kharif crops(Table 8.3) is likely to be adversely affected bydeficiency in the south-west monsoon and theresultant acreage losses. The overall area coverageat 665.0 lakh ha under foodgrains during kharif 2012-13 shows a decline of 55.8 lakh ha compared to720.86 lakh ha during kharif 2011-12 (fourth AE) .Output is expected to decline in all major crops.
Area, Production, and Yield of AgriculturalCrops8.8 There are limitations to the expansion of areafor cultivation. Multiple cropping, improvement in yieldlevels and shifts in area for certain crops hold thekey to the long-term output growth. An analysis of
Table 8.2 : Monsoon Performance 2003-2012 (June-September)Year Number of meteorological subdivisions Percentage of Percentage
districts with of long periodNormal Excess Deficient/ normal/ average rainfall
Scanty excess for the countryrainfall as a whole
2003 23 8 5 76 102
2004 23 0 13 56 87
2005 24 8 4 72 99
2006 21 6 9 60 100
2007 18 13 5 72 106
2008 31 2 3 76 98
2009 11 3 22 42 78
2010 17 14 5 70 102
2011 26 7 3 76 101
2012 22 1 13 58 92
Source : Indian Meteorological Department.
http://indiabudget.nic.in

176 Economic Survey 2012-13
Table 8.4 : CAGRs of Area, Production, and Yield Indices of Principal Crops during 1980-1 to 1989-90, 1990-1 to 1999-2000 (Base : TE 1981-2=100), and 2000-1 to 2011-12(Base: TE 1993-4=100) (% per annum)
1980-1 to 1989-90 1990-1 to 1999-2000 2000-1 to 2011-12*
Area Production Yield Area Production Yield Area Production Yield
Rice 0.41 3.62 3.19 0.68 2.02 1.34 0.00 1.78 1.78
Wheat 0.46 3.57 3.10 1.72 3.57 1.83 1.35 2.61 1.24
Coarse cereals -1.34 0.40 1.62 -2.12 -0.02 1.82 -0.81 3.01 3.85
Total pulses -0.09 1.52 1.61 -0.60 0.59 0.93 1.60 3.69 2.06
Sugarcane 1.44 2.70 1.24 -0.07 2.73 1.05 1.38 2.07 0.68
Total oilseeds 1.51 5.20 2.43 0.86 1.63 1.15 2.12 3.36 1.22
Cotton -1.25 2.80 4.10 2.71 2.29 -0.41 3.22 13.53 9.99Source : Department of Agriculture and Cooperation.*As per fourth AE.
the all-India compound annual growth rate (CAGR)in the indices of area, production, and yield of majoragricultural crops during the last three decades
indicates significant progress towards increasingproduction, yield levels and crop diversification(Table 8.4).
Table 8.3 : Agricultural Production of Principal Crops
Production in Million Tonnes/Bales Rate of GrowthCrop Season 2000-01 2006-07 2009-10 2010-11 2011-12 2012-13 CAGR 2012-13/
(AE) 2011-12/ 2011-122006-07
Rice Kharif 72.8 80.2 75.9 80.7 92.8 90.7 3.0 -2.3Coarse Cereals Kharif 24.9 25.6 23.8 33.4 32.5 28.5 4.9 -12.3Cereals Kharif 97.6 105.8 99.7 114.1 125.2 119.2 3.4 -4.8Pulses Kharif 4.5 4.8 4.2 7.1 6.1 5.5 4.9 -9.8Foodgrains Kharif 102.1 110.6 104 121.2 131.3 124.7 3.5 -5.0Oilseeds Kharif 11.94 14.01 15.73 21.92 20.7 19.5 8.1 -5.8Cotton * Kharif 9.52 22.63 24.02 33.0 35.2 33.8 9.2 -4.0Jute** Kharif 9.32 10.32 11.23 10.01 10.7 10.6 0.7 -0.9Sugarcane Kharif 295.96 355.52 292.3 342.38 361.0 334.5 0.3 -7.3
Coarse Cereals Total 31.1 33.9 33.5 43.7 42.04 38.47 4.4Cereals Total 185.7 203.1 203.4 226.5 242.23 232.57 3.6Pulses Total 11.1 14.2 14.7 18.2 17.09 17.58 3.8Foodgrains Total 196.8 217.3 218.1 244.8 259.32 250.14 3.6Oilseeds Total 18.44 24.29 24.88 32.48 29.8 29.5 4.2
Share of production in Kharif to total production (per cent)Total Cereals 52.6 52.1 49.0 50.4 51.7 51.3Total Pulses 40.5 33.8 28.6 39.0 35.7 31.3Total Foodgrains 51.9 50.9 47.7 49.5 50.6 49.9Total Oilseeds 64.8 57.7 63.2 67.5 69.5 66.1
Source : Directorate of Economics and Statistics, Department of Agriculture and Cooperation.
*Bales of 170 kgs each. ** Bales of 180 kgs each.
http://indiabudget.nic.in

177Agriculture and Food Management
8.9 Overall, the 1980-90 period witnessed relativelyhigher growth in production and yield in major cropscompared to the 1990-2000 period except for themarginal increase in growth of yield in coarse cerealsand the same levels of growth in production of wheatand sugarcane. Further, a lower growth (coarsecereals, pulses, sugarcane) and marginally highergrowth (rice, oilseeds) was observed in the area underthese major crops during the 1990-2000 period vis avis 1980-1990 except in wheat and cotton where
growth rate was 1.72 per cent and 2.71 per centrespectively. By and large the growth rates achievedin the 1980-90 period could not be sustained duringthe 1990-2000 period. In coarse cereals yieldincreases were able to offset a negative growth inarea. In both wheat and rice, in all the three subperiods, there was an increase in area and yield,though rate of increase in yield levels had significantlymoderated in latter periods. Yield levels significantlyimproved for cotton, pulses and coarse cereals during
Box 8.1 : Sugar sector Reforms in India India is the largest consumer and second largest producer of sugar after Brazil. Sugar and Sugarcane are notified as
essential commodities under the Essential Commodities Act 1955. The production of sugarcane during 2012-13 isestimated at 334.54 million tonnes. However the Indian sugar sector suffers from policy inconsistency andunpredictability. The Sugar industry in India is over-regulated and prone to cyclicality due to price interventions.Deregulation of the sugar industry has been widely debated for a long time. From a purely economic point of view,greater play of market forces would provide better prices and serve the interests of all stakeholders. The governmentshould come into the picture only in situations where absolutely necessary. Export bans and controls could be replacedwith small variable external tariffs to stabilize prices.
A report on 'Regulation of the Sugar Sector in India: The way forward' has been submitted by the Committee under thechairmanship of Dr C. Rangarajan, Chairman of the Economic Advisory Council to the Prime Minister. The waysforward suggested include: a) phasing out cane reservation area; b) dispensing with minimum distance criteria; c)dispensing with the levy sugar system; states that want to provide sugar under the PDS may procure it from themarket according to their requirement, fix the issue price and subsidize from their own budgets. Currently, there is animplicit cross-subsidy on account of the levy as sugar mills are under a transition, some level of central support to helpstates meet the cost to be incurred on this account may be provided for a transitory period; d) dispensing with theregulated release mechanism (of non-levy) sugar; e) stable trade policy; no quantitative or movement restrictions on by-products like molasses and ethanol and dispensing with compulsory jute packing. A stable, predictable, and consistentpolicy reforms have to be brought about in a fiscally neutral manner and issues considered for implementation in aphased manner.
Box 8.2 : Edible Oil Economy India is one of the largest producers of oilseeds in the world. However, 50 per cent of its domestic requirements are met
through imports, out of which crude palm oil and RBD palmolein constitute about 77 per cent and soyabean oilconstitutes about 12 per cent. Import dependence was about 3 per cent during 1992-3. The production of oilseeds,though it has increased in recent years (from 184.40 lakh tons in 2000-1 to 297.99 lakh tons in 2011-12), has not keptpace with the demand for edible oils in India. Imports have helped raise the per capita availability of edible oils whichhas increased from 5.8 kg in 1992-3 increased to 14.5kg in 2010-11.
One instrument for promoting future domestic production is calibration of the import duty structure. Large importsof edible oils are primarily due to competitive prices of edible oils in the international market and the import dutystructure which has been sharply reduced to near zero levels over time to protect consumers. India has a market sharethat allows it to set some independent tariff policy that can meet both goals better. Considering the situation, it is timeto frame a price band for edible oils in a manner that harmonizes the interests of domestic farmers, processors, andconsumers through imposition of import duty at an appropriate rate. The import duty would also generate revenue,which could also be utilized for an oilseeds development programme. Recently the tariff value of all edible oils whichhad remained unchanged since 2006 was updated to market levels. This is a right step for aligning the tariffs to currentprices for edible oils in the international market. By freezing the tariff value, imports had become more attractive thandomestic refining. Over time, domestic oil palm production may also gain.
India is also fortunate in having a wide range of oilseed crops grown in its different agro-climatic zones, including high-value premium crops. Recently export of edible oils in branded consumer packs upto 5 kg has been allowed withoutany quantitative limit having minimum export price (MEP) of US $ 1500 per ton in order to encourage export of highvalue premium edible oils. Farmers respond to prices. The aim of policy is to consistently enhance their competitiveness.
http://indiabudget.nic.in

178 Economic Survey 2012-13
2000-2012. Cotton and pulses have become two 'star'performers, with Bt cotton and the pulsesintensification programme being important reasons;oilseeds such as mustard and ground nuts too areresponding reasonably well to better prices, as isthe case in sugarcane (Boxes 8.1 and 8.2).
AGRICULTURAL INPUTS
8.10 Improvement in yield, which is the key to thelong-term growth, depends on efficient use of qualityseeds, fertilizers, pesticides, micronutrients, andirrigation. Each of these plays a role in determiningyield level and in turn augmentation in level ofproduction.
Seeds8.11 Seeds are a critical input for agricultural crops.Farmers typically rely on farm-saved seeds, over useof which leads to a low seed replacement rate andpoor yield. An Indian Seed Programme forencouraging the development of new varieties andprotecting the rights of farmers and plant breedershas been put in place with the participation of centraland state governments, the Indian Council ofAgricultural Research (ICAR), state agriculturaluniversities, seed cooperatives, and private sectors.A central-sector Scheme for Development andStrengthening of Infrastructure Facilities forProduction and Distribution of Quality Seeds withthe aim of making quality seeds of various cropsavailable to farmers at affordable price is underimplementation since 2005-6. As a result of thisinitiative, availability of certified quality seeds hasincreased from 140.5 lakh quintals in 2005-6 to 328.6lakh quintals in 2012-13; 426 seed-processing plantshave been sanctioned and an amount of Rs 37.24crore released to small entrepreneurs for creation of85.89 lakh quintal seed-processing capacity and30.30 lakh quintal storage capacity; and seed-processing capacity of 4.7 lakh quintals and seedstorage capacity of 2.4 lakh quintals has beencreated in the public sector during 2011-12 (up to31.10.2012). For achieving timely availability of seedsat affordable price to farmers in hilly/remote areas ofnorth-eastern states, a Transport Subsidy onMovement of Seeds scheme is in operation wherebygrants-in-aid of ` 12.6 crore was reimbursed tovarious implementing agencies for movement of 9.7lakh quintals of seeds during the Eleventh Five YearPlan. A Sub-Mission on Seed and Planting Materialunder the National Mission for Agricultural Extension
and Technology with an allocation of ̀ 2088 crore isunder consideration for the Twelfth Five Year Plan.
Mechanization and Technology8.12 Tractors are the main power source for variousfarm operations and India is the world leader in tractorproduction with over 5 lakh tractors producedannually. Studies reveal that adoption of appropriatemechanization of farm operations can increaseproduction and farm productivity by 10-15 per cent,cropping intensity by 5-20 per cent and effect savingsin seeds (up to 15-20 per cent), fertilizer andchemicals (up to 15-20 per cent), and time andlabour( up to 20-30 per cent). Progress in farmmechanisation at present is hindered by the low anderratic availability of farm power and shrinking holdingsizes. Average farm power availability for thecultivated areas of the country has increased from0.48 kW/ha in 1975-76 to 1.73 kW/ha at presentand is likely to rise to 2.0 kW/ha by 2015. Shrinkinglandholding size with majority of the farmers beingsmall and marginal is also making individualownership of agricultural machinery progressivelyuneconomical. This requires steps for the setting upof custom-hiring centres/high-tech machinery banksso that small and marginal farmers can reap thebenefits of farm mechanization. The government hasinitiated a Sub-Mission on Agriculture Mechanizationin the Twelfth Five year Plan, with a focus on customhiring.
Integrated Nutrient Management8.13 India meets 80 per cent of its urea requirementthrough indigenous production but is largely importdependent for meeting its requirements of thepotassic (K) and phosphatic (P) fertilizerrequirements. The consumption of fertilizers innutrient terms has shown improvement, indicatingthat the policies for increasing availability andconsumption of fertilizers at affordable prices in thecountry have been successful (Table 8.5). Howeverover-use of nitrogenous and limited use of P and Kfertilizers are matters of great concern and needappropriate price incentives by reducing fertilizersubsidies so that sustainable practices areencouraged.
Policy Initiatives for Fertilizers8.14 The government has notified the NewInvestment Policy 2012 (NIP-2012) in the urea sectorwhich will encourage investments leading to increasein indigenous capacities, reduction in import
http://indiabudget.nic.in

179Agriculture and Food Management
Table 8.5 : Production and Consumption of Fertilizers (in lakh tonnes)
2007-8 2008-9 2009-10 2010-11 2011-12 2012-13*
Production of urea, DAP and compex fertilizers
Urea 198.60 199.20 211.12 218.80 219.84 223.87
DAP 42.12 29.93 42.46 35.37 39.63 37.10
Complex fertilizers 58.50 68.48 80.38 87.27 77.70 79.47
Consumption of fertilizers in nutrient terms
Nitrogenous (N) 144.19 150.90 155.80 165.58 173.00
Phosphatic (P) 55.15 65.06 72.74 80.50 79.14
Potassic (K) 26.36 33.13 36.32 35.14 25.25
Total (N+P+K) 225.70 249.09 264.86 281.22 277.39
Per ha consumption (kg) 116.50 127.20 135.76 144.14 141.30
Source : Department of Fertilizers.* Estimated.
dependence and savings in subsidy due to importsubstitution at prices below import parity price (IPP).It is expected that fresh investment will come forexpansion, revival, and setting up of brownfield andgreenfield projects. Adequate provisions are madein NIP-2012 to ensure the long-term availability ofgas required for expansion and greenfield/brownfieldprojects. In the event of increase in gas prices or fallin IPP, provisions are made in the policy to protectthe interest of investors. It has been decided toimplement direct cash transfer to the farmers in aphased manner, which would help target small,marginal, and other farmers and bring moretransparency in subsidy disbursement. Elevendistricts have been identified for piloting this across10 states.
8.15 Under the Nutrient Based Subsidy (NBS)scheme for phosphatic and potassic (P&K) fertilizersimplemented in 2010, a fixed amount of subsidy,decided on annual basis, is provided to each gradeof P&K fertilizer, depending upon its nutrient content.An additional subsidy is also provided to secondaryand micro-nutrients. Under this scheme,manufacturers/marketers are allowed to fix themaximum retail price (MRP). Presently (as inNovember 2012), farmers pay only 58 to 73 per centof the delivered cost of P&K fertilizers; the rest isborne by the Government of India in the form ofsubsidy. However, the government continues to sharea substantial burden in the form of fertilizer subsidy(Figure 8.2).
http://indiabudget.nic.in

180 Economic Survey 2012-13
Irrigation8.16 India has made considerable progress indeveloping irrigation infrastructure. However irrigationefficiency is low for both surface and ground waters.In order to help the rainfed farmers improveproductivity and profitability, in situ soil and waterconservation practices are developed for differentagro-climatic regions with special emphasis oneffective rainwater management along with a suiteof location-specific technologies. Substantialirrigation potential has been created through majorand medium irrigation schemes. The centralgovernment initiated the Accelerated Irrigation BenefitProgramme (AIBP) in 1996-7 for extendingassistance for the completion of incomplete irrigationschemes. Under the AIBP, ̀ 55416 crore of centralloan assistance (CLA)/grant has been released upto 31 December 2012. An irrigation potential of 7622.5thousand ha is reported to have been created bystates, from major / medium /minor irrigation projectsunder the AIBP till March 2011. The Command AreaDevelopment Programme has also beenamalgamated with the AIBP to reduce the gapbetween irrigation potential that has created and thatis utilized.
Agriculture Research and Education8.17 Agriculture research has played a vital role inagricultural transformation. Indian Council ofAgricultural Research (ICAR) Institutes undertakebasic, strategic, and applied research, focusingparticularly on problems of rainfed agriculture, whileState Agricultural Universities (SAUs) concentrateon generating required manpower and on applied andadaptive research to address local problems. Public-sector agricultural R&D spending to agricultural GDPin India remained in the range of 0.50 to 0.59 percent in the last decade, needing to be enhancedconsiderably. The ICAR in partnership with SAUshas developed a number of technologies that arebeing used by farmers on a large scale. Theseincludes 9838 tonnes of breeder seed, 13,228 tonnesof foundation seed, 20,541 tonnes of certified seed,14,860 tonnes of truthfully labelled seed, about40,000 tissue culture plantlets of field crops and threenew improved varieties of sugarcane during 2011-12.
PRICE POLICY FOR AGRICULTURALPRODUCE
8.18 The government's price policy for agriculturalproduce seeks to ensure remunerative prices to
growers for their produce with a view to encouragehigher investment and production as well assafeguarding the interests of consumers by makingavailable supplies at reasonable prices. The pricepolicy also seeks to evolve a balanced and integratedprice structure in the perspective of the overall needsof the economy. To achieve this end, the governmentin each season announces Minimum Support Prices(MSPs) for major agricultural commodities andorganizes purchase operations, wherever required,through public, cooperative, and other designatedagencies to ensure that prices do not fall below thatlevel. It decides on the support prices for variousagricultural commodities taking into account therecommendations of the Commission for AgriculturalCosts and Prices (CACP), the views of stategovernments and central ministries as well as suchother relevant factors as are considered importantfor fixation of support prices.
8.19 MSP is announced well ahead of the sowingseason so that farmers can take informed decisionson cropping. Taking into account the relevant factorsespecially for encouraging farmers that these areremunerative, the government fixed the MSPs forkharif crops of the 2012-13 season and rabi crops of2012-13 season to be marketed in 2013-14. Thesubstantial price increases in many crops are anoticeable feature (Table 8.6) especially at a timewhen the global food prices were also on a risingtrend (Figures 8.3 and 8.4). This puts in substantialfiscal stress on the government, discussed in detaillater in the Food Management section of this chapter.
8.20 Further, the Government of India has centrallydesignated agencies to undertake Price SupportScheme (PSS) operations. The losses, if any,incurred by the central agencies for undertaking PSSoperations are fully reimbursed by the centralgovernment. The government also implements aMarket Intervention Scheme (MIS) on the request ofstates/union territories (UTs) for horticultural andagricultural commodities, generally perishable innature and that are not covered under the PSS.States/UTs bear 50 per cent of the loss (25 per centin the case of north-eastern states), if any, incurredon its implementation. However the loss is restrictedup to 25 per cent of total procurement value. Profitearned, if any, in implementing the MIS is retainedby the procuring agencies. A few procurementoperations were made by NAFED in 2011-12 in gramand urad in Rajasthan and milling copra in theAndaman & Nicobar islands and MIS was
http://indiabudget.nic.in

181Agriculture and Food Management
Table 8.6 : MSPs
(` per quintal)
2009-10 2010-11 2011-12 2012-13 Difference between2012-13 and
2011-12 Prices
Kharif CropsPaddy (Common) 1000 1000 1080 1250 170Paddy (Gr.A) 1030 1030 1110 1280 170Jowar (Hybrid) 840 880 980 1500 520Jowar (Maldandi) 860 900 1000 1520 520Bajra 840 880 980 1175 195Maize 840 880 980 1175 195Ragi 915 965 1050 1500 450Arhar (Tur) 2300 3500 3700 3850 150Moong 2760 3670 4000 4400 400Urad 2520 3400 3800 4300 500Groundnut in shell 2100 2300 2700 3700 1000Sunflower 2215 2350 2800 3700 900Soyabean (black) 1350 1400 1650 2200 550Soyabean(Yellow) 1390 1440 1690 2240 550Sesamum 2850 2900 3400 4200 800Nigerseed 2405 2450 2900 3500 600Rabi CropsWheat 1100 1170 1285 1350 65Barley 750 780 980 980 0Gram 1760 2100 2800 3000 200Masur(lentil) 1870 2250 2800 2900 100Rapeseed/mustard 1830 1850 2500 3000 500Safflower 1680 1800 2500 2800 300Source : Department of Agriculture and Cooperation.Note : inclusive of bonus wherever applicable.
http://indiabudget.nic.in

182 Economic Survey 2012-13
implemented in arecanut, onion, and turmeric inKarnataka; apple in Himachal Pradesh; and potatoin Uttar Pradesh.
MAJOR SCHEMES / PROGRAMMESFOR THE AGRICULTURAL SECTOR8.21 Agriculture being a state subject, primaryresponsibility for increasing agriculture production,enhancing productivity and exploring the untappedpotential of the sector rests with the states. Thecentral government supplements the efforts of stategovernments through centrally sponsored andcentral-sector schemes.
National Food Security Mission8.22 To enhance the production of rice, wheat, andpulses by 10, 8, and 2 million tonnes respectivelyby the end of the Eleventh Plan through areaexpansion and productivity enhancement; restoringsoil fertility and productivity; creating employmentopportunities; and enhancing farm-level economy torestore the confidence of farmers of targeted districts,a centrally sponsored National Food Security Mission(NFSM) was launched in 2007-8 with three majorcomponents, viz. NFSM-Rice, NFSM-Wheat, andNFSM-Pulses. During the Eleventh Five Year Plan,NFSM-Rice was implemented in 144 districts of 16states, NFSM-Wheat in 142 districts of 9 states andNFSM-Pulses in 468 districts of 16 states. In 2012-13, six north-eastern states, viz. Arunachal Pradesh,Manipur, Meghalaya, Mizoram, Nagaland, and Sikkimwere included under NFSM-Rice and the hill statesof Himachal Pradesh, and Uttarakhand under NFSM-Rice and Wheat and J & K under NFSM- wheat.
Specifically, during 2012-13 a Special Plan to achieve19+ million tonnes of pulses production during kharif2012 was launched with a total allocation of ̀ 153.5crore comprising `107.3 crore for activities to beundertaken under the NFSM and `46.2 crore foractivities to be undertaken under the Micro IrrigationScheme. During 2012-13, ` 87.0 crore has beenallocated for additional area coverage of pulses duringrabi/summer 2012-13.
Rashtriya Krishi Vikas Yojana8.23 The Rashtriya Krishi Vikas Yojana (RKVY)was launched in 2007-8 with an outlay of ` 25,000crore in the Eleventh Plan for incentivizing states toenhance public investment. States were provided` 22,408.79 crore under the RKVY during EleventhFive Year Plan. The RKVY format permits taking upnational priorities as sub-schemes, allowing thestates flexibility in project selection andimplementation. Allocation under the RKVY for2012-13 is ` 9217 crore. The RKVY links 50 percent of central assistance to those states that havestepped up the percentage of state plan expenditureon the agriculture and allied sector. A total of 5768projects were taken up by states in the EleventhPlan of which 3343 had been completed tillDecember end 2012.
National Mission for Sustainable Agriculture8.24 Climate change poses a major challenge toagricultural production and productivity. The NationalMission for Sustainable Agriculture (NMSA), underthe aegis of the National Action Plan on ClimateChange (NAPCC), seeks to address issues related
http://indiabudget.nic.in

183Agriculture and Food Management
to 'Sustainable Agriculture' in the context of risksassociated with climate change. It hopes to achieveits objectives by devising appropriate adaptation andmitigation strategies for ensuring food security,enhancing livelihood opportunities, and contributingto economic stability at national level. The NMSAhas already been accorded 'in-principle' approval byPrime Minister's Council on Climate Change . Duringthe Twelfth Five year Plan, climate change adaptationand mitigation strategies will be operationalized byrestructuring the existing programmes.
Bringing Green Revolution to Eastern India8.25 Bringing Green Revolution to Eastern India,initiated in 2010-11, intends to address theconstraints limiting the productivity of 'rice basedcropping systems' in eastern India comprising sevenstates, viz. Assam, Bihar, Chhattisgarh, Jharkhand,Odisha, Eastern Uttar Pradesh, and West Bengal.` 400 crore each was allocated for the programmeduring 2010-11 and 2011-12 and of ̀ 1000 crore during2012-13.
Rainfed Area Development Programme8.26 Given the importance of rainfed agriculture inIndia, the Rainfed Area Development Programme(RADP) was launched by the government as a pilotscheme under the RKVY focusing on small andmarginal farmers and farming systems. It adopted aholistic 'end-to-end approach' covering integratedfarming, on-farm water management, storage-marketing, and value addition of farm produce in orderto enhance farmers' income in rainfed areas. During2012-13, the RADP is being implemented in 22states and will be substantially upscaled during theTwelfth Plan as a programme component under theNMSA.
Macro Management of Agriculture8.27 The Macro Management of Agriculture (MMA)scheme, revised in 2008, has formula-basedallocation criteria and provides assistance to states/UTs as 100 per cent grant. Out of the total outlay of` 5500 crore for the Eleventh Five Year Plan, fundsto the tune of ` 4625.24 crore have been utilized/released to states/ UTs. Of an outlay of Rs 900 croreapproved for 2012-13, ` 680.51 crore had beenreleased till date.
Integrated Scheme of Oilseeds, Pulses, OilPalm, and Maize8.28 The Integrated Scheme of Oilseeds, Pulses,Oil Palm, and Maize (ISOPOM) provides flexibilityto states in implementation based on a regionallydifferentiated approach for promoting cropdiversification and providing a focus to theprogramme. Under the Scheme, assistance isprovided for purchase of breeder seed, production offoundation seed, production and distribution ofcertified seed, distribution of seed minikits,distribution of plant protection chemicals, plantprotection equipments and weedicides, supply ofrhizobium culture/phosphate solubilizing bacteria,supply of improved farm implements, distribution ofgypsum/pyrite/liming/dolomite, distribution ofsprinkler sets and water-carrying pipes, and publicityfor encouraging farmers to grow oilseeds and maize.
National Horticulture Mission8.29 The National Horticulture Mission (NHM)covered 18 states and three UTs during the EleventhPlan. The scheme aims at the holistic developmentof the horticulture sector by ensuring forward andbackward linkages through adopting a clusterapproach with the active participation of allstakeholders. During the Eleventh Plan period 16.7lakh ha of land was brought under horticulture / high-value horticulture crops.
8.30 In order to harness production gains byreducing post harvest losses and creating valueaddition and better delivery mechanism to consumersthrough a cold chain system, a National Centre forCold-Chain Development (NCCD) has been set up.Setting up of the NCCD is expected to provide thenecessary boost for adding capacity and creating acold chain network in the country. Over the years,the availability of horticultural produce has improvedsignificantly (Table 8.7).
Agricultural Credit8.31 Timely availability of agricultural credit atreasonable rate, especially for small and marginalfarmers is crucial for agricultural-sector growth.Government has taken several measures forimproving the flow of agricultural credit:
(i) The flow of agricultural credit since 2003-4 hasconsistently exceeded the target. The targetof agriculture credit flow for the year 2012-13was fixed at ` 5,75,000 crore, against whichachievement as of September 2012 was` 2,39,629 crore.
http://indiabudget.nic.in

184 Economic Survey 2012-13
(ii) Farmers have been receiving crop loans up toa principal amount of ` 3 lakh at 7 per centrate of interest since 2006-7. The effective rateof interest for farmers who promptly repay theircrop loans during 2012-13 will be 4 per centper annum.
(iii) The Kisan Credit Card (KCC) scheme has beeneffective for extending agriculture credit. Arevised KCC scheme was introduced in March2012 in which the KCC passbook has beenreplaced by an ATM-cum-debit card to alleligible and willing farmers in a time-boundmanner. The number of operative KCCs issuedby cooperative and regional rural banks as on31 August 2012 was 4.07 crore. The numberof cumulative KCCs issued by commercialbanks as on 31 March 2012 was 5.47 crore.
(iv) Farmers were granted post-harvest loansagainst negotiable warehouse receipts atcommercial rates. In order to discouragedistress sale by farmers and to encouragethem to store their produce in warehousesagainst warehouse receipts, the benefit ofinterest subvention has been extended to smalland marginal farmers having KCCs for a furtherperiod of up to six months post-harvest on thesame rate as crop loans.
(v) The government is implementing a revivalpackage for Short-term Rural CooperativeCredit Structure involving a financial outlay of` 13,596 crore. Twenty-five state governmentshave signed memorandums of understanding(MoU) with the GoI and the National Bank forAgriculture and Rural Development (NABARD).As of July 2012, ` 9002.11 crore had beenreleased by NABARD as the GoI share forrecapitalization of 53,202 primary agriculturecooperative societies (PACS) in seventeenstates.
Major crop insurance schemes8.32 Indian agriculture faces risks from manyfactors ranging from weather changes, and naturaldisasters to uncertainties in output prices. Hencerisk management and risk mitigation are of utmostimportance. The government administers a numberof crop insurance schemes.
National Agricultural Insurance Scheme8.33 The Agriculture Insurance Company of IndiaLtd. implements the National Agricultural InsuranceScheme (NAIS). At present the scheme is beingimplemented by 24 states and two UTs. Sinceinception, claims of about ̀ 24,246 crore have beenpaid against premium income of about ̀ 7580 crorebenefiting about 511 lakh farmers.
Modified NAIS8.34 With the aim of further improving crop insuranceschemes, the Modified NAIS (MNAIS) is underimplementation on pilot basis in 50 districts of 16states in the country from rabi 2010-11 season. Someof the major improvements made in the MNAIS areactuarial premium with subsidy in premium atdifferent rates, all claims liability to be on the insurer,unit area of insurance reduced to village panchayatlevel for major crops, indemnity for prevented/sowing/planting risk and for post-harvest losses due tocyclone, on account payment up to 25 per centadvance of likely claims as immediate relief, moreproficient basis for calculation of threshold yield, andallowing private-sector insurers with adequateinfrastructure. During 2011-12, about 11.80 lakhfarmers with an area of about 13.48 lakh ha havebeen covered, insuring a sum amounting to` 3195 crore.
Table 8.7 : Per Capita Availability and Production of Fruits and VegetablesPer capita availability Production of fruits & vegetables
(gram / per person / day) (million tonnes)Fruit Vegetables Total Fruit Vegetables Total
2001-02 114 236 350 43 89 1322007-08 158 309 467 66 128 1942008-09 163 306 469 68 129 1972009-10 167 313 480 71 134 2052010-11 170 332 502 75 147 2222011-12 172 350 522 76 156 232Source : Department of Agriculture and Cooperation.
http://indiabudget.nic.in

185Agriculture and Food Management
Pilot Weather Based Crop InsuranceScheme8.35 The Pilot Weather Based Crop InsuranceScheme is intended to insure farmers against adverseweather incidence. From kharif 2007-8 to rabi 2011-12, 370.69 lakh farmers cultivating an area of about520.86 lakh ha with sum insured of about ̀ 64,905crore have been covered under the scheme. Claimsof about ̀ 3208 crore have been paid against premiumof about ` 5791 crore. The fund requirements asestimated by the implementing agency for theseschemes for the year 2012-13 are ̀ 2200 crore.
AGRICULTURAL MARKETING8.36 Organized marketing of agriculturalcommodities has been promoted in the countrythrough a network of regulated markets to ensurereasonable gains to farmers and consumers bycreating a market environment conducive for fair playof supply and demand. In order to bring about reformsin the sector, a model Agricultural Produce Marketing(Development and Regulation) (APMC) Act wasprepared in 2003. Though the process of marketreforms has been initiated by different stategovernments through amendments in the presentAPMC Act on the lines of Model Act, many of thestates are yet to adopt the Model Act uniformly. It istherefore necessary to complete the process ofmarket reforms early in order to provide farmers analternative competitive marketing channel fortransaction of their agricultural produce atremunerative prices. Development of an agriculturalmarketing infrastructure is the foremost requirementfor the growth of a comprehensive and integratedagricultural marketing system in the country. Forthe purpose, the Ministry of Agriculture isimplementing demand-driven Plan schemes byproviding assistance to entrepreneurs in the form ofback-ended credit-linked subsidy, viz. the GrameenBhandaran Yojana and Development/Strengtheningof Agricultural Marketing Infrastructure, Grading andStandardization.
Extension Services8.37 The State Extension Programmes forExtension Reforms scheme was launched in 2005-6,aiming at making the extension system farmer drivenand farmer accountable by providing new institutionalarrangements for technology dissemination. This hasbeen done through the setting up of AgriculturalTechnology Management Agencies (ATMA) at district
(614 rural districts in 28 states and 3 UTs) level tooperationalize the extension reforms. The ATMAshave active participation of farmers/farmer groups,non-governmental organizations (NGOs), and otherstakeholders operating at district level and below.Gender concerns are being mainstreamed bymandating that 30 per cent of resources onprogrammes and activities are utilized by womenfarmers and women extension functionaries. Sinceinception, 2.19 crore farmers, of whom 25 per centare women farmers, have benefited under variousextension activities. Restructuring of all extensionand IT-related schemes of the department and puttingthem under one mission scheme namely the NationalMission on Agriculture Extension (NMAE) during theTwelfth Plan has been proposed.
ANIMAL HUSBANDARY, DAIRYING,AND FISHERIES
8.38 The livestock sector achieved an averagegrowth rate of 4.8 per cent during the Eleventh FiveYear Plan. In 2011-12, the production of milk wasestimated at 127.9 million tonnes, eggs at 66.45billion numbers , wool at 44.73 million kg, and meatat 5.51 million tonnes . The Livestock Census (2007)has placed total livestock population at 529.7 millionand poultry birds at 648.8 million.
Dairy Sector8.39 India ranks first in the world in milk production,which has gone up from 53.9 million tonnes in 1990-1 to 127.9 million tonnes in 2011-12. The per capitaavailability of milk has also increased from 176 gramsper day in 1990-1 to 290 grams per day in 2011-12.This is comparable with the world per capitaavailability of milk at 289.31 grams per day for 2011.
8.40 This represents sustained growth in theavailability of milk and milk products for the growingpopulation of the country, apart from being animportant secondary source of income for ruralfamilies (Figure 8. 5).
8.41 The Intensive Dairy Development Programme,Strengthening Infrastructure for Quality and CleanMilk Production, Assistance to Cooperatives, andDairy Entrepreneurship Development Scheme aresome of GoI's important schemes/programmes formeeting the growing demand for milk. The NationalProject for Cattle and Buffalo Breeding has beenunder implementation since 2000. A new schemecalled the National Dairy Plan Phase I has been
http://indiabudget.nic.in

186 Economic Survey 2012-13
launched in March 2012 with the objectives ofimproving productivity of milch animals, strengtheningand expanding village-level infrastructure for milkprocurement, and providing producers greater accessto the market in the dairy sector.
Poultry8.42 The poultry sector encompasses a range offarming systems from highly industrialized andexport oriented at one end to the backyard, small,and marginal model addressing livelihood issues atthe other end. Per capita availability of eggs wasaround 55 per year in 2011-12. In order to encourageentrepreneurship skills of individuals, a central-sectorPoultry Venture Capital Fund scheme is beingimplemented in capital subsidy mode since1 April 2011, covering various poultry activities.
Feed and Fodder8.43 Adequate availability of feed and fodder forlivestock is vital for increasing milk production andsustaining the ongoing genetic improvementprogramme. Green fodder shortage in the country isestimated at about 34 per cent. The centralgovernment has put in place a modified CentrallySponsored Fodder and Feed Development Schemesince 2010 to supplement the efforts of states toimprove fodder production. Besides, the AcceleratedFodder Development Programme was launched asa component of the RKVY in 2011-12 to promoteproduction of fodder.
Fisheries8.44 Fish is an important source of protein andalso an important source of livelihood. Production of
http://indiabudget.nic.in

187Agriculture and Food Management
fish, both marine and inland, has gone up from 5.6million tonnes in 2000-1 to 8.7 million tonnes in 2011-12 (provisional). The exports of marine products haveincreased significantly as evident from Figure 8.6.
FOOD MANAGEMENT8.45 The main objectives of food management areprocurement of foodgrains from farmers atremunerative prices, distribution of foodgrains toconsumers, particularly the vulnerable sections ofsociety, at affordable prices, and maintenance of foodbuffers for food security and price stability. Theinstruments used are MSP and central issue price(CIP). The nodal agency for procurement, distribution,and storage of foodgrains is the Food Corporation ofIndia (FCI). Procurement at MSP is open-ended,while distribution is governed by the scale of allocationand its offtake by beneficiaries. The offtake offoodgrains is primarily under the targeted publicdistribution system (TPDS) and other welfareschemes of the GoI.
Procurement and Offtake of Foodgrains8.46 Due to good production of foodgrains in recentyears and remunerative MSPs, along with variousother steps taken by the government, theprocurement of wheat and rice has steadily risenand reached record levels (Table 8.8). Besides Punjaband Haryana, contribution from States such as Bihar,Madhya Pradesh, Rajasthan and Uttar Pradesh inprocurement of wheat was much higher comparedto last season. In procurement of rice, non-traditionalStates like Bihar, Chhatsigarh, Uttar Pradesh andWest Bengal showed significant increase over lastyear.
Decentralized Procurement Scheme8.47 A number of states have opted forimplementation of the Decentralized ProcurementScheme (DCP) introduced in 1997, under whichfoodgrains are procured and distributed by stategovernments themselves. Under this scheme, thedesignated states procure, store, and issuefoodgrains under the TPDS and welfare schemes ofthe GoI. The difference between the economic costfixed for the state and the CIP is passed on to thestate government as subsidy. The decentralizedsystem of procurement has the objectives of coveringmore farmers under MSP operations, improvingefficiency of the PDS, providing foodgrains varietiessuited to local tastes, and reducing transportationcosts.
Economic Cost of Foodgrains to the FCI8.48 The economic cost of foodgrains consists ofthe MSP (and bonus if applicable) as the price paidto farmers, procurement incidentals, and the cost ofdistribution. The economic cost for both wheat andrice has witnessed significant increase during thelast few years thanks to increase in MSPs andprocurement incidentals (Figure 8.7).
Food Subsidy8.49 Provision of minimum nutritional support tothe poor through subsidized foodgrains and ensuringprice stability are the objectives of the food securitysystem. In fulfilling its obligation towards distributivejustice, the government incurs food subsidy. Whilethe economic cost of wheat and rice has continuously
Table 8.8 : Procurement and Offtake of Wheat and Rice (million tonnes)
2008-09 2009-10 2010-11 2011-12 2012-13
Procurement
Rice 34.1 32.0 34.2 35.0 23.0 *
Wheat 22.7 25.4 22.5 28.3 38.1
Total 56.8 57.4 56.7 63.3 52.8
Offtake
Rice 24.62 27.37 29.93 32.12 24.02 **
Wheat 14.87 22.34 23.07 24.26 23.13 **
Total 39.49 49.71 53.00 56.38 47.16**
Source : Department of Food and Pubic Distribution.Note : Figures of procurement of wheat and rice are marketing season wise.* As on 07.02.2013 ** 2012-13 (upto December, 2012)
http://indiabudget.nic.in

188 Economic Survey 2012-13
gone up, the issue price has been kept unchangedsince 1 July 2002. The government thereforecontinues to provide large and growing amounts ofsubsidy on foodgrains for distribution under the TPDS,other nutrition-based welfare schemes, and openmarket operations. The food subsidy bill issubstantial, putting huge stress on the fiscal side(Figure 8.8).
Allocation of Foodgrains under the TPDSand Other Welfare Schemes8.50 Allocations for Antyodaya Anna Yojana (AAY)and below poverty line (BPL) families are being madeat 35 kg per family per month. For above poverty line(APL) families, allocation varies from 15 kg to35 kg in different states. During 2012-13, the
following allocations have so far been made(upto 6-2-2013):
Normal TPDS allocation made is 499.42 lakhtonnes covering AAY, BPL, and APL families.
Additional allocations of 78.98 lakh tonnes ofrice and wheat have also so far been made.These include (i) 50 lakh tonnes to BPL familiesmade in July 2012, (ii) 21.21 lakh tonnes topoorest districts and (iii) 7.77 lakh tonnes ofrice and wheat for festivals, calamity relief, etc.
49.26 lakh tonnes of rice and wheat has beenallocated for other welfare schemes such asthe Mid-day Meal Scheme, Wheat BasedNutrition Programme under the Integrated ChildDevelopment Service, and Annapurna.
http://indiabudget.nic.in

189Agriculture and Food Management
Total release of foodgrains during the currentyear so far has been 627.67 lakh tonnes.
Open Market Sale Scheme (Domestic)8.51 The FCI on behalf of the GoI has beenundertaking sale of wheat and rice at predeterminedprices/reserve prices in the open market from timeto time to enhance market supply of foodgrains tohave a moderating influence on open market pricesand to offload surplus stocks. Under the Open MarketSale Scheme (Domestic) (OMSS[D]), 95 lakh tonnesof wheat has been allocated for tender sale to bulkconsumers and sale to small private traders sinceJuly 2012 for the period up to February 2013. Underthe OMSS retail scheme, 5 lakh tonnes of wheatand 5 lakh tonnes of rice have been allocated forsale to states/UTs/cooperatives for the period up toMarch 2013.
Storage Capacity in the Country8.52 Storage capacity including both covered andcover and plinth (CAP), available with state agenciesfor storage of central stock foodgrains, has increasedfrom 291.32 lakh tonnes as on 31 March 2012 to341.35 lakh tonnes as on 31 December 2012.However, to meet the requirement of all-time highstock levels of 823.17 lakh tonnes achieved this year,the FCI resorted to short-term hiring to efficientlymanage the stocks. In order to incentivizing thecreation of storage capacity in the country, thegovernment initiated the Private EntrepreneursGuarantee (PEG) Scheme that aims to constructstorage godowns through private entrepreneurs, theCentral Warehousing Corporation (CWC), and StateWarehousing Corporations (SWC). Under the PEGScheme, the FCI guarantees 10-year usage ofstorage capacities to private investors and nine yearsto the CWC and SWCs. Construction of godowns in19 states with a total capacity of 197 lakh tonneshas been approved out of which a capacity of 132.73lakh tonnes has been sanctioned for construction.These measures are expected to address theshortage of covered godown space to a great extent.
Agricultural Exports8.53 As per World Trade Organization (WTO)International Trade Statistics, 2012 (based on tradein 2011), global export and import of agricultural andfood products is US$ 1.66 trillion and US$ 1.82 trillionrespectively. India's share in this is 2.07 per centand 1.24 per cent respectively. India has improved
its position in agricultural and food exports to10th globally. Exports of agriculture and alliedproducts during 2011-12 accounted for 9.08 per centof India's total exports against 6.9 per cent during2010-11. In recent years, the policy impetus by thegovernment has provided much required stability toagri exports. Given sufficient stocks of foodgrains inthe central pool, the government has allowed exportsof 4.5million tonnes of wheat from the central poolstock of the FCI through central public-sectorundertakings and placed export of wheat and riceunder open general licence (OGL). Permission toexport wheat products up to 6.50 lakh tonnesthrough customs Electronic Data Interchange portson private account has also been extended up to31 March 2013. Though these measures are in theright direction, a consistent long-term trade policywith tariff in a narrow band may be required for Indiato acquire international presence in commoditieswherein it has comparative advantage.
The National Food Security Bill8.54 In order to address the issue of food securityin a comprehensive manner, the Governmentintroduced National Food Security Bill in the LokSabha on 22 December, 2011. The Bill, inter alia,envisages coverage of 75% of the rural and 50% ofthe urban population for subsidised foodgrains underthe Targeted Public Distribution System, besidesprovisions for nutritional support to women andchildren. After its introduction, the Bill was referredto the Parliamentary Standing Committee on Food,Consumer Affairs and Public Distribution forexamination. The Committee held wide rangingconsultations with Central Ministries/Departments,various other organizations and individuals and alsovisited States/UTs to obtain their views/suggestionson the Bill. The Standing Committee has submittedits report to the Speaker, Lok Sabha on 17th January,2013, which is being processed in consultation withconcerned Central Ministries/Departments andStates/UTs. The Government is committed to earlyenactment of this historic legislation.
COMMODITY FUTURES MARKET
8.55 The commodity futures market facilitates theprice discovery process and provides a platform forprice-risk management in commodities. Currently113 commodities are notified for futures trading ofwhich 51 are actively traded in five national and 16regional commodity-specific exchanges. The year
http://indiabudget.nic.in

190 Economic Survey 2012-13
2012-13 witnessed a decline in the total value oftrade compared to the corresponding period of thepreceding year (Table 8.9).
CHALLENGES AND OUTLOOK
8.56 Foodgrains production in India has shownremarkable improvement in recent years. Theproduction of food-grains in 2011-12 was at a recordhigh of 259.32 million tonnes. This achievementcomes at a time when it is generally recognizedthat inadequate attention to agriculture across manyparts of the world led to food shortages and steephikes in food prices. In comparison, Indian agriculturehas performed well primarily due to timely policyinterventions. Nevertheless, the average annualgrowth rate of 3.6 per cent during the Eleventh FiveYear Plan for the agriculture & allied sector fell shortof the target of 4 per cent. Moreover the countryfaces the stiff challenge of feeding its growingpopulation. There are a number of constraints andchallenges that need to be addressed and the countrywill have to invest heavily in farm research, ruralinfrastructure, providing better access to high valuemarkets, better credit facilities and input use, sothat the farming community as a whole is motivatedto produce more and the target of 4 per cent growthset for the agriculture and allied sector in the TwelfthFive Year Plan is met.
8.57 Though India is one of the leading producersin the world of many major crops like paddy, wheat,pulses, sugarcane, spices, and plantation crops, the
comparison in terms of yield levels is not creditablewith it achieving a much lower rank in many of thesecrops. Further, studies indicate that there are wideyield gaps among various crops across the country.Agriculture production can be substantially increasedif we address this yield gap by adopting technologicaland policy interventions. Improvement in yields holdsthe key for India to remain self-sufficient in foodgrainsand also make a place for itself in many agriculturalcrops and products in the international market.
8.58 Another challenge is how to maximizeagricultural income while adopting a moresustainable agricultural strategy. The concerns hereare land and water degradation due to soil erosion,soil salinity, water logging, and excessive applicationof nutrients. There are concerns arising also fromover-exploitation of water resources, especially inthe Green Revolution belt. Better managementpractices for rehabilitation of degraded land and waterresources hold the key. Measures must be taken topromote use of quality seeds, cultivation of drought-resistant varieties of crops, judicious use of availablewater, balanced use of fertilizers, farm mechanizationto improve efficiency levels, and wider use of irrigationfacilities. Expenditure on agricultural research alsoneeds to be stepped up substantially.
8.59 Climate change and extreme weather eventswith greater intensity and frequency can have seriousimplications for our agriculture sector and creategreater instability in food production and therebyfarmers' livelihood. The current crop insurance
Table 8.9 : Trade in Commodity Futures Market(Volume of trading in lakh tonnes, value ` in crore)
Commodity 2011-11 2011-12 2012-13 (Up to 30-11-12)Volume Value Volume Value Volume Value
Agricultural 4168 1456390 4942 2196150 3113 1536268commodities (32.6) (12.2) (35.24) (12.12) (30.77) (13.21)
Bullion 7.38 5493892 10.27 10181957 5.02 5363816(0.05) (46.0) (0.07) (56.17) (0.05) (46.13)
Metals 1410 2687673 1388 2896721 1046 2157139(11.0) (22.5) (9.9) (15.98) (10.33) (18.55)
Energy 7220 2310959 7686 2851270 5954 2569619(56.4) (19.3) (54.8) (15.73) (58.85) (22.1)
Others 29.04 6.45 1.28
Total 12806 11948942 14026 18126104 10119 11626842
Source : Department of Consumer Affairs.Note : Volume of certified emission reduction (CER), electricity, heating oil and gasoline not included inthe total volumes of other commodities.Figures in brackets are the percentage to the total volume and value of trade of the respective group.
http://indiabudget.nic.in

191Agriculture and Food Management
system also needs to be further refined in order tocater to the unavoidable climatic conditions or pestepidemics.
8.60 Declining per capita availability of foodgrainshas been a major concern in India. For ensuringnutritional security, it is not only important to increaseper capita availability of foodgrains but also to ensurethe right amounts of food items in the food basket ofthe common man. A thrust on horticulture productsand protein-rich items is required for enhancing percapita availability of food items as well as ensuringnutritional security.
8.61 The pace of agricultural growth in the easternand north-eastern regions has been slower than inthe rest of the country. The good prospects ofproduction in many crops in these parts of the countryshould quickly be taken advantage of in the years tocome. Hence a strategy for agricultural developmentin eastern and north-eastern India comprising multiplelivelihood opportunities, sustainable agriculturaldevelopment through a farming systems approach,efficient national resources management, eco-regional technology missions, and rice-based farmingsystems needs to be put in place.
8.62 Another critical issue is supply chainmanagement in agricultural marketing in India.Farmers' access to markets is hampered by poorroads, rudimentary market infrastructure, andexcessive regulation. Many agricultural crops areperishable in nature and post-harvest handling issuesand marketing problems affect the farm incomes. Itis necessary that we evolve mechanisms for linking
wholesale processing, logistics and retailing withfarm-production activities so as to generate enhancedefficiency, better farm prices, etc. The private sectorshould be allowed to operate in developing thesemarket linkages for which suitable reforms will help.Recently the government allowed foreign directinvestment (FDI) in retail, which has been supportedby many farmer organizations as well, and it canpave the way for investment in new technology andmarketing of agricultural produce in India.
8.63 There has been substantial increase in theMSPs of various crops over the last few years.Though considered necessary for incentivizingfarmers, the MSP signals the floor price for theproduce. There is a huge cost involved in the process,in the form of food subsidy. Further, this policy ofstocking foodgrains well above the buffer normscomes under criticism on the grounds of hoardingand creating artificial shortages in the market, therebyjacking up the prices of essential commodities.Urgent attention needs to be accorded to efficientfood stocks management, timely offloading of stocks,and a stable and predictable trade policy.
8.64 Strengthening agricultural statistics withreliable and timely availability of forecasts ofagricultural crops is also an immediate need as thegaps in agricultural statistics will hamper agriculturaldevelopment planning and policymaking.
8.65 With these and other improvements, it shouldbe possible to sustain the 4 percent growth targetset for agriculture and allied sectors in the TwelfthFive Year Plan.
http://indiabudget.nic.in

Industrial Performance
After recovering to a growth of 9.2 per cent in 2009-10 and 2010-11, growth of
value added in industrial sector, comprising manufacturing, mining, electricity and
construction sectors, slowed to 3.5 per cent in 2011-12 and to 3.1 percent in the
current year. The manufacturing sector, the most dominant sector within industry,
also witnessed a decline in growth to 2.7 per cent in 2011-12 and 1.9 per cent in
2012-13 compared to 11.3 per cent and 9.7 per cent in 2009-10 and 2010-11,
respectively. The growth in electricity sector in 2012-13 has also moderated. The
growth of the mining sector in 2012-13 is estimated at 0.4 per cent, though it showed
an improvement over a negative growth of 0.63 per cent recorded in 2011-12. With
improved business sentiments and investor perception and a partial rebound in
industrial activity in other developing countries, industrial growth is expected to
improve in the next financial year.
9.2 The index of industrial production (IIP) with2004-5 as base is the leading indicator for industrialperformance in the country. Compiled on a monthlybasis, the current IIP series based on 399 products/product groups is aggregated into three broad groupsof mining, manufacturing, and electricity. The IIP asan index shows both the level of production andgrowth. Overall industrial performance, as reflectedby the IIP continued to moderate from Q1 of 2011-12with growth turning negative in Q1 of 2012-13, beforeimproving to 2.1 per cent in Q3 of 2012-13. The Miningsector production has contracted in the last sixquarters. The contraction in the current year waslargely because of decline in natural gas and crudepetroleum output. Manufacturing, which is thedominant sector in industry, also witnesseddeceleration in growth, as did the electricity sector(Table 9.1). There was, however, a sharp pick-up ingrowth in October 2012 with manufacturing growthimproving to 9.8 per cent, the highest recorded sinceJune, 2011. Growth, however, turned negative inNovember and December, 2012 and was placed at(-) 0.8 per cent and (-) 0.6 per cent respectively.
9.3 In terms of the use- based classification ofindustries, the capital goods sector sustainednegative growth in the last six quarters. Growth inthe consumer durable sector continued to fluctuate,turning negative in Q4 of 2011-12, 0.7 per cent in Q2and 3.2 per cent in Q3 of 2012-13. Pickup in growthin October was generally broad based with consumergoods, capital goods, and intermediates showingimprovement in performance. The growth of consumerdurables 16.9 per cent was the highest in the last20 months (Figure 9.1).
9.4 Industrial growth was volatile across all sectorsin this period. The seasonally adjusted annualizedrate of growth of the IIP, which had shown a nearlyflat trajectory, indicates a downward momentum. Thissuggests that the IIP growth may perhaps remainsluggish (Figure 9.2).
9.5 The IIP also provides data for 22 sub-groups ofthe manufacturing sector. Cumulatively during April-December 2012, four manufacturing sub groups witha weight of 14.5 per cent in the IIP recorded a growthin excess of 5 per cent. Seven sub- groups with a
CHAPTER
9
http://indiabudget.nic.in

193Industry
Table 9.1 : Growth Rate(per cent)
Weight 2010- 2011- 2011-12 2012-1311 12 Q1 Q2 Q3 Q4 Q1 Q2 Q3
General 100.0 8.23 2.89 6.98 3.18 1.18 0.63 -0.28 0.41 2.13
Mining 14.16 5.23 -1.97 0.65 -4.06 -4.22 -0.37 -1.53 -0.69 -3.25
Manufacturing 75.53 8.95 3.00 7.72 3.36 1.09 0.35 -0.84 0.25 2.61
Electricity 10.32 5.55 8.16 8.26 10.54 9.57 4.53 6.40 2.83 4.40
Basic goods 45.68 5.97 5.48 7.47 7.00 4.36 3.41 3.31 2.21 2.72
Capital goods 8.83 14.75 -3.97 16.99 -5.84 -16.17 -6.85 -20.08 -8.06 -0.95
Intermediate goods 15.69 7.39 -0.62 1.83 -0.83 -2.90 -0.51 0.83 1.47 2.35
Consumer goods 29.81 8.56 4.37 4.46 4.77 7.72 1.05 3.93 1.40 2.48
Consumer durables 8.46 14.16 2.60 2.71 7.87 4.91 -4.13 8.04 0.07 3.17
Consumer non-durables 21.35 4.26 5.86 5.93 2.05 10.09 5.28 0.58 2.61 1.92
Source : CSO
http://indiabudget.nic.in

194 Economic Survey 2012-13
weight of 37.0 per cent had a positive growth andeleven sub-groups with a weight of 24.0 per centhad a negative growth, the highest negative growthof 14.6 per cent being shown by electric machineryand apparatus. Negative growth has persisted intobacco products, office accounting and computingmachinery and wood and wood products. On thepositive side, however, growth in some of the labour-intensive industries particularly textile has shownimprovement in the last three quarters. Growth has
also turned significantly positive for leather and foodproducts in the Q3. Growth, as with the broad groupsof the IIP, has varied across manufacturing sub-groups and over time (Table 9.2).
9.6 Momentum of the IIP manufacturing more orless mirrors the path of overall IIP. The seasonallyadjusted annualised series indicates a downwardtrajectory till recently, and a slow pick up(Figure 9.3).
Table 9.2 : Manufacturing Growth Rate (in per cent)
Weight 2010- 2011- 2011-12 2012-1311 12
Full Year Q1 Q2 Q3 Q4 Q1 Q2 Q3
Food products and beverages 7.28 7.0 15.4 17.4 12.3 22.1 11.0 -0.9 0.9 6.7
Tobacco products 1.57 2.0 5.4 4.1 -5.0 16.7 7.2 -5.9 -11.1 -4.2
Textiles 6.16 6.7 -1.3 -2.3 -0.3 -4.7 1.8 9.0 5.4 6.2
Wearing apparel 2.78 3.7 -8.5 -4.9 -9.4 0.0 -18.2 -6.4 5.4 -0.4
Luggage, handbags, saddlery, 0.58 8.1 3.7 5.4 7.7 0.2 1.7 8.8 -0.4 9.8harness & footwear
Wood and products of wood 1.05 -2.2 1.8 -8.1 1.7 9.2 4.8 -2.2 -3.5 -15.3
Paper and paper products 1.00 8.6 5.0 6.7 4.2 5.4 3.8 0.6 1.4 0.3
Publishing, printing & reproduction 1.08 11.2 29.6 10.7 7.4 41.9 55.9 13.6 16.7 -14.3of recorded media
Coke, refined petroleum products 6.72 -0.2 3.5 6.0 4.7 1.8 1.7 1.6 7.9 13.1& nuclear fuel
Chemicals and chemical products 10.06 2.0 -0.4 3.5 -2.1 -0.5 -2.3 -1.2 6.4 3.0
Rubber and plastics products 2.02 10.6 -0.3 -2.5 -0.1 -2.5 3.9 6.9 -2.1 -0.2
Other non-metallic mineral products 4.31 4.1 4.8 -0.5 6.2 8.4 5.2 7.5 -0.2 -4.3
Basic metals 11.34 8.8 8.7 15.6 13.6 4.6 2.4 2.3 0.2 5.0
Fabricated metal products, except 3.08 15.3 11.2 15.8 12.1 12.9 6.2 2.9 0.6 -9.7machinery & equipment
Machinery and equipment n.e.c. 3.76 29.4 -5.8 -1.7 -2.0 -3.8 -13.2 2.4 -3.8 -10.4
Office, accounting & computing 0.31 -5.3 1.6 28.2 0.1 -5.3 -9.5 -1.8 -21.5 -14.7machinery
Electrical machinery & apparatus 1.98 2.8 -22.2 25.5 -27.7 -49.5 -26.4 -43.7 -10.5 33.2
Radio, TV and communication 0.99 12.7 4.3 -6.7 16.5 11.6 -5.0 18.3 4.1 4.5equipment & apparatus
Medical, precision & optical 0.57 6.8 10.9 -2.2 -1.9 36.0 12.2 15.5 7.4 -17.7instruments, watches and clocks
Motor vehicles, trailers & 4.06 30.2 10.8 20.1 8.0 7.6 9.0 0.3 -5.6 -4.2semi-trailers
Other transport equipment 1.82 23.2 11.9 19.1 16.3 11.1 3.1 0.7 -4.7 0.4
Furniture; other manufacturing 3.00 -7.5 -1.8 -0.1 -0.5 -6.4 -0.6 -8.2 -9.2 7.7
Source : CSO
http://indiabudget.nic.in

195Industry
Why has growth moderated?9.7 The moderation in industrial growth, particularlyin the manufacturing sector, is largely attributed tosluggish growth of investment, squeezed margins ofthe corporate sector, deceleration in the rate of growthof credit flows and the fragile global economicrecovery.
Investment in the industrial sector9.8 Gross capital formation (GCF) in the industrialsector comprising mining, manufacturing, electricityand construction recorded an average growth of 13.2
per cent during 2004-5 to 2011-12. Growth turnednegative during 2008-9 and again in 2011-12. Thecombined industry sector in 2007-8 accounted for55 per cent of total GCF (excluding valuables) in thecountry, which declined 44.4 per cent in 2011-12(Table 9.3).
9.9 The decline in overall share of GCF in industryin the total GCF for the economy and overall negativeannual growth during 2008-09 and 2011-12 waslargely due to a negative growth in GCF in theregistered and unregistered manufacturing sector.Share of the registered manufacturing sector in overall
Table 9.3 : GCF in Industry
2004-05 2005-06 2006-07 2007-08 2008-09 2009-10 2010-11 2011-12
Rate of growth of GCF 46.7 18.3 22.0 24.7 -24.5 24.2 22.3 -10.8in Industry (per cent)Share of Sectors of Industryin overall GCF (per cent)Mining 3.7 4.4 4.4 4.3 3.6 3.6 3.8 3.8Manufacturing 34.1 34.2 34.8 38.1 26.8 32.9 34.7 27.9Registered Manufacturing 24.3 29.0 27.9 32.5 24.1 27.8 29.7 24.9Unregistered Manufacturing 9.7 5.3 6.9 5.6 2.7 5.1 5.1 3.0Electricity 5.3 5.5 5.6 5.4 6.3 6.2 6.6 6.8Construction 5.4 4.9 7.0 7.2 5.7 4.8 5.3 6.0Share of Industry in GCF 48.4 49.0 51.8 54.9 42.5 47.5 50.4 44.4Share of GCF in industry 59.0 63.6 69.2 78.7 56.9 64.7 72.5 62.4as per cent of GDP of thissectorShare of GCF in 76.0 81.1 83.2 97.3 64.1 78.3 86.8 68.6manufacturing as per centof GDP in manufacturing
Source : CSO
http://indiabudget.nic.in

196 Economic Survey 2012-13
GCF declined from a peak of 38.1 per cent in 2007-8 to 27.9 per cent in 2011-12. As percentage of GDPoriginating from industry, the share of GCF reached78.7 per cent in 2007-8, though it moderated to 62.4per cent in 2011-12. The GCF of the registeredmanufacturing sector in 2008 had reached a level ofover 97 per cent income of this sector.
9.10 Investment in industry has generally beenbuoyant and witnessed an increase in its share inoverall GCF of the economy. The share peaked toreach 56.2 per cent of total GCF in the economy in1995-6 in the post reform period. The rate of growthof GCF, however, moved with the rate of growth ofindustry. This sector has continued to allocate asignificantly high share of its income to the capitalformation (Fig 9.4).
9.11 Together with a deceleration in growth ofinvestment (investment in the overall industrysector actually declined in 2011-12), excesscapacity in aggregate appears to have persisted.Figure 9.5, which depicts de-trended growth ofthe IIP and capacity utilization clearly indicatesthat with moderation in IIP growth, there has alsobeen a decline in capacity utilization. Capacityutilization as measured by the 19th round of theOrder Books, Inventories and Capacity UtilizationSurvey (OBICUS) of the Reserve Bank of India(RBI) shows a continuous decline until Q1 of 2012-13 and a moderately upward trend in Q2. There isa broad co-movement between capacity utilizationand de-trended IIP.
http://indiabudget.nic.in

197Industry
Credit flow to the industrial sector9.12 Moderation in investment was largely becauseof two factors: decline in profitability and decelerationin the rate of growth of credit to the industrial sector.Overall rate of growth of credit flow to industrymoderated from 26.48 per cent on an average in 2010-11 to an average15.52 per cent in Q3 of 2012-13.The moderation in the growth was even shaper forthe construction sector with overall growth in creditdisbursement declining from 16.3 per cent in 2010-11 to 6.6 per cent in Q3 of 2012-13. Mining andelectricity sectors also suffered a decline in thegrowth of credit disbursement (Table 9.4).
9.13 The momentum of credit growth to theindustrial sector based on seasonally adjustedannualized rate indicates a downward trajectorysuggesting that credit pick up may be slow (Figure9.6).
9.14 Within manufacturing, which had a share ofover 60 per cent in total credit of disbursement tothe industrial sector, decline in growth was not
distributed across all the sectors, though most ofsectors did witness moderation in growth. Thechemicals and petroleum products segment, whichhad a share of over 16 per cent in total outstandingcredit in 2010-11 witnessed an increase in the rateof growth of credit in the current year equipments,gems and jewellery and other miscellaneousindustries witnessed a sharp decline in the rate ofgrowth of credit flow.
9.15 The aggregate resource flow to industrycomprising credit flows, non-SLR investment bybanks and flow from non-banking channels, however,is showing cause for optimism. The total flow offinancial resources to the commercial sector for thefinancial year so far (up to 11 January, 2013) hasbeen higher compared with the corresponding periodof the previous year in Table 9.5. The increase inflow has been accounted for by both bank and non-bank sources, though the latter played a dominantrole. Among the domestic sources, non-food creditand non-statutory liquidity ratio (SLR) investment byscheduled commercial banks (SCBs), net issuance
Table 9.4 : Deployment of Credit to Industrial Sector(` ` ` ` ` billion)
2010-11 2011-12 2011-12 2012-13
Q1 Q2 Q3 Q4 Q1 Q2 Q3
Industries 14461 17656 16541 17121 17964 18999 19772 19890 20752
Manufacturing 9169 11106 10296 10771 11315 12040 12617 12498 12994
Mining 198 283 263 273 285 309 356 367 393
Electricity 2317 3032 2865 2966 3080 3216 3264 3537 3745
Construction 453 523 504 496 531 561 581 593 566
Others 2323 2714 2613 2616 2752 2873 2954 2895 3054
Share in credit disbursed (per cent)Manufacturing 63.41 62.90 62.25 62.91 62.99 63.37 63.81 62.84 62.61
Mining 1.37 1.60 1.59 1.59 1.59 1.63 1.80 1.85 1.89
Electricity 16.02 17.17 17.32 17.32 17.15 16.93 16.51 17.78 18.05
Construction 3.13 2.96 3.05 2.89 2.96 2.95 2.94 2.98 2.73
Others 16.06 15.37 15.80 15.28 15.32 15.12 14.94 14.56 14.72
Rate of growth of credit flow ( per cent)Industries 26.48 22.10 24.82 22.57 21.21 20.24 19.54 16.17 15.52
Manufacturing 19.39 21.12 19.90 22.92 21.08 20.62 22.54 16.04 14.83
Mining 27.97 42.43 41.54 42.16 41.40 44.42 35.08 34.42 37.94
Electricity 48.19 30.83 41.44 34.15 27.06 23.30 13.94 19.26 21.58
Construction 16.30 15.45 14.71 11.04 20.16 15.90 15.35 19.64 6.60
Others 41.20 16.82 29.74 10.98 14.33 14.34 13.06 10.66 10.96
Source: RBI
http://indiabudget.nic.in

198 Economic Survey 2012-13
of commercial paper, net credit by housing financecompanies witnessed large increase compared tothe corresponding period of the previous year. Foreignsources of funding (up to December 2012), alsorecorded marginal increase compared to the previousyear, mainly on account of a higher externalcommercial borrowings
Corporate Performance9.16 Sluggish industrial performance also affectedcorporate performance. The rate of growth of salesof the corporate sector particularly in respect of listedmanufacturing companies for the private sector,declined from an average of 28.8 per cent in Q1 of2010-11 to 11.4 per cent in Q2 of 2012-13, the latestquarter for which comparable set of data areavailable. There was a significant increase in therate of growth of interest expenditure with year onyear growth peaking at 41.5 per cent in Q2 of 2011-12. Together with a deceleration in the rate of growthof sales, the ratio of net profit to sales also
Table 9.5 : Resource Flow to the Commercial Sector
(`̀̀̀̀ billion)
April-March April 1 to Jan 11 2009-10 2010-11 2011-12 2011-12 2012-13P
A. Adjusted non-food bank credit and non
SLR investment 4786 7110 6764 3953 4397
B. Flow from non-banks (b1+b2) 5850 5341 5338 4154 5232
b1. Domestic sources 3652 3011 3034 1913 2951
b2. Foreign sources 2198 2330 2304 2241 2281
C. Total flow of resources 10,636 12,451 12,102 8107 9629
Source : RBI; Note: P: provisional
moderated. The ratio of profit to sales which averaged8 per cent in the first two quarters of 2010-11 hasalso moderated to 3.6 per cent in Q3 of 2011-12 andhas been in the range of 5 to 6 per cent in the lastthree quarters (Table 9.6).The growth of interestpayments moderated to 10 per cent in Q2 of 2012-13, reflecting stabilization of the interest rate withrepo rates remaining unchanged from April, 2012 toJanuary, 2013. Consequently, profit in Q2 2012-13grew somewhat, in part also because of a sharpincrease in other incomes. As has already beenindicated in Chapter 4, the corporate sector has onlyhad limited pricing power, with inflation for non-foodmanufacturing recording a sharper deceleration thanheadline inflation. Inflation for capital goods remainedrelatively low.
Capital goods sector continues to be a dragon manufacturing performance9.17 The lower corporate profitability andmoderation in the growth of credit flow to industry
http://indiabudget.nic.in

199Industry
also had its impact of the performance of capitalgoods sector, which in turn affected overall industrialgrowth. Post global financial crisis, the IIP-basedgrowth rate of the capital goods sector was robustat 14.8 per cent in 2010-11, thereafter the sectorhas continued to experience a sustained recession.The output of the capital goods sector contractedby 10.1 per cent during April-December 2012. Turningto sub-sectors of capital goods, we see persistentnegative growth in machinery and equipment,electrical machinery and transport segments (Table9.7). Major individual products falling under the capitalgoods sector and registering negative growth during
Table 9.6 : Growth in Sales and Expenditure of Listed Manufacturing Companies in thePrivate Sector
Items 2010-11 2011-12 2012-13
Q1 Q2 Q3 Q4 Q1 Q2 Q3 Q4 Q1 Q2
No. of companies 1900 1933 1961 1953 1935 1922 1910 1887 2003 1954
Growth rates ( Y-o-Y in per cent)
Sales 28.8 21.2 19.0 23.3 24.9 19.7 19.5 15.2 13.0 11.4
Change in stock-in-trade 354.0 -46.5 89.0 214.9 -42.8 -24.0 117.7 -53.6 -40.1 224.3
Expenditure of which 34.5 22.5 21.1 26.5 25.0 23.2 25.9 16.2 15.6 12.5
Raw material 40.6 21.9 20.9 30.5 28.8 23.8 26.0 17.0 13.4 14.7
Staff cost 16.9 20.4 21.1 18.2 17.5 15.3 13.5 10.8 13.2 12.5
Power & fuel 13.1 15.6 22.9 20.7 27.9 23.3 25.5 24.4 19.1 15.9
Other income -28.5 69.5 10.3 -30.5 45.8 -3.0 40.4 72.3 15.8 71.1
Interest expenditure 10.9 7.8 13.7 23.1 20.5 41.5 38.6 30.0 38.2 10.0
Net profit 8.2 10.9 14.6 7.1 9.6 -18.3 -43.9 -9.8 -18.1 28.7
Ratio (in per cent)
Net profit to sales 8.0 8.1 7.7 7.4 6.8 5.4 3.6 6.1 5.0 6.3
Source : RBI
the current financial year are computers, UPS,transformers, cable insulated, turbines andconstruction machinery.
9.18 Deceleration in investment, importsubstitution in the machinery and electricalmachinery segments, and a decline in the numberof new projects adversely impacted the capital goodssector. The dip in the transport segment after robustgrowth in 2009-2011 has mainly been due to thedecline in domestic demand for commercial vehiclesand three wheelers. During 2010-11 and 2011-12imports of capital goods increased by 28 per cent
Table 9.7 : IIP-based Growth Rate Of the Capital Goods Sector and its Constituents(in per cent)
2009-10 2010-11 2011-12 April-Dec.2012-13
Fabricated metal products 10.2 15.3 11.2 -2.4
Machinery & equipment 15.8 29.4 -5.8 -3.8
Office, accounting & comp. machinery 3.8 -5.3 1.6 -12.5
Electrical machinery -13.5 2.8 -22.2 -14.6
Motor vehicles, etc 29.8 30.2 10.8 -3.2
Other transport equipments 27.7 23.2 11.9 -1.2
Capital goods 1.0 14.8 -4.0 -10.1
Manufacturing 4.8 9.0 3.0 0.7
Source : CSO
http://indiabudget.nic.in

200 Economic Survey 2012-13
and 32 per cent respectively. Imports of machinery,electrical machinery, machine tools and projectgoods saw a major spurt. However, due todepreciation of the rupee and depressed domesticdemand during the current financial year, the importof key capital goods has declined. The share ofcapital goods in overall imports during 2010-11, 2011-12 and 2012-13 (Apr-Dec) ranged between 18-20 percent. Total import of capital goods during April-December 2012-13 was about $68.35 billion out ofthe total imports of $365 billion (Table 9.8).
9.19 Analysis of the quarterly trend of capital goodsimports and domestic production of capital goodsshows a sudden spurt in imports of capital goodsduring 2011-12 and these impacted domesticsegments of heavy machinery, constructionmachinery and electrical machinery. But during thecurrent financial year there has been a sharper
deceleration in the imports of capital goodsespecially during Q2 (Fig 9.7). As the IIP-basedcapital goods sector output declined by 20.1 percent (in Q1), 8.1 per cent (in Q2) and 1.0 (in Q3) ofthe current financial year, deceleration in capitalgoods output is also due to slowdown in domesticinvestment and project expenditure.
Is industrial slow down bottoming out?9.20 Notwithstanding a pick-up in industrial growthobserved in October 2012, there are mixed signalson whether the slowdown phase has bottomed outor the current sluggishness would persist a littlelonger. There are at least two factors which suggestsome optimism on industrial front. The data onfrequency distribution of products/product groupswhich constitute the IIP indicate the number ofproducts with a negative growth has declined from
Table 9.8 : Rate of Growth of Imports of Capital Goods valued in US$(per cent)
2009-10 2010-11 2011-12 2012-13(April-Dec.)
1. Machine tools -27.6 36.1 32.7 -3.6
2. Machinery other than electrical -9.4 21.0 26.6 -6.7
3. Electrical machinery -16.1 23.4 24.1 -6.5
4. Transport equipment -11.5 -2.1 19.2 4.5
5. Project goods 47.9 30.8 42.1 -15.4
6. Manufactures of metals -26.1 38.5 27.5 3.1
7. Electronic goods -10.7 26.8 23.0 -8.2
8. Computer Soft. physical form 32.0 -32.5 44.3 -60.8
Source : Department of Commerce, Ministry of Commerce and Industry
http://indiabudget.nic.in

201Industry
182 in Q4 of 2011-12 to 160 in October-November,2012. The weight of the products with a negativegrowth has declined to 29.3 per cent in October-November, 2012 from an average of 40-45 per centin Q2 of 2011-12. Number of products and theirweights which have been witnessing a growth inexcess of 20 per cent are showing a mild upwardtrend (Table 9.9).
9.21 The second set of data making for theoptimism is the RBI's business expectation index,which recorded moderately positive growth in Q3of 2012-13, after persistent negative growth forthe previous six quarters. The business
expectation index tracks IIP growth fairly closelyand this suggests a possible bottoming out of IIPgrowth moderation (Figure 9.8). Globally alsothere has been a pick-up in industrial activity.Initiatives taken by the government, both withregard to confidence building and other measuresto boost manufacturing should also facilitateindustr ial recovery (Box 9.2). Downwardmomentum of IIP, IIP manufacturing and creditgrowth to industry based on SAAR, however,indicate that the data taken together, should beseen as mixed, and it is a little early to call abottom to the industrial sector slowdown.
Table 9.9 : Frequency Distribution of Products in Terms of Their Growth
2010-11 2011-12 2011-12 2012-13
Q1 Q2 Q3 Q4 Q1 Q2 Oct-Nov
No.of products/product groupsNegative 102 163 151 168 179 182 175 188 160
0-5 82 92 74 65 81 77 60 67 75
6 to 20 137 109 105 103 89 80 101 83 97
20 and above 81 38 72 66 53 63 66 64 70
Total commodities 402 402 402 402 402 402 402 402 402
Weights ( per cent)Negative 22.22 28.60 28.53 36.96 39.53 41.64 45.01 41.38 29.33
0-5 20.86 29.79 16.69 18.10 18.57 27.73 11.42 27.62 34.74
6 to 20 42.58 33.16 41.25 32.44 31.58 23.38 38.01 21.74 24.36
20 and above 14.34 8.44 13.52 12.50 10.33 7.25 5.57 9.25 11.57
Total weight 100.00 100.00 100.00 100.00 100.00 100.00 100.00 100.00 100.00
Note: The IIP has 399 products/product groups and treats electricity and mining as one product each.Mining sector has been divided into crude petroleum, coal, natural gas and others, as the first threeproducts are covered in the core industries.
http://indiabudget.nic.in

202 Economic Survey 2012-13
Box 9.1 : Comparative Picture of India and World Manufacturing ProductionIndia is one of the top ten manufacturing countries though its share in total manufacturing value added (MVA) is only about1.8 per cent. The impact of the post-crisis slowdown on industrial growth has been relatively mild on developing countriesincluding India yet the downward trend in MVA has been significant. The intensity of the slide did vary across countries asshown in Figure in the box. The growth rate of world MVA had declined from 5.4 per cent in Q1 of 2011-12 to 2.2 per cent inQ2 of 2012-13. During the same period China's MVA growth rate declined from 14.3 per cent to 7.3 per cent but thedeceleration rate has been sharper in the case of India as the rate of growth dipped from 7.3 per cent to 0.2 per cent. Analysisof the sub-group level MVAs shows sharp differences between India vis -a -vis other major manufacturing countries. Theproduction of machinery and equipment, one of the key segments of the capital goods sector, has been growing at faster ratein the United States, Canada, China, Malaysia as compared to the deceleration in India's case. A similar pattern is observablein other capital goods segments and high technology sectors. The reason is India's competitive disadvantage owing to low-level technology, higher input costs and poor quality infrastructure. A long term trend analysis from 1995 to 2009 shows thatIndia has lagged behind in increasing its share in MVA of sophisticated products. It has fared better in medium-lowtechnology products in labour-intensive sectors such as textiles, wearing apparel and leather products. Even in these threesectors India's share was low as compared to China, which dominates all three sectors.
A two-digit industry level analysis of world manufacturing shows that in recent years the five fastest- growing sectors were- office accounting and computing; radio, TV and communication equipment; electrical machinery and apparatus, othertransport; and basic metal. Other than basic metal all these sectors are medium and high technology activities. India'sperformance in recent years has been dismal in some of these fast moving sectors. In contrast, China accounted for more than50 per cent of the developing economies total MVA in 15 out of the 22 industrial sectors -- India's share was significant onlyin a few of these sectors. The latest competitive industrial performance index (CIP) compiled by the United NationsIndustrial Development Organization (UNIDO), ranks India 42nd out of 118 countries the same as in 2005. China isranked 5th.
Organized manufacturing9.22 The Ministry of Statistics and ProgrammeImplementation on 31st December, 2012 releasedthe provisional results of the Annual Survey ofIndustries (ASI) for 2010-11. The ASI is the mostcomprehensive survey of organized manufacturingemploying 10 or more workers. These industriesrecorded a growth of 19.5 per cent in gross valueadded (GVA) in 2010-11 indicating a sharp increasecompared to a growth of 10.6 per cent in 2008-9 and14.1 per cent in 2009-10. Another positive feature isan increase in number of persons engaged. The totalnumber of persons engaged in these industries hasshown continuous increase since 2001-2. Overallemployment in these industries recorded a growthof 7.8 per cent in 2010-11. The total number of
persons engaged in organized manufacturingindustries reached 12.7 million in 2010-11 ascompared to employment of 7.8 million in 2001-2.The employment growth in organized manufacturingis in sharp contrast to the decline in overall numberof persons engaged in manufacturing as per the 2009-10 National Sample Survey Organization (NSSO)survey on employment. Industry has becomeconscious of its fuel efficiency. Fuel consumptionas a percentage of total output has shown continuousdecline to stand at 4.2 per cent in 2010-11, organizedmanufacturing has remained resource intensive. Theshare of GVA in their total value of output hasgradually declined from a peak of 24.9 per cent in1996-97 to 17.8 per cent in 2010-11, indicating anincrease in resource intensity, particularly of rawmaterials and other non-fuel inputs. (Figure 9.9).
http://indiabudget.nic.in

203Industry
Box 9.2 : Government's key initiatives to Boost ManufacturingApart from the government's recent steps to uplift overall business sentiment and boost investment, several specific initiativeshave been initiated to strengthen industry and in particular the manufacturing sector in the country. The Twelfth Five YearPlan document lays down broad strategies for spurring industrial growth and recommends sector specific measurescovering micro, small, medium and large industries in the formal as well as informal sector. Some of major initiatives that canchange the manufacturing landscape of the country are announcement of National Manufacturing Policy (NMP),implementation of the Delhi Mumbai Industrial Corridor (DMIC) Project (see Chapter 2) and policy reforms to promoteforeign direct investment (FDI) and an e-Biz project.
National Manufacturing Policy (NMP)The NMP was approved by the government in October, 2011. The major objectives of the policy are enhancing the share ofmanufacturing in gross domestic product (GDP) to 25 per cent and creating an additional 100 million additional jobs overa decade or so. The Policy also provides special focus to industries that are employment intensive, those producing capitalgoods, those having strategic significance, small and medium enterprises, and public sector enterprises besides industrieswhere India enjoys a competitive advantage. The NMP provides for promotion of clusters and aggregation, especiallythrough the creation of national investment and manufacturing zones (NIMZs). Out of twelve NIMZs so far announced,eight are along the DMIC. Besides, four other NIMZs have been given in-principle approval (i) Nagpur in Maharashtra, (ii)Tumkur in Karnataka, (iii) Chittoor district in Andhra Pradesh, and (iv) Medak district in Andhra Pradesh.DMIC ProjectIndustrial development initiatives under DMIC project presently cover eight industrial cities that are proposed to bedeveloped along the railway corridor. The Master Planning for the investment regions and industrial areas taken up initiallyto be developed as new cities in Gujarat, Madhya Pradesh, Haryana, Rajasthan and Maharashtra have been completed andmaster planning in Uttar Pradesh has started. The State governments have initiated the process of obtaining land for the newindustrial regions/areas as well as for the Early Bird Projects. Environmental impact assessment (EIA) studies have beeninitiated for five industrial cities. Details of the overall DMIC project have been discussed in Chapter 2.FDI Policy initiativesAs a part of policy reform process, the FDI policy is being progressively liberalized on an ongoing basis in order to allow FDIin more industries under the automatic route. Some recent changes in FDI policy, besides consolidation of the policy into asingle document include FDI in multi-brand retail trading up to 51 per cent subject to specified conditions; increasing FDIlimit to 100 per cent in single-brand retail trading; FDI up to 49 percent in civil aviation and power exchanges; FDI up to 49percent in broadcasting sector under the automatic route and FDI above 49 percent and up to 74 percent under theGovernment route both for teleports and mobile TV.Setting up of the e-Biz Project to promote ease of doing business The government has announced the setting up of -'Invest India'-, a joint-venture company between the Department ofIndustrial Policy and Promotion and FICCI, as a not-for-profit, single window facilitator, for prospective overseas investorsand to act as a structured mechanism to attract investment. In addition, the Government has initiated implementation of thee-Biz Project, a mission mode project under the National e-Governance Plan (NeGP) for promoting an online single windowat the national level for business users. The objectives of setting up of the e-Biz portal are to provide a number of services tobusiness users, covering the entire life cycle of their operation. The project aims at enhancing India's business competitivenessthrough a service oriented, event-driven G2B interaction.
http://indiabudget.nic.in

204 Economic Survey 2012-13
Higher resource intensity not only has implicationsfor internal accruals but also for research anddevelopment (R&D).
Characteristics of Organized Manufacturing9.23 A higher intensity of resource use has madethe profitability of organized manufacturingconsiderably dependent on wages and interest rates.Total emoluments as a percentage of output haveconsistently declined from 40.6 per cent in 1980-81to 22 per cent in 2010-11. The share of emolumentsin total output has remained in the range of 19-22per cent in the last seven years. There has alsobeen a decline in the share of interest to output,from 28.4 per cent in 1991-92 to 9.0 per cent in 2006-07, increasing thereafter to 10.6 per cent in 2010-11. The increase in profitability of the organizedmanufacturing has depended on the reduction inthese two ratios and improved from 18.5 per cent in1991 to 53.8 per cent in 2007-08 before moderatingto 47.8 per cent in 2010-11. Interest rates structuretherefore becomes one of the important factors forinternal accruals of the organized manufacturingsector. Unorganised manufacturing with relatively lessaccess to institutional capital may in fact be evenmore vulnerable to interest rate increases(Figure 9.10).
MICRO, SMALL AND MEDIUM
ENTERPRISES (MSME) SECTOR
9.24 The MSME sector covers both the registeredand informal sectors. The classification of micro,small and medium enterprises at present is based
on the criterion of investment in plant and machineryby each enterprise. Detailed information for theregistered MSMEs on the various economic variablessuch as employment, investment, products, grossoutput, and exports is available based on the FourthCensus of MSME (2006-07). The size of theregistered MSMEs was estimated to be about 15.84lakh units with sub-sector wise composition in theproportion of 94.9 per cent micro enterprises, 4.89per cent small and 0.17 per cent medium enterprises.The total registered MSME sector comprised of 67.1per cent manufacturing enterprises and 32.9 per centservices enterprises. About 45 per cent of theseregistered enterprises were located in rural areas.More detailed information based on the FourthCensus on the unorganized sector units, constitutingabout 94 per cent of the entire MSME sector isawaited.
9.25 In the recent past the Prime Minister's TaskForce on MSMEs and the Twelfth Plan WorkingGroup on MSMEs have discussed issues related tothe MSME sector. The Twelfth Five Year Plan policyframework is guided by the recommendations ofthese key committees. The Plan covers variousaspects of the MSME sector and its keyrecommendations fall under six broad verticals, viz.1) finance and credit (ii) technology (iii) infrastructure(iv) marketing and procurement (v) skill developmentand training, and (vi) institutional structure. The Planhas a separate set of recommendations for the khadiand village industries and the coir sector. In order toboost the MSME sector, several schemes are underoperation including the following ones.
1. Procurement Policy: The government has notifieda Public Procurement Policy for Goods
http://indiabudget.nic.in

205Industry
Produced and Services rendered by Micro &Small Enterprises (MSE) order, 2012 effectivefrom 1st April, 2012. The policy mandates thatall the central ministries / departments / centralpublic sector undertakings (CPSUs) shallprocure a minimum of 20 per cent of their annualvalue of goods / services required by them fromMSEs. Further, policy has earmarked a sub-target of 4 per cent procurement out of this 20per cent from MSEs owned by scheduled caste/scheduled tribe (SC / ST) entrepreneurs.
2. MSE- Cluster Development Programme (MSE-CDP): The Ministry of MSME has adopted acluster approach for holistic development of MSEin a cost effective manner. To build capacity ofMSMEs for common supportive actions, softinterventions are undertaken in the existingclusters/new industrial areas/ estates or existingindustrial areas/estates. To ensure transparencyand speedy implementation of the MSE-CDP,office of the Development Commissioner, MSMEhas started an online application system from 1April 2012. Hard interventions are taken up tocreate/upgrade infrastructure facilities andsetting up of common facility centres in new/existing industrial estates/clusters.
3. Credit Guarantee Scheme: The Government isimplementing the Credit Guarantee FundScheme for MSEs with the objective offacilitating flow of credit to the MSEs, particularlyto micro enterprises by providing guarantee coverfor loans upto ̀ 100 lakh without collateral / thirdparty guarantees. For making the scheme moreattractive to both lenders as well as borrowers,several modifications have been undertakenwhich, inter alia, include: (a) enhancement inthe loan limit to ̀ 100 lakh; (b) enhancement ofguarantee cover from 75 per cent to 85 per centfor loans upto ` 5 lakh; (c) enhancement ofguarantee cover from 75 per cent to 80 per centfor MSEs owned/operated by women and forloans in north eastern region (NER); (d) reductionin one-time guarantee fee from 1.5 per cent to 1per cent and annual service charges from 0.75per cent to 0.5 per cent for loans upto ` 5 lakhand (e) reduction in one-time guarantee fee forNER from 1.5 per cent to 0.75 per cent.
4. Credit Linked Capital Subsidy Scheme for Microand Small Enterprises (CLCSS) for MSEs: Thescheme aims at facilitating technology up-gradation of MSEs by providing 15 per centcapital subsidy (limited to maximum ` 15 lakh)
for purchase of plant & machinery. Maximumlimit of eligible loan for calculation of subsidyunder the scheme is ` 100 lakh. Presently, 48well established and improved technologies/subsectors have been approved under the scheme.The CLCSS is implemented through 11 nodalbanks/agencies including the Small IndustriesDevelopment Bank of India (SIDBI), NationalBank for Agriculture and Rural Development(NABARD) and Tamil Nadu Industrial InvestmentCorporation (TICC), Chennai (TIIC) and NationalSmall Industries Development Corporation(NSIC) Ltd.
Central Public sector Enterprises9.26 Central Public Sector Enterprises (CPSEs)are an important constituent industry. There werealtogether 260 CPSEs under the administrativecontrol of various ministries/departments as on 31March 2012. Of these, 225 were in operation and 35under construction. The share of industrial CPSEsin the total investment in CPSEs in terms of grossblock, stood at 77.46 percent during the year. Thelatest complete results are available for the year2011-12. CPSEs in the mining sector registered thehighest increase in net profit (29.45 per cent) in 2011-12. CPSEs in manufacturing sector recorded adecline of 22.65 per cent in net profit in 2011-12despite 27.73 per cent increase in their turnover. Theelectricity sector recorded growth of 16 per cent inturnover and 13.42 per cent in profit (Table 9.10).
9.27 The government set a target of raising ̀ 40,000crore by way of disinvestment in various CPSEsduring 2011-12 and raised ` 13,854 crore, whichincluded disinvestment by way of 'offer for sale' (OFS)in Oil and Natural Gas Commission(ONGC)amounting to ̀ 12,749.50 crore. The disinvestmenttarget in Budget 2012-13 has been set ̀ 30,000 crore.
Foreign Direct Investment (FDI)9.28 The government has put in place an investor-friendly policy on FDI, under which equity participationof up to 100 per cent, is permitted through theautomatic route, in many sectors/activities. FDIpolicy is reviewed on an ongoing basis, with a viewto making it more investor friendly. For ease ofreference, all press notes/circulars issued since 1991have been consolidated into a single document whichis available in the public domain on the website ofDepartment of Industrial Policy and Promotion(www.dipp.nic.in). Significant changes have beenmade in the FDI policy regime in recent times, to
http://indiabudget.nic.in

206 Economic Survey 2012-13
ensure that India remains increasingly attractive andinvestor-friendly. Some of the changes made to thepolicy during 2012 are as follows:
(i) Significant changes effective from 10.4.2012include: (i) mandating FIPB approval only forinvestment made under the FDI scheme incommodity exchanges (ii) clarification thatthe activity of 'leasing and finance', coversonly 'financial leases' and not 'operatingleases' ( (iii) clarification that raising of theaggregate limit of 24 per cent, to the sectoralcap/statutory ceiling, would be subject to priorintimation to RBI.
(ii) Reviewing the policy relating to calculation ofdownstream investments by a bankingcompany incorporated in India, which isowned and/or controlled by non-residents/ anon-resident entity/non-resident entities, thegovernment has exempted downstreaminvestments made by such companies, undercorporate debt restructuring (CDR), or otherloan restructuring mechanism, or in tradingbooks, or for acquisition of shares due todefaults in loans, from being counted asindirect foreign investment.
(iii) The government amended the policy on single-brand retail trading, amending the conditionsrelating to : (i) the foreign investor being theowner of the brand: it has been specified that,henceforth, only one non-resident entity,whether owner of the brand or otherwise, shallbe permitted to undertake single brandproduct retail trading, for the specific brand,
through a legally tenable agreement, with thebrand owner and (ii) mandatory sourcing ofat least 30 per cent of the value of productsto be done from Indian 'small industries/village and cottage industries, artisans andcraftsmen', applicable in respect of proposalsinvolving FDI beyond 51 per cent: It has beenspecified that, sourcing of 30 per cent of thevalue of goods purchased, will be done fromIndia, preferably from MSME, village andcottage industries, artisans and craftsmen,in all sectors.
(iv) The government has decided to permit FDIup to 51 per cent, with FIPB approval, in multi-brand retail trading, subject to specifiedconditions.
(v) In the civil aviation sector, the government hasdecided to permit foreign airlines also toinvest, in the capital of Indian companies,operating scheduled and nonscheduled airtransport services, up to the limit of 49 percent of their paid-up capital.
(vi) The government has decided to permit foreigninvestment up to 49 per cent, in powerexchanges, registered under the CentralElectricity Regulatory Commission (PowerMarket) Regulations, 2010. The foreigninvestment would be in compliance withSecurities and Exchange Board of India(SEBI) Regulations; other applicable laws/regulations; security and otherconditionalities.
Table 9.10 : Performance of Industrial CPSEs, 2011-12(`̀̀̀̀ crore)
SI. No. Sector 2010-11 2011-12 Per centchange
I. Manufacturing (28.31 per cent) @
1.1) Turnover 947,411.7 1,210,087.6 27.7
1.2) Net Profit 30,668.2 23,720.5 (22.7)
II. Mining (23.53 per cent) @
2.1) Turnover 15,968.3 188,011.1 17.7
2.2) Net Profit 47,594.8 61,610.6 29.5
III. Electricity (25.62 per cent) @
3.1) Turnover 84,032.4 97,623.0 16.2
3.2) Net Profit 18,727.5 21,239.9 13.4
Source : Department of Public EnterprisesNote : @ shows the percentage share, in total investment in terms of gross block;
http://indiabudget.nic.in

207Industry
(viii) The government has decided to permit NBFCs(i) having foreign investment above 75 per centand below 100 per cent and (ii) with aminimum capitalisation of US$ 50 million, toset up step down subsidiaries for specificNBFC activities, without any restriction onthe number of operating subsidiaries andwithout bringing in additional capital.
FDI inflows9.29 During April-November 2012-13, FDI inflow(including equity inflows, reinvested earnings andother capital) was US$ 24.65 billion (Table 9.11).FDI equity inflows were US$ 15.85 billion showing adecline of 43 percent as compared to thecorresponding period of the previous year. CumulativeFDI inflow from April 2000 to November 2012 stoodat US$ 277.86 billion.9.30 During April-October 2012, services, hotelsand tourism, metallurgical industries, automobileindustry, construction, drugs and pharmaceuticals,industrial machinery were the sectors that attractedmaximum FDI inflows. Sector-wise FDI inflows intoindustry and infrastructure is given in Table 9.12.9.31 In FDI equity investments, Mauritius tops thelist of first ten investing countries, followed bySingapore, the UK, Japan, the US, the Netherlands,Cyprus, Germany, France, and the UAE. The UnitedNations Conference on Trade and Development(UNCTAD) World Investment Report, 2012 in itsanalysis of the global trends and sustained growthof FDI inflows continues to report India as the thirdmost attractive location for 2012-14.
Industry- Environment linkages9.32 The development of a diversified industrialstructure in India, based on a combination of largeand small-scale industries and growing urban andrural population have produced pressures on theenvironment as reflected in the growing incidence ofair water, and land degradation. Industrial pollutionis concentrated in industries like petroleum refineries,textiles, pulp and paper, industrial chemicals, ironand steel, and non-metallic mineral products. Smallscale industries, especially foundries, chemicalmanufacturing, and brick making, are also significantpolluters. In the power sector, thermal power, whichconstitutes the bulk of installed capacity for electricitygeneration, is an important source of air pollution.Choice of policies and investment has, therefore tobe such which encourages more efficient use ofresources, substitution away from scarce resourcesand adoption of technologies and practices thatminimize environment impact.
Labour relations9.33 Due to constant endeavour of the industrialrelations machineries of both the centre and states,the industrial relations climate has generallyremained peaceful and cordial. While the number ofincidences of strikes and lockouts reported during2007 were 389, this figure was 189 in 2011(provisional) and stood at 194 (provisional) up toOctober 2012. The number of strikes has exhibiteda declining trend over the period. Similarly the figuresfor mandays lost were 27.17 million in 2007 and 2.03million (provisional) up to October, 2012 (Table 9.13).
Table 9.11 : Foreign inflows(US$ billion)
Financial year As per international Percentage FDI equity Percentagepractices growth inflow growth
2003-4 4.32 (-) 14 2.19 (-) 19
2004-5 6.05 (+) 40 3.22 (+) 47
2005-6 8.96 (+) 48 5.54 (+) 72
2006-7 22.83 (+) 146 12.49 (+) 125
2007-8 34.84 (+) 53 24.58 (+) 97
2008-9 41.87 (+)20 31.40 (+)28
2009-10 (P) 37.75 (-)10 25.83 (-)18
2010-11 (P) 34.85 (-)08 21.38 (-)17
2011-12(P) 46.55 (+)34 35.12 (+)64
2012-13 (P) (Apr-Nov) 24.65 15.85
Source : DIPP; P : provisional
http://indiabudget.nic.in

208 Economic Survey 2012-13
As regards spatial/industry-wise dispersions ofincidences of strikes and lockouts, there existwidespread variations among different states/UTs.Wage and allowance, bonus, personnel, indiscipline
and violence and financial stringency have beenstated to be the major reasons for these strikes andlockouts.
CHALLENGES AND OUTLOOK
9.34 Industrial production remained sluggish in2011-12 and the moderation continued during thecurrent financial year. Industrial growth still remainsvulnerable to several domestic factors and externalshocks. Infrastructure and energy constraints,decline in demand for India's exports, and fragilerecovery in investment are the risk factors. The latestlead indicators suggest mixed signals about whethera growth upturn is underway. The policy initiativestaken by the government in the recent months madethe business sentiment buoyant and have generatedsome optimism. The latest seasonally adjustedannualised growth of industrial output indicate thatthe growth of the sector could remain moderatelypositive at around 3 per cent for the current year.
Table 9.12 : Sector-wise FDI flows into Industry and Infrastructure(US $ million)
1991-2000 2000-10 2010-11 2011-12 April-Oct April-Oct2011-12 2012-13
Food products 707.4 1237.3 246.9 239.7 122.3 368.4
Fermentation industries 24 770.1 57.7 69.7 53.1 43.7
Textiles 241.8 828.6 129.8 164.7 74.3 91.3
Wood products 0.0 18.8 1.6 29.6 8.1 28.7
Paper 250.5 716.9 44.0 454.7 29.6 3.1
Leather 33.5 42.6 9.3 8.3 5.6 34.7
Chemicals 1480.9 4446.1 2690.2 7534.1 7007.6 789.4
Rubber, plastic & petroleum
Products (including oil exploration) 90.3 2953.6 573.6 2217.4 2097.8 476.3
Non Metallic Minerals 261.1 2263.6 657.3 310.0 203.4 189.7
Metals and metal products 186.2 3143.2 1098.1 1786.1 1436.9 1215.1
Machinery and equipment 2043.1 15670.4 1836.3 4147.5 2894.2 1171.2
Transport equipment 0 4603.2 1299.4 923.0 563.7 743.2
Others manufacturing 1761.6 5705.6 1495.6 850.5 625.7 206.3
Mining (including mining services) 0 730.9 79.5 142.7 135.0 15.9
Power* 1038.9 5220.9 1486.2 2104.6 1440.8 771.0
Telecommunication 1089.4 8915.9 1664.5 1997.2 1964.1 48.4
Total 9208.7 57267.7 13369.9 22979.7 18662.0 6196.4
Source : Office of the Economic Adviser, DIPPNote : Total excludes inflows to services sector and other NRI schemes*includes non-conventional energy
Table 9.13 : Strikes and Lockouts (man-dayslost)
Year Strikes Lockouts Total Man-days lost
2007 210 179 2,71,66,752
2008 240 181 1,74,33,721
2009(P) 205 187 1,33,64,757
2010(P) 261 168 1,79,32,345
2011(P) 106 29 66,71,179
2012(Jan.-October) (p) 173 21 20,29.439
Source: Labour Bureau, Ministry of Labour &Employment
Note : P = provisional
http://indiabudget.nic.in

209Industry
9.35 In the short run, revival of investment inindustry and key infrastructure sectors is the keychallenge. Industrial sector has been hit hard by thedeceleration in investment for the second successiveyear. As per the latest first revised estimates of GDP,gross capital formation in the manufacturing sectorin 2011-12 (at 2004-05 prices) had declined by 18.8per cent as compared to 2010-11. Lower foreign directinvestment inflows in key industry and infrastructuresectors during April-October 2012 at $ 6.19 billionas against the inflow of $18.66 billion during the sameperiod of the previous year have further constrainedinvestment in these sectors. Investment intentionsindicated in the industrial entrepreneur memorandum(IEMs) filed, which are lead indicators of likelyinvestment flows to industry, also declined in 2011and 2012. Notwithstanding a marginal pickup in thegross bank credit deployment into industrial sectorin recent months, year on year increase in grossbank credit deployment as on end December 2012has been 13.8 per cent as compared to 19.8 percent a year ago.
9.36 Apart from weak investment climate, industrialsector performance remained subdued due toinfrastructure bottlenecks. Industrial growth ratemoderated due to sharp decline in output of naturalgas; subdued performance of the coal sector and itsresultant impact on thermal power generation; andslow pace of project implementation in rail, road,and ports sectors. In the medium term it is thereforecrucial to accelerate the output of core sectors andspeed up implementation of crucial big ticket projects.
9.37 As discussed in detail in the earlier sections,the key underpinning cause of the recent industrialslowdown has been the manufacturing sector. India'smanufacturing value-added (MVA) as share of GDP,has remained sticky at around 15 per cent. As perthe latest competitive industrial performance index(CIP) compiled by UNIDO for the year 2009, Indiawas placed 42nd out of the 118 countries. India'slow CIP ranking hints at the underlying weaknessesand vulnerabilities despite being one of the top ten
manufacturing nations. India's manufacturing sectortherefore needs to acquire dynamism andtechnological sophistication to become one of theleading manufacturers. From the long term point ofview, low level of R&D and inadequate availability ofskilled manpower would adversely affect India'scompetitiveness and the manufacturing growth.
9.38 India has not improved significantly in termsof the ease of doing business and ranks very low incomparison to other industrial peers. The MSMEsector in particular faces multiple approval andoperational restrictions. The process of setting upand exiting business is time consuming andcomplicated requiring expensive third partyassistance. Since states have the major role inadministering MSME sector, the prevailingecosystem therefore varies from state to state. Exitrules as per the Companies Act, 1956 are complexand costly and do not permit reaping the benefitsfrom reallocation of resources.
9.39 Sourcing of finance at competitive cost isanother major constraint for both the organized andthe unorganized MSME enterprises. Financing otherthan internal accruals is costly and prohibitive. ThePrime Minister's Task Force on MSMEs hadrecommended a 20 per cent year-on-year growth incredit to micro and small enterprises to ensureenhanced credit flow. It had also recommendedallocation of 60 per cent of the micro and smallenterprises advances to the micro enterprises to beachieved in a phased manner. The resource flow,however, needs to improve. Research and technologyupgradation activities also need to be scaled up.Presently only a small number of incubators operatesin the country which is very low relative to othercountries. New incubators will need to be set up ona Public-Private Partnership basis. To attract moreinvestment and talent, incubators need to be allowedto distribute profits back to investors. With some ofthese changes indutrial growth could becomesteadier.
http://indiabudget.nic.in

Services Sector CHAPTER
10
India’s services sector expanded quickly with double-digit growth in the second half
of the 2000s. As the Euro-zone crisis has worsened, growth has slowed, though thesector is still growing at a much higher rate than the other two sectors of the economy.
10.2 The services sector covers a wide array ofactivities ranging from services provided by the mostsophisticated sectors like telecommunications,satellite mapping, and computer software to simpleservices like tehose performed by the barber, thecarpenter, and the plumber; highly capital-intensiveactivities like civil aviation and shipping toemployment-oriented activities like tourism, realestate, and housing; infrastructure-related activitieslike railways, roadways, and ports to social sector-related activities like health and education. Thus,there is no one-size–fits- all definition of servicesresulting in some overlapping and some borderlineinclusions. The National Accounts classification ofthe services sector incorporates trade, hotels, andrestaurants; transport, storage, and communication;financing, insurance, real estate, and businessservices; and community, social, and personalservices. In the World Trade Organization (WTO)list of services and the Reserve Bank of India (RBI)classification, construction is also included.
SERVICES SECTOR : INTERNATIONALCOMPARISON
10.3 In world GDP of US$70.2 trillion in 2011, theshare of services was 67.5 per cent, more or lessthe same as in 2001. Interestingly the top 15countries in terms of services GDP are also thesame in overall GDP in 2011. This list includes themajor developed countries and Brazil, Russia, India,
and China. Among the top 15 countries with highestoverall GDP in 2011, India ranked 9th in overall GDPand 10th in services GDP. A comparison of theservices performance of the top 15 countries in theeleven-year period from 2001 to 2011 shows thatthe increase in share of services in GDP is thehighest for India (8.1 percentage points) followedby Spain. While China’s highest services compoundannual growth rate (CAGR) of 11.1 per cent wasaccompanied by marginal change in its share ofservices for this period, India’s very high CAGR (9.2per cent) which was second highest was alsoaccompanied by the highest change in its share.This is also a reflection of the domination of theindustrial sector along with services in China in itsgrowth, while India’s growth has been poweredmainly by the services sector (also see Chapter 2).Despite the higher share of services in India’s GDPand dominance of industry over services in China,in terms of absolute value of services GDP as wellas growth in services ( both decadal and annual in2001, 2010, and 2011) China is still ahead of India.(Table 10.1)
10.4 Country estimates for 2012 show adeceleration in services growth in some majorcountries. For example, in 2012 it decelerated to0.5 per cent from 0.9 per cent (in 2011) in the USA;8.1 per cent in 2012 from 9.4 per cent (in 2011) inChina; and 6.6 per cent in FY 2012-13 from 8.2 percent (in FY 2011-12) in India. In Brazil, the servicessector grew by a 1.4 per cent in Q3 of 2012compared to 2.1 per cent in the correspondingperiod of the previous year.
http://indiabudget.nic.in

211Services Sector
10.5 While the share of services in employmentfor many developed countries is very high and inmany cases higher than the share of services inincomes, the gap between these shares is relativelyless. Except China and India, all the other BRICScountries also have a similar pattern. In the Indianand Chinese cases, there is a wide gap betweenthe two, with gap being wider for India. China’s shareof services in both income and employment isrelatively low due to the domination of the industrialsector, but the gap is also narrower than that of India.
10.6 World services export growth (CAGR) reacheda high of 12.6 per cent during 2000 to 2008 comparedto 6.6 per cent in the 1990s. Growth of world exportsof services which declined to - 11.1 per cent due tothe global economic crisis of 2008, quicklyrebounded in 2010 and grew by 10 per cent.However, the pre-crisis (2008) level of US $ 3.84 trillionwas reached and surpassed only after a lag of two
years in 2011 when world services exports reachedUS $ 4.17 trillion with a growth of 11 per cent. TheEuro-zone crisis and the global slowdown in 2012affected services trade as well. Mirroring the trendsin world GDP growth and merchandise trade, worldexports of commercial services started deceleratingfrom Q4 of 2011 with 5 per cent growth followed by 4per cent in Q1 of 2012, zero per cent in Q2 of 2012and - 2 per cent in Q3 2012.
10.7 World services-sector FDI rebounded in 2011after falling sharply in 2009 and 2010, to reach aroundUS $570 billion, registering a growth of 15 per centover the previous year. FDI in non-financial services,which accounted for 85 per cent of the total, rosemodestly, on the back of increases in FDI, targetingelectricity, gas, and water as well as transportationand communications. Financial services registereda 13 per cent increase in the value of FDI projects in2011 reaching US$80 billion, though still 50 per centbelow the pre-crisis average (2005-2007). FDI projects
Table 10.1 : Performance in Services : International comparison
Country Rank Overall GDP Share of services Change Services growth(US$ billion) ( percent of GDP) in rate ( per cent)
ShareAt At 2011 CAGR
Overall Services current constant over 2001-GDP GDP Prices Prices 2001 11
2011 2011 2001 2010 2011 2001 2010 2011
1 US 1 1 14991.3 13225.9 77.0 78.3 78.4 1.4 2.9 2.5 5.1 2.1
2 China 2 3 7203.8 4237.0 40.6 41.9 41.7 1.1 10.4 9.9 8.9 11.1
3 Japan 3 2 5870.4 4604.1 70.6 69.9 70.5 -0.1 1.8 1.1 0.6 0.4
4 Germany 4 4 3604.1 3048.7 70.0 70.8 70.0 0.0 2.5 1.0 1.9 1.3
5 France 5 5 2775.5 2240.5 76.8 79.0 79.2 2.4 1.8 1.9 2.1 1.4
6 Brazil 6 8 2476.7 1126.4 65.4 66.2 66.5 1.1 1.8 5.0 3.1 3.8
7 UK 7 6 2429.2 2381.1 74.0 76.4 76.0 2.0 3.8 1.1 1.2 2.3
8 Italy 8 7 2195.9 1773.1 70.9 73.1 73.1 2.2 2.6 1.4 0.7 0.6
9 India 9 10 1897.6 1322.7 50.1 56.8 58.2 8.1 7.5 9.4 7.4 9.2
10 Russia 10 13 1857.8 947.2 56.3 62.4 62.1 5.8 3.3 3.9 3.6 5.5
11 Canada 11 9 1736.9 1233.5 65.0 69.9 69.7 4.7 3.5 2.6 2.2 2.7
12 Australia 12 11 1515.5 894.5 67.9 69.0 69.2 1.3 3.9 2.3 3.6 3.3
13 Spain 13 12 1478.2 1183.8 63.7 69.8 70.0 6.3 3.6 1.2 1.2 2.8
14 Mexico 14 14 1155.2 956.8 61.4 63.8 64.2 2.8 1.2 5.4 5.0 2.9
15 South Korea 15 15 1116.2 1056.1 60.5 57.0 56.6 -3.9 4.4 3.9 2.7 3.5
World 70201.9 52667.7 68.2 67.6 67.5 -0.7 2.8 2.9 3.6 2.6
Source : Computed from UN National Accounts Statistics accessed on 4 January 2013.Note : Rank is based on current prices, shares are based on constant prices(US$), growth rates arebased on constant prices(US$), CAGR is estimated for 2001-11, construction sector is excluded inservices GDP.
http://indiabudget.nic.in

212 Economic Survey 2012-13
in 1950-1 to 56.5 per cent in 2012-13 as per AdvanceEstimates (AE). Including construction, the sharewould increase to 64.8 per cent in 2012-13. With an18.0 per cent share, trade, hotels, and restaurantsas a group is the largest contributor to GDP amongthe various services sub-sectors, followed byfinancing, insurance, real estate, and businessservices with a 16.6 per cent share. Both theseservices showed perceptible improvement in theirshares over the years. Community, social, andpersonal services with a share of 14.0 per cent is inthird place. Construction, a borderline servicesinclusion, is at fourth place with an 8.2 per cent share(Table 10.2).
10.11 The CAGR of the services sector GDP at 10per cent for the period 2004-5 to 2011-12 has beenhigher than the 8.5 per cent CAGR of overall GDPduring the same period. However in 2011-12 and2012-13, there has also been a deceleration in growthrate of services sector at 8.2 per cent and 6.6 percent respectively. Among the major broad categoriesof services, ‘financing, insurance, real estate, andbusiness services’, which continued to grow robustlyboth in 2010-11 and 2011-12 decelerated to 8.6 percent in 2012-13. While in 2011-12 growth in ‘trade,hotels, and restaurants’ and ‘transport, storage, andcommunication’ slowed down to 6.2 per cent and8.4 per cent respectively, in 2012-13 ‘trade, hotels,and restaurants’ and ‘transport, storage, andcommunication’ combined grew by an estimated5.2 per cent.
10.12 Sub-sector wise, among commercialservices, in terms of shares, the major services aretrade, transport by other means (i.e. excluding
in banking remained subdued in the wake of theglobal financial crisis. European banks, which hadbeen at the forefront of international expansionthrough FDI, were largely absent, with a number ofthem remaining under government control. In 2012,United Nations Conference on Trade andDevelopment (UNCTAD) estimates indicate a fall inglobal FDI by 18 per cent to US $ 1.3 trillion, whileforecasting a moderate recovery in 2013-14.
INDIA’S SERVICES SECTOR
10.8 India’s services sector has emerged as aprominent sector in terms of its contribution tonational and states incomes, trade flows, FDI inflows,and employment.
Services GDP10.9 The growth story overall and services of worldand India in the 2000s began from almost the samelevel of around 4-5 per cent in 2000. But over theyears, India’s overall and services growth rates haveoutpaced those of the world. Interestingly, unlikeworld services growth, which has been moving intandem with its overall growth with mild see-sawmovements over the years, India’s services growthhas been consistently above its overall growth inthe last decade except for 2003 (when the formerwas marginally lower than the latter). Thus, for morethan a decade, this sector has been pulling up thegrowth of the Indian economy with a great amountof stability (Figure 10.1).
10.10 The share of services in India’s GDP at factorcost (at current prices) increased from 33.3 per cent
Source : Based on UN National Accounts Statistics accessed on 2 February 2013.
http://indiabudget.nic.in

213Services Sector
Table 10.2 : Share and Growth of India’s Services Sector (at factor cost)(per cent)
2000- 2005- 2006- 2007- 2008- 2009- 2010- 2011- 2012-01 06 07 08 09 10^ 11@ 12* 13**
Trade, hotels, & restaurants 14.6 16.7 17.1 17.1 16.9 16.5 17.2 18.0 25.1#(5.2) (12.2) (11.1) (10.1) (5.7) (7.9) (11.5) (6.2) (5.2)
Trade 13.3 15.1 15.4 15.4 15.3 15.1 15.7 16.6(5.0) (11.6) (10.8) (9.8) (6.7) (8.5) (11.5) (6.5)
Hotels & restaurants 1.3 1.6 1.7 1.7 1.5 1.4 1.5 1.5(7.0) (17.4) (14.4) (13.0) (-3.3) (1.9) (10.8) (2.8)
Transport, storage, & 7.6 8.2 8.2 8.0 7.8 7.7 7.3 7.1communication (9.2) (11.8) (12.6) (12.5) (10.8) (14.8) (13.8) (8.4)
Railways 1.1 0.9 0.9 1.0 0.9 0.9 0.8 0.7(4.1) (7.5) (11.1) (9.8) (7.7) (8.8) (5.9) (7.5)
Transport by other means 5.0 5.7 5.7 5.6 5.5 5.3 5.3 5.4(7.7) (9.3) (9.0) (8.7) (5.3) (7.3) (8.2) (8.6)
Storage 0.1 0.1 0.1 0.1 0.1 0.1 0.1 0.1(6.1) (4.7) (10.9) (3.4) (14.1) (19.3) (2.2) (9.4)
Communication 1.5 1.6 1.5 1.4 1.4 1.4 1.1 0.9(25.0) (23.5) (24.3) (24.1) (25.1) (31.5) (25.4) (8.3)
Financing, insurance, real estate, 13.8 14.5 14.8 15.1 15.9 15.8 16.0 16.6 17.2& business services (4.5) (12.6) (14.0) (12.0) (12.0) (9.7) (10.1) (11.7) (8.6)
Banking & insurance 5.4 5.4 5.5 5.5 5.6 5.4 5.6 5.7(-2.4) (15.8) (20.6) (16.7) (14.0) (11.4) (14.9) (13.2)
Real estate, ownership of , 8.7 9.1 9.3 9.6 10.3 10.4 10.4 10.8dwellings & business services (7.5) (10.6) (9.5) (8.4) (10.4) (8.3) (6.0) (10.3)
Community, social, & personal 14.8 13.5 12.8 12.5 13.3 14.5 14.0 14.0 14.3services (4.6) (7.1) (2.8) (6.9) (12.5) (11.7) (4.3) (6.0) (6.8)
Public administration & defence 6.6 5.6 5.2 5.1 5.8 6.6 6.1 6.1(1.9) (4.3) (1.9) (7.6) (19.8) (17.6) (0.0) (5.4)
Other services 8.2 7.9 7.6 7.4 7.5 7.8 7.9 7.9(7.0) (9.1) (3.5) (6.3) (7.4) (7.2) (8.0) (6.5)
Construction 6.0 7.9 8.2 8.5 8.5 8.2 8.2 8.2 8.2(6.1) (12.8) (10.3) (10.8) (5.3) (6.7) (10.2) (5.6) (5.9)
Total Services 50.8 53.1 52.9 52.7 53.9 54.5 54.4 55.7 56.5(5.4) (10.9) (10.1) (10.3) (10.0) (10.5) (9.8) (8.2) (6.6)
Total Services (incl. Construction) 56.8 61.0 61.0 61.2 62.4 62.7 62.6 63.9 64.8(5.5) (11.1) (10.1) (10.3) (9.4) (10.0) (9.8) (7.9) (6.5)
Total GDP 100.0 100.0 100.0 100.0 100.0 100.0 100.0 100.0 100.0 (4.3) (9.5) (9.6) (9.3) (6.7) (8.6) (9.3) (6.2) (5.0)Source : Central Statistics Office (CSO).Notes :Shares are in current prices and growth in constant prices;
Figures in parenthesis indicate growth rate;* first revised estimates, @ second revised estimates, ^ third revised estimates,** Advance Estimate (AE);# includes the shares and growth of both trade, hotels, & restaurants and transport, storage,
& communication only for 2012-13.
http://indiabudget.nic.in

214 Economic Survey 2012-13
railways), banking, and insurance, and real estateownership of dwellings, and business services,besides construction. In 2011-12, though the growthof ‘trade’ decelerated to 6.5 per cent, its shareimproved to 16.6 per cent. The share of ‘transport byother means’ at 5.4 per cent was almost at earlierlevels, while its growth was at 8.6 per cent. Bankingand insurance with marginal improvement in its shareto 5.7 per cent was the most dynamic sector in2011-12 with a growth of 13.2 per cent on the top ofhigh growths in the preceding years. ‘Real estate,ownership of dwellings, and business services’ witha share of 10.8 per cent, which is marginally higherthan that of the previous year, also had robust growthof 10.3 per cent. ‘Other services’ with a share of7.9 per cent both in 2010-11 and 2011-12 grew at aslower pace of 6.5 per cent in 2011-12. Among ‘otherservices’, the two major items are communityservices, of which education, medical, and health,are the major items; and personal services.Interestingly some items among community serviceslike coaching centres and membership organizationshave high growth rates with small shares which arerising. Construction, the borderline services sector,has been the most vulnerable to global events. Witha share of 8.2 per cent as in the previous two years,it has been growing unevenly since the global crisis.
State-wise Comparison of Services10.13 A comparison of the share of services in thegross state domestic product (GSDP) of differentstates and union territories (UTs) in 2011-12 shows
that the services sector is the dominant sector inmost states of India (Figure 10.2). States and UTssuch as Chandigarh, Delhi, Kerala, Mizoram, WestBengal, Tamil Nadu, Maharashtra, Nagaland, andKarnataka have higher than all-India shares.Chandigarh tops the list with a share of 85 per centfollowed by Delhi with 81.8 per cent. Other thanArunachal Pradesh (33.8 per cent), Chhattisgarh(36.7 per cent), and Sikkim (37.0 per cent), the shareof services in the GSDP in all other states is morethan 40 per cent. In 2011-12, in tune with the generalmoderation in overall services growth, services growthrates in many states also moderated. But somestates continued to register high growth rates withthe highest being in Himachal Pradesh at 17.3 percent followed by Bihar at 16.6 per cent. Among UTswith high services share in GSDP, Delhi with11.5per cent growth tops the list. While the servicesrevolution in India is becoming more broad-based,with even the hitherto backward states piggy-backingon the good performance of this sector, the initialmomentum seems to have slowed down for somenorth-eastern states like Arunachal Pradesh,Mizoram, and Nagaland after the advantage of baseeffect is over.
FDI in the Services Sector10.14 The growth of the services sector is closelylinked to the FDI inflows into this sector and the roleof transnational firms. While the ambiguity inclassifying the different activities under the servicessector continues, the combined FDI share of financial
Source : Computed from CSO data. Notes : Data in the case of Gujarat and Mizoram are from 2010-11.
Shares at current prices, growth rate at constant (2004-5) prices.
http://indiabudget.nic.in

215Services Sector
and non-financial services, constructiondevelopment, telecommunications, computerhardware and software, and hotel and tourism canbe taken as a rough estimate of the FDI share ofservices, though it could include some non-serviceelements. This share is 47 per cent of the cumulativeFDI equity inflows during the period April 2000-November 2012. The five service sectors are alsothe sectors attracting the highest cumulative FDIinflows to the economy with financial and non-financial services topping the list at US$ 36.04 billionduring the period April 2000-November 2012. This isfollowed by other service sectors—constructiondevelopment (US$21.77 billion), telecommunication(US $12.62 billion), and computer software andhardware (US $ 11.54 billion). If the shares of someother services or service-related sectors like trading(1.96 per cent), information and broadcasting (1.65per cent), consultancy services (1.11 per cent),construction (infrastructure) activities (1.06), ports(0.88 per cent), agriculture services (0.80 per cent),hospital and diagnostic centres (0.82 per cent),education (0.36 per cent), air transport including airfreight (0.24 per cent), and retail trading (0.02 percent) are included then the total share of cumulativeFDI inflows to the services sector would be 56.08per cent.
10.15 In 2011-12, FDI inflows to the services sector(top five sectors including construction) grew robustlyat 57.62 per cent to US $ 12.14 billion compared tothe growth of overall FDI inflows at 33.6 per cent.However, in 2012-13 (April-November), overall FDIinflows fell by 43.3 per cent to US$ 15.85 billionfrom US$ 27.93 billion in the corresponding period
of the previous year. Following this trend, FDI inflowsin the top five services also fell by 9.7 per cent to US$ 8.19 billion. Among them, while FDI inflows to thetop four services sectors fell in the range of 14 to 97per cent, FDI inflows to the hotel and tourism sectorincreased by a very high 328 per cent over thecorresponding period in the previous year.
10.16 The government has taken many policyinitiatives to liberalize the FDI policy for the servicessector. These include liberalizing the policy on foreigninvestment for companies operating in thebroadcasting sector, like increasing the foreigninvestment limit from 49 per cent to 74 per cent inteleports (setting up up-linking HUBs/teleports) anddirect to home (DTH) and cable networks, andpermitting foreign investment (FI) up to 74 per centin mobile TV; permitting foreign airlines to makeforeign investment, up to 49 per cent in scheduledand non-scheduled air transport services; permittingFDI, up to 51 per cent, in multibrand retail trading,(also see Box 10. 2); and amendment of the existingpolicy on FDI in single-brand product retail trading.
India’s Services Trade10.17 India’s share of services exports in the worldexports of services, which increased from 0.6 percent in 1990 to 1.0 in 2000 and further to 3.3 percent in 2011, has been increasing faster than theshare of merchandise exports in world exports. Thegrowth rates of exports of services of India and theworld show two distinct phases, the first till 1996when the two growths had a scissor-like movementand the second phase after 1996 when the growth ofIndia’s services exports was higher than that of the
Source : Computed from WTO data.
http://indiabudget.nic.in

216 Economic Survey 2012-13
world in almost all the years except 2009. In thissecond phase, the former was much above the latterin upswings but almost converged with the latterduring downswings. (Figure 10.3) (also see Chapter7: ‘International Trade’).
10.18 The overall openness of the economyreflected by total trade including services as apercentage of GDP shows a higher degree ofopenness at 55.0 per cent in 2011-12 compared to38.1 per cent in 2004-5. The openness indicatorbased only on merchandise trade is at 43.2 percent in 2011-12 compared to 28.3 per cent in2004-5.
Services employment in India10.19 The pattern of sectoral share of employmenthas changed over the last two decades with theshare of agriculture falling from 64.75 per cent in1993-4 to 53.2 per cent in 2009-10 and of industries(excluding construction) falling from 12.43 per centto 11.9 per cent. The shares of the services andconstruction sectors in employment, on the otherhand, increased in the same period from 19.70 percent to 25.30 per cent and 3.12 per cent to 9.60 percent respectively. As per the National SampleSurvey Office’s (NSSO) report on Employment andUnemployment Situation in India 2009-10, on thebasis of usually working persons in the principaland subsidiary statuses, for every 1000 peopleemployed in rural India, 679 people are employedin the agriculture sector, 241 in the services sector(including construction), and 80 in the industrialsector. In urban India, 75 people are employed inthe agriculture sector, 683 in the services sector
(including construction) and 242 in the industrialsector. Construction; trade, hotels, and restaurants;and public administration, education, and communityservices are the three major employment-providingservices sectors.
10.20 Studies show that the tertiary employmentshare has strong upward slopes in all the incomequintiles both in rural and urban areas with higherincome quintiles having higher shares in eachsuccessive NSSO round (Figure 10.4). Thus tertiaryemployment growth is steadily moving from being anabsorber of low income labour to provider of highincome jobs.
PERFORMANCE OF SOME MAJORSERVICES10.21 The performance of the different servicesbased on the different indicators shows that sectorslike telecom, tourism, and railways have done well in2011-12 (Table 10.3). Shipping and ports show poorperformance reflecting the effects of the globalslowdown. The performance and outlook for thedifferent services sectors based on limited firm-leveldata, based on estimates and forecasts, show amixed picture for this year, though there are somegrounds for optimism in the coming year (Box 10.1).
10.22 The important commercial services for Indiabased on their significance in terms of GDP,employment, exports, and future prospects, havebeen dealt with in detail in this section. Care hasbeen taken to avoid duplication to the extent possibleof services covered in other chapters likeInfrastructure, Financial Intermediation, and Social
Source : D. Mazumdar, S. Sarkar and B.S. Mehta, ‘Inequality in India’, part of IHD Research Programme on Globalisation andLabour funded by ICSSR. (forthcoming).Note : APCE : Average per capita expenditure; UPS : Usual principal status.
http://indiabudget.nic.in

217Services Sector
Box 10.1 : Performance of Services Firms : A Sectoral AnalysisThe Centre for Monitoring Indian Economy’s (CMIE) analysis of the sector-wise performance of services activities basedon firm-level data show that the performance of sectors such as transport logistics, aviation and construction in the year2012-13 is subdued in comparison to with the previous year. High negative PAT in hotel sector continued. The healthservices and telecom sectors are projected to have rebounded in the year 2012-13. Overall the year 2013-14 is projectedto be better for most of the sectors, except retail trading, which is projected to have negative growth in profitability. Thisnegative growth is contributed by two factors—one is the base effect with high profit after tax (PAT) growth in the year2012-13; and the other is an expected shrinking of margins in 2013-14 due to increase in operating costs and price cutsdriven by high competition (Table 1).
Table 1: Performance of Select Services Firms
Annual Growth ( per cent change over previous year)
Sector Sales PAT Expenditure
2011-12 2012-13* 2013-14* 2011-12 2012-13* 2013-14* 2011-12 2012-13* 2013-14*
Transport logistics 11.0 1.8 11.9 5.8 -2.5 16.3 13.4 3.1 10.8
Shipping 9.3 12.9 4.2 -78.5 63.7 84.0 23.0 9.5 0.0
Aviation 10.6 -0.2 8.0 - - - 21.0 -4.2 7.5
Retail trading -10.3 10.6 12.3 24.9 169.6 -59.4 -2.5 7.8 12.3
Health services 16.6 21.1 19.5 -22.0 52.4 24.7 18.8 20.0 17.8
Hotel 9.2 9.5 11.0 -77.5 -76.2 -11.7 16.4 12.9 10.9
Telecom 8.9 9.5 11.8 -71.0 39.9 56.2 13.0 12.6 11.4
Software 21.3 19.3 10.7 16.2 19.6 5.2 26.0 18.5 11.8
Construction 18.6 12.1 17.2 -2.6 0.4 19.3 21.6 13.6 16.4
Source: CMIE Industry Analysis (Compiled by Exim Bank of India).
Note: * Forecast.
Table 10.3 : Performance of India’s Services Sector: Some IndicatorsSector Indicators Unit Period
2008-09 2009-10 2010-11 2011-12 2012-13
Aviation Airline passengers (domestic and international) Million 49.5 (a) 54.5 (a) 64.5 (a) 70.2(a) 67.5(a)
Telecom Telecom connections (wireline and wireless) Lakh 4297.25 6212.8 8463.2 9513.4 8955.1(b)
Tourism Foreign tourist arrivals Million 5.28 (a) 5.17 (a) 5.78 (a) 6.31 (a) 6.65 (a)Foreign exchange earnings from tourist arrivals US $ million 11832 (a) 11136(a) 14193 (a) 16564(a) 17737(a)
Shipping Gross tonnage of Indian shipping Million GT 9.28 9.69 10.45 11.06(c) 10.45(d)No. of ships Numbers 925 1003 1071 1122 (c) 1158(d)
Ports Port traffic Million tonnes 744.02 850.03 885.45 911.68 455.77(e)
Railways Freight traffic by railways Million tonnes 833.31 887.99 832.75 969.78 735.32(c)Net tonne kilometers of railways Million 538226 584760 444515 639768 470956(c)
Storage Storage capacity Lakh MT 105.25 105.98 102.47 100.85 101.60No. of warehouses Numbers 499 487 479 468 469
Sources : Directorate General of Civil Aviation, Telecom Regulatory Authority of India, Ministry of Tourism,Ministry of Shipping, Ministry of Railways and Central Warehousing Corporation (Compiled by EXIM Bankof India).Notes : (a) calendar years, for example 2007-8 for 2007. (b) As on 31st December, 2012, (c) April-December, (d) As on 31 January 2013, (e) April-September. GT is gross tonnage; MT is metric tonnes.
Sectors. The important services for India includetrade, tourism, shipping and port services, real estateservices, business services including IT and IT
enabled services (ITeS), research and development(R&D) services, legal services, and accounting andaudit services.
http://indiabudget.nic.in

218 Economic Survey 2012-13
Trade10.23 Trade with a share of above 15 per cent inIndia’s GDP in the last seven years (16.6 per cent in2011-12) and a CAGR of 9.3 per cent during 2004-5to 2011-12, has grown to ̀ 8,10,585 crore in 2011-12. As per the A.T. Kearney, Global RetailDevelopment Index 2012 report, India ranked at 5thplace remains a high-potential market withaccelerated retail market growth of 15 to 20 per centexpected over the next five years. While the overallretail market contributes 14 per cent of India’s GDP,organized retail penetration remains low, indicatingroom for growth. Brazil tops the ranks with retailsales accounting for 70 per cent of Brazil’s consumerspending, followed by Chile, China, and Uruguay. InIndia, the food and beverages segment is seeingincreased activity from foreign players, and groceryremains India’s largest source of retail sales.Hypermarkets and supermarkets continue todominate the organised retail market, but cash-and-
carry is growing fast, with significant expansionplanned from Bharti Wal-Mart, Metro Group, andCarrefour. Apparel is expected to grow by 9 to 10per cent annually for the next five years. Playerssuch as Zara, Marks & Spencers, and Mango areactively scouting locations to open more storesacross the country. The luxury retail sector saw 20per cent growth last year, with luxury malls becomingentrenched in Delhi, Mumbai, and Bangalore.
10.24 Since 2006, India allowed FDI in single-brandretail to the extent of 51 per cent. In January 2012,the government removed restrictions on FDI in thesingle-brand retail sector, allowing 100 per cent FDIand from September 2012. FDI in multibrand retailhas been allowed up to 51 per cent under thegovernment route and subject to specified conditions(Box 10.2). While agricultural products could getvastly improved access to markets with the growthof modern retail trade, the revenue to the governmentcould also increase, as at present the retail sectoris largely unorganized and has low tax compliance.
Box 10.2 : FDI in Multibrand Retail TradingFDI in multibrand retail trading has been permitted subject to specified conditions like the following:
• Fresh agricultural produce, including fruits, vegetables, flowers, grains, pulses, fresh poultry, fishery, and meatproducts, may be unbranded; ·
• Minimum amount to be brought in as FDI by the foreign investor, would be US $ 100 million;• At least 50 per cent of total FDI brought in shall be invested in ‘backend infrastructure’ within three years of the first
tranche of FDI;• At least 30 per cent of the value of procurement of manufactured/ processed products purchased shall be sourced
from Indian ‘small industries’ which have a total investment in plant and machinery not exceeding US $ 1million;• Retail sales outlets may be set up only in cities with a population of more than 10 lakh as per Census 2011and may also
cover an area of 10 km around the municipal/urban agglomeration limits of such cities;• Government will have the first right to procurement of agricultural products.
State governments/UTs would be free to take their own decisions in regard to implementation of the policy as retail trade isa state subject. Eleven states/UTs, viz. Andhra Pradesh, Assam, Delhi, Haryana, Jammu and Kashmir, Maharashtra,Manipur, Rajasthan, Uttarakhand, Daman and Diu, and Dadra and Nagar Haveli have agreed to permit establishment ofretail outlets under this policy. Constitution of a high-level group under the Minister of Consumer Affairs has also beenannounced to look into various aspects relating to internal trade and to make recommendations on internal trade reforms tothe government, whenever required. FDI in multibrand retail trade would benefit stakeholders across the entire span of thesupply chain. Farmers stand to benefit from the significant reduction in post-harvest losses expected to result from thestrengthening of the backend infrastructure, which would enable the farmers to obtain a remunerative price for their produce.Small manufacturers will benefit from the conditionality requiring at least 30 per cent procurement from Indian smallindustries, as this would enable them to get integrated with global retail chains. This in turn will enhance their capacity toexport products from India. As far as small retailers are concerned, organized retail already coexists with small traders andthe unorganized retail sector. Studies indicate that there has been a strong competitive response from the traditional retailersto these organized retailers, through improved business practices and technological upgradation. Global experience alsoindicates that organized and unorganized retail coexist and grow. Consumers stand to gain the most, first, from the loweringof prices that would result from supply-chain efficiencies and secondly, through improvement in product quality due to thecombined effect of technological upgradation, efficient grading, sorting and packaging, testing and quality control, andproduct standardization. Implementation of the policy is also likely to lead to greater FDI inflows, quality employment, andadoption of global best practices.Source: Based on Inputs from the Department of Industrial Policy and Promotion (DIPP)
http://indiabudget.nic.in

219Services Sector
Tourism, including hotels and restaurants10.25 Tourism accounts for around 6-7 per cent ofglobal employment (direct and indirect) and 5 percent of global income as per the United NationsWorld Tourism Organization (UNWTO), TourismHighlights 2012 edition. It is one of the largestgenerators of employment across the world andwomen account for 70 per cent of the workforce inthe travel and tourism industry. Hence it generatesmore inclusive growth than other sectors. Accordingto the UNWTO, international tourist arrivalssurpassed the 1 billion mark for the first time in historyin 2012, reaching a figure of 1.04 billion from 996million in 2011 with 4 per cent growth despite thevolatility around the globe, particularly in Europewhich accounts for over half of international touristarrivals worldwide. Emerging economies, with 4.1per cent growth regained the lead over advancedeconomies with 3.6 per cent growth, with Asia andPacific showing the strongest growth at 7 per cent.In 2013 growth is expected to decelerate slightlyand fall in the range of 3-4 per cent with prospectsstronger for Asia and Pacific (5-6 per cent). In 2011international tourism receipts grew by 11 per cent(3.9 per cent in real terms) to an estimated US$1030 billion, setting new records in most destinationsdespite economic challenges in many sourcemarkets. Available data on international tourismreceipts and expenditure for 2012 covering at leastthe first nine months of the year confirm the positivetrend in arrivals. In a significant number of destinationsincluding India (22 per cent) receipts from internationaltourism increased by 15 per cent or more. Accordingto the UNWTO, the number of international touristarrivals worldwide is expected to increase by 3.3per cent a year on an average from 2010 to 2030,resulting in around 43 million more arrivals every year,to reach a total of 1.8 billion arrivals by 2030. As inthe past, emerging economy destinations are set togrow faster than advanced economy destinations.As a result, the market share of emerging economieswhich has increased from 30 per cent in 1980 to 47per cent in 2011 is expected to reach 57 per cent by2030, equivalent to over one billion international touristarrivals.
10.26 As per Tourism Satellite Account (TSA) data2009-10, the contribution of tourism to India’s GDPwas 6.8 per cent (3.7 per cent direct and 3.1 percent indirect) and its contribution to total employmentgeneration was 10.2 per cent (direct 4.4 per cent
and indirect 5.8 per cent). As per the Twelfth FiveYear Plan approach paper, India’s travel and tourismsector is estimated to create 78 jobs per millionrupees of investment compared to 45 jobs per millionrupees in the manufacturing sector. Foreign touristarrivals (FTAs) in India grew by 9.2 per cent in 2011.However, due to the Euro-zone crisis and globalslowdown, FTA growth moderated to 5.4 per cent toreach 66.48 lakh arrivals in 2012. As a result, foreignexchange earnings (FEEs) growth in dollar termsthat was 16.7 per cent in 2011 moderated to 7.1 percent to reach US $ 17.74 billion in 2012. The shareof India in international tourist arrivals was just 0.64per cent (rank 38) in 2011. India’s share in theinternational tourism receipts was relatively higherat 1.61 per cent in 2011 (rank 17), though it is verylow compared to countries like the US (11.3 per cent)and even China (4.7 per cent).
10.27 Domestic tourism is also an importantcontributor to the growth of this sector with a 14.34per cent CAGR of domestic tourist visits from 1991to 2011. During 2011, there were 851 million domestictourists, with the top five states, Uttar Pradesh,Andhra Pradesh, Tamil Nadu, Karnataka, andMaharashtra, cumulatively accounting for around 69per cent of the total domestic tourist visits in thecountry. The hotels and restaurants sector with a1.5 per cent share in India’s GDP in 2011-12 is alsoan important sub-component of the tourism sector.There are also many new tourism products that holdsignificant potential for India like wellness tourism,golf tourism and adventure tourism.
10.28 To promote tourism, the government hastaken many policy initiatives including a five-yeartax holiday for 2, 3, and 4 star category hotels locatedaround all United Nations Educational, Scientific,and Cultural Organization (UNESCO) World Heritagesites (except Delhi and Mumbai) for hotels whichstart operating w.e.f. 1 April 2008 to 31March 2013;an investment-linked deduction under Section 35 ADof the Income Tax Act extended to new hotels of 2star category and above anywhere in India, allowing100 per cent deduction in respect of the whole orany expenditure of capital nature excluding land,goodwill, and financial instruments incurred duringthe year; and inclusion of 3 star or higher categoryclassified hotels located outside cities withpopulation of more than 10 lakh in the harmonizedlist of the infrastructure subsector. The Governmentof India has also taken the initiative of identifying,
http://indiabudget.nic.in

220 Economic Survey 2012-13
diversifying, developing, and promoting the nascent/upcoming niche products of the tourism industry toovercome the ‘seasonality’ aspect and promote Indiaas a 365 days destination, attract tourists withspecific interests, and ensure repeat visits forproducts in which India has comparative advantage.A committee has been constituted for promotion ofgolf tourism and wellness tourism and specificguidelines have been formulated to support golf, polo,and wellness tourism. The government has alsoformulated a set of guidelines on safety and qualitynorms for adventure tourism. A scheme of Approvalof Adventure Tour Operators which is a voluntaryscheme open to all bonafide adventure-tour operatorshas been announced. To attract foreign touristscoming to India for medical treatment, a new ‘medicalvisa’ category has been introduced. The governmenthas also formulated guidelines to address variousissues governing wellness centres, covering theentire spectrum of the Indian systems of medicine.
10.29 The Economic Surveys 2010-11 and 2011-12 have highlighted various challenges that need tobe addressed to develop this sector. Some of thechallenges still remain as hindrances to the growthof this sector. One of them is the multiple taxes onhospitality- and tourism-related activities which makethe tourism product expensive in the form of highhotel rates and high fares; another is the luxury taxwhich is imposed by state governments leading tohigh tariffs and low occupancy in hotels. Luxury taxon hotels in some states is very high and variesfrom 5 per cent to 12.5 per cent and in some casesit is applicable on printed room rates whereas theactual hotel rates offered to guests are much lower.Tourism infrastructure is another area which needsimmediate attention where there is plenty of scopefor public private partnerships (PPP). User fees couldbe levied if monuments or tourist sites are developedby the private sector or through PPP. Thus significantopportunities still remain relatively untapped and forfaster, sustainable, and more inclusive growth, asenvisaged in the Twelfth Five Year Plan, the tourismsector holds a lot of promise.
Some Transport-related ServicesShipping
10.30 Shipping plays an important role inmerchandise trade. The fortunes of the former dependon the growth of the latter and the prospects of thelatter depend on the efficiency of the former. About
95 per cent of India’s trade by volume and 68 percent in terms of value is transported by sea. As on31 January 2013, India had a fleet strength of 1158ships with GT of 10.45 million, with the public-sectorShipping Corporation of India having the largest shareof 32.60 per cent. Of this, 356 ships with 9.37 millionGT cater to India’s overseas trade and the rest tocoastal trade. The gross foreign exchange earnings/savings of Indian ships in 2011-12 were ̀ 10,666.45crore. Despite one the largest merchant shippingfleets among developing countries, India ranks 18th
among the 35 flags of registration with the largestregistered dead weight tonnage (DWT) with a shareof only 1.05 per cent in total world DWT as on 1January 2012. Leaving aside flags of convenience,Hong Kong has the highest DWT, with a share of7.6 per cent, while China’s share is 3.79 per cent.In 2011 as per UNCTAD, India was ranked 8th amongdeveloping countries in terms of container shipoperations with 9.95 million twenty foot equivalentunits of container (TEUs), with a world share of 1.74per cent. India is one of the major ship-breakingdestinations. In 2011, with a world share of 28.7 percent (in terms of DWT), it topped the list of ship-scrapping nations, scrapping 203 ships of 13.87million DWT as per ISL Shipping Statistics andMarket Review September/October 2012. India isalso one of the major countries supplying seafarers.
10.31 As a result of the global slowdown, theturbulence experienced by the global shippingindustry continued in 2012. The Baltic Dry Index,the barometer of merchandise trade as well asshipping services, has been in the red since the globalcrisis of 2008, though there were small upswings atthe lower end of the index (Also see Chapter 7:‘International Trade’). Like shipping companiesworldwide, Indian shipping companies also facedproblems of restricted cash inflows due to very lowcharter hire and freight rates in all segments ofshipping. Going by the rough assimilation of variousVery Large Crude Carrier (VLCC) fixtures, the averagerate tumbled from US$ 13,605 a day in the firstquarter of FY 2012-13 to US$ 835, US$ 776, andUS$ 1296 in the next three months.
10.32 There has been a sharp decline in the shareof Indian ships in the carriage of India’s overseastrade from about 40 per cent in the late 1980s to10.4 per cent in 2011-12 with 17.05 per cent sharein India’s oil imports. Given the relatively lowparticipation of Indian ships in India’s trade and given
http://indiabudget.nic.in

221Services Sector
the fact that Indian ships are ageing, with the averageage of the Indian fleet increasing from 15 years in1999 to 16.83 years as on 31 December 2012 (with41.59 per cent of the fleet over 20 years and 11 percent in the age group 16-20 years), there is urgentneed to increase the shipping fleet so that it isadequate atleast to meet India’s trade volumes. Thisis also an opportune time to increase our depletingshipping fleet to reasonable size as ship prices whichhad peaked in the middle of 2007-8 have dropped tohistorical lows in the subsequent years and the trendis continuing even now as on December 2012. Alarge and modernized shipping fleet will not only leadto higher growth, employment and higher earning/saving of foreign exchange, but also increase ourbargaining power with foreign liners who carry Indiancargo as per their schedule and also discriminate inthe rates.
Port Services
10.33 Port services are closely connected toshipping services and merchandise trade. Theperformance of the latter two is also dependent onthe efficiency of ports. The total capacity of Indianports has reached approximately 1245.3 milliontonnes as on 31st March 2012. During 2011-12, totaltraffic handled at all ports at 911.7 million tonnes,grew by 3 per cent over the previous year. Thoughthere was a decline in traffic at major ports, whichaccounted for more than 60 per cent of total traffic,the 11.5 per cent growth achieved by non-major portscontributed to the overall traffic growth handled byall ports. In the first half of 2012-13 (April-September),
traffic handled by Indian ports grew by 1.8 per centover the corresponding period of the previous year,with the growth of non-major ports (10.3 per cent)compensating for the decline in growth of major ports.
10.34 As per the World Shipping Council, Shanghaiport ranked at the top in terms of total cargo volumehandled with 31.74 million TEUs in 2011. Singaporewith 29.94 million TEUs was in second position. TheJawaharlal Nehru Port Trust (JNPT) is ranked 30th interms of total cargo volume handled with 4.53 millionTEUs in 2011. The three port-related performanceindicators show improvement in both 2011-12 andApril-September 2012 over corresponding previousperiod. The average output per ship-berth-dayimproved to 13,374 tonnes for all major ports during2012-13 (April-September) compared to 12,825tonnes in corresponding period of 2011-12.Theaverage turnaround time at major Indian portsimproved to 4.15 days in 2012-13 (April-September)compared to 5.29 and 5.05 in 2010-11 and 2011-12respectively and ranged between 1.54 days at CochinPort to 6.27 days at Kandla Port. The average pre-berthing detention time (PBDT) for all major portsdeclined from 2.32 days in 2010-11 to 2.04 in 2011-12. While at first sight this indicates greater efficiencyof ports, it could also be due to the lower volumeshandled by ports with the global downturn. Even theaverage turnaround time has been higher in 2011-12compared to 2008-09. Thus except for average outputper ship berth day, the other two indicators have notshown much improvement over the years. Thusefficiency of our ports needs to be improved further(Table 10.4).
Table 10.4 : Some Performance Indicators of Ports in India
April to Change Change inSeptember in 2012-13
2011-12 2011-12 (Apr.-Sept.)Indicators over over
1990- 2000- 2008- 2009- 2010- 2011- 2011- 2012- 2008-09 previous91 01 09 10 11 12P 12 13 Year
Average turnaround 8.10 4.24 4.20 4.63 5.29 5.05 4.80 4.15 0.85 -0.65
Time (days)
Average pre- berthing 2.16 1.19 1.63 2.16 2.32 2.04 - - 0.41 -
detention time (days)
Average output per ship- 3372 6961 9669 9215 9140 13073 12825 13374 3404 549berth-day (in tonnes)
Source : Transport Research Wing, Ministry of Shipping based on data of Major Ports/Indian PortAssociation(IPA).P stands for provisional
http://indiabudget.nic.in

222 Economic Survey 2012-13
10.35 The government has been following thestrategy of increasing investment in infrastructurethrough a combination of public investment and PPP.The Twelfth Five Year Plan with an outlay of` 3,057.47crore (gross budgetary support) for theport sector envisages an increase in capacity of majorports to 1229.29 million tonnes by the end of 2016-17 from the pre-Plan base level of 696.5 milliontonnes with 12 per cent average annual growth incapacity addition. While efforts are being made toimprove port infrastructure, there is need to upgradethe facilities at existing ports with regard to cargohandling, stevedoring, pilotage services, bunkerservices, and warehousing facilities; increase thedrafts to facilitate trans-shipment of Indian cargowhich otherwise takes place outside the country;and rationalize the different port charges to makethem comparable with best practice levels. TheMaritime Agenda 2010-20 covers some of theseissues like full mechanization of cargo handling andmovements, having draft of not less than 14 m inmajor ports and 17 m in hub ports, and shifting oftrans-shipment of Indian containers from foreign portsto Indian ports.
Real Estate Services and Housing10.36 Real estate and dwellings has a share of5.9 per cent in India’s GDP and a growth of 7.2 percent in 2011-12. The growth of the real estateservices in particular has been impressiveconsistently at over 25 per cent since 2005-6 with26.3 per cent growth in 2011-12. Housing is a basicnecessity for human life and is the second largestgenerator of employment, next only to agriculture.Housing activities have both forward and backwardlinkages in nearly 300 sub-sectors such asmanufacturing (steel, cement, and builders’hardware), transport, electricity, gas and watersupply, trade, financial services, and constructionwhich contribute to capital formation, incomeopportunities, and generation of employment.
10.37 In 2012-13 property prices have moderated.As per the National Housing Bank (NHB) RESIDEXindex for the quarter July-September 2012 comparedto April-June 2012 (covering 20 cities, with 2007 asbase year), there is a general decline in prices ofresidential properties in some smaller towns, whilethe increase in other cities is mostly marginal. Inview of increased urbanization, the housingrequirements in urban areas have been witnessingincreases over the years. The Eleventh Five Year
Plan (2007-12) estimated housing requirement of24.7 million units in urban areas of which 99 percent was in the economically weaker sections/lowerincome groups (EWS/LIG) segment. As per theestimation of the Task Force on HousingRequirements in Urban Areas during the Twelfth FiveYear Plan Period (2012-17), the housing requirementin urban areas is 18.7 million units of which 18.5million are for the EWS/LIG segment. As per aMcKinsey Report, the demand for affordable housingwill be 38 million by 2030.
10.38 To support the growth of the housing andreal estate sector, many institutions have been setup especially for financing. While these institutionslargely cater to the formal sector, access to financeby the informal market segment largely remainsuntapped. As this untapped market segment issignificant and growing, the Government of India hasannounced various measures like the InterestSubsidy Scheme for Housing for the Urban Poor andsetting up of the Credit Risk Guarantee Fund Trustfor Low Income Housing. With support from lendinginstitutions, housing credit has grown substantiallyover the years, resulting in increased marketpenetration. The housing loan portfolio of scheduledcommercial banks and housing finance companies– the major institutional players – stood at ` 6.10lakh crore as in end-March 2012. However, due tolimited housing finance solutions, the gap betweenhousing demand and supply is widening. Besidesthe mortgage market in India is also underdeveloped.Though mortgages as a percentage of GDP haverisen from 3.4 per cent in 2001 to 9 per cent in 2011-12, the share is relatively lower than in many othercountries – such as China (12 per cent), Thailand(17 per cent), Malaysia (29 per cent), Hong Kong(40 per cent), and the USA (65 per cent).
10.39 While advanced countries like the US wererattled by the sub-prime crisis, Indian banks havedemonstrated a great amount of maturity in theirlending for the housing sector. The government hasalso taken many policy measures for this sector. InUnion Budget 2012-13, a number of incentives weregiven for promoting affordable housing like allowingexternal commercial borrowings (ECB) for low costaffordable housing projects, increase in investment-linked deduction of capital expenditure incurred inthe affordable housing projects, exemption fromservice tax payments for construction servicesrelated to residential dwellings, and low cost mass
http://indiabudget.nic.in

223Services Sector
housing up to an area of 60 sq. m under the Schemeof Affordable Housing in Partnership. A Credit RiskGuarantee Fund Trust has been established since 1May 2012, which will be managed by the NHB, andprovide default guarantee for housing loans up to ̀ 5lakh sanctioned and disbursed by the lendinginstitutions without any collateral security or third-party guarantees and for new borrowers in the EWS/LIG category in urban areas. The NHB has alsofloated a joint-venture mortgage guarantee company– the India Mortgage Guarantee Corporation Pvt.Ltd—which will offer mortgage guarantees againstborrower defaults on housing loans from mortgagelenders which will help expand access to housing inIndia. Renting of residential units has been includedin the negative list of services that are exempt frompayment of service tax. In order to develop strategicpolicy intervention to promote rental housing as aviable alternative for addressing the housing shortage,the Government of India has also set up a task forcefor rental housing. The Rajiv Awas Yojana (RAY),also provides support to states for creation ofaffordable housing stock and assigning property rightsto slum dwellers.
10.40 India’s housing and real estate sector facesmany challenges. While India is among the topcountries in terms of housing and workspace needs,it ranks 182nd in construction permission processesaccording to the World Bank’s Doing Business 2013report. There are 34 procedures and the average timetaken is 196 days, which increases the sale valueby 40 per cent. Rapid increase in land prices,absence of a long-term funding and lending marketat fixed rates, limited developer finance, the UrbanLand Ceiling Regulations Act (ULCRA) continuing insome states, existing lower floor area ratio in cities,high stamp duties and difficulties in land acquisitionare some other issues which need to be addressed.
‘Affordable Housing for All’ is another challenge asthe demand for housing by the EWS/LIG segmenthas increased.
Some Business Services10.41 Business services include services likecomputer-related services, R&D, accounting servicesand legal services, and renting of machinery in orderof importance (shares) as per India’s NationalAccounts. The share of business services in India’sGDP, has risen over the years, and these are alsothe dynamic services with a combined growth rateof 13.5 per cent in 2011-12. They grew at around 20per cent during 2005-6, 2006-7 and 2008-9 but growthdecelerated in the next two years due to the globaleconomic situation.
IT and ITeS
10.42 India’s IT and ITeS services with exponentialgrowth are a unique export-led success story whichhas put India on the global map. While India hasachieved a brand identity in this sector, otherdeveloping countries are trying to emulate India’sexample. Besides its impact on growth (both directand indirect), it is also a provider of skilledemployment both in India and abroad, generatingdirect employment for nearly 2.8 million persons andindirect employment of around 8.9 million in 2011-12. The IT-ITeS industry has four major sub-components: IT services, business processoutsourcing (BPO), engineering services and R&D,and software products.
10.43 The global slowdown has impacted therevenues of the IT-Business Process Management(BPM) sector, the growth of which decelerated from15 percent in 2011-12 to an estimated 8.4 percentreaching US$95.2 billion in 2012-13 as perNASSCOM. The deceleration in growth of the
Table 10.5 : Overall Growth Performance of the IT-BPM Sector
Year Value (US $ Billion) Growth rate (per cent)2007- 2008- 2009- 2010- 2011- 2012- 2013- 2011- 2012- 2013-
08 09 10 11 12 13E 14P 12 13E 14P
Total IT-BPM 52.1 59.9 64.0 76.3 87.7 95.2 106-111 15.0 8.4 13-15Services Revenue
Exports 40.4 47.1 49.7 59.0 68.8 75.8 84-87 16.5 10.2 12-14
Domestic 11.7 12.8 14.3 17.3 19.0 19.3 22-24 9.7 1.9 13-15
Source : NASSCOMNote : Data excludes Hardware; E: Estimates; P: Projections
http://indiabudget.nic.in

224 Economic Survey 2012-13
dominant export sector (80 percent share) was from16.5 percent in 2011-12 to 10.2 percent in 2012-13,while domestic revenue growth decelerated from 9.7percent to a 1.9 per cent (due to currency effect)during these years. In Indian rupee terms domesticrevenues have grown at 14.1 per cent in 2012-13compared to 16.6 per cent in 2011-12. NASSCOMestimate of growth for 2013-14 are 13-15 percent fortotal IT-BPM revenue, 12-14 percent for exports and13-15 percent for domestic sector. As a proportionof national GDP, IT and Business ProcessManagement (BPM) sector revenues have grown from1.2 per cent in 1997-98 to an estimated nearly 8 percent in 2012-13. (Table 10.5)
10.44 While the global slowdown, increasingcompetition from new countries, and risingprotectionist measures in the wake of job losses indeveloped countries have slightly dimmed theprospects for exports of IT and ITeS services, a greatopportunity is waiting in India’s domestic market withincreasing technology adoption within thegovernment sector and the small and mediumbusiness (SMB) sector. The Twelfth Five Year Planaims to harness the potential of the software andservices sector to contribute to the country’s
development and growth, particularly in terms ofinvestment, exports, employment generation, andcontribution to GDP and to retain India’s leadershipposition as a global IT-BPO destination, consolidateand grow in both mature and emerging markets. Thegovernment has also announced the National Policyon Information Technology 2012 which aims tomaximally leverage the power of ICT to help addressthe economic and developmental challenges thecountry faces. Under the National e-Governance Plan(NeGP), the government focuses on making criticalpublic services available electronically and promotingrural entrepreneurship. Of the 31 Mission ModeProjects (MMP), 24 have been approved by theGovernment of India (with 22 MMPs having gone live).At central level these are: MCA 21,a complete e-governance project of Ministry of Corporate Affairs,pensions, income tax, central excise and customs,banking, insurance, passport, e-Office, NationalPopulation Register (NPR) and UID, India Post,immigration visa, and foreigners’ registration andtracking. Some of the issues and challenges relatedto this sector are the growing competition fromdeveloping countries with lower costs, risingprotectionist sentiments in developed countries, andtransfer pricing issues (See Box 10.3).
Box 10.3 : Growing competition to India’s IT and ITeS ServicesThe IT and ITeS sector has started facing competition from many developing countries. While the EU has the highest sharein computer and information services exports, followed by India and the USA, many new competitors like China, Israel andthe Philippines have emerged in recent years. Between 2005 and 2011, the annual average growth of computer services was69 per cent in the Philippines, 28 per cent in Sri Lanka, 59 per cent in Ukraine, 27 per cent in the Russian Federation, 37 percent in Argentina and 35 per cent in Costa Rica. Even if in some cases the export values are relatively low, the average annualgrowth of computer services in these economies is well above the average of the top exporters. In the BPO sector, countriessuch as the Philippines, Malaysia and China in the Asian continent; Egypt and Morocco in North Africa; Brazil, Mexico, Chileand Columbia in Latin America; and Poland and Ireland in Europe are emerging as attractive destinations for voicecontracts, posing a significant threat to Indian firms. According to NASSCOM, in the last five years, India has lost about 10per cent market share to the rest of the world in the world BPO space, most of which is in the voice contract segment.
Though China faces challenges, such as language proficiency, the country is spending large amounts in mission mode toincrease English proficiency, and thus may eventually emerge as a threat to India. Though the Philippines, the second largestdestination for outsourcing, is currently facing the challenge of appreciating currency, it is a serious competitor havingdeveloped both the hardware and software segments of IT. Outsourcing has also become a national issue in severaldeveloped countries, like the USA and the UK, who are supporting the local BPO industry through various means. Accordingto industry sources, the BPO industry in the UK employs 800,000 British workers and is emerging as a vital part of theeconomy.
In such a situation, the Indian BPO industry needs to gear up to address the challenges. Information campaigns to dispel themyths and fears about outsourcing needs to be undertaken by the industry in the developed economies. India should alsomove up the value chain in software services. Equally important is the need to focus on the large domestic sector where thereis a huge opportunity which, if tapped could also lead to lower costs due to scale economies. To address the rising wages inthe urban BPO space, there is a need to move more towards rural areas, for which skill development, and English languagetraining with American and different European accents is necessary.
Source : Based on WTO Report and inputs of NASSCOM and EXIM Bank of India.
http://indiabudget.nic.in

225Services Sector
other research 6 per cent. Government funding ofR&D accounts for two-thirds of the total funding.Industry contribution to R&D has been steadilyincreasing over the years but is still less than a thirdof the total. Government support for R&D in Indiatends to focus on classical objectives for public R&Dfunding such as nuclear energy, defence, space,health, and agriculture.
10.47 India is ranked 64th in the global innovationindex (GII) in 2012 according to a joint reportpublished by the Institut Européen d’Administrationdes Affaires i(INSEAD) and World IntellectualProperty Organization (WIPO). Though India isranked better in terms of market sophistication,knowledge and technology outputs, and creativeoutputs, the country has scored relatively poorly interms of institutional support, human capital andresearch, infrastructure and business sophisticationfor innovation. According to the GlobalCompetitiveness Report 2012-13, India’s capacityfor innovation has been lower than that of other BRICScountries except Russia. Though India scores betterthan China, Brazil, and Russia on the quality ofscientific research institutions, the researchundertaken in such institutions is not percolatingdown for commercial usage. This is exhibited throughits poor score on university–industry collaborationon R&D as compared to other BRICS nations exceptRussia. Though India scores better than all BRICSnations on availability of scientists and engineers,as compared to the population, the country has one
Table 10.6 : Global Competitiveness Index : Innovation Capacity
Country Capacity Quality Company University Availability PCT patentsfor innovation of scientific spending on – Industry of scientists granted/
research R&D collaboration and millioninstitutions on R&D engineers population
Score Rank Score Rank Score Rank Score Rank Score Rank Score Rank
India 3.5 42 4.4 39 3.5 37 3.8 51 5.0 16 1.2 63
China 4.1 23 4.2 44 4.1 24 4.4 35 4.4 46 6.5 38
South Africa 3.5 41 4.6 34 3.5 39 4.5 30 3.4 122 6.8 37
Brazil 3.7 34 4.1 46 3.6 33 4.1 44 3.5 113 2.8 48
Russia 3.3 56 3.6 70 3.0 79 3.4 85 3.8 90 5.4 44
South Korea 4.5 19 4.9 24 4.9 11 4.7 25 4.9 23 161.1 9
UK 5.0 12 6.2 3 4.8 12 5.8 2 5.1 12 93.0 18
USA 5.2 7 5.8 6 5.3 7 5.6 3 5.4 5 137.9 12
Source : Global Competitiveness Report 2012-13, World Economic Forum.Note : PCT—Patent Cooperation Treaty.
R&D Services
10.45 Among business services, R & D occupiesthe second position in India’s GDP with growth beingconsistently high at near 20 per cent in the last fewyears with growth in 2011-12 at 20.5 per cent. Untilrecently, the competitive advantage in R&D wasalmost exclusively with the developed economies.Of late, emerging countries are increasingly involvedin R&D and innovation, with active involvement ofboth public and private sectors. Factors such aslow cost, access to new markets, availability ofknowledge-oriented manpower, favourable regulatoryenvironment, and fiscal benefits play a major role indriving R&D investments towards emergingeconomies. These countries are also encouraginginnovation through legal, regulatory, and policysupport.
10.46 The US $ 1.5 trillion global gross expenditureon R&D (GERD) for 2013 projected by Battelle andR&D magazine is expected to grow by more thanUS$ 50 billion over the previous year. In this enormousactivity, India’s share is 3 per cent with GERD inPPP (purchasing power parity) terms projected atUS $ 45.2 billion which is around five times lowerthan that of China. As a percentage of GDP also it islow at 0.9 per cent. This is partly because the sizeof the R&D base and absorption capacity is notcommensurate with requirements. As per the report,the share of basic research in India’s R&D isestimated to be 26 per cent, applied research 36per cent, development research 32 per cent, and
http://indiabudget.nic.in

226 Economic Survey 2012-13
of the lowest ratios of scientists and engineers permillion people. Part of this shortage is attributed tothe lack of quality higher education institutions. TheReport estimates that even with large populationbase, India is estimated to have 25 per cent shortageof engineers in the country by 2025 (Table 10.6).
10.48 In Budget 2012-13, the government hasextended the weighted deduction of 200 per cent forR&D expenditure in an in-house facility beyond 31March 2012 for a period of five years to promoteinvestment in R&D. In this Budget a sum of ` 200crore has been set aside for incentivizing agriculturalresearch with awards. India has declared 2010-20as the ‘decade of innovation’. The government hasstressed the need to enunciate a policy forsynergizing science, technology, and innovation andhas also established the National Innovation Council.A Science, Technology, and Innovation Policy 2013has been announced in furtherance of thesepronouncements. Increasing GERD to 2 per cent ofGDP, from the present level of less than 1 per centhas been set as a national goal.
Legal Services
10.49 Legal services have been growing at a steadyrate of 8.2 per cent in each of the years from 2005-6to 2011-12. The Indian legal profession todayconsists of approximately 1.2 million registeredadvocates, around 950 law schools, andapproximately 4 to 5 lakh law students across thecountry. Every year, approximately 60,000–70,000law graduates join the legal profession in India. Indiais ranked 45, with a score of 4.5, in terms of judicialindependence by the Global Competitiveness Report2012-13, an improvement from 51st rank in 2011-12.As regards efficiency of the legal framework insettling disputes, India is ranked 59, with a score of3.8, an improvement from 64th rank a year before.India is ranked at 52nd position when it comes to theefficiency of the legal framework in challengingregulations, with a score of 3.9, a marginal declinedfrom 51st position in the previous year. Though India'srankings are better than most of the South Asianand some South East Asian countries in all the threeparameters, there is a need for further improvementparticularly in speeding up disposal of cases. Theeconomic growth in our country has inevitably led tocomplex laws and regulations and it is importantthat lawyers across India have access to thenecessary tools to keep pace with the change.
10.50 The practice of law has however changeddrastically in the past few decades due toliberalization and associated economic growth inIndia. With industrialization and FDI inflows, thecorporate legal sector in India has been witnessingtremendous growth, as also legal processoutsourcing (LPO). In India the practice of law isgoverned by the Advocates Act of 1961. Under thisAct, foreign law firms are not allowed to engage inpractice of law in India. Many foreign legal firms haveset up liaison offices (currently permitted under thelaw), while a few have established referralrelationships with Indian firms. Given that India hasbenefited from opening up to foreign competition inmany other areas, and given that Indian lawyers areoffering services across the world (see below), Indiashould explore allowing foreign law firms greateraccess to the Indian market.
10.51 The global financial crisis has not onlyincreased recession-related litigations in developedcountries but also encouraged legal outsourcing tocut down costs. India is regarded as one of the bestLPO destinations in view of the low cost of legalprofessionals (50 per cent to 80 per cent more costcompetitive than that of the USA and UK),geographical advantage (Indian time zone is distinctfrom that of the USA and Britain, allowing it to offerlegal services round the clock), language proficiency(emphasis on English education), and the legalsystem (which is inspired by the legal systems ofthe USA and UK). Technologically too, the IndianLPO industry has made rapid strides as Indianservice providers can make use of advanced meansof communication technology. Indian legal serviceproviders offer legal support in the form of researchdocument reviews, drafting of documents, makingapplications for patents, and various paralegal andadministrative tasks.
10.52 The National Legal Services Authority(NALSA) has been constituted under the LegalServices Authorities Act 1987 to monitor and evaluateimplementation of legal aid programmes and to laydown policies and principles for making legal servicesavailable under the Act. Free legal services includepayment of court fee, process fees and other chargesincurred in legal proceedings, services of lawyers,obtaining and supply of certified copies of ordersand other documents in legal proceedings andpreparation of appeal, paper book, etc. During theperiod from 1 April 2012 to 31 October 2012, more
http://indiabudget.nic.in

227Services Sector
than 7.82 lakh persons have benefited through legalaid services in the country. Of them, there were morethan 23,000 persons belonging to the scheduledcastes and about 20,000 persons from the scheduledtribes. More than 37,000 women and about 5900children also benefited. During this period more than54 thousand Lok Adalats have been organized andthese Lok Adalats settled more than 17.30 lakhcases. A Para-Legal Volunteers (PLVs) project hasbeen developed by NALSA for the purpose ofimparting legal awareness to various target groups.As on 31 December 2012, 73,555 PLVs have beentrained in the country and have started functioning,bridging the gap between common people and legalservices institutions.
Accounting and Audit Services
10.53 Accounting, auditing, and book-keepingservices are a part of ‘business services’. Accountingservices have been growing at around 6-7 per centsince 2005-6 with 7.1 per cent growth in 2011-12.The accounting profession in India is highly developedwith the potential to play a greater role internationally.As per WTO data, in the US $ 44.5 billion ‘otherbusiness services’ exports of India in 2010, the legal,accounting, management, and public relationsservices with a value US$ 8.6 billion had a share of19.3 per cent. This is around five times less than theUS exports of US $ 39.1 billion and three times lessthan China’s exports of US$22.8 billion.
10.54 The accountancy service providers in Indiaare self-regulated through a combination of statutorybodies like the Institute of Chartered Accountants ofIndia (ICAI), the Institute of Cost and WorkAccountants of India, and the Institute of CompanySecretaries of India (ICSI). There are 53,197 activeCA firms as of 27 December 2012. Indian accountingfirms are increasingly getting integrated and areproviding associated services such as managementconsultancy, corporate finance, and advisoryservices in addition to their core business ofaccounting, auditing, and tax services. Given thehigh potential for accounting and audit services bothdomestically and in exports through the outsourcingmode, there is need to revamp the professionaldevelopment framework to expand the talent pool,deepen the expertise, and enhance the flow of highquality accountancy professionals. Tapping theoutsourcing market of the US and other developingcountries in niche areas like actuarial andaccountancy services would depend on the
availability of high-quality experts in tax, insurance,and pension laws of the US and other countries andencouraging setting up of back offices of foreign firmsin India. Tie-ups of domestic firms with foreign firmscan help gain expertise and markets which wouldotherwise not be individually available for smalldomestic accountancy firms. This would also needrelaxation in some domestic regulations and obtainingdue recognition to Indian qualifications through mutualrecognition agreements (MRAs). As with legalservices, FDI in accounting services will help improvethe competitiveness of the Indian market, and link itbetter to global markets.
Communication ServicesTelecom and Related Services
10.55 Telecom services is another sunrise sectorin which India has made a mark with the secondlargest telephone network in the world, after onlyChina. Teledensity, which is an important indicatorof telecom penetration, increased from 18.22 per centin March 2007 to 73.34 per cent as on 31 December2012, with urban teledensity at 149.55 per cent andrural at 39.90 per cent. (See Chapter 11 for furtherdetails.)
Postal Services
10.56 Postal services, a traditional mode ofcommunications all over the world, have also been apopular mode in India, especially rural India.Department of Posts has the largest postal networkin the world with 1,54,822 post offices in the countryas on 31March 2012. Of these, 1,39,086 are in ruralareas and 15,736 in urban. In order to expand thenetwork and further improve people’s access topostal services, India Post is also adopting thefranchisee model. It has so far opened 1,670franchisee outlets in areas where it was not possibleto open post offices. The Department of Posts haslaunched ‘Project Arrow’ as a quality improvementinitiative to transform India Post into a vibrant andresponsive organization.
10.57 With tough competition from courier servicesoffered by the private sector, and emergence ofalternate modes of communications such as telecomand information technology, the postal service isdiversifying into new areas like e-commerce, B to Caddress/addresse verification, M to M moneytransfer, web-based money transfer, social securitydisbursement and some other social sector-related
http://indiabudget.nic.in

228 Economic Survey 2012-13
Box 10.4 : An Indicative list of domestic restrictions and regulations in some services in IndiaOne major issue in services is the domestic barriers and regulations. Domestic regulations in strict WTO terms includelicensing requirements, licensing procedures, qualification requirements, qualification procedures, and technical standardsbut here other restrictions and barriers are also considered. While there are many domestic regulations in our major marketswhich deny market access to us and therefore need to be negotiated at multilateral and bilateral levels, there are also manydomestic regulations in India which hinder the growth of this sector. Since domestic regulations perform the role of tariffs inregulating services, there is need to list the domestic regulations in India which need to be curbed to help growth of the sectorand its exports, while retaining those which are necessary for regulating the sector at this stage. An indicative list of someimportant domestic regulations in India which need to be examined for suitable policy reforms in the services sector is asfollows:
Trade and Transport services: Some constraints in these sectors include restrictions on inter-state movement of goodswhich could ease with the adoption of the model Agriculture Produce and Marketing Committee (APMC) Act by manystates; the Multimodal Transportation of Goods Act 1993 which needs revision to ease the existing restrictions on transportationand documentation through different modes of transport, particularly restrictions in the Customs Act which do not allowseamless movement of goods; and restrictions on free movement of cargo between Inland Container Depots (ICDs), ContainerFreight Stations (CFSs) and Ports.
Construction: In construction, bottlenecks result from continuation of restrictions under the Urban Land Ceiling andRegulation Act (ULCRA) in some states namely Andhra Pradesh, Assam, Bihar, and West Bengal which have not yetrepealed it and the confusion in the process required for clearance of buildings even after the repeal of ULCRA by passing ofthe Urban Land(Ceiling and Regulations) Repeal Act 1999 by the other states. There is also lack of clarity on the role of statesas facilitators in the land acquisition policy resulting in increasing number of court litigations adding to risk profile ofbuilders/projects thereby restricting lenders from extending finance to such builders/ projects. There are also restrictions onfloor area ratio (FAR) in many states; and other restrictions like the application of bye laws/regulations and its exemptionse.g. increase in FAR which varies from project to project and is sometimes discriminatory. Obtaining environment clearanceis another major hindrance.
Accountancy services: While the accountancy professionals were hitherto allowed to operate either as a partnership firm oras a sole proprietorship firm or in their own name since the Indian regulations do not permit exceeding 20 professionals underone firm, the emergence of Limited Liability Partnership (LLP) structure is likely to address this impediment. However, thenumber of statutory audits of companies per partner is restricted to 20. FDI is also not allowed in this sector and foreignservice providers are not allowed to undertake statutory audit of companies as per the provisions of the laws in India. Thereare also domestic regulations like prohibition on the use of individual logos for partnership and single proprietorshipaccounting firms. These regulations need to be relaxed and streamlined to facilitate tie-ups and penetrate foreign marketsgiven the potential for exporting these services by the outsourcing mode.
Legal services: In legal services FDI is not permitted and international law firms are not authorized to advertise and openoffices in India. Foreign service providers can neither be appointed as partners nor sign legal documents and representclients. The Bar Council is opposed to entry of foreign lawyers/law firms in any manner. Indian advocates are not permittedto enter into profit-sharing arrangements with persons other than Indian advocates.
Education Services: These come under the concurrent list with multiple controls and regulations by central and stategovernments and statutory bodies. Regulations of minimum of 25 acres of land to establish a medical college restricts thesetting up of medical colleges in cities like Delhi. Patient load factor regulations related to establishment of new medicalcolleges also need to be in tune with present day equipment-intensive patient care and modern practices and procedures ofmedical education.
Source : Based on Dr H.A.C. Prasad and R. Sathish (2010), working paper No. 1/2010-DEA on ‘Policy for India’sServices Sector’ with updates from concerned Departments and Institutions.
activities. Besides the already existing instant moneyorder, the Department of Posts launched mobilemoney remittance services on 15 November 2012 in18 selected post offices in each of four circles, viz.Kerala, Bihar, Delhi, and Punjab. The Department ofPosts has also been given the responsibility of
disbursing wages to Mahatma Gandhi National RuralEmployment Guarantee Scheme (MGNREGS)beneficiaries through post office savings bankaccounts. At present, MGNREGS wages aredisbursed through 5.55 crore NREGS accounts in96,895 post offices. During the current financial year
http://indiabudget.nic.in

229Services Sector
(April-November 2012) wages to the tune of ̀ 9,812crore have been disbursed. Post offices also have asignificant role in disbursement of benefits undervarious schemes such as pensions and conditionalcash transfers to women. The wide reach of postoffices is also being utilized for collection of data tocompute the rural consumer price index every monthin rural areas. While the postal sector is enteringinto new areas of activity, it has not only to shed itsrole in some of the traditional activities and areas,but also trim its size and release the resources bothphysical and human for use in other areas.
CHALLENGES AND OUTLOOK
Outlook10.58 The growth of the steadily growing servicessector did not fall even during the post 2008 crisisperiod This was primarily due to higher governmentspending with the high weighted community, social,and personal services at 19.8 per cent and 17.6 percent in 2008-09 and 2009-10 respectively, which ismore than the rate in 2007-08 and around eight toten times the rate of 2006-07. This was supportedby the good growth in the other two major sectors,‘financial, insurance, real estate, and businessservices’ and ‘transport, storage, andcommunication’. While these two sectors along with‘trade, hotels, and restaurants’ were the majorcontributors to growth before the crisis, during thecrisis years of 2008-9 and 2009-10, ‘community,social and personal services’ assumed a greater rolein stabilizing the growth of the services sector.However, the growth of these services deceleratedin 2010-11 and was low in 2011-12 due to decelerationin growth of public administration and defence. This,coupled with the lower growth of trade (internal andexternal) reflected in fall in growth of transport andrelated activities, led to a relatively lower growth ofthe services sector and even construction sector. In2011-12, among the broad services sub-sectors, thehighest point contribution to total GDP growth at34.0 per cent was that of ‘financing, insurance, realestate, and business services’ followed by ‘trade,hotels, and restaurants’ (16.9 per cent). In 2012-13,with growth of even ‘trade, hotels & restaurants’ and‘financing, insurance, real estate and businessservices’ decelerating, overall services growth hasalso decelerated.
10.59 Moving forward in the coming years, theshipping sector continues to be in the red with fall in
external trade and the aviation sector has been rattledby sudden eruption of problems in some airlines.Following the growth moderation in FTAs and theresultant FEEs, growth in tourism and relatedservices like hotels is expected to be moderate. Onthe other hand with the recent announcement ofreform measures at regular intervals including mildrelaxation in the monetary and credit policy, sectorslike retail, construction, and telecom are expectedto perform better. With the slight improvement in theglobal economic situation, software, financial, andfair-weather business services are also expected toperform better. With no major cuts in communityand social expenditure expected, services sectorgrowth could recover, the downside risks, however,being any downswings in the global economicsituation.
Challenges10.60 The immediate challenge for the servicessector covering myriad activities and areas is growthrevival. India’s growth has been basically a services-led growth pulling up overall growth of the economy.While this could be through a business-as-usualapproach, a more targeted approach with focus onbig-ticket services could lead to exponential gainsfor the economy. While software and telecomservices have led by example, there are some otherimportant services like tourism including medicaltourism and shipping and logistics. Tourism is a big-ticket item which can not only lead to higher growthbut also more inclusive growth. With world touristarrivals expected to increase by 43 million every yearon an average from 2010 to 2030 and FTAs inemerging countries expected to grow faster than inadvanced economies, a goldmine of opportunity intourism is waiting for India which at present has apaltry share of 0.64 per cent in world tourist arrivals.India has an assorted list of destinations havingdifferent types of weather and catering to differenttypes of tourists. However, an image change for Indiantourism is needed with higher investment in tourisminfrastructure including through PPP mode. Evenuser charges could be levied if monuments or touristsites are developed by the private sector or throughPPP. There is urgent need to address issues likehigh luxury taxes on hotels by states and ensuregreater cleanliness and safety for tourists which canhelp in giving a big boost to this sector. RefundingVAT as done in countries like Thailand and Singapore
http://indiabudget.nic.in

230 Economic Survey 2012-13
can also help the tourism sector with ripple effectson sectors like textiles and leather manufacturing,as it can lead to high purchase of these items inwhich India is price competitive. Shipping servicesis another major area where the growth impact canbe high. With the share of shipping services in India’soverseas cargo falling from 40 per cent in the 1980sto just 10.4 per cent in 2011-12, measures toaugment the ageing shipping fleet of India arenecessary. With global prices at an all-time low, thetime is opportune for such purchases which can helpin greater foreign exchange earnings/savings in thefuture through shipping services which have forwardlinkage effect even in the export sector and alsoincrease our bargaining power with the foreign liners.Super specialty healthcare is another potentialsector with India being one of the cheapestdestinations offering quality services.
10.61 The other major challenge is to retain andexpand our competitive advantage in those serviceswhere we have already made a mark. The presentadvantage in services may not continue forever, withnew competitors from other developing countriesmaking rapid strides even in areas where we hadthe initial advantage as in the case of softwareservices. Further expansion of established services
like software and telecom into new markets andgreater usage of these services domestically cannot only increase services growth but also propelgrowth in other sectors with greater efficiency in thesesectors using knowledge- and technology-basedservices.
10.62 Removing or easing domestic regulations isthe third challenge. While removal of market barriersin the form of domestic regulations in other countriesdepends on multilateral and bilateral negotiations,the myriad restrictions and regulations in the differentservices domestically as indicated in Box 10.4 needimmediate attention. Removing or easingthem can lead to dynamic gains for the Indianeconomy.
10.63 The services sector is an uncharted seathrowing up many daunting challenges as well asopening up many exciting opportunities. While manyhitherto non-tradable services including those in thegovernment and social sectors are becomingdomestically tradable, many services hithertoconfined within national borders (like telemedicine)have become internationally tradable. Addressing thechallenges of the diverse services sectors andseizing the new opportunities can lead to multiplegains for the services sector and the economy.
http://indiabudget.nic.in

Energy, Infrastructureand Communications CHAPTER
11
The Twelfth Five Year Plan lays special emphasis on development of theinfrastructure sector including energy, as the availability of quality infrastructureis important not only for sustaining high growth but also ensuring that the growthis inclusive. The total investment in the infrastructure sector during the TwelfthFive Year Plan, estimated at ` 56.3 lakh crore (approx. US$1trillion), will benearly double that made during the Eleventh Five Year Plan. This step up ininvestment will be feasible primarily because of enlarged private-sector participationthat is envisaged. Unbundling of infrastructure projects, public private partnerships(PPP), and more transparent regulatory mechanisms have induced private investorsto increase their participation in infrastructure sectors. Their share in infrastructureinvestment increased from 22 per cent in the Tenth Five Year Plan to 38 per cent inthe Eleventh Plan and is expected to be about 48 per cent during the Twelfth FiveYear Plan. Yet, more than half of the resources required for infrastructure wouldneed to come from the public sector, from the government, and the parastatals.This would require not only the creation of the fiscal space but also use of a rationalpricing policy. Further, scaling up private-sector participation on a sustainablebasis will require redefining the contours of their participation for the developmentof infrastructure sector in a transparent and objective manner with a comprehensiveregulatory mechanism in place. This chapter summarizes recent developments inthe infrastructure sector, particularly the energy scenario in India, and the challengesand opportunities in the context of the targets and milestones envisaged in theTwelfth Five Year Plan.
OVERVIEW OF PERFORMANCE
11.2 Infrastructure projects take a long time toplan and implement. Delays in the execution ofprojects not only lead to shortfalls in achievingtargets but widen the availability gaps. Timeoverruns in the implementation of projects continueto be one of the main reasons for underachievementin many infrastructure sectors. The status report ofmajor central-sector projects costing ` 150 croreand above for the month of September 2012 showsthat out of the 566 projects, five were ahead ofschedule, 226 on schedule, and 258 had beendelayed with respect to their latest scheduled dateof completion. The remaining projects do not have
fixed dates of commissioning. Delays in landacquisition, municipal permission, supply ofmaterials, award of work, operational issues, etc.continued to drag down implementation of theseprojects. Sector-wise, in the coal sector 21 projectswere delayed out of 51, in the petroleum sector 37out of 71, in the power sector 45 out of 98, in therailways 40 out of 127, and in the road sector 86out of the total 146 projects. The overall cost overrunamounted to 16.8 per cent of the original cost andtill September 2012 only 45.5 per cent of theanticipated cost of the projects had been incurred.
11.3 Major sector-wise performance of coreindustries and infrastructure services shows a mixed
http://indiabudget.nic.in

232 Economic Survey 2012-13
trend so far in the current financial year. Productionof coal, cement, petroleum refinery was marginallyhigher during the current year as compared to thecorresponding period of the previous year while steeland power-sector production was comparativelylower. Fertilizer, crude oil, and natural gas productionalso declined during the first nine months of thisfinancial year. Among the infrastructure services,growth in freight traffic by railways has beencomparatively higher so far, while the civil aviationsector and cargo handled at major ports havewitnessed negative growth. In the road sector theNational Highways Authority of India (NHAI) achieved17.3 per cent growth during the current financial yearupto November 2012 (Table 11.1).
ENERGY
11.4 During the Eleventh Five Year Plan, nearly55,000 MW of new generation capacity was created,
yet there continued to be an overall energy deficit of8.7 per cent and peak shortage of 9.0 per cent.Resources currently allocated to energy supply arenot sufficient for narrowing the gap between energyneeds and energy availability. Indeed, this may widenas the economy moves to a higher growth trajectory.India's success in resolving energy bottleneckstherefore remains one of the key challenges inachieving the projected growth outcomes. Further,India's excessive reliance on imported crude oilmakes it imperative to have an optimal energy mixthat will allow it to achieve its long-run goal ofsustainable development.
Reserves and potential for energygeneration11.5 The potential for energy generation dependsupon the country's natural resource endowmentsand the technology to harness them. India has both
Table 11.1 : Growth in core industries and infrastructure services (in per cent)
Sl. Sector Unit 2009-10 2010-11 2011-12 2011 2012No. (April-Dec.)
1 Power Bill Unit 6.8 5.7 8.1 9.3 4.62 Coal MT 8 0 1.3 -2.7 5.73 Finished steel MT 3.2 9.6 8.5 9.1 3.64 Fertilizers MT 13.2 1 -0.1 -0.5 -3.45 Cement MT 10.1 4.3 6.4 5.8 6.16 Petroleum: a) Crude oil MT 0.5 11.9 1 1.9 -0.4 b) Refinery MT -0.4 3 3.2 4 6.9 c) Natural gas MT 44.8 9.9 -8.9 -8.8 -13.37 Railway revenue-earning
freight traffic MT 6.6 3.8 5.2 4.2* 4.7*8 Cargo handled at major ports MT 5.7 1.6 -1.7 1.3* -2.9*9 Civil aviation: a) Export cargo handled Tonnes 10.4 13.4 -2.2 -1.3* -1.0* b) Import cargo handled Tonnes 7.9 20.6 -1.6 1.8* -9.7* c) Passengers handled at
international terminals Lakh 5.7 11.5 7.6 7.5* 2.8* d) Passengers handled at
domestic terminals Lakh 14.5 16.1 15 18.5* -5.5*10 Telecommunications:
Cell phone connections Thousand lines 47.3 18 -52.7 -49.6* -11 Roads: Upgradation of
highways@ i) NHAI Kms 30.9 21.4 -33.3 2.9* 17.3* ii) NH(O) & BRDB Kms 17.3 4 -6.8 -32.4* -2.8*
Source: Ministry of Statistics and Programme Implementation (MOSPI) and O/o The Economic Adviser,DIPPNotes : NH(O) stands for National Highways Organization and BRDB for the Border Roads DevelopmentBoard(BRDB).@ Includes Widening to four lanes and two lanes and strengthening of existing weak pavement only.*Data pertain to April-November 2011 and 2012 respectively; MT is million tonnes.
http://indiabudget.nic.in

233Energy, Infrastructure and Communications
non-renewable reserves (coal, lignite, petroleum, andnatural gas) and renewable energy sources (hydro,wind, solar, biomass, and cogeneration bagasse).As on March 2011, India's estimated coal reserveswere about 286 billion tonnes, lignite 41 billiontonnes, crude oil 757 MT, and natural gas 1241billion cubic metres (BCM). Estimated hydropotential (above 25 MW) is about 145 gigawatts(GW). The total potential for renewable powergeneration from various sources other than largehydro projects was 89,760 MW. The estimatedreserves of non-renewable and the potential fromrenewable energy resources change with theresearch and development of new reserves and thepace of their exploration.
Energy production11.6 The trend in production of the primary sourcesof conventional energy such as coal, lignite, crude
petroleum, natural gas, and electricity shows thatin last four decades, i.e. from 1970-1 to 2010-11,the compound annual growth rate (CAGR) ofproduction of coal, lignite, crude petroleum, naturalgas, and electricity (hydro and nuclear) generationwas 5.0 per cent, 6.1 per cent, 4.3 per cent, 9.1per cent, and 4.0 per cent respectively (Figure 11.1).In terms of energy equivalent of all the primary energysources in 2010-11, the share of coal and lignite,electricity (hydro and nuclear), and natural gas was52 per cent, 28 per cent, and 11 per centrespectively.
Consumption pattern of conventional energy11.7 Trends in consumption of energy fromconventional sources in India show that during thelast four decades, i.e from 1970-1 to 2010-11,consumption of coal, lignite, crude oil in terms ofrefinery throughput, and electricity (thermal, hydro,
http://indiabudget.nic.in

234 Economic Survey 2012-13
and nuclear) increased at a CAGR of 5.30 per cent,6.05 per cent, 11.25 per cent, and 6.63 per centrespectively. Growth of total energy consumptionfrom all conventional sources in terms of peta jouleswas 6.04 per cent during 1970-1 to 2010-11 (Figure11.2). Per capita energy consumption grew at anaverage annual rate of 5.30 per cent during thisperiod. The elasticity of energy use ( Kwh per rupee),defined as the amount of energy consumed forgenerating one unit of gross domestic production(GDP), has, however, been less than one. Theconsumption pattern of energy by primary sourcesexpressed in terms of peta joules shows thatelectricity generation accounted for about 51 percent of the total consumption of all primary sourcesof energy during 2010-11, followed by coal and lignite(25 per cent) and crude petroleum (20 per cent).
Energy scenario during the Twelfth Five YearPlan and beyond11.8 The Twelfth Plan has projected a totaldomestic energy production of 669.6 million tons ofoil equivalent (MTOE) in 2016-17 and 844 MTOE in2021-2. This will meet around 71 per cent and 69
per cent of expected energy consumption, with thebalance to be met from imports, projected to beabout 267.8 MTOE in 2016-17 and 375.6 MTOE in2021-2. Import dependence in case of crude oil andcoal is projected to be about 78 per cent and 22.4per cent respectively by 2016-17. Coal and lignitewill continue to dominate the energy scenario andby 2021-2 the share of these two fuel products willbe about 66.8 per cent in total commercial energyproduced and about 56.9 per cent in totalcommercial energy supply by 2021-2. The share ofcrude oil in production and consumption is expectedto be 6.7 per cent and 23 per cent respectively.Energy exploration and exploitation, capacityadditions, clean energy alternatives, conservation,and energy sector reforms will, therefore, be criticalfor energy security. Box 11.1 gives a picture of energypricing in India.
POWER
Generation11.9 Electricity generation by power utilities during2012-13 was targeted to go up by 6.05 per cent to
Box 11.1 : Energy PricingThe government appreciates the economic role of rational energy pricing. Rational energy prices provide the right signals toboth the producers and consumers and lead to a demand-supply match, providing incentives for reducing consumption onthe one hand and stimulating production on the other. Aligning domestic energy prices with the global prices, especiallywhen large imports are involved, may be ideal option as misalignment could pose both micro- and macroeconomicproblems. At microeconomic level, underpricing of energy to the consumer not only reduces the incentive for being energy-efficient, it also creates fiscal imbalances. Leakages and inappropriate use may be the other implications. Underpricing tothe producer reduces both his incentive and ability to invest in the sector and increases reliance on imports.
Over the years, India's energy prices have become misaligned and are now much lower than global prices for manyproducts. The extent of misalignment is substantial, leading to large untargeted subsidies.
The government has taken several initiatives for rationalizing the energy prices in different sectors. The Integrated EnergyPolicy has outlined the broad contours of the pricing system for coal. The pricing of coal is done now on gross calorific value(GCV) basis with effect from 31 January 2012, replacing the earlier system of pricing on the basis of useful heat value (UHV)which takes into account the heat trapped in ash content also, besides the heat value of carbon content. The revision in theGCV is likely to increase the prices of domestic coal to some extent, but this is a desirable adjustment because domesticthermal coal, adjusted for quality differences, continues to be underpriced.
In case of petroleum products pricing, the government dismantled the Administered Pricing Mechanism in 2002. Thisdecision, however, was not fully implemented and domestic pass through of global price increases remained low for petrol,diesel, kerosene, and LPG. On 25 June 2010, the government announced that the price of petrol was fully deregulated andthe oil companies were free to fix it periodically. However, diesel price deregulation was deferred. In January 2013, thegovernment announced the new roadmap providing for a gradual price increase for reducing diesel under-recoveries.Admissibility of subsidized number of liquefied petroleum gas (LPG) cylinders and prices of LPG have also recently beenrevised.
Pricing of gas is presently done under the New Exploration Licensing Policy (NELP). The government provides the operatorfreedom to sell the gas produced from the NELP blocks at a market-determined price , subject to the approval of pricingformula. The government is reviewing pricing under the price sharing contract (PSC) to clarify the extent to which producerswill have the freedom to market the gas.
http://indiabudget.nic.in

235Energy, Infrastructure and Communications
9.6 per cent in the terminal year of the Tenth Plan(2006-7) to 8.7 per cent during April to December2012, peak deficit declined from 13.8 per cent in2006-7 to 9.0 per cent during the current financialyear (up to December 2012).
Capacity Addition11.12 The Eleventh Five Year Plan initially envisageda capacity addition of 78,000 MW, of which 19.9per cent capacity was hydro, 75.8 per cent thermal,and the rest nuclear. At the time of the Mid TermAppraisal (MTA) of the Eleventh Plan, the target wasrevised to 62,374 MW with the thermal, hydro, andnuclear segments contributing 50,757 MW, 8,237MW, and 3,380 MW respectively. A capacity additionof 54,964 MW has been achieved during theEleventh Plan. The capacity addition during theTwelfth Plan period is estimated at 88,537 MWcomprising 26,182 MW in the central sector, 15,530
Table 11.2 : Power Generation by Utilities (Billion KWh)Category April-December Growth
20011-12 2011-12 2012-13 (per cent)Power Generation 876.887 580.664 683.753 4.55
Hydroelectric# 130.510 100.178 92.543 (-)13.9
Thermal 708.806 454.404 561.879 8.55
Nuclear 32.286 21.183 24.653 3.54
Bhutan import 5.285 4.898 4.677 (-)7.49
Source : Ministry of Power;Note : #Includes generation from hydro stations above 25 MW.
Table 11.3 : Thermal power generationduring April-December 2012
Components Generation Growth PLF (in per cent)(Billion (%) Apr.- Apr.-
KWh) Dec. Dec.2011 2012
Coal 488.92 13.90 72.23 69.49Lignite 23.40 19.81 67.05 73.47Gas Turbine 53.87 -25.49 62.01 43.62Diesel 1.69 -6.44 - -
Thermal Total 561.80 8.6 71.94 69.63
Source : Ministry of Power.
930 billion units. The growth in power generationduring April to December, 2012 was 4.55 per cent,as compared to about 9.33 per cent during April toDecember, 2011 (Table 11.2).
11.10 In the thermal category, growth in generationfrom coal, lignite, and gas-based stations was ofthe order of 13.90 per cent, 19.81 per cent,and (-) 25.49 per cent respectively. The overall plantload factor (PLF), a measure of efficiency of thermalpower stations, during April to December 2012declined to 69.63 per cent as compared to the PLFof 71.94 per cent achieved during April to December2011(Table 11.3).
11.11 The sector-wise and region-wise break-upsof the PLF of thermal power stations from 2009-10to 2012-13 (April to December 2012) show changeover time as well as regional variation (Table 11.4).During the current year, while the PLF for central-and state-sector utilities moderated, PLF for private-sector utilities witnessed improvement. The PLF ofstate-sector utilities remained lower than that ofprivate- and central-sector utilities. The deficit inpower supply in terms of peak availability and totalenergy availability declined during the Eleventh FiveYear Plan. While the energy deficit decreased from
Table 11.4 : PLF of Thermal Power Stations(per cent)
Category 2011-12 2011-12 2011-12 2012-13(Apr.- (Apr.-Dec.) Dec.)
i) State sector 66.75 68.00 66.50 65.01
ii) Central sector 85.12 82.12 80.16 78.80
iii) Private sector
(Utilities) 76.70 76.19 78.10 79.03
REGIONS
i) Northern region 78.75 77.48 77.19 69.67
ii) Western region 75.26 72.04 71.19 69.00
iii) Southern region 80.04 82.19 79.39 80.77
iv) Eastern region 66.21 63.51 61.37 61.99
v) North-easternregion 0 0 0 0
All India 75.08 73.32 71.94 69.63
Source : Ministry of Power.
http://indiabudget.nic.in

236 Economic Survey 2012-13
MW in the state sector, and 46,825 MW in theprivate sector respectively. The capacity additiontarget for the year 2012-13 was set at 17,956 MW.As against it, a capacity of 9,854 MW has beenadded till 31 December 2012 (Table 11.5).
Development of Hydro Power11.13 As per a re-assessment study carried outby the Central Electricity Authority (CEA), the
Table 11.5 : Sector-wise and Fuel –wise capacity addition during April-December 2012 (MW)Sector Thermal Hydro Nuclear Total Per cent
Target Actual Target Actual Target Actual Target Actual to target
Central 4023.3 2660 645 264 2000 0 6668.3 2924 43.8
State 3951 1350 87 15 0 0 4038 1365 33.8
Private 7180 5495 70 70 0 0 7250 5565 76.8
All India 15154.3 9505 802 349 2000 0 17956.3 9854 54.87
Source : Ministry of Power.
Table 11.6 : Exploitation of HydroelectricPotential
No of projects/ Capacityschemes (MW)
Under operation 180 39324
Under construction 51 13619
Approved by CEA 57 29443Approved by CEA and yet tobe taken up for construction 32 19259Survey & investigation 97 20436
Total 377 103019Source : Ministry of Power
identified hydroelectric potential of the country(having installed capacity above 25 MW) is 1,45,320MW. As of now, 434 hydropower projects/schemes(Table 11.6) are at different stages of operation/approval/investigation.
Ultra Mega Power Project Initiatives11.14 The Ministry of Power launched an initiativefor development of coal-based super critical UltraMega Power Projects (UMPP) of about 4000 MWcapacity each. Four UMPPs, viz. Sasan in MadhyaPradesh, Mundra in Gujarat, Krishnapatnam inAndhra Pradesh, and Tilaiya in Jharkhand havealready been transferred to the identified developersand are at different stages of implementation. Three
units of Mundra UMPP each of 800 MW have beencommissioned in March, July, and October 2012.The fourth and fifth units are expected to achievecommercial operation in May and September 2013.Other awarded UMPPs are expected to come up inthe Twelfth Plan (except the last unit of the TilaiyaUMPP, which is likely to come up in the ThirteenthPlan).
Transmission, Trading, Access, andExchangeNational Grid
11.15 An integrated power transmission grid helpsto even out supply-demand mis-matches. Theexisting inter-regional transmission capacity of27,750 MW connects the northern, western,eastern, and north-eastern regions in a synchronousmode operating at the same frequency and thesouthern region asynchronously operating in thesame mode. This has enabled inter-regional energyexchanges of about 48,896 million units (MUs) duringApril-December 2012, thus contributing to betterutilization of generation capacity and improvementin power supply position. Synchronousinter-connection of the southern region with otherregions is expected to be established by Q1 of 2014.
Open access
11.16 Competition in the electricity sector hasbeen augmented through open access, allowing abuyer to choose the supplier and a seller to choosethe buyer. Open access at inter-state level is nowfully functional. The facilitative framework createdthrough the Central Electricity RegulatoryCommission [CERC] (Open Access in Inter-StateTransmission) Regulations 2008 has providedregulatory certainty for the sellers and buyersthrough market access and also the security ofpayment against default by buyers. During 2011-12,
http://indiabudget.nic.in

237Energy, Infrastructure and Communications
24,111 inter-state short-term open accesstransactions (including bilateral and collective) wereapproved for sale of 66,987 MU. During 2012-13 (upto November 2012), sale of 48,008 MU has beenapproved through 21,185 inter-state bilateral andcollective short-term open access transactions. TheCERC also notified the regulations concerning grantof connectivity, long-term access, and medium-termopen access in inter-state transmission in 2009 andregulations for approvals for execution of the inter-state transmission scheme in 2010 to ensuredevelopment of an efficient, reliable, coordinated,and economical inter-state electricity transmissionsystem based on the long-term access sought bygeneration developers.
Trading of Electricity
11.17 Trading in electricity is enabled throughelectricity traders and power exchanges. It optimizesgeneration resources by facilitating trade and flowof electricity across the country. It has helped insale of surplus power by distributing utilities andcaptive power plants on one hand and purchase ofpower by deficit utilities on the other hand to meetsudden increases in demand. The short-termmarkets also provide generators with an alternativeto sell power other than through long-term powerpurchase agreements (PPAs). The CERC hasgranted 61 inter-state trading licences, 45 of whichwere in existence as on 30 November 2012. Thereis a cap on trading margins to be charged by tradersunder the regulations. For short-term contracts withthe per unit price of electricity being less than ` 3(Rupees Three), the trading margin is 4 (four) paiseper unit and for per unit price of electricity higherthan ̀ 3, the trading margin is capped at 7 (seven)paise per unit.
Aggregate Technical and Commerciallosses and Restructured APDRP11.18 The focus of the Restructured AcceleratedPower Development Reforms Programme(R-APDRP) is on actual, demonstrable performancein terms of reduction in aggregate technical andcommercial (AT&C) losses. Projects under thescheme are taken up in two parts in urban areasand cities with population of more than 30,000(10,000 in case of special category states). Part-Aof the scheme includes projects for establishmentof baseline data and information technology (IT)application for energy accounting/auditing and IT-
based consumer service centres. Part-B of thescheme includes regular distribution-strengtheningprojects. So far (as on 30.11.2012) under Part-A(IT),projects worth ̀ 5,196 crore covering all the eligibletowns (1,402) in 29 states/union territories(UTs), andunder Supervisory Control and Data Acquisition, andprojects worth ` 1,442 crore covering 63 towns in15 states have been covered. Under Part-B, 1,132projects worth ̀ 25,684 crore in 20 states have beensanctioned. Cumulatively an amount of ̀ 6,304 crore(as on 30.11.2012) has been disbursed under theR-APDRP for implementation of sanctioned projects.A proposal for continuing the R-APDRP during theTwelfth Plan for completing the ongoing works isunder consideration in the Ministry of Power.
Rural Electrification11.19 The Rajiv Gandhi Grameen VidyutikaranYojana (RGGVY) was launched in April 2005 withthe objective of providing all rural households accessto electricity through the creation of an appropriaterural electricity infrastructure. Below poverty line(BPL) households are provided connections free ofcost. The Government of India provides 90 per centcapital subsidy for projects under the scheme. Thescheme was initially approved with a capital subsidyof ` 5,000 crore for the last two years of the TenthPlan period ending March 2007. During the EleventhPlan, 341 projects covering 46,141 un-electrifiedcensus villages, 2,37,981 partially electrified censusvillages, and free connections to 152.11 lakh BPLhouseholds were sanctioned. The revised cost ofthese projects is ` 20,906 crore. During 2011-12,an additional 72 projects covering 1,909 un-electrifiedcensus villages, 53,505 partially electrified censusvillages, and free connections to 45.59 lakh BPLhouseholds were sanctioned with a revised cost of` 8,103 crore. As on 30 November 2012,electrification works in 1,06,116 un-electrified villagesand intensive electrification in 2,73,328 partiallyelectrified villages have been completed and freeelectricity connections to 202.60 lakh BPLhouseholds have been released. Capital subsidy of` 26,664 crore has so far been utilized under thescheme.
PETROLEUM
11.20 In order to meet the burgeoning demand forpetroleum products in the country, the governmenthas taken several measures to enhance exploration
http://indiabudget.nic.in

238 Economic Survey 2012-13
and exploitation of petroleum resources includingnatural gas and coal bed methane (CBM), apart fromimproved distribution, marketing, and pricing ofpetroleum products. During financial year 2011-12,crude oil production was 38.09 million metric tonnes(MMT), with the share of national oil companies at72.4 per cent. The projected crude oil production in2012-13 is 42.31 MMT which is about 11.1 per centhigher than that in 2011-12. The increase inproduction is expected mainly on account of highercrude oil production from Barmer Fields, Rajasthan.Crude oil production by Cairn Energy India Pvt. Ltd.in Rajasthan started with effect from 29 August 2009and reached 5.77 MMT during April-November 2012against 4.26 MMT during the same period of 2011-12. Overall crude oil production during April-November 2012-13 at 25.39 MMT, however, showsa negative growth of 0.54 per cent over the sameperiod of the previous year.
11.21 The average natural gas production in theyear 2011-12 was 130 million metric standard cubicmetre per day (MMSCMD) which was about 9 percent lower than the previous year mainly due to lowerproduction from the KG D6 deep-water block. Theprojected natural gas production in 2012-13 is about117.8 MMSCMD, which is about 9 per cent lowerthan production in the previous year. Natural Gasproduction during April- November 2012-13 was28.05 billion cubic metre (BCM) as compared to32.28 BCM during the same period of the previousyear.
Exploration of Domestic Oil and Gas11.22 The NELP was adopted in 1999. India hasan estimated sedimentary area of 3.14 million sq.km, comprising 26 sedimentary basins. Prior toadoption of the NELP, only 11 per cent of Indiansedimentary basins were under exploration. Sincethe operationalization of the NELP in 1999, thegovernment has awarded an area of 47.3 per cent ofIndian sedimentary basin for exploration. So far, 117oil and gas discoveries have been made in 39 NELPblocks. As on April 2012, about 737 MMT of oilequivalent hydrocarbon reserves have been addedunder the NELP. The investment made by Indianand foreign companies until April 2012 was of theorder of US$ 20.2 billion, of which US $12.1 billionwas on hydrocarbon exploration and US$ 8.1 billionon development of discoveries. With a view to furtheraccelerating the pace of exploration, in the ninthround of the NELP (NELP-IX), 34 exploration blocks
were offered. These include 8 deep-water blocks, 7shallow-water blocks, 11 on-land blocks, and 8Type-S on-land blocks. Nineteen production-sharingcontracts have already been signed with theawardees. A total of 254 production-sharing contractshave been signed under the NELP so far.
Domestic Exploration of other Gaseous FuelCBM
11.23 India has the fourth largest proven coalreserves in the world and holds significant prospectsfor exploration and exploitation of CBM. Under theCBM policy, 33 exploration blocks have beenawarded in Andhra Pradesh, Assam, Chhattisgarh,Gujarat, Jharkhand, Madhya Pradesh, Maharashtra,Orissa, Rajasthan, Tamil Nadu, and West Bengal.Out of the total available coal-bearing area of 26,000sq. km for CBM exploration in the country,exploration has been initiated in about 17,000 sq.km. The estimated CBM resources in the countryare about 92 trillion cubic feet (TCF), out of whichonly 8.92 TCF has so far been established.Commercial production of CBM in India has nowbecome a reality with current production of about0.28 MMSCMD.
Shale Gas
11.24 Shale Gas can emerge as an important newsource of energy in the country. India has severalshale formations which seem to hold shale gas.The shale gas formations are spread over severalsedimentary basins such as Cambay, Gondwana,Krishna-Godawari on-land, and Cauvery. The DirectorGeneral Hydrocarbans (DGH) has initiated steps toidentify prospective areas for shale gas exploration.A multi-organizational team (MOT) of the DGH, Oiland Natural Gas Corporation (ONGC), Oil IndiaLimited (OIL), Gas Authority of India Limited (GAIL)has been formed by the government to examine theexisting data set and suggest a methodology forshale gas development in India. Further, amemorandum of agreement (MoU) between theDepartment of State, USA and Ministry of Petroleumand Natural Gas has been signed for assessmentof shale gas resources in India, imparting trainingto Indian geo-scientists and engineers, andassistance in the formulation of regulatory frameworks.A draft Shale Oil /Gas Policy was placed in the publicdomain by the government for inviting comments. Theviews/comments received from various stakeholders/agencies are under examination.
http://indiabudget.nic.in

239Energy, Infrastructure and Communications
Equity Oil and Gas from abroad11.25 In view of an unfavourable demand-supplyratio of hydrocarbons in the country, acquiring equityoil and gas assets overseas is an important strategyfor enhancing energy security. The government isencouraging national oil companies to aggressivelypursue equity oil and gas opportunities overseas.ONGC Videsh Limited (OVL) has produced about8.753MMT of oil and equivalent gas during the year2011-12 from its assets abroad in Sudan, Vietnam,Venezuela, Russia, Syria, Brazil, South Sudan, andColombia. The estimated crude oil and natural gasproduction in 2012-13 is about 6.865 MMT. Thereasons for lower overseas production aregeopolitical problems in South Sudan and Syria.Oil public-sector units (PSU), viz. OVL, India OilCorporation (IOC), OIL, Bharat PetroleumCorporation Limited (BPCL), Hindustan PetroleumCorporation Limited (HPCL), and GAIL have acquiredexploration and production (E&P) assets in morethan 20 countries.
Refining Capacity11.26 The total refining capacity in the countryincreased from 187.4 MMT (as on 1.4.2011) to 215.1MMT (as on 1.1.2013) and is projected to reach218.4 MMT by the end of 2012-13 and 239.6 MMTin 2013-14 with capacity augmentation of existingrefineries and commissioning of the Paradip Refinery.Refinery production (crude throughput) during 2011-12 was 211.4 MMT (including the Jamnagar Refineryunder special economic zone [SEZ] by RelianceIndustry Ltd.) showing an increase of 2.6 per centcompared to a production of 206.15 MMT in 2010-11. During the current financial year (April-November2012-13), refinery production (crude throughput) is141.45 MMT. The country is not only self- sufficientin refining capacity for its domestic consumptionbut also substantially exports petroleum products.During 2011-12, the country exported 60.84 MMT ofpetroleum products worth ̀ 2,66,486 crore.
Pipeline Network and City Gas Distribution11.27 There has been substantial increase in thepipelines network in the country with 32 productpipelines with a length of 11,274 km and capacity of70.688 MMT at present. There are also 16 crudepipelines spreading over 8,558 km with capacity of106.45 MMT. In addition, there are LPG pipelines of2,313 km with 3.94 MMT capacity and gas pipelinesof 13,428 km with 355MMSCMD capacity. The gas
pipeline infrastructure is being augmented with about14,889 km of pipeline network with additionalcapacity to transport 264 MMSCMD of gas by 2015-16. In addition, around 4,300 km of pipeline networkhas been authorized by the Petroleum and NaturalGas Regulatory Board (PNGRB) which will furtheradd capacity to transport 184 MMSCMD of gas.
11.28 With increased availability of gas in thecountry, the city gas distribution (CGD) network hasbeen enlarged to cover various cities supplying gasfor domestic consumers, public transport, andcommercial/ industrial entities. At present, there area total of 588 compressed natural gas (CNG)stations across the country. Vision- 2015 envisagesproviding piped natural gas (PNG) to more than 200cities across the country. The current consumptionof gas in the CGD network is around 14 MMSCMD,of which 6.63 MMSCMD is from regasified liquefiednatural gas (RLNG). At present, there are a numberof entities operating in 43 geographical areas (GAs).The PNGRB has recently invited bids forauthorization of CGD in these cities. The CGD sectorcomprises CNG and PNG customers. The PNGRBhas envisaged a rollout plan of CGD networkdevelopment through competitive bidding in morethan 300 possible GAs on the basis of expressionsof interest (EOI) submitted to the Board.
Rajiv Gandhi Gramin LPG Vitaran Yojna11.29 The 'Vision-2015' adopted for the LPG sectorinter alia focuses on raising the LPG populationcoverage in rural areas and areas where LPGcoverage is low. The Rajiv Gandhi Gramin LPGVitaran Yojana (RGGLVY) for small-size LPGdistribution agencies has been launched in 2009.Under this scheme 75 per cent population is to becovered by 2015 by releasing 5.5 crore new LPGconnections. To ensure that growth of LPG usageis evenly spread, public-sector oil marketingcompanies (OMCs) are assessing/identifyinglocations in a phased manner under the RGGLVY.OMCs have undertaken to set up 5,261 LPGdistributors in 29 states. Out of this 1,591 LPGdistributors had already been commissioned as onNovember 1, 2012. Selection for the rest of thelocations is in progress as per policy.
Direct Transfer of Cash- LPG Scheme11.30 In order to check leakages, adulteration, andinefficiency resulting from the current system ofdelivery of subsidized products, the Government of
http://indiabudget.nic.in

240 Economic Survey 2012-13
India set up a task force for evolving a suitablemechanism for direct transfer of subsidies toindividuals/families, who are entitled to subsidizedkerosene, LPG, and fertilizers. A pilot project waslaunched at Mysore. So far details of 35,000customers have been collected. Of these, nearly18,000 have authenticated Aadhaar numbers. Ason 25 November 2012, OMCs had completed morethan 35,000 successful biometric-authenticateddeliveries. Modalities on subsidy payment as tokenamount (` 10) have been finalized with sponsor bankand participating banks using the Aadhaar PaymentBridge. It has now been decided to close the MysorePilot Project as Mysore is one of the 51 districtsselected for roll-out under the wider direct benefittransfer scheme.
COAL11.31 The production of coal was estimated at 540MT in 2011-12. The production of raw coal duringApril-December 2012 was estimated to be 384.1MT (including coking grade coal of 35.3 MT)compared to 359.6 MT (including 33.2 MT of cokinggrade coal) during the corresponding period of theprevious year. Domestic production however wasinadequate and had to be supplemented with importsof 102.85 MT in 2012-13 (up to December 2012).Coal is largely sold through a notified price. At thesame time, under the e-auction system (whichenables price discovery through a market-basedprocess), Coal India Ltd. (CIL) and SingareniCollieries Company Limited (SCCL) sold 57.27 MTand 2.91 MT of coal (spot and forward) respectivelyin 2011-12. During April-December 2012, CIL sold33.84 MT of coal through e-auction at an averageprice which was 48.65 per cent above the notifiedprice. Average e-auction price was nearly 80 percent higher than the notified price for SCCL for its2.61 MT of coal sales through e-auction.
11.32 During the Twelfth Plan period, the demandfor coal is projected to reach 980 MT, whereasdomestic production is expected to touch 795 MTin the terminal year (2016-17). Even though thedemand gap will need to be met through imports,domestic coal production will also need to grow atan average rate of 8 per cent compared to about 4.6per cent in the Eleventh Five Year Plan. It isenvisaged that even as public-sector companies,particularly the CIL will continue to play a majorrole in achieving the domestic coal-productiontargets, investment by the private sector including
investment in new coal blocks for captive end userswill be necessary.
11.33 In order to achieve the necessary impetus,the focus is on addressing both the short-runconstraints on mining and evacuation of coal as alsoon long-term measures for enhancing productioncapacity. As an immediate measure, the governmenthas issued specific guidelines for grantingenvironment clearance for one-time productioncapacity expansion of up to 25 per cent in existingmines. In order to attract greater investment in coalmining, the pace of exploration and drilling will needto be scaled up. Apart from emphasis on coalproduction, efforts are also under way to increasethe capacity for coal washing, CBD, undergroundcoal gasification, and clean coal technologies. Thepositive aspect of the large investment requirementsin the coal sector is the spin-off effects that it wouldhave on associated sectors such as equipmentmanufacturing, supply, maintenance, project design,and execution.
TRANSPORT SECTORS
Railways11.34 The Twelfth Five Year Plan (2012-2017) hasenvisaged an integrated approach for the transportsector as a whole. The vision for transport is to beguided by a modal mix that will lead to an efficient,sustainable, economical, safe, reliable, environment-friendly, and regionally balanced transport system.In line with the objectives of the Plan, IndianRailways aims at developing a strategy to build upthe rail network to be part of an effective multi-modaltransport system.
Freight Performance of the Indian Railways
11.35 Freight loading by Indian Railways duringthe fiscal 2011-12 increased to 969.1 MMT against921.7 MMT in 2010-11, registering an increase of5.1 per cent. The freight traffic target for the year2012-13 was fixed at 1,025 MMT (Budget Estimates[BE]). During April-November 2012, Indian Railwayscarried 647.1 MMT of revenue-earning freight traffic(an increase of 4.7 per cent) compared to 618.05MMT carried during the corresponding period of theprevious year. The moderate growth in freight trafficmay be attributed not only to the overall slowdownin the economy but also to other factors like a banon iron ore exports from Karnataka and reducedimports of fertilizers.
http://indiabudget.nic.in

241Energy, Infrastructure and Communications
Rationalization of Railway Freight andPassenger Fare11.36 While Indian Railways' input costs increasedby 10.6 per cent per annum between 2004-5 and2010-11, passenger fares remained unchanged orwere even reduced in lower classes therebyconstraining internal resource generation, essentialfor replacement /renewal of assets, operation andmaintenance activities, and critical safety andpassenger amenity works. Further, cross-subsidythrough the freight business was no longer viabledue to fast evolving competition from other modesof transport. Keeping these factors in mind, anincrease in passenger fares was announced on9 January 2013, effective from the midnight of21-22 January 2013. While second class ordinary(suburban) fares were raised by 2 paise per km,second class ordinary (non-suburban) fares wereincreased by 3 paise per km and second class (mail/express) fares by 4 paise per km. For the sleeperclass the increase was 6 paise per km; For ACchair car, AC 3-tier, and AC first class, fares werehiked by 10 paise per km, while for first class andAC 2-tier, the increase was 3 paise and 6 paise perkm respectively. A rationalized freight tariff structurewas also brought into effect from 6 March 2012.
Upgradation of Passenger Amenities11.37 The Adarsh stations scheme was introducedin 2009. Adarsh stations are provided with basicfacilities such as drinking water, functioning toilets,catering services, waiting rooms and dormitoriesespecially for lady passengers, and better signage.A total of 976 stations have been identified fordevelopment as Adarsh stations, of which 616 haveso far been developed. The ComputerisedUnreserved Ticketing System (UTS) was madeavailable at 5,560 locations with 10,172 countersby end-November 2012. About 250 additionalautomatic ticket-vending machines (ATVMs) werecommissioned during 2012-13 taking the total tallyof installed ATVMs to 808. The Freight OperationInformation System (FOIS) gives an account of alldemands, number of loads/rakes/trains and theirpipelines, freight locos, and stock at aggregate level.The Rake Management System (RMS) module ofFOIS has been implemented at 246 locations and itcovers all major yards/lobbies and control offices atvarious divisions and zones of Indian Railways. Box11.2 discusses the Dedicated Freight CorridorProject initiative of Indian Railways.
New Initiatives by Indian Railways Kisan Vision Project: To encourage setting up
of cold storage and temperature-controlledperishable cargo centres through PPP mode,
Box 11. 2 : Dedicated Freight Corridor Project
The Eastern and Western Dedicated Freight Corridors (DFC) are a mega rail transport project being undertaken to increasetransportation capacity, reduce unit costs of transportation, and improve service quality. The Eastern DFC (1839 routekilometres [RKM]) extends from Dankuni near Kolkata to Ludhiana in Punjab, while the Western DFC (1499 RKM)extends from the Jawahar Lal Nehru Port (JNPT) in Mumbai to Dadri /Rewari near Delhi. A special purpose vehicle, theDedicated Freight Corridor Corporation of India Limited has been set up to implement the project. Out of 10,703 ha ofland to be acquired for the project, 7,768 ha (73 per cent) has already been awarded under the Railway Amendment Act(RAA) 2008. The Eastern and Western DFC projects are being funded through a mix of bilateral/multilateral loans, grossbudgetary support (GBS), and PPP. The Western DFC is being funded by the Japan International Cooperation Agency(JICA) up to 77 per cent of the total cost. Funding has been tied up and award of civil contract of 900 km is in process. Theremaining portion of the project construction cost will be borne by the Ministry of Railways as equity funding. TheLudhiana to Mughalsarai section (1183 km) of the Eastern DFC is being funded by the World Bank up to 66 per cent of theproject cost. Funding for the first sector, viz. Khurja-Kanpur (343 km), has been tied up and award of civil contract is underway. Funding tie up with the World Bank for the remaining sectors is also in process. The Mughalsarai-Sonnagar sector(122 km) will be funded by Indian Railways' own resources. Civil construction work of this sector is in progress. TheDankuni-Sonnagar section (534 km) of the Eastern DFC will be implemented through PPP mode.
Apart from the Eastern and Western DFCs, a feasibility study has also been undertaken on four future freight corridors,viz. East-West Corridor (Kolkata-Mumbai), North-South Corridor (Delhi-Chennai), East Coast Corridor (Kharagpur-Vijayawada) and Southern Corridor (Goa-Chennai). A pre-feasibility study of the Chennai-Bangalore Freight Corridor isalso being proposed. After commissioning of the Eastern and Western DFCs, it is planned to upgrade the speed ofpassenger trains to 160-200 kmph on the existing routes. A feasibility study for upgradation of speed of passenger trainsto 160-200 kmph on the existing Delhi-Mumbai route has been undertaken with co-operation from the Government ofJapan in 2012-13.
http://indiabudget.nic.in

242 Economic Survey 2012-13
logistics based PSUs including the ContainerCorporation of India Limited, CentralWarehousing Corporation, and Central Rail-sideWarehouse Company Limited have been askedto provide infrastructure at six Indian Railwayslocations under a pilot project--the Kisan VisionProject. Of the six locations, so far Singur (WestBengal) and Nasik (Ojhar in Maharashtra) arein operation, while New Jalpaiguri (West Bengal),Dankuni (West Bengal), and New Azadpur(Adarsh Nagar, Delhi) are under process andwill shortly be completed. Macheda (WestBengal) being not a remunerative project, wasnot found to be a potential location for settingup a perishable cargo shed.
High-speed passenger trains: Indian Railwaysis adopting a multi-pronged strategy to providesafer, faster, cleaner, and more comfortablepassenger trains. Seven corridors have beenidentified for conducting pre-feasibility studiesfor running high-speed trains (popularly referredto as bullet trains) at speeds above 350 kmph.These corridors will be set up through PPProute. Initially, the Mumbai-Ahmedabad corridorhas been taken up for which the pre-feasibilitystudy has been completed. Work is in progressin respect of the remaining corridors. A study isalso being done on the Delhi-Mumbai route forraising the speed of passenger trains from 160kmph to 200 kmph, i.e. for running semi-highspeed trains.
Induction of LHB Coaches: Linke HolfmannBusch (LHB) coaches are being inducted intrain services including existing and certainimportant Rajdhani and mail/express trains.Till December 2012, LHB coaches had beeninducted in about 14 Rajdhani, 12 Shatabdi,and 11 AC Duronto services. LHB coacheshave higher carrying capacity, better ridingcomfort, higher-speed potential, longer life,upgraded amenities, provision of controldischarge toilet system, lower maintenancerequirement, enhanced safety features, andaesthetic interiors. A rail coach factory atPalakkad has been sanctioned in PPP modefor production of such coaches.
Introduction of bio-toilets: With a commitmentto providing hygienic environment to itspassengers and staff, Indian Railways along withthe Defence Research and DevelopmentOrganization (DRDO) has developed
environment-friendly bio-toilets for its passengercoaches. Eight trains are running with 436 bio-toilets. A complete switch-over to bio-toilets innew coaches has been planned by 2016-17 andIndian Railways has targeted elimination of directdischarge passenger coach toilet systems bythe end of the Thirteenth Five Year Plan(2021-22).
Roads11.38 National Highway Development Projects: Asof now about 24 per cent of the total length ofNational Highways (NHs) is single lane/intermediatelane, about 51 per cent is two-lane standard, andthe balance 25 per cent is four-lane standard or more.In 2012-13, the achievement under various phasesof the National Highways Development Project(NHDP) up to December 2012 has been about 1,605km and projects have been awarded for a total lengthof about 878 km (Table 11.7).
Financing of NHDP
11.39 A part of the fuel cess imposed on petroland diesel is allocated to the National HighwaysAuthority of India (NHAI) for funding the NHDP. TheNHAI leverages the cess resources to borrowadditional funds from the debt market. Till date, suchborrowings have been limited to funds raised through54 EC (capital gains tax exemption) bonds, tax-free bonds, and short-term overdraft facility. Thegovernment has also taken loans for financingprojects under the NHDP from the World Bank (US$1965 million), Asian Development Bank (ADB) (US$1605 million), and Japan Bank for InternationalCooperation (32,060 million yen) which are passedon to the NHAI partly in the form of grants and partlyas loan. The NHAI has also taken a direct loan ofUS$ 149.78 million from the ADB for the ManorExpressway Project (Table 11.8). Initiatives takenby the NHAI for speeding up the roads programmeare summarized in Box 11.3.
Development of Roads in Left WingExtremism)-affected areas
11.40 The government on 26 February 2009approved the Road Requirement Plan (RRP) forupgrading of 1,126 km NHs and 4351 km state roads(total 5,477 km) to two-lane at a cost of ` 7,300crore in 34 districts affected by left-wing extremism(LWE) in Andhra Pradesh, Bihar, Chhattisgarh,Jharkhand, Madhya Pradesh, Maharashtra, Odisha,
http://indiabudget.nic.in

243Energy, Infrastructure and Communications
and Uttar Pradesh for inclusive growth of theseareas. The Ministry of Road Transport & Highways(MoRT&H) entrusted with the responsibility ofdeveloping these roads, has set up a LWE divisionunder the Chief Engineer for sanctioning andimplementing the above programme throughrespective PWDs. Detailed estimates for 5,419km length have been sanctioned at an estimatedcost of ` 7,699 crore and works on 5,049 km
length costing ̀ 6,853 crore have been awarded.Development of 1,960 km length had beencompleted up to December 2012 with a cumulativeexpenditure of ̀ 2,494 crore incurred so far. Thedevelopment of roads under the programme isscheduled to be completed by March 2015. RRP-II covering a length of 5,624 km at an estimatedcost of ` 9,400 crore is under consideration ofthe government.
Table 11.7 : NHDP Projects as on December 2012Sl. NHDP Total Completed Under Balance forNo. components Length 4/6 Lane implementation Award of
km) (km) Civil Work (km)Length No. of
(km) Contracts
1 GQ 5846 5846 0 8 -
2 NS-EW 7142 6053 722 59 3673 Port Connectivity 380 368 12 3 04 Other NHs 1390 964 406 4 205 SARDP-NE 388 49 63 2 2766 NHDP Phase III 12109 4602 5734 90 17737 NHDP Phase IV 20000 62 4300 31 156388 NHDP Phase V 6500 1276 2804 28 24209 NHDP Phase VI 1000 - - - 1000
10 NHDP Phase VII 700 19 22 2 65911 NH 34 5.5 - 5.5 1 -
Total 55460.5 19239 14068.5 228 22153Source : Ministry of Road Transport and Highways (MoRT&H).Notes : GQ—Golden Quadrilateral connecting Delhi, Mumbai, Chennai, and Kolkata; NS-EW—North-South andEast-West corridor; SARDP-NE—Special Accelerated Road Development Programme in the North-Eastern Region.
Table 11.8 : Financial Structure of NHAI (` ` ` ` ` crore)Year Cess Fund External assistance Ploughing Borrowings Budgetary
Grant Loan back of funds 54-EC Supportdeposited by Bonds
NHAI in CFI
2005-06 3269.70 2350.00 600.00 1289.00 802.002006-07 6407.45 1582.50 395.50 1500.00 570.672007-08 6541.06 1776.00 444.00 305.18 559.002008-09 6972.47 1515.00 378.80 1630.74 159.002009-10 7404.70 272.00 68.00 1153.63 200.002010-11 8440.94 320.00 80.00 1623.00 2160.10 843.002011-12 6187.00 - - 2692.89 12511.52# 1212.212012-13* 6003.00 1777.00 1868.85 550.00
Source : MoRT&H.Notes : #including tax-free bonds of `̀̀̀̀ 10,000 crore;* up to December 2012; CFI—Construction Federation of India.
http://indiabudget.nic.in

244 Economic Survey 2012-13
Prime Minister's Reconstruction Plan forJ&K11.41 The Hon'ble Prime Minister announced aReconstruction Plan (PMRP) for Jammu andKashmir during his visit to the state on 17 and 18November 2004. Construction of Mughal Road,widening of Domel-Katra road (NH-1C), double-laningof Batote-Kishtwar-Sinthanpass-Anantnag Road(NH-1B), upgrading of Srinagar-Uri Road (NH-1A),construction of Khanabal--Pahalgam Road,construction of Narbal-Aangmarg Road and double-laning of Srinagar-Kargil-Leh Road (NH-1D) are theseven works under this project amounting to ̀ 3,300crore. An expenditure of around ̀ 2,708 crore hasalready been incurred. Besides, ̀ 178.6 crore hasbeen allocated to the State of J&K for work beingexecuted on NHs through the BRO. Under theCentral Road Fund (CRF) another ` 113.58 crorehas been allocated for work on state and otherdistrict roads (ODR).
Civil Aviation
Air Passenger and Cargo Traffic
11.42 Domestic passenger traffic handled atIndian airports reached 106 million during Januaryto November 2012. This is marginally lower thanthe domestic passenger traffic throughput of 108mil l ion for the same period during 2011.International passenger traffic handled at Indianairports was placed at 37.8 million during January-November 2012 as against 36.20 million duringthe corresponding period of the previous year.International cargo throughput at Indian airportsduring January-November 2012 was 1.30 MMT ascompared to 1.37 MMT during the previous year.Domestic cargo throughput during January-November 2012 stood at 0.73 MMT, almost thesame as in the corresponding period of theprevious year.
Box 11. 3 : Initiatives taken by the Government to expedite projects under NHDP The NHAI Board has approved formation of a High Level Expert Settlement Advisory Committee for one-time
settlement of old cases pending in courts. The claims shall be resolved as one-time settlement and strategy would varybased on commonality of issues across contracts or could be based on optimum settlement with firms or groups withsignificant stakes collectively through appraisal of merits, risks, and settlement through stages of negotiations.
As a new initiative for promoting highway development, the mode of engineering procurement and construction(EPC) contracts is being brought in. Projects that are not viable under BOT (toll) mode, such as those in far-flung areas,would have to be undertaken under EPC mode. To overcome the economic slowdown in this sector, the MoRT&H hasfinalized a proposal for awarding projects under new modified turnkey EPC mode under 100 per cent governmentfunding in cases where there are no takers under BOT (toll) mode. This mode of delivery will also take care of cost andtime overruns.
In order to remove the bottlenecks and ensure seamless movement of traffic and collection of toll as per the notifiedrates, the government had decided to introduce passive radio frequency identification (RFID) based on electronic tollcollection.
In order to relax the condition of mandatory environment clearance (EC) for areas less than 5 hectare, the Ministry ofEnvironment and Forests (MoEF) has been requested not to insist on EC for the earth/soil because all highway projectscommence only after obtaining necessary environment clearance for the project whereby the conditions stipulated bythe MoEF for borrow areas are adhered to by the concessionaires.
The NHAI has recently taken up award of select highway projects to private-sector players under an operate,maintain, and transfer (OMT) concession. Till recently the tasks of toll collection and highway maintenance wereentrusted to tolling agents/ operators and subcontractors, respectively.
State governments have been requested to constitute high-level committees under their Chief Secretaries (as NodalOfficers) with the NHAI's Regional Officer as Member-Secretary, for monitoring pre-construction activities for NHAIprojects. Most states have constituted the committees.
In order to speed up the implementation of projects mandated to the NHAI by the government and for ensuring better andcloser liaison with the state governments for expediting the pre-construction activities of the projects, it was decided toestablish 17 Regional Offices headed by Chief General Managers CGMs at various locations in the country. Substantialfinancial powers have been delegated to Regional Officers for facilitating speedy processing/approvals for acquisition ofland.
http://indiabudget.nic.in

245Energy, Infrastructure and Communications
Air India
11.43 The Government of India approved a TurnAround Plan (TAP) and a Financial RestructuringPlan (FRP) for improving the operational and financialperformance of Air India (AI) in April 2012. Thecompany has taken several initiatives towards costcutting and revenue enhancement during the year2011-12, covering route rationalization, phasing outand grounding of old fleet, freezing of employmentin non-operational areas, leveraging assets of thecompany to increase MRO (maintenance, repair,and overhaul) revenue and revenue from thecompany's real estate properties. The TAP alsoincluded operationalization of subsidiary companiesin ground handling and MRO and transfer ofmanpower and equipment so that these could betreated as independent profit centres. An OversightCommittee in the Ministry of Civil Aviation has beenconstituted to closely monitor the performance ofAI vis-à-vis milestones set in the TAP. For the firsthalf of the year, performance has been in line withthe target set in the TAP. AI has registered an all-round enhanced performance such as on-timeperformance at 85 per cent, passenger load factorat 70.9 per cent, and yield at ` 4.31 per revenuepassenger kilometre. It is expected that thecompany will achieve positive EBIDTA (earningsbefore income, taxes, depreciation andAmoritization) in the results for the Financial Year2012-13.
Airport Infrastructure
11.44 The Airports Authority of India (AAI) is a majorairport operator managing 125 airports across thecountry and also entrusted with the sovereignfunction of providing air traffic services in India. To
enhance airport infrastructure in India, modernizationof existing airport infrastructure in metro and non-metro cities and construction of greenfield airportswere contemplated. The Twelfth Five Year Plan(2012-17) envisages an investment of ̀ 65,000 croreat Indian airports, of which a contribution of about` 50,000 crore is expected from the private sector.The AAI has completed expansion and upgradationof two metro airports at Kolkata and Chennai at thecost of ̀ 2,325 crore and ̀ 2,015 crore respectively.In addition, restructuring and modernization of Delhiand Mumbai airports has also been undertaken at acost of about ` 25,000 crore with state-of-the-artfacilities. Expansion of Bangalore InternationalAirport Ltd. (BIAL) has been undertaken at anestimated cost of ` 1,479 crore.
11.45 Development of 35 selected non-metroairports has been undertaken by the AAI which havebeen identified based on regional connectivity,development of regional hubs, places of major touristattraction, and potential for development as businesshubs. Projects at 28 airports have been completed.
Ports11.46 Cargo Traffic at Indian Ports: During the firsthalf (April-September) of 2012-13 major and non-major ports in India accomplished a total cargothroughput of 455.8 million tonnes reflecting anincrease of only 1.8 per cent over the same periodof 2011-12. This is mainly attributable to a declineof 3.3 per cent in the cargo handled at major ports.In contrast, non-major ports' growth increased to10.3 per cent in the first half of 2012-13 comparedto 8.2 per cent in the corresponding period of 2011-12 (Table 11.9). During first six months of 2012-13,Ennore port recorded the highest growth in traffic
Table 11.9 : Traffic Handled at Indian Ports (Thousand Tonnes)Major/Non- Traffic Handled Growth over previous year/periodMajor Ports 2010-11 2011-12 April-September 2010-11 2011-12 April-September 2011-12 2012-13 2011-12 2012-13
(P)
Major Ports 570086 560134 279880 270561 1.6 -1.7 3.2 -3.3 (64.4) (61.4) (62.5) (59.4)Non-Major Ports 315358 351545 167969 185206 9.1 11.5 8..2 10.3 (35.6) (38.6) (37.5) (40.6)All Ports 885444 911679 447849 455767 4.2 3.0 5.0 1.8 (100) (100) (100) (100)
Source : Indian Ports AssociationNote : Figures within parenthesis indicate percent share in total cargo traffic for Major and Non Majorports respectively. (P) : Provisional
http://indiabudget.nic.in

246 Economic Survey 2012-13
(22.5 per cent) followed by Mumbai (8.0 per cent),Kandla (7.5 per cent), NMPT (4.3 per cent) andCochin Port (3.9 per cent). Negative traffic handlingwas reported by Mormugao (-22.9 per cent) HaldiaDock Complex (HDC) (-17.9 per cent),Vishakhapatnam (-16.0 per cent), Paradip (-8.5 percent), Chennai Port (-7.3 per cent) and Kolkata DockSystem (KDS) (-7.8 per cent).11.47 Commodity-wise Cargo Traffic at MajorPorts : At a broad commodity level, during the firstsix months of 2012-13, coal, container cargo, othercargo, and petroleum oil and lubricant (POL) trafficposted growth of 3.8 per cent, 2.7 per cent, 2.4 percent and 0.5 per cent respectively. The traffic in ironore was affected during April-September 2012,recording a negative growth of 43.1 per cent primarilydue to ban on mining of iron ore. Fertilizer and FRMtraffic during April-September 2012 also declined by5.2 per cent over the corresponding period of theprevious year. In terms of the composition of cargotraffic handled at major ports during April-September2012, the largest commodity group (in terms ofpercentage share in total cargo handled) was POL(34 per cent) followed by container traffic (22 percent), other cargo (19 per cent) and coal (15 percent). Total container traffic at major ports increasedboth in terms of tonnes and twenty foot equivalentunits [TEUs] by 2.7 per cent and 1.3 per centrespectively during April-September 2012 andJawahar Lal Nehru Port (JNPT) emerged as theleading container-handling port with a 48 per centshare in terms of tonnage and 55 per cent in termsof TEUs.
TELECOMMUNICATION
11.48 The telecom sector has been one of thefastest growing sectors in recent years. It is nowthe second largest telephone network in the world,after only China. A series of reform measures bythe government, wireless technology, and activeparticipation by the private sector played animportant role in the exponential growth of thetelecom sector in the country. Tele-density, whichshows the number of telephones per 100 persons,was 76.75 per cent at the end of October 2012.With the growth of mobile telephony due to easyaccess and affordability, the number of landlinetelephones has declined from 32.17 million as onend March 2012 to 30.95 million as on 31 October2012. Wireless telephones now account for 96.7per cent of all telephones. The share of the privatesector, in terms of number of subscribers, hasincreased from 86.3 per cent to 86.6 per cent duringthe period from April to June 2012 and is currentlyplaced at 86.1 per cent (end- October 2012)(Table 11.10). Broad features of the National TelecomPolicy-2012 (NTP-2012) are summarized inBox 11.4.
11.49 Since the announcement of the BroadbandPolicy in 2004, several measures have been takento promote broadband penetration in the country.As a result, there were 22.86 million internetsubscribers including 13.79 million broadbandsubscribers at the end of March 2012. Broadbandsubscribers increased to 14.81 million by the end
Table 11.10 : Telephone Connections & Tele-densityAt the end of March (in million)
2010 2011 2012 As on 31st Oct. 12
Total telephones 621.28 846.33 951.35 935.18Landline telephones 36.96 34.73 32.17 30.95Wireless telephones 584.32 811.60 919.17 904.23Rural telephones 200.77 282.29 330.83 344.49Urban telephones 420.51 564.04 620.52 590.68Telephones of Private Sector ( % share) 515.41 720.32 821.08 805.21
(82.96%) (85.11%) (86.31%) (86.10%)Telephones of Public Sector( % share) 105.87 126.01 130.27 129.97
(17.04%) (14.89%) (13.69%) (13.90%)Rural tele-density in% 24.31 33.83 39.26 40.66Urban tele-density in % 119.45 156.93 169.17 159.15Overall tele-density in % 52.74 70.89 78.66 76.75
Source : Department of Telecom (DOT).
http://indiabudget.nic.in

247Energy, Infrastructure and Communications
of October 2012. Special efforts are being made toincrease the penetration of broadband, especiallyin rural and remote areas. The government hasapproved a project at a cost of ` 20,000 crore forcreating a National Optical Fiber Network (NOFN)which will provide broadband connectivity to 2.5 lakhgram panchayats for various applications like e-health, e-education, and e-governance. The projectis being funded under the Universal ServiceObligation Fund (USOF).
USOF11.50 With the objective of promoting ruraltelephony, the government formed a UniversalService Obligation Fund (USOF). Under the SharedMobile Infrastructure Scheme of USOF 7,310 towerswere set up by the end of November 2012 and 15,971base transceiver stations commissioned by serviceproviders at these towers for provisioning of mobileservices. Under another scheme for village publictelephones (VPTs), at the end of November 2012 atotal of 5,81,572 (97.97 per cent) villages had beencovered. VPTs are likely to be provided in theremaining inhabited revenue villages by March 2013through the ongoing USOF scheme for provision of
VPTs in newly identified uncovered villages as perCensus 2001.
11.51 For providing broadband connectivity to ruraland remote areas, the USOF signed an agreementwith Bharat Sanchar Nigam Limited on 20 January,2009 under the Rural Wireline Broadband Schemeto provide wire-line broadband connectivity (with aspeed of at least 512 kbps, always on) to rural andremote areas by leveraging the existing ruralexchanges infrastructure and copper wire-linenetwork. As on 31 August 2012, a total of3,91,245 broadband connections had been providedand 10,076 kiosks set up in rural and remoteareas.
URBAN INFRASTRUCTURE
Urban Infrastructure and Governance11.52 The Jawaharlal Nehru National UrbanRenewal Mission (JNNURM) was launched by theMinistry of Urban Development for a seven-yearperiod (i.e. up to March 2012) to encourage citiesto initiate steps for bringing improvements in aphased manner in their civic service levels. Thegovernment has extended the tenure of the Mission
Box 11.4 : NTP-2012The Government approved National Telecom Policy (NTP) 2012, which addresses the vision, strategic direction, and thevarious medium- and long-term issues related to the telecom sector, on 31 May 2012. NTP-2012 is aimed at maximizingpublic good by making affordable, reliable, and secure telecommunication and broadband services available across thecountry. The objectives of NTP-2012 include the following: Provide secure, affordable, and high-quality telecommunication services to all citizens. Strive to create One Nation-One Licence across services and service areas. Achieve One Nation-Full Mobile Number Portability and work towards One Nation-Free Roaming. Increase rural tele-density from the current level of around 39 to 70 by the year 2017 and 100 by the year 2020. Recognize telecom, including broadband connectivity, as a basic necessity like education and health and work towards
'Right to Broadband'. Provide affordable and reliable broadband-on-demand by the year 2015 and to achieve 175 million broadband
connections by the year 2017 and 600 million by the year 2020 at minimum 2 Mbps download speed and makeavailable higher speeds of at least 100 Mbps on demand.
Provide high-speed and high-quality broadband access to all village panchayats through a combination of technologiesby the year 2014 and progressively to all villages and habitations by 2020.
Recognize telecom as an infrastructure sector to realize the true potential of information communication technology(ICT) for development
Address right-of-way (RoW) issues in setting up of telecom infrastructure. Mandate an ecosystem for ensuring setting up of a common platform for interconnection of various networks for
providing non-exclusive and non-discriminatory access. Strive for enhanced and continued adoption of green policy in telecom and incentivize use of renewable resources for
sustainability Achieve substantial transition to the new Internet Protocol (IPv 6) in the country in a phased and time-bound manner
by 2020 and encourage an ecosystem for provision of a significantly large bouquet of services on the IP platform.
http://indiabudget.nic.in

248 Economic Survey 2012-13
for two years, i.e. from 1 April 2012 to 31 March2014. The components under the sub-mission UrbanInfrastructure and Governance (UIG) include urbanrenewal, water supply (including desalination plants),sanitation, sewerage and solid waste management,urban transport, development of heritage areas, andpreservation of water bodies. Revised allocation forthe UIG for the Mission period is ̀ 31,500 crore. Asum of ̀ 6,340 crore (BE) has been provided for theyear 2012-13. The JNNURM has also emphasizedthe implementation of three key mandatory pro-poorreforms to enhance the capacity of urban localbodies (ULBs):
Internal earmarking within local body budgetsfor basic services to the urban poor.
Earmarking of at least 20-25 per cent ofdeveloped land in all housing projects (bothpublic and private agencies) for the economicallyweaker sections (EWS)/ low income groups(LIG) category.
Implementation of a seven-point charter forprovisioning of seven basic entitlements/services.
11.53 All the selected 65 cities under the UIGcomponent of the JNNURM have preparedcomprehensive city development plans (CDPs),charting their long-term vision and goals in urbangovernance and development. These plans includeinvestment plans, with a focus on provision of city-wide urban services such as water supply, sanitation,drainage, and provision of basic services to the urbanpoor. During the Mission period, highest priority hasbeen accorded to water supply, sanitation, andstorm-water drainage sectors that directly benefitthe urban poor. As on December 2012, more than91 per cent of the seven-year additional centralassistance (ACA) allocation of ̀ 31,500 crore hadbeen committed.
11.54 A total of 551 projects (as on 31 December2012) have been sanctioned at an approved cost of` 61,772.9 crore for the listed 65 mission citiesacross 31 states/ union territories (UTs). The ACAcommitted for these projects including assistancefor the buses sanctioned under the second stimuluspackage is ` 30,689.7 crore. As on 31 December2012, a sum of ̀ 20,145.2 crore had been releasedas ACA. During April-December 2012 ̀ 1326.7 crorewas released as ACA for the projects sanctionedunder the JNNURM. Out of these 551 projects
approved under the UIG, 165 are reported to havebeen completed.
11.55 The JNNURM has also undertaken anexercise for assessment of finances andcreditworthiness of the Mission ULBs through aprocess of credit rating. This is intended to triggerthe process of leveraging debt for JNNURM projectsand provide a platform for the ULBs and financialinstitutions to engage on issues related to projectfinancing. Presently 65 ULBs in the Mission citieshave been assigned final ratings that have beenmade public. As a follow up, surveillance rating hasbeen initiated to affirm the rating and assessimprovements undertaken. So far, 62 ULBs haveundergone surveillance rating.
Urban Infrastructure Development Schemefor Small and Medium Towns11.56 The Urban Infrastructure DevelopmentScheme for Small and Medium Towns (UIDSSMT)is a sub-component of the JNNURM for developmentof infrastructure facilities in all towns and cities otherthan the 65 Mission cities covered under its UIGsub-mission. For obtaining assistance under theUIDSSMT, states and ULBs need to signmemorandums of agreement committing to theimplementation of the reforms. From its inceptionin December 2005 till December 2012, 807 projectsacross 672 towns and cities at a cost of `14,021crore had been sanctioned under the UIDSSMT.Committed ACA for the approved projects is` 11,358.3 crore, against which ̀ 9465.2 crore hadbeen released till 31 December 2012. 305 projectsare reported to have been completed.
Urban Transport11.57 Urban transport is one of the key elementsof urban infrastructure. In order to provide bettertransport, proposals for bus rapid transit system(BRTS) were approved for Ahmedabad, Bhopal,Indore, Jaipur, Pune-Pimpri-Chinchwad, Rajkot,Sutrat, Vijayawada, Vishakhapatnam, and Kolkataunder the JNNURM, covering a total length of 467.4km at an estimated cost of ` 5,211.6 crore withadmissible central financial assistance of ̀ 2,373.4crore. In addition, BRTS is also planned in NayaRaipur and Hubli-Dharwar with loan from the WorldBank. Purchase of 15,260 buses at a total costof ` 4,724 crore has been approved under thescheme, with admissible ACA amounting to
http://indiabudget.nic.in

249Energy, Infrastructure and Communications
` 2,092.1 crore. Till November 2012, more than12,620 modern intelligent transport system (ITS)-enabled low-floor and semi-low-floor buses havebeen delivered to the states/cities.
Metro Rail Projects
11.58 In order to give proper legal cover to metro/mono-rail projects, the Metro Railways AmendmentAct 2009 was brought into effect in September 2009,providing as umbrella 'statutory' safety cover formetro rail work in all the metro cities of India. TheAct has been extended to the National CapitalRegion, Bengaluru, Mumbai, Chennai, Hyderabad,Kochi, and Jaipur metropolitan areas. The BangaloreMetro Rail Project of 42.3 km length is targeted forcompletion by December 2013. The first leg of 7 kmhas already been commissioned on 20 October2011. The government had earlier approved theimplementation of the East-West Metro Corridor of14.67 km length in Kolkata by Kolkata Metro RailCorporation Ltd. (KMRCL). The project is targetedfor completion by 31 January 2015. The ChennaiMetro Rail Project of 46.5 km length by ChennaiMetro Rail Ltd. (CMRL) at a total estimated cost of` 14,600 crore is targeted for completion by31 March 2015. Recently the 103.5 km Phase III ofDelhi Metro at a total cost of ` 35,242 crore hasalso been approved and is targeted for completionby 2016. The metro extension to Faridabad has alsobeen sanctioned. In addition, the government hasalso approved the extension of Delhi Metro fromDwarka to Najafgarh (5 km), Yamuna Vihar to Shiv
Vihar (2.7 km), and Mundka to Bahadurgarh (11.50km) as part of Delhi Metro Phase III, this year. TheKochi Metro Rail Project of 25.6 km by Kochi MetroRail Limited (KMRL)at a completion cost of ̀ 5,181.8crore has also been approved. In addition, metrorail projects have been taken up in Mumbai on PPPbasis for Versova- Andheri-Ghatkopar (11.07 km) andCharkop to Mankhurd via Bandra (31.87 km) and inHyderabad (71.16 km) with viability gap funding(VGF) from the Government of India. Presently theGovernment of Rajasthan is implementing 7 km ofmetro rail with funding entirely from the stategovernment.
Credit flow to infrastructure sector11.59 The India Infrastructure Finance CompanyLimited (IIFCL) was set up in 2006 for providing long-term financing for infrastructure projects thattypically involve long gestation periods. The IIFCLprovides financial assistance up to 20 per cent ofthe project cost both through direct lending to projectcompanies and by refinancing banks and financialinstitutions. The IIFCL raises funds from bothdomestic and overseas markets on the strength ofgovernment guarantees. It has sanctioned loansaggregating ̀ 40,373 crore for 229 projects involvinga total investment of ̀ 3,52,047 crore and disbursed` 20,377 crore till 31 March 2012. The IIFCL isexpected to graduate in the Twelfth Plan from theexisting role of a normal lender to that of a catalystmobilizing additional resources for financing ofinfrastructure. This could be achieved by the IIFCL
Table 11.11 : Sectoral share and growth rate of credit- Infrastructure (` ` ` ` ` crore)2010-11 2011-12 2011-12 2012-13
Q1 Q2 Q3 Q4 Q1 Q2 Q3
Infrastructure 4640.08 5745.35 5477.70 5581.83 5832.68 6089.19 6218.46 6431.96 6799.16Power 2317.28 3031.76 2864.55 2965.78 3080.25 3216.48 3263.97 3536.92 3745.00Telecommunications 898.51 930.43 973.58 903.76 918.46 925.93 966.70 894.66 917.66Roads 818.37 1048.02 976.03 1023.90 1068.86 1123.29 1142.40 1204.62 1262.44Other Infrastructure 605.92 735.13 663.53 688.39 765.10 823.50 845.39 795.75 874.06Share Power 49.94 52.77 52.29 53.13 52.81 52.82 52.49 54.99 55.08Telecommunications 19.36 16.19 17.77 16.19 15.75 15.21 15.55 13.91 13.50Roads 17.64 18.24 17.82 18.34 18.33 18.45 18.37 18.73 18.57Other Infrastructure 13.06 12.80 12.11 12.33 13.12 13.52 13.59 12.37 12.86Growth rate Infrastructure 44.60 23.82 35.61 22.19 20.72 18.90 13.52 15.23 16.57Power 48.19 30.83 41.44 34.15 27.06 23.30 13.94 19.26 21.58Telecommunications 76.57 3.55 41.01 -5.55 -4.84 -5.67 -0.71 -1.01 -0.09Roads 33.27 28.06 29.42 29.26 28.99 25.00 17.04 17.65 18.11Other Infrastructure 16.05 21.32 16.50 13.17 24.69 30.25 27.41 15.60 14.24
Source : RBI
http://indiabudget.nic.in

250 Economic Survey 2012-13
providing guarantees for bonds issued by privateinfrastructure companies rather than expanding itsdirect lending operations. This would enablemobilization of insurance and pension funds,external debt, and household savings. The IIFCLwould also make subordinated debt available as anadditional source of finance. Further, it may alsosubstitute its take-out financing scheme with anInfrastructure Debt Fund.
11.60 The latest available data on grossdeployment of bank credit to major infrastructuresectors shows that the rate of growth of bank creditmoderated from an average of 35.61 per cent in Q1of 2011-12 to 13.52 per cent in Q1 of 2012-13, beforemarginally improving to 16.57 per cent in Q3 of thecurrent year. Within infrastructure, power had over50 per cent share in total credit flow to infrastructure.The rate of growth of this sector, after moderating to13.94 per cent in Q1 of 2012-13 improved to 21.58per cent in Q3. The telecom sector witnessedconsecutive decline in the last six quarters(Table 11.11)
11.61 Continued global risks and moderatedbusiness sentiment have affected FDI inflows to keyinfrastructure during the current financial year. Thetotal FDI inflows into major infrastructure sectorsduring April-November 2012 have dipped significantlyregistering a contraction of 97.8 per cent. The majordecline has been in the power sector (-68 per cent),petroleum and natural gas (-89 per cent), andtelecommunications (-96 per cent) (Table 11.12).Regulatory uncertainties, slower growth, and delaysin acquisition of land were some of the reasons fordecline in FDI inflows in the infrastructure sector inthe current year.
Table 11.12 : FDI Flows to infrastructure (US$ million)Sector 2009-10 2010-11 2011-12 Apr.-Nov.
2011 2012
Power 1,437.3 1271.77 1652.38 1436.75 456.00Non-conventional energy 497.9 214.40 452.17 241.62 443.08Petroleum & natural gas 272.1 556.43 2029.98 1971.97 210.73Telecommunications 2554.0 1664.50 1997.24 1987.18 70.46Air transport * 22.6 136.00 31.22 27.50 13.72Sea transport 284.9 300.51 129.36 99.42 36.23Ports 65.4 10.92 0.00 0.00 0.00Railway-related components 34.2 70.66 42.27 35.16 17.79Total (of above) 5,168.40 4,225.19 6,334.62 5,799.60 1,248.01
Source : Department of Industrial Policy and Promotion.Notes : *Air transport including air freight. Variation in data is due to reclassification of some sectors.
PPP initiatives11.62 The government is promoting PPPs as aneffective tool for bringing private-sector efficienciesin creation of economic and social infrastructureassets and delivery of quality public services.According to a World Bank Report on PrivateParticipation in Infrastructure (PPI), India has beenthe top recipient of PPI activity since 2006 and hasimplemented 43 new projects which attracted totalinvestment of US$20.7 billion in 2011. India aloneaccounted for almost half of the investment in newPPI projects implemented in developing countriesduring the first semester of 2011. The Reportmaintained that India remained the largest marketfor PPI in the developing world. In the South Asianregion, India attracted 98 per cent of regionalinvestment and implemented 43 of the 44 newprojects in the region. Details of PPP initiatives areprovided in Box.11.5.
CHALLENGES AND OUTLOOK
11.63 From a macroeconomic perspective, a highlevel of investment in the infrastructure sector isessential for the overall revival of investment climatewhich may finally lead to sustainable growth in aneconomy. However, in the current macroeconomicenvironment, to achieve this objective, there is needto address sector-specific issues over the medium-to long-term horizon in India.
11.64 There is an overall shortage of power in thecountry both in terms of energy deficit and peakshortage. At present, overall energy deficit is about8.6 per cent and peak shortage of power is about9.0 per cent. The Eleventh Plan added 55,000 MW
http://indiabudget.nic.in

251Energy, Infrastructure and Communications
Box 11.5 : PPP initiatives in IndiaThe Government of India is promoting PPPs as an effective tool for bringing private-sector efficiencies in creation ofeconomic and social infrastructure assets and for delivery of quality public services. India in recent years has emerged asone of the leading PPP markets in the world, because of several policy and institutional initiatives taken by the centralgovernment. By end December 2012 there were over 900 PPP projects in the infrastructure sector with total project cost(TPC) of ` 5,43,045 crore as compared to over 600 projects with TPC of ` 333,083 crore on 31 March 2010. These projectsare at different stages of implementation, i.e. bidding, construction, and operational.
Approval of Central-sector PPP projects
Since its constitution in January 2006, the Public Private Partnership Appraisal Committee (PPPAC) has approved 307central project proposals with TPC of ` 2,97,856.58 crore. These include NHs (242 proposals), ports (29 proposals),airports (2 proposals), tourism infrastructure (1proposal), railways (1 proposal), housing (27 proposals), and sportsstadia (5 proposals).
VGF for PPP Projects
Under the Scheme for Financial Support to PPPs in Infrastructure (Viability Gap Funding Scheme), 145 projects have beengranted approval with TPC of ` 80,203.28 crore and VGF support of ` 1,56,72.68 crore and ` 902.96 VGF crore has beendisbursed.
Thirteen new sub-sectors have been included in the list of sectors eligible for VGF support under the Scheme. Theseinclude:
i. Capital investment in the creation of modern storage capacity including cold chains and post-harvest storage.
ii. Education, health, and skill development.
iii. Internal infrastructure in National Investment and Manufacturing Zones.
iv. Oil/gas/liquefied natural gas (LNG) storage facility [includes City Gas distribution (CGD) network]; oil and gaspipelines (includes CGD network); irrigation (dams, channels, embankments, etc); telecommunication (fixed network)(includes optic fibre/ wire/cable networks which provide broadband /internet); telecommunication towers; terminalmarkets; common infrastructure in agriculture markets; and soil-testing laboratories.
Support for Project Development of PPP Projects
The India Infrastructure Project Development Fund (IIPDF) was launched in December 2007 to facilitate quality projectdevelopment for PPP projects and ensure transparency in procurement consultants and projects. So far, 51 projects havebeen approved with IIPDF assistance of ` 64.51 crore of which ` 25.00 crore has been disbursed.
Capacity Building and Strengthening of State and Central Institutions
The National PPP Capacity Building Programme was launched by the Finance Minister in December 2010, and was rolledout last year in 15 States and two central training institutes, viz. the Indian Maritime University and Lal Bahadur ShastriNational Academy of Administration. A comprehensive curriculum has been prepared and 11 training programmesconducted to train 154 trainers, who have trained over 1975 public functionaries, who deal with PPPs in their domain.
Online toolkits for PPP projects for five sectors were developed and were launched by the Finance Minister. These areavailable on this Department's website on PPPs, i.e. www.pppinindia.com. The PPP toolkit is a web-based resource thathas been designed to help improve decision-making for infrastructure PPPs in India and to improve the quality of theinfrastructure PPPs that are implemented in India. In the past one year, 720 national and international users have availedof this one-of-a-kind web-based resource to structure better PPP projects.
PPP Rules and PPP Policy:
Following the recommendations of the Committee on Public Procurement, the Prime Minister's announcement regardingtransparency and accountability in procurement, and preparation of the Public Procurement Bill, and to ensure that PPPprojects are procured and implemented by following laid down processes and observing principles of transparency,competitive bid process, affordability, and value for money, the draft PPP Rules and PPP Policy have been prepared. Thesehave undergone extensive consultation process at central and state government levels for finalization.
Global experience indicates that PPPs work well when they combine the efficiency and risk assessment of the private sectorwith the public purpose of the government sector. They work poorly when they rely on the efficiency and risk assessmentof the government sector and the public purpose of the private sector. India should be careful not to undertake PPPs thatdo not apportion risks and responsibilities sensibly. Moreover flexibility needs to be built into arrangements so that thecontract can be withdrawn and put up for rebid when the private party underperforms. The government needs to study thePPP experience and build some central capacity to help ministries, authorities, and states structure contracts and renegotiatetroubled ones.
http://indiabudget.nic.in

252 Economic Survey 2012-13
Box 11.6 : Financial Restructuring of State Distribution CompaniesThe government in September 2012 approved the scheme for Financial Restructuring of State Distribution Companies(Discoms). The salient features of the scheme are as follows:
a. 50 per cent of the outstanding short-term liabilities up to 31 March 2012 to be taken over by state governments. Thisshall be first converted into bonds to be issued by Discoms to participating lenders, duly backed by state governmentguarantee.
b. Takeover of liability by state governments from Discoms in the next two to five years by way of special securities andrepayment and interest payment to be done by state governments till the date of takeover.
c. Restructuring the balance 50 per cent short-term Loan by rescheduling loans and providing moratorium on principal.
d. The restructuring/reschedulement of loan is to be accompanied by concrete and measurable action by the Discoms/states to improve their operational performance.
e. Central government will provide incentive by way of grant equal to the value of the additional energy saved by way ofaccelerated AT&C loss reduction beyond the loss trajectory specified under the RAPDRP and capital reimbursementsupport of 25 per cent of principal repayment by the state governments on the liability taken over by the stategovernments under the scheme.
of generation capacity which was more than twicethe capacity added in the Tenth Plan. The TwelfthPlan aims to add another 88, 000 MW. Delivery ofthis additional capacity would critically depend onresolving fuel availability problems, especially whenabout half the generated capacity is expected tocome from the private sector. The private developersmay not be able to finance the projects if coallinkages are not resolved and there are delays infinalization of fuel supply agreements (FSAs).Whilesome decisions have been taken for restructuringDiscoms' finances (Box 11.6), these may need tobe monitored and implemented in spirit.
11.65 Although India has large coal reserves,demand for coal is substantially outpacing itsdomestic availability, with Coal India not being ableto meet its coal production targets in the EleventhPlan. Domestic coal supplies are therefore notassured for coal-based power projects plannedduring the Twelfth Plan. Hence it is essential toensure that domestic production of coal increasesfrom 540 million tonnes in 2011-12 to the target of795 million tonnes at the end of the Plan. Thisincrease of 255 million tonnes assumes an increaseof 64 million tonnes of captive capacity with the restbeing met by Coal India Limited. However, even withthis increase, there will be a need to import 185million tonnes of coal in 2016-17 which may furtheradd to the financing cost of power projects. Moreeffort must be made for improving competition andefficiency in the coal sector, which may entailstructural reforms. Problems like delays in obtainingenvironmental clearances, land acquisitions, and
rehabilitation need to be suitably addressed in fast-track mode to achieve the Twelfth Plan targets forcoal production while maintaining a balance betweengrowth needs and environmental concerns. Progressof road projects has also suffered on account ofsimilar factors. The creation of a High-Level CabinetCommittee on Investment to quicken the pace ofdecision making in critical infrastructure projectsby the government is expected to resolve any issuesinvolving inter-ministerial coordination.
11.66 Of late, financing of road projects has alsorun into difficulty as leveraged companiesimplementing road projects are unable to raise moredebt in the absence of fresh equity. In current marketconditions, these firms are unable to raise newequity. Exit route needs to be eased so thatpromoters can sell equity positions afterconstruction, passing on all benefits andresponsibilities to entities that step in. Promoterscan then use the equity thus released for newprojects. Steps are also needed to up-scale projectsin PPP mode for achieving the targets envisaged forthe development of roads in the Twelfth Plan.
11.67 The process of extending transparentpolicies and mechanisms for allocation of scarcenatural resources to private companies forcommercial purposes has also been initiated. TheMines & Mineral (Development and Regulation) Bill2011 aims at providing a simple and transparentmechanism for grant of mining lease or prospectinglicence through competitive bidding in areas ofknown mineralization and on first-in-time basis inareas where mineralization is not known. However,
http://indiabudget.nic.in

253Energy, Infrastructure and Communications
in order to meet the objective of revenuemaximization in an open, transparent andcompetitive manner, this should be preceded bydetailed geological mapping of the mineral wealthof the country. Further, any policy prescriptionregarding the use of natural resources must ensurethat the process of selection is fair, reasonable, non-discriminatory, transparent, and aimed at promotinghealthy competition and equitable treatment.
11.68 Owing to a number of external and internalfactors, viability of airline operations in India hascome under stress. A high operating costenvironment owing to high and rising cost of aviationturbine fuel (ATF) coupled with rupee depreciationis making operations unviable for carriers in India.The Expert Report of Nathan Economic ConsultingIndia Private Ltd. (Nathan India) which went into thequestion of pricing and the tax regime governingATF concluded that ATF prices in India aresignificantly higher (at least 40 per cent) than incompeting hubs in the region such as Singapore,Hong Kong, and Dubai. Therefore, there is need torationalize the tax regime particularly value addedtax on ATF which is in the range of 20-30 per cent inmost of the states. The Ministry of Civil Aviation isof the view that ATF should be included under thedeclared category of goods under the relevantprovision of the Central Sales Tax Act so that auniform levy of 5 per cent is achieved. Equallyimportant is the need for a transparent pricing regimefor ATF in India. A high tax regime for aviation ingeneral and ATF in particular will reduce the widereconomic benefits available from aviation, resultingin a negative impact on economic growth and overallgovernment revenue bases.
11.69 Development of capability in Railways isanother urgent priority for the Twelfth Plan. Capacityin Railways has lagged far behind what is needed,especially given the requirement of shifting from roadtransport to rail in the interests of improving energyefficiency and reducing carbon footprints indevelopment. The funding pattern of the Twelfth Planclearly shows that the modernization of IndianRailways cannot be achieved by simply relying onGBS as about 62 per cent of the resources wouldhave to be generated through non-GBS sources andnearly 20 per cent through private-sector investment.There is a need to draw up clear strategies togenerate resources by identifying segments whereIndian Railways can adopt a low-cost policy byplaying on volumes and taking advantage ofeconomies of scale and segments where it canadopt a differentiation approach by providing highquality services and command premium prices.11.70 As mentioned in the Twelfth Plan document,a GDP growth rate of about 8 per cent requires agrowth rate of about 6 per cent in total energy usefrom all sources. Unfortunately, the capacity of theeconomy to expand domestic energy supplies tomeet this demand is severely limited. The countryis not well-endowed with energy resources, exceptcoal, and the existence of policy distortions makesmanagement of demand and supply more difficult.Accordingly, the short-run action needed to removeimpediments to implementation of projects ininfrastructure, especially in the area of energy,includes ensuring fuel supply to power stations,financial restructuring of Discoms, and clarity interms of the NELP. At the same time, the long-termstrategy should focus on issues like coal production,petroleum price distortion, natural gas pricing, andeffective management of the urbanization process.
http://indiabudget.nic.in

Sustainable Development andClimate Change CHAPTER
12
The year 2012 may arguably be considered a high water mark in the field ofenvironment and sustainable development initiatives. The global community metat the UN Conference on Sustainable Development that took place in Rio in June2012, also marking the 20th anniversary of the landmark first Earth Summit heldin 1992. The Conference reviewed the progress made, identified implementationgaps, and assessed new and emerging challenges, which resulted in a politicaloutcome called the 'The Future We Want'. In India, the Twelfth Five Year Planwas launched with a focus on sustainable growth. This along with sustainabledevelopment policies and programmes which are being followed signalled to citizensat home and the world at large that India is committed to sustainable developmentwith equal emphasis on its three dimensions - social, economic, and environmental.A global comparative opinion survey shows that people in India and indeed allcountries, have a marked and rising concern about sustainable development andclimate change. However, the challenges are also formidable, especially in the contextof finding the matching resources of the required magnitude given the economicconditions. Climate science has rightly taken up an important position in the publicdebate. Even as the science of climate change grapples with uncertanities the worldis witnessing more extreme events. The urgency for action is felt more than everbefore. In contrast, though the Doha Gateway on climate change agreed upon inDecember 2012 ensured that there is continuation of a multilateral and rule-basedregime to reduce emissions, the emission pledges on the table by the developed countryParties lacked ambition. Now the Fifth Assessment Report of the Inter-governmentalPanel on Climate Change (IPCC) is in the final stages of completion. With risingextreme events, and rising citizen demand, the world has little option but to listento the voice of evolving science and respond adequately with strategies and policyrooted in the principles of multilateralism with equitable and fair burden sharing.
INTRODUCTION
12.2 Sustainable Development and ClimateChange was introduced as a chapter in theEconomic Survey last year for the first time. Thesetopics remained headline news with extremeweather events both at home and abroad. Efforts toarrive at a consensus on what to do at home andabroad gathered momentum, even as they sailedthrough some rough waters and fickle seas in manyrespects. In 2012 science and nature voiced a sense
of urgency for action. Yet the relevant statistics havea mixed story to tell: it strongly accepts sciencebut weakly reflects on the corresponding multilateralactions, suggesting that a lot remains to be doneon the latter.
12.3 A volatile mix of erratic weather, naturaldisasters, and enormous pressures on theavailability of clean air, water, and energy togetherwith the problems of poverty and hunger continuesto be of great concern for policymakers particularly
http://indiabudget.nic.in

255Sustainable Development and Climate Change
in the developing countries. There was building ofthe forward momentum both globally anddomestically with three high-profile events in theglobal arena in 2012 and launch of the Twelfth FiveYear Plan at home. The Earth Summit in Rio alsopopularly known as Rio + 20 celebrated its 20thanniversary, next the 11th session of the Conferenceof Parties (COP 11) to the Convention on BioDiversity (CBD), hosted by India in Hyderabad, andfinally the year closed with the 18th session of theCOP to the United Nations Framework Conventionon Climate Change (UNFCCC) in Doha in December.These international collaborations came out withbalanced packages though short on ambition butproceeding on efforts. At home we launched theTwelfth Five Year Plan whose explicit theme was a'faster, more inclusive and sustainable growth'process. It is the first time that a five year plan hassustainability as a prominent focus. The Twelfth Planoutlined lower carbon growth strategies addingmomentum to the ongoing policies and programmesof the government on environment and climatechange (Box 12.1). To add to this, State Action Planson Climate Change (SAPCC), a recent initiative, willtune national initiatives on the National Action Plan
on Climate Change (NAPCC) to regional, socio-economic and ecological conditions. The SAPCC isexpected to take off as part of the plan scheme forstates (Box 12.2). With these developments, it isclear that sustainable development and climatechange issues are being addressed on a prioritybasis.
12.4 The world population crossed the 7 billionmark but with continued decline in population growthrates. Urbanization continues to grow with moredemand for resources. A United Nations EnvironmentProgramme (UNEP) study, 'Keeping Track of OurChanging Environment: From Rio to Rio + 20 (1992-2012)', tells the story of where the world collectivelystands today on the sustainability and environmentfront. According to this study, both global grossdomestic product (GDP) and the human developmentindex (HDI increased by 2.5 per cent per year)continue to increase but variation and inequalitiesbetween regions still exist. The study also points tothe growing pressure on agriculture, water, fisheries,and land resources. Pressure on natural resourcesreflected in per capita global use of natural resourcematerials has increased around 27 per cent between1992 and 2005 though there has been a decline in
Box 12.1 : Twelfth Five Year Plan Approaches for Sustainable Development and Lower CarbonStrategiesThe Twelfth Plan strategy suggests that there are significant 'co-benefits' for climate action with inclusive and sustainablegrowth. India as a large responsible player with very low income has also to ensure that these efforts are matched byequitable and fair burden sharing among countries, taking into account the historical responsibilities for emissions. Theseissues are being discussed in the UNFCCC.
India's approach to a lower-carbon growth strategy explicitly recognizes that policies have to be inclusive and differentiatedacross sectors according to national priorities, so as to lower the transaction costs of implementing the policy, and conformwith a nationally fair burden-sharing mechanism. An Expert Group on Low Carbon Strategies appointed by the PlanningCommission has outlined the lower carbon strategies for major potential carbon mitigation sectors:
(i) Power : On the supply side, adopt super-critical technologies in coal-based thermal power plants; use gas in combinedheat and power systems; invest in renewable technologies; and develop hydropower in a sustainable manner. On thedemand side, accelerate adoption of super-efficient electrical appliances through market and regulatory mechanisms;enhance efficiency of agricultural pump sets and industrial equipment with better technology; modernize transmissionand distribution to bring technical and commercial losses down to world average levels; universalize access to electricity;and accelerate power-sector reforms.
(ii) Transport : Increase the share of rail in overall freight transport; improve the efficiency of rail freight transport; makeit price competitive by bringing down the levels of cross-subsidization between freight and passenger transport; completededicated rail corridor; improve share and efficiency of public transport system; and improve fuel efficiency of vehiclesthrough both market-based and regulatory mechanisms.
(iii) Industry : Greenfield plants in the iron and steel and cement sectors adopt best available technology; existing plants,particularly small and medium ones, modernize and adopt green technology at an accelerated pace, with transparentfinancing mechanisms.
(iv) Buildings : Evolve and institutionalize green building codes at all levels of government.
(v) Forestry : 'Green India Mission' to regenerate at least 4 million ha of degraded forest; increase density of forest cover on2 million ha of moderately dense forest; and overall increase the density of forest and tree cover on 10 million ha of forest,waste, and community lands.
http://indiabudget.nic.in

256 Economic Survey 2012-13
emissions and energy and material use per unit ofoutput, indicating improvement in efficiency levels.At the same time global greenhouse gas (GHG)emissions have continuously been rising (Figure12.1). GHG emissions measured in million metrictons of CO2 equivalent (MtCO2e) from 1990 to 2005register an increase of 25.9 per cent (WorldResources Institute).
12.5 Positive and rising trends in global effortsare competing against mixed trends in the state ofthe environment. In 2011, global investment in therenewable energy sector, went up 17 per cent to$257 billion hitting another record. In terms of newcapacity added in 2011, renewable power (excludinglarge hydro) accounted for 44 per cent of the totalnew generation capacity added worldwide up from34 per cent in 2010 (Frankfurt School of Financeand Management 'Global Trends in RenewableEnergy investment 2012') .The global community isnow working upon a set of Sustainable Development
Goals (SDGs) possibly to be integrated withMillennium Development Goals (MDGs) for the post2015 global policy architecture. Simultaneously theworld over the past decade has entered into manynew environmental agreements. Together with thegovernments the private sector has been forthcoming.However, multilateral and bilateral funding dedicatedto environmental purposes fluctuated and was facedwith unmet promises to a great extent.
SUSTAINABLE DEVELOPMENT ANDCLIMATE CHANGE IN THE INDIANCONTEXT
12.6 The key environmental challenges in Indiahave been sharper in the past two decades. TheState of the Environment Report by the MoEF clubsthe issues under five key challenges faced by India,which are climate change (Box 12.3), food security,water security, energy security, and managingurbanization. Climate change is impacting the natural
Box 12.2 : SAPCCSince the launch of the NAPCC, there have been serious efforts to dovetail national programmes of action to regional andlocal levels consistent with varying socio-economic and ecological conditions. At the Conference of State EnvironmentMinisters held on 18 August 2009, the Prime Minister of India requested all state governments to prepare SAPCCs. TheState Action Plans took their lead from National Mission documents while formulating mitigation/ adaptation strategies.So far, 21 states have prepared documents on the SAPCC focused on approaches that are sectoral but with regionalramifications. The State Action Plans include strategies and a list of possible sectoral actions that would help the statesachieve their adaptation and mitigation objectives. The common threads that bind these State Plans together are theprinciples of territorial approach to climate change, sub-national planning, building capacities for vulnerability assessment,and identifying investment opportunities based on state priorities. This framework provides a broad, systematic, andstep-wise process for the preparation of SAPCCs and advocates a participatory approach so that states have enoughownership of the process and final plan. The major sectors for which adaptation strategies envisaged are agriculture,water, forests, coastal zone, and health.
http://indiabudget.nic.in

257Sustainable Development and Climate Change
Box 12.3 : Understanding Climate Change at a GlanceEver since the industrial revolution, manmade activities have added significant quantities of GHGs into theatmosphere. Climate change is a global negative externality primarily caused by the building up of GHG emissionsin the atmosphere. The efforts needed to address the climate change include mitigation of GHG emissions on theone hand and building of adaptive capacities to cope with the adverse impacts of climate change on the other. Froma developing country perspective, adaptation is of utmost importance as they are the ones who are most vulnerableto the adverse impacts of climate change.
The incremental impact of a ton of GHG on climate change is independent of where in the world it is emitted. Theseemissions impose a cost on both the present and future generations, which are not fully recouped from the emittersof these emissions. This formed the starting point for a globally coordinated policy action and the need for aninternational climate change negotiating regime.
UNFCCC, set up in 1992, although global in scope, differentiates the commitments/responsibilities of Parties onthe basis of historic responsibilities, economic structures, and on the basis of the principle of 'equity' and CBDRwhich is at the core of the climate change debate. The largest share of historical and current global emissions ofGHGs has originated in developed countries. Scientists attribute the global problem of climate change not to thecurrent GHG emissions but to the stock of historical GHG emissions. Most of the countries, particularly theindustrialized countries, having large current emissions are also the largest historic emitters and the principalcontributors to climate change. The Convention therefore lays down legally binding commitments for the developedcountries, taking into account their historical responsibilities and also squarely puts the responsibilities on developedcountries for providing financial resources, including for the transfer of technology, needed by the developingcountries. The Convention also acknowledges that climate change actions taken by developing countries are contingenton the resources made available to them.
ecosystems and is expected to have substantialadverse effects in India, mainly on agriculture onwhich 58 per cent of the population still depends forlivelihood, water storage in the Himalayan glacierswhich are the source of major rivers and groundwaterrecharge, sea-level rise, and threats to a longcoastline and habitations. Climate change will alsocause increased frequency of extreme events suchas floods, and droughts. These in turn will impactIndia's food security problems and water security.As per the Second National Communicationsubmitted by India to the UNFCCC, it is projectedthat the annual mean surface air temperature riseby the end of the century ranges from 3.5°C to 4.3°Cwhereas the sea level along the Indian coast hasbeen rising at the rate of about 1.3 mm/year on anaverage. These climate change projections are likelyto impact human health, agriculture, water resources,natural ecosystems, and biodiversity.
12.7 Wary of the threats imposed by climatechange and pressures on natural resources,sustainability and environment are increasingly takingcentrestage in the Indian policy domain. India hasbeen part of 94 multilateral environmentalagreements. India has also voluntarily agreed toreduce its emission intensity of its GDP by 20-25
per cent over 2005 levels by 2020, and emissionsfrom the agriculture sector would not form part of theassessment of its emissions intensity. Indianeconomy is already moving along a lower carbonand sustainable path in terms of declining carbonintensity of its GDP which is expected to fall furtherthrough lower carbon strategies. It is estimated thatIndia's per capita emission in 2031 will still be lowerthan the global per capita emission in 2005 (in 2031,India's per capita GHG emissions will be under 4tonnes of carbon dioxide equivalent (CO2eq.) whichis lower than the global per capita emissions of 4.22tonnes of CO2eq. in 2005).
12.8 Along with the national efforts in differentsectors, India also recognizes that rural areas areequally prone to stress and pressures from naturalresource exploitation. In this context, schemes forrural development and livelihood programmes arevery relevant. A vast majority of the works under theMahatma Gandhi National Rural EmploymentGuarantee Scheme (MGNREGS) are linked to land,soil, and water. There are also programmes for non-timber forest produce-based livelihood, promotion oforganic and low-chemical agriculture, and increasedsoil health and fertility to sustain agriculture-basedlivelihoods. These schemes help mobilize and
http://indiabudget.nic.in

258 Economic Survey 2012-13
develop capacities of community institutions to utilizenatural resources in a sustainable manner and theirpotential can be further developed.
12.9 Together with efforts to incorporatesustainability in the rural development process, Indiais increasingly making efforts to integrate the threepillars of sustainable development into its nationalpolicy space. In fact, environment protection isenshrined in our Constitution (Articles 48 A and 51 A[g]). Various policy measures are being implementedacross the domains of forestry, pollution control,water management, clean energy, and marine andcoastal environment. Some of these are policies likeJoint Forest Management, Green Rating forIntegrated Habitat Assessment, Coastal ZoneRegulation Zone, eco labelling and energy efficiencylabelling, fuel efficiency standards etc . Over a periodof time, a stable organizational structure has beendeveloped for environment protection. The countryhas been making fast progress in increasing itsrenewable energy capacity and has displayed thefastest expansion rate of investment of any largerenewables market in the world in 2011, with a 62per cent increase to $12 billion (Frankfurt School ofFinance and Management 'Global Trends inRenewable Energy investment 2012'). The TwelfthFive Year Plan with a prominent focus onsustainability makes provision and provides for manymore opportunities like these.
12.10 Working on the social and economic pillarsof sustainable development policies, programmesand targeted schemes have been introduced toeradicate poverty. This is done either through a directfocus on economic indicators like employmentgeneration, youth mobilization, and building upassets of the poor, or indirectly through socialindicators of human development with emphasis onhealth, education, and women's empowerment. Manyparameters on this front have shown improvement.The poverty head-count ratio declined by 7.3percentage points from 2004-5 to 2009-10, maternalmortality rate (MMR) dropped from 301 per 100,000live births in 2001-3 to 212 in 2007-9; literacy rateshave been constantly rising and are estimated to be82.14 per cent for men and 65.46 per cent for womenas per the 2011 Census of India. However, India isstill not on target to meet some key MDGs by 2015.
12.11 Over the years arguments in favour oflooking beyond the conventional measure of GDPand taking into account the environmental damage
caused by production of goods and services receivedattention. An expert group under the chairmanshipof Prof Sir Partha Dasgupta has been set up todevelop a framework for 'Green National Accounts'for India. In fact, the Central Statistics Office (CSO)under the Ministry of Statistics & ProgrammeImplementation (MOSPI) has been publishingcomprehensive environment statistics since 1997.The process of putting in place a system for naturalresources accounting was initiated by MOSPI wayback in 2002.
12.12 Despite all these efforts, the reality thatconfronts us on the environmental front continues tobe harsh and complex. Increasing population,urbanization, and growing demand for water and landresources have severely impacted the quality andavailability of water and soil resources. Rising energyneeds is another area of concern. Besides, rapidgrowth will require corresponding growth in energysupply. Presently a large share of our energy demandis met through coal and oil and this trend willcontinue, given the unprecedented surge in energydemand and resource constraints. Energy issuesbecome more complex with existing energy povertyand rise in energy prices. There is considerable scopefor increasing efficiency in the use of energy andwater in India together with other developmentindicators like infant mortality rate, MMR, sanitationfacilities, and public health services. Economicinstruments, regulatory measures, and marketmechanisms can play an important role in helpingto achieve development and growth in a sustainablemanner.
INTERNATIONAL COLLABORATIONAND EFFORTS
12.13 Admitting the well-founded concerns on theneed to redress environmental problems, there wereglobal calls for cooperation, action, and innovation.World leaders in 2012 continued to engage anddeliberate in international forums dedicated to climateand environment and also in forums like the G20where sustainable development and climate changewere an integral part of the discussions. Ambition orgoal setting to reach targets, provision of financeand technology for developing countries, andinstitutions and mechanisms for capacity buildingwere the common threads of negotiations runningthrough all these forums. Some of the high-profileevents which the world was watching are discussedin the following paragraphs.
http://indiabudget.nic.in

259Sustainable Development and Climate Change
Rio + 2012.14 The United Nations Conference onSustainable Development (UNCSD), was held in June2012 at Rio de Janeiro, Brazil, (also known asRio+20) and was attended at the heads of stateslevel.
12.15 The objective of the Rio+20 Conference wasto secure renewed political commitment forsustainable development, review progress made andidentify implementation gaps, and assess new andemerging challenges since the UNCSD held 20 yearsago in Rio de Janeiro in 1992. Towards this end, theConference had two themes, viz. (a) green economyin the context of sustainable development & povertyeradication; and (b) institutional framework forsustainable development. The most significantoutcomes of the Rio Summit have been therestoration of the principles of equity and of commonbut differentiated responsibilities (CBDR) in the globalenvironmental discourse and placing povertyeradication at the centre of the global developmentagenda. The outcome also ensures the requireddomestic policy space to countries on a greeneconomy and launched four processes/mechanisms, i.e. developing SDGs, financingstrategy, technology transfer, and defining the formatand organizational aspects of the proposed high-level political forum to follow up on the implementationof sustainable development.
12.16 'Fairness' as an issue received attention. Itis a matter of satisfaction and achievement for Indiathat the Rio outcome document reaffirms equity andthe principle of CBDR among other Rio principles.India together with other developing countries playedan instrumental role in this. CBDR is especiallyimportant for developing countries, as it implies thatwhile all countries should take sustainabledevelopment actions, the developed countries haveto take the leading role in environmental protection,as they have contributed the most to environmentalproblems. Also they should support developingcountries with finance and technology in theirsustainable development efforts. India has alwaysheld that the eradication of poverty should be theoverarching goal of sustainable development. Thiswas given due recognition in the deliberations at theRio Summit and in the outcome document.
12.17 On the issue of Green economy, theoutcome document affirms that there are differentapproaches, visions, models, and tools available to
each country, in accordance with its nationalcircumstances and priorities, for achievingsustainable development. It identifies green economyin the context of sustainable development andpoverty eradication as one of the important tools forachieving sustainable development but specifies thatwhile it could provide options for policy-making itshould not be a rigid set of rules. The outcomedocument clearly states what green economypolicies should result in and what they should not. Itis a matter of satisfaction that the document firmlyrejects prescriptive policies, unilateral measures, andtrade barriers as well as unwarranted conditionalityon official developmental assistance (ODA) in thiscontext.
12.18 The Rio+20 Conference will also beremembered for kick-starting the process ondeveloping SDGs. The SDGs would address andincorporate in a balanced way, all the threedimensions of sustainable development and theirinter-linkages. The SDGs would be universal, global,and voluntary. Since the SDGs are expected tobecome a part of the post-2015 UN developmentagenda, they would hopefully guide the internationalcommunity towards inclusive sustainabledevelopment.
12.19 From India's point of view, SDGs need tobring together development and environment into asingle set of targets. The fault line, as ever in globalconferences, is the inappropriate balance betweenenvironment and development. Developing countriesdo not want any bindings on their efforts towardspoverty eradication or any agreement that comeswith such a price tag. Therefore, we could also viewthe SDGs and the post 2015 agenda as anopportunity for revisiting and fine-tuning the MDGframework and sustainably regaining focus ondevelopmental issues. India and many developingcountries are slow or off track in achieving targetsunder some of the MDGs, which have concrete areasof overlap between environment and development.This is another reason why these MDGs shouldcontinue to be a part of the post 2015 global policyarchitecture.
12.20 The Rio Summit did not lead to any specificcommitments on the finance and technology front.The developed countries, having obligations andresponsibilities, need to commit to provision ofadequate public funds including for transfer oftechnology and capacity building to developing
http://indiabudget.nic.in

260 Economic Survey 2012-13
countries. There has been no mention of provision ofnew and additional financial resources by developedcountries, something that India would have wantedto see. Any new green economy and sustainabledevelopment goals would be meaningless withoutnew money and technology commitments on thetable. Nevertheless, we may hope that the follow upprocess of Rio + 20 on both finance and technologywill keep these issues alive leading to some newstrategies and mechanisms.
12.21 While developing countries remaindisappointed with the outcome document on meansof implementation, they managed to secure manyof their key positions and demands in thenegotiations. It says a lot about the currentinternational situation that a reaffirmation of principlesmade 20 years ago is a sign of success.
Convention on Biological Diversity12.22 Global concerns about biodiversity foundexpression in the CBD adopted in 1992. Theobjectives of the Convention are: conservation ofbiodiversity, sustainable use of its components, andthe fair and equitable sharing of benefits arising fromthe use of genetic resources. The Convention hasnear universal membership with 193 countries. TheUSA is the only major country that is not a Party.Following the ratification of the CBD, India alsoenacted the Biological Diversity Act in 2002 andnotified the Rules in 2004 to give effect to theprovisions of the CBD.
12.23 Being committed to the cause, Indiasuccessfully hosted the COP 11 to the CBD, andthe sixth Conference of the Parties serving as Meetingof the Parties (CoP/MoP-6) to the CBD's CartagenaProtocol on Biosafety in Hyderabad from 8-19October 2012. The event provided India an opportunityto consolidate, scale up, and showcase its initiativesand strengths on biodiversity. One of the mostimportant outcomes is the commitment of the Partiesto doubling the total biodiversity-related internationalfinancial resource flows to developing countries by2015 and at least maintaining this level until 2020.This will translate into additional financial flows tothe developing countries to the tune of about US $30 billion over the next eight years.
12.24 The Prime Minister of India, during COP 11announced India's ratification of the Nagoya Protocolon Access and Benefit Sharing under the CBD andalso launched the 'Hyderabad Pledge' of US $ 50
million during India's Presidency to strengtheninstitutional mechanisms and capacity building indeveloping countries. The Prime Minister unveiled acommemorative pylon in Hyderabad to mark COP-11. It has been decided to establish a biodiversitymuseum and a garden on this site. At national level,efforts will be made to strengthen the implementationof the Biological Diversity Act and provide support tothe State Biodiversity Boards and at local levelprepare Peoples Biodiversity Registers.
Doha Climate Change Conference 201212.25 The 18th session of the COP to theUNFCCC, that started on 26 November andconcluded on 8 December 2012 in Doha, Qatar hasresulted in a set of decisions (clubbed together as'Doha Climate Gateway') aimed at advancing theimplementation of the UNFCCC and its KyotoProtocol (KP).
12.26 The key issues for the Doha conferencewere: amending the KP to implement the secondcommitment period under the Protocol; successfullyconcluding the work of the Bali Action Plan (BAP)within which there was urgent need for a clear pathto climate finance; and planning the work under theDurban Platform (DP) for enhanced action. TheConference addressed all three issues and cameout with a package which balanced the interestsand obligations of various countries (Box 12.4).
12.27 At the Doha Conference, the three issuesof equity, technology-related IPRs, and unilateralmeasures raised by India resounded in the decisions.These outstanding or unresolved issues under theBAP are now part of the planned or continuing workof various bodies of the Convention. At Doha, Indiaalso ensured that no hasty decision is taken onaspects related to mitigation in agricultural sectorat global level as agriculture is a sensitive sector fordeveloping countries. The Conference has explicitlyrecognized that the action of Parties will be basedon equity and CBDR including the need for equitableaccess to sustainable development. The Conferencealso recognized that issues relating to global peakingthat could place a cap on emissions of developingcountries and restrict their development space werecontroversial and best avoided at this stage ofdevelopment.
12.28 At the same time, in an effort to cater to theinterest of all countries and come up with a balancedpackage, some elements of the package required
http://indiabudget.nic.in

261Sustainable Development and Climate Change
Box 12.4 : Key Doha Outcomes It has been agreed that the KP, as the only existing and binding agreement under which developed countries commit
to cutting emissions of GHGs, will enter a second commitment period that will run for eight years.
Governments have agreed to speedily work toward a climate change agreement under DP applicable to all countriesfrom 2020, to be adopted by 2015. Further governments have decided to find ways to scale up efforts before 2020 tomeet the gap in global ambition for emissions reduction.
Governments have launched a robust process to review the long-term temperature goal. This will start in 2013 andconclude by 2015 and is a reality check on the advance of the climate change threat and the possible need to mobilizefurther action.
The Work Programme on Long term Finance launched last year has been extended for another year to contribute to theongoing efforts to scale up mobilization of climate finance. Developed countries have reiterated their commitment todeliver on promises of mobilizing US$100 billion both for adaptation and mitigation by 2020.
Decision also encourages developed countries to increase efforts for providing finance between 2013 and 2015, and atleast to the average annual level provided during the 2010-2012 fast-start finance period.
Finance pledges of about $ 6 billion for period upto 2015 announced by Germany, the UK, France, Denmark, Swedenand the EU Commission.
The selection of the Republic of Korea by the Board of the Green Climate Fund (GCF) to host the GCF has beenendorsed.
The unresolved issues of Technology-related Intellectual Property Rights (IPRs) and the Unilateral Measures under theBAP are now part of the planned or continuing work of various bodies of the Convention. Based on the decisions, theTechnology Executive Committee (TEC) will initiate exploration of issues relating to enabling environments andbarriers, including IPRs in its future work-plan. The TEC has already identified IPRs as one of the key messages onwhich further work is necessary. Similarly, a decision has been taken for facilitating discussion on the issue ofunilateral measures under the existing forum on implementation of response measures.
compromise or deferral. In many cases, ambitiousand strong demands were collectively made bydeveloping countries, but in the act of balancing,countries were made to accept the mellowed downand subtle versions of their demands. Among thekey concerns which the Conference could notaddress were those relating to financingcommitments of developed countries and sectoralactions. No specific targets for mid-term financing(2013-2020) were adopted. While the Conferencestopped short of giving a mandate to the InternationalCivil Aviation Organization (ICAO) or InternationalMartine Organization (IMO) to initiate steps forcurtailing emissions in their respective sectors, theabsence of a decision on sectoral framework for suchactions has left open the possibility of such actionsbeing initiated in such sectors by the respectiveinternational organizations. Considering the fact thatsome of the leading members of ICAO prefer a globalmarket based mechanism to be the vehicle of suchactions, the framework and the principles on thebasis of which such actions will be taken are likelyto be a bone of contention for quite sometime. Also,despite vociferous demand from vulnerable countries,there could be no satisfactory agreement on acompensation mechanism for loss and damageresulting from climate change.
12.29 On the positive side, the Doha Conferencesucceeded in carrying out amendments to the KPto ensure a second commitment period. The secondcommitment period will last for a period of eight yearsas of 1 January 2013. This decision has ensuredthat there will be no gap between the first commitmentperiod under the KP ending on 31 December 2012and the second one commencing on 1 January 2013.With the exception of Russia, New Zealand, Japan,and Canada, all other countries that were part of thefirst commitment period entered into the secondround, with some new countries joining as well. Ithas been agreed that the KP Parties will revisit theirtargets in 2014 with a view to increasing theirambition. The emission reduction obligationsundertaken by the KP Parties are not as ambitiousas required by science; however, they provide arelative degree of certainty to the carbon markets.The EU will reduce its emissions by 20 per cent by2020 compared to 1990 (Table 12.1). Governmentsalso agreed to speedily work under the DP to evolvea new set of arrangements for mitigationcommitments and actions applicable to all countriesfrom 2020, and to adopt it by 2015. In a significantand positive advancement, it has been agreed thatthe work of the DP will be based on the principles ofthe Convention.
http://indiabudget.nic.in

262 Economic Survey 2012-13
Discussions under G20
12.30 G20--the group of twenty major economiesof the world--took up the agenda of inclusive greengrowth during the Mexican Presidency in 2011-12.The aim of introducing inclusive green growth intothe G20 agenda was to support the transition ofdeveloping countries, in particular the low incomecountries, towards becoming lower carboneconomies as well as to enable countries to becomemore resilient to climate change. As of now, the G20ministers have agreed to voluntarily self-report in 2013on their respective country's efforts to follow inclusivegreen growth and sustainable development policiesunder their structural reform agendas. Leaders atthe G20 last year also collaborated to form a ClimateFinance Study Group to consider ways of effectivelymobilizing resources taking into account theobjectives, provisions, and principles of the UNFCCC.
A Look at CO2 Emissions of the G 20 Countries
12.31 As CO2 is the predominant GHG, ananalysis of its emissions across countries in percapita terms in 2009, compared to 2005 presentsan interesting picture. Although the G20 is referredto as a group, there are stark disparities on theground between member countries in terms ofincomes, stages of development as well as respectiveper capita CO2 emissions. In 2005, the USA had thehighest CO2 emissions in metric tons per capita at19.7, followed by Australia (18.0). The lowest percapita emitters in 2005 were Brazil (1.9), Indonesia(1.5), and India (1.2) who continued to be the bottomthree in 2009 as well. In 2009, Australia ranked firstwithin the G20, followed by the USA (Figure 12.2).
FINANCING CLIMATE CHANGE
12.32 The idea of a global budget for carbon andits corresponding financing stems from the objectiveof stabilizing the GHG concentrations in theatmosphere at a level that would prevent dangerousanthropogenic interference with the climate system.There has already been a 0.8°C increase in globalmean temperature. It is widely believed that we arefast approaching the 2°C temperature rise withinwhich the global community is striving to limit itself.This indicates that only a small and fast closingwindow of opportunity exists for the internationalcommunity to take actions and ensure that we avoidreaching this point.
12.33 Yet the question remains: How to financeactions to achieve this target. A UNFCCC paper(2007) estimated a requirement of US$ 200-210 billionin additional annual investment in 2030 to return GHGemissions to current levels. Further, additionalinvestment needed worldwide for adaptation wasestimated to be annually US$ 60-182 billion in 2030.However, with the passage of time and inadequateaction, these estimates are being revised upwards.Most recent estimates presented at the UNFCCC'sworkshop on Long-term Finance (July 2012) point toan even more enormous scale of funds, in the rangeof $600-$1500 billion a year, that would be neededby developing countries for mitigation and adaptation.
12.34 This amount is at least 5-10 times theprospective financing flows of US$100 billion per yearby 2020 agreed upon as the goal under theUNFCCC. Representatives from the InternationalEnergy Agency reported at this workshop that annual
http://indiabudget.nic.in

263Sustainable Development and Climate Change
Table 12.1 : Emission Reduction Commitments by Kyoto Parties in the SecondCommitment Period
Country Emission reduction Emission reduction Actual change Deviation fromcommitment in the commitment in the in GHG Kyoto target of
second period first period emissions 1st commitment2013-2020 (% of 2008-2012 (% of from 1990 to period asbase year 1990) base year 1990) 2010 (%) in 2010 (%)
Australia (-0.5) 8 30.0 22Austria (-20) (-8) 8.2 16.2Belgium (-20) (-8) –7.6 0.4Bulgaria* (-20) (-8) –52.0 (-44)Croatia* (-20) (-5) –9.1 (-4.1)Czech Republic* (-20) (-8) –28.9 (-20.9)Denmark (-20) (-8) –10.5 (-2.5)Estonia* (-20) (-8) –49.6 (-41.6)European Union (-20) (-8) –15.4 (-7.4)Finland (-20) (-8) 6 14France (-20) (-8) –6.0 2Germany (-20) (-8) –24.8 (-16.8)Greece (-20) (-8) 12.6 20.6Hungary* (-20) (-6) –40.9 (-34.9)Iceland (-20) 10 29.7 19.7Ireland (-20) (-8) 11.2 19.2Italy (-20) (-8) –3.5 4.5Latvia* (-20) (-8) –54.5 (-46.5)Liechtenstein (-16) (-8) 1.1 9.1Lithuania* (-20) (-8) –56.9 (-48.9)Luxembourg (-20) (-8) –5.9 2.1Monaco (-22) (-8) –18.7 (-10.7)Netherlands (-20) (-8) –0.9 7.1Norway (-16) 1 8.2 7.2Poland* (-20) (-6) –28.9 (-22.9)Portugal (-20) (-8) 17.5 25.5Romania* (-20) (-8) –57.6 (-49.6)Slovakia* (-20) (-8) –35.9 (-27.9)Slovenia* (-20) (-8) –3.5 4.5Spain (-20) (-8) 25.8 33.8Sweden (-20) (-8) –9.0 (-1)Switzerland (-15.8) (-8) 2.2 10.2Ukraine* (-24) 0 –58.8 -58.8United Kingdom (-20) (-8) –22.6 (-14.6)Belarus* (-12)Malta (-20)Kazakhstan (-5)Cyprus (-20)
Source: UNFCCC (The latest available data of actual emissions available upto 2010 only)Notes: Kazakhstan, Cyprus, Malta, and Belarus did not have reduction commitments for 2008-2012 underthe KP. Canada, Japan, New Zealand’ and Russia are not Parties to the second commitment period to theKyoto protocol. :*Countries that are undergoing the process of transition to a market economy.For any representative country say for Australia, the table shows that in the first commitment period,Australia could collectively increase emissions by 8 per cent between 2008-2012 (taking the base yearas 1990), whereas for the second KP round, Australia would need to reduce its emissions by 0.5 percent collectively between 2013- 2020. The last two columns of the table measure progress towards thefirst KP target which shows that Australia’s actual emissions increased by 30 per cent between2008-10. This indicates that for the period between 2010-2012, Australia’s emission should have beenreduced by 22 per cent for it to be within the target
http://indiabudget.nic.in

264 Economic Survey 2012-13
global investments for power generation alone, in a20C temperature rise scenario, would involve $370billion from 2010 to 2020; $630 billion between 2020and 2030; and $760 billion between 2030 and 2050.
Domestic Resources and Mechanisms12.35 The assessment and quantification of thecosts of adaptation and mitigation is a difficult task.However, it is clear that these costs are significantand will likely be higher in the future as initiativesare taken in line with the goals outlined in theNAPCC. The preliminary estimates indicate a sumof ` 230,000 crore to fulfill the mission objectivesunder the NAPCC alone, let alone other lower carbonstrategies and environment policies and programmesof the government.
12.36 The most obvious source of financing forclimate change action is government budgetarysupport. Most of it would come as sectoral financesince some of the resources for adaptation andmitigation are built into the ongoing schemes andprogrammes. Although mitigation is sometimes animportant co-benefit, the deployment of resourcesfor such purposes is largely guided by the overallavailability of resources. The Finance Bill 2010-11created a corpus called the National Clean EnergyFund (NCEF) out of a cess at the rate of ` 50 pertonne of coal to invest in entrepreneurial venturesand research in the field of clean energy technologies.The government expects to collect ` 10,000 crore
under the NCEF by 2015. Governments have a rangeof policy instruments and variables at their disposalto use for generating the enormous resourcerequirements in this field. This includes a set of pricesignals, direct and indirect taxes, subsidies, andexport and import levies. Theoretically, environment-related taxes have an important role to play in fundinggreen initiatives. At the same time, any governmentmust use these policy tools after seriousconsideration and analysis as they may have seriousrepercussions on other sectors of the economy.Preliminary modelling studies by the Ministry ofEnvironment and Forests indicate that even a modestrevenue-neutral economy-wide carbon tax of US$10per ton of GHG emissions in India would result in aGDP loss of around US$ 632 billion at 2005 prices.At the same time, the government continues to usesubsidies to promote the environment (Box 12.5).
12.37 Relying solely on carbon taxes and subsidymay not be the most viable policy option. Therefore,India is experimenting with a careful mix of marketmechanisms together with fiscal instruments andregulatory interventions. On one hand, where the cesson coal is a type of carbon tax being levied in India,Perform Achieve and Trade (PAT) and RenewablePurchase Obligation (RPO) are examples of cap andtrade market mechanisms promoting energyefficiency and the use of renewable energyrespectively in India (Box12.6).
Box 12.5 : Carbon Taxes and Environmental SubsidiesResults of Preliminary Modeling Studies by MoEF onCarbon Taxes and GDP Loss
Undiscounted cumulative GDP loss
Carbon tax is revenue positive when it involves noadjustment to other tax rates in the economy. It is revenueneutral when other tax rates are adjusted so that therevenue inflow from carbon tax is exactly balanced by anequal reduction in yields from reduced taxes.
A Look at the Expenditure on Some EnvironmentPromoting Subsidies by Government
Environment-promoting Exp. in 2008-9subsidies (`̀̀̀̀ crore)Sewerage & sanitation 1236.06Soil & water conservation 26.04Fisheries 221.52Forestry & wildlife 696.36Agricultural research & education 365.11Special areas development prog. 1560.29Flood control & drainage 175.28Non-conventional energy 477.21Ecology & environment 473.80
Total 5231.67
Source: A Technical Paper on 'EnvironmentalSubsidies in India: Role and Reforms' by theMadras School of Economics(January 2012).
http://indiabudget.nic.in

265Sustainable Development and Climate Change
12.38 In the particular context of the Twelfth Plan,lower carbon strategies will require capital financefor improvements in technology and enhanceddeployment of renewable and clean energytechnologies. Some of these objectives may be metthrough regulatory interventions and use of marketmechanisms, in which case the required budgetarysupport may be small. In other cases, adequatefinancial outlays will be needed to implement policiesand measures that can achieve specific mitigationoutcomes in the individual sectors. So far, three grantsof ` 5,000 crore each, for forest cover, renewableenergy, and the water sector, have beenrecommended by the 13th Finance Commission forthe state governments.
12.39 Considering the large resource requirement,arguments in favour of setting up a National GreenFund to finance public- and private-sector projects/activities aimed at protecting environment inaccordance with the Twelfth Plan objectives havefound support. The Fund could also be a vehicle forreceiving international support through agreedbilateral and multilateral sources and can financeactions not only at national level but also at statelevel for agreed priorities and thrust areas.
12.40 Carbon offsetting and its requisite financingrequire global effort and process. Markets that areoperating take signals from internationalnegotiations. Domestic markets and mechanismsalone are neither sufficient for generating resourcesof the required scale nor efficient enough for reachingthe set level of targets and therefore rely heavily oninternational policy architecture. The secondcommitment period of the KP has brought some
respite and certainty to the carbon markets; however,due to lack of ambition the future of carbon marketscould still be in an indeterminate state. India's actionsfor climate change will, therefore, need to be financedfrom a pool of resources consisting of domesticresources, international carbon finance, andmultilateral funds.
International Sources and Issues12.41 Primarily out of its own concerns, India haschalked out ambitious plans and policies to tackleclimate change and environment issues that reflectIndia's strong will to address this global public good.However, given the scarcity of resources andcompeting demands, finding the matching resourcesis a challenge. The Expert Group on Low CarbonStrategies has also stated in its Interim Report thataggressive mitigation cannot be achieved withoutsubstantial international financial support, both interms of financial resources and technology transfer.The Prime Minister also echoed similar sentimentin his Rio+20 Summit speech: 'Many countries coulddo more if additional finance and technology wereavailable. Unfortunately, there is not enough evidenceof support from the industrialised countries in theseareas.'
12.42 In the recent past, in the context of makingfinances available to developing countries, much ofthe talks under the UNFCCC revolved around twonumbers, namely US$ 30 billion between 2010 and2012 as Fast Start Finance (FSF) and US$ 100billion annually by 2020 as long-term finance. Thesewere the two finance figures that the developed worldcollectively pledged as climate change finance in
Box 12.6 : PAT and RPOPAT is a scheme for trading energy-efficiency certificates in large energy-intensive industries under the National Missionfor Enhanced Energy Efficiency. Identified industries are required to improve their specific energy consumption (SEC)within the specified period of three years or face penalty provisions. At the same time this mechanism facilitates efficientindustries to trade their additional certified energy savings (that go beyond the assigned target) with other designatedconsumers who could use these certificates to comply with their SEC-reduction targets. In the Twelfth Five Year Plan, thePAT scheme is likely to achieve about 15 million tonnes oil equivalent of annual savings in coal, oil, gas, and electricity(including 6.686 million ton of oil-equivalent energy savings of first phase)
Similarly, the RPO is creating domestic markets for renewable energy through regulatory interventions at state level. TheRPO is the minimum level of renewable energy (out of total consumption) the obligated entities (DISCOMs, CaptivePower Plants, and Open Access Consumers) are entitled to purchase in the area of a distribution licensee. The obligationis mandated by the State Electricity Regulatory Commission (SERC). Since the renewable energy sources are not evenlyspread across India, SERCs cannot specify a linear level of RPOs for all states. Renewable Energy Certificates (RECs) underthe RPO mechanism is an instrument that enables the obligated entities to meet their Renewable Purchase Obligation bytrading surplus or deficit RECs among themselves with the owner of the REC being able to claim to have purchasedrenewable energy.
http://indiabudget.nic.in

266 Economic Survey 2012-13
Box 12.7 : Assessing the US$ 30 Billion FSF Commitment (2010-2012)As FSF came to an end in 2012, many studies echoed serious concerns on the way FSF was implemented. There are lessonsto be learnt so that these issues are addressed when we implement long-term finance by 2020. As a part of the FSFassessment, an Oxfam study 'The Climate Fiscal Cliff' reveals five numbers that speak for themselves on the delivery offunds under FSF.
1. Only 33 per cent of FSF appears to be new money
2. Only 24 per cent of public finance was additional to existing aid promises
3. Only 21per cent went for supporting adaptation in spite of promises to balance it with mitigation
4. Only 43 per cent was provided as grants and the rest as loans
5. Only 23 per cent was channeled through multilateral funds
Almost all assessments on FSF point to the core problems as being a) that it was recycled money either diverted from ODAor made up of funds delivered or planned before the Copenhagen promise in 2009; b) that the most vulnerable were notprioritized, with minimal funds spent on adaptation and c) net transfer of resources to developing countries was not evenhalf the amount promised as more than 50 per cent was in the form of loans that have to be repaid. Therefore, an importanttakeaway in the context of the long-term finance flows are lessons on transparency, coherence, and consistency in reportingand verifying climate finance flows.
2009. These pledges need to be new and additional.The term 'new and additional' in the context ofprovision of finances by developed countries can betraced right from the text of the Convention to variousCOP decisions. In this sense 'new and additional'refers to provision of financial resources thatrepresent new commitment, rather than those thatare diverted from flows that have already beenearmarked for some other form of developmentassistance. However, in the absence of an agreeddefinition of additionality in climate finance, thedeveloped and developing countries have divergingviews. In the backdrop of these differences togetherwith great uncertainty in finance flows, complex webof channels, and lack of transparency and reportingpractices, the actual additionality on FSF turned outto be a matter of great contention (Box 12.7). Thesedifferences more recently led to demand fromdeveloping countries on the need for a mechanismto measure, report, and verify (MRV) climate financeflows.
12.43 As a part of the finance package in the DohaConference, the MRV of finance was an importantelement of the deal. It is satisfying that elements ofMRV will be taken up by the Standing Committeeon Finance under the COP. The Committee willconsider ways of strengthening methodologies forreporting, measuring, and tracking climate finance.Talking about other finance elements, the Conferencedid not take ambitious or meaningful decisionsespecially on the demand for finance for the periodbetween 2013 and 2020. The final decisionencourages developed country Parties to increase
efforts for at least maintaining the average annual2010-2012 level of finance between 2013 and 2015.On the other hand, it is reassuring that the workprogramme on long-term finance started in COP17in Durban has been extended with a view tocontinuing discussion on likely sources of financein the long term. To sum up, finance negotiationsand outcomes at Doha were in the nature of smallslow steps rather than big strides.
12.44 Simultaneously, there have been efforts tobuild the requisite infrastructure for enabling andfacilitating the flows of climate finance under theConvention. This is because only scaling up offinance will not suffice. The money should be put toefficient use and generate results. To this effect workon operationalizing the GCF progressed. TheRepublic of Korea has been selected as the hostcountry to house its secretariat. The GCF isexpected to be instrumental in channelling asignificant share of the US$ 100 billion expectedannually to be mobilized to developing countries by2020 for addressing climate change. The vision,structure, and strategy of the Fund to carry out itsfunction are a crucial priority on the agenda of theGCF Board. The Board should not rush with the'standard' solutions sometimes proposed by outsideinterests but focus on ultimate goals and results onthe ground with accountability and transparency.
12.45 Meanwhile, there are other Funds under theUNFCCC which continue to function. Collectively,the Climate focal area of Global Environment Facility(GEF), the Special Climate Change Fund, the Least
http://indiabudget.nic.in

267Sustainable Development and Climate Change
Developed Countries Fund, and the Adaptation Funddisburse around less than US$ 1 billion per year(Report on the workshop of the work programme onlong-term finance 2012). The GEF, which is also anoperating entity of the financial mechanism of theUNFCCC like the GCF, provides project grants foraddressing global environmental issues whilesupporting national development initiatives. Till date,India has accessed about US$ 438 million of GEFgrant of which US$ 269.5 million is for projects underthe climate change focal area. At the same time,the Climate Investment Fund (CIF)-- a collaborativeeffort among the multilateral development banks--isoffering its funds to be used for climate action on thebasis of agreed terms and conditions. India hasagreed 'in principle' to accessing the CIF, provided itis not treated as part of the climate change financeflows under the Convention and no GHG emissionreduction related conditionalities are associated withthe funds. The Trust Fund Committee in May 2012has approved the allocation of the first trancheamounting to US $ 263 million for four projectscontained in India's Investment Plan.
Private Sector and Carbon Markets12.46 Disappointed with the Doha outcomes onfinance, many observers warned that we are headingtowards a climate fiscal cliff. In this context, theprivate sector and global carbon markets are beingincreasingly emphasized. While not sufficient inthemselves, the private sector and carbon marketshave shown significant potential in mobilizing financefor climate change especially for mitigation action.According to the UNFCCC report on long-termfinance, of the estimated current international climatefinancial flows, US$ 55 billion per year was generatedfrom the private sector. Likewise carbon markets helpdeveloping countries to find financial resources toproceed on their sustainability efforts. The CDM----the KP's market mechanism--as the world's largestcarbon market has helped mobilize more than US$215 billion collectively so far in investments indeveloping countries (CDM Policy Dialogue Report).India has been an active player in the CDM, withover 2000 projects having been accorded host countryapproval, which has the potential of facilitating anoverall inflow of approximately US $ 7.07 billion if allthe projects get registered.
12.47 At the same time, both these sources haveserious limitations in terms of predictability andadequacy of flows. It is absolutely clear that they
will not deliver on the hardest things: equity, publicgoods, and adaptation such as climate resiliency inagriculture or off -grid distributed renewables for poorregions. They will instead prove useful for market-led goods and services for the better off, such asgrid-based solar and wind power, where publicsubsidies in one form or another will be demanded.Also private sector investment is guided by risk return.This explains the strong inclination of the privatesector towards mitigation projects. Adaptationfinancing continues to be a concern for all developingcountries with insignificant private participation asadaptation usually does not yield returns oninvestment. Carbon markets on the other hand arevolatile, where success is contingent on the level ofcollective mitigation ambition of nations. End of thefirst phase of the KP saw the CDM market collapsingwith carbon prices declining around 70 per cent inthe past year alone. Moreover, unilateral restrictionsimposed by the authorities in some of the majorcarbon markets such as EU on carbon credits frommajor developing countries such as India have nothelped matters. The prices of carbon credits are likelyto remain in a trap until the global ambition improvesand new market mechanisms emerges to take intoaccount the pledge based emissions. Both thecarbon markets and private money need clear andtargeted signals from public policies to address theinstitutional and market barriers confronting them.
CHALLENGES AND OUTLOOK
12.48 Though multilateral efforts on sustainabledevelopment and climate change have led to severalpositive outcomes, there are still areas of concernwhere further work is needed to safeguard theinterests of developing countries in futuredeliberations. Some of the challenges anddeliverables from India's point of view are: follow upand action on the Rio + 20 outcome document, andthe four processes/mechanisms part of it, especiallyon developing SDGs and the processes on thefinancing strategy and technology transfer. Alsotaking forward the climate change discussions atDoha, the key question to be addressed is toarticulate equity in the evolving arrangements thatwill be applicable to all in the post 2020 period. Wehave to ensure that domestic goals continue to benationally determined even as we contribute to theglobal efforts according to the principle of CBDRand respective capabilities.
http://indiabudget.nic.in

268 Economic Survey 2012-13
12.49 We should take concrete decisions on thesectoral framework for such actions closing thepossibility of both unilateral measures and actionsbeing initiated in sectors by the respectiveinternational organizations like ICAO or IMO on theirown. More importantly, equity, fair burden sharing,and equitable access to global atmosphericresources have to be protected and addressed moreadequately under the DP. India will have to fight forits fair share of carbon and development space. Thesources and channels of providing long-term financeby developed countries have not yet been clearlyidentified. With no certainty on funding in the comingyears, it is absolutely necessary to expeditiouslymobilize finance and provide initial capital to the GCFfor its operations.
12.50 Based on historic emissions andresponsibilities, developed countries should take thelead. However, according to a June 2011 study bythe Stockholm Environment Institute, 'Comparisonof Annex 1 and non-Annex 1 pledges under theCancun Agreements', developing countries arepledging greater cuts in their GHG emissions thandeveloped countries. India is also proactive in thisregard with its intentions and ambition firmly in placein its policies and programmes. One may rightlyargue that with the Twelfth Plan's focus on
'environmental sustainability', India is on the righttrack with the right enabling environment and has anumber of achievements to its credit. However, thechallenge while India is growing is to identify thekey drivers and enablers of growth, be it infrastructure,transportation sector, housing, or agriculture and tomake these sectors grow sustainably. This leadsus to the next and most vital issue: of finding andraising new and additional resources for meetingeconomic well-being needs with greaterenvironmental sustainability. More often, it is theresource crunch which is the stumbling block fordeveloping countries like India. While it makes effortsto efficiently and expeditiously bring price signalsand other policy instruments into play, India coulddo much more if new and additional finance andtechnology are made available through multilateralprocesses.
12.51 Be it national or global, environmentaldecline and global warming occurred gradually overdecades and centuries, picking up pace with time.We must remember that the clock is now ticking onthe needed global action to combat and contain thisdecay. This action should be fair, just and equitablefor all countries so that the future we want will be afuture in which there is ecological and economicspace for sustainable development for all.
http://indiabudget.nic.in

Human DevelopmentCHAPTER
13
Economic growth though important cannot be an end in itself. Higher standards
of living as well as of development opportunities for all, stemming from the greater
resources generated by economic growth, are the ultimate aim of development policy.
This implies the need to bridge regional, social and economic disparities, as well as
the empowerment of the poor and marginalized, especially women, to make the
entire development process more inclusive. The draft Twelfth Five Year Plan's subtitle
'Faster, More Inclusive and Sustainable Growth', puts the growth debate in the
right perspective. The government's targeted policies for the poor, with the prospect
of fewer leakages, can help better translate outlays into outcomes.
13.2 The global economic and financial crisis whichhas persisted for the last five years has not onlyexposed the vulnerability of almost all the countriesover the globe to external shocks, but also haslessons for development planning. Countries needto have inbuilt social safety nets for facing sucheventualities, which affect the weak and vulnerablethe most, and wipe out the fruits of growth for years.India with its focus on inclusive development andtimely interventions has, however, been able toweather the crisis better than many other countries.
13.3 India is on the brink of a demographicrevolution with the proportion of working-agepopulation between 15 and 59 years likely to increasefrom approximately 58 per cent in 2001 to more than64 per cent by 2021, adding approximately 63.5million new entrants to the working age groupbetween 2011 and 2016, the bulk of whom will be inthe relatively younger age group of 20-35 years.Given that it is one of the youngest large nations inthe world, human development assumes greateconomic significance for it as the demographicdividend can be reaped only if this young populationis healthy, educated, and skilled (See chapter 2).The emphasis on human development also gainssignificance in the light of our major social indicatorsin the recent past being less encouraging than those
of our neighbours like Bangladesh and Sri Lanka.Therefore policy planners in India have, over theyears, engaged themselves in making moreinclusive growth and development policies, focusingon human development. This approach has beenreflected in the substantial enhancement inbudgetary support for major social-sectorprogrammes during 2012-13 like the Pradhan MantriGram Sadak Yojana (PMGSY), Backward RegionsGrant Fund, Right to Education (RTE)-Sarv ShikshaAbhiyan (SSA), Rashtriya Madhyamik ShikshaAbhiyan, National Rural Health Mission (NRHM),and rural drinking water and sanitation schemes.
HUMAN AND GENDERDEVELOPMENT: INTERNATIONALCOMPARISON
13.4 As per the latest available HumanDevelopment Report (HDR) 2011 published by theUnited Nations Development Programme (UNDP)(which estimates the human development index[HDI] in terms of three basic capabilities: to live along and healthy life, to be educated andknowledgeable, and to enjoy a decent economicstandard of living), the HDI for India was 0.547 in2011 with an overall global ranking of 134 (out of
http://indiabudget.nic.in

270 Economic Survey 2012-13
187 countries) compared to 119 (out of 169 countries)in HDR 2010. The growth rate in average annual HDIof India between 2000-11 is among the highest, afinding also corroborated by the India HumanDevelopment Report (IHDR) 2011 brought out by theInstitute of Applied Manpower Research and thePlanning Commission. According to the IHDR, HDIbetween 1999-2000 and 2007-8 has increased by21 per cent, with an improvement of over 28 per centin education being the main driver. India is ranked129 in terms of the gender inequality index(GII) whichcaptures the loss in achievement due to genderdisparities in the areas of reproductive health,empowerment, and labour force participation, withvalues ranging from 0 (perfect equality) to 1 (totalinequality). A lot more needs to be done as our GII ishigher than the global average of 0.492. Evenneighbours like Pakistan (115), Bangladesh (112),and Sri Lanka (74), have performed better in termsof this indicator (Table 13.1). The gross nationalincome (GNI) per capita ranking minus HDI rankingfor India is -10 indicating that India is better rankedby GNI than by non-income HDI. As a corollary, Indiais worse off in its performance of non-income HDIvalue computed from life expectancy and education.
INCLUSIVE DEVELOPMENT
13.5 This section and the one that follows examinethe major dimensions of inclusive development likepoverty alleviation, employment generation, health,education, women's empowerment, and socialwelfare besides reviewing the progress of importantgovernment programmes in these sectors.
13.6 Inclusive development includes socialinclusion along with financial inclusion and in mostcases the socially excluded are also financiallyexcluded. Many segments of the population likelandless agricultural labourers, marginal farmers,scheduled castes (SCs), scheduled tribes (STs), andother backward classes (OBCs) continue to suffersocial and financial exclusion. The government'spolicies are directed towards bringing thesemarginalized sections of the society into themainstream as is also reflected in social-sectorexpenditure by the government.
Trends in India's social-sectorexpenditure13.7 Central support for social programmes hascontinued to expand in various forms although most
Table 13.1 : India’s Global Position in Human Development 2011HDI Average annual GNI per GNI per Non- GII
HDI growth capita capita incomeCountry Value Rank rate (per cent) (constant rank HDI Value Rank
1990- 2000- 2005 minus value2011 2011 PPP $) HDI rank
Norway 0.943 1 0.53 0.29 47,557 6 0.975 0.075 6
Australia 0.929 2 0.30 0.23 34,431 16 0.979 0.136 18
Brazil 0.718 84 0.86 0.69 10,162 -7 0.748 0.449 80
China 0.687 101 1.62 1.43 7476 -7 0.725 0.209 35
Sri Lanka 0.691 97 0.81 0.80 4943 12 0.768 0.419 74
Thailand 0.682 103 0.89 0.78 7694 -14 0.714 0.382 69
Philippines 0.644 112 0.58 0.62 3478 11 0.725 0.427 75
Egypt 0.644 113 1.24 0.88 5269 -6 0.686 NA NA
Indonesia 0.617 124 1.19 1.17 3716 -2 0.674 0.505 100
South Africa 0.619 123 0.03 0.05 9469 -44 0.604 0.490 94
Vietnam 0.593 128 1.50 1.06 2805 8 0.662 0.305 48
India 0.547 134 1.38 1.56 3468 -10 0.568 0.617 129Pakistan 0.504 145 1.12 1.33 2550 -7 0.526 0.573 115
Bangladesh 0.5 146 1.69 1.55 1529 11 0.566 0.550 112
World 0.682 0.66 0.66 10,082 0.683 0.492
Source : World HDR 2011.Note : NA: Not Available, Data refer to 2011 or the most recent year available; PPP is purchasing power parity.
http://indiabudget.nic.in

271Human Development
Table 13.2 : Central Government Expenditure (Plan and non-Plan) on Social Servicesand Development
(as per cent of total expenditure)ITEM 2007-8 2008-9 2009-10 2010-11 2011-12 2012-13
Actual Actual Actual Actual R E B E
1. Social servicea. Education,sports,youth affairs 4.02 4.27 4.15 4.56 4.38 4.52b. Health & family welfare 2.05 2.09 2.00 1.98 1.90 2.06c. Water supply, housing, etc. 2.02 2.54 2.39 2.35 1.93 2.08d. Information & broadcasting 0.22 0.23 0.20 0.21 0.19 0.17e.Welfare of SCs/STs, and OBCs 0.36 0.41 0.43 0.58 0.64 0.61f. Labour & employment 0.27 0.28 0.22 0.24 0.23 0.28g. Social welfare & nutrition 0.82 1.15 0.87 1.01 1.19 1.25h. North-eastern areas 0.00 0.00 0.02 0.02 1.65 1.88i. Other social services 1.29 1.55 1.67 1.66 0.21 0.19Total 11.06 12.52 11.94 12.61 12.31 13.04
2. Rural development 2.80 4.56 3.77 3.51 2.97 2.743. Pradhan Mantri Gram Sadak Yojana (PMGSY) 0.91 0.88 1.11 1.87 1.52 1.614. Social services, rural development and PMGSY 14.77 17.95 16.82 18.00 16.79 17.395. Total central government expenditure 100.00 100.00 100.00 100.00 100.00 100.00
Source : Budget Documents.Note : RE-Revised Estimates; BE- Budget Estimates.
Table 13.3 : Trends in Social Services Expenditure by General Government(Central and State Governments combined)
(` crore)
Items 2007-8 2008-9 2009-10 2010-11 2011-12 2012-13 RE BE
Total expenditure 1315283 1599677 1852119 2145145 2518825 2835873Expenditure onsocial services 294583 380628 446382 529398 617939 710759of which: i) Education 129366 162008 197070 244156 291378 331524
ii) Health 63226 74273 88054 100576 115711 136296iii) Others 101991 144347 161258 184666 210850 242939
As percentage to GDPTotal expenditure 26.37 28.41 28.59 27.52 28.07 28.28Expenditure on social services 5.91 6.76 6.89 6.79 6.89 7.09
of which: i) Education 2.59 2.88 3.04 3.13 3.25 3.31ii) Health 1.27 1.32 1.36 1.29 1.29 1.36iii) Others 2.05 2.56 2.49 2.37 2.35 2.42
As percentage to total expenditureExpenditure on social services 22.4 23.8 24.1 24.7 24.5 25.1
of which: i) Education 9.8 10.1 10.6 11.4 11.6 11.7ii) Health 4.8 4.6 4.8 4.7 4.6 4.8iii) Others 7.8 9.0 8.7 8.6 8.4 8.6
As percentage to social services expenditurei) Education 43.9 42.6 44.1 46.1 47.2 46.6ii) Health 21.5 19.5 19.7 19.0 18.7 19.2iii) Others 34.6 37.9 36.1 34.9 34.1 34.2
Source : RBI as obtained from Budget Documents of union and state governments.BE: Budget Estimates; RE: Revised Estimate.
http://indiabudget.nic.in

272 Economic Survey 2012-13
13.9 However, India's expenditure on health as aper cent of GDP is very low compared to many otheremerging and developed countries. Unlike mostcountries, in India private-sector expenditure onhealth as a percentage of GDP is higher than publicexpenditure and was more than double in 2010.Despite this the total expenditure on health as apercentage of GDP is much lower than in many otherdeveloped and emerging countries and the lowestamong BRICS (Brazil, Russia, India, China and SouthAfrica) countries (Table13.4).
POVERTY13.10 The Planning Commission estimates povertyusing data from the large sample surveys onhousehold consumer expenditure carried out by theNational Sample Survey Office (NSSO) every fiveyears. It defines poverty line on the basis of monthlyper capita consumption expenditure (MPCE). Themethodology for estimation of poverty followed bythe Planning Commission has been based on therecommendations made by experts in the field fromtime to time. The Expert Group headed by ProfessorSuresh D. Tendulkar which submitted its report inDecember 2009 has computed the poverty lines atall India level as MPCE of ̀ 447 for rural areas and ̀579 for urban areas in 2004-5. After 2004-5, thissurvey has been conducted in 2009-10. The PlanningCommission has updated the poverty lines andpoverty ratios for the year 2009-10 as per therecommendations of the Tendulkar Committee usingNSS 66th round (2009-10) data from the HouseholdConsumer Expenditure Survey. It has estimated thepoverty lines at all India level as an MPCE of ̀ 673for rural areas and ̀ 860 for urban areas in 2009-10.Based on these cut-offs, the percentage of peopleliving below the poverty line in the country hasdeclined from 37.2 per cent in 2004-5 to 29.8 percent in 2009-10. Even in absolute terms, the numberof poor people has fallen by 52.4 million during thisperiod. Of this, 48.1 million are rural poor and 4.3million are urban poor. Thus poverty has declined onan average by 1.5 percentage points per yearbetween 2004-5 and 2009-10. The annual averagerate of decline during the period 2004-5 to 2009-10is twice the rate of decline during the period 1993-4to 2004-5 (Table13.5).
13.11 Infant mortality rate (IMR) which was 58 perthousand in the year 2005 has fallen to 44 in theyear 2011. The number of rural households providedtoilet facilities annually have increased from 6.21 lakhin 2002-3 to 88 lakh in 2011-12. Similarly MPCE (at
social-sector subjects fall within the purview of thestates. Central government expenditure on socialservices and rural development (Plan and non-Plan)has increased from 14.77 per cent in 2007-8 to 17.39per cent in 2012-13 (Budget Estimates [BE]) withan all-time high of 18 per cent in 2010-11 due to thecombined effect of higher expenditure under thePradhan Mantri Gram Sadak Yojana (PMGSY) andeducation (Table 13.2).
13.8 Expenditure on social services by the generalgovernment (centre and states combined) has alsoshown increase in recent years reflecting the higherpriority given to this sector (Table 13.3). Expenditureon social services as a proportion of total expenditureincreased from 22.4 per cent in 2007-8 to 24.7 percent in 2010-11 and further to 25 .1 per cent in 2012-13 (BE). Among social services, the share ofexpenditure on education has increased from 43.9per cent in 2007-8 to 46.6 per cent in 2012-13 (BE),while that on health has fallen from 21.5 per cent to19.2 per cent. As a proportion of the gross domesticproduct (GDP), expenditure on social servicesincreased from 5.91 per cent in 2007-8 to 6.79 percent in 2010-11 and further to 7.09 per cent in 2012-13(BE). While expenditure on education as aproportion of GDP has increased from 2.59 per centin 2007-8 to 3.31 per cent in 2012-13 (BE), that onhealth has increased from 1.27 per cent in 2007-8 to1.36 per cent in 2012-13 (BE).
Table 13.4 : Expenditure on Health inDeveloped and Emerging Economies
(as percentage of GDP)
Country Expenditure on health (2010 or latestavailable year)
Public Private TotalAustralia 6.2 2.9 9.1
Norway 8.1 1.4 9.4
United Kingdom 8.0 1.6 9.6
United States 8.5 9.1 17.6
Mexico 2.9 3.3 6.2
Indonesia 1.3 1.3 2.6
Brazil 4.2 4.8 9.0
Russian Federation 3.2 1.9 5.1
India 1.2 2.9 4.1China 2.7 2.4 5.1
South Africa 3.9 5.0 8.9
Source: OECD Factbook 2013: Economic,Environmental and Social Statistics.
http://indiabudget.nic.in

273Human Development
constant prices) has also increased from ` 558.78and ` 1052.36 during 2004-5 to ` 707.24 and `1359.75 in 2011-12 in rural and urban areasrespectively. The improvement in these socialindicators is also a reflection of fall in deprivation.The Planning Commission has also constituted anExpert Group under the Chairmanship of Dr C.Rangarajan to 'Review the Methodology forMeasurement of Poverty' in June 2012. (Also seeinter-state comparison of poverty in Table 13.8).
INEQUALITY
13.12 HDR measures inequality in terms of twoindicators. The first indicator is the income Ginicoefficient which measures the deviation ofdistribution of income (or consumption) among theindividuals within a country from a perfectly equaldistribution. For India, the income Gini coefficientwas 36.8 in 2010-11. In this respect, inequality inIndia is lower than many other developing countriese.g. South Africa (57.8), Brazil (53.9), Thailand (53.6),Turkey (40.8), China (41.5), Sri Lanka (40.3),Malaysia (46.2), Vietnam (37.6), as well as countrieslike USA (40.8), Hong Kong (43.4), Argentina (45.8),Israel (39.2), Bulgaria (45.3) etc., which are otherwise
ranked very high in terms of human developmentindex. The second indicator is the quintile incomeratio, which is a measure of average income of therichest 20 per cent of the population to that of poorest20 per cent. The quintile income ratio for India was5.6 in 2010-11. Countries like Australia (7.0), theUSA (8.5), New Zealand (6.8), Singapore (9.8), theUK (7.8), Argentina (12.3), Mexico (14.4), Malaysia(11.4), Philippines (9.0), Vietnam (6.2) had higherratios. This implies that the inequality between thetop and bottom quintiles in India was lower than alarge number of countries.
13.13 To estimate the rural-urban gap, the monthlyper capita expenditure (MPCE) defined first athousehold level to assign a value that indicates thelevel of living to each individual or household is used.According to the provisional findings of the 68th round(2011-12) of the NSS, average MPCE (UniformReference Period [URP] based) is `1281.45 and ̀2401.68 respectively for rural and urban Indiaindicating rural-urban income disparities. However,monthly per capita rural consumption rose by 18per cent in real terms in 2011-12 over 2009-10, whilemonthly per capita urban consumption rose by only13.3 per cent. Thus the rate of increase in the MPCEof rural areas is higher than that of urban areas,
Table 13.5 : Number and Percentage of Poor* Year Number of poor (million) Poverty ratio (%)
Rural Urban Total Rural Urban Total
1993-4 328.6 74.5 403.7 50.1 31.8 45.3
2004-5 326.3 80.8 407.1 41.8 25.7 37.2
2009-10 278.2 76.5 354.7 33.8 20.9 29.8
Annual Average Decline : 1993-4 to 2004-5 0.75 0.55 0.74(percentage points per annum)
Annual Average Decline : 2004-5 to 2009-10 1.60 0.96 1.48(percentage points per annum)
Source : Planning Commission, * Estimated by Tendulkar Method.
Table 13.6 : Average MPCE (Uniform Reference Period)(in ` )
NSS Round Year Constant prices (2004-5) Current prices (2011-12)Rural Urban Rural Urban
68th Round July 2011-June 2012 707.24 1359.75 1281.45 2401.68
66th Round July 2009-June 2010 599.06 1200.01 927.70 1785.81
61st Round July 2004-June 2005 558.78 1052.36 558.78 1052.36
Source: NSSO Press release 1 August 2012 (The results of 68th round of NSS data are provisional).
http://indiabudget.nic.in

274 Economic Survey 2012-13
indicating a bridging of the rural-urban gap (Table13.6). Out of the MPCE, the share of food as per66th round NSS data (2009-10) is ̀ 600 (57 per cent)and ` 881(44 per cent) for rural and urban Indiarespectively, showing a higher share for food in ruralcompared to urban India.
EMPLOYMENT
13.14 The last decade, i.e. 1999-2000 to 2009-10,witnessed an employment growth of 1.6 per centper annum based on usual principal and subsidiarystatus (UPSS). Employment growth in second halfof the decade was relatively modest. This as perNSSO survey, 2009-10 was largely on account of alower labour force participation rate (LFPR), acrossall ages in 2009-10 vis-à-vis 2004-5. Labour forceparticipation rate, which reflects the persons whoexpress their willingness to work declined from 430per thousand persons in 2004-5 to 400 per thousandpersons in 2009-10. The LFPR declined particularlyfor rural females. The growth of those in labour forcedeclined possibly on account of greater number ofpersons opting for education/skill development.Studies using NSS data show that there has been asteady increase in the ratio of students to totalpopulation from 20.5 per cent in 1993-4 to 24.3 percent in 2004-5 and further to 26.6 per cent in 2009-10 (Jayan Jose Thomas, EPW, December 22, 2012)and this largely explains the modest growth inemployment in second half of 2000-10. The studentsto population ratio increased faster in rural areasand more so for females. It may, however, bementioned that the unemployment rate, accordingto UPSS criteria, in fact declined between 2004-5and 2009-10, both in rural and urban areas, implyingthat relatively larger proportions of persons who werewilling to work, were actually employed.13.15 An increased intensity of employment is alsoreflected by an overall increased availability ofemployment to workers based on current daily status(CDS). The CAGR of employment on CDS basis forthe period 2004-5 to 2009-10 is 1.11 per cent perannum which is significantly higher than the growthof employment in UPSS terms. One development ofinterest is the loss in female employment in ruralareas using both UPSS and CDS methods and lossin female employment in urban areas on UPSS basis.One of the reasons for this is a significant number ofwomen (137 million in 2009-10) opted not to work to
continue education. But total employment (rural andurban combined of males and females combined) ispositive on both methods.
Unemployment13.16 The unemployment rate increased at a slowpace on UPSS basis and at a relatively higher paceon CDS basis from 1993-4 to 2004-5. However, in2009-10 there was a fall in the unemployment ratewhich was relatively more on CDS basis (See Figure13.1 and Table 13.8). Despite negligible employmentgrowth, the unemployment rate (CDS method) fellfrom 8.2 per cent in 2004-5 to 6.6 per cent in 2009-10. The decline in CDS unemployment rate impliesa decline in unemployed persondays. The totalnumber of unemployed persondays declined by 6.5million persons, from around 34.5 million in 2004-5to 28 million in 2009-10.
13.17 The fall in unemployment despite marginalgrowth in employment in 2009-10 could be due tothe demographic dividend, as an increasing proportionof the young population opts for education ratherthan participating in the labour market. This isreflected in the rise in growth in enrolment of studentsin higher education from 49.25 lakh in 1990-91 to169.75 lakh in 2010-11. Similarly gross enrolmentratio in class I-VIII has risen from 93.54 in 2004-5 to104.3 in 2010-11. Enactment of the Right toEducation and programmes like the Sarva ShikshaAbhiyan could also have contributed to this.
Employment in the Organized Sector13.18 Employment growth in the organized sector,public and private combined, has increased by 1.0per cent in 2011, as against 1.9 per cent in 2010(Table 13.7). The annual growth rate of employmentin the private sector in 2011 was 5.6 per cent whereasthat in the public sector was negative. The share ofwomen in organized-sector employment was around20.5 per cent during 2009-11 and has remained nearlyconstant in recent years.
Employment Situation in 2011-12 as PerQuarterly Survey Reports13.19 The Fifteenth Quarterly Quick EmploymentSurvey by the Labour Bureau to assess the impactof the economic slowdown on employment in Indiaindicates that the upward trend in employment sinceJuly 2009 has been maintained (Box 13.1).
http://indiabudget.nic.in

275Human Development
Table 13.7 : Overall Employment in Public and Private Sectors
Sector Employment (in lakh) as on 31 March Percentage Percentagechange 2010/2009 change 2011/2010
2009 2010 2011
Public 177.95 178.62 175.48 0.4 -1.8
Private 103.77 108.46 114.52 4.5 5.6
Total 281.72 287.08 289.99 1.9 1.0
Women 55.80 58.59 59.54
Source: Annual Employment Review, 2011 (Directorate General of Employment and Training).Note: 1) Excludes Sikkim, Arunachal Pradesh, Dadra & Nagar Haveli, and Lakshadweep. 2) Industry-wise break-up may not tally with public sector, private sector and grand total due to non-inclusion of data as per National Industrial Classification (NIC) -1998, in respect of J&K, Manipur, and Daman &Diu in 2011.
Source : Second Annual Report to the People on Employment 2011 (Ministry of Labour & Employment).
Box 13.1 : Fifteenth Quarterly Survey Report on Effect of Economic Slowdown on Employmentin India April to June 2012The results for selected sectors, i.e. textiles including apparel, leather, metals, automobiles, gems and jewellery, transport,information technology (IT) / business process outsourcing (BPO) and handloom/powerloom are as follows:-
Overall employment in June, 2012 over June, 2011 has increased by 6.94 lakh, with the highest increase recorded inIT/BPO (4.44 lakh) sector followed by 1.70 lakh in Textiles including Apparels, 0.45 lakh in Transport, 0.26 lakh inMetals, 0.19 lakh in Gems and Jewellery and 0.11 lakh in Automobiles sectors during the period. On the other hand,employment in handloom/powerloom and leather sectors has marginally declined during this period.
In export oriented units, employment at the overall level has increased by 5.81 lakh whereas in the non-exportingunits, it has increased by 1.10 lakh during the period June, 2012 over June, 2011.
During the quarter March to June 2012, employment increased in respect of only Textiles including Apparelsfollowed by IT/BPO and Gems & Jewellery. There was no growth in employment in the Leather, Transport andHandloom/Powerloom sectors, while sectors like Metals and Automobiles registered negative growth. Overallemployment has increased by 0.73 lakh during this quarter.
The results of the15th quarterly survey reveal that there has been a sustained and consecutive increase in employmentin the sectors covered at overall level during the last eleven quarters with a total addition of 30.73 lakh employmentduring this recovery period.
Source : Labour Bureau (Ministry of Labour & Employment).
http://indiabudget.nic.in

276 Economic Survey 2012-13
Table 13.8 : Socio-Economic Profiles & Inter-State comparison of some Major States of India
S. No. Socio-economic Indicators/Items Andhra Assam Bihar GujaratPradesh
1 Population Related Census 2011 (Provisional) *Percentage Decadal Growth of Population (2001-11) 11.10 16.93 25.07 19.17 Sex-ratio (No. of Females per 1000 Males) 992 954 916 918
2 Growth Related at constant prices 2004-5(as on 14 August 2012) #GSDP Growth 2011-12 6.72 8.42 16.71 8.20GSDP Growth 2005-6 to 2011-12 8.90 6.05 10.17 9.98Growth in Per Capita Income 2011-12 5.75 7.24 15.44 8.65^
3 Poverty Headcount Ratio (per cent)***2009-10 (Rural) 22.8 39.9 55.3 26.72009-10 (Urban) 17.7 26.1 39.4 17.92009-10(Total) 21.1 37.9 53.5 23.02004-5 (Rural) 32.3 36.4 55.7 39.12004-5 (Urban) 23.4 21.8 43.7 20.12004-5 (Total) 29.9 34.4 54.4 31.8
4 Rual-Urban Disparity 2009-10##Average MPCEMMRP (Rural) (`) 1234 1003 780 1110Per cent Share of Food (Rural) 58.1 64.4 64.7 57.7Average MPCEMMRP (Urban)(`) 2238 1755 1238 1909Per cent Share of Food (Urban) 44.8 52.9 52.9 46.2
5 Unemployment Rates 2009-10 (per 1000)according to usual status (adjusted) ##Rural 12 39 20 8Urban 31 52 73 18
6 Health RelatedMale (Life expectancy at birth 2006-10)$ 63.5 61.0 65.5 64.9Female (Life expectancy at birth 2006-10)$ 68.2 63.2 66.2 69.0Infant Mortality Rates(per 1000 live births) 2011* 43 55 44 41Birth Rate (per 1000) 2011 * 17.5 22.8 27.7 21.3Death Rate(per 1000) 2011* 7.5 8.0 6.7 6.7
7 Education Related 2010-11 $$GER (6-13 years) 92.0 84.0 102.9 107.2Pupil-Teacher Ratio (Primary/ Jr.Basic School) 31 28 76 NAPupil-Teacher Ratio (Middle/Sr. Basic School) 25 21 51 35
8 Financial Inclusion (In per cent)Decadal Growth Rate of Bank Branches (&) 35.4 16.5 14.4 25.3Households availing Banking Services in 2011* 53.0 44.1 44.4 57.9
9 Key Social-sector ProgrammesNo.of 24x7 PHCs, Additional PHCs, CHCs & other sub-districts 1183 548 612 437facilities under NRHM $Average persondays per Household under Mahatma Gandhi 58 26 38 38NREGA 2011-12 @Percentage Share of Women in Employment under MGNREGA 2011-12 57.79 24.87 28.82 46.54Indira Awas Yojana (IAY) Houses constructed during 2011-12(Nos.) @ 249013 143770 469885 111999Percentage share of total houses constructed during 2011-12 under IAY 10.08 5.82 19.01 4.53
Source: * Office of Registrar General of India(RGI);*** Planning Commission; $ M/O H & FW;$$ M/O HRD; # CSO;## NSS(66th round); NA Not Available.
MMRP Modified mixed reference period@ DMU/MPR of M/O RD; (&) Study on Financial Inclusion by Justice K S Hegde Institute;^ Growth rate in per capita income of Gujarat for 2010-11 is repeated.
http://indiabudget.nic.in

277Human Development
Haryana Himachal Karnat- Kerala Madhya Mahara- Odisha Punjab Rajas- Tamil Uttar West AllPradesh aka Pradesh shtra than Nadu Pradesh Bengal India
19.90 12.81 15.67 4.86 20.30 15.99 13.97 13.73 21.44 15.60 20.09 13.93 17.64877 974 968 1,084 930 925 978 893 926 995 908 947 940
7.88 7.59 7.52 7.80 11.98 8.54 7.18 5.68 5.41 7.37 6.04 6.55 6.489.39 8.29 8.37 8.31 8.77 9.97 8.52 7.11 7.78 9.68 7.04 6.94 8.346.18 5.76 6.69 7.13 10.48 8.73 4.64 4.24 3.72 6.72 4.17 5.67 5.16
18.6 9.1 26.1 12.0 42.0 29.5 39.2 14.6 26.4 21.2 39.4 28.8 33.823.0 12.6 19.6 12.1 22.9 18.3 25.9 18.1 19.9 12.8 31.7 22.0 20.920.1 9.5 23.6 12.0 36.7 24.5 37.0 15.9 24.8 17.1 37.7 26.7 29.824.8 25.0 37.5 20.2 53.6 47.9 60.8 22.1 35.8 37.5 42.7 38.2 41.822.4 4.6 25.9 18.4 35.1 25.6 37.6 18.7 29.7 19.7 34.1 24.4 25.724.1 22.9 33.4 19.6 48.6 38.2 57.2 20.9 34.4 29.4 40.9 34.2 37.2
1510 1536 1020 1835 903 1153 818 1649 1179 1160 899 952 105454.0 NA 56.5 45.9 55.8 54.0 61.9 48.2 54.8 54.7 57.9 63.5 57.0
2321 2654 2053 2413 1666 2437 1548 2109 1663 1948 1574 1965 198443.1 NA 42.3 40.2 41.7 41.0 48.4 44.3 48.0 45.0 46.3 46.2 44.4
18 16 5 75 7 6 30 26 4 15 10 19 1625 49 27 73 29 32 42 48 22 32 29 40 34
67.0 67.7 64.9 71.5 61.1 67.9 62.2 67.4 64.7 67.1 61.8 67.4 64.669.5 72.4 69.7 76.9 63.8 71.9 63.9 71.6 68.3 70.9 63.7 71.0 67.7
44 38 35 12 59 25 57 30 52 22 57 32 4421.8 16.5 18.8 15.2 26.9 16.7 20.1 16.2 26.2 15.9 27.8 16.3 21.8
6.5 6.7 7.1 7.0 8.2 6.3 8.5 6.8 6.7 7.4 7.9 6.2 7.1
90.5 111.0 99.3 96.2 122.6 100.0 104.8 103.1 99.3 112.0 109.5 90.1 104.351 15 17 23 38 29 33 26 46 27 79 45 4338 14 27 25 39 32 26 15 26 32 69 49 33
59.5 29.2 28.5 30.6 21.2 28.1 27.9 39.8 25.5 31.3 26.9 18.4 28.868.1 89.1 61.1 74.2 46.6 68.9 45.0 65.2 68.0 52.5 72.0 48.8 58.7
407 156 1332 660 651 645 394 407 1500 1844 903 596 13835
39 53 42 45 43 50 33 26 47 48 36 27 43
36.44 59.48 45.71 92.76 42.48 45.95 38.60 43.17 69.20 73.36 16.98 32.46 47.9817282 6019 26965 54499 98447 141479 141398 16622 125642 91631 307012 186224 2471421
0.70 0.24 1.09 2.21 3.98 5.72 5.72 0.67 5.08 3.71 12.42 7.54 100.00
http://indiabudget.nic.in

278 Economic Survey 2012-13
SOCIO-ECONOMIC PROFILE OF STATESAND INTER-STATE COMPARISONS
Human Development: Inter-statecomparisons13.20 Narrowing inter-state and inter-regionaldisparities is also one of the objectives of inclusivedevelopment. Inter-state comparisons of socio-economic development of selected major statesbased on available indicators from different sourcesshow some interesting results (Table 13.8).
Population Related:
Bihar has the highest decadal (2001-11) growthrate of population (25.07 per cent), while Keralahas the lowest rate (4.86 per cent). Some bigstates like Gujarat, Haryana, Madhya Pradesh,Rajasthan, and Uttar Pradesh also have highdecadal growth of population.
In 2011, Kerala has the highest sex ratio with1084 females per 1000 males, followed by TamilNadu (995), while Haryana is at the bottom (877).Interestingly, the sex-ratios in some of thedeveloped states like Gujarat and Maharashtraare also low at 918 and 925 respectively.
Growth Related:
The best performers in terms of growth during2011-12 are Bihar (16.71 per cent) followed byMadhya Pradesh and Maharashtra. The growthof these states is much above the all Indiaaverage. The worst performers are Rajasthan(5.41 per cent) followed by Punjab and UttarPradesh. States with the highest growth rate forthe period 2005-6 to 2011-12 are Bihar (10.17per cent) followed by Gujarat and Maharashtra.
In terms of growth in per capita income, the bestperformer is Bihar (15.44 per cent) followed byMadhya Pradesh and Maharashtra due to highgrowth in gross state domestic product (GSDP)in 2011-12 and despite their high decadal growthin population. Per capita income growth is thelowest in Rajasthan (3.72 per cent), followed byUttar Pradesh, Punjab, and Odisha which areall below the all India per capita income growth.
Poverty:
The poverty estimates indicate that the highestpoverty headcount ratio (HCR) exists in Bihar at53.5 per cent as against the national average of29.8 per cent. In 2009-10 compared to 2004-5,Bihar has displaced Odisha as the poorest state,
with Odisha's situation improving considerablyin 2009-10. Lowest poverty is in HimachalPradesh (9.5 per cent) followed by Kerala (12per cent).
Rural-Urban Disparity:
Bihar has the lowest MPCE both in rural andurban areas at ` 780 (with 65 per cent foodshare) and ̀ 1238 (with 53 per cent food share)respectively. In comparison, Kerala has thehighest in both rural and urban areas at ̀ 1835(with 46 per cent food share) and ̀ 2413 (with40 per cent food share) respectively. It is obviousthat poorer states spend a greater proportion ofincome on food in total consumptionexpenditure.
Unemployment:
As per usual status(adjusted) NSS 66th round2009-10, the unemployment rate (per 1000)among the major states is the lowest inGujarat(18) and highest in Kerala(73) andBihar(73) in urban areas and the lowest inRajasthan (4) and again highest in Kerala (75)in rural areas. The low unemployment rate inrural areas in Rajasthan may partly be due tohigh absorption of Mahatma Gandhi NationalRural Employment Guarantee Act(MGNREGA) funds in the state. Kerala, whichhas performed well in terms of most indicators,performs less well in terms of unemployment(both rural and urban). This may be due tothe higher level of education in Kerala resultingin people not opting for manual jobs asobserved by some studies.
Health:
Kerala is the best performer in terms of lifeexpectancy at birth for both males (71.5 years)and females (76.9 years) whereas Assam is theworst performer for both males (61 years) andfemales (63.2 years) during 2006-10. Infantmortality rate (IMR) in 2011 is the lowest in Kerala(12) and highest in Madhya Pradesh (59) againstthe national average of 44. Birth rate is lowest inKerala (15.2) and highest in Uttar Pradesh (27.8)against the national average of 21.8. Death rateis lowest in West Bengal (6.2) and highest inOdisha (8.5) against the national average of 7.1.
Education:
Madhya Pradesh has the highest grossenrolment ratio (GER) (6-13 years) in 2010-11
http://indiabudget.nic.in

279Human Development
while Assam has the lowest. Pupil-teacher ratiosin primary and middle/basic schools are thelowest in Himachal Pradesh and high in stateslike Uttar Pradesh and Bihar.
Financial Inclusion:
In terms of decadal growth rate in bank branches,Haryana (59.5 per cent) has the highest growthand Bihar the lowest (14.4 per cent). Even anorth-eastern state like Assam (16.5 per cent)is better placed than Bihar. Himachal Pradesh(89.1 per cent) has the highest percentagehouseholds availing of banking services whileAssam (44.1 per cent) is the lowest followed byBihar (44.4 per cent). Thus in terms of both thesefinancial inclusion indicators, Bihar'sperformance is among the worst.
Key Social-sector Programmes:
While there are state-wise indicators for somesocial-sector programmes, it is not possible toevaluate the performance of states based juston numbers. The average persondays perhousehold under the MGNREGA in 2011-12 isthe highest in Andhra Pradesh (58 days) followedby Himachal Pradesh (53 days) and lowest inAssam and Punjab (both 26 days) against thenational average of 43 days. While the share ofwomen's employment under the MGNREGA isthe highest in Kerala (92.76 per cent) followedby Tamil Nadu (73.36 per cent), it is the lowestin Uttar Pradesh (16.98 per cent). While thestipulation of one-third women's participation hasbeen maintained at the all India level, in stateslike Uttar Pradesh, Assam, and Bihar, it hasbeen below the stipulated level.
Progress in terms of 24x7 primary health centres(PHCs), additional PHCs, CHCs and other sub-districts health facilities under the NRHM is thehighest in Tamil Nadu and lowest in HimachalPradesh. Under the Indira Awas Yojana (IAY),Bihar has the highest share followed by UttarPradesh and Andhra Pradesh whereas HimachalPradesh has the lowest.
13.21 Thus the inter-state comparison ofperformance of states based on different indicatorsshows that while some states have performed wellin terms of growth indicators, they have performedpoorly in terms of other indicators like poverty, rural-urban disparity, unemployment, education, healthand financial inclusion. This calls for a rethink onthe criteria used for devolution of funds to states
under Finance Commissions where criteria likeincome distance (12th Finance Commission) or fiscalcapacity distance (13th Finance Commission) alongwith population are given high weightage and noneof the human development indicators or financialinclusion indicators are used. Similarly the criteriaused for awarding special category status to states(hilly and difficult terrain, low population density and/or sizable share of tribal population, strategic locationalong borders with neighbouring countries, economicand infrastructural backwardness, and non-viablenature of state finances) need to be revisited.
POVERTY ALLEVIATION ANDEMPLOYMENT GENERATIONPROGRAMMES
13.22 The government is following a focusedapproach through various flagship schemes in theareas of poverty alleviation and employmentgeneration to achieve inclusive development. As thelast exercise conducted in 2002 to identify peopleliving in poverty in rural areas had several limitations,the Dr. N. C. Saxena Committee was constituted toadvise on the methodology for conducting a belowpoverty line (BPL) census. Consequently, a SocioEconomic and Caste Census (SECC) hascommenced in June 2011 through a door-to-doorenumeration across the country, which after duedeliberation will form the basis of targetingbeneficiaries under various social-sector progarmmes(Box.13.2).
13.23 Some important poverty alleviation andemployment generation programmes are as follows:
Mahatma Gandhi NREGA: This flagship programmeof the government aims at enhancing livelihoodsecurity of households in rural areas by providing atleast one hundred days of guaranteed wageemployment in a financial year to every householdwhose adult members volunteer to do unskilledmanual work with the stipulation of one-thirdparticipation of women. The MGNREGA provideswage employment while also focusing onstrengthening natural resource management throughworks that address causes of chronic poverty likedrought, deforestation, and soil erosion and thusencourage sustainable development. The MGNREGAis implemented in all districts with rural areas. Outof total a outlay of ̀ 33,000 crore approved for 2012-13, ` 25,894.03 crore has been released and thetotal fund available with the states including theopening balance of ̀ 10,009.09 crore is ̀ 41,788.74
http://indiabudget.nic.in

280 Economic Survey 2012-13
crore. Of this, ` 28,073.51 crore has been utilized(as on 31.01.2013) and about 4.39 crore householdshave been provided employment of 156.01 crorepersondays of which 82.58 crore (53 per cent) wereavailed of by women, 34.56 crore (22 per cent) SCs,and 24.90 crore (16 per cent) by STs. At nationallevel, with the average wage paid under theMGNREGA increasing from ̀ 65 in FY 2006-7 to ̀115 in FY 2011-12, the bargaining power of agriculturallabour has increased as even private sector wageshave increased as shown in many studies (SeeMGNREGA Sameeksha 2012). Improved economicoutcomes, especially in watershed activities, andreduction in distress migration are its otherachievements. Wages under the MGNREGA areindexed to the consumer price index for agriculturallabour (CPI-AL). While some initiatives have beentaken recently (Box.13.3), with better planning ofproject design, capacity building of panchayati rajinstitutions (PRIs), skill upgradation for enhancedemployability, and reduction of transaction costs,gaps in implementation could be plugged to a greaterextent and the assets so created could make a muchlarger contribution to increasing land productivity.
National Rural Livelihood Mission (NRLM)- Aajeevika:The Swarnjayanti Gram Swarozgar Yojana (SGSY)/NRLM a self-employment programme implemented
since April 1999 aims at lifting the assisted ruralpoor families (swarozgaris) above the poverty lineby providing them income-generating assets througha mix of bank credit and government subsidy. Therural poor are organized into self-help groups (SHGs)and their capacities built through training and skilldevelopment. The scheme is implemented with activeinvolvement of PRIs. Since the inception of the SGSY42.05 lakh SHGs have been formed, of whichapproximately 60 per cent are women SHGs. Total
Box 13.2 : Socio Economic and Caste Census (SECC)For the success of any targeted approach, the identification of the real beneficiaries is of paramount importance. In linewith this approach the Dr. N. C. Saxena Committee was constituted to advise on the methodology for a BPL census inrural areas. Since June 2011, for the first time through a comprehensive door-to-door enumeration in both rural and urbanIndia, authentic information is being made available on the socio-economic condition and educational status of variouscastes and sections through the SECC. This exercise will help better target government schemes to the right beneficiariesand ensure that all eligible beneficiaries are covered, while all ineligible beneficiaries are excluded. Households identifiedas highly deprived will have the highest inclusion priority under government welfare schemes. Use of the Aadhar numberin various beneficiary-oriented social sector programmes will also check duplications.
The SECC 2011 is being conducted simultaneously for rural and urban areas by the respective states, with technical andfinancial support from the Government of India. Enumeration is to be done with the help of about 6 lakh enumerators,who are accompanied by an equal number of technically qualified and computer literate Data Entry Operators (DEO)selected by the country's premier IT majors. The Ministry of Rural Development in association with the Ministry ofHousing and Urban Poverty Alleviation, Office of the Registrar General of India (RGI) and the states have shouldered theresponsibility of training the enumerators, supervisors, verifiers, and state officials engaged in the census operation. TheSECC process ensured transparency and people's participation. Before finalizing the outcomes, the household data,except caste data, will be placed in the public domain for scrutiny and go through a two-stage appeal procedure in the'claims and objections' stage. In rural areas, the Gram Sabha will also mandatorily scrutinize the data in a speciallyconvened meeting.
Enumeration under SECC 2011 has been completed in 2,339,926 enumeration blocks (EBs) comprising 94.26 per cent ofthe total EBs of all the states as on 31 December 2012. The government has constituted an Expert Committee under thechairpersonship of Professor Abhijit Sen, Member Planning Commission, to examine the SECC indicators and the dataanalysis and recommend appropriate methodologies for determining classes of beneficiaries for different rural developmentprogrammes. It will consult states, experts, and civil society organizations while arriving at these methodologies.
Source : Ministry of Rural Development
Box 13.3 : Major recent initiatives under theMGNREGA The basket of permissible activities has been expanded
to make it more meaningful. Electronic fund management system (eFMS) in all
states has been initiated in a phased manner to reducedelay in payment of wages.
Additional employment over and above 100 daysper household in notified drought-affected talukas/blocks is now permissible.
Provision has been made for seeding in Aadhaar intothe MGNREGA Workers records to prevent leakage.
Convergence of the MGNREGA with the TotalSanitation Campaign (TSC) has been undertaken.
Source : Ministry of Rural Development
http://indiabudget.nic.in

281Human Development
investment under the SGSY is ` 42,168.42 crorecomprising ` 28,824.53 crore as credit and` 13,343.89 crore as subsidy. Approximately 168.46lakh swarozgaris have been assisted with bank creditand subsidy. The SGSY now restructured as theNRLM has been renamed Aajeevika and implementedin mission mode across the country since 2011. Themain features of Aajeevika are: a) one woman memberfrom each identified rural poor household to bebrought under the SHG network, b) ensuring 50 percent of the beneficiaries from SC/STs, 15 per centfrom minorities, and 3 per cent persons with disabilitywhile keeping in view the ultimate target of 100 percent coverage of BPL families, c) training for capacitybuilding and skill development, d) ensuring revolvingfund and capital subsidy, e) financial inclusion,f) provision of interest subsidy, g) backward andforward linkages, and h) promoting innovations.
Swarna Jayanti Shahari Rozgar Yojana (SJSRY):The SJSRY launched on 1 December 1997 aims atproviding gainful employment to the urbanunemployed and underemployed, by encouragingthem to set up self-employment ventures or creatingwage employment opportunities. The scheme hasbeen revamped w.e.f. April 2009. The annualbudgetary provision for the SJSRY for the year 2012-13 is ` 838 crore and of this ` 516.77 crore hadbeen released up to 7 February 2013. A total of4,06,947 people have benefited from this schemeduring 2012-13.
SOCIAL PROTECTION PROGRAMMES
13.24 The coverage of social security schemes hasbeen expanded to provide a minimum level of socialprotection to workers in the unorganized sector andensure inclusive development. Such schemesinclude the following:
Aam Admi Bima Yojana (AABY): The Janashree BimaYojana (JBY) has now been merged with the AABYto provide better administration of life insurance coverto the economically backward sections of society.The scheme extends life and disability cover topersons between the ages of 18 and 59 years livingbelow and marginally above the poverty line under47 identified vocational/occupational groups,including 'rural landless households'. It providesinsurance cover of a sum of ̀ 30,000 on natural death,` 75,000 on death due to accident, ̀ 37,500 for partialpermanent disability due to accident, and ̀ 75,000on death or total permanent disability due toaccident. The scheme also provides an add-on
benefit of scholarship of ` 100 per month per childpaid on half-yearly basis to a maximum of twochildren per member studying in Classes 9 to 12(including ITI courses). The total annual premiumunder the scheme is ̀ 200 per beneficiary of which50 per cent is contributed from the Social SecurityFund created by the central government andmaintained by the Life Insurance Corporation of India(LIC). The balance 50 per cent is contributed bybeneficiary/state governments/union territory (UT)administrations. The scheme is being implementedthrough the LIC. A total of 289.94 lakh lives underthe JBY and 178.67 lakh lives under the AABY hadbeen covered till December 2012.
Rashtriya Swasthya Bima Yojana (RSBY): Thescheme provides smart card-based cashless healthinsurance cover of ̀ 30,000 per family per annum ona family floater basis to BPL families in theunorganized sector with the premium shared on75:25 basis by central and state governments. Incase of states of the north-eastern region andJammu and Kashmir, the premium is shared in theratio of 90:10. The scheme provides for portability ofsmart card by splitting the card value for migrantworkers. As on 31 December 2012, the scheme isbeing implemented in 27 states/ UTs with more than3.34 crore smart cards issued.
The Unorganized Workers Social Security Act 2008and National Social Security Fund: The Act providesfor constitution of a National Social Security Boardand State Social Security Boards which willrecommend social security schemes for unorganizedworkers. The National Social Security Board wasconstituted in August 2009. It has made somerecommendations regarding extension of socialsecurity schemes to certain additional segments ofunorganized workers. A National Social SecurityFund with initial allocation of ̀ 1000 crore to supportschemes for weavers, toddy tappers, rickshawpullers, beedi workers, etc. has also been set up.
Social Security Agreements (SSAs): SSA, a bilateralinstrument to protect the interests of Indianprofessionals as well as self-employed Indiansworking in foreign countries, was initiated by signingan SSA between India and Belgium on 3 November2006. So far India has signed 15 SSAs with Belgium,Germany, Switzerland, France, Luxembourg,Netherlands, Hungary, Denmark, Czech Republic,Republic of Korea, Norway, Finland, Canada,Sweden, and Japan. These SSAs facilitate mobilityof professionals between two countries by exempting
http://indiabudget.nic.in

282 Economic Survey 2012-13
them from double payment of social securitycontributions and enables them to enjoy the benefitsof exportability and totalization.
RURAL INFRASTRUCTURE ANDDEVELOPMENT
13.25 Rural infrastructure and developmentprogrammes for achieving a higher degree of rural-urban integration and an even pattern of growth andopportunities for the poor and disadvantaged sectionsof society include the following:
Bharat Nirman: Bharat Nirman, launched in 2005-6by the government to provide basic amenities andinfrastructure to rural India has six components:irrigation, roads, housing, water supply, electrification,and telecommunication connectivity.
Indira Awas Yojana (IAY): The IAY is one of the sixcomponents of Bharat Nirman. During 2012-13, asagainst a physical target of 30.10 lakh houses, 25.35lakh houses were sanctioned and 13.88 lakh hadbeen constructed as on 31 December 2012. Theunit assistance provided to rural households forconstruction of a dwelling unit under the IAY is beingrevised w.e.f. I April 2013 from ̀ 45,000 to ̀ 70,000in plain areas and from ̀ 48,500 to ̀ 75,000 in hilly/difficult areas/Integrated Action Plan (IAP) districts.Eighty-two left-wing extremism (LWE)-affecteddistricts have been made eligible for a higher rate ofunit assistance of ` 48,500 to ` 75,000 (w.e.f.1.4.2013). Since the inception of this scheme till 31December 2012, 301 lakh houses have beenconstructed. Under the Homestead Scheme, the unitassistance for purchase/acquisition of house sitesfor those rural BPL households who have neitherland nor a house site will be enhanced from ̀ 10,000to ` 20,000 w.e.f. 1 April 2013 to be shared by thecentre and states in a 50:50 ratio. Since the inceptionof the Homestead Scheme, funds amounting to `347.46 crore have been released to the states forpurchase of land and ` 1395.06 crore as incentivefor additional houses for providing homestead sites.For effective monitoring of the IAY, MIS software'Awaasoft' has been put in place.
Pradhan Mantri Gram Sadak Yoyana (PMGSY): ThePMGSY was launched in December 2000 as a fullyfunded centrally sponsored scheme with the objectiveof providing connectivity to the eligible unconnectedhabitations in the core network with a population of500 persons and above (as per Census 2001) inplains areas and 250 persons and above in hill states,
tribal areas, desert areas, and in the 82 selectedtribal and backward districts under the IAP. Sinceinception, projects totalling about 4,74,528 km ofroad to connect 1,26,176 habitations have beencleared with an estimated cost of ` 1,42,946 croreincluding upgradation. A sum of ` 1,02,658 crorehad been released to the states and about ̀ 96,939crore spent by December 2012. A total of 3,63,652km road length has been completed and newconnectivity has been provided to over 89,382habitations by the states. Work on a road length ofabout 1,07,739 km is in progress.
Rural Drinking Water: About 73.91 per cent of ruralhabitations are fully covered under the provision ofsafe drinking water in rural areas as measured byhabitations with the provision of at least 40 litres percapita per day (lpcd) of safe drinking water. The restare either partially covered or have chemicalcontamination in drinking water sources. As againstthe target of 7,98,967 habitations to be covered duringthe Eleventh Five Year Plan, the coverage up to 31March 2012 was 6,65,052 (83.23 per cent). Thefinancial outlay for rural drinking water supplyincreased considerably under Bharat Nirman from ̀4,098 crore in 2005-6 to ̀ 10,500 crore in 2012-13.All uncovered habitations have been reported as beingcovered on 1 April 2012. Census 2011 reported that84.2 per cent rural households as having improveddrinking water sources with tap water, hand pumps,and covered wells constituting the major sources.Therefore ensuring safe drinking water for theremaining 15.8 per cent of rural households withunimproved sources and 22.1 per cent of ruralhouseholds that have to fetch water from beyond500 m is the major challenge. In the Twelfth FiveYear Plan period, the focus is on increasing theservice level from 40 lpcd to 55 lpcd and provision ofdrinking water through piped water supply schemesand household tap connections.
Rural Sanitation—Total Sanitation Campaign (TSC) :According to Census 2011, only 32.7 per cent ofrural households have latrine facilities. The TSCrenamed the Nirmal Bharat Abhiyan (NBA) aims totransform rural India into 'Nirmal Bharat' by adoptinga community saturation approach and achieve 100per cent access to sanitation for all rural householdsby 2022. NBA projects have been sanctioned in 607rural districts with a total outlay of ` 22,672 crore,with a central share of ̀ 14,888 crore. Allocation forthe NBA has increased from ̀ 1500 crore in 2011-12to ` 2500 crore in 2012-13. Under the NBA, theprovision of incentives for individual household latrine
http://indiabudget.nic.in

283Human Development
units has been widened to cover all above povertyline (APL) households that belong to/are SCs, STs,small and marginal farmers, landless labourers withhomesteads, physically challenged, and womenheaded along with all BPL households. Since 1999,over 8.97 crore toilets have been provided to ruralhouseholds under the TSC/NBA. A total of 12.57lakh school toilet units and 4.24 lakh Anganwaditoilets have also been constructed. With increasingbudgetary allocations and focus on rural areas, thenumber of households being provided toilets annuallyhas increased from 5.96 lakh in 2002-3 to 88 lakh in2011-12. In the year 2012-13 (up to November 2012),more than 27 lakh toilets have been provided to ruralhouseholds. A total of 28,002 gram panchayats, 181intermediate panchayats, and 13 district panchayatshave been awarded the Nirmal Gram Puruskar (NGP)in the last seven years.
URBAN INFRASTRUCTURE, HOUSING,AND SANITATION
13.26 The central government has been assistingstate governments by way of various centrallysponsored schemes through national financialinstitutions providing better urban infrastructure,housing, and sanitation in the country. Some of theinitiatives in this area are as follows:
Jawahar Lal Nehru Urabn Renewal Mission(JNNURM): The JNNURM, a flagship programme forurbanization launched in December 2005, providessubstantial central financial assistance to cities forinfrastructure, housing development, and capacitydevelopment. The two out of four components underthe JNNURM devoted to shelter and basic serviceneeds of the poor residing in urban areas are: BasicServices to the Urban Poor (BSUP) for 65 selectcities and the Integrated Housing and SlumDevelopment Programme (IHSDP) for other citiesand towns. The Mission period has been extendedfor two years till March 2014 for completion of projectssanctioned till March 2012. About 1.57 million houseshad been sanctioned by 6 February 2013 and 1610projects with outlay of more than ` 41,723 croreapproved. A central share of ̀ 22,370.82 crore (96.5per cent of the seven-year allocation for 2005-12)has been committed. More than 1.57 million houseshave been sanctioned, of which more than 6.60 lakhhave been completed and 4.37 lakh occupied.Additional central assistance of ̀ 14,661.16 croreshas also been released.
Rajiv Awas Yojana (RAY): The RAY was launchedon 2 June 2011 with the vision of creating a slum-free India. Phase I of the RAY (preparatory phase) isfor a period of two years from the date of approval ofthe scheme and is currently under implementation.Phase II of the RAY shall be for the remaining periodof the Twelfth Five Year Plan. An amount of ` 50crore has been allocated for the year 2012-13.
Integrated Low Cost Sanitation Scheme (ILCS): TheILCS aims at conversion of individual dry latrinesinto pour flush latrines thereby liberating manualscavengers from the age-old, degrading practice ofmanually carrying night soil. The allocation for thescheme for 2012-13 is ̀ 25 crore.
SKILL DEVELOPMENT
13.27 Education and skill development play apivotal role in economic development and growth ofany country as they provide an environment forcreating jobs and help in reduction of poverty andother related social fallouts. A new strategicframework for skill development for early schoolleavers and existing workers has been developedsince May 2007 in close consultation with industry,state governments, and experts. During April-December 2012, the National Skill DevelopmentCorporation (NSDC) approved 24 training projectsfor imparting skill training in a wide array of sectorslike healthcare, tourism, hospitality and travel,banking, financial services and insurance (BFSI),retail, IT, electronics, textiles, leather, handicraftsand automotive, agriculture, cold chains andrefrigeration, tailoring, carpentry, and masonry.Besides formation of Skill Councils for seven sectors,proposals related to food processing, telecom,agriculture, plumbing, logistics, capital goods, andconstruction sectors have also been approved duringthis period. During this period, NSDC partners hadskilled around 1,39,305 people and placedapproximately 97,116 of them, thereby achievingplacement of 70 per cent. Special skills traininginitiatives of the NSDC have been helping youth inJammu and Kashmir and the north-eastern statesjoin the mainstream. The NSDC has been able toget some of India's biggest corporate groupsinterested in the private sector-led skills trainingprogramme for graduates and post-graduates inJammu and Kashmir called Udaan. Scaling up ofthis initiative is targeted to make 40,000 people inJammu & Kashmir skilled and placed in jobs over afive-year span. In the north-east region, the NSDC is
http://indiabudget.nic.in

284 Economic Survey 2012-13
partnering the Ministry of Youth Affairs and Sports inthe Youth Employability Skills (YES) project. Till 3December 2012, NSDC partners had established apresence in 25 states and three UTs and covered312 districts.
UNIQUE IDENTIFICATION AUTHORITYOF INDIA (UIDAI)13.28 After successfully completing Phase Ienrolments, the UIDAI is actively engaged in PhaseII in which 40 crore residents are to be enrolled beforeend 2014. As of December 2012, 24.93 croreAadhaars had been generated and approximately20 crore Aadhaar letters dispatched. The UIDAI hasalso established infrastructure to generate 10 lakhAadhaars per day and process 10 millionauthentication transactions a day. Apart from meetingtargets related to enrolments, significant amount ofeffort has been spent on enabling service delivery ofgovernment schemes with Aadhaar onlineauthentication and Aadhaar-enabled benefits transfersto bank accounts of beneficiaries. The governmenthas decided to initiate direct transfer of subsidy undervarious social schemes into beneficiaries' bankaccounts. The transfer will be enabled through apayments bridge known as Aadhaar Payment Bridge(APB) wherein funds can be transferred into anyAadhaar-enabled bank account on the basis of theAadhaar number. This eliminates chances of fraud/error in the cash transfer process. The Aadhaarnumber will be linked to the beneficiary database sothat ghosts/ duplicates are weeded out from thebeneficiary list.
13.29 To make withdrawal of money by thebeneficiaries easier and more accessible and friendly,micro ATMs will be set up by banks/ post officesthroughout the country in an open manner particularlywith the help of SHGs, community service centres(CSCs), post offices, grocery stores, petrol pumps,etc. in rural areas and accessible pockets. This isbeing done initially in 51 pilot districts across thecountry from 1 January 2013. Pilots on direct benefittransfer (DBT) have also been successfullyconducted in the states of Jharkhand, Tripura, andMaharashtra to transfer monetary benefits relatedto rural employment, pension, the IAY, and othersocial welfare schemes. An important pilot is thefair price shops in East Godavari and Hyderabaddistricts of Andhra Pradesh which are being enabledto carry out online Aadhaar authentication. In anotherimportant pilot with oil marketing companies (OMCs)in Mysore, delivery of LPG gas cylinders is being
done only after Aadhaar online authentication ofcustomers.
EDUCATION
13.30 To reap the benefits of the demographicdividend to the full, India has to provide education toits population and that too quality education. Thedraft Twelfth Plan focuses on teacher training andevaluation and measures to enforce accountability.It also stresses the need to build capacity insecondary schools to absorb the pass outs fromexpanded primary enrolments.
Elementary and Secondary Education13.31 Many schemes have been initiated by thegovernment for elementary and secondary education.Some are as follows:
Sarv Shiksha Abhiyan (SSA)/Right to Education(RTE): The Right of Children to Free and CompulsoryEducation (RTE) Act 2009, legislating Article 21A ofthe Constitution of India, became operational in thecountry on 1 April 2010. It implies that every childhas a right to elementary education of satisfactoryand equitable quality in a formal school which satisfiescertain essential norms and standards. Theachievements till September, 2012 include openingof 3,34,340 new primary and upper primary schools,construction of 2,84,032 school buildings, 16,42,867additional classrooms, 2,17,820 drinking waterfacilities and 6,18,089 toilets, supply of freetextbooks to 8.32 crore children, appointment of12.46 lakh teachers, and imparting of in-servicetraining to 18.64 lakh teachers. Significant reductionin the number of out-of-school children on accountof SSA interventions has been noted. The number ofout-of-school children has come down from 134.6lakh in 2005 to 81.5 lakh in 2009 as per anindependent study conducted by the Social andRural Research Institute (SRI)-International MarketingResearch Bureau (IMRB).
Mid-day Meals (MDM): Under the MDM, cookedmidday meals are provided to all children attendingClasses I-VIII in government, local body,government-aided, and National Child Labour Project (NCLP)schools. Education Guarantee Scheme (EGS)/alternate and innovative education centres includingmadarsas /maqtabs supported under the SSA acrossthe country are also covered under this programme.At present the cooked midday meal provides anenergy content of 450 calories and protein contentof 12 grams at primary stage and an energy content
http://indiabudget.nic.in

285Human Development
of 700 calories and protein content of 20 grams atupper primary stage. Adequate quantity of micro-nutrients like iron, folic acid, and vitamin A are alsorecommended for convergence with the NRHM.During 2011-12, the budget allocation for thisprogramme was ` 10,380 crore against which thetotal expenditure incurred was ̀ 9901.91 crore. About10.54 crore children (7.18 crore in primary and 3.36crore in upper primary stages) benefited under theprogramme during 2011-12. The MDM-MIS has beenlaunched to monitor the scheme and annual dataentries for about 11.08 lakh schools have beencompleted. The MDM-MIS will be integrated with theInteractive Voice Response System (IVRS) meantto capture the information from the schools within aspan of 1 hour on daily basis to monitor the scheme.
Rashtriya Madhyamik Shiksha Abhiyan (RMSA): TheRMSA was launched in March 2009 with the objectiveof enhancing access to secondary education andimproving its quality. An amount of ̀ 3124 crore wasallocated to the scheme in 2012-13, of which `2264.81 crore (as on 31.12.12) had been releasedto 22 states for construction of new school buildingsand to existing secondary schools for strengtheningof infrastructure, salary of teachers and staffsanctioned under the RMSA, learning enhancementprogrammes, equity interventions, etc.
Model Schools Scheme: A scheme for setting up of6000 high quality model schools as a benchmark ofexcellence at block level at the rate of one schoolper block was launched in November 2008 to providequality education to talented rural children. Thescheme has two modes of implementation, viz. (i)3500 schools are to be set up in as many EBBsthrough state governments and (ii) the remaining 2500schools are to be set up under PPP mode in blockswhich are not educationally backward. The stategovernment component has been operational from2009-10. Implementation of the PPP component hasbeen initiated from 2012-13. Under the stategovernment component of this scheme, till31December 2012 setting up of 2266 model schoolsin 22 states had been approved. Financial sanctionshad been accorded for setting up of 1880 schools in21 states and an amount of ̀ 2215.58 crore releasedas the central share. Out of these, 473 schools hadbecome functional in Punjab, Karnataka,Chhattisgarh, Tamil Nadu, Gujarat, Madhya Pradesh,and Jharkhand and ` 57.88 crore as recurringexpenditure had also been released till 31 December2012.
Saakshar Bharat (SB)/ Adult Education: The NationalLiteracy Mission, recast as SB, reflects theenhanced focus on female literacy. The target of theEleventh Five Year Plan was to achieve 80 per centliteracy but as per Census 2011, only 74.04 per centliteracy has been achieved. However, the literacyrate improved sharply among females as comparedto males with the latter increasing by 6.9 per centpoints from 75.26 per cent to 82.14 per cent and theformer by 11.8 per cent points from 53.67 per centto 65.46 per cent. Literacy levels remain unevenacross states, districts, social groups, andminorities. The government has taken focusedmeasures for reducing the disparities in backwardareas and target groups. By March 2012, theprogramme had reached 372 districts in 25 statesand one UT covering over 161,219 gram pachayats.By the end of March 2012, about 16 lakh literacyclasses enrolling about 174 lakh learners werefunctioning. By the end of November 2012, 372 outof 410 eligible districts had been covered under theprogramme comprising 4386 blocks and 161,219gram panchayats. Since the Mission has beenenvisaged as a people's programme, stakeholders,especially at grassroots level i.e. PRIs, have duesay and role in its planning and implementation.Despite the efforts of the government to provideprimary and elementary education, there is a lot moreto be done in terms of quality. The Annual Status ofEducation Report (ASER) 2012 by Pratham, an NGO,in its annual survey of rural children conducted in567 districts, highlights many positives as well asnegatives (Box 13.4). The declining levels ofeducational achievement are a cause for concern,though it is unclear how much of the decline isbecause of lower levels of learning, and how muchis because schools are reaching out to enrollstudents with lower preparation than they did earlier.
Higher and Technical Education13.32 The Indian higher education system is oneof the largest in the world in terms of the number ofcolleges and universities. While at the time ofIndependence, there were only 20 universities and500 colleges with 0.1 million students, their numberhas increased to 690 universities and university-levelinstitutions and 35,539 colleges upto 2011-12. Ofthe 690 universities, 44 are central universities, 306state universities, 145 state private universities, 130deemed universities, 60 institutes of nationalimportance plus other institutes, and 5 institutionsestablished under State Legislature Acts.
http://indiabudget.nic.in

286 Economic Survey 2012-13
Box 13.4 : Main Findings of ASER 2012Some Positives or status quo maintainedRising enrollment: In 2012, 96.5 per cent of all 6-14 year olds in rural India are enrolled in schools. This is the fourthconsecutive year that enrollment levels have been 96 per cent or more. In 2006, in eight major states, more than 11 per centgirls in the age group of 11 to 14 years were not enrolled in school. By 2011, this figure had dropped to less than 6.5 percent in 3 of these states (Jharkhand, Gujarat and Odisha) and less than 5 per cent in 3 others (Bihar, Chhattisgarh andWest Bengal).The situation in these states remained more or less unchanged in 2012. However in Rajasthan and UttarPradesh, the proportion of out of school girls (age 11-14) has increased from 8.9 per cent and 9.7 per cent respectively in2011 to more than 11 per cent in 2012.
Private school enrollment is rising in most states: Private school enrollment of 6 to 14 year olds has risen steadily since2006 from 18.7 per cent in 2006 to 28.3 per cent in 2012. Increase in private school enrollment is seen in almost all states,with the exception of Kerala, Nagaland, Manipur, Meghalaya and Tripura (where private school enrollment was over 40per cent even last year). There was of more than 40 per cent enrollment in Jammu & Kashmir, Punjab, Haryana, Rajasthan,Uttar Pradesh and Meghalaya in private schools. This percentage is 60 per cent or more in Kerala and Manipur. Since2009, private school enrollment in rural areas has been rising at an annual rate of about 10 per cent. If this trend continues,by 2018 India will have 50 per cent children in rural areas enrolled in private schools.
Better provision of girls' toilets: The proportion of schools without toilets (girls + boys) has fallen from 12.2 per cent in2011 to 8.4 per cent in 2012. The proportion of schools having toilets usable separately by the girls has improved from 32.9in 2011 to 48.2 percent in 2012.
More libraries in schools and more children using them: The proportion of schools without libraries has declined from28.7 per cent in 2011 to 23.9 percent in 2012. Children were seen using the library in more schools as well - up from 37.9per cent in 2010 to 43.9 per cent in 2012.
Compliance on pupil-teacher ratio and Classroom-teacher ratio: At the All India level, there has been a consistent risein the proportion of schools complying with RTE norms on pupil-teacher ratio, from 38.9 per cent in 2010 to 42.8 percentin 2012. In 2012, Nagaland stands out with 93.0 per cent of schools in compliance ahead of Kerala (92.0 percent) whichwas the highest last year. In Jammu & Kashmir, Mizoram, Manipur and Tripura, more than 80 per cent schools are incompliance with these norms.
No major changes in buildings, playgrounds, boundary walls or drinking water: About 61.1 per cent of visitedschools had a playground in 2012 compared to 62.8 percent in 2011. However, there has been marginal increase of 0.8percent in the proportion of all schools that have a boundary wall in 2012 from the last year. Nationally, the proportionof schools with no provision for drinking water remained almost the same at 17 per cent in 2010, 16.7 per cent in 2011 and16.6 percent in 2012. The proportion of schools with a useable drinking water facility has remained steady at about 73 per cent.
Some Negatives
Teacher Classroom ratio is declining: There has been a decline in the proportion of schools with at least one classroomper teacher, from 76.2 per cent in 2010 to 74.3 per cent in 2011 and further to 73.7 percent in 2012. However, departingfrom the national pattern, in states like Bihar, Chhattisgarh, Haryana, Himachal Pradesh, Kerala, Maharashtra, Meghalaya,Nagaland, Tamil Nadu, Tripura, Uttarakhand and West Bengal there has been an increase in teacher classroom ratio thisyear.
Declining basic reading levels: In 2010, 46.3 per cent of all children in std V could not read a std II level text, which hasincreased to 52.3 percent in 2012.
Arithmetic levels also show a decline across most states: Basic arithmetic levels estimates show a decline. For example,nationally, 29.1 per cent of Std V children could not solve simple two digit subtraction problem with borrowing in 2010which increased to 39 per cent in 2011 and further to 46.5 per cent in 2012. Barring Andhra Pradesh, Karnataka andKerala, every major state shows signs of substantial drop in arithmetic learning levels.
Children's attendance has declined: Children's attendance (for std I-V) shows a decline from 74.3 per cent in 2009 to71.3 per cent in 2012 in rural primary schools. However, children's attendance in some states shows an increase over time.For example, in primary schools of Bihar, average attendance of children increased from 57.0 per cent in 2007 to 58.3 percent in 2012, in Karnataka from 88.0 per cent in 2009 to 89.1 per cent in 2012, in Kerala it has increased from 91.9 percentin 2009 to 94.4 percent in 2012 and in Odisha from 74.1 per cent in 2009 to 77.5 per cent in 2012.
More than half of all Std 2 and Std 4 classes sit together with another class: Nationally, in rural government primaryschools, students who sit in multi-grade classrooms is rising.
Source : ASER 2012, Press Release Dated 17 January 2013, website http://images2.asercentre.org/aserreports/ASER_2012_PRESS_RELEASE.pdf
http://indiabudget.nic.in

287Human Development
13.33 A number of initiatives have been takenduring the Eleventh Plan period with focus onimprovement of access along with equity andexcellence, adoption of state-specific strategies,enhancing the relevance of higher education throughcurriculum reforms, vocationalization, networking,and use of IT and distance education along withreforms in governance in higher education. The majorinitiatives are as follows:
During the Eleventh Plan, 16 central universitieswere established which include conversion ofthree state universities to central universities.Seven new Indian Institutes of Management(IIMs), 8 new Indian Institutes of Technology(IITs), 10 new National Institutes of Technology(NITs), 5 Indian Institutes of Science Education& Research (IISERs), and 2 Schools of Planningand Architecture (SPAs) were also established.
The National Mission on Education through ICT(NMEICT) which aims at providing high speedbroadband connectivity to universities andcolleges and development of e-content in variousdisciplines is under implementation. Nearly 404universities have been provided 1Gbpsconnectivity or have been configured under thescheme and 19,851 colleges have also beenprovided VPN connectivity. Over 250 courseshave been completed and made available inNational Programme on Technology EnhancedLearning (NPTEL) Phase I and another 996courses in various disciplines in engineering andscience are being generated in Phase-II ofNPTEL by IIT Madras. The low cost access-cum-computing device Aakash 2 was launchedon 11 November 2012. Using the A-Viewsoftware developed under the NMEICT, severalprogrammes for teachers' empowerment havebeen conducted for batches of 1000 teachers ata time by IIT Mumbai.
A Scheme of Interest Subsidy on EducationalLoans to economically weaker sections (EWS)students was introduced from 2009-10.
An Expert Group was set up by the PrimeMinister in order to suggest ways of enhancingemployment opportunities in Jammu andKashmir and to formulate job plans involving thepublic and private sectors. Among the keyrecommendations of the Expert Group, one isoffering scholarships over the next five years, toencourage the youth of Jammu and Kashmir to
pursue higher studies outside the state. Thisscheme is being implemented since 2011-12.
To address the increasing skill challenges of theIndian IT industry, the government has approvedsetting up of twenty new Indian Institutes ofInformation Technology (IIITs) on PPP basis. Theproject is targeted for completion in nine yearsfrom 2011-12 to 2019-20. The Government ofIndia also provides financial assistance to thestates up to a limit of ` 12.30 crore perpolytechnic to meet the costs of establishingnew government polytechnics in un-serveddistricts.
HEALTH
13.34 Improvement in the standard of living andhealth status of the population has remained one ofthe important objectives for policymakers in India. Inline with the National Health Policy 2002, the NRHMwas launched on 12 April 2005 with the objective ofproviding accessible, affordable, and qualityhealthcare to the rural population. It seeks to bringabout architectural correction in the health systemsby adopting the approaches like increasinginvolvement of community in planning andmanagement of healthcare facilities, improvedprogramme management, flexible financing andprovision of untied grants, decentralized planning andaugmentation of human resources. Table 13.9 showsthe progress made by India over the years based onhealth indicators.
13.35 In 2012-13, the Plan outlay for health wasincreased by 13.9 per cent to ` 30,477 crore. Thecombined revenue and capital expenditure of thecentre and states on medical and public health, watersupply and sanitation, and family welfare hasincreased from ` 53,057.80 crore in 2006-7 to` 1,18,295.78 crore in 2011-12 (BE). In the TwelfthFive Year Plan the central outlay for health has beenincreased by 200 per cent to ` 3,00,018 crorecompared to the actual outlay of ` 99,491 crore inthe Eleventh Five Year Plan. This outlay will bedirected towards building on the initiatives taken inthe Eleventh Plan period, for extending the outreachof public health services, and for moving towards thelong-term objective of establishing a system ofuniversal health coverage. Despite the efforts by thegovernment to provide affordable access to thedecentralized public health system, its expenditureon public health as a percentage of GDP is low asindicated earlier in this chapter.
http://indiabudget.nic.in

288 Economic Survey 2012-13
13.36 The government has launched a large numberof programmes and schemes to address the majorconcerns and bridge the gaps in existing healthinfrastructure and provide accessible, affordable,equitable healthcare. The details of some majorprogrammes and developments are as follows:
National Rural Health Mission (NRHM): The NRHMwhich provides an overarching umbrella to the existinghealth and family welfare programmes was launchedin 2005 to improve accessibility to quality healthcarefor the rural population, bridge gaps in healthcare,facilitate decentralized planning in the health sector,and bring about inter-sectoral convergence. Betterinfrastructure, availability of manpower, drugs andequipment, and augmentation of health humanresources in health facilities at different levels haveled to improvement in healthcare delivery servicesand increase in outpatient department (OPD) andinpatient department (IPD) services (Table 13.10).
13.37 Under the NRHM, over 1.4 lakh health humanresources have been added to the health systemacross the country (up to September 2012).Accredited social health activists (ASHAs) havebeen engaged in each village / large habitation inthe ratio of one per 1000 population. Till September2012, 8.84 lakh ASHAs had been selected in theentire country, of whom 8.09 lakh had been givenorientation training. Further, 7.96 lakh ASHAs hadbeen provided drug kits. As part of the infrastructurestrengthening under the NRHM, 10,473 sub-centres,714 primary health centres (PHCs), and 245
community health centres (CHCs) have been newlyconstructed. Also, renovation/upgradation of 10,326sub-centres, 2963 PHCs, and 1221 CHCs has beencompleted. A total of 8199 PHCs have been madefunctional as 24X7 services across the country.Further, nearly 2024 vehicles are operational asmobile medical units (MMUs) in 459 districts in thecountry under the NRHM. The total plan outlay forthe year 2012-13 under the NRHM is ̀ 20,542 croreand ̀ 2712.7 crore for schemes/projects in the north-eastern region and Sikkim.
Janani Suraksha Yojana (JSY): The JSY launchedin 2005 aims to bring down the MMR by promotinginstitutional deliveries conducted by skilled birthattendants. The beneficiaries have increased from7.38 lakh in 2005-6 to more than 1.09 crore in 2011-12. The number of institutional deliveries hasincreased from 1.08 crore during 2005-6 to 1.75 croreduring 2011-12. The number of institutional deliveriesduring 2012-13(up to September 2012) was 80.39lakh. In addition, Janani Shishu Suraksha Karyakram(JSSK), a new initiative which entitles all pregnantwomen delivering in public health institutions to anabsolutely no expenses delivery covering free deliveryincluding Caesarean, free drugs, diagnostics, bloodand diet, and free transport from home to institutionincluding during referrals, is also in operation.
National Vector Borne Disease Control Programme:To control and prevent vector-borne diseases suchas malaria, dengue, chikungunya, Japaneseencephalitis, kala-azar, and lymphatic filariasis in
Table 13.9 : India — Selected health indicators
Sl. No. Parameter 1981 1991 Current level
1. Crude Birth Rate (CBR) (per 1000 population) 33.9 29.5 21.8 (2011*)
2. Crude Death Rate (CDR)(per 1000 population) 12.5 9.8 7.1 (2011*)3. Total Fertility Rate (TFR)(per woman) 4.5 3.6 2.5 (2010*)4. Maternal Mortality Rate (MMR) (per 100,000 live births) NA NA 212 (2007-9*)5. IMR (per 1000 live births): 110 80 44 (2011*)
Rural 48Urban 29
6. Child (0-4 years) Mortality Rate ( per 1000 children) 41.2 26.5 13.3 (2010*)7. Life Expectancy at Birth: (1981-85) (1989-93) (2006-10)**
Total 55.4 59.4 66.1Male 55.4 59.0 64.6Female 55.7 59.7 67.7
Source: Ministry of Health and Family Welfare.*Sample Registration Survey (SRS), RGI.** Abridged Life Table 2003-07 to 2006-10, RGI.
http://indiabudget.nic.in

289Human Development
the country, a National Vector Borne Disease ControlProgramme has been launched. Of these sixdiseases, kala-azar and lymphatic filariasis have beentargeted for elimination by 2015. With this initiative,malaria has shown a declining trend with 0.95 millioncases and 446 deaths reported out of the 94.85 millionpersons screened in 2012 (up to November)compared to 1.31 million cases and 753 deaths ofthe 108.97 million persons screened in 2011. Denguein the recent past has been reported from almost allthe states and UTs except Lakshadweep. During2011, 18,860 cases and 169 deaths were reported,whereas during 2012, 47,029 cases and 242 deathshave been reported. Chikungunya cases have showna declining trend after its re-emergence in 2006.
Human Resources, Infrastructure Development/Upgradation of Tertiary Healthcare: To strengthengovernment medical colleges, land requirementnorms and infrastructural requirements for openingnew medical colleges have been revised. However,to further increase availability of doctors, it isproposed to set up new medical colleges attachedto district hospitals and strengthen and upgradeexisting ones to add 16,000 new MBBS seats duringthe Twelfth Plan period. In order to meet the shortageof nurses, a scheme is under implementation foropening of 132 ANM schools (at a cost of ̀ 5 croreper school) and 137 general nursing and midwifery(GNM) schools (at ̀ 10 crore per school) in districtswhere there are no such schools. A sum of ̀ 520.50crore had been released under the scheme tillDecember 2012. Opening of six nursing colleges atthe sites of AIIMS-like institutions at a total cost of` 120 crore is also under implementation. Thescheme for strengthening / upgradation of stategovernment medical colleges envisages a one-timegrant of ` 1350 crore to be funded by central andstate governments in a 75:25 ratio. During 2009-10
to 2012-13, 72 medicals colleges have been funded.To augment the supply of skilled paramedicalmanpower and promote paramedical training, oneNational Institute of Paramedical Sciences (NIPS)at Najafgarh, Delhi, and eight Regional Institutes ofParamedical Sciences (RIPS) are being set up at acost of ̀ 804.43 crore. Besides, State GovernmentMedical Colleges are being provided support forconducting paramedical courses through one-timegrant at a cost of ` 352 crore.
Pradhan Mantri Swasthya Suraksha Yojana(PMSSY): The PMSSY aims at correcting regionalimbalances in the availability of affordable/reliabletertiary health-care services and augmenting facilitiesfor quality medical education in the country. For theyear 2012-13, ̀ 1544.21 crore has been earmarkedunder the PMSSY, which aims at (i) construction of6 AIIMS-like institutions in the first phase at Bhopal,Bhubaneswar, Jodhpur, Patna, Raipur, and Rishikeshand in the second phase in West Bengal and UttarPradesh, (ii) upgradation of 13 medical colleges inthe first phase and 6 in the second phase. Theacademic session for 50 MBBS seats hascommenced at the six new AIIMS like institutions inSeptember 2012 and hospitals are likely to beoperational by September 2013.
Ayurveda, Yoga & Naturopathy, Unani, Siddha andHomoeopathy (AYUSH): The Indian system ofmedicines is also being developed and promoted byinvolvement/integration of the AYUSH system innational healthcare delivery through an allocation of` 990 crore Plan outlay in 2012-13. To integrateAYUSH healthcare with mainstream allopathichealthcare services, the states are provided financialsupport for co-location of AYUSH facilities at PHCs,CHCs, and district hospitals and supply of essentialdrugs to standalone AYUSH hospitals/dispensaries.
WOMEN AND CHILD DEVELOPMENT
13.38 Women lag behind men in many socialindicators like health, education, and economicopportunities. Hence they need special attention dueto their vulnerability and lack of access to resources.Since national budgets impact men and womendifferently through the pattern of resource allocation,the scope and coverage of schemes for women andchild development have been expanded withprogressive increase in Plan expenditure undervarious Plan schemes, increased employment forwomen under the MGNREGA and gender budgeting(GB). The allocations for GB as a percentage of total
Table 13.10 : Health Care InfrastructureFacilities No.
SC/PHC/CHC*(2011) 176,820
Government hospitals (rural & urbanareas)** 11,493
AYUSH hospitals & dispensaries 27,339
Nursing personnel (as on 31-12-10)** 18,94,968
Doctors (modern system) (2011)** 922,177
Source : Ministry of Health & Family Welfare asobtained from *RHS: Rural Health Statistics in India2011 and ** National Health Profile 2011.
http://indiabudget.nic.in

290 Economic Survey 2012-13
budget have gone up from 2.79 per cent in 2005-6 to5.91 per cent in 2012-13. Some of the importantschemes and policy initiatives for economic andsocial empowerment of women and childdevelopment are as follows:
Integrated Child Development Services (ICDS)Scheme: The objective of the ICDS scheme is holisticdevelopment of children below 6 years of age andproper nutrition and health education of pregnant andlactating mothers starting with 33 projects and 4891anganwadi centres (AWCs) in 1975. This has nowbeen universalized with cumulative approval of 7076projects and 14 lakh AWCs including 20,000anganwadis 'on-demand'. At present 7025 ICDSprojects and 13.31 lakh AWCs are operational. Theyare currently providing services to 928 lakhbeneficiaries. A proposal for strengthening andrestructuring of the ICDS Scheme with an overallbudget allocation of ` 1,23,580 crore during theTwelfth Plan has been approved and will be rolledout in all the districts in three years. Greateremphasis is being laid on awareness generation,convergence with the MGNREGA, and MIS-basedmonitoring.
Rajiv Gandhi Scheme for Empowerment ofAdolescent Girls (RGSEAG)-Sabla: Sabla nowoperational in 205 selected districts aims at all-rounddevelopment of adolescent girls in the age group 11-18 years and making them self-reliant with a specialfocus on out-of-school girls. The scheme has twomajor components, nutrition and non-nutrition.Nutrition is being given in the form of 'take homerations' or 'hot cooked meals' to out-of -school 11-14year old girls and all adolescent girls in the 14 -18age group. The non-nutrition component addressesthe developmental needs of 11-18 year oldadolescent girls who are provided iron-folic acidsupplementation, health check-up and referralservices, nutrition and health education, counseling/guidance on family welfare, skill education, guidanceon accessing public services, and vocational training.The target of the scheme is to provide nutrition to 1crore adolescent girls in a year. Against an allocationof ` 750 crore for 2012-13, ` 496 crore has beenreleased to states/UTs benefiting 87.23 lakhadolescent girls as on 31.12.2012.
Indira Gandhi Matritva Sahyog Yojana (IGMSY): TheIGMSY is a conditional cash transfer scheme forpregnant and lactating women implemented initiallyon pilot basis in 53 selected districts in the countryfrom October 2010. As on 31December 2012, more
than 3 lakh beneficiaries had been covered and ̀ 27crore released to states. The scheme is now coveredunder the Direct Benefit Transfer (DBT) programmewith nine districts being included in the first phase.In 2012-13, the scheme has a budgetary outlay of ̀520 crore and targets covering 12.5 lakh pregnantand lactating women.
National Mission for Empowerment of Women(NMEW): This initiative for holistic empowerment ofwomen through better convergence and engenderingof policies, programmes, and schemes of differentministries was operationalized in 2010-11. Under theMission, institutional structures at state levelincluding State Mission Authorities headed by ChiefMinisters and State Resource Centres for Women(SRCWs) for spearheading initiatives for women'sempowerment have been established across thecountry.
Rashtriya Mahila Kosh (RMK): The RMK providesmicro-credit in a quasi-informal manner, lending tointermediate micro-credit organizations (IMOs)across states. It focuses on poor women and theirempowerment through the provision of credit forlivelihood-related activities. With a corpus fund of` 31 crore, the RMK has grown to over ̀ 180 croreincluding reserves and surplus due to credit,investments, and recovery management with anadditional budgetary allocation of ̀ 69 crore. Fromits inception in 1993 till 31 December 2012, the RMKhas sanctioned loans worth ` 342.40 crore andreleased ` 275.89 crore covering over 7.19 lakhwomen beneficiaries.
Policies to address violence against women:Addressing violence against women is another areawhich has received a lot of recent attention. Followingthe recent tragic incident of sexual assault in NewDelhi, a committee of eminent jurists, headed byformer Chief Justice of India Justice J. S. Verma,was constituted to review existing laws and examinelevels of punishment in cases of aggravated sexualassault and it has submitted its recommendations.An ordinance has also been issued on sexual assaultagainst women [Criminal Law (Amendment)Ordinance, 2013] based on the recommendationsof the Justice Verma Committee. A Commission ofInquiry was also set up under the Chairpersonshipof Ms Justice Usha Mehra, retired Judge of DelhiHigh Court to identify lapses on the part of publicauthorities and suggest measures to improve thesafety and security of women in the capital. Newinitiatives are being taken like one-stop crisis centres
http://indiabudget.nic.in
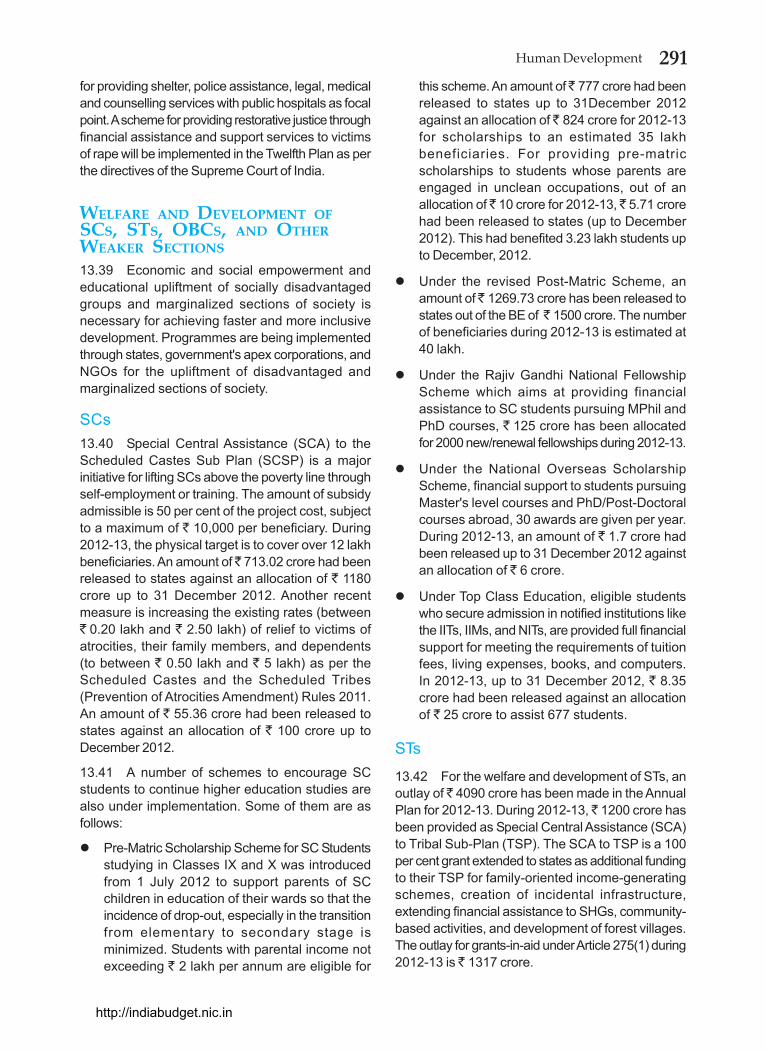
291Human Development
for providing shelter, police assistance, legal, medicaland counselling services with public hospitals as focalpoint. A scheme for providing restorative justice throughfinancial assistance and support services to victimsof rape will be implemented in the Twelfth Plan as perthe directives of the Supreme Court of India.
WELFARE AND DEVELOPMENT OFSCS, STS, OBCS, AND OTHERWEAKER SECTIONS
13.39 Economic and social empowerment andeducational upliftment of socially disadvantagedgroups and marginalized sections of society isnecessary for achieving faster and more inclusivedevelopment. Programmes are being implementedthrough states, government's apex corporations, andNGOs for the upliftment of disadvantaged andmarginalized sections of society.
SCs13.40 Special Central Assistance (SCA) to theScheduled Castes Sub Plan (SCSP) is a majorinitiative for lifting SCs above the poverty line throughself-employment or training. The amount of subsidyadmissible is 50 per cent of the project cost, subjectto a maximum of ` 10,000 per beneficiary. During2012-13, the physical target is to cover over 12 lakhbeneficiaries. An amount of ̀ 713.02 crore had beenreleased to states against an allocation of ` 1180crore up to 31 December 2012. Another recentmeasure is increasing the existing rates (between` 0.20 lakh and ` 2.50 lakh) of relief to victims ofatrocities, their family members, and dependents(to between ` 0.50 lakh and ` 5 lakh) as per theScheduled Castes and the Scheduled Tribes(Prevention of Atrocities Amendment) Rules 2011.An amount of ` 55.36 crore had been released tostates against an allocation of ` 100 crore up toDecember 2012.
13.41 A number of schemes to encourage SCstudents to continue higher education studies arealso under implementation. Some of them are asfollows:
Pre-Matric Scholarship Scheme for SC Studentsstudying in Classes IX and X was introducedfrom 1 July 2012 to support parents of SCchildren in education of their wards so that theincidence of drop-out, especially in the transitionfrom elementary to secondary stage isminimized. Students with parental income notexceeding ` 2 lakh per annum are eligible for
this scheme. An amount of ̀ 777 crore had beenreleased to states up to 31December 2012against an allocation of ̀ 824 crore for 2012-13for scholarships to an estimated 35 lakhbeneficiaries. For providing pre-matricscholarships to students whose parents areengaged in unclean occupations, out of anallocation of ̀ 10 crore for 2012-13, ̀ 5.71 crorehad been released to states (up to December2012). This had benefited 3.23 lakh students upto December, 2012.
Under the revised Post-Matric Scheme, anamount of ̀ 1269.73 crore has been released tostates out of the BE of ̀ 1500 crore. The numberof beneficiaries during 2012-13 is estimated at40 lakh.
Under the Rajiv Gandhi National FellowshipScheme which aims at providing financialassistance to SC students pursuing MPhil andPhD courses, ` 125 crore has been allocatedfor 2000 new/renewal fellowships during 2012-13.
Under the National Overseas ScholarshipScheme, financial support to students pursuingMaster's level courses and PhD/Post-Doctoralcourses abroad, 30 awards are given per year.During 2012-13, an amount of ` 1.7 crore hadbeen released up to 31 December 2012 againstan allocation of ̀ 6 crore.
Under Top Class Education, eligible studentswho secure admission in notified institutions likethe IITs, IIMs, and NITs, are provided full financialsupport for meeting the requirements of tuitionfees, living expenses, books, and computers.In 2012-13, up to 31 December 2012, ` 8.35crore had been released against an allocationof ` 25 crore to assist 677 students.
STs
13.42 For the welfare and development of STs, anoutlay of ̀ 4090 crore has been made in the AnnualPlan for 2012-13. During 2012-13, ̀ 1200 crore hasbeen provided as Special Central Assistance (SCA)to Tribal Sub-Plan (TSP). The SCA to TSP is a 100per cent grant extended to states as additional fundingto their TSP for family-oriented income-generatingschemes, creation of incidental infrastructure,extending financial assistance to SHGs, community-based activities, and development of forest villages.The outlay for grants-in-aid under Article 275(1) during2012-13 is ̀ 1317 crore.
http://indiabudget.nic.in

292 Economic Survey 2012-13
13.43 For economic empowerment of STs, financialsupport is extended through the National ScheduledTribes Finance and Development Corporation(NSTFDC) in the form of loans and micro-credit atconcessional rates of interest for income-generatingactivities. Market development of tribal products andtheir retail marketing is done by the TribalCooperative Marketing Development Federation ofIndia Limited (TRIFED) through its sales outlets. Till31 October 2012, 32.37 lakh claims had been filedand 12.76 lakh titles distributed under the provisionsof the 'The Scheduled Tribes and Other TraditionalForest Dwellers Act 2006'. Further, 14,603 titles wereready for distribution. A total of 27.88 lakh claimshave been disposed of.
13.44 There are also many schemes for helpingST students. Under the Post-Matric ScholarshipScheme, 100 per cent financial assistance isprovided to ST students whose family income is lessthan or equal to ̀ 2 lakh per annum to pursue post-matric-level education including professional,graduate, and postgraduate courses in recognizedinstitutions. The Top Class Education Scheme forSTs provides financial assistance for qualityeducation to 625 ST students per annum to pursuestudies at degree and post-degree level in any of125 identified institutes. The family income from allsources of the beneficiary ST student under thescheme should not exceed ` 2 lakh per annum.Financial assistance is also provided to 15 eligibleST students for pursuing higher studies abroad inspecified fields at Master's and PhD level under theNational Overseas Scholarship Scheme. A schemefor Strengthening of Education among ST Girls inLow Literacy Districts is also being implemented tobridge the gap in literacy levels between the generalfemale population and tribal women.
Minorities13.45 The five communities--Muslims, Christians,Sikhs, Buddhists, and Parsis- notified as minoritycommunities constitute 18.42 per cent of the totalpopulation of the country. The plan outlay for thedevelopment of minorities was raised from ` 2850crore in 2011-12 to ` 3135 crore in 2012-13. TheMulti-sectoral Development Programme, a specialareas development initiative to address the'development deficits' especially in education, skilldevelopment, employment, health and sanitation,housing, and drinking water in 90 minorityconcentration districts (MCDs), was launched in2008-9. Projects worth ̀ 3734 crore were approvedduring the Eleventh Plan. The outlay for this
Programme is ` 1000 crore in 2012-13. Theauthorized share capital of the National MinoritiesDevelopment and Finance Corporation (NMDFC) hasbeen raised from ` 650 crore in 2006-7 to ` 1500crore in 2010-11 for expanding its loan and micro-finance operations to promote self-employment andother economic ventures among backward sectionsof the minority communities. An amount of ` 99.64crore has been released to the NMDFC during 2012-13. The Prime Minister's New 15 Point Programmefor Welfare of Minorities which earmarks 15 per centof targets/ outlays for minorities in many importantschemes aims at ensuring the equitable flow ofbenefits of education, employment, and basicinfrastructure schemes to minorities.
13.46 The corpus of the Maulana Azad EducationFoundation (MAEF) had been enhanced from ̀ 100crore in 2005-6 to ̀ 750 crore till March 2012. Fundallocation has been enhanced from ̀ 1190 crore in2011-12 to ` 1620 crore in 2012-13 for threescholarships schemes, Pre-Matric, Post-Matric, andMetric-cum-means based, which are beingimplemented exclusively for the notified minorities.Two schemes, viz. (i) the Maulana Azad NationalFellowship for Minority Students, with an allocationof ̀ 70 crore in 2012-13 and (ii) Computerization ofRecords of State Wakf Boards, with an allocation of` 5 crore in 2012-13, are under implementation since2009-10. There is also a scheme for LeadershipDevelopment of Minority Women with an allocationof ̀ 15 crore for 2012-13.
OBCs13.47 Central assistance is provided to states foreducational development of OBCs. Under the Pre-Matric Scholarship for OBCs Scheme, against anallocation of ̀ 50 crore during 2012-13, ̀ 35.45 crorewas released to states up to December 2012. Underthe Post-Matric Scholarship Scheme, the target isto provide scholarship to 17.25 lakh OBC students.To provide hostel facilities to OBC students studyingin middle and secondary schools, colleges, anduniversities and enable them to pursue higher studies,` 6.13 crore was released up to December 2012against an allocation of ̀ 45 crore in 2012-13.
Persons with Disabilities13.48 Persons with disabilities are a valuablehuman resource for the country. For the physicalrehabilitation, educational and economicdevelopment, and social empowerment of differentlyabled persons many schemes are in operation.According to Census 2001, there were 2.19 crore
http://indiabudget.nic.in
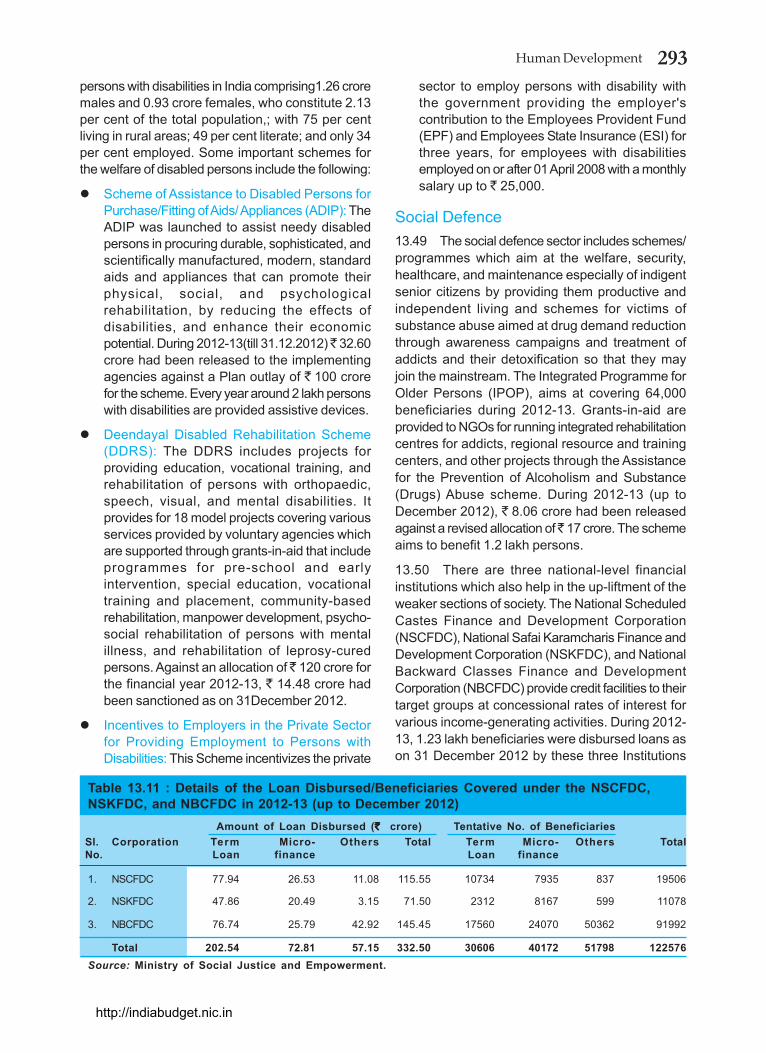
293Human Development
persons with disabilities in India comprising1.26 croremales and 0.93 crore females, who constitute 2.13per cent of the total population,; with 75 per centliving in rural areas; 49 per cent literate; and only 34per cent employed. Some important schemes forthe welfare of disabled persons include the following:
Scheme of Assistance to Disabled Persons forPurchase/Fitting of Aids/ Appliances (ADIP): TheADIP was launched to assist needy disabledpersons in procuring durable, sophisticated, andscientifically manufactured, modern, standardaids and appliances that can promote theirphysical, social, and psychologicalrehabilitation, by reducing the effects ofdisabilities, and enhance their economicpotential. During 2012-13(till 31.12.2012) ̀ 32.60crore had been released to the implementingagencies against a Plan outlay of ` 100 crorefor the scheme. Every year around 2 lakh personswith disabilities are provided assistive devices.
Deendayal Disabled Rehabilitation Scheme(DDRS): The DDRS includes projects forproviding education, vocational training, andrehabilitation of persons with orthopaedic,speech, visual, and mental disabilities. Itprovides for 18 model projects covering variousservices provided by voluntary agencies whichare supported through grants-in-aid that includeprogrammes for pre-school and earlyintervention, special education, vocationaltraining and placement, community-basedrehabilitation, manpower development, psycho-social rehabilitation of persons with mentalillness, and rehabilitation of leprosy-curedpersons. Against an allocation of ̀ 120 crore forthe financial year 2012-13, ` 14.48 crore hadbeen sanctioned as on 31December 2012.
Incentives to Employers in the Private Sectorfor Providing Employment to Persons withDisabilities: This Scheme incentivizes the private
sector to employ persons with disability withthe government providing the employer'scontribution to the Employees Provident Fund(EPF) and Employees State Insurance (ESI) forthree years, for employees with disabilitiesemployed on or after 01 April 2008 with a monthlysalary up to ` 25,000.
Social Defence13.49 The social defence sector includes schemes/programmes which aim at the welfare, security,healthcare, and maintenance especially of indigentsenior citizens by providing them productive andindependent living and schemes for victims ofsubstance abuse aimed at drug demand reductionthrough awareness campaigns and treatment ofaddicts and their detoxification so that they mayjoin the mainstream. The Integrated Programme forOlder Persons (IPOP), aims at covering 64,000beneficiaries during 2012-13. Grants-in-aid areprovided to NGOs for running integrated rehabilitationcentres for addicts, regional resource and trainingcenters, and other projects through the Assistancefor the Prevention of Alcoholism and Substance(Drugs) Abuse scheme. During 2012-13 (up toDecember 2012), ` 8.06 crore had been releasedagainst a revised allocation of ̀ 17 crore. The schemeaims to benefit 1.2 lakh persons.
13.50 There are three national-level financialinstitutions which also help in the up-liftment of theweaker sections of society. The National ScheduledCastes Finance and Development Corporation(NSCFDC), National Safai Karamcharis Finance andDevelopment Corporation (NSKFDC), and NationalBackward Classes Finance and DevelopmentCorporation (NBCFDC) provide credit facilities to theirtarget groups at concessional rates of interest forvarious income-generating activities. During 2012-13, 1.23 lakh beneficiaries were disbursed loans ason 31 December 2012 by these three Institutions
Table 13.11 : Details of the Loan Disbursed/Beneficiaries Covered under the NSCFDC,NSKFDC, and NBCFDC in 2012-13 (up to December 2012)
Amount of Loan Disbursed ( `̀̀̀̀ crore) Tentative No. of BeneficiariesSl. Corporation Term Micro- Others Total Term Micro- Others TotalNo. Loan finance Loan finance
1. NSCFDC 77.94 26.53 11.08 115.55 10734 7935 837 19506
2. NSKFDC 47.86 20.49 3.15 71.50 2312 8167 599 11078
3. NBCFDC 76.74 25.79 42.92 145.45 17560 24070 50362 91992
Total 202.54 72.81 57.15 332.50 30606 40172 51798 122576Source: Ministry of Social Justice and Empowerment.
http://indiabudget.nic.in

294 Economic Survey 2012-13
together. Micro-finance beneficiaries of the NBCFDCand NSKFDC have increased by 23.79 per cent and54 per cent respectively, while those under theNSCFDC have fallen by 66 per cent in 2012-13 (April-December) over the corresponding period of theprevious year (Table 13.11).
OUTLOOK AND CHALLENGES13.51 The global recession of 2008 and the recentglobal slowdown have squeezed the fiscal space formost countries and consequently the purse for social-sector spending. However, India's social sectorspending has seen a continuous increase evenduring these crisis-ridden years. India needs tobalance the dual imperatives of growth and inclusion.This can happen only if growth leads to higher andbetter jobs. While the government's flagshipprogramme, the MGNREGA, is intended to fill this'job deficit' in the interregnum, we have to focus onlonger-term inclusive growth strategies. The $ 1 trillionInfrastructure opportunity is one such example. Evenin the interregnum, schemes like the MGNREGAshould move towards more production- and growth-generating activities. The draft Twelfth Five Year Planhas emphasized faster, more inclusive, andsustainable growth. A special effort is needed in twoareas of human development in India - health andeducation. These will help translate our demographicadvantage into a real dividend (See chapter 2). Thereis also need to address delivery-related issues in amission mode to ensure optimum utilization of fundsand to convert outlays into outcomes. For this, goodgovernance is critical.13.52 Coming to expenditure management, in thelast few years public expenditure on socialprogrammes has increased dramatically from ̀ 9.10lakh crore in the Tenth Plan period to ` 22.69 lakhcrore during the Eleventh Plan period with a step upof over 149 per cent. In the Eleventh Plan periodnearly ̀ 7 lakh crore has been spent on the 15 majorflagship programmes. This sharp increase isunprecedented. A number of legislative steps havealso been taken to secure the rights of people, likethe Right to Information Act, the MGNREGA, theForest Rights Act, and the RTE. Thus the funds arein place, rights constitutionally guaranteed, and manyachievements recorded, but there are also pressingissues like leakages and funds not reaching thetargeted beneficiaries. While the Direct BenefitTransfer (DBT) system with the help of the UID can
help in plugging many of these leakages, there isenough scope for expenditure reduction even insocial-sector programmes through convergence(integration and combining). Economic Survey 2011-12 had pointed out that there are many schemeslike the AABY, JBY, and RSBY with significant overlapand catering to the same or similar categories of thepopulation, with Shiksha Sahyoga Yojana (SSY) asa add-on benefit under the former two schemes. Awelcome development this year is the merger of theJBY with the AABY. There are many other such areaswhere convergence can take place. For example theJSY, Janani Shishu Surksha Karyakram (JSSK), andIndira Gandhi Matritva Sahyog Yojana (IGMSY) havemany overlapping features and the samebeneficiaries. This calls for a careful exercise inidentifying overlapping schemes and weeding out orconverging them. A threshold level could also be fixedfor the schemes as a critical minimum investmentor outlay is needed for any programme to besuccessful. The Committee on 'Restructuring ofCentrally Sponsored Schemes' has suggested thatnew centrally sponsored schemes should have aminimum Plan expenditure of ` 10,000 crore overthe Five Year Plan and should be included underflagship schemes.
13.53 Another area needing attention isdecentralization. While Plan programmes aredesigned with a bottom-up approach and arepanchayat- and PRI-centric, they are actuallyimplemented in a top-down manner and do noteffectively articulate the needs and aspirations ofthe local people, especially the most vulnerable. Withthe 73rd Constitutional Amendment, several functionswere transferred to PRIs and since 2004 there hasalso been massive transfer of funds to PRIs,especially after the enactment of the MGNREGA.But institutionally the PRIs remain weak and do nothave the required capacity to plan or implementprogrammes effectively. The Twelfth Five Year Planproposes a complete break from the past andprovides sizeable resources to the Ministry ofPanchayati Raj. These higher outlays should beconverted into outcomes. This calls for greater focuson empowering PRIs through training and awarenessgeneration coupled with social audit of all social-sector programmes. Cash transfers to the intendedbeneficiaries can also help empower citizens, evenwhile giving them choice of provider. This too canhelp improve the quality of service delivery.
http://indiabudget.nic.in