ECONOMIC SCIENCE FOR RURAL DEVELOPMENT - ESAF Economic Science... · Scientific Conference...
292
ECONOMIC SCIENCE FOR RURAL DEVELOPMENT 1. Production and Cooperation in Agriculture 2. Bioeconomy 3. Finance and Taxes № 37 Jelgava 2015
Transcript of ECONOMIC SCIENCE FOR RURAL DEVELOPMENT - ESAF Economic Science... · Scientific Conference...

ECONOMIC SCIENCE FOR RURAL
DEVELOPMENT
1. Production and Cooperation in Agriculture
2. Bioeconomy
3. Finance and Taxes
№ 37 Jelgava
2015

2
ISSN 1691-3078 ISSN 2255-9930 on line
ISBN 978-9984-48-180-7
Abstracted / Indexed: ISI Web of Science, AGRIS, CAB Abstracts and EBSCOHost Academic Search Complete databases http://www.esaf.llu.lv/journals-and-proceedings
www.fao.org/agris/
http://search.ebscohost.com/login.aspx?authtype=ip,uid&profile=ehost&defaultdb=lbh
http://search.ebscohost.com/login.aspx?direct=true&db=a9h&jid=25AP&site=ehost-live

3
The Conference Committee
Professor Baiba Rivza
Professor Andra Zvirbule-Berzina
Professor Irina Pilvere
Professor Barbara Freytag-Leyer
Professor Bo Öhlmer
Professor Bartosz Mickiewicz
Professor Maria Parlinska
Professor Alina Danilowska
Professor Janina Sawicka
Professor Joanna Szwacka-Mokrzycka
Professor Arild Sæther
Professor Vilija Alekneviciene
Professor Csaba Forgacs
Senior Researcher Magnar Forbord
Professor Ingrida Jakusonoka
Professor Aina Dobele
Professor Modrite Pelse
Associate professor Gunita Mazure
Associate professor Aija Eglite
Associate professor Janis Kusis
Associate professor Gunars Brazma
Associate professor Signe Dobelniece
Associate professor Anita Auzina
Latvia University of Agriculture /Latvia/
Latvia University of Agriculture /Latvia/
Latvia University of Agriculture /Latvia/
Fulda University of Applied Sciences /Germany/
Swedish University of Agricultural Sciences
/Sweden/
West Pomeranian University of Technology
/Poland/
Warsaw University of Life Sciences /Poland/
Warsaw University of Life Sciences /Poland/
Warsaw University of Life Sciences /Poland/
Warsaw University of Life Sciences /Poland/
University of Agder /Norway/
Aleksandras Stulginskis University /Lithuania/
Budapest Corvinus University /Hungary/
Centre for Rural Research /Norway/
Latvia University of Agriculture /Latvia/
Latvia University of Agriculture /Latvia/
Latvia University of Agriculture /Latvia/
Latvia University of Agriculture /Latvia/
Latvia University of Agriculture /Latvia/
Latvia University of Agriculture /Latvia/
Latvia University of Agriculture /Latvia/
Latvia University of Agriculture /Latvia/
Latvia University of Agriculture /Latvia/

4
Time schedule of the conference
Preparation of the proceedings and organization: October 2014 – April 2015
Conference: 23-24 April 2015
Researchers from the following higher education institutions, research institutions, and
professional organizations presented their scientific papers at the conference:
Mendel University in Brno
Silesian University in Opava
Estonian University of Life Sciences
Natural Resources Institute
Fulda University of Applied Sciences
Czech Republic
Czech Republic
Estonia
Finland
Germany
Latvian State Institute of Agrarian Economics Latvia
University of Latvia Latvia
Latvia University of Agriculture Latvia
Riga Technical University
Riga Stradins University
Latvia
Latvia
Vidzeme University of Applied Sciences
Latvenergo AS
State Priekuli Plant Breeding Institute
Rezekne Higher Education Institution
Ventspils University College
Riga International School of Economics and Bussiness
Administration
University College of Economics and Culture
Baltic International Academy
Baltic Psychology and Management University College
BA School of Business and Finance
Latvia
Latvia
Latvia
Latvia
Latvia
Latvia
Latvia
Latvia
Latvia
Latvia
Aleksandras Stulginskis University Lithuania
Kaunas University of Technology
Lithuanian Institute of Agrarian Economics
Lithuania
Lithuania
Vilnius Gediminas Technical University
Vytautas Magnus University
Erasmus University of Rotterdam
Lithuania
Lithuania
Netherlands
University of Warmia and Mazury in Olsztyn Poland
Warsaw University of Life Sciences Poland
West Pomeranian University of Technology in Szczecin Poland
Agricultural University in Krakow
University of Social Sciences and Humanities in Warsaw
Pope John Paul II State School of Higher Education in Biała
Podlaska
Poland
Poland
Poland
Bauman Moscow State Technical University Russia
Pennsylvania State University USA
University of Georgia USA

5
Editorial Board
The Editorial Board of the edition of the International Scientific Conference Proceedings:
Professor Ingrida Jakusonoka Latvia
Professor Irina Pilvere Latvia
Associate professor Gunita Mazure Latvia
Professor Barbara Freytag-Leyer Germany
Professor Jacques Viaene Belgium
Professor Bo Öhlmer Sweden
Professor Antoni Mickiewicz Poland
Professor Vilija Alekneviciene Lithuania
Associate professor Bruna Maria Zolin Italy
Professor Arild Sæther Norway
Assistant professor Inguna Leibus Latvia
Editor-in-chief: Associate professor Janis Kusis
Layout designer: Associate professor Gunars Brazma
The authors are responsible for the content and language of their papers.
Reviewers
Ludmila Aleksejeva
Valentina Andrejeva
Dzintra Atstaja
Dr.oec., assist.prof (Daugavpils University, Latvia)
Dr.oec. (JSC Olainfarm Chairperson of the Board, Latvia)
Dr.oec., prof. (BA School of Business and Finance, Latvia)
Anita Auzina Dr.oec., assoc.prof. (Latvia University of Agriculture)
Voldemars Bariss
Veronika Bikse
Dr.phil., assoc.prof. (Latvia University of Agriculture)
Dr.oec., prof. emeritus (Liepaja University, University of Latvia)
Dina Bite
Edgars Brekis
Dr.sc.soc., assist.prof. (Latvia University of Agriculture)
Dr.oec., assoc.prof. (University of Latvia)
Larisa Brokāne
Veronika Bugina
Zane Bulderberga
Vladimir Chalupsky
Mindaugas Dapkus
Agnieszka Dawidowicz
Dr.psych, assoc.prof. (Latvia University of Agriculture)
Dr.oec., assoc.prof (Latvia University of Agriculture)
Dr.oec., assist.prof. (Latvia University of Agriculture)
Dr.ing., assist.prof. (Brno University of Technology, Czech Republic)
PhD, assoc.prof. (Vytautas Magnus University, Lithuania)
PhD, assist.prof. (University of Warmia and Mazury in Olsztyn, Poland)
Konstantins Didenko
Dzineta Dimante
Dr.oec., prof. (Riga Technical University)
Dr.eoc., assist.prof. (University of Latvia)
Aina Dobele Dr.oec., prof. (Latvia University of Agriculture)
Lasma Dobele
Signe Dobelniece
Rolandas Drejeris
Nina Drejerska
Dr.oec., assist.prof. (Latvia University of Agriculture)
Dr.phil.soc.d., assoc.prof. (Latvia University of Agriculture)
Assoc.prof. (Aleksandras Stulginskis University, Lithuania)
PhD, assist.prof. (Warsaw University of Life Sciences, Poland)

6
Aija Eglite
Aleksandrs Fedotovs
Hertje Funke
Egle Gaule
Audrius Gargasas
Dr.oec., assoc.prof. (Latvia University of Agriculture)
Dr.oec., prof. (Riga International School of Economics and Business
Administration, Latvia)
Dr., prof. (Fachhochschule Münster, Germany)
Dr., assoc. prof. (Kaunas University of Tecnology, Lithuania)
Dr., prof. (Aleksandras Stulginskis University, Lithuania)
Gunta Grinberga-Zalite Dr.oec., assist. prof. (Latvia University of Agriculture)
Anda Grinfelde Dr.oec., assist. prof. (Latvia University of Agriculture)
Wojciech Gotkiewicz
Jurate Guscinskiene
Mara Gulbe
Jayson Harper
Janis Ievins
PhD, prof. (University of Warmia and Mazury in Olsztyn, Poland)
PhD, assoc.prof. (The General Jonas Zemaitis Military Academy of
Lithuania)
Dr.oec., prof. (University of Latvia)
Dr.oec., prof (Pennsylvania State University, USA)
Dr.oec., prof. (Riga Technical University, Latvia)
Ingrida Jakusonoka Dr.oec., prof. (Latvia University of Agriculture)
Inara Jurgena
Veronika Kajurova
Dace Kaufmane
Janis Kaulins
Dr.oec., assoc. prof. (Latvia University of Agriculture)
Ing. (Masaryk University, Czech Republic)
Dr.oec., assist.prof. (Latvia University of Agriculture)
MSc.env. (University of Latvia)
Kitija Kirila Dr.oec., assist.prof. (Latvia University of Agriculture)
Viola Korpa Dr.sc.soc., assist.prof. (Latvia University of Agriculture)
Ginta Kronberga
Juri Krusealle
Zenija Kruzmetra
Dace Klava
Dr.sc.soc., assist.prof. (Latvia University of Agriculture)
PhD (Estonian University of Life Sciences)
Dr.geogr., assist.prof. (Latvia University of Agriculture)
Dr.sc.ing. (Latvia University of Agriculture)
Bogdan Klepacki Grzegorz Koszela
Dr hab., prof. (Warsaw University of Life Sciences, Poland) PhD, assoc.prof. (Warsaw University of Life Sciences, Poland)
Krystyna Kryzanowska Dr., prof. (Warsaw University of Life Sciences, Poland)
Jüri Krusealle Krystyna Krzyzanowska
Gediminas Kuliesis
PhD, assoc. prof. (Estonian University of Life Sciences) Dr.hab., prof. (Warsaw University of Life Sciences, Poland)
Dr., senior researcher (Institute of Agrarian Economics, Lithuania) Janis Kusis Dr.hist., assoc.prof. (Latvia University of Agriculture)
Inguna Leibus
Nina Linde
Heikki Makinen
Dr.oec., assoc.prof. (Latvia University of Agriculture)
Dr.paed. (Institute of Economics, Latvia)
Research scientist (Natural Resources institute, Finland)
Gunita Mazure Dr.oec., assoc.prof. (Latvia University of Agriculture)
Linda Medne Dr.oec., assist.prof. (Latvia University of Agriculture)
Bartosz Mickiewicz
Antoni Mickiewicz
Pawel Mickiewicz
Ingrida Millere
Jolanta Millere
Phd, prof. (West Pomeranian University of Technology in Szczecin,
Poland)
PhD, prof. (West Pomeranian University of Technology in Szczecin,
Poland)
Dr.hab, prof. (Welfare Projects Academy of Sciences in Lodz, Poland)
Dr.oec., assist.prof. (Latvia University of Agriculture)
Dr.sc.soc., assist.prof. (Latvia University of Agriculture)
Tatjana Muravska Dr.oec., prof. (University of Latvia)
Aina Muska Dr.oec., assoc. prof. (Latvia University of Agriculture)
Kaspars Naglis-Liepa
Viktors Nespors
Czeslaw Nowak
Inta Ostrovska
Juris Paiders
Liga Paula
Dr.oec., assist.prof. (Latvia University of Agriculture)
Dr.oec., prof. (Riga Technical University, Latvia)
Dr.hab., prof. (University of Agriculture in Krakow, Poland)
Dr.paed., assist.prof. (Daugavpils University, Latvia)
Dr.geogr., assist.prof. (University of Latvia)
Mg.sc.soc., lecturer (Latvia University of Agriculture)
Modrite Pelse Dr.oec., prof. (Latvia University of Agriculture)
Irina Pilvere
Andrzej Pjotr
V. Polezhaev
Dr.oec., prof. (Latvia University of Agriculture)
Dr.hab., prof. (University of Warsaw, Poland)
Dr.paed., leading researcher (Institute of Informatization of Education,
Russia)

7
Anne Poder M.sc., researcher (Estonian University of Life Sciences)
Dina Popluga
Arturs Praulins
Dr.eoc., assist.prof. (Latvia University of Agriculture)
Dr.oec., researcher (Latvian State Institute of Agrarian Economics)
Liga Proskina
Karlis Purmalis
Liga Rasnaca
Dr.oec., assist.prof. (Latvia University of Agriculture)
Dr.oec., assist.prof. (University of Latvia)
Dr.sc.soc., assist.prof. (University of Latvia)
Baiba Rivza Dr.hab.oec., prof. (Latvia University of Agriculture)
Valerijs Roldugins
Ritma Rungule
Juris Saulitis
Isabella Sikorska-Wolak
Dr.oec., prof. (Baltic International Academy, Latvia)
Dr.sc.soc., assoc.prof. (Riga Stradins University, Latvia)
Dr.oec., prof. (Riga Technical University, Latvia)
Dr.hab., prof. (Warsaw University of Life Sciences, Poland)
Linda Silina
Irina Solovjova
Dr.oec., assist.prof. (Latvia University of Agriculture)
Dr.oec., assist.prof. (University of Latvia)
Voldemars Strikis
Erika Sumilo
Aivars Tabuns
Tatjana Tambovceva
Dr.hab.oec., prof. (Latvia University of Agriculture)
Dr.oec., prof. (University of Latvia)
Dr.sc.soc., prof. (University of Latvia)
Assoc.prof. (Riga Technical University, Latvia)
Ilze Upite Dr.oec., assist. prof. (Latvia University of Agriculture)
Romualdas Valkauskas
Visvaldis Valtenbergs
Gintare Vaznoniene
Ants-Hannes Viira
Dr., assoc.prof. (Vilnius University, Lithuania)
Dr.sc.pol., assist.prof (Vidzeme University of Applied Sciences)
Dr., assoc.prof. (Aleksandras Stulginskis University, Lithuania)
PhD., researcher (Estonian University of Life Sciences)
Anastasija Vilcina
Inga Vilka
Dr.oec., prof. (Latvia University of Agriculture)
Dr.oec., assoc.prof. (University of Latvia)
Irija Vitola
Tatjana Volkova
Sergejs Volvenkins
Arnost Wahla
Dr.oec., prof. (Latvia University of Agriculture)
Dr.oec., prof. (BA School of Business and Finances, Latvia)
Dr.oec., prof. (Turiba University, Latvia)
Prof., RNDr. (Karel Englis College, Czech Republic)
Bogdan Wawrzyniak
Radoslaw Wisniewski
Dr.hab., prof. (Technical Environmental Univ. In Bydgoszcz, Poland)
Assoc. prof. (University of Warmia and Mazury in Olsztyn, Poland)
Ludwik Wicki
Toms Zalitis
Dr.hab., assist. prof. (Warsaw University of Life Sciences, Poland)
PhD, researcher (Latvian State Forestry Research Institute Silava)
Sandija Zeverte-Rivza Dr.oec., assist.prof. (Latvia University of Agriculture)
Aija Zobena
Leonas Zitkus
Dr.sc.soc., prof. (University of Latvia)
Dr., prof. (Kaunas University of Technology)
Anda Zvaigzne Dr.oec., assist. prof. (Latvia University of Agriculture)
Andra Zvirbule-Berzina Dr.oec., prof. (Latvia University of Agriculture)

8
Publication Ethics and Malpractice Statement for the International
Scientific Conference “Economic Science for Rural Development”
The Editorial Board is responsible for, among other, preventing publication malpractice.
Unethical behaviour is unacceptable and the authors who submit articles to the Conference
Proceedings affirm that the content of a manuscript is original. Furthermore, the authors’
submission also implies that the material of the article was not published in any other
publication; it is not and will not be presented for publication to any other publication; it does
not contain statements which do not correspond to reality, or material which may infringe
upon the intellectual property rights of another person or legal entity, and upon the conditions
and requirements of sponsors or providers of financial support; all references used in the
article are indicated and, to the extent the article incorporates text passages, figures, data or
other material from the works of others, the undersigned has obtained any necessary permits
as well as the authors undertake to indemnify and hold harmless the publisher of the
proceedings and third parties from any damage or expense that may arise in the event of a
breach of any of the guarantees.
Editors, authors, and reviewers, within the International Scientific Conference “Economic
Science for Rural Development” are to be fully committed to good publication practice and
accept the responsibility for fulfilling the following duties and responsibilities, as set by the
COPE Code of Conduct and Best Practice Guidelines for Journal Editors of the Committee on
Publication Ethics (COPE).
It is necessary to agree upon standards of expected ethical behaviour for all parties involved in
the act of publishing: the author, the editor, the peer reviewer, and the publisher.
DUTIES OF EDITORS
Publication decisions
The Editorial Board is responsible for deciding which of the articles submitted to the
Conference Proceedings should be published. The Editorial Board may be guided by the policies
of ethics and constrained by such legal requirements as shall then be in force regarding libel,
copyright infringement and plagiarism. The editor may confer with other editors or reviewers in
making this decision.
Fair play
An editor at any time evaluate manuscripts for their intellectual content without regard to the
nature of the authors or the host institution including race, gender, sexual orientation,
religious belief, ethnic origin, citizenship, or political philosophy of the authors.
Confidentiality
The editor and any editorial staff must not disclose any information about a submitted
manuscript to anyone other than the corresponding author, reviewers, potential reviewers,
other editorial advisers, and the publisher, as appropriate.
Disclosure and conflicts of interest
Unpublished materials disclosed in a submitted manuscript must not be used in an editor’s own
research without the express written consent of the author.
DUTIES OF REVIEWERS
Every submitted manuscript has been reviewed by one reviewer from the author’s native
country or university, while the other reviewer came from another country or university. The
third reviewer was chosen in the case of conflicting reviews. All reviewers were anonymous for
the authors of the articles, and the reviewers presented blind reviews. Every author received
the reviewers’ objections or recommendations. After receiving the improved (final) version of

9
the manuscript and the author’s comments, the Editorial Board of the conference evaluated
each article.
Contribution to editorial decisions
Peer review assists the editor in making editorial decisions and through the editorial
communications with the author may also assist the author in improving the paper.
Promptness
Any selected referee who feels unqualified to review the research reported in a manuscript or
knows that its prompt review will be impossible should notify the editor and excuse himself
from the review process.
Confidentiality
Any manuscripts received for review must be treated as confidential documents. They must
not be shown to or discussed with others except as authorised by the editor.
Standards of objectivity
Reviews should be conducted objectively. Personal criticism of the author is inappropriate.
Referees should express their views clearly with supporting arguments.
Acknowledgement of sources
Reviewers should identify relevant published work that has not been cited by the authors. Any
statement that an observation, derivation, or argument had been previously reported should
be accompanied by the relevant citation. A reviewer should also call to the editor's attention
any substantial similarity or overlap between the manuscript under consideration and any
other published paper of which they have personal knowledge.
Disclosure and conflict of interest
Privileged information or ideas obtained through peer review must be kept confidential and not
used for personal advantage. Reviewers should not consider manuscripts in which they have
conflicts of interest resulting from competitive, collaborative, or other relationships or
connections with any of the authors, companies, or institutions connected to the papers.
DUTIES OF AUTHORS
Reporting standards
The authors of reports of original research should present an accurate account of the work
performed as well as an objective discussion of its significance. Underlying data should be
represented accurately in the paper. A paper should contain sufficient detail and references to
permit others to replicate the work. Fraudulent or knowingly inaccurate statements constitute
unethical behaviour and are unacceptable.
Data access and retention
The authors are asked to provide the raw data in connection with a paper for editorial review,
and should be prepared to provide public access to such data (consistent with the ALPSP-STM
Statement on Data and Databases), if practicable, and should in any event be prepared to
retain such data for a reasonable time after publication.
Originality and plagiarism
The authors should ensure that they have written entirely original works, and if the authors
have used the work and/or words of others that this has been appropriately cited or quoted.
Multiple, redundant or concurrent publication
An author should not in general publish manuscripts describing essentially the same research
in more than one journal or primary publication. Submitting the same manuscript to more than
one journal concurrently constitutes unethical publishing behaviour and is unacceptable.

10
Acknowledgement of sources
Proper acknowledgment of the work of others must always be given. The authors should cite
publications that have been influential in determining the nature of the reported work.
Authorship of the paper
Authorship should be limited to those who have made a significant contribution to the
conception, design, execution, or interpretation of the reported study. All those who have
made significant contributions should be listed as co-authors. Where there are others who
have participated in certain substantive aspects of the research project, they should be
acknowledged or listed as contributors.
The corresponding author should ensure that all appropriate co-authors and no inappropriate
co-authors are included on the paper, and that all co-authors have seen and approved the final
version of the paper and have agreed to its submission for publication.
Hazards and human or animal subjects
If the work involves chemicals, procedures or equipment that have any unusual hazards
inherent in their use, the author must clearly identify these in the manuscript.
Disclosure and conflicts of interest
All authors should disclose in their manuscript any financial or other substantive conflict of
interest that might be construed to influence the results or interpretation of their manuscript.
All sources of financial support for the project should be disclosed.
Fundamental errors in published works
When an author discovers a significant error or inaccuracy in his/her own published work, it is
the author’s obligation to promptly notify the editor or publisher and cooperate with the editor
to retract or correct the paper.
Editorial Board

11
Foreword
The international scientific conference “Economic Science for Rural Development” is
organized annually by the Faculty of Economics and Social Development of Latvia University of
Agriculture. The proceedings of the conference are published since 2000.
The scientific papers presented in the conference held on 23-24 April 2015 are
published in 4 thematic volumes:
No 37 Production and Cooperation in Agriculture
Bioeconomy
Finance and Taxes
No 38 Integrated and Sustainable Regional Development
No 39 Rural Development and Entrepreneurship
No 40 Marketing and Sustainable Consumption
New Dimensions in the Development of Society
The proceedings contain scientific papers representing not only the science of
economics in the diversity of its sub-branches, but also other social sciences (sociology,
political science), thus confirming inter-disciplinary development of the contemporary social
science.
This year for the first time the conference includes the section on a new emerging kind
of economy - bioeconomy. The aim of bioeconomy is to use renewable biological resources in a
more sustainable manner. Bioeconomy can also sustain a wide range of public goods, including
biodiversity. It can increase competitiveness, enhance Europe's self-reliance and provide jobs
and business opportunities.
The Conference Committee and Editorial Board are open to comments and
recommendations concerning the preparation of future conference proceedings and
organisation of the conference.
Acknowledgements
We would like to thank all the authors, reviewers, members of the Conference Committee and
the Editorial Board as well as supporting staff for their contribution organising the conference
and preparing the proceedings. In particular we wish to thank associate professor Signe
Dobelniece, assistant professor Zenija Kruzmetra, lecturer Lana Janmere, lecturer Baiba
Miltovica, and assistant professor Juris Vuguls.
On behalf of the Editorial Board
Gunars Brazma
Associate professor of Faculty of Economics and Social Development
Latvia University of Agriculture

12
Contents
1. PRODUCTION AND COOPERATION IN AGRICULTURE
Kęstutis Peleckis, Valentina Peleckiene, Kęstutis Peleckis
CROP YIELD INSURANCE – NEGOTIATING BETWEEN GOVERNMENT, FARMERS AND INSURANCE COMPANIES ……………………………………………….........15
Alina Sinisalo PRODUCTION COSTS OF FINNISH DAIRY FARMS IN THE 2000S…………………….26
Tomas Balezentis THE IMPACT OF TIME SERIES EXPANSION IN NONPARAMETRIC ANALYSES OF EFFICIENCY EFFECTS……………………………………………………………………………………35
Tomas Balezentis, Daiva Makuteniene
RESOURCE USE AND PRODUCTIVITY IN AGRICULTURE ACROSS THE EUROPEAN UNION MEMBER STATES…………………………………………………………………45
Reet Põldaru, Ants-Hannes Viira, Jelena Ariva, Jüri Roots
MODELLING THE MEAT SECTOR IN ESTONIA……………………………………………………54
Eglė Stonkutė, Jolita Vveinhardt
ECONOMIC POLICY INCENTIVES ENCOURAGING AGRICULTURAL PRODUCTION: A COMPARATIVE ANALYSIS OF LITHUANIAN RURAL
DEVELOPMENT PROGRAMME FOR 2007-2013 AND 2014-2020 ………………………64
Adam Pawlewicz CONDITION AND PROSPECTS OF DEVELOPMENT OF ORGANIC FARMING
IN THE EUROPEAN UNION………………………………………………………………………………….76 Tomasz Rokicki
ECONOMIC RESULTS OF SHEEP FARMS IN POLAND………………………………………..86
Marcin Wysokinski, Joanna Baran, Wojciech J. Florkowski
CONCENTRATION OF MILK PRODUCTION IN POLAND……………………………………..93 Sandija Zēverte-Rivža, Aleksandrs Adamovičs
RISK ASSESSMENT IN HEMP (Cannabis sativa L.) PRODUCTION AND PROCESSING……………………………………………………………………………………………105
2. BIOECONOMY
Barbara Golebiewska
THE RELATIONSHIPS OF ECOLOGICAL AND ECONOMIC USE OF NATURAL
RESOURCES …………………………………………………………………………………………………….114
Irina Pilvere, Agnese Krievina, Aleksejs Nipers
LAND MANAGEMENT PATERNS IN LATVIA AND ITS REGIONS………………………122

13
Piotr Gołasa
AGRICULTURAL BIOGAS PRODUCTION AND THE DEVELOPMENT OF
PROSUMER ENERGY IN POLAND…………...................................................134 Alina Danilowska
PROVISION OF PUBLIC GOODS BY AGRICULTURE IN POLAND…………………….142
Liga Proskina, Sallija Cerina
ECONOMIC EFFICIENCY OF FEEDING A PROTEIN CONCENTRATE
ADDITIVE TO BROILER CHICKENS………………………………………………………………….152 Arnis Lenerts
DEVELOPMENT OF SUSTAINABLE INTENSIFICATION
EVALUATION METHODOLOGY FOR FARMLANDS IN LATVIA........................160
Tomasz Pajewski
TENDENCY OF CHANGES IN EXPENDITURES FOR ENVIRONMENTAL
PROTECTION IN THE EUROPEAN UNION………………………………………………………..171
3. FINANCE AND TAXES Jekaterina Nazarova, Inna Dovlabdekova
INVESTMENT PLANNING IN THE CONTEXT OF
VOLATILE BUSINESS CYCLES…………………………………………………………………………180 Mara Petersone, Aivars Vilnis Krastins, Karlis Ketners
DEVELOPMENT OF SYSTEM OF STATE REVENUE SERVICE
PERFORMANCE INDICATORS………………………………………………………………………….190 Irija Vitola, Atrjoms Antonovs
ASSESSMENT OF CORPORATE INCOME TAX IN THE BALTIC STATES………….201
Karlis Ketners
POSSIBILITY FOR PERSONAL WEALTH TAXATION SYSTEM IN LATVIA.........211
Algis Junevicius, Mindaugas Puidokas
CONTOURS OF THE BANKING UNION WITHIN THE INTEGRATED EUROPE: THE LITHUANIAN CASE........................................................................220
Nadezhda Semjonova
ASSESSMENT OF THE GOVERNMENT DEBT POSITION IMPACT ON THE GENERAL TAXATION POLICY…………………………………………………………………..232
Linda Kauskale, Ineta Geipele
FOREIGN DIRECT REAL ESTATE INVESTMENTS IN LATVIA IN THE CONTEXT OF THE DEVELOPMENT OF THE NATIONAL ECONOMY………………………………….241
Ivita Faitusa
PUBLIC INTERNAL CONTROL IN THE EUROPEAN UNION………………………………251

14
Alina Dibrova
BUSINESS ANGELS – POSSIBILITY FOR EUROPEAN SMES……………………………258 Gunita Mazure, Sandra Tiltina
EXPORT-IMPORT DYNAMICS WITHIN THE EUROPEAN UNION
TRADE POLICY………………………………………………………………………………………………….268
Jana Simakova
ASSESSING THE EXCHANGE RATE SENSITIVITY OF CZECH BILATERAL AGRICULTURAL TRADE........................................................280

15
CROP YIELD INSURANCE – NEGOTIATING BETWEEN GOVERNMENT, FARMERS AND INSURANCE COMPANIES
Kęstutis Peleckis1, prof.; Valentina Peleckienė2*, associated prof.; Kęstutis Peleckis3,
PhD student. 1,2,3,Vilnius Gediminas Technical University, Lithuania
Abstract. The purpose of this paper is to analyse the experience of crop yield insurance in
Lithuanian agricultural sector against unfavourable climatic factors causing the losses of crop
harvest and their impacts on the insurance premiums and the indemnity for damage. The huge
problem of Lithuanian crop insurance system is the low rate of farmer’s participation and
problems arising in defining insurance premiums. However, there are noticeable substantial
climate changes during the last 20 years, and agricultural sector in future will be more affected
by unfavourable climatic conditions and such natural disasters require the Government to
provide assistance to farmers. The amount of insurance premiums for crop insurance are
relatively high, because a single Insurance Company does not accumulated sufficient statistics,
so farmers rarely use its services: now there are insured only 7% of insurable crop areas in
Lithuania. Consequently, negotiating takes place between farmers, Insurance Company and
Government concerning compensation for crop yield losses. The aim of paper is to analyze the
advanced experience of other countries, to evaluate principles of crop insurance in order to
give proposals for all negotiating parties. Methods of the investigation are comparative analysis
of the problem, descriptive approach, synthesis, modeling. The results and conclusions of the
paper suggest to modify the principles of crop insurance driving to „low-premium“, „wide
coverage“ system, to increase the transparency of damage evaluation and payment of
insurance claims and to be more focused on trends of climate change in future.
Key words: Crop insurance, loss indemnity, insurance premium, yield, weather-related
disasters.
JEL code: G18, G22, Q18, Q54.
Introduction
Lithuanian agriculture employs about 5% of all persons employed. The production of
agricultural sector accounts approximately 8% of GDP of Lithuania. Agriculture is a strategic
sector of the economy of Lithuania due to its ties to elements essential to the quality of life of
a country's population: food supplies and the environment. Crops were grown by 159 600
farms in 2013. Widespread crops in Lithuania are winter cereals and spring cereals. The winter
* Corresponding author. Tel. +370 64358067. E-mail [email protected]
Proceedings of the 2015 International Conference “ECONOMIC SCIENCE FOR RURAL DEVELOPMENT” No37
Jelgava, LLU ESAF, 23-24 April 2015, pp. 15-25

16
cereals harvest has increased by 12.0% (169 thousand t) and harvest of spring cereals – 4.7%
(59 thousand t) in Lithuania throughout 2000 – 2010 year period (Balezentis, 2011). However,
it is also one of the activities with the highest risk exposure, mostly because it is carried out in
a natural environment. It can also be argued that the degree of uncertainty in agriculture will
be even more marked in the future due to the tendency of significant changes in weather
conditions (climate change and environmental risks) and the increased international trade and
free market conditions.
As for a long time insurers lacked competence in assessing the impact on plant violations to
the final harvest, the ability and willingness competently and understandably to explain for
farmers damages assessment methods. Hence, the negotiations between insurers and the
farmers concerning crop insurance ended to conflicts typically and moved to the courts, what
increased the unpopularity of the crop insurance service even more and formed negative
attitude of the farmers to the insurers.
In this context, agricultural risk management has been the focus of both recent and current
reforms in many countries belonging to the Organisation for Economic Cooperation and
Development (OECD). Agricultural insurance is probably one of the most efficient and best
known tools for managing the risks associated with agriculture. The trust of farmer in the
policy of insurance is the clearest indicator of the insurance policy efficiency. It‘s validity
becomes clear when an assessment is made on the extent of damages suffered by the insured
product, since this is the time when the policy either meets or fails to meet the holder's
expectations. For this reason, damage assessment is of crucial importance as it can guarantee
insured farmers a satisfactory return on their work.
The objective is to carry out an investigation of crop insurance in Lithuania in order to
define and offer proposals which can help solving problems arising in negotiations between
farmers, Insurance Company and Government. Could the coverage level of crop insurance be
capable to offer adequate compensation for yield loss from natural disasters or encourage
farmers to purchase crop insurance? With the help of statistical data ratio analysis, this paper
is to give recommendations for improving crop insurance system of Lithuania.
1. The overview of world agricultural insurance systems as a risk
management tool
Crop insurance is an important tool to alleviate natural disaster risks. There are three types
of crop insurance in the world: 1) cost insurance, 2) yield insurance and 3) revenue insurance
(Ruihua et al., 2010).
The yield insurance is widely used in about 40 countries. Lithuania is using Government -
subsidized crop insurance system from 2008, according to which the coverage level is defined
on the yield cost incurred during crop production. Under the current policy of principles of crop
insurance system the insurance system aims to stabilize the life of farmers in cases where
natural disasters occur.
17
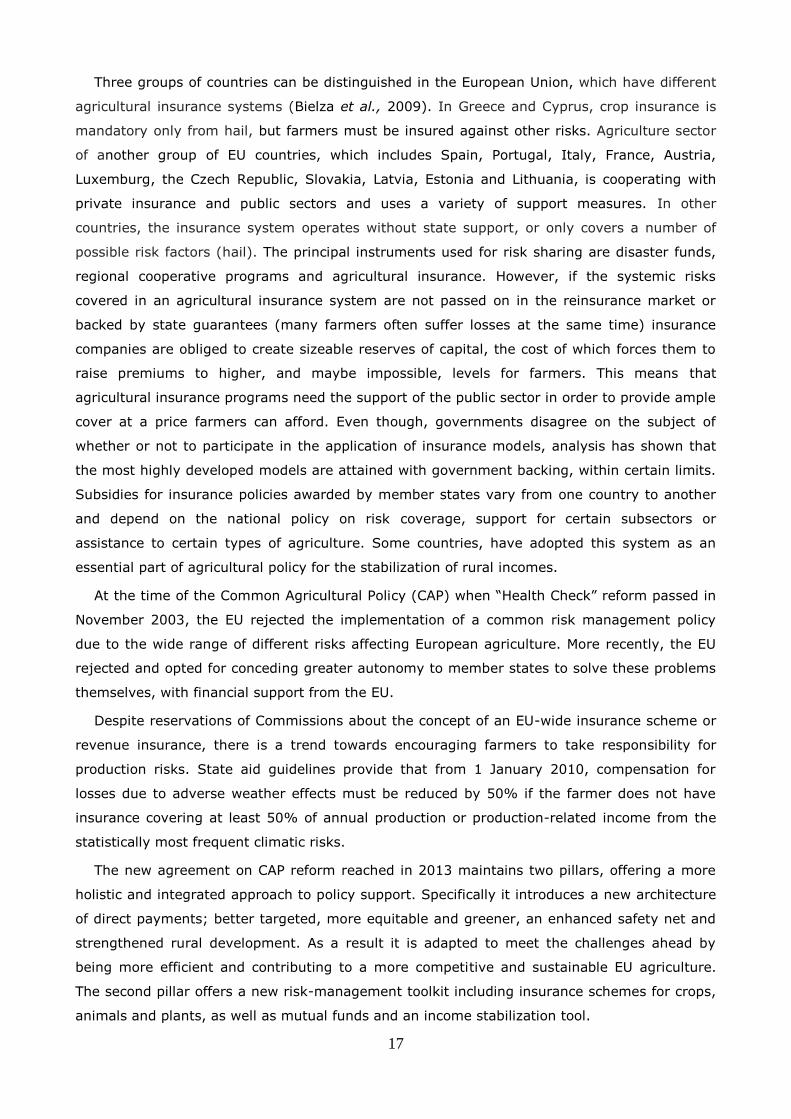
Three groups of countries can be distinguished in the European Union, which have different
agricultural insurance systems (Bielza et al., 2009). In Greece and Cyprus, crop insurance is
mandatory only from hail, but farmers must be insured against other risks. Agriculture sector
of another group of EU countries, which includes Spain, Portugal, Italy, France, Austria,
Luxemburg, the Czech Republic, Slovakia, Latvia, Estonia and Lithuania, is cooperating with
private insurance and public sectors and uses a variety of support measures. In other
countries, the insurance system operates without state support, or only covers a number of
possible risk factors (hail). The principal instruments used for risk sharing are disaster funds,
regional cooperative programs and agricultural insurance. However, if the systemic risks
covered in an agricultural insurance system are not passed on in the reinsurance market or
backed by state guarantees (many farmers often suffer losses at the same time) insurance
companies are obliged to create sizeable reserves of capital, the cost of which forces them to
raise premiums to higher, and maybe impossible, levels for farmers. This means that
agricultural insurance programs need the support of the public sector in order to provide ample
cover at a price farmers can afford. Even though, governments disagree on the subject of
whether or not to participate in the application of insurance models, analysis has shown that
the most highly developed models are attained with government backing, within certain limits.
Subsidies for insurance policies awarded by member states vary from one country to another
and depend on the national policy on risk coverage, support for certain subsectors or
assistance to certain types of agriculture. Some countries, have adopted this system as an
essential part of agricultural policy for the stabilization of rural incomes.
At the time of the Common Agricultural Policy (CAP) when “Health Check” reform passed in
November 2003, the EU rejected the implementation of a common risk management policy
due to the wide range of different risks affecting European agriculture. More recently, the EU
rejected and opted for conceding greater autonomy to member states to solve these problems
themselves, with financial support from the EU.
Despite reservations of Commissions about the concept of an EU-wide insurance scheme or
revenue insurance, there is a trend towards encouraging farmers to take responsibility for
production risks. State aid guidelines provide that from 1 January 2010, compensation for
losses due to adverse weather effects must be reduced by 50% if the farmer does not have
insurance covering at least 50% of annual production or production-related income from the
statistically most frequent climatic risks.
The new agreement on CAP reform reached in 2013 maintains two pillars, offering a more
holistic and integrated approach to policy support. Specifically it introduces a new architecture
of direct payments; better targeted, more equitable and greener, an enhanced safety net and
strengthened rural development. As a result it is adapted to meet the challenges ahead by
being more efficient and contributing to a more competitive and sustainable EU agriculture.
The second pillar offers a new risk-management toolkit including insurance schemes for crops,
animals and plants, as well as mutual funds and an income stabilization tool.

18
The agricultural sector is highly supported in the European, with various CAP instruments,
reducing the level of income variability faced by farmers. However, in addition to these
measures most countries have specific measures designed to help farmers manage risks, for
example insurance. With regard to insurance type schemes, the level and extent of coverage
and subsidization can vary widely in various countries.
2. Development of Crop insurance system in Lithuania
In 2006, the farmers of Lithuania suffered from drought: according to calculations, the
losses exceeded LTL 600 million. Crop insurance has been carried out only by single insurance
company “PZU Lithuania” in this period, for very high premiums, so only small part of farmers
could insure their crops (they insured only 0.5% of overall size of crops), crop insurance for
this company was unprofitable (during 5 years insurance company made only 1 000 insurance
policies and insured approximately 10 000 ha of crops), therefore, farmers appealed to the
state asking to cover losses caused by drought.
Already in 2006, assessing farmers' dissatisfaction with the insurance quality, the Ministry
of Agriculture created a working group, which was instructed to prepare Lithuanian concept of
crop insurance system that could meet the expectations of farmers, the state strategy, the
European Union's priorities, trends and also would be attractive for Lithuania insurance
companies. Members of the group undertook a detailed analysis of European, American and
Asian countries experience on crop insurance, their existing legislation, the main trends and
made recommendations for future model. It was found that the main components of risk
management process are: the risk identification and assessment, its potential impact on the
economy forecast; the creation and implementation of an action plan for risk management.
So working group in preparing the crop risk management action plan defined the main
principles of crop insurance system (Radzevicius, 2007): interest and willingness; cooperation
(coordinated interaction entities); interest and willingness; cooperation (coordinated
interaction entities); fairness and objectivity; effectiveness; transparency; flexibility,
adaptability; system stability; continuity of the system (development option).
German specialized crop insurance company Vereinigte Hagelversicherung VvaG „Branch“
VH Lithuania“ (Insurance Company) for carrying out crop insurance in Lithuania was selected
in 2007 according to defined principles, which is cooperating successfully with Government of
Lithuania and farmers up to now. However, the majority of the country's farmers are still
unwilling to insure their crops: this is evidenced by statistics of the 2014 winter crop season,
which began in August. Most farmers insured their crops against three risks: hail, rainfall and
storms. No farmer had insured crops from drought risk. The winter crop insurance against the
frost risk still gets a lot of discussions not only in Lithuania but in Europe also. Lithuania
farmers complain of increased insurance premiums, although last winter did not make a lot of
damage. However, the most famous European reinsurer’s professionals say that farmers of
Lithuania just were lucky in 2013 winter, because there was about 5 cm thicker coat of snow

19
cover. Only, in seaside region of Lithuania, where a snow cover was slightly lower, almost all
winter crops have frozen. Consequently, Insurance Company have changed the insurance
conditions for winter crops against frost risks in 2014, considering to the losses of last two
years (Figure 1), when more than LTL 600 million of claims were paid due crop destruction by
frost: the insurance premium for winter cereals and rape were increased from 1.8 to 2.5 times.
So now the maximum premiums are for insurance of crops against destruction by frost. Yet,
policyholders are repaid 20% of insurance premiums amount. In cases of a natural disaster,
the Government can decide whether to provide support for this critical situation. It should
cover losses not compensated by insurance. Member States in this case must inform the
European Commission, that they intend to provide such support.
Source: author’s construction based on statistics of Bank of Lithuania, Insurance supervisory authority
Fig.1. Ratio of Insurance premiums and claims paid by Insurance Company
The Insurance Company has opinion that crops’ destruction by frost is loss insurance, rather
than yield insurance because farmers can again re-sown crops, and can get a new harvest in
the same year. In contrary, the hail can destroy the entire harvest. In the future farmers
should focus more on crop insurance from destruction by frost or to sow less amounts of winter
crops.
3. The main risk determinants and their evaluation
The most complicated issue for Insurance Company is definition of proper coverage level of
the crop indemnity and determining the value of the sum insured. In 20I2 year the Ministry of
Agriculture introduced restriction of 50% reimbursement of premium but no more than a
certain amount of crops. This reimbursement amount is the main issue in negotiations between
the Insurance Company and farmers. Defining the method of calculating reimbursement
amount is essential. The decision was made to calculate it according to the income obtained
from the crop production per hectare. Conditional income per hectare from growing one or

20
another kind of plants is calculated by statistical data - what is the average yield obtained from
such unit of area and what is value of such production. After calculation the average income
per hectare, the Insurance Company determines the highest amount for compensation of
insurance premium: more income is higher, the insurance is more expensive, however, and
the amount of compensation is higher. The Insurance Company acknowledges that now
insurance premiums in Lithuania are relatively high, because the Insurance Company still does
not have a so-called "history" that is, it have not accumulated enough statistical data that
would allow to focus on questions: how often natural disasters touch agriculture, what areas
do they cover. Insurance Company usually focuses on 30-year statistical average, while in
Lithuania they work only for 7 years. Lithuania’s specificity is that they have to persuade
farmers to insure crops, when in other countries the insurance is much more common.
In summary can be said that there are too much constraints in trying to select feasible crop
insurance scheme: lack of historical yield data, small sized farm holdings, low value crops,
relatively high cost of insurance, distrust of farmers in insurance system.
4. Comparison of the harvest, areas and yields in estimation of loss
indemnity costs
Winter cereals and spring cereals are the most common crops in Lithuania. Comparison of
statistics on harvest, areas and yield of these two main kinds of crops in 10 counties (Alytus,
Kaunas, Klaipeda, Marijampole, Panevezys, Siauliai, Taurage, Telsiai, Utena, Vilnius) has been
displayed in Table 1 throughout the period of 2000-2010 on the basis of Lithuania Statistics
database. Considering the results of analysis the total harvest increased about 110 thousand
tons or by 4.0%. The total area of crops also grew up by 54 thousands ha or by 5.7% but the
total yield of crops decrease from 2.7 to 2.6 ton per ha because of the yields drop of winter
cereals from 3.1 to 2.9 ton per ha during the same period of time.
As for winter cereals, their area increased by 18.3%. More specifically, the share of winter
crops compared with the whole area of Lithuania increased for counties of Marijampole,
Siauliai, Telsiai, Panevezys and Taurage. On the other hand, this share decreased for counties
of Kaunas, Vilnius, Utena, Alytus, and Klaipeda.

21
Table 1
Dynamics of crop harvest, area and yield in Lithuania under 2000 -2010 years
Cereals Year Harvest, t Area, ha Yield, t/ha
Winter cereals 2000 1410055 448934 3.1
2010 1579274 530998 2.9
Spring cereals 2000 1247570 530693 2.3
2010 1188492 505178 2.3
Total 2000 2657625 979627 2.7
2010 2767766 1036176 2.6
Source: author’s calculations based on Lithuania Statistics database
As for spring cereals, their area decreased by 4.8%, that is 25.5 thousand ha during 2000–
2010 period. At the counties level the following shifts in crop structure were observed: in
counties of Panevezys, Kaunas, Vilnius, Telsiai, Siauliai and Alytus has increased, whereas in
counties of Marijampole, Taurage, Klaipeda and Utena has decreased.
Indeed, the research (Balezentis, 2011) has reported that the most efficiently operating
farms were those in counties of Marijampole, Siauliai and Klaipeda. Hence, it might be
concluded that farming is associated with growing of winter cereals efficiency
and therefore counties of Marijampole and Siauliai were those managed to increase their share
in total area of winter cereals in Lithuania (increases of 3.1% and 2.9%). Indeed, these
findings can be based on commonly known advantages of winter cereals.
Considering the winter cereals, their harvest has increased by 12% (169 thousand t) in
Lithuania throughout 2000–2010. The highest rates of increase were observed in counties of
Telsiai, Marijampole, Taurage and Siauliai. At the other end of spectrum, counties of Vilnius,
Utena, and Alytus exhibited the highest rates of decrease in harvest. The yield values have
also been varying across different counties.
The alteration of the area proportions under different cereal species in certain county lead to
positive effect of their mix. Hence, these changes can be considered as rational ones.
Nevertheless, adverse climatic conditions lead to decrease in yields. Yield effect, hence, caused
decline of 6% or 246 thousand t in total harvest. In accordance with the results obtained by
Lithuanian scientists (Balezentis, 2011), the results of multiplicative index decomposition
analysis (IDA) for cereal crop harvest in Lithuania during 2000–2010 year period, which are
presented in Figure 2, suggest that the area effect caused increase in harvest of some 6%.
Meanwhile, species mix effect led to increase in harvest of 3%, whereas structure effect – to
that of 2%. The yield effect caused decrease of some 6%. The total harvest during researched
period, therefore, grew by 4%.
Over time, the loss experience for an average individual producer is generally related to:
the crop characteristics,
the production area,

22
and the weather.
A group of producers in a particular region will generally exhibit yield risks over time in
relationship to the time periods of the geographic region. This relationship is illustrated in
Figure 3 that shows the evolution of regional de-trended yield risks over time and the
corresponding set of producers’ risk for selected years. When regional yields increase or
decrease around the expected (zero percent) trend level, the producer yield distribution within
the region tends to shift in the same direction. A proper yield-based insurance rating analysis
would sample across each producer at various coverage levels and all years to estimate loss
indemnity costs.
Source: author’s construction based on research Balezentis, 2011
Fig.2. The changes in crop harvest of Lithuania in 2000–2010
The weather is becoming an increasingly important variable in the recent period. The year
2010 can be described as specific meteorological conditions year in Lithuania: during the
winter cold was of 5 degrees below, in summer - the heat was of 5 degrees higher. Agriculture
particular suffers from early spring and autumn frosts, heat waves and flaw.

23
Source: author’s construction based on Cole, Gibson, 2010
Fig. 3. Times periods of Regional Yield and Selected Cross-sectional Producer Yield
Risks
Lithuanian climate conditions have been slowly changing over the last 20 years. While
climate changes vary in different regions of Lithuania, but overall changes are observed
everywhere. Research results of soil freezing depth showed that it decreased in regions
(Vilnius, Utena, Varena), where history has been observed high level of soil freezing, and
increased in Birzai, Kaunas, Siauliai (Stuoge et al., 2012). Thus Insurance Company should be
more focused on climate change trends in the future, rather than complain about the lack of
statistics.
5. Negotiation strategy between Government, farmers and Insurance
Company
In the crop insurance practice, it is essential to determine proper coverage level and
affordable premium. However, the majority of the country's farmers are still unwilling to insure
their crops. On the basis of results of the analysis, it can be concluded that crop insurance in
Lithuania is ineffective, what is causing a lot of financial problems for farmers. Consequently,
there are basic tasks for negotiations between Government, farmers and Insurance Company:
For Government: the government-subsidized crop insurance system is acceptable for
farmers, but state budget deficit more and more restricts possibilities of subsidies payment to
farmers. The Government should be interested to initiate a revision of the principles of crop
insurance, which must be driven to: low-premium, wide-coverage and to plan guarantees in
the state budget for cases of huge, unpredictable natural disasters.
For farmers: Farmers' crop yields are particularly dependent on the weather conditions,
therefore the crop insurance has significant demand. For this purpose it is necessary and
appropriate Government support. Farmers must intensify the use of crop insurance in the face
of the Government and Insurance Companies' efforts to improve conditions for crop insurance.

24
For Insurance Company: The Insurance Company is controlling the risks by collecting
insufficient amount of premiums. The biggest problem is that the Insurance Company is faced
with the low rate of farmer’s participation. The systematic risks in high frequency partly come
from the poor agricultural infrastructure and unpredictable disasters. In future the Insurance
Company must decrease insurance premiums which will help to attract more farmers, as they
have a high potential: only 7% of insurable crops in Lithuania are insured now. The Insurance
Company needs to increase transparency in the calculations of extent of the damage and the
payments of insurance allowances, which will help to increase the confidence of the farmers for
crop insurance. In addition, the Insurance Company should pay more attention to climate
change trends in the future.
Conclusions
1. In Lithuania there are too much constraints in trying to select feasible crop insurance
scheme: lack of historical yield data, small sized farm holdings, low value crops and the
relatively high cost of insurance, farmers distrust of insurance system.
2. Insurance premiums for crop yield insurance in Lithuania are relatively high, as
Lithuania’s Insurance Company still does not have a so-called "history" that is, insurance
premiums in Lithuania are relatively high, because the Insurance Company still does not have
a so-called "history" that is, it have not accumulated enough statistical data that would allow
to what will enable to evaluate all the risks and determine the correct amounts of insurance
premiums. There is a high potential of crop insurance market: only 7% of insurable crops in
Lithuania are insured now. If Insurance Company would like to attract a greater number of
farmers it must decrease insurance premiums. The main principles of Insurance Company
must be driven to: „low-premium, wide-coverage“.
3. The Government must give guarantees in the state budget for cases of huge,
unpredictable natural disasters if it wants to encourage the farmers to insure their crops.
4. The Insurance Company must increase transparency of process on estimation of
insurance premiums and procedures of claim payments and be more focused on climate
change trends in the future. This will increase the confidence of the farmers for crop
insurance.
Bibliography
1. Balezentis, A., Balezentis, T. (2011). An Index Decomposition Analysis Model for
Identification of Strategic Changes: The Case of Cereal Harvest in Lithuanian Counties.
Research papers, Volume 4, Issue 28, pp. 38-52, ISSN: 1822-1760.
2. Bank of Lithuania: Insurance activity results. Retriewed:
http://www.lb.lt/n23395/14_ng_insurance premiums_payments_lt.html. Access: 18.11.2014.
3. Bielza, M. et.al. (2009). Experiences of Risk and Crises Management in the European Union.
Rev. Esp. Estud. Agrosoc. Pesq. Volume 221, Issue 1, pp. 127-150.
4. Coble, K., Knight, T., Goodwin, B., Miller, M., Rejesus, R. (2009). A Comprehensive Review
of the RMA APH and Combo Rating Methodology: Draft final Report. October.

25
5. European Commission, DG Agriculture own elaboration based on literature
http://ec.europa.eu/agriculture/publi/fact/climate_change/leaflet_en.pdf. Access: 17.11.2014.
6. Eurostat.(2010).Retrieved: http://ec.europa.eu/eurostat/estat-navtree-portlet-
rod/BulkDownloadListing.
7. Joseph, B., Gibson, C. and Gibson, R. (2010). Elsevier Agriculture and Agricultural Science
Procedia. Issue 1, pp. 136–145.
8. Radzevicius, G. (2007), Pasėlių draudimo sistemos tobulinimo kryptys [Directions of Crop
Insurance System Development] (in Lithuanian). University of Aleksandras Stulginskis. Vadyba
[Management]. Volume 4, Issue 11, pp. 125-142.
9. Rao, K. N. (2007). Weather based Crop Insurance: Panacea or Providence? Insurance
Regulatory & Development Authority (IRDA), IRDA Journal. Volume 6, Issue 1, pp. 20.
10. Ruihua, Y. et al. (2010). Evaluation on the Efficiency of Crop Insurance in China’s Major
Grain-Producing Area. Elsevier Agriculture and Agricultural Science Procedia. Issue 1, pp. 90–
99.
11. Stuoge, I. et al. (2012), Kaimo raidos kryptys žinių visuomenėje. Klimato kaitos įtaka
Lietuvos žemės ūkiui: iššūkiai, situacijos analizė ir prognozės [Rural Trends in the Knowledge
Society. Climate Change Impact to Lithuanian Agriculture: Challenges, Situation Analysis and
Forecasts] (in Lithuanian). Volume 2, Issue 4, pp. 43–55, ISSN: 2029-8846.

26
PRODUCTION COSTS OF FINNISH DAIRY FARMS IN THE 2000S
Alina Sinisalo1, Research scientist, M.Sc.
1 Natural Resources Institute Finland
Abstract. The development of production costs in dairy farms in 2000—2011 was studied
with a linear mixed model taking into account farm-level information (location, economic size,
number of cows) and time effect. The results indicate that the unit cost increased over time
and decreased as the number of cows and farm size increased and to compensate annual unit
cost increase farms should be expanded with two cows every year. Small farms had higher
unit cost and annual variation than medium-sized and large farms. Finnish dairy farms have
developed fast and the benefits of scale may not have yet been accomplished.
Key words: dairy farm, production, cost, panel data, Finland.
JEL code: D20, Q10, Q12
Introduction
Structural change may provide benefits through economies of scale and scope, i.e.
increasing farm size may reduce the production costs per unit of product as larger farms may
be able, for instance, to exploit more effective technologies and use labour more effectively, or
farms may increase the intensity of production through specialization (MacDonald et al., 2007;
Jaforullah and Whiteman, 1999). During the period 2000—2011 the number of dairy farms has
dropped by 54% (from 22913 to 10597 farms) but the number of cows only by 22% (from
364100 to 283600 cows), and when in 2000 one dairy farm had on average 15.9 cows by
2011 the average had raised to 26.9 cows (Tike, 2012). The European Union farm structure
survey results from 2005, 2007 and 2010 show that the structural change has been almost
similar to Finland in Sweden, the United Kingdom and Spain, and somewhat similar in
Hungary, Denmark and Norway (Eurostat, 2013).
Finland is divided into seven agriculture support areas (A, B, C1, C2, C2P, C3 and C4).
Support areas adapt to average growing season and the effective temperature sum (Tike,
2012; FMI, 2014). In northern Finland the growing season is shorter than in the southern
Finland. Therefore agricultural support increases from South to North (from area A to C4). The
majority of dairy farms (as per 2011) are located in C2 area (44% of all dairy farms) followed
Corresponding author. Tel.: +358 295326543.
E-mail address: [email protected].
Proceedings of the 2015 International Conference “ECONOMIC SCIENCE FOR RURAL DEVELOPMENT” No37
Jelgava, LLU ESAF, 23-24 April 2015, pp. 26-34

27
by C1 (21%), B (17%), C3 (8%), C2P (5%), A (4%) and C4 (1%) area. The farm numbers
diminished quite evenly across these areas from 2000 to 2011. A larger decrease (-58%) was
observed in the southernmost areas (A and B) than in the northern areas, for instance, C2
area (-48%). (Tike, 2012)
Price indices (2000–2011; OSF, 2014b) show that the prices of goods and services currently
consumed in agriculture (+47%) and goods and services contributing to agricultural
investments (+42%) have increased faster than the Consumer Price Index that is used to
measure general inflation rate (+21%) (OSF, 2014a). Among goods and services that are
targeted to animal and especially dairy production, only the price of veterinary expenses
(+18%) and compound feeds for calves (+12%) have risen less than the general inflation rate.
Prices for farm machinery and installations used in animal production have increased by 44%
and farm buildings by 41% from 2000 to 2011. The prices for energy and lubricants (+105%)
have increased substantially mainly due to crude oil prices (BP, 2013).
The production costs in Finnish dairy farms have been studied mostly based on data
covering only one year. Rantala (1997) and Talpila (1999) studied the unit costs of dairy farms
using the data obtained from the dairy survey farms in 1996 and 1996—1997, respectively.
Talpila (1999) found that smaller farms (<15 cows) had 15% higher unit production cost than
larger farms (15 or more cows) but did not observe significant differences between support
areas although there was a large (smaller farms: 0.98—1.11 Finnish mark/milk kg; larger
farms 0.95—1.06 FIM/kg) variation between areas in forage costs. Ovaska et. al (2004)
studied the production and economy of dairy farms by using International Farm Comparison
Network data from a few typical farms.
Production costs have been studied also by using different farm models (e.g. Ala-Mantila,
1998). The unit cost of milk production decreases as the farm size (number of cows) increases.
Increasing farm size affects most importantly the labour cost. The share of wages of total
production costs for the smallest farm model was 34% and for the largest farm model 26%.
The defect of farm models is the fact that in reality the conditions on farms may be quite much
different.
Ovaska and Heikkilä (2013) compared Finnish dairy farms in regards to the structural
development and competitiveness to Swedish, Danish, German, Dutch and Polish dairy farms.
By using International Farm Comparison farm data for years 2001–2011 they found that the
unit cost of milk produced was highest on typical Finnish (24 cows) farms, USD 89/100 kg ECM
(energy corrected milk) and on larger Finnish farms (70 cows) USD 78/100 kg ECM. They
found that the major cost disadvantages on Finnish farms were related to machinery, labour
and other miscellaneous costs. The disadvantage from labour cost decreased as farm size
increased.
The goal of this study is to assess how the unit production costs of dairy farms have
developed in 2000—2011 taking into account

28
farm-level information
o geographical location,
o economic size,
o number of dairy cows,
time effect by observing the same farms for several years.
This study contributes to previous knowledge by revealing changes in unit production costs
over time. The following section introduces data and methods applied. Further sections
represent results and conclusions.
Data and methods
The development of unit production costs of milk was studied by using the annual
accounting data from dairy farms taking part in MTT profitability bookkeeping for the years
2000—2011 and specialized in dairying (code 45 defined as per European Commission
regulation 1242/2008). The dataset was formed as panel allowing the possibility to effectively
study change over time. During the period 2000—2011 some farms exited from and some
joined in the voluntary profitability bookkeeping, and some farms exited the business. The
data included 4205 observations from 633 different farms and on average 350 different farms
every year in the data. The farm-level data were weighted with weight factors calculated
individually for each farm taking into account the type of operations, economic size and
location. Weights were calculated for each farm by stratum indicators separately for every year
and calibrated taking into account the total arable land in Finland. Thus, after weighting, the
used data can be used to describe the results of all Finnish dairy farms.
The unit costs were obtained by dividing the total production costs by the amount of
produced milk (cent per litre) meaning the studied unit costs were not particularly targeted to
milk production but also included other costs. Dairy farming is typically a combination of
dairying, livestock production and forage production. In the dataset, the share of milk and milk
products (SE216*) of total livestock and livestock products output (SE206†) was 91% on
average. The livestock total output includes milk and animal output. When supports were
included the share of milk output was on average 53% of the total output of a farm.
The farm size was described by using the number of cows and farm standard output. The
number of cows is a convenient explanatory variable since it is clear and easily understandable
and the explained variable (unit cost) includes the quantity of milk output as denominator. The
standard output (SO) is the average monetary value of the agricultural output at farm-gate
price per head of livestock. There is a regional standard output coefficient for each product.
The sum of all standard outputs per unit multiplied by headcount forms the overall economic
size, expressed in euro (Eurostat, 2014). The SO was classified into three classes. The smallest
* Cows’ milk & milk products – See definition from “Definitions of Variables used in FADN standard results” by European
Commission † Total output livestock & livestock products – See definition from “Definitions of Variables used in FADN standard results” by
European Commission

29
class was selected (SO less than EUR 50000) as a basis for testing so that the medium class
(SO EUR 50000—100000) and the largest class (SO more than EUR 100000) were compared
to the smallest class. Since there were fewer farms in the northern area, support areas of C2P,
C3 and C4 were combined and this combination (C2P—C4) was used as a basis for testing
against other areas (A, B, C1 and C2). Pair-wise testing was conducted to observe significant
differences between economic size classes and areas.
The linear mixed model was defined for an individual farm i as followed
(1)
in which yi is ith farm’s ni1 response vector, a denotes a p1 vector of unknown population
parameters and Xi denotes a known nip design matrix linking a to yi. The bi are distributed as
N(0,D) (normal with mean 0 and covariance matrix D), independently of each other and of the
ei that is distributed as N(0,Ri). The D is a kk and Ri is an nini positive-definite covariance
matrix. Parameters a are treated as fixed effects and bi and ei as random effects. In the data
the ni varied between 1 to 12.
Five fixed effects, denoted as p, (intercept a0, time a1, number of cows a2, standard output
class a3, support area a4 and weight a5) and two random effects, denoted as k, (intercept b0
and time b1) were included in the model. Standard output is partially endogenous variable in
the model since the number of cows influences its variation. Other explanatory variables in the
model are exogenous. The cow variable denotes the average number of cows of a farm during
the year. Intercept was included as a fixed effect since in practice all production units require a
level of fixed costs independent of production levels. Variable time was reset by distracting
value 2000 (year 2000=0, year 2001=1 etc.). Hence, variables time and cow had a similar
scale.
For random effects an unstructured (UN) covariance structure that is suitable for
longitudinal data was selected. Random effects were defined over the observation unit i, that
is, farm register number. For residual random effects a first-order autoregressive (AR1)
covariance structure was selected since it is suitable for data containing sequential
observations and correlations that decline exponentially with distance (in our case time).
The UN covariance matrix for the random effects is denoted
D var(bi) b0
2 b0b1
b0b1b1
2
(2)
and has three parameters b0 variance denoted as UN(1,1), b0 and b1 covariance as UN(2,1)
and b1 variance as UN(2,2). The AR1 covariance matrix for residual is denoted
y i Xia Z ibi e i
bi ~ N(0,D)
e i ~ N(0,Ri)
b1,...,bn ,1,...,n independent

30
Ri var(e i)
2 2 L 2n i 1
2 2 L 2n i 2
M M O M
2n i 1 2n i 2 L 2
(3)
and has two parameters variance 2 and correlation . When N (total number of different
farms) vectors are stacked, equation (1) can be represented as
y Xa Zb e
b ~ N(0,G)
e ~ N(0,R)
cov b,e 0
(4)
Model parameters are in the fixed effect vector a and all unknown variables in covariance
matrices G and R. Matrices X and Z contain explanatory variables. Vector b contains only
random effect variables. The model was solved and analyzed by using IBM SPSS 22.0
statistical software.
Results and discussion
The mean unit production cost in the dataset in 2000—2011 was 108.1 c/l (S.D. 39.1 c/l).
From 2000 to 2011 this figure had reduced by 7%. Small farms (standard output <
EUR 50000) had greater unit costs than medium-sized farms (EUR 50000—100000) and large
farms (> EUR 100000). Unit costs in these classes have remained quite stable from 2000 to
2011. The mean unit cost of small farms was 135.5 c/l (S.D. 52.6 c/l), of medium sized farms
103.1 c/l (S.D. 28.1 c/l) and of large farms 86.1 c/l (S.D. 20.4 c/l). The annual variation of
costs was larger at small farms than at medium-sized or large farms.
Descriptive statistics did not reveal clear differences in unit costs between support areas.
Annual variation was large. In 2000—2011 the mean unit cost in area A was 98.5 c/l (S.D.
27.9 c/l), in area B 116.5 c/l (S.D. 47.3 c/l), in area C1 109.9 c/l (S.D. 45.9 c/l), in area C2
104.0 c/l (S.D. 32.9 c/l) and in area C2P—C4 110.4 c/l (S. D. 31.5 c/l).
During the study period the production costs and farm size had developed (increased
proportionally) the same way. The rise of input prices has also been more than inflation rate.
However, the shares of different types of costs have remained quite stable, apart from the
share of wages that had decreased by approximately one-fourth. A previous study from the
1990s shows a similar trend (Ala-Mantila, 1998).
The estimation results of linear mixed model are presented in Table 1. The most important
explanatory variables were time (1.472, p<0.001), the number of cows (-0.710, p<0.001) and
standard output class. The smallest farms differ significantly (p<0.001) from other size classes
so that the smallest farms have higher unit cost. Pair-wise comparison between the medium-
sized and the large farms did not show significant difference. The farm location by support
areas explains the unit cost only slightly so that only area B differs significantly from northern

31
areas (7.385, p<0.05). Pair-wise comparison shows that B area has higher unit cost than area
C (B vs. C1 p=0.015, B vs. C2 p=0.002, B vs. C2P—C4 p=0.042). Areas A and B did not differ
significantly from each other.
The results indicate strong year-to-year correlation in unit costs (AR1 =0.493, p<0.001).
Unit costs changed at different pace between farms (2b1 p=0.021). Time effect (1.472) is
more than double compared to the number of cows (-0.710). This can be interpreted so that
herd size should be increased by two cows every year to compensate time effect increase of
the unit cost.
Table 1
The results of linear mixed model explaining the unit cost of milk
Effect Estimate S.E. Sig. CI95 low CI95 high
Intercept a0 135.303 3.120 <0.001 129.182 141.423
time a1 1.472 0.176 <0.001 1.125 1.818
cow a2 -0.710 0.045 <0.001 -0.797 -0.622
Standard output a3
medium (EUR 50000-100000) -20.025 1.869 <0.001 -23.689 -16.361
large (>EUR 100000) -22.253 2.390 <0.001 -26.938 -17.567
small (EUR 0-50000) 0 0
Support area a4
A -1.506 4.879 0.758 -11.089 8.077
B 7.385 3.623 0.042 0.268 14.503
C1 -0.921 3.195 0.773 -7.195 5.354
C2 -2.513 2.903 0.387 -8.215 3.189
C2P-C4 0 0
weight a5 -0.011 0.013 0.390 -0.036 0.014
Covariance parameters
UN (1,1) 2b0 342.126 57.962 <0.001 245.459 476.864
UN (2,1) b0b1 5.231 6.890 0.448 -8.274 18.735
UN (2,2) 2b1 2.774 1.205 0.021 1.184 6.499
Residual
AR1 diagonal 2 435.630 27.519 <0.001 384.898 493.048
AR1 rho 0.493 0.032 <0.001 0.428 0.554
Observations 4205
-2 Restricted Log Likelihood 37439
Akaike's Information
Criterion (AIC) 37449
Schwarz's Bayesian
Criterion (BIC) 37481
S.E. = standard error
Sig. = significance CI95 low = 95% confidence interval lower bound CI95 high = 95% confidence interval upper bound UN = unstructured covariance matrix AR1 = first-order autoregressive residual covariance matrix
Source: author’s calculations.
In this study, the dataset did not allow to separate costs targeted to milk production from
other costs of dairy farms. Hence, rather than the unit cost representing specifically milk
production, it represents the joint production of milk and other products as it includes also
costs from other activities. It may seem arbitrary, but this approach allows us to capture the

32
effect of farm size and ‘unit’ production costs as single variables. Although the data were from
specialized full-time dairy farms, there were no farms producing only milk. Usually dairy farms
produce also some other agricultural goods, of which beef is usually the most important
product. In this data 53% of total output including support came from cows’ milk and milk
products on average and farms, therefore, had dairying as their main production line. Standard
output was not included as a continuous explanatory variable in the model since it correlated
strongly (Spearman two-tailed correlation 0.979, p<0.01) with the amount of cows. Therefore,
it was included as ordinal-scale explanatory variable by dividing the data into three classes. An
alternative way to handle the overall farm size as an explanatory variable would have been to
include the number of other resources such as arable land and the number of beef cattle as
explanatory variables. Since arable land correlated strongly with the amount of cows (0.762,
p<0.01) it was not included into the final model. According to the results the medium sized
and the large farms did not show significant difference in the unit production costs. This may
be due to the fact that the farm size has grown rapidly over the past few years in Finland and
the large farms are not yet operating at optimal production levels.
The estimated linear mixed model worked well. Fitted values followed well the measured
values (difference on average 2.0%, minimum 0.1%, maximum 5.6%). The difference
between measured and fitted values falls between the standard errors. Descriptive statistics
show that unit costs have remained quite stable from 2000 to 2011. According to the model
the unit cost has annually increased on average 1.472 c/l, however, the pace has varied
significantly between farms. The increased number of cows and greater standard output both
decrease the unit cost. Previous studies show similar results (Ala-Mantila, 1998; Riepponen,
1998, 2003; Latukka 2013, Ovaska & Heikkilä 2013). Latukka (2013) studied the costs
targeted to milk production line in 2011. He found out that small farms (10 cows) had the
highest unit cost (119 c/l) that decreased by increasing the number of cows. In the same
study medium-sized farms (39 cows) had the unit cost of 76 c/l and large farms (141 cows) of
69 c/l. In this study significant differences between areas were not found, which is in line with
results reported by Latukka (2013).
Further studies could examine the unit costs of milk production only. In explanatory models
external influential factors such as input and output prices, farmland prices and different
interaction effects could also be studied. Furthermore, the effect of different weighting
methods should be tested. Weighting in linear mixed models is a challenge because of
assumptions and because the interpretation of standard error is more complex (Bertolet,
2008). Weights were included in the model as a continuous fixed effect. The results showed
that weight effect was not significant, which means that results can be generalized to the total
population, the specialized Finnish dairy farms.

33
Conclusions
The cost per produced milk litre has remained stable in the 2000s. The smallest farms have
the highest unit costs compared to medium sized and large farms. By increasing the number of
cows, economies of scale can be achieved. A significant difference between medium-sized and
large farms was not found, possibly due to the fact that the structural development in Finnish
farms has been fast and the benefits of scale have not yet been accomplished on the largest
farms. The geographical location of farm cannot be seen as important explanatory variable for
the development of unit costs. The development of production costs has varied significantly
between farms. To simplify further analysis, weighting can possibly be left out if dataset used
is large enough and carefully classified.
Bibliography
1. Ala-Mantila, O. (1998). The Production Costs of Agricultural Products According to Farm
Models [In Finnish with English abstract]. In: Research reports 222. Agricultural Economics
Research Institute, Helsinki.
2. Bertolet, M. (2008). To Weight or Not to Weight? Incorporating Sampling Designs into
Model-based Analyses. Carnegie Mellon University, Pittsburgh.
3. BP. 2013. BP Statistical Review of World Energy 2013. Retrieved:
http://www.bp.com/statisticalreview. Access 22.01.2014.
4. European Commission. (2008). Commission Regulation (EC) No 1242/2008 of 8 December
2008 Establishing a Community Typology for Agricultural Holdings. Official Journal of the
European Union, 13.12.2008: 335/3-24. Retrieved: http://eur-
lex.europa.eu/LexUriServ/LexUriServ.do?uri=OJ:L:2008:335:0003:0024:EN:PDF. Access:
22.01.2014.
5. Eurostat. (2013). Livestock: Number of Farms and Heads of Animal by Type of Farming.
Retrieved:
http://epp.eurostat.ec.europa.eu/portal/page/portal/agriculture/farm_structure/database.
Access: 21.02.2014.
6. Eurostat. (2014). Statistics Explained (2014/2/0). Glossary: Standard output (SO).
Retrieved:
http://epp.eurostat.ec.europa.eu/statistics_explained/index.php/Glossary:Standard_output
(SO). Access: 10.12.2013.
7. Finnish Meteorological Institute FMI. (2014). Terminen kasvukausi [In Finnish: Thermal
growing season.]. Retrieved: http://ilmatieteenlaitos.fi/terminen-kasvukausi. Access:
25.01.2014.
8. Jaforullah, M., Whiteman, J. (1999). Scale Efficiency in the New Zealand Dairy Industry: a
Non-parametric Approach. Australian Journal of Agricultural and Resource Economics,
volume 43, issue 4, pp. 523-541.
9. Latukka, A. (2013). Mitä maitolitran tuottaminen maksaa? Kustannusrakenteen tuntemus
auttaa kehittämään kannattavuutta [In Finnish: How Much Does it Cost to Produce a Milk
Litre? Knowledge on Cost Structure Helps Developing Profitability.]. Maito ja Me, issue
3/2013, pp. 50-51.
10. MacDonald, J., O’Donoghue, E., McBride, W., Nehring, R., Sandretto, C., Mosheim, R.
(2007). Profits, Costs, and the Changing Structure of Dairy Farming. Economic Research
Report 47. United States Department of Agriculture. Retrieved:
http://www.ers.usda.gov/publications/err-economic-research-report/err47. Access:
21.02.2014.

34
11. Official Statistics of Finland (OSF). (2014a). Consumer Price Index. Retrieved:
http://www.stat.fi/til/khi/index_en.html. Access: 22.01.2014.
12. Official Statistics of Finland (OSF). (2014b). Index of Purchase Prices of the Means of
Agricultural Production. Retrieved: http://www.stat.fi/til/ttohi/index_en.html. Access:
22.01.2014.
13. Ovaska, S., Sipiläinen, T., Ryhänen, M. (2004). Finnish IFCN-dairy farms. Review of Year
2003 results [In Finnish]. MTT Selvityksiä 74. MTT Agrifood Research Finland, Helsinki.
http://urn.fi/URN:ISBN:951-729-901-X.
14. Ovaska, S., Heikkilä, A-M. (2013). Structural Change and Competitiveness of Finnish Dairy
Farms [In Finnish]. MTT Raportti 126. MTT Agrifood Research Finland, Jokioinen.
http://urn.fi/URN:ISBN:978-952-487-502-8.
15. Rantala, J. (1997). Costs of Dairy Production. Reports and Discussion papers 151. Pellervo
Economic Research Institute, Helsinki.
16. Riepponen, L. (1998). Production Costs of Milk, Cereals and Pig Meat on Bookkeeping
Farms [In Finnish with English abstract]. In: Research reports 222. Agricultural Economics
Research Institute, Helsinki.
17. Riepponen, L. (2003). Production Costs of Milk and Cereals on Finnish Bookkeeping Farms
in 1998—2000 [In Finnish with English abstract]. Maa- ja elintarviketalous 19. MTT
Agrifood Research Finland, Helsinki. http://urn.fi/URN:ISBN:951-729-736-x.
18. Sumner, D. A., Wolf, C. A. (2002). Diversification, Vertical Integration, and the Regional
Pattern of Dairy Farm Size. Review of Agricultural Economics, volume 24, pp. 442-457.
19. Talpila, S-J. (1999). Costs of Milk Production in Dairy Survey Farms in 1997 [In Finnish].
Working papers 22. Pellervo Economic Research Institute, Helsinki. http://ptt.fi/wp-
content/uploads/2013/04/tp22_10080610.pdf.
20. Tike. (2012). Yearbook of Farm Statistics 2012. Information Centre of the Ministry of
Agriculture and Forestry, Helsinki.
http://www.maataloustilastot.fi/sites/default/files/vuosikirja_2012_0.pdf.

35
THE IMPACT OF TIME SERIES EXPANSION IN NONPARAMETRIC
ANALYSES OF EFFICIENCY EFFECTS
Tomas Balezentis, Dr
Lithuanian Institute of Agrarian Economics
Abstract. Efficiency analyses often involve panel data which enable to reveal certain
longitudinal patterns. However, it is often impossible to maintain the same sample structure
when expanding time series. This paper, thus, attempts to test whether there are obvious
differences in the trends of efficiency across two different data sets. The research focuses on
Lithuanian family farm performance. The data are taken form Farm Accountancy Data Network
with different samples covering the periods of 2004-2009 and 2004-2011. The juxtaposition of
two-stage efficiency analyses based on different data sets enabled to identify the impact of
changes in both the structure of the sample and time series expansion upon the efficiency
factors and effects. The analysis suggests that Lithuanian family farms featured generally the
same patterns of efficiency during 2004-2011 if opposed to 2004-2009.
Key words: data envelopment analysis, efficiency, family farms, Lithuania.
JEL code: C14, C34, C44, D24, Q12.
Introduction
Efficiency and productivity gains are the most important factors behind a sustainable
economic growth. Indeed, gains in efficiency enable to allocate the resources in a more
rational way across the economy. Therefore, it is important to develop reasonable frameworks
for analysis of efficiency and productivity. As regards the agricultural sector, it is due to Gorton
and Davidova (2004) and Balezentis (2014b) that the frontier methods are the most widely
applied ones for the efficiency analyses. Efficiency analysis requires estimation of the
productive technology, which can be described in terms of the production function, distance
function, cost function, or revenue function, among others. The two wide groups of the frontier
methods can be delineated as regards specification of the representation of the productive
technology, viz., parametric methods and non-parametric methods (Coelli et al., 2005). The
parametric methods require a priori specification of the functional form of the representation,
whereas the non-parametric methods do not require suchlike assumptions. These
Corresponding author. Tel.: + 370 5 262 10 78; fax: + 370 5 261 45 24
E-mail address: [email protected]
Proceedings of the 2015 International Conference “ECONOMIC SCIENCE FOR RURAL DEVELOPMENT” No37
Jelgava, LLU ESAF, 23-24 April 2015, pp. 35-44

36
circumstances make the non-parametric methods quite appealing ones if opposed to the
parametric ones. Yet, the non-parametric methods do not allow for analysis of efficiency
effects. On the contrary, parametric methods, like Stochastic Frontier Analysis (SFA), proposed
by Meeusen and van den Broeck (1977) and Aigner et al. (1977), can accommodate the
efficiency effects (Kumbhakar et al., 1991; Battese, Coelli, 1995). Data Envelopment Analysis
(DEA), introduced by Charnes et al. (1978) and Banker et al. (1984), does not allow for
inclusion of the efficiency effects into the model. Therefore, two-stage analysis is conducted to
estimate the impact of certain factors upon the DEA-based efficiency scores. Initially, such
techniques as the Ordinary Least Squares and Tobit model were used for suchlike analyses. It
is due to Simar and Wilson (2007) that the aforementioned setting might render misleading
results due to the underlying serial correlation among the observations. Accordingly, the
double bootstrap methodology has been proposed to overcome these issues. Indeed, the
double bootstrap methodology can be considered as semi-parametric one, as the second stage
analysis relies on the truncated regression model. Daraio and Simar (2005, 2007a, 2007b)
introduced the conditional measures of efficiency. The latter framework allows for a fully non-
parametric analysis of the efficiency factors. The proposed model assumes no separability
among environmental variables and the shape of the underlying technology set. Fousekis et al.
(2014) employed the said framework in the agricultural context. Balezentis et al. (2014)
suggested a fully non-parametric framework for analysis of the efficiency effects assuming
separability. In the latter case, no conditional measures are involved.
Analyses of the agricultural efficiency do often rely on the data from Farm Accountancy Data
Network (FADN) or other statistical data bases. Accordingly, the data are not easily and readily
available for the research. On the contrary, multiple aspects of the efficiency should be
analysed by employing the same datasets in order to avoid additional sampling bias.
Therefore, one often needs to check whether one data set features the same underlying trends
as opposed to those associated with another data set.
The aim of the research is to propose a procedure for testing whether there are obvious
differences in the trends of efficiency across two different data sets. The following tasks are
set: 1) to present the preliminaries of frontier-based efficiency analysis; 2) to present the data
available for analysis of Lithuanian family farm performance; 3) to analyse the impact of time
series expansion on the results of efficiency analysis. This paper employs the approach
proposed by Balezentis et al. (2014) to analyse the differences in efficiency effects due to
expansion of the time span of the analysis. Particularly, the paper focuses on the two datasets,
each covering the periods of 2004-2009 and 2004-2011. These data are taken form Farm
Accountancy Data Network (Lithuanian Institute of Agrarian Economics, 2012). In addition, the
results are compared with those obtained via the double bootstrap methodology.

37
Methodological approach
The fully non-parametric framework proposed by Balezentis et al. (2014) relies on bootstrapped
DEA and non-parametric regression. The bootstrapped DEA is described by Simar and Wilson
(1998) and implemented by Wilson (2008). The obtained efficiency scores are then used as
dependent variables in the non-parametric regression (Racine, Li, 2004; Li, Racine, 2007) as it is
implemented by Hayfield and Racine (2008). In its essence, the non-parametric regression weights
the residuals at each observation with respect to its distances to other observations as defined by
the kernel function when optimising the sum of squared residuals. The proposed framework uses
partial regression plots to depict the relationships among the efficiency factors and efficiency scores.
As regards the double bootstrap methodology, the present research follows Algorithm #2 in
Simar and Wilson (2007). The latter technique comprises the two parts. First, the bootstrap
technical efficiency scores are estimated in order to approximate the true underlying technology
with respect to the environmental variables. Second, the bootstrap coefficients of the truncated
regression are estimated to establish the corresponding confidence intervals.
In order to maintain comparability with the previous results, the input-oriented model was
employed for methodology proposed by Balezentis et al. (2014), whereas the output-oriented
model was applied for the double bootstrap (Simar, Wilson, 2007).
Research results and discussion
Balezentis et al. (2014) and Balezentis (2014a) employed the FADN data set for years 2004-
2009. The aforementioned dataset is a balanced panel comprising 200 observations (viz., family
farms) per year. Indeed, the end of the said period coincides with economic turmoil. This paper,
thus, attempts to check the consistency of the obtained results by fitting models used in the
aforementioned research to the extended data set.
In order to proceed with the comparison, the additional dataset was extracted from the FADN.
The new dataset covers the period of 2004-2011. Given the FADN farm sample changes year to
year, the expansion of time span renders a decrease in the number of farms observed for each year
to 163. The extended dataset, thus, is a balanced panel comprising 1304 observations in total. The
third dataset has also been established for the same 163 farms, yet covering the initial time span.
To sum up, the following three samples were considered: 1) years 2004-2009, 200 farms; 2)
years 2004-2011, 163 farms; 3) years 2004-2009, 163 farms. Samples 1 and 3 share the same
time period albeit they cover different farms, hence, they can be employed to test for differences in
efficiency effects due to changes in the sample structure. Samples 2 and 3 share the same sample
structure yet cover different time spans, thus, they can be used to test for differences in efficiency
effects arising due to temporal developments (possibly, those occurring in the whole family farming
sector).
The technical efficiency was estimated by considering four inputs, namely utilised agricultural
land area in hectares, labour input in annual work units, intermediate consumption in Litas, and
assets in Litas, and one output, viz., total agricultural output in Litas. The monetary variables were

38
deflated by respective real price indices. Various explanatory variables were chosen for the analysis,
yet only significant ones were finally kept in lines of the backward procedure.
Results of the non-parametric regression are presented in Figure 1. As one can note, results
based on the dataset for 2004-2011 and 163 farms virtually re-iterate those obtained by
considering the original data set for 2004-2009 and 200 farms (Balezentis et al., 2014). Specifically,
technical efficiency appeared to increase with increasing farm size, yet a kink in the partial
regression plot was observed at the (logged) value of 400 ha. The time trend showed decreases in
technical efficiency during 2006 and 2009. The only evident difference between the original and
extended datasets is an increase in crop farm efficiency. Anyway, livestock farming appear to be
the most efficient on average. These differences might have been caused by both changes in
relative performance and sample structure. Therefore, the third sample was further considered.
Source: author’s calculations based on Lithuanian Institute of Agrarian Economics (2012).
Fig. 1. Partial regression plots (2004-2011, 163 farms, the dependent variable is
Farrell input efficiency)
The following Table 1 presents the bandwidths and p-values. Obviously, all the variables were
statistically significant at 1%.

39
Table 1
Results of non-parametric regression analysis (2004-2011, 163 farms)
log(UAA) CropShare ordered(Year)
Bandwidth 1.447169 0.1780017 0.04444178
P Value <.000 *** <.000 *** <.000 ***
Significance codes: *** – 0.001, ** – 0.01, and * – 0.05.
Source: author’s calculations based on Lithuanian Institute of Agrarian Economics (2012).
The double bootstrap analysis was also re-iterated with the extended data set. The resulting
truncated regression’s coefficients are given in Table 2. The new results can be compared against
those in Balezentis (2014). Note that more variables entered the model under the backward
procedure. These include time trend (Trend) to check if there is an underlying general trend
describing the change in efficiency, utilised agricultural area (UAA) to account for farm size, the
ratio of assets to the labour input (Assets/AWU) to measure the level of capital accumulation and
modernisation (to a certain extent), the ratio of subsidies over the total output (Subsidies) to
measure the impact of production subsidies on the farm performance. Note that the confidence
intervals were defined for the three levels of confidence by the means of bias-corrected accelerated
and percentiles methods.
Table 2
Double bootstrap estimates for determinants of the farming inefficiency (2004-2011,
163 farms)
Variables ˆ̂
Sig. Confidence intervals
.1
.05
.01
aBC method
Time 0.175 *** 0.114 0.240 0.103 0.256 0.082 0.280
UAA -0.073 -0.240 0.095 -0.278 0.122 -0.331 0.177
Assets/AWU -0.167 * -0.361 -0.007 -0.397 0.024 -0.506 0.078
Crop 0.714 *** 0.321 1.051 0.249 1.113 0.068 1.225
Subsidies 1.520 *** 1.394 1.649 1.372 1.678 1.331 1.730
Percentiles method
Time 0.175 *** 0.111 0.237 0.100 0.251 0.076 0.276
UAA -0.073 -0.242 0.094 -0.278 0.119 -0.331 0.176
Assets/AWU -0.167 -0.347 0.006 -0.381 0.032 -0.483 0.091
Crop 0.714 *** 0.339 1.066 0.274 1.134 0.086 1.236
Subsidies 1.520 *** 1.392 1.646 1.370 1.676 1.322 1.721
Significance codes: ‘***’ - 0.01, ‘**’ - 0.05, ‘*’ - 0.1; the dependent variable is Farrell output efficiency
Source: author’s calculations based on Lithuanian Institute of Agrarian Economics (2012).

40
Results obtained for the extended data set do not contradict to those based on the original data
set presented by Balezentis (2014). The only significant difference is a change in the direction of the
time trend: the extended data set suggests a negative time trend. However, this can be a direct
outcome of expansion of timespan. Farm size features a positive effect upon efficiency, yet the
associated coefficient is no longer significant. The asset-labour ratio is also specific with the same
direction of the relationship. However, it is insignificant according to the percentiles method. The
remaining two variables, viz. crop share in the total output and production subsidy intensity,
featured the same kind of relationships with the efficiency. These findings are also supported by
results of the fully non-parametric framework (cf. Figure 1).
As it was already said, certain differences emerged between results presented by Balezentis
(2014) and Balezentis et al. (2014) might be due to changes in the structure of the sample under
analysis. Therefore, the new sample is reduced by considering only the period of 2004-2009 and
keeping the same 163 farms in the sample. The resulting estimates of the coefficients of the non-
parametric regression are depicted in Figure 2.
Source: author’s calculations based on Lithuanian Institute of Agrarian Economics (2012).
Fig. 2. Partial regression plots (2004-2009, 163 farms, the dependent variable is
Farrell input efficiency)

41
Table 3 presents the p-values associated with the regressors. Evidently, all the three
variables were significant.
Table 3
Results of non-parametric regression analysis (2004-2011, 163 farms)
log(UAA) CropShare ordered(Year)
Bandwidth 0.6636057 0.1894315 0.05482321
P Value <.000 *** <.000 *** <.000 ***
Significance codes: *** – 0.001, ** – 0.01, and * – 0.05.
Source: author’s calculations based on Lithuanian Institute of Agrarian Economics (2012).
The results of double bootstrap model for the 163 farms during 2004-2009 are presented in
Table 4. If compared to results for the same period based on the larger data set for the 200 farms,
it is evident that the change in the sample structure played an important role. Therefore, the impact
of farm size (UAA) and assets per AWU became insignificant. Crop output’s share in the total output
had a negative effect upon efficiency, yet the latter factor remained insignificant at the level of
significance of 10% under one of the methods for estimation of the confidence intervals (anyway,
the lower bound of the confidence interval suggests that p-value might not be far from 0.1).
Table 4
Double bootstrap estimates for determinants of the farming inefficiency (2004-2009,
163 farms)
Variables ˆ̂
Sig. Confidence intervals
.1
.05
.01
aBC method
Time 0.345 *** 0.250 0.452 0.226 0.470 0.189 0.512
UAA -0.020 -0.219 0.179 -0.253 0.215 -0.328 0.283
Assets/AWU -0.135
-0.353 0.042 -0.404 0.066 -0.476 0.123
Crop 0.493
-0.026 0.871 -0.110 0.953 -0.324 1.101
Subsidies 1.347 *** 1.215 1.481 1.195 1.505 1.148 1.556
Percentiles method
Time 0.345 *** 0.245 0.451 0.224 0.468 0.184 0.509
UAA -0.020 -0.232 0.169 -0.270 0.207 -0.339 0.279
Assets/AWU -0.135 -0.341 0.051 -0.391 0.075 -0.472 0.138
Crop 0.493 * 0.074 0.932 -0.050 0.988 -0.231 1.161
Subsidies 1.347 *** 1.210 1.478 1.192 1.502 1.145 1.555
Significance codes: ‘***’ - 0.01, ‘**’ - 0.05, ‘*’ - 0.1; the dependent variable is Farrell output efficiency
Source: author’s calculations based on Lithuanian Institute of Agrarian Economics (2012).
Results based on the sample of 163 farms and the time period of 2004-2009 did indicate that
the change in structure of the sample (while keeping the time period fixed) induced null effects of

42
farm size in terms of UAA and the ratio of assets to labour input. However, the latter variable
became significant at the confidence level of 10% after time series expansion. Obviously, time
series expansion resulted in decrease in the coefficient associated with the time trend, thus,
implying a positive development of family farms’ efficiency during 2010-2011. These results are
also confirmed by a fully non-parametric framework (cf. Figures 1 and 2). Even though the farm
size variable (UAA) remained insignificant after time series expansion, the coefficient as well as its
upper confidence band decreased, thus, implying that larger farms gained more productivity if
compared to smaller ones. Nevertheless, the coefficient remained insignificant at the confidence
level of 10%. The negative impact of production subsidies persisted and even increased during the
period of 2010-2011.
In order to obtain more precise estimates of the p-values in the fully non-parametric framework,
Daraio and Simar (2014) introduced an improved bootstrapping methodology. In addition, the test
proposed by Daraio et al. (2010) might be utilised to check whether the condition of separability
holds for the analysed data. Finally, Badin et al. (2012) argued that the conditional framework
enables to estimate “pure” and managerial efficiency.
Conclusions
1. The juxtaposition of two-stage efficiency analyses based on different data sets enabled
to identify the impact of changes in both the structure of the sample and time series
expansion upon the efficiency factors and effects. The analysis suggests that Lithuanian
family farms featured generally the same patterns of efficiency during 2004-2011 if
opposed to 2004-2009.
2. Crop farms became more efficient during 2010-2011 as opposed to 2004-2009. The
carried out analysis also revealed that a part of the latter increase was due to changes
in the structure of the analysed sample. Indeed, this finding is in line with the
undergoing changes in Lithuanian family farms, where more and more farmers opt for
crop farming. Anyway, it was livestock farms that maintained the highest efficiency.
3. The negative impact of production subsidies persisted and even increased during the period
of 2010-2011. Farm size effect became insignificant in the double bootstrap setting due to
changes in the sample structure, yet certain changes were observed after time series
expansion.
4. For sake of comparison, the present research utilised models with exactly the same
variables as it was the case with the original data set. Therefore, further analyses should
attempt to apply the methodologies proposed in this paper with the extended data set in
order to reveal a possible impact of inclusion of additional variables into analysis.
5. As regards the non-parametric analysis of the efficiency effects, further researches
should attempt to test the condition of separability, analyse managerial efficiency in the
conditional settings, and perform the improved tests of significance of the efficiency
factors.
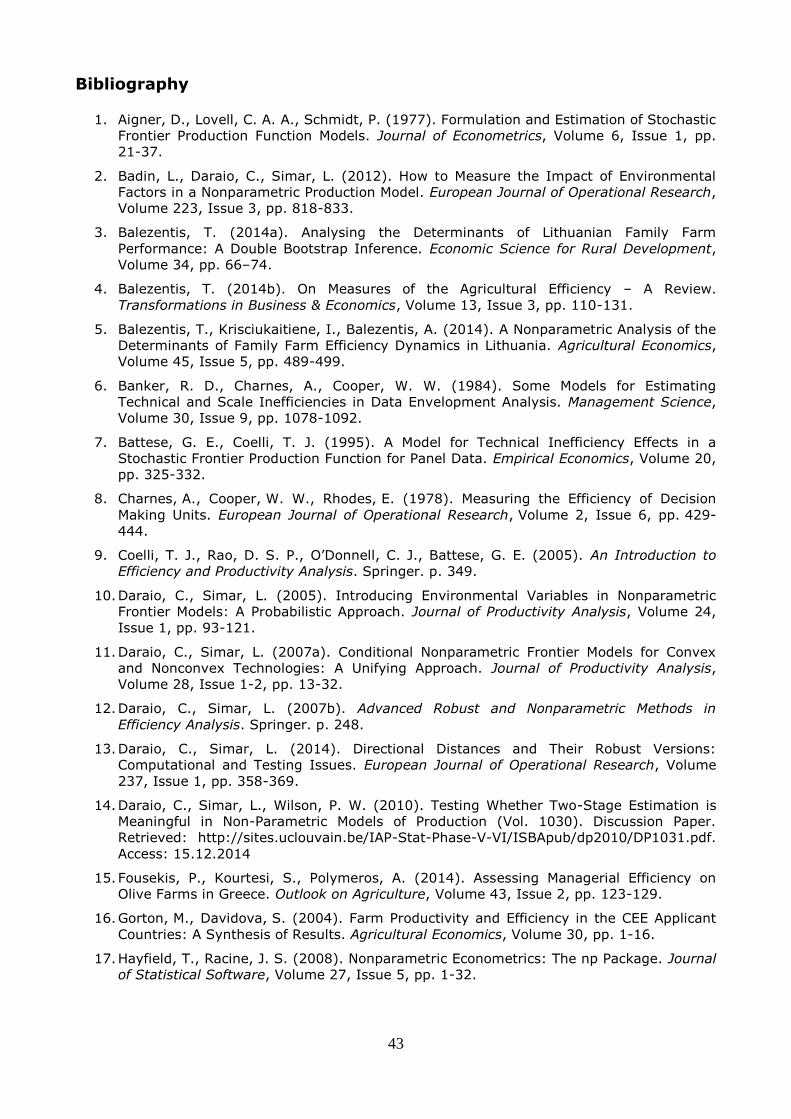
43
Bibliography
1. Aigner, D., Lovell, C. A. A., Schmidt, P. (1977). Formulation and Estimation of Stochastic
Frontier Production Function Models. Journal of Econometrics, Volume 6, Issue 1, pp.
21-37.
2. Badin, L., Daraio, C., Simar, L. (2012). How to Measure the Impact of Environmental
Factors in a Nonparametric Production Model. European Journal of Operational Research,
Volume 223, Issue 3, pp. 818-833.
3. Balezentis, T. (2014a). Analysing the Determinants of Lithuanian Family Farm
Performance: A Double Bootstrap Inference. Economic Science for Rural Development,
Volume 34, pp. 66–74.
4. Balezentis, T. (2014b). On Measures of the Agricultural Efficiency – A Review.
Transformations in Business & Economics, Volume 13, Issue 3, pp. 110-131.
5. Balezentis, T., Krisciukaitiene, I., Balezentis, A. (2014). A Nonparametric Analysis of the
Determinants of Family Farm Efficiency Dynamics in Lithuania. Agricultural Economics,
Volume 45, Issue 5, pp. 489-499.
6. Banker, R. D., Charnes, A., Cooper, W. W. (1984). Some Models for Estimating
Technical and Scale Inefficiencies in Data Envelopment Analysis. Management Science,
Volume 30, Issue 9, pp. 1078-1092.
7. Battese, G. E., Coelli, T. J. (1995). A Model for Technical Inefficiency Effects in a
Stochastic Frontier Production Function for Panel Data. Empirical Economics, Volume 20,
pp. 325-332.
8. Charnes, A., Cooper, W. W., Rhodes, E. (1978). Measuring the Efficiency of Decision
Making Units. European Journal of Operational Research, Volume 2, Issue 6, pp. 429-
444.
9. Coelli, T. J., Rao, D. S. P., O’Donnell, C. J., Battese, G. E. (2005). An Introduction to
Efficiency and Productivity Analysis. Springer. p. 349.
10. Daraio, C., Simar, L. (2005). Introducing Environmental Variables in Nonparametric
Frontier Models: A Probabilistic Approach. Journal of Productivity Analysis, Volume 24,
Issue 1, pp. 93-121.
11. Daraio, C., Simar, L. (2007a). Conditional Nonparametric Frontier Models for Convex
and Nonconvex Technologies: A Unifying Approach. Journal of Productivity Analysis,
Volume 28, Issue 1-2, pp. 13-32.
12. Daraio, C., Simar, L. (2007b). Advanced Robust and Nonparametric Methods in
Efficiency Analysis. Springer. p. 248.
13. Daraio, C., Simar, L. (2014). Directional Distances and Their Robust Versions:
Computational and Testing Issues. European Journal of Operational Research, Volume
237, Issue 1, pp. 358-369.
14. Daraio, C., Simar, L., Wilson, P. W. (2010). Testing Whether Two-Stage Estimation is
Meaningful in Non-Parametric Models of Production (Vol. 1030). Discussion Paper.
Retrieved: http://sites.uclouvain.be/IAP-Stat-Phase-V-VI/ISBApub/dp2010/DP1031.pdf.
Access: 15.12.2014
15. Fousekis, P., Kourtesi, S., Polymeros, A. (2014). Assessing Managerial Efficiency on
Olive Farms in Greece. Outlook on Agriculture, Volume 43, Issue 2, pp. 123-129.
16. Gorton, M., Davidova, S. (2004). Farm Productivity and Efficiency in the CEE Applicant
Countries: A Synthesis of Results. Agricultural Economics, Volume 30, pp. 1-16.
17. Hayfield, T., Racine, J. S. (2008). Nonparametric Econometrics: The np Package. Journal
of Statistical Software, Volume 27, Issue 5, pp. 1-32.

44
18. Kumbhakar, S.C., Ghosh, S., McGuckin, J. T. (1991). A Generalized Production Frontier
Approach for Estimating Determinants of Inefficiency in U.S. Dairy Farms. Journal of
Business and Economic Statistics. Volume 9, pp. 279-286.
19. Li, Q., Racine, J. S. (2007). Nonparametric Econometrics: Theory and Practice.
Princeton: Princeton University Press. p. 768.
20. Lithuanian Institute of Agrarian Economics. (2012). Ukiu veiklos rezultatai (UADT tyrimo
duomenys) 2011 [FADN Survey Results 2011]. Vilnius: Lietuvos agrarines ekonomikos
institutas. p. 108.
21. Meeusen, W., van den Broeck, J. (1977). Efficiency Estimation from Cobb-Douglas
Production Functions with Composed Error. International Economic Review, Volume 18,
Issue 2, pp. 435-444.
22. Racine, J. S., Li, Q. (2004) Nonparametric Estimation of Regression Functions with Both
Categorical and Continuous Data. Journal of Econometrics, Volume 119, pp. 99-130.
23. Simar, L., Wilson, P. W. (1998). Sensitivity Analysis of Efficiency Scores: How to
Bootstrap in Nonparametric Frontier Models. Management Science, Volume 44, Issue 1,
pp. 49-61.
24. Simar, L., Wilson, P. W. (2007). Estimation and Inference in Two-Stage, Semi-
Parametric Models of Production Processes. Journal of Econometrics, Volume 136, Issue
1, pp. 31-64.
25. Wilson, P. (2008). FEAR: A Software Package for Frontier Efficiency Analysis with R.
Socio-Economic Planning Sciences, Volume 42, Issue 4, pp. 247-254.

45
RESOURCE USE AND PRODUCTIVITY IN AGRICULTURE ACROSS THE
EUROPEAN UNION MEMBER STATES
Tomas Balezentis1, Dr; Daiva Makuteniene2, Assoc. Prof. Dr
1 Lithuanian Institute of Agrarian Economics
2 Aleksandras Stulginskis University
Abstract. This paper aims to analyse the trends in resource use across the European Union
(EU) Member States. The research relies on concept of decoupling between the resource use
and economic activity. Indeed, the analysis focuses on the general trends in the energy, land,
and water resource as well as material consumption. The cases of decoupling across the EU
Member States are presented in the paper in order to disentangle the linkages between
economic activity and resource use. The research relies on the WIOD data for 1995-2009. In
general, it can be concluded that energy and land were those inputs (production factors) which
have been used in the most sustainable way if opposed to the remaining inputs covered in this
study.
Key words: resources, decoupling, agriculture.
JEL code: Q15, Q56.
Introduction
Economic activity is mainly aimed at transforming inputs to outputs and, thus, satisfying the
needs of society. Efficiency of suchlike activity can, hence, be measured by considering the
ratio of output production to input use. Furthermore, the total output can be maximized by
making the productive process more extensive (increase in scale) or intensive (increase in
productivity). Whereas the limits for increase in the scale of production are more or less clearly
defined by physical restrictions of the production system and associated production factors, the
limits for increase in productivity are much vaguer. Indeed, the comparative analysis
(benchmarking) can provide yardstick for possible improvements in the production systems.
Therefore, it is important to develop and apply the benchmarking frameworks in order to
identify the best practice and possible limits for growth.
The traditional approach is to measure the relative indicators like gross value added (GVA)
per unit of labour etc. However, it is not always possible to include all sorts of costs into
Corresponding author. Tel.: + 370 5 262 10 78; fax: + 370 5 261 45 24
E-mail address: [email protected]
Proceedings of the 2015 International Conference “ECONOMIC SCIENCE FOR RURAL DEVELOPMENT” No37
Jelgava, LLU ESAF, 23-24 April 2015, pp. 45-53

46
analysis as some inputs are public goods or common goods and, accordingly, require no
“tangible” expenses for consumption thereof. The latter issue is especially topic for natural
resources, viz. water, air etc. such inputs as land, materials etc. might also be used
excessively due to market imperfections ownership rights. In addition, such undesirable
outputs as carbon emission need also to be taken into account as they induce climate change
along with further negative externalities. Due to the aforementioned circumstances, one needs
to analyse the “physical economy”, i. e. the use of resources along with economic activity.
Weisz et al. (2006) analysed the trend in material consumption across the European Union
Member States. Galli et al. (2012) proposed an integrated framework for analysis of the
human impact. The latter framework comprises the ecological footprint, the water footprint,
and the carbon footprint. The concept of eco-efficiency is further discussed by Keating et al.
(2010).
At the level of the European Union, the need for analysis of resource efficiency was stressed
by launching a flagship initiative “A resource-efficient Europe” (European Commission, 2011).
In this vein, the associated data bases were established for international comparisons. These
are, for instance, EU KLEMS (O'Mahony, Timmer, 2009) and the World Input-Output Database
(WIOD) described by Timmer et al. (2012).
In a competitive environment, the productive processes are performed and influenced by
multiple agents at different levels. In order to streamline the production system at sector or
region, an instance of benchmarking is usually required. This is especially important in the
agricultural sectors of the EU Member States which are subject to the Common Agricultural
Policy.
These findings undoubtedly urge to analyse not only economic variables available by the
virtue of accounting (cf. Farming Accountancy Data Network), but also physical flows of
materials and input use. Indeed, the latter information is hard to measure and, due to that,
only certain estimates are available. Balezentis and Hougaard (2014) performed the analysis of
resource use in Lithuanian agriculture. However, in order to reveal the possible ways for
improvement.
This paper aims to analyse the trends in resource use across the EU Member States. The
following tasks are set: (i) to present the methodology for analysis of decoupling between the
resource use and economic activity, (ii) to present the general trends in the resource use, and
(iii) to analyse the cases of decoupling across the EU Member States. The research relies on
the WIOD data for 1995-2009.
Methodology
The key concept for analysis of the resource use and decoupling, in particular, is resource use
elasticity. It can be defined in terms of the levels of resource use and economic activity. Say 0r and
tr are the quantities of resources used in the base and current period, respectively. Similarly,

47
assume 0e and te
denote the quantities of output, i. e. results of the economic activity in the base
and current period, respectively. Thenceforth, the elasticity of resource use, re , is defined as
(Tapio, 2005):
0 0 0
0 0 0
/ ( ) /
/ ( ) /
t
t
re
r r r r r
e e e e e
. (1)
However, the measure of elasticity cannot fully describe the underlying trends in resource use.
This can be done by considering it alongside changes in resource use and economic activity. The
four axes and the two dashed lines in Figure 1 delineate the eight types of (de)coupling.
Source: authors’ construction based on Tapio (2005) and Song, Liu (2014).
Fig. 1. A graphical interpretation of the (de)coupling concept
Weak decoupling can alternatively be termed relative decoupling, i. e. the rate of increase in
economic activity induces is higher than that in resource use. At the other end of spectrum, strong
decoupling can be termed absolute decoupling, i. e. the changes in economic activity and resource
use occur towards different directions. Negative decoupling occurs whenever resource use is
disproportional to changes in economic activity. Finally, expansive (resp. recessive) decoupling is
related to economic growth (resp. downturn).

48
The research relies on the data from the WIOD (Timmer, 2012). The data cover years 1995–
2009. Specifically, the research focuses on the data series for the Agriculture, Hunting, Forestry and
Fishing sector (NACE 1.1 sectors A-B). In order to facilitate the international comparisons, the gross
value added is deflated by respective price indices available in the WIOD (base year 1995) thus
constructing the implicit quantity indices. Furthermore, purchasing power parities of 1995 based on
the EU-28 Gross Domestic Product are used. Therefore, the monetary terms used in this study are
expressed in purchasing power standards (PPS) of 1995, which are devoid of price and exchange
rate differences, otherwise existing among the analysed states. Note that the WIOD presents
material extraction rather than direct material consumption.
Results
First of all, the general trends for the agricultural gross value added (GVA) are presented to
describe the relative importance of agriculture in the economic sense. The obtained results (Table
1) are based on the WIOD data base (Timmer, 2012).
Table 1
Dynamics of the agricultural value-added across the selected EU Member States,
1995-2009
Member
States
The share of agricultural sector
in the total GVA, per cent Rate of growth,
per cent 1995 2009 Average CV
Austria 2.6 1.9 2.1 0.13 -6.7
Belgium 1.5 1.2 1.4 0.10 1.7
Bulgaria 15.7 12.5 17.5 0.23 2.8
Czech Rep. 5.0 3.2 4.2 0.15 -6.7
Germany 1.3 1.2 1.3 0.08 14.4
Denmark 3.5 3.7 3.2 0.10 29.1
Estonia 5.8 4.9 5.3 0.19 60.0
Finland 4.5 3.6 3.5 0.13 18.1
France 3.3 3.0 3.1 0.08 16.5
Hungary 8.0 9.5 7.9 0.14 66.6
Lithuania 11.0 7.4 8.6 0.22 27.1
Latvia 9.1 6.4 6.7 0.17 35.1
Netherlands 3.5 3.1 3.1 0.07 22.9
Poland 8.0 5.4 6.5 0.13 21.1
Romania 19.2 10.6 15.4 0.20 -20.7
Slovakia 5.9 6.5 5.7 0.09 102.9
Slovenia 4.4 2.7 3.6 0.19 -0.7
Sweden 3.0 2.9 2.7 0.06 33.5
Source: authors’ calculations based on Timmer (2012).

49
These results are rather important in the sense that the general trends in GVA enable to describe
the overall development of the agricultural sectors across the selected EU Member States, the
corresponding decoupling types, and provide an overview on the data available in the WIOD. Table
1 presents the main results regarding GVA generated in the agricultural sector, viz., the share of
the agricultural sector in the total GVA generated in an economy for 1995 and 2009, an average
value, coefficient of variation (CV), and the rate of growth in the volume of the GVA in agriculture.
Therefore, one can analyse the trends in both the relative importance of the agricultural sector and
the absolute change in its output across the EU Member States.
In order to define the prevailing types of decoupling, the partial productivities of the resources
used in the agricultural sector are analysed. Specifically, Table 2 presents the results related to
energy use, whereas Table 3 deals with land, material use, and water productivity.
Table 2
Partial productivity of energy use and carbon emission, 1995-2009
Member
States
Energy use productivity
(million PPS / TJ)
Carbon emission productivity
(million PPS / kt)
Average Rate of
growth CV Average
Rate of
growth CV
Austria 0.14 -6 0.10 3.37 15 0.10
Belgium 0.07 36 0.22 0.97 28 0.09
Bulgaria 0.36 60 0.19 6.62 -11 0.17
Czech Rep. 0.17 101 0.19 1.78 21 0.18
Germany 0.12 78 0.23 2.33 84 0.22
Denmark 0.06 34 0.09 1.29 53 0.11
Estonia 0.13 52 0.23 3.35 2 0.44
Finland 0.08 5 0.09 1.52 42 0.15
France 0.17 21 0.06 2.35 26 0.07
Hungary 0.23 141 0.35 4.71 173 0.38
Lithuania 0.26 99 0.17 6.32 104 0.21
Latvia 0.09 83 0.18 1.54 63 0.14
Netherlands 0.04 91 0.26 0.92 31 0.11
Poland 0.09 65 0.19 1.24 60 0.17
Romania 0.53 31 0.26 36.27 242 0.47
Slovakia 0.31 330 0.49 27.39 25 0.31
Slovenia 0.18 -1 0.19 3.69 17 0.06
Sweden 0.13 54 0.18 1.93 10 0.09
Source: authors’ calculations based on Timmer (2012).
Energy productivity clearly depended on the geographical location of the analysed countries: the
Southern countries featured higher levels of energy productivity if opposed to the Northern ones.
Lithuania might be an interesting exception with rather low energy intensity. The correlation
between average energy productivity and rate of growth in productivity (R = 0.14) indicates that
the divergence in energy productivity/intensity is not likely to deepen in the analysed countries. As

50
regards carbon emission productivity, the pattern of country ranking remained more or less the
same. However, a positive correlation coefficient between average carbon emission productivity and
CV (R = 0.48) implied that high-productivity countries face higher variance in carbon emission
productivity. Note that energy productivity decreased in Austria (-6%) and Slovenia (-1%) during
the research period. Carbon emission productivity decreased in Bulgaria only.
Table 3
Partial productivity of land, water, and materials, 1995-2009
Member
States
Land productivity
(thousand PPS / ha)
Material use
productivity
(thousand PPS / t)
Water productivity
(PPS / m3)
Averag
e
Rate
of
gro
wth
CV
Averag
e
Rate
of
gro
wth
CV
Averag
e
Rate
of
gro
wth
CV
Austria 0.54 -9 0.08 0.08 -13 0.08 0.57 -9 0.06
Belgium 1.35 5 0.05 0.07 15 0.06 0.81 -3 0.05
Bulgaria 0.84 13 0.14 0.31 -13 0.17 0.40 6 0.16
Czech Rep. 0.79 -12 0.09 0.13 -2 0.12 0.37 -17 0.13
Germany 0.79 22 0.10 0.07 20 0.10 0.38 -7 0.05
Denmark 1.10 30 0.09 0.09 35 0.08 0.34 14 0.06
Estonia 0.19 19 0.10 0.08 31 0.11 0.17 -8 0.23
Finland 0.14 7 0.08 0.07 8 0.07 0.54 0 0.08
France 0.74 17 0.05 0.11 4 0.03 0.41 -3 0.03
Hungary 0.93 79 0.25 0.15 41 0.12 0.25 49 0.14
Lithuania 0.46 50 0.13 0.12 11 0.11 0.22 -32 0.11
Latvia 0.19 8 0.14 0.03 -8 0.19 0.17 -31 0.13
Netherlands 4.27 22 0.07 0.22 -8 0.04 1.76 24 0.09
Poland 0.82 25 0.09 0.10 0 0.06 0.36 18 0.10
Romania 0.99 -15 0.10 0.23 -2 0.07 0.45 -8 0.14
Slovakia 0.86 93 0.27 0.13 44 0.20 0.43 104 0.26
Slovenia 0.66 -13 0.10 0.14 -1 0.05 0.55 -1 0.06
Sweden 0.24 30 0.12 0.07 31 0.12 0.53 23 0.17
Source: authors’ calculations based on Timmer (2012).
Table 3 presents the partial productivity of land, material use, and water. Note that Romania and
Bulgaria exhibited rather high land productivity levels of 0.99 and 0.84 thousand PPS/ha,
respectively. This might be due to the fact that the WIOD database includes forestry GVA and
productive forest area into account. It is important to take into account that the use of implicit
quantity indices involved in the analysis has also altered the real output levels. The same
observations can be made for material use productivity. Anyway, these countries showed negative
growth rates for the aforementioned variables (save for land productivity in Bulgaria), thus, analysis
of the extended time series might reveal some additional insights. The three Baltic States

51
performed the worst in terms of the average water use productivity. Indeed, the abundance of the
latter resource there induces excessive use thereof.
Given the results presented in Table 1 and the rates of growth of resource consumption (these
data are available from the corresponding author upon request), the prevailing types of
(de)coupling were identified for the analysed countries. Table 4 presents the results, namely
elasticities of resource use and the associated types of (de)coupling. The types of decoupling are
denoted in the same manner is in Figure 1.
Table 4
Elasticities of resource use and the types of (de)coupling, 1995-2009
Member
States
Energy
use
Carbon
emission Land
Material
consumptio
n
Water
Ela
sti
cit
y
Typ
e
Ela
sti
cit
y
Typ
e
Ela
sti
cit
y
Typ
e
Ela
sti
cit
y
Typ
e
Ela
sti
cit
y
Typ
e
Austria 0.0 A 2.8 G -0.4 D -1.1 D -0.4 D
Belgium -15.2 H -12.3 H -1.9 H -6.9 H 2.8 C
Bulgaria -12.8 H 5.5 C -3.2 H 6.4 C -0.9 H
Czech Republic 8.0 G 3.4 G -0.8 D 0.7 E -1.9 D
Germany -2.5 H -2.6 H -0.5 H -0.3 H 1.6 C
Denmark -0.1 H -0.5 H
-
0.01
H/
A -0.1 H 0.4 A
Estonia 0.1 A 0.9 B 0.6 A 0.4 A 1.2 C
Finland 0.7 A -0.9 H 0.6 A 0.5 A 1.0 B
France -0.2 H -0.5 H
-
0.03
H/
A 0.7 A 1.3 C
Hungary -0.5 H -0.6 H -0.1 H 0.3 A 0.2 A
Lithuania -1.3 H -1.4 H -0.6 H 0.5 A 3.2 C
Latvia -0.7 H -0.5 H 0.7 A 1.3 C 2.7 C
Netherlands -1.6 H -0.3 H 0.0 A 1.4 C 0.0 H
Poland -1.3 H -1.1 H -0.2 H 1.0 B 0.1 A
Romania 1.9 G 3.7 G 0.3 E 0.9 F 0.7 E
Slovakia -0.5 H 0.6 A 0.1 A 0.4 A
-
0.005
H/
A
Slovenia -0.7 D 23.0 G
-
20.7 D -1.3 D 0.003
H/
A
Sweden -0.4 H 0.6 A 0.1 A 0.1 A 0.3 A
Source: authors’ calculations based on Timmer (2012).

52
The results did indicate that the best situation in terms of decoupling prevailed for the energy
use. Indeed, some 12 of the 18 analysed countries featured strong (absolute) decoupling (denoted
as H). This implies that the economic growth did not render growth in energy use but was rather
maintained along with decreasing energy use. The similar trend was observed for carbon emission.
However, in this case, only 10 countries were specific with absolute decoupling. This might be due
to the lack of technical innovations and sustainable energy use, which induce higher values of the
carbon factor. As regards the land use, 6 countries exhibited strong decoupling (type H) and
another 6 – weak (relative) decoupling (type A). Even though seven countries were specific with
weak decoupling for material use, there were six cases of negative decoupling (i. e. resource use
grew faster than economic activity). Finally, nine instances of negative decoupling (types C, D, and
E) were observed for water use.
In general, it can be concluded that energy and land were those inputs (production factors)
which have been used in the most sustainable way if opposed to the remaining inputs covered in
this study. Indeed, costs associated with energy and land are those easiest to internalise through
the respective factor markets, whereas such inputs as materials and water are more or less freely
available upon acquisition of land.
Note that the elasticities of land use in Denmark and France along with water consumption in
Slovakia and Slovenia were close to zero. Therefore, the type of decoupling is rather arbitrary for
these cases.
Conclusions
1. The highest relative importance of the agricultural sector (in terms of the average share
of GVA in the total GVA) was observed in Bulgaria, Romania, Lithuania, Hungary, Latvia,
and Poland. The average share of the agricultural GVA exceeded 6% in these
economies. Negative growth rates in the agricultural GVA were observed for Slovenia (-
0.7%), Austria (-6.7%), Czech Republic (-6.7%), and Romania (-20.7%).
2. In general, it can be concluded that energy and land were those inputs (production
factors) which have been used in the most sustainable way if opposed to the remaining
inputs covered in this study. Indeed, costs associated with energy and land are those
easiest to internalise through the respective factor markets, whereas such inputs as
materials and water are more or less freely available upon acquisition of land.
3. Results for the transformation economies with a history of monetary reforms might be
misleading in the sense that the estimates of real value added and, thus, elasticities of
resource use might had been spuriously altered during certain periods. Therefore,
further analyses should attempt to (i) use different time series, (ii) employ mathematical
modelling techniques able to tackle the uncertainty.

53
Bibliography
1. Balezentis, T., Hougaard, J. L. (2014). Resource Use in Lithuanian Agricultural Sector.
Management Theory and Studies for Rural Business and Infrastructure Development,
Volume 36, Issue 4, pp. 755-765.
2. European Commission. (2011). A Resource-Efficient Europe – Flagship Initiative under
the Europe 2020 Strategy. Brussels, 26.1.2011. COM(2011) 21. Retrieved:
http://ec.europa.eu/resource-efficient-europe/pdf/resource_efficient_europe_en.pdf.
Access: 15.12.2014
3. Galli, A., Wiedmann, T., Ercin, E., Knoblauch, D., Ewing, B., Giljum, S. (2012).
Integrating Ecological, Carbon and Water Footprint into a “Footprint Family” of
Indicators: Definition and Role in Tracking Human Pressure on the Planet. Ecological
Indicators, Volume 16, pp. 100-112.
4. Keating, B. A., Carberry, P. S., Bindraban, P. S., Asseng, S., Meinke, H., Dixon, J.
(2010). Eco-Efficient Agriculture: Concepts, Challenges, and Opportunities. Crop
Science, Volume 50, Issue S1, pp. S-109-S-119.
5. O'Mahony, M., Timmer, M. P. (2009). Output, Input and Productivity Measures at the
Industry Level: The EU KLEMS Database. The Economic Journal, Volume 119, Issue 538,
pp. F374-F403.
6. Song, W., Liu, M. (2014). Assessment of Decoupling Between Rural Settlement Area and
Rural Population in China. Land Use Policy, Volume 39, pp. 331-341.
7. Tapio, P. (2005). Towards a Theory of Decoupling: Degrees of Decoupling in the EU and
the Case of Road Traffic in Finland between 1970 and 2001. Transport Policy, Volume
12, pp. 137–151.
8. Timmer, M. P., ed. (2012). The World Input-Output Database (WIOD): Contents,
Sources and Methods. WIOD Working Paper Number 10. Retrieved:
http://www.wiod.org/publications/papers/wiod10.pdf. Access: 15.12.2014
9. Timmer, M., Erumban, A. A., Gouma, R., Los, B., Temurshoev, U., de Vries, G. J., Arto,
I. (2012). The World Input-Output Database (WIOD): Contents, Sources and Methods.
Retrieved: http://www.wiod.org. Access: 15.12.2014
10. Weisz, H., Krausmann, F., Amann, C., Eisenmenger, N., Erb, K. H., Hubacek, K.,
Fischer-Kowalski, M. (2006). The Physical Economy of the European Union: Cross-
Country Comparison and Determinants of Material Consumption. Ecological Economics,
Volume 58, pp. 676-698.
54
MODELLING THE MEAT SECTOR IN ESTONIA
Reet Põldaru*, Dr. Econ, associate professor;
Ants-Hannes Viira, PhD, researcher;
Jelena Ariva, MA, researcher;
Jüri Roots, PhD, researcher Institute of Economics and Social Sciences,
Estonian University of Life Sciences
Abstract. Improving the competitiveness of Estonian agriculture is the priority objective for
Estonia’s agricultural policy. The livestock sector is among the most fundamental sectors of
Estonian agriculture. The primary objective of this study is to model the Estonian livestock
sector and to project patterns of future meat production and consumption. The model used for
this purpose is multi-sectoral and comprises of econometrically estimated equations for all of
the major products of the Estonian agricultural sector. The Estonian macroeconomic
agricultural model is developed in order to analyse and project the medium-term
developments of Estonian agricultural production and the structure of agricultural
commodities. An approach based on FAPRI (FAPRI-Missouri's EU GOLD model) was used for
creating the overall agricultural model which includes several modules (sub-models).
Stochastic equations are estimated by two stage least squares (2SLS) and full information
maximum likelihood (FIML) using data from 1993 to 2013 inclusive. Projections for the main
endogenous variables are made for a seven-year period to 2020. We present and analyse the
projections of production and consumption of beef, pork and poultry.
Key words: econometric modelling, simultaneous equations, livestock sector, Estonia
JEL code: C53, O13, Q18
Introduction
In 1993, approximately 13% of the labour force was employed in agriculture, forestry and
fishery, producing 15.5% of Estonia’s Gross Domestic Product (GDP). In 2013, only 4.3% of
the workforce was employed in these areas, producing 4% of GDP (SOE, 2014). Although the
relative contribution of agriculture to the economy in terms of GDP and employment is
declining, there is a need for modelling tools which enable the analysis of agricultural
developments allowing a well-founded basis for policy decision-making. The decline in the
number of agricultural animals began during the early 1990s (Figure 1).
* Corresponding author. Tel.: + 372 7313 024. E-mail [email protected]
Proceedings of the 2015 International Conference “ECONOMIC SCIENCE FOR RURAL DEVELOPMENT No37”
Jelgava, LLU ESAF, 23-24 April 2015, pp. 54-63

55
Source: authors’ construction based on Statistics Estonia
Fig. 1. Number of livestock and poultry as of 31 December (per thousands)
Mainly due to agricultural restructuring, the number of cattle in Estonia has gradually
decreased (Viira, et. al., 2009). Cattle numbers including dairy cows decreased as many small-
scale producers stopped dairy farming. Certain growth of cattle occurred from 2010–2013 due
to the increase in the number of beef cattle. The number of pigs decreased between 1992 and
1999. Pig numbers began to grow after 2000, mainly due to increasing demand from Eastern
European markets but started to again decline from 2013 due to an import ban of live pigs
from the EU. The number of poultry had been in decline until 2007. However, the poultry
population has increased significantly after 2008.
After a significant decline in the production of meat, meat production is again on the rise
since 2001 (Figure 2), and has amounted to 80,000 tonnes in recent years. The meat total
combines beef, pork and poultry meat.
Source: authors’ construction based on Statistics Estonia
Fig. 2. Meat production 1992–2013 (per thousand tonnes)

56
The structure of meat production has changed. Production of pork and poultry meat has
increased, while beef production has decreased. Meat has always had a significant place on the
Estonian table. Meat consumption has been affected by changing times and traditions, i.e.
changes in income and food consumption patterns. Between 1993 and 2013, meat
consumption has seen a large increase (Figure 3). Consumption of meat increased from 47 kg
to 65.7 kg per capita between 1993 and 2013. Therefore, in parallel to the increase in
incomes, per capita consumption has increased by nearly 50%.
Source: authors’ construction based on Statistics Estonia
Fig. 3. Meat consumption per capita 1993-2013 (per kg)
From 1993 to 2013, consumer preferences have also changed. Compared to 1993, the
consumption of pork and poultry meat has increased, while beef consumption has decreased
(follows the trends in meat production, Figure 2).
The most popular type of meat is pork. This accounts for more than 50% of all the meat
consumed in Estonia. The consumption of beef decreased to 7 kg per capita in 2013 (SOE,
2014) and accounts for only 10% of meat consumed. The reduction in the consumption of beef
in Estonia can be partially attributed to extensive exports of live cattle. Furthermore, the price
increase is seen as having a significant negative effect on beef consumption. Poultry meat
consumption, after a considerable decline between 2004 and 2006, has started to grow and
has reached the maximal level – 23.2 kg per capita in 2013. Consumption of poultry meat
accounts for more than 33% of total meat consumption.
This paper aims to provide an overview of modelling and projections of meat production as
well as consumption per capita. The meat sub-model of the Estonian agricultural model is
applied to analyse simulations in order to make projections of beef, pork and poultry
production and consumption for a seven-year period until 2020. The main objective of this
study is to project the most essential characteristics of the Estonian meat (livestock) sector for

57
the period of 2014–2020.The task of this paper is to make projections of meat production and
consumption.
Stochastic equations are estimated by two stage least squares (2SLS) and full information
maximum likelihood (FIML) using data from 1993 to 2013 inclusive. The Fair-Parke program is
used for the estimation of meat model parameters (Fair & Parke 2003).
Research results and discussion
Materials and methods
Models in agriculture, in relation to projections of agricultural production have been used for
many different purposes in decision-making. The modelling methodology employed in this
paper follows the one that has been used by FAPRI (Hanrahan, 2001). The FAPRI GOLD model
structure was used as a basis for the creation of the Estonian agricultural model. The
specification of the model is inspired by the structure of FAPRI’s Irish and UK models (Binfield,
et al., 1999, 2000, 2002; Hanrahan, 2001, Moss, et. al., 2011) and the AG-MEMOD model
(Donnellan, et al., 2001; Leeuwen & Tabeau, 2005; Salputra, et. al., 2011). This also
facilitates the use of world and EU market projections within the Estonian model.
The FAPRI system is a dynamic, partial equilibrium, multi-commodity, global model
(Hanrahan, 2001). As a partial equilibrium model, macroeconomic factors such as population,
real GDP per capita, GDP deflation, GDP growth, and growth rates for the general economy,
and various producer price indices are exogenous to the system.
At the Estonian University of Life Sciences we have some experience in implementing the
FAPRI approach to macroeconomic modelling in agriculture (Põldaru & Roots, 2003; Põldaru, et
al., 2006; Põldaru, et al., 2008). Now the integrated macroeconomic model of Estonian
agriculture (milk, grain, rapeseed, meat, welfare) has been developed. The model consists of a
system of equations covering the dairy, beef, sheep, pigs, poultry, grain and rapeseed sectors.
There is also a block for welfare estimations. The integrated database of endogenous and
exogenous variables contains data on 203 endogenous and 214 exogenous variables.
Projections were made for 187 variables (equations), covering the period 2014–2020: 52
equations describing the dairy sector, 52 describing the grain sector, 24 describing rapeseed
production and consumption, and 46 equations describing the meat sector. The change in
economic welfare is described by 13 equations.
Figure 4 shows how the meat sector module’s successive components (endogenous
variables, key relationships) link with each other. The module determines a projection of
production, domestic demand, stock building, producer prices, imports and exports for each of
the considered commodities.
There are four livestock blocks in the meat sector’s sub-model. The cattle and beef, pig and
pork, and sheep meat blocks share a similar structure. The poultry block is considerably less
complicated than the other livestock blocks. The key variable of supply-side in each of the
livestock blocks (except poultry) is the stock of female breeding animals (cows, sows, and

58
ewes). The stock of female breeding animals determines the number of young animals
available for fattening and/or slaughter, which in turn determines meat production. The share
of sheep meat production in total meat production is insignificant (accounting for less than 1%
of total meat production) and its production and consumption are not analysed in this paper.
Source: authors’ construction based on macroeconomic model
Fig. 4. Flow diagram showing key relationships in the meat sector sub-model
The various livestock blocks are linked primarily through their demand side specifications.
Meat demand per capita is modelled as a function of real prices of meat. The beef production
block is linked with the dairy block via slaughter and the calf production from the dairy herd.
The grain and rape modules are linked to the livestock sub-model by means of livestock
production price indices that are functions of the prices of the sub-models of grain and seed
meals. Total domestic supply is equal to domestic production plus beginning stocks and
imports. As the general welfare affects the consumption of meat, it is important to use the
average wage and GDP per capita for modelling meat production and consumption.
The meat sector sub-model is developed in order to enable projections for meat production
and consumption. This is demonstrated by means of a baseline scenario representing an
estimation of a likely future development under the given conditions, the values of
independent variables are at the average level of past the 3–4 years. The baseline scenario is
based on the assumption that GDP per capita and the average wage will increase by 2%
annually during the period of 2014–2020. The prices for different meats are modelled
endogenously.
Trend
Meat prices
Slaughtered
head
Slaughtered head
Slaughtered
head
Pig slaughter weight
Cattle
slaughter weight
Beef production
Pork production
Poultry meat production
Meat production
(supply)
GDP per capita
Income
Import
Trend
Price index
Calving
Consumption
End of stock
Sheep
slaughter weight
Sheep meat production
Export
Demand of meat

59
Projections for seven-year period to 2020
The baseline scenario projects a positive development for beef and poultry production and
decline for pork production (Table 1). The total supply of meat (beef, pork, poultry) will
increase to 82.9 thousand tonnes by 2020.
Table 1
The projected values of meat supply and demand 2014–2020 (thousand tonnes)
Indicators 2014 2015 2016 2017 2018 2019 2020 Change 2020
Beef
vs 2014 %
Production 15.6 15.2 16.2 16.8 17.5 17.9 18.7 19.6
Import 4.9 5.4 5.6 5.9 5.9 5.9 5.7 17.5
Export 9.2 8.5 9.6 10.5 11.0 11.4 11.8 27.2
Domestic use 14.5 13.7 13.0 12.4 11.8 11.1 10.6 -27.0
Pork
Production 44.0 43.9 43.7 43.3 42.8 42.7 42.5 -3.5
Import 34.4 36.2 37.6 38.9 40.2 41.6 42.9 24.8
Export 31.3 34.3 34.6 36.7 37.2 38.5 39.2 25.1
Domestic use 47.4 46.4 46.3 46.2 46.2 46.1 46.0 -3.1
Poultry
Production 18.9 19.1 19.6 20.1 20.6 21.1 21.7 14.3
Import 21.6 21.8 21.9 21.9 22.0 22.0 22.1 2.3
Export 10.5 10.7 11.2 11.6 11.9 12.0 11.9 12.9
Domestic use 30.2 30.1 30.2 30.4 30.5 30.6 30.7 1.5
The projected values for beef production will increase but the projected values for total beef
domestic use will decrease. The supply of beef meat is projected to increase to 18.7 thousand
tonnes by 2020 (19.6% growth compared to the 2014 estimate). The domestic use of beef
meat will decrease 27% by 2020. In Estonia, there is a grassland resource necessary for
increasing the beef cattle population but the growth is slowing down, as the subsidies and
output selling prices have declined while the environmental regulations become stricter. In the
projected period (2014–2020), exports will increase to 27.2% and imports to 17.5% by 2020.
Export growth is mainly due to the increasing export of live animals.
The projected pork meat production will decrease by 3.5% to 42.5 thousand tonnes and
domestic use will decrease 3.1% to 46.0 thousand tonnes by 2020 compared to 2014.
According to projections, imports and exports continued to grow over the projection period.
This implies that the processing industry will continue to import pork meat in order to prepare
various products out of it.
Production of poultry meat will increase by 14.3% to 21.7 thousand tonnes and domestic
use will increase by 1.5% to 30.7 thousand tonnes by 2020. At the same time, poultry’s

60
domestic use will remain higher than production, and imports of poultry meat will exceed
exports.
In the case of poultry, self-sufficiency is considerably lower than in the cases of pig meat
and beef. The projections of poultry consumption and production indicate that the deficit will
also remain during the period 2014–2020.
Domestic demand for meat is modelled per capita. Figure 5 shows the projections of
consumption for different types of meat. Per capita beef consumption presents a downward
trend while pork and poultry indicate an upward trend.
Source: authors’ construction based on macroeconomic model
Fig. 5. The projected values for meat consumption (kg per capita)
Per capita meat consumption is specified as a function of the producer price, prices of
substitutes in consumption (i.e. the prices of the other meats), average monthly wage and
trend. All of the meats are assumed to be substitutes for each other in consumption. For
example, the beef consumption function could be presented as follows:
The consumption of beef will decrease and consumption of pork and poultry will increase
(Figure 5). Per capita beef consumption exhibited a downward trend during the early 1990s
(Figure 3). In 1993, per capita consumption of beef meat was 25 kg. The projected average
annual consumption of beef is 8.4 kg per capita in 2020. Per capita beef consumption is
declining as consumer attitudes and preferences have changed (increasing consumption of
poultry meat), while the beef price is also higher than the prices of other meats. According to
the model estimates, an increase in the beef price by EUR 0.1 per kg decreases average
annual beef consumption per capita by 0.4 kg; an increase in the pork price by EUR 0.1 per kg

61
increases average annual per capita beef consumption by 0.3 kg; an increase in the average
monthly wage by EUR 100 (from EUR 900 to EUR 1000, in 2013, the Estonian national average
for the gross monthly wage was EUR 949 [SOE, 2014]) will increase average annual beef
consumption by 0.47 kg.
Consumption of pork will increase to 36.8 kg per capita by 2020; this growth is mainly
driven by assumed income growth (average 2% per annum) in the baseline scenario.
According to the estimates of the respective equations, an increase in the pork price by EUR
0.1 per kg decreases the average pork consumption by 0.9 kg per capita per annum; an
increase in the beef price by EUR 0.1 per kg increases average pork consumption by 0.05 kg
per capita; an increase in the average monthly wage by EUR 100 will increase average annual
pork consumption by 1.13 kg per capita.
The baseline projection indicated an increase in poultry meat consumption to 25.4 kg per
capita per annum by 2020. The consumption of poultry in Estonia during recent years has been
constantly growing (Figure 3). There are several reasons for the increase in the consumption of
poultry meat. The main reason is the price of poultry meat, which is lower in comparison to
other types of meat, and increased awareness of the characteristics of poultry meat.
Production of poultry in Estonia is still modest, and the rate of self-sufficiency is projected to
grow to 70% by 2020. According to the model estimates, an increase in the poultry price by
EUR 0.1 per kg decreases average annual poultry meat consumption by 0.58 kg per capita. An
increase in pork prices by EUR 0.1 per kg increases average annual per capita poultry meat
consumption by 0.75 kg. An increase in the average monthly wage by EUR 100 will increase
average annual poultry consumption by 0.96 kg per capita.
The baseline projection of the macroeconomic model of Estonian agriculture indicates an
increase in the production and consumption of meat. This tendency is closely related to income
growth and positive macroeconomic environment (GDP growth).
Conclusions
1. The partial equilibrium model was used as a method to evaluate the future developments
of the Estonian meat sector. The livestock sub-model equations are estimated
econometrically using annual data and are then solved simultaneously using 2SLS and
FIML.
2. Beef meat production is projected to increase to 18.7 thousand tonnes by 2020 (19.6%
growth compared to 2014). According to the projections, approximately 12 thousand
tonnes of beef meat will be exported. The projected average annual consumption of beef is
8.4 kg per capita in 2020. According to the model estimates, an increase in the beef price
by EUR 0.1 per kg decreases average annual beef consumption per capita by 0.4 kg.
3. Projected pig meat production indicates a decrease by 3.5% to 42.5 thousand tonnes by
2020. Consumption of pork will increase to 36.8 kg per capita by 2020. According to the
estimates of the respective equations, an increase in the pork price by EUR 0.1 per kg

62
decreases average pork consumption by 0.9 kg per capita per annum. An increase in the
average monthly wage by EUR 100 will increase the average annual pork consumption by
1.13 kg per capita.
4. The projected production of poultry meat will increase by 14.3% to 21.7 thousand tonnes.
Consumption of poultry meat will increase to 25.4 kg per capita by 2020. According to the
model estimates, an increase in the poultry price by EUR 0.1 per kg decreases average
annual poultry meat consumption by 0.58 kg per capita and an increase in pork prices by
EUR 0.1 per kg increases per capita poultry meat consumption by 0.75 kg.
5. The model estimates of meat demand indicated negative price elasticity for all considered
meat types, which corresponds to expectations. According to the model estimates, meat
consumption is positively related to changes in the average wage and GDP.
6. The macroeconomic model for Estonian agriculture can be used as a decision-making
instrument for projection and analysis purposes.
Funding
The macroeconomic model of Estonian agriculture has been developed within the framework of
the research project “The Analysis of Changes in Agricultural Commodity Prices and Structure
of Estonian Main Agricultural Products. The Approach Based on Macroeconomic Models”,
financed under the national “Agricultural and Applied Research and Development Program
2009-2014”.
Bibliography
1. Binfield, J., Donnellan, T., McQuinn, K. (1999). Modelling Agriculture in the Republic of
Ireland: Agenda 2000 Impacts. Paper presented at the Agricultural Economics Society
1999. Belfast, Northern Ireland. March 26-29.
2. Binfield, J., Donnellan, T., McQuinn, K. (2000). The Econometric Modelling of Irish
Agriculture. Paper presented at the AES Annual Conference, University of Manchester, UK.
3. Binfield, J., Donnellan, T., Hanrahan, K., Hennessy, T., McQuinn, K., Westhoff, P. (2002).
The Baseline Outlook for the Agricultural Sector in the EU and Ireland. Paper in Outlook
2002: Medium Term Analysis for the Agri-Food Sector. April 2002. Teagasc, Dublin.
4. Donnellan, T., Hanrahan, K., McQuinn, K., Riordan, B. (2002). Analysis with the AG-
MEMOD Model: Dealing with Diversity in the EU Agri-Food Sector. EAAE Congress
Zaragosa, Spain, August 28th-31st, 2002, RERC, Teagasc, Dublin.
5. Fair, R.C., Parke, W. R. (2003). The Fair-Parke Program for the Estimation and Analysis of
Nonlinear Econometric Models. User’s Guide.
Retrieved: http://fairmodel.econ.yale.edu/fp/fp.htm. Access: May 20, 2005.
6. Hanrahan, Kevin F. (2001). The EU GOLD MODEL 2.1. An Introductory Manual. Retrieved:
http://www.tnet.teagasc.ie/agmemod/downloads/goldmanualdft.pdf. Access: January 23,
2002. Rural Economy Research Centre, Teagasc.
7. Leeuwen, M., Tabeau, A. (2005). Dutch AG-MEMOD model; A Tool to Analyse the Agri-
food sector. The Hague, Agricultural Economics Research Institute (LEI). Report.
Retrieved: http://purl.umn.edu/29079. Access: 20.05.2013.
8. Moss, J., Patto, M., Zhang, L., Kim, I.S. (2011). FAPRI-UK Model. Documentation. Agri-
Food & Biosciences Institute & Queen’s University Belfast. 215 p.
9. Põldaru, R., Roots, J. (2003). An Econometric Model of the Estonian Dairy Sector.
Proceedings of the International Conference: Economic Science for Rural Development.
Jelgava, Latvia, pp. 110-115.

63
10. Põldaru, R., Roots, J., Viira, A-H., Värnik, R. (2006). A Macroeconomic (Simultaneous
Equation) Model Of the Estonian Dairy Sector. In: Zazueta, F., Xin, J., Ninomiya, S.,
Schiefer, G. (Eds.), Proceedings of the 4th World Congress on Computers in Agriculture
and Natural Resources, July 24-26, 2006, Orlando, Florida USA. pp. 775-780.
11. Põldaru, R., Roots, J., Viira, A-H., Värnik, R. (2008). A Macroeconomic (simultaneous
equation) Model of the Estonian Livestock Sector. IAALD AFITA WCCA 2008. Program and
Abstracts: World Conference on Agricultural Information and IT, pp. 7-8.
12. Salputra G., Chantreuil F., Hanrahan K., Donnellan T., Leeuwen M.V., Erjavec E. (2011).
Policy Harmonized Approach for the EU Agricultural Sector Modelling. Agricultural and Food
Science, Volume 20, Issue 2, pp. 119-130.
13. Statistics Estonia (SOE). 2014. Online statistical database. Retrieved: http://
www.stat.ee. Access: December 29, 2014.
14. Viira, A.-H., Põder, A., Värnik, R. (2009). 20 years of Transition Institutional Reforms
and the Adaptation of Production in Estonian Agriculture. German Journal of Agricultural
Economics, Volume 58, Issue 7, pp. 294-303.

64
ECONOMIC POLICY INCENTIVES ENCOURAGING AGRICULTURAL PRODUCTION: A COMPARATIVE ANALYSIS OF LITHUANIAN RURAL
DEVELOPMENT PROGRAMME FOR 2007-2013 AND 2014-2020
Eglė Stonkutė, Assoc. Prof. Dr.; Jolita Vveinhardt, Assoc. Prof. Dr.
Vytautas Magnus University
Abstract. The new European Union’s financial perspective for rural development policy
started in 2014 bringing the need to assess the results of past policies and to design future
rural development in line with new strategic objectives. While the Rural Development
programme for Lithuania for 2014-2020 being still under development it is important to
implement ex-ante evaluation of economic incentives being created (maintained) under these
programmes in order to detect relative changes in economic policy incentives encouraging
agricultural production in the future. Therefore, the aim of the paper is to define relative
changes in economic policy incentives encouraging agricultural production being created by the
structural support for agriculture under the Rural Development programme for Lithuania for
2014-2020. For that purpose measures aimed at support for business entities (producers)
under the Rural Development programmes for 2007-2013 and 2014-2020 are compared. The
results of the comparative analysis reveal that total support and its intensity is decreasing in
the period 2014-2020 compared to that in the period 2007-2013. The decrease of support can
induce lagging in structural changes or advancement in productivity as an option to overcome
structural deficiencies.
Key words: economic incentives, rural development measures, investment support, Lithuania.
JEL code: Q18
Introduction
The new European Union’s (EU) financial perspective for rural development policy started in
2014 bringing the need to assess the results of past policies and to design future rural
development in line with new strategic objectives. The potential changes in support for
agricultural sector could bring new incentives for changes in structure of agricultural sector, its
competiveness, productivity, farm income and welfare as well as other broader benefits for
whole rural and national society through economically viable, competitive, agro-
environmentally friendly and sustainable agricultural sector. As the decoupling of support
under the called First Pillar (direct payments) of the EU Common Agricultural Policy (CAP) is
Proceedings of the 2015 International Conference “ECONOMIC SCIENCE FOR RURAL DEVELOPMENT” No37
Jelgava, LLU ESAF, 23-24 April 2015, pp. 64-75

65
implemented its incentives being created for agricultural production have become limited. In
that context the attention shifts to the EU CAP’s support for rural development (called also as
the Second Pillar’s and even the Third Pillar’s support), its measures and their impact on
agricultural production. While the Rural Development programme for Lithuania for 2014-2020
being still under development it is important to implement ex-ante evaluation of economic
incentives being created (maintained) under these programmes in order to detect relative
changes in economic policy incentives encouraging agricultural production in the future.
The aim of the paper is to define relative changes in economic policy incentives encouraging
agricultural production being created by the structural support for agriculture under the Rural
Development programme for Lithuania for 2014-2020.
In order to achieve the aim of the paper, three tasks are formulated:
to analyse and classify measures under the Rural Development programmes for
Lithuania for 2007-2013 and 2014-2020 in order to define those directly linked to
productive assets, income and costs of agricultural producers;
to make comparative analysis of intensity of support for producers (business
entities) taking into account structural indicators of agricultural sector (a structural
approach);
to make comparative analysis of intensity of support for producers (business
entities) taking into account indicators of economic accounts for agriculture (an
economic approach);
to draw conclusions, proposals and recommendations for further development of
rural development policy with the aim to support competitiveness and sustainability
of agricultural activity.
The comparative analysis is applied in order to define relative changes in economic policy
incentives encouraging agricultural production being created by the structural support for
agriculture under the Rural Development programme for Lithuania for 2014-2020. For that
purpose there is made the analysis and comparison of packages of measures under the Rural
Development programmes for Lithuania for 2007-2013 and 2014-2020. The main data sources
used for the comparative analysis of packages of measures are the Rural Development
Programme for Lithuania 2007-2013 (e.g. the Ministry of Agriculture of the Republic of
Lithuania, 2014), Lithuania - Rural Development Programme for 2014-2020 (e.g. the Ministry
of Agriculture of the Republic of Lithuania, 2014), “Lietuvos kaimo pletros 2014-2020 metu
programos priemoniu pagrindines nuostatos“ (Main Concepts of the Rural Development
Programme’s 2014-2020 Measures) – background presentation prepared by the Ministry of
Agriculture of the Republic of Lithuania (e.g. the Ministry of Agriculture of the Republic of
Lithuania, 2014) and the Regulation (EU) No 1305/2013 of the European Parliament and of the
Council of 17 December 2013 on support for rural development by the European Agricultural
Fund for Rural Development (EAFRD and repealing Council Regulation (EC) No 1698/2005 (e.g.
European Parliament and the Council, 2013). The data on agricultural structural (on UAA)

66
statistics (UAA, number of holdings) for Lithuania are the data of the National Paying Agency
(2014) while data on agricultural labour and economic accounts statistics for Lithuania are the
data taken from Eurostat (2014).
The discussion on the impact of structural (EU CAP’s Second and Third Pillars) support on
agricultural sector of the world, the EU and that of Lithuania is never ending. Rural
development policies as a part of common agricultural policy affect structural changes in
agricultural sector to the extent it makes the effect on agricultural production incentives,
output and input markets, and farm household income (e.g. OECD, 2011). The structural
changes in agricultural sector will always be the result of many complex interactions among
different policies and economic realities; thus, it is difficult to identify impact of specific policy
measures onto structural changes in the agricultural sector. The same applies for the impact of
agricultural policies on agricultural productivity and competitiveness (e.g. OECD, 2011). The
relative importance and the changes in support intensity can be these measurable elements in
order to identify the orientation the support policy is changing towards even if the Second and
Third Pillars’ support remains relatively modest compares to that of the First Pillar (e.g. Dwyer
et al., 2007) and its suitability for Central and Eastern countries is under discussion itself. It is
perceived that direct support being relatively important compared to farm income generated in
the market (the case of Lithuania; e.g. Stonkute, 2013), it decreases the likelihood of farm
households to diversify into new, non-agricultural businesses or entering the labour market,
i.e. increases stagnation of the structure of rural economy (e.g. Gorton et al., 2009) decreases
like hood to reform (Jensen et al., 2009). While future of the rural development is rather
dependant on diversification into food and non-food production (e.g. Dammers and Keiner,
2006; Hodge, 2003), the importance of incentives being created under rural development
measures (the Second and Third Pillars‘ support) is increasing and needs to be analysed.
Research results and discussion
The comparative analysis of changes in economic policy incentives for encouraging
agricultural production during the periods of 2007-2013 and 2014-2020 in Lithuania focuses on
the economic policy incentives designed, planned and implemented under the Rural
Development programmes for Lithuania for the respective periods. The packages of measures
included into the Rural Development programmes are analysed and compared in order to
detect the main changes in intensity of economic policy incentives being created and
implemented (2007-2013) or being created and planned to be implemented (2014-2020)
during two periods.
The analysis starts with the analysis and definition of each measure in terms of its purpose
and comparative analysis of financial importance of each type of measure in the Rural
Development programmes for Lithuania for 2007-2013 and 2014-2020. The analysis of the
measures and their classification is based on the identification of producer (business entity)
oriented measures having direct impact on the producer’s productive assets, income (or

67
income foregone) or costs, general services (or common benefit) for agriculture, rural
development, and forestry oriented measures. The analysis and comparison of measures’
packages is made eliminating certain financial engagements (measures) having no analogies in
the programmes being compared. For that reason and having in mind that the Rural
Development programme for 2014-2020 is not approved by the European Commission,
differences in support amounts can be detected (other than official documents). The
classification made takes no account of the priorities and objectives being stated in the Rural
Development programmes as aims to be achieved by measures being planned, undertaken.
The analysis of support intensity changes is made taking into account structural changes in
agricultural sector (a structural approach) and in economic accounts of agriculture (an
economic approach) during the respective periods. The analysis is based on the comparison of
average planned support intensity during periods 2007-2013 and 2014-2020 in respect to
changes of structural indicators, such as utilized agricultural area (UAA), total number of
holdings, and annual working units (AWU), and economic indicators, such as agricultural
output, net fixed capital formation, and net value added. The data on UAA and total number of
holdings are data of annual UAA declaration reports (e.g. National Paying Agency, 2014) and
other data are data on agriculture from Eurostat (2014).
1. Comparison of rural development measures’ packages
There are rural development measures’ packages being planned under the Rural
Development programmes for Lithuania for the periods 2007-2013 and 2014-2020. These
measures are analyzed and classified according their purpose. The measures directly
oriented and making effect on agricultural producer (agricultural business entities)
productive assets, income (or income foregone) or costs are grouped into the package of
support for business entities (Table 1). There are two types of support for business entities:
support for investments and support in the form of compensations of additional costs and
income foregone. Investments in physical assets and support for farm and business
development (eligible for business development support are also non-agricultural
businesses in rural areas but can be undertaken by farmers as business diversification
strategy), are two measures aimed at investment support. Compensational support for
business entities can be allocated under measures of quality schemes, agro-environmental –
climate, organic farming, Natura 200 and Water Framework Directive payments, payments
to areas facing natural or other specific constrains and as partial compensation of insurance
premiums (risk management).
Measures of knowledge transfer and information actions, advisory services, support for
starting-up of producer groups and organizations, co-operation and national rural network is
classified as being measures of general interest for all agricultural and rural development
actors. Even if advisory services and knowledge transfer measures are targeting mostly

68
concrete agricultural producers, their impact on the economics of business entities remains
indirect. The development of basic services in rural areas and Leader are two measures
oriented towards development of rural infrastructure (small, social, broadband). Support for
forestry is allocated through one main measure of investments in forest area development
and improvement of the viability of forest.
For the purpose of the research only support for business entities is analysed in depth while
some broad analysis of other types of support is made just for the completeness and
argumentation of the main research objective.
Table 1
Comparison of rural development measures in Lithuania in the periods 2007-2013
and 2014-2020
Measures/ purpose of measure
2007-
2013 %
2014-
2020 %
Total 2226.6 100.0 1851.1 100.0
Support for business entities 1750.5 78.6 1404.4 75.9
Investment support 1027.5 46.1 852.1 46.0
Investments in physical assets 727.9 32.7 647.3 35.0
investments in agricultural holdings 464.6 20.9 429.2 23.2
Investments in processing, marketing,
and/or development of new products 148.0 6.6 111.9 6.0
investments into infrastructure 109.5 4.9 102.7 5.5
investments into non-productive assets
(agri-environmental, climate objectives) 5.9 0.3 3.5 0.2
Farm and business development 299.6 13.5 204.8 11.1
start-up aid for 0.0 0.0 0.0 0.0
for young farmers 87.5 3.9 64.7 3.5
for non-agricultural activities in rural
areas 0.0 0.0 34.8 1.9
for development of small farms 17.3 0.8 16.9 0.9
investments in creation and development
of non-agricultural activities 194.9 8.8 44.9 2.4
annual payments or one-off payments for
farmers eligible for small farmer scheme 0.0 0.0 0.0 0.0
biogas production development (from
agricultural waist) 0.0 0.0 43.4 2.3
Compensation of costs (additional cost) and
income foregone 723.0 32.5 552.4 29.8
Quality schemes for agricultural products,
and foodstuffs 2.3 0.1 4.2 0.2
Agro-environmental-climate 170.0 7.6 55.9 3.0
Organic farming 137.6 6.2 163.9 8.9
Natura 2000 and Water Framework
Directive payments 5.6 0.3 6.6 0.4
Payments to areas facing natural or other
specific constraints 370.4 16.6 287.0 15.5
Risk management 37.1 1.7 34.8 1.9
financial contributions to premiums 37.1 1.7 34.8 1.9
General services, common benefits for 38.4 1.7 58.4 3.2

69
agricultural sector
Knowledge transfer and information actions 24.4 1.1 23.4 1.3
Advisory services, farm management and
farm relief services 6.3 0.3 4.6 0.2
Starting-up of producers groups and
organizations 0.0 0.0 1.8 0.1
Co-operation 0.0 0.0 24.0 1.3
National rural network 7.7 0.3 4.6 0.3
Rural infrastructure 201.6 9.1 190.0 10.3
Basic services and village renewal in rural
areas 67.2 3.0 76.2 4.1
Leader 134.4 6.0 113.8 6.1
Support for forestry 145.5 6.5 122.4 6.6
Investments in forest are development and
improvement of the viability of forests 145.5 6.5 122.4 6.6
Technical support 90.7 4.1 75.9 4.1 Source: author’s construction and calculations based on data Rural Development Programme for Lithuania
2007-2013 (e.g. Ministry of Agriculture of the Republic of Lithuania, 2014), Lithuania - Rural Development
Programme for 2014-2020 (e.g. Ministry of Agriculture of the Republic of Lithuania, 2014), “Lietuvos
kaimo pletros 2014-2020 metu programos priemoniu pagrindines nuostatos“ (Main Concepts of the Rural
Development Programme’s 2014-2020 Measures) – background presentation prepared by the Ministry of
Agriculture of the Republic of Lithuania (e.g. Ministry of Agriculture of the Republic of Lithuania, 2014)
and Regulation (EU) No 1305/2013 of the European Parliament and of the Council of 17 December 2013
on support for rural development by the European Agricultural Fund for Rural Development (EAFRD and
repealing Council Regulation (EC) No 1698/2005 (e.g. European Parliament and the Council, 2013).
The total support amount under the Rural Development programme for 2014-2020 is lower
than that for 2007-2013 (Table 1). The total support for the period 2007-2013 was EUR
2227 million and for the period 2014-2020 is planned – EUR 1851 million or 17% lower. The
structure of the allocation of support remains rather similar during these two periods, i.e.
support for producers (agricultural business entities) accounted for 78.6% of all support
(EUR 1750.5 million) during 2007-2013 and it will remain dominant support purpose in
2014-2020 (75.9% of total support or EUR 1404.4 million). Support for general services,
common benefits for agriculture (or that with no direct link to productive assets, income or
costs of the particular producers) as economic sector accounted for 1.7% of total support
(EUR 38.4 million) in the period 2007-2013 and will account 3.2% of total support (or EUR
58.4 million) in the period 2014-2020. The amount of support for rural infrastructure (small,
broadband, social) remain rather stable and accounts for 9.1% of total support (EUR 201.6
million) in the period 2007-2013 and 10.3% (EUR 190.0 million) in the period 2014-2020.
The same importance in the Rural Development programme is put on support for forestry
during two periods with marginal difference in its share (6.5% of total support in the period
2007-2013 or EUR 145.5 million and 6.6% in the period 2014-2020 or EUR 122.4 million).
Even if the support for technical administration of the Rural Development programmes’
implementation will be lower in the period 2014-2020 (EUR 75.9 million) than in the period

70
2013-2020 (EUR 90.7 million), the importance of it remains the same in both periods (4.1%
of total support in periods 2007-2013 and 2014-2020).
Investment support remains dominant support in the package of support for business
entities. It accounted for 58.75 of total support (EUR 1027.5 million) for business entities in
the period 2007-2013 and will account for 60.7% (EUR 852.1 million) of total support in the
period 2014-2020 while compensational support respectively 41.3% (EUR 723.0 million)
and 39.3% (EUR 552.4 million) of total support. The importance of investments into
physical assets, even if the support in EUR is lower, is higher in the period 2014-2020. The
investments into physical assets accounts for 76.0% (EUR 647.3 million) of total investment
support in the period of 2014-2020, while in the period 2007-2013 it accounts for 70.8%
(EUR 727.9 million) of total investment support. More than a half of investments in physical
assets were investments in agricultural holdings in the period 2007-2013 (EUR 464.6
million). The same is true for in the period 2014-2020 (EUR 429.2 million). Support for farm
and business development accounted for 29.2% (EUR 299.6 million) in the period 2007-
2013 and will reach 24.0% (EUR 204.8 million) in the period 2014-2020 of total investment
support for business entities.
Payments to areas facing natural or other specific constrains remain the main
compensational measure and they accounted in the period 2007-2013 and they will account
in the period 2014-2020 more than a half of all compensational support (respectively 51.2%
or EUR 370.4 million and 52.0% or EUR 287.0 million). Support for organic farming is
becoming more important and in the period 2014-2020 it will account for 29.7% (EUR 163.9
million) of total compensational support where it accounted for 19.0% (EUR 137.6 million)
in the period 2007-2013. Measures to support agro-environmental – climate objectives of
the European Union agricultural policy remain of rather limited importance and their share
decreases in the period 2014-2020 (10.1% or EUR 55.9 million) compared to the period
2007-2013 (23.5% or EUR 170.0 million).
Even if the total amount of support for rural development and business entities is
decreasing in the period 2014-2020 compared to the period 2007-2013, the structure of the
support remains rather the same preserving broadly the same policy orientation.
2. Support intensity: a structural approach
In order to scale the changes of support for business entities in the period 2014-2020
compared to the period 2007-2013, the average planned support intensity during the
respective period is compared in respect to changes of structural indicators. For that purpose,
averages of total annual support for business entities, investment support and compensational
support are calculated by dividing the respective amounts of support for the periods by the
duration of these periods in years (7 years). The average of total annual support for business
entities, investment support and compensational support in the period 2007-2013 is,

71
respectively, EUR 250.1 million, EUR 146.8 million, and EUR 103.3 million. In the period 2014-
2020 these support measures accounted for, respectively, EUR 200.6 million, EUR 121.7
million, and EUR 78.9 million.
The average numbers of UAA, holdings and AWU were calculated finding the arithmetical
average of respective numbers in the period 2007-2013 for the analysis of support in the
period 2007-2013 and in the period 2012-2014 for the analysis of support in the period 2014-
2020. The average area of UAA for the calculations of support intensity in the respective
periods is 2693.6 thousand ha for the period 2007-2013 and 2772.9 thousand ha for the
period 2014-2020. Analogically, the average number of holdings and the average number of
AWU were found. The average number of holding is 171.9 thousand for the period 2007-2013
and 149.2 thousand for the period 2014-2020. The average number of AWU is 147.5 thousand
for the period 2007-2013 and 145.7 thousand for the period 2014-2020.
Table 2
Average support intensity for business entities per ha of UAA
EUR/ha 2007-2013 2014-2020 2007-2013 2014-2020
Support for business entities 92.8 72.4 100.0 77.9
Investment support 54.5 43.9 100.0 80.6
Compensational support 38.3 28.5 100.0 74.2 Source: author’s calculations based on agricultural structural (on UAA) statistics for Lithuania (e.g.
National Paying Agency, 2014) and data generated in Table 1.
The support for business entities, investment support and compensational support per
hectare of UAA in the period 2007-2013 was higher than that it is planned to be in the period
2014-2020. In the period 2007-2013 the total support for business entities amounted to 92.8
EUR/ha of UAA where in the period 2014-2020 it will be some 22.1% lower and will amount to
72.4 EUR/ha (Table 2). Relatively smaller decrease is observed in investment support (by
19.4%) than in compensational support.
Table 3
Average support intensity for business entities per holding
EUR/holding 2007-2013 2014-2020 2007-2013 2014-2020
Support for business entities 1454.7 1344.5 100.0 92.4
Investment support 853.9 815.8 100.0 95.5
Compensational support 600.8 528.9 100.0 88.0 Source: author’s calculations based on agricultural structural (on number of holdings) statistics for
Lithuania (e.g. National Paying Agency, 2014) and data generated in Table 1.
The average support intensity per holding, as number of holdings is decreasing, will
decrease just slightly in the period 2014-2020 compared to the period 2007-2013. The
average support for business entities per holding will be 1344.5 EUR/holding in the period
2014-2020 and it will account for 92.4% of the average support in the period 2007-2013

72
(Table 3). The average investment support per holding was 853.9 EUR/holding in the period
2007-2013 and it will be EUR 815.8 million in the period 2014-20120.
Table 4
Average support intensity for business entities per AWU
EUR/AWU 2007-2013 2014-2020 2007-2013 2014-2020
Support for business entities 1695.6 1376.7 100.0 81.2
Investment support 995.3 835.3 100.0 83.9
Compensational support 700.3 541.5 100.0 77.3 Source: author’s calculations based on agricultural labour statistics for Lithuania (e.g. Eurostat, 2014) and
data generated in Table 1.
As total amount of support for business entities is decreasing and the average AWU in the
respective periods is rather similar, the decrease in support effects the most the decrease in
support per AWU (Table 4). The average support for business entities per AWU was 1695.6
EUR/AWU in the period 2007-2013 and it will be 1376.7 EUR/AWU in the period 2014-2020 (it
will account for 81.2% of the support per AWU in the period 2007-2013).
3. Support intensity: an economic approach
For the economic importance of the changes in support for business entities being planned
and foreseen in the Rural Development programmes for Lithuania, the average annual
amounts of agricultural output, net fixed capital formation and net value added were divided
by the average annual support amounts.
The average annual amounts of agricultural output, net fixed capital formation and net
value added were calculated by finding the arithmetical average of respective numbers in the
period 2007-2013 for the analysis of support in the period 2007-2013 and in the period 2012-
2014 for the analysis of support in the period 2014-2020. The average agricultural output is
EUR 2253.3 million for the period 2007-2013 and EUR 2635.6 million for the period 2014-
2020. Analogically, the average number of net fixed capital was found being EUR 126.7 million
and EUR 224.2 million holdings and the average number of net value added – EUR 601.4
million and EUR 769.2 million.
Table 5
Average support intensity for business entities in relation to agricultural output
Agricultural output per EUR 1 of support 2007-2013 2014-2020 2007-2013 2014-2020
Support for business entities 9.0 13.1 100.0 145.8
Investment support 15.4 21.7 100.0 141.0
Compensational support 21.8 33.4 100.0 153.1 Source: author’s calculations based on economic accounts for agriculture for Lithuania (e.g. Eurostat,
2014) and data generated in Table 1.
The average support intensity for business entities in relation to agricultural output is lower
in the period 2014-2020 compared to the period 2007-2013 (Table 5). If in the period 2007-

73
2013 EUR 1 of support for business entities was relative to EUR 9.0 of agricultural output, then
in the period 2014-2020 EUR 1 of support will be relative already to EUR 13.1 of agricultural
output. The intensity of support will decrease by 45.8% in the period 2014-2020 compared to
the period 2007-2013.
Table 6
Average support intensity for business entities in relation to net fixed capital
formation
Net fixed capital formation per EUR 1 of support 2007-2013 2014-2020 2007-2013 2014-2020
Support for business entities 0.5 1.1 100.0 220.5
Investment support 0.9 1.8 100.0 213.3
Compensational support 1.2 2.8 100.0 231.6 Source: author’s calculations based on economic accounts for agriculture for Lithuania (e.g. Eurostat,
2014) and data generated in Table 1.
The average support intensity for business entities in relation to net fixed capital formation
will decrease in the period 2014-2020 compared to the period 2007-2013 (Table 6). The EUR 1
of support for business entities was relative to EUR 0.5 of net fixed capital in the period 2007-
2013 and it will be relative to EUR 1.1 of net fixed capital in the period 2014-2020. The rather
sharp decrease in the average support intensity for business entities is linked to rather sharp
increase in average net fixed capital formation during the last three years (2012-2014).
Table 7
Average support intensity for business entities in relation to net value added
Net value added per EUR 1 of support 2007-2013 2014-2020 2007-2013 2014-2020
Support for business entities 2.4 3.8 100.0 159.4
Investment support 4.1 6.3 100.0 154.2
Compensational support 5.8 9.7 100.0 167.4 Source: author’s calculations based on economic accounts for agriculture for Lithuania (e.g. Eurostat,
2014) and data generated in Table 1.
The average support intensity for business entities in relation to net value added is
decreasing in the period 2014-2020 compared to the period 2007-2013 (Table 7). The average
net value added was EUR 2.4 per EUR 1 of support for business entities in the period 2007-
2013 and it will be some EUR 3.8 for each EUR 1 of support in the period 2014-2020. The
support intensity per net value added is decreasing and follows the patterns of the changes in
average support intensity per agricultural output.
The average support intensity per agricultural output, net fixed capital formation and net
value added is decreasing. The bigger decrease in average support intensity relative to net
fixed capital formation is due to the sharp increase in fixed capital formation during the last
three years as the last years of the period 2007-2013.

74
Conclusions, proposals, recommendations
The comparative analysis of support for business entities in the periods 2007-2013 and
2014-2020, done by comparing packages of relative measures being planned in the Rural
Development programmes for Lithuania, implies generation of these conclusions:
1. The rural development policy in the period 2014-2020 remains rather similar to that
being applied in the period 2007-2013 with dominant support for producers (business
entities) in the form of investment support and compensational support.
2. The investment support (investments into productive assets) remains the most
important support in the structure of the policy measures package, while the
importance of agro-environment oriented measures (sustainability oriented measures)
remains rather limited.
3. The support (in total amounts) and its intensity (relative to structural and economic
indicators of agricultural sector) for business entities in the form of investments and
compensational support in the period 2014-2020 are decreasing compared to the period
2007-2013.
4. The unchanging orientation of rural development policy with its decreasing intensity,
could decrease economic incentives for agricultural production; however, previously
high dependability on supports on products and decreasing intensity of supports for
producers could generate incentives to increase productivity in order to compensate
decreasing support intensity and to maintain the economic viability of business entities
and to help overcome the “subsidy trap” (e.g. Stonkute, 2013) being perceived in
Lithuania’s agriculture.
5. The decreasing intensity of structural support for business entities and decreasing
maximum amounts of investment support together could initiate some sort of
stagnation in structural changes of agricultural sector with still rather small average size
of holdings. In that case the policy creating incentives for high value added or
exceptional quality in order to overcome structural deficiencies to benefit from
economies of scale would be needed and that is rather limited.
Bibliography
1. Dammers, E. and Keiner, M. (2006). Rural Development in Europe. The Planning
Review, Volume 42, Issue 166, pp. 5-15.
2. Dwyer, J., Ward, N., Lowe, Ph., Baldock, D. (2007). European Rural Development under
the Common Agricultural Policy's ‘Second Pillar’: Institutional Conservatism and
Innovation. Regional Studies, Volume 41, Issue 7, pp. 873-888.
3. European Parliament and the Council (2013). Regulation (EU) No 1305/2013 of the
European Parliament and of the Council of 17 December 2013 on Support for Rural
Development by the European Agricultural Fund for Rural Development (EAFRD and

75
repealing Council Regulation (EC) No 1698/2005. Retrieved: http://eur-
lex.europa.eu/LexUriServ/LexUriServ.do?uri=OJ:L:2013:347:0487:0548:EN:PDF.
Access: 04.12.2014.
4. Eurostat (2014). Statistics on Economic Accounts for Agriculture, Agricultural Structural
and Labour Statistics for Lithuania. Retrieved:
http://ec.europa.eu/eurostat/data/database. Access: 08.12.2014.
5. Gorton, M., Hubbard, C., Hubbard, L. (2009). The Folly of European Union Policy
Transfer: Why the Common Agricultural Policy (CAP) Does Not Fit Central and Eastern
Europe. Regional Studies, Volume 43, Issue 10, pp. 1305-1317.
6. Hodge, I. (2003). Mainstreaming Rural Development Policy under the CAP: an English
Perspective. Journal of Environmental Policy & Planning, Volume 5, Issue 4, pp. 361-
378.
7. Jensen, M.S., Lind, K. M., and Zobbe, H. (2009). Enlargement of the European Union
and Agricultural Policy Reform. Journal of European Integration, Volume 31, Issue 3,
pp. 329-344.
8. Ministry of Agriculture of the Republic of Lithuania (2014). Lietuvos kaimo pletros 2014-
2020 metu programos priemoniu pagrindines nuostatos (Main Concepts of the Rural
Development Programme’s 2014-2020 Measures). Presentation. Retrieved:
http://www.zum.lt/zum/m/m_files/wfiles/file2609.pdf. Access: 04.12.2014.
9. Ministry of Agriculture of the Republic of Lithuania (2014). Lithuania – Rural
Development programme for 2014-2020. Retrieved:
http://www.zum.lt/index.php?2121927796. Access: 04.12.2014.
10. Ministry of Agriculture of the Republic of Lithuania (2014). Rural Development
Programme for Lithuania 2007-2013. Retrieved: http://www.zum.lt/index.php?-
1340171989. Access: 04.12.2014.
11. National Paying Agency (2014). Tiesiogines ismokos: statistika (Direct Payments:
Statistics). Retrieved: https://www.nma.lt/index.php/parama/tiesiogines-
ismokos/statistika/349. Access: 08.12.2014.
12. OECD (2011). Evaluation of agricultural policy reforms in European Union. OECD
Publishing. p. 104.
13. Stonkute, E. (2013). Comparative Analysis of Productivity Developments of Agricultural
Sector in Baltic States: Assessing the Impact of Subsidies on Products. Proceedings of
the Sixth international Scientific Conference “Rural Development 2013” (28-29
November 2013, Aleksandras Stulginskis University, Kaunas, Lithuania), Volume 6,
Book 1, pp. 622-627.

76
Proceedings of the 2015 International Conference “ECONOMIC SCIENCE FOR RURAL DEVELOPMENT” No37
Jelgava, LLU ESAF, 23-24 April 2015, pp. 76-85
CONDITION AND PROSPECTS OF DEVELOPMENT OF ORGANIC FARMING
IN THE EUROPEAN UNION
Adam Pawlewicz*, PhD
Department of Agrotechnology, Agricultural Production Management and Agribusiness,
University of Warmia and Mazury in Olsztyn, Poland
Abstract. In recent years, the policy of reducing negative human impact on the natural
environment and the fashion for eating high-quality food influenced the development of
organic farming. However, that organic crops in the world currently only cover approx. 0.9% of
agricultural land, mainly in developed countries. Europe, particularly the European Union
countries, besides the North America, is a leader in terms of both the area and the number of
farms, and the development of organic products market. The aim of the paper is to present
both the status of organic farming in the European Union in the years 2000–2012, and
synthetic prospects for the development by the year 2020. Information was analysed on the
organic farming i.e. the area and structure of organic crops, and the number of certified farms.
An analysis of the basic data concerning the level and rate of the development of organic
farming in the European Union confirmed an increase in the significance of this method of
agricultural production. As a result of the support under the CAP so far, both the number of
organic farms and the area of organic agricultural land have been on the increase.
Key words: organic agriculture, organic farming, European Union, economic development,
trends for a change
JEL code: Q10, Q11, Q13, Q18
Introduction
One of the most important trends in the last years in agricultural production is the demand
on the domestic and foreign markets for agricultural products produced within safe farming
practices that protect consumers' health and the environmental ecosystems. In this case, the
most promising farming system is organic farming which provides a crucial element of quality
– organic food products (Ciburiene J., 2014). Organic products differ from conventional
products with the fact that the first ones are exposed to significant restrictions in use of
pesticides and artificial fertilizers in crop production, use of antibiotics in cattle breeding, food
additives, processing aids, and other inputs as well as prohibition to use genetically modified
* Corresponding author. Tel.: +48895233313; fax: +48895233775. E-mail address: [email protected]

77
organisms (Grinberga-Zalite G. et al., 2013). This results in high production cost, which has a
significantly effect on the price level.
Organic system of agricultural production is a global process, and is found, although in
different dimensions, on all continents. In principle, all analyses and studies concerning the
possibilities for the development of organic farming in the world indicate that this is a constant
trend, and that the area of organic agricultural land is going to steadily increase in the years to
come (Brodzinska K., 2014). However, a very important factor in the development of organic
farming is the support of the development of organic methods of agricultural production,
coming from numerous countries. The number of operators applying the organic system of
agricultural production in the world in 2012 amounted to nearly 2 million, which represents
nearly 9-fold increase as compared to the year 2000 (with approx. 233 thousand). In turn, the
area of agricultural land under organic crops in the world in 2012 amounted to 37.5 million ha.
As compared to 2000, there has been a 2.5-fold increase in the area of land farmed under an
organic system. However, it should be noted that organic crops in the world currently only
cover approx. 0.9% of agricultural land, mainly in developed countries. Europe, particularly the
European Union countries, besides the North America, is a leader in terms of both the area and
the number of farms, and the development of organic products market. Unfortunately, demand
for such products is not the major factor stimulating the development of organic farming.
Another serious problem is the number of entities which are being converted exclusively due to
higher agro-environment payments, so-called “sofa farmers” (Dunn J.W., et al. 2014,
Pawlewicz A., 2014).
However, it should be borne in mind that the support of such a method of agricultural
production in the EU, as compared to the conventional one, is regarded as an activity
performed in the public interest, contributing to the conservation of the environment.
Therefore, the development of organic farming is closely linked to the theory of sustainable
development including the economic, social and environmental objectives. Consequently, not
only the organic products market but also the environmental aptitude of a particular region are
of importance (Pawlewicz A., Pawlewicz K., 2008).
The aim of the paper is to present both the status of organic farming in the European Union
in the years 2000–2012, and synthetic prospects for the development by the year 2020.
Information was analysed on the organic farming i.e. the area and structure of organic crops,
and the number of certified farms, based on the Eurostat* data supplemented with information
from yearbooks "The World of Organic Agriculture - Statistics and Emerging Trends" from the
years 2000–2014, published by the Research Institute of Organic Agriculture (FiBL) and the
International Federation of Organic Agriculture Movements (IFOAM)†, in horizontal (time) and
vertical (countries) arrangement. The study period included the available data from the years
2000–2012. The additional sources of information included both the documentation of
institutions supporting the development of agriculture, and the literature on the subject; they
* http://ec.europa.eu/eurostat/web/organic-farming † http://www.organic-world.net

78
allowed the obtained results to be properly interpreted and the correct conclusions to be
drawn.
In order to determine the anticipated future changes in the years 2014–2020, the
author applied the deductive reasoning method based on mathematical analysis of historical
data, literature on the subject, and source documents. The author used historical data for the
presentation of the trend in development using the linear regression method by estimating the
numerical value of the dependent variable y (response variable – numerical values of an
investigated phenomenon, e.g. the number of farms, the area of organic agricultural land)
based on the values of independent variables x (prediction of the dependent variable based on
the independent value, e.g. a year). Trend estimation for the dynamic series was determined
using a mathematical function: y = β0+β1x+ξ, where: β0 and β1 are structural parameters of
the regression function, and ξ denotes a random component. Parameter β0 in the linear
regression equation denotes the so-called absolute term, and parameter β1 is a regression
coefficient for variable y in relation to variable x. It corresponds to the slope of linear function,
and thus provides information on by how much the value of the dependent variable y will
change when the independent variable x changes by one unit. In the construction of a
synthetic model it was assumed that no significant changes to the existing legislation
concerning organic farming would take place, and that the aid amounts would remain at a
similar level, which would not affect the current level of prices of raw materials and processed
products. This allowed the impact of the random component ξ to be restricted. In order to
make certain of the validity of the adopted model of trend, it is necessary to specify the
determination coefficient (r2) which is a measure of the degree to which the model explains the
formation of variable y. The closer the value thereof is to 1, the better the fitting of the model
is.
Research results and discussion
The area under organic crops in the European Union in the years 2000–2012 was steadily
increasing. At the beginning of the period under analysis, the area concerned amounted to
nearly 4 million ha, and in 2012 it amounted to over 10 million ha. The trend as described on
the basis of the regression equation indicates that the average annual increase in the area
under organic farming amounted to over 507 thousand ha. Determination coefficient with a
value of 0.9858 indicates that the adopted model very well presents the course of the
phenomenon in the period under analysis. On this basis, it may be estimated that under
ceteris paribus conditions, the trend may continue and, by the year 2020, the area under
organic crops in the European Union may increase up to approx. 14 million ha (Figure 1). It
should be noted that in the years 2004–2012, the rate of growth was nearly five times higher
in the countries which entered the EU structures in 2004 as compared to the old fifteen
Member States (Facts and …, 2013). According to Runowski H. (2009b), in the old European
Union countries with the longest tradition of organic farming, the rate of development thereof
has been slowing down, and even speaking of stagnation and regress may be justified.

79
At the same time, with the increase in the area managed under the system of organic
farming, one may observe a steady increase in the proportion of organic crops to the total area
of agricultural land. In 2000, the value concerned amounted to 3%, and reached the level of
5.7% in 2012. In this period, a certain fluctuation may be observed. In the years 2004–2007,
a drop to the level of 3.6% occurred (Figure 1). This resulted from the accession of new states
in which the area under organic farming was small, and at the same time the area of
agricultural land was rather significant, to the EU structures. In accordance with the trend
being described by the regression equation, the average annual increase was 0.1937%, which
allowed the indication of a forecast according to which the value in question may amount to
nearly 7% in 2020. The determination coefficient was 0.8481, which also indicated a high
degree of the fitting of the model of trend to the course of this phenomenon.
Source: author’s construction based on: Organic Farming …, 2014; The World …, 2000 - 2014.
Fig. 1. Changes in the area under organic crops and the proportion of organic crops
to the area of agricultural land in the years 2000–2012, and a forecast for the period
until 2020 in the European Union
In terms of space, one may observe significant differences in the area under organic crops
in particular countries in the European Union, which are associated with the regional specificity
of agriculture. In 2012, the largest area under organic crops was found in Spain, and
amounted to nearly 1.6 million ha. In turn, in Italy the area concerned amounted to over
1.16 million ha. These countries were followed by Germany with 1.034 million ha, and France
with 1.032 million ha. It should be noted that Poland with 0.66 million ha was also included
among the states in which the area under organic crops was large, and was followed by Great
Britain with 0.55 million ha, Austria with 0.53 million ha, the Czech Republic with 0.49 million
ha, Sweden with 0.48 million ha, and Greece with 0.46 million ha (Figure 2).
The spatial differences in the proportion of organic crops to the total area of agricultural
land are somewhat different. This value is not correlated with the previously discussed

80
indicator, which means that it cannot be concluded that in the countries with a large area
under organic crops, one may observe, at the same time, a significant proportion of these
crops to the agricultural land in a given country, and vice versa. In the European Union in
2012, the highest level of the indicator under analysis was found in Austria, and accounted for
nearly a fifth of the area of agricultural land in that country. A high value was also noted in
Sweden (15.6%), and in Estonia (15.3%). However, in the latter country, the absolute value
of the area under organic crops was small, and in 2012 amounted to over 144 thousand ha. In
the Czech Republic and Latvia, one may also observe a rather high level of the indicator being
discussed, namely 11.5% and 10.8%, respectively. Another country which stands out is Italy
where, in turn, there is a large absolute area, and the relative value amounted to over 9%
(Figure 2). The detailed changes for each country has been discussed by K. Brodzinska (2014).
Source: author’s construction based on Organic Farming …, 2014; The World …, 2000 - 2014
Fig. 2. The area of organic agricultural land (ha), and the proportion of the area of
organic agricultural land to the total agricultural area (%) in the European Union
countries in 2012
The number of organic farms in the period under analysis was increasing rapidly as well. In
2000, records included over 130 thousand registered operators. After the initial increase in
2001 when the number amounted to 143 thousand, there was a short-lived decline which
lasted until 2003, when 135 thousand farms one could observe. In 2004, there was another
increase in the number of registered operators up to 153 thousand. This was due to the
accession of new countries to the European Union, and the beginning of the implementation of
financial support for agriculture and rural areas of those states. This resulted in, inter alia, an
increase in the interest in organic farming, since the aid to the area under organic crops is
considerably larger, particularly in the new EU countries. In 2012, over 267 thousand
registered operators were recorded (Figure 3), which accounted for over two-fold increase as
compared to the year 2000.

81
An increase in the number of farms, as described using the regression equation, is
presented in Figure 3. Determination coefficient with a value of 0.9602 indicates that the
adopted model well describes the course of the phenomenon in the period of 2000–2012. It
can be noticed that, on average, year after year, the number of operators in question was
increasing by over 11.4 thousand. On this basis, it may be assumed that under ceteris paribus
conditions, the number of organic farms in the European Union may increase up to nearly
350 thousand operators by the year 2020 (Figure 3). However, as Runowski H. (2009a) points
out, there are numerous reasons for changes over time in the number of operators that
produce using organic methods. The most important ones include differences in the economic
effectiveness of organic production between countries, as compared to the conventional
production. In the countries where organic production ensures incomes being either lower or
comparable to the conventional production, there is a decrease in the interest in the
development thereof, while in the countries in which this advantage is clear, an increase
therein occurs. It follows from this that the main objectives of organic farming and an increase
in the economic effectiveness of organic farming may be primarily achieved by means of
incentive aid and intervention of the State.
Source: author’s construction based on: Organic Farming …, 2014; The World …, 2000 - 2014
Fig. 3.The trend for a change in the number of organic farms and the average area
of a farm (ha) in the years 2000–2012, and a forecast for the period until 2020 in the
European Union
Figure 3 presents changes in the average size of an organic farm in the European Union
during the study period. It should be noted that in particular years, the value concerned was
characterised by significant fluctuations. In 2000, it amounted to approx. 30 ha, and in 2012 it
reached a value higher by only 7 ha. The trend is not unambiguous, since one may observe
both significant increases, e.g. in 2001 or 2003, and declines, e.g. in 2002, in the years 2004–
2006, and in 2011. However, a statistical analysis indicates that in the period discussed, the

82
average increase was 0.5034 ha per annum. The determination coefficient was not as high as
for previous analyses, and indicated, with a value of 0.5171, that the fitting of the model is
merely satisfactory. It follows from this that in 2020, the average area of a farm may oscillate
around 44 ha, which is an increase in relation to 2012 by only 16%.
In particular European Union countries, in 2012, the number of operators involved in
organic crop production was greatly varied. Most registered organic farms may be found in
Italy, with over 43 thousand, and in Spain, with 30 thousand. These countries are followed by
a country newly accessed in 2004, i.e. Poland, with nearly 26 thousand operators. Next
countries are France– 24.4 thousand, Greece – 23.4 thousand, Germany – 23 thousand, and
Austria – 21.8 thousand (Figure 4).
In 2012, an average area of an organic farm in the European Union was 39.44 ha. The
differences between countries are presented in Fig. 4. It should be noted that, after an analysis
of this indicator in particular European Union states, the value concerned differed considerably
for Slovakia, and amounted to 456.11 ha. A high level of the indicator in question was also
noted in the Great Britain with 137.82 ha, the Czech Republic with 124.21 ha, Estonia
with97.53 ha, Sweden with 85.29 ha, and Hungary with83.72 ha (Fig 4).
Source: author’s construction based on Organic Farming …, 2014; The World …, 2000 - 2014
Fig. 4. The number of organic farms and the average area of an organic farm (ha)
in particular countries of the European Union in 2012
In the surface structure for the main organic agricultural land, permanent crops slightly
prevail, particularly in the countries in which organic animals’ production, especially production
of milk, is developing (e.g. Austria). In 2012, in the European Union countries, the area in
question accounted for 44% of the area under organic crops (more than 4.9 million ha). In
turn, the area under arable crops was slightly smaller i.e. accounted for 42% (4.7 million ha),
including mainly cereals (almost 2 million ha), green fodder (1.9 million ha), high protein crops
(0.24 million ha), oilseed crops (0.19 million ha), and vegetables (0.1 million ha). Perennial

83
crops covered the area of 10% (1.1 million ha), including primarily olives (0.46 million ha),
grapes (0.24 million ha), nuts (0.17 million ha), pip fruit, stone fruit and berries (0.12 million
ha) and citrus fruit (0.04 million ha).
The area under the main crops during the period of 2004–2012 was steadily increasing. In
2004, the area under permanent pasture amounted to 3.1 million ha, and reached the value of
4.7 million ha in 2012. The average annual rate of increase in the area, described using the
regression equation, amounted in this case to 0.09 million ha, with the determination
coefficient of r2=0.9439. On this basis, it may be assumed that under ceteris paribus
conditions, the area in question may increase to as much as 7.04 million ha by the year 2020.
A similar trend may be observed for field crops. In 2004, the area in question amounted to
2.2 million ha, and increased more than two-fold in 2012. An analysis of the rate of change,
based on the regression equation, indicates that the average annual increase amounted to 0.3
million ha, with the determination coefficient of r2=0.9890, which shows that more than 98%
of the variance of the response variable (the area under field crops) has been explained by the
model. Therefore, the area in question may increase to as much as 7.07 million ha by the year
2020. The prospects of changes in the area under perennial crops are analogous. In 2004, the
area in question amounted to 0.5 million ha, and increased by over 100% in 2012. The
regression equation indicates annual changes by approx. 0.09 million ha. In turn,
determination coefficient equal to 0.9516 indicates a well-described model, based on which it
can be concluded that in 2020, the area under perennial crops may cover nearly 2 million ha
(Figure 5).
Source: author’s construction based on Organic Farming …, 2014; The World …, 2000 - 2014
Fig. 5. Trends for the area under the main organic crops in the years 2004–2012,
and a forecast for the period until 2020 in the European Union (ha)
The proportion of permanent pasture to the area under organic crops in the years 2004–
2007 ranged from 3.1 through 3.0to 3.3 million ha. At the same time, rapid increase in the

84
area under field crops from 2.3 to 3.2 million ha could be observed during that period. The
area under perennial crops also changed during that period from 0.5 to 0.7 million ha. In turn,
in the years 2008–2012, all crop types were characterised by a steady increase in their area.
What is significant is that the predominance of permanent pasture in relation to field crops is
getting smaller and smaller. In 2004, this difference amounted to approx. 0.9 million ha, and
reached the value of 0.2 million ha in 2012. According to the forecast based on a statistical
analysis, the trend is going to continue, and in 2020 a scenario is possible in which the area
under field crops is larger than the area under permanent pasture by approx. 0.03 million ha
(Figure 5).
Conclusions, proposals, recommendations
The conducted research into the trend for the development of organic farming in the
European Union allows the following conclusions to be drawn.
1. The area of organic agricultural land in the European Union in the years 2000–2012 was
steadily increasing from nearly 4 million ha to over 10 million ha. The area in question
increased annually by an average of over 507 thousand ha. Based on this trend, it may be
estimated that under ceteris paribus conditions, the area under organic crops in the European
Union may increase to as much as 14 million ha by the year 2020.
2. The number of organic farms in the period under analysis was increasing rapidly. In 2000,
over 130 thousand registered operators were recorded, and in 2012, records included as many
as over 267 thousand registered organic farms. In the years 2000–2012, the number of
certified agricultural operators was increasing annually by an average of 11.4 thousand. While
forecasting the development of organic farming by the year 2020, using the existing course of
the phenomenon in time, it may be assumed that there are going to be nearly 3 thousand of
them in the European Union.
3. An analysis of the basic data concerning the level and rate of the development of organic
farming in the European Union confirmed an increase in the significance of this method of
agricultural production in nearly all EU Member States. What deserves special attention is the
strong interest in this method of management among new EU members, particularly in Poland
and the Czech Republic. These states are characterised by both a large area under organic
crops and a large number of organic farms. This results in the level of concentration of organic
farming in the EU getting impaired. The previous dominance of Italy, Germany, Spain, Great
Britain and France in the development of this system of agricultural production over the other
countries has been on the decrease. The EU membership which guarantees both more stable
financial and legal conditions and new sales markets has resulted in the EU-12 states farmers’
evident increase in the interest in the conversion to management manner being consistent
with the organic farming criteria.
4. In the structure of areas under organic crops in the European Union, permanent pasture
accounted for 44%, and field crops for 42%, in which cereals (almost 2 million ha) and green

85
fodder (1.9 million ha) were predominant. It should be noted, however, that since 2000 the
predominance of permanent pasture has been getting smaller. While forecasting the
development of organic farming by the year 2020, using the existing course of the
phenomenon in time, it may be assumed that in the future it is the area under field crops that
is going to increase at the expense of permanent pasture, which may indicate an increase in
the plant and food commodity production resulting from an increase in demand.
Bibliography
1. Brodzinska, K. (2014). Rolnictwo ekologiczne – tendencje i kierunki zmian (Organic farming
– trends and directions of changes). Zeszyty Naukowe Szkoly Glownej Gospodarstwa
Wiejskiego w Warszawie Problemy Rolnictwa Swiatowego. Vol. 14 (XXIX), No. 3, pp. 27–
36.
2. Ciburiene, J. (2014). Organic agriculture for sustainable rural development: Lithuanian
case. Economic Science for Rural Development. Jelgava, Latvia University of Agriculture,
No. 36. pp. 51-57.
3. Dunn, J.W., Borawski, P., Pawlewicz, A. (2014). Development of organic farming in the
use. Acta Scientiarum Polonorum. Vol. 13 (3), pp. 55-68.
4. Facts and figures on organic agriculture in the European Union. Agricultural and Rural
Development. European Commission. October 2013. p. 45.
5. Grinberga-Zalite, G., Liepa. E., Avotina, A. (2013). Role of social marketing in maintaining
the balance between satisfaction of immediate and long-term needs in the context of food
consumption. Economic Science for Rural Development. Jelgava, Latvia University of
Agriculture, No. 32, pp. 152-157.
6. Nieberg, H., Offermann, F., Zander, K. (2007). Organic farms in a changing policy
environment: impacts of support payments, EU-enlargement and Luxembourg reform.
Organic Farming in Europe: Economics and Policy. Vol. 13 Universität Hohenheim, Institut
für Landwirtschaftliche Betriebslehre. p. 234.
7. Organic Farming Database. Eurostat. Retrieved: http://ec.europa.eu/eurostat/web/organic-
farming/database. Access: 12.12.2014
8. Pawlewicz, A. (2014). Importance of horizontal integration in organic farming. Economic
Science for Rural Development.Jelgava, Latvia University of Agriculture, No. 34. 2014. pp.
112-120.
9. Pawlewicz, A., Pawlewicz, K. (2008). Zroznicowanie przestrzenne produkcji ekologicznej w
Polsce (Spatial differentiation of organic agricultural production in Poland). Zeszyty
Naukowe Szkoly Glownej Gospodarstwa Wiejskiego w Warszawie. Problemy Rolnictwa
Swiatowego. No.05(20), pp.109-115.
10. Runowski H. (2009a). Ekonomiczne aspekty ekologicznej produkcji mleka (Economic
aspects of organic milk production). Roczniki Nauk Rolniczych, Seria G, Vol. 96, Issue 1,
pp. 36–51.
11. Runowski H. (2009b). Rolnictwo ekologiczne – rozwoj czy regres? (Organic Farming –
Progress or Regress?). Roczniki Nauk Rolniczych, Seria G, Vol. 96, Issue 4, pp. 182-193.
12. The World of Organic Agriculture - Statistics and Emerging Trends (Yearbooks from the
years 2000 – 2014), published by the Research Institute of Organic Agriculture (FiBL) and
the International Federation of Organic Agriculture Movements (IFOAM).

86
Proceedings of the 2015 International Conference “ECONOMIC SCIENCE FOR RURAL DEVELOPMENT” No37
Jelgava, LLU ESAF, 23-24 April 2015, pp. 86-93
ECONOMIC RESULTS OF SHEEP FARMS IN POLAND
Tomasz Rokicki*, PhD
Warsaw University of Life Sciences
Abstract. The aim of this paper was to present economic performance of farms engaged in
sheep production. The research was conducted at 11 farms in the Province of Lublin in 2012.
The detailed aim of this study was to compare the productivity per 1 ha of AL and per PLN 1
direct costs on farms. Area of the farm did not affect the generated incomes. The performed
analyses confirm close relationship between the economic performance, the value of the farm
buildings and the value of machinery and equipment. The farm income was negative in two
farms with a loss of PLN 164 and PLN 306 per 1 ha of AL; whereas, the top farm generated
PLN 3717 income per 1 ha of AL.
Key words: sheep production, gross margin, breeding profitability
JEL code: D-24
Introduction
Historical records highlighted the importance of sheep farming which provided meat, wool,
milk and skins. In Poland, only in the 1980s, the sheep population was 5 million (Niznikowski
R., 1994). Lowering demand for sheep-farming products in the second half of 1980s and in the
first half of 1990s of the twentieth century was the reason for a drastic sheep livestock
population drop. Such changes resulted in lowering sheep-farming production profitability.
Wool prices fell down and overproduction of this product was a worldwide phenomenon
(Klepacki B., 2005). However, the economic reforms that took place in Poland influenced the
sheep husbandry sector (Nowoczesny …, 2005). Polish wool had no chance to compete with
the cheaper and better quality raw material from countries where production conditions were
much more advantageous. Inflation and rising costs of production resources, as well as lack of
financial liquidity resulted in liquidation of many sheep herds (Poradnik …, 2005).
Due to interrelations between the farming sector and the national economy, the
development of farms is influenced by social and economic conditions of an area.
Unfortunately, the free market mechanisms supporting flow of capital to the most efficient
areas of economy gave rise to developmental problems in the agricultural sector, including
farms. Therefore, both the government and local authorities need to take some action
(Wozniak M., 2008). The rules of market economy introduced to the agricultural farm sector
displayed negative effects on the market which was totally unprepared for competition (Goraj
* Corresponding author. E-mail address: [email protected]

87
L., 2005, Baran J., Zak J., 2014). In accordance with the concept of Pareto efficiency, the
sheep product market functions properly (Gołasa P., Lenort R., Wysokinski M., Baran J.,
Bienkowska-Gołasa W., 2014). At that time, we could observe a dominant trend in meat
production, while wool lost its importance (Rokicki T., 2005). Upon joining the EU structures,
Poland became part of the single European market. The opportunity to reach a greater number
of consumers was accompanied by fears related to increased competition. All entities operating
on the market were forced to adopt EU requirements and legal regulations (Gorna J., 2009).
The farming sector requires state intervention. In highly developed countries, agricultural
producers are subsidised and domestic markets are protected against import. Yet,
governments are abandoning market support to farmers, in favour of direct subventions
(Poczta-Wajda A., 2009). Poland’s accession to the European Union changed farming
conditions. The Biological Progress Fund ceased to provide support to sheep-farming
production. Instead, farmers could take advantage of direct payments or agricultural and
environmental payments. Incomes and costs generated in sheep-farming production were
subject to change. Therefore, factors which affected sheep-farming production profitability in
Poland at the beginning of the twenty-first century need to be determined (Rokicki T., 2007).
At the beginning of the 21st century, sheep production in Poland is commonly regarded as a
branch complementary to other agricultural activities, and the production scale depends
primarily on resources of bulky feeds (Rokicki T., 2008).
The studies on sheep farming profitability conducted at the beginning of the 21st century
showed its dependence on the lamb sale and the level of subsidy granted. The total cost was
dominated by feed costs (Klepacki B., Rokicki T., 2006). Besides, researchers established that
in order to reach profitability in sheep farming, farmers had to maintain breeding herds of
definitely larger sizes than those in the 1980s and in the first half of the 1990s. Economic
effectiveness in sheep farming depended on a number of factors (Klepacki B., 2005, Rokicki T.,
2004b). The activity of agribusiness companies is influenced by a number of macroeconomic
and microeconomic factors (Rokicki T., 2013).
The aim of this paper was to present economic performance of farms engaged in sheep
production. The research was conducted at farms in the Province of Lublin. The detailed aim of
this study was to compare productivity per 1 ha of AL and PLN 1 direct costs on farms. The
objective of the author was to confirm the relationship between the area of the farm and its
productivity. Farm owners were interviewed (a structured interview) in order to obtain
information on farm resources. Economic performance was determined on the basis of the crop
calendar. Sheep farm owners maintained financial records relevant to their payments and
payouts throughout 2012, i.e. from 1st January to 31st December. In these agricultural
enterprises, the data were presented in the form of tables, graphic representation, and
descriptive or economic calculation. The results calculated on the basis of the data refer to
2012. The studies involved 11 farms – sheep enterprises. The farm with the best income had
15.66 ha of AL, the worst only 7.45 ha of AL, and the "standard" farm 19.07 ha of AL. The

88
data were presented using descriptive, tabular and graphic methods, as well as correlation
coefficient methods.
Research results
In the study, the following profit and loss categories were applied: sales revenues, gross
margin, gross value added, net value added, net farm income, family farm income, rural family
income (personal income). Positive economic effects were obtained in most sheep breeding
enterprises (Table 1). Only two farms made a loss.
Besides, the farms earned their income from other off-farm sources as the personal income
amounted to PLN 25 400. The sheep farm with the best results had an income of PLN 58 210,
and notably, the sheep farm household was its sole source of income. The farm with the
poorest performance made a loss of PLN 2 280. Two farms, of a total of 11 farms subject to
the study, made a loss. The negative effects were attributable to deduction of cost of annual
depreciation from the revenues obtained. The farm with the best income received PLN 16.9
thousand of direct payment, and the farm with the lowest income - only PLN 3.7 thousand.
Table 1.
Economic results of sheep enterprises subject to the study
Farm
Code
Farm
area
(ha of
AL)
Economic results of farms (PLN)
Gross
margin
Gross
value
added
Net value
added
Net farm
income
Family
farm
income
Rural
family
income
1 15.66 102964 69660 58210 58210 58210 58210
2 35.70 38980 25462 22050 22050 15350 15350
3 8.22 22016 11293 -1352 -1352 -1352 -1352
4 7.45 8552 1843 -2280 -2280 -2280 -2280
5 38.56 40280 12130 10430 3670 -4080 17924
6 13.82 35540 15050 11200 11200 11200 11200
7 12.75 15640 8980 2005 2005 2005 14305
8 25.64 61813 44970 40270 39470 58670 58670
9 23.53 58910 35800 34800 26960 45560 45560
10 9.21 17859 8099 8099 6844 6844 6844
11 19.23 66507 52826 52826 52826 55286 55286
Source: author’s own research
The researched farms were differentiated in terms of potential, land resources and cost
level. One of the modes of comparison of farms is to find a common reference. Gross margin
was presented per 1 ha of AL (arable land). The farm with the best results earned nearly 3-fold
higher direct surplus per 1 ha of AL as compared to the medium one (Figure 1). The farm with
the lowest performance made a gross margin of PLN 1045 per 1 ha of AL. There were large
differences between farms in the level of gross margin. The resulting correlation coefficient
between the gross margin per 1 ha of AL and the farm building value was moderate and
amounted to 0.62 (p=0.00). The correlation between gross margin per 1 ha of AL and the

89
value of machinery and equipment (correlation r = 0.27, p=0.00) and the number of
conversion hectares in farms (r = 0.24, p=0.00) was insignificant.
0
1000
2000
3000
4000
5000
6000
7000
1 2 3 4 5 6 7 8 9 10 11
PL
N p
er
1 h
a A
L
farms code
Source: author’s own research
Fig. 1. Gross margin per 1 ha of AL in sheep farms
The income of the farm with the best results, per 1 ha of AL, amounted to PLN 3717
(Figure 2). The income of the most profitable farm, per 1 ha of AL, was over 3 times higher
than the average, whereas the farm with the poorest performance made a loss of minus PLN
306 per 1 ha of AL. Only two farms incurred losses. Half the farms faced a very difficult
situation. The correlation coefficient between the net farm income per 1 ha of AL and the
number of conversion hectares in farms amounted to 0.55 (p=0.00). The strength of the
impact was moderate. There was an insignificant relationship between income per 1 ha of AL
and the farm building value (correlation r = 0.36, p=0.00), and the value of machinery and
equipment in farms (r= 0.27, p=0.00).
-1000
-500
0
500
1000
1500
2000
2500
3000
3500
4000
1 2 3 4 5 6 7 8 9 10 11
Farms code
PL
N p
er
1 h
a A
L
Source: author’s own research
Fig. 2. Net farm income per 1 ha of AL in sheep companies
The microeconomic approach to efficiency is linked to the individual enterprise and defined
as the relation between the effects obtained by a particular economic operator and its input
(Lenort R., Baran J., Wysokinski M., 2014). The larger value of productivity indexes is

90
indicative of higher efficiency of a particular economic entity (Wysokinski M., Baran J., Gołasa
P., Lenort R., 2014). The revenues and direct surplus related to direct costs determine
productivity of the direct operating expenses incurred. On average, PLN 1 direct costs
generated PLN 5.28 revenues (Figure 3). The best farm had revenues of PLN 11.20 per PLN 1
direct costs, and the worst - PLN 3.27 per PLN 1 direct costs. The differences in the results
were significant. The resulting correlation coefficient between the revenues per PLN 1 direct
costs and the value of machinery and equipment in farms was strong and amounted to 0.84
(p=0.00). There was an insignificant relationship between revenues per PLN 1 direct costs and
the number of conversion hectares in farms (correlation 0.46, p=0.00), and the farm building
value (0.37, p=0.00).
0,00
2,00
4,00
6,00
8,00
10,00
12,00
1 2 3 4 5 6 7 8 9 10 11
farms code
PL
N p
er
1 P
LN
dir
ec
t c
os
ts
Source: author’s own research
Fig. 3. Revenues per PLN 1 direct costs in sheep enterprises
On average, PLN 1 direct costs generated PLN 4.24 gross margin (Figure 4). The most
effective sheep farm obtained as much as 10.20 direct surplus from PLN 1 of direct operating
expenses, while the most ineffective farm generated a gross margin of PLN 2.27 from PLN 1 of
direct costs.
0,00
2,00
4,00
6,00
8,00
10,00
12,00
1 2 3 4 5 6 7 8 9 10 11
farms code
PL
N p
er
1 P
LN
dir
ect
co
sts
Source: results of own research.
Fig. 4. Gross margin per PLN 1 of direct costs in sheep enterprises

91
Correlation coefficients for gross margin per PLN 1 of direct costs were at a similar level as
in the case of revenue per PLN 1 of direct costs. There was a weak link between the level of
the gross margin per PLN 1 of direct costs and the land area of farms (correlation 0.26,
p=0.00) and the value of the basic herd of sheep (-0.27, p=0.00).
Conclusions
1. The bigger the area of the farm, the better results were obtained per 1 ha of AL or PLN 1 of
direct costs. This regularity has been confirmed in most of the farms subject to the study.
The data presented in the graphic form demonstrated a disproportion in productivity of the
studied farms. The productivity per 1 ha of AL and PLN 1 of direct costs depends on several
factors.
2. The calculated correlation coefficients showed a strong interrelationship between economic
performance and potential of farms, such as the value of the farm buildings and the value
of machinery and equipment. The effect of the number of conversion hectares was
moderate, and the effect of the land area of the farm and the value of the basic herd of
sheep was quite insignificant.
3. The sheep farm with the best results earned an income of PLN 58 210 . The one with the
poorest results made a loss of PLN 2 280. Two farms, of a total of 11 farms subject to the
study, made a loss. Two farms incurred losses: PLN 164 and PLN 306 per 1 ha of AL
respectively; whereas the top farm generated an income of PLN 3717 . The negative results
were attributable to deduction of cost of annual depreciation from the revenues obtained.
The farm with the highest income received direct payments in the amount of PLN 16.9
thousand, and the one with the poorest result – only PLN 3.7 thousand.
Bibliography
1. Baran, J. Zak, J. (2014). Multiple Criteria Evaluation of Transportation Performance for
Selected Agribusiness Companies. Procedia - Social and Behavioural Sciences, Volume
111, pp. 320 – 329.
2. Gołasa, P., Lenort, R., Wysokinski, M., Baran, J., Bienkowska-Gołasa, W. (2014).
Concentration of Greenhouse Gas Emissions in the European Union. In Metal 2014:
23th International Conference on Metallurgy and Materials. Ostrava: TANGER, 2014, pp.
1691-1696.
3. Goraj, L. (2005). Ekonomiczno-rynkowe uwarunkowania przekształcen w sektorze
indywidualnych gospodarstw rolnych (Economic and Market Conditions in the
Transformation of Individual Farms). Wies i Rolnictwo, no. 4, pp. 34.
4. Gorna, J. (2009). Konkurencyjnosc przedsiebiorstw przemysłu miesnego i
mleczarskiego na terenie Wielkopolski w aspekcie spełnienia wymagan prawa
zywnosciowego Unii Europejskiej (Competitiveness of Enterprises Dairy and Meat
Industry in Wielkopolska in Terms of Meeting the Requirements of Food Law of the
European Union). Problemy Rolnictwa Swiatowego, vol. 7, pp. 5-12.
5. Klepacki, B. (2005). Prowadzenie efektywnych gospodarstw owczarskich po
przystapieniu Polski do Unii Europejskiej (Conducting Effective Sheep Farms After the

92
Polish Accession to the European Union). Poradnik dla producentow jagniat rzeznych.
ed. Niznikowski R., TWIGGER, Warsaw, pp. 50.
6. Klepacki, B., Rokicki, T. (2006). Prowadzenie efektywnych gospodarstw owczarskich po
przystapieniu Polski do UE [W:] Technologie produkcji owczarskiej (Conducting Effective
Sheep Breeding Farms After the Polish Accession to the EU [In:] Sheep Production
Technologies). Polskie Towarzystwo Zootechniczne, Warsaw, pp. 53-63.
7. Lenort, R., Baran, J., Wysokinski, M. (2014). Application of Data Envelopment Analysis
to Measure the Efficiency of the Metal Production Sector in Europe. In Metal 2014: 23th
International Conference on Metallurgy and Materials. Ostrava: TANGER, 2014, pp.
1795-1802.
8. Niznikowski, R. (1994). Chow owiec (Sheep Farming). PWRiL, Warsaw, pp. 4-8.
9. Nowoczesny chow i hodowla zwierzat gospodarskich (Modern Breeding and Raising of
Livestock). (2005). Instytut Genetyki i Hodowli Zwierzat PAN, Jastrzebiec, pp. 295.
10. Poczta-Wajda, A. (2009). Zjawisko paradoksu rozwojowego w polityce rolnej (Paradox
Phenomenon in Agricultural Policy Development). Roczniki Naukowe SERIA, vol. XI,
book 2, pp. 200.
11. Poradnik producenta jagniat rzeznych (Guidance for Manufacturer of Slaughter Lambs).
(2005). ed. Niznikowski R. TWIGGER Conferences Ltd., Warsaw, pp. 151-154.
12. Rokicki, T. (2004) Produkcja jagniat szansa dla gospodarstw? (Production of Lambs as
an Opportunity for Farms). Top Agrar Polska, No. 7-8/2004, Polskie Wydawnictwo
Rolnicze, Poznan, pp. 48-51.
13. Rokicki, T. (2005): Gospodarstwa owczarskie w okresie po transformacji gospodarczej.
[W:] Procesy przystosowawcze przedsiebiorstw agrobiznesu do gospodarki rynkowej
(Sheep Farms During the Economic Transformation. [In:] Agribusiness Enterprises
Adaptation Processes to a Market Economy). Wies Jutra, Warsaw, pp. 216-220.
14. Rokicki, T. (2008): Produkcja owczarska jako szansa gospodarstw z przewaga trwałych
uzytkow zielonych (Sheep Production as an Opportunity for Households with a
Predominance of Permanent Grassland). Wies Jutra 11(124), pp. 25-26.
15. Rokicki, T. (2013). The Importance of Logistics in Agribusiness Sector Companies in
Poland, Economic Science for Rural Development: Production and Cooperation in
Agriculture / Finance and Taxes. Proceedings of the International Scientific Conference,
Issue 30, pp. 116-120.
16. Wozniak, M. (2008): Dywersyfikacja szansa rozwoju indywidualnych gospodarstw
rolnych w globalnej gospodarce (Diversification as an Opportunity for the Development
of Individual Farms in the Global Economy). Zeszyty Naukowe SGGW, no. 67, pp. 15-
24.
17. Wysokinski, M., Baran, J., Gołasa, P., Lenort, R. (2014). Economic and Energy
Efficiency of the Mining and Quarrying Sector in European Countries, In Metal 2014:
23th International Conference on Metallurgy and Materials. Ostrava: TANGER, 2014, pp.
1965-1971.

93
CONCENTRATION OF MILK PRODUCTION IN POLAND
Marcin Wysokinski*, PhD; Joanna Baran†, PhD, Wojciech J. Florkowski3, Prof.
1 Warsaw University of Life Sciences (SGGW), Poland 2 Warsaw University of Life Sciences (SGGW), Poland
3University of Georgia, USA
Abstract. This paper presents selected issues related to the processes of concentration of
commercial milk production in Poland. The analysis excludes farms that sell directly to
individuals, due to their marginal share in total commercial production (less than 1%).
Changes in milk production in Poland as a whole and in individual regions have been analyzed
dynamically in terms of quantities delivered, average quantity delivered per farm and number
of suppliers. Based on the Gini coefficient, surveys released a steady process of concentrating
milk production in certain Polish regions. The research has also shown notable changes in the
structure of wholesale deliveries of milk and the structure of suppliers. Research let to observe
the decided decrease in importance of producers selling less than 50, 000 kg of milk per year
in comparison with those selling more than 200, 000 kg.
Key words: milk production, concentration of production, scale of production
JEL code: Q10
Introduction
Concentration, in most general terms, means intensification, the process of making denser
or smaller (Slownik jezyka polskiego, 1988). Concentration of production in an agricultural
farm, means nevertheless a process of intensifying (attracting, drawing together) production
and the means necessary to achieve it within a separate, self-sufficient economic unit
(Encyklopedia ekonomiczno-rolnicza, 1984).
The main aspects of concentration in agriculture include concentration of production (scale
of production, cultivation, raising livestock) and spatial concentration while producing specific
agricultural products (Zegar J.S., 2009).
According to Rychlik and Kosieradzki, references to concentration of production should be
understood as covering a specific branch of production, group of products, or even a single
product. Statistically speaking, concentration of production in agriculture refers mainly to the
* Corresponding author. Tel. + 48 225934261, fax: +48 225934256, E-mail address: [email protected] † Corresponding author. Tel. + 48 225934261, fax: +48 225934256, E-mail address: [email protected] 3 Corresponding author. Tel. (770) 228-7231, fax: (770) 228-7208, E-mail address: [email protected]
Proceedings of the 2015 International Conference “ECONOMIC SCIENCE FOR RURAL DEVELOPMENT” No37 Jelgava, LLU ESAF, 23-24 April 2015, pp. 93-104

94
mass of a specific agricultural product available to the farm during the year (Rychlik T.,
Kosieradzki M., 1978).
In literature, assertions have also been made that the notion of concentration is frequently
equated with the notion of scale of production. This is the result of a certain interdependence
between concentration and scale of production; advances in one lead to increases in the other
(Runowski H., 1994).
According to Wos and Tomczak, the scale of agricultural production can be understood not
only in quantitative, however also organizational and economic terms. A specific scale of
production involves a certain method of organization and economics of production and the
consequent effectiveness of production (Wos A., Tomczak F., 1979).
The basic objective of business entities in agriculture is to improve the effectiveness of
production with a view to increasing their income. As noted by H. Runowski (1994), every
reasonably sized process of concentrating production has a positive impact on the
effectiveness of manufacturing processes. An increased scale of production permits effective
application of modern production technologies – the main source of economic advances in
agriculture, the other being advances in biology – and thereby contributes to better farming
effectiveness.
Following the microeconomic approach, the efficiency is its capacity to transform
expenditures into effects, where a larger value of productivity indexes is indicative of a higher
efficiency of a particular economic entity (Coelli et al., 2005; Lenort et al., 2014; Wysokinski et
al., 2014).
Globalization and new technologies are conductive to the expansion of large farms.
Globalization is also inherently associated with powerful food processing and retail corporations
which show preference for larger agricultural farms either due to new requirements concerning
the quality, timeliness and batch size of deliveries, or because of lower transaction costs
(Birner R., Resnick D., 2005). Similarly, new capital-intensive technologies and
biotechnological advances, as inventions of modern corporations, are more suitable to large
agricultural farms, undermining the position and opportunities of family farms (Hazel P.,
Poulton C., Wiggins S., Dorward A., 2007).
The process of concentration also occurs in family (individual) farming, as evidenced by
changes in agrarian structure. Observed trends include a decrease in the number of farms and
concentration of land within steadily growing estates. Such transformations in Polish
agriculture came, for multiple reasons, with delay compared to Western Europe countries, a
fact of some importance considering the integration of the Polish food and agricultural sector
into the EU Single Market and the application of the Common Agricultural Policy mechanisms.
(Zegar J. S., 2009).
Concentration of production is accompanied by organizational problems, such as inefficient
logistics (Rokicki T., 2013; Baran J., Zak J., 2014).
95
Proceeding to the analysis of concentration of production on the milk market, one can
share the assertion of H. Runowski that concentration of production means the process of
increasing production within a single economic unit, while scale of production means a specific
advanced stage of that process. Scale of production is a specific level of concentration of
production (Runowski H., 1994).
Research methodology and sources of materials
The purpose of this study was to identify changes in wholesale milk production in Poland
and to estimate the level of concentration in spatial terms.
Research tasks was to identify the level of concentration of wholesale milk production in
Poland; to estimate the changes in the structure of supply and wholesale suppliers of milk in
Poland; and to analyze the wholesale milk production in Poland on a regional basis.
The research focused on wholesale production due to its dominant role on the Polish
market (accounting for more than 99% of total sales during the 2012/2013 quota year*).
Using data from the Agricultural Market Agency (Milk Production Quota Office), a comparison
was made between the structure of deliveries and suppliers in the quota years 2004/2005 and
2012/2013. The analysis was based on the following delivery ranges: A - (> 0 ≤ 20,000 kg
per year); B - (> 20,000 ≤ 50,000); C - (> 50,000 ≤ 100,000); D - (> 100,000 ≤ 200,000);
E - (> 200,000 ≤ 500,000); F - (> 500,000 ≤ 1,000,000); G - (> 1,000,000);
The study is based on the literature review method, the descriptive method, concentration
measures (Gini coefficient, Lorenz curve).
Gini coefficient was used to assess the wholesale milk production concentration level. It is
strictly linked with the Lorenz curve (hence its second name – “Lorenz concentration ratio”).
Since it is the most commonly used inequality measure, it contains many formal
representations. One of such representations is described below (1):
n
i
n
j
ji xxn
G1 1
22
1
(1)
μ – average emission;
n – sample size.
* EU milk production is limited. Each country can produce milk under quota. There are two types of milk
production quotas: a) for sale directly from the farmer to the consumer, b) wholesale from the farmer for processing. Accounting and monitoring of production is within the quota year. Quota year begins on April 1 and ends on March 31. In Poland, the dominant role played by wholesale (more than 99% of the total amount of the national dairy market).

96
Gini coefficient of 0 expresses egalitarian distribution, while a Gini coefficient of 1 expresses
maximal inequality. This equation may be interpreted as half of the absolute production
difference between all countries in relation to average production. This coefficient satisfies the
Pigou-Dalton Principle of Transfers (it changes by transferring production from high-production
countries to lower-production countries) and principles of symmetry, homogeneity, replication.
It does not, however, satisfy the decomposition principle.
The Lorenz curve illustrates accumulated percentage of wholesale milk production for
subsequent countries in order from lowest to highest production. In a theoretical case, when
production of all countries is equal, the Lorenz curve becomes a straight line at 45 degrees
(curve of absolute equality). However, such situation does not actually occur. The greater the
production diversity, the more the actual curve differs from the curve of absolute equality. The
Gini coefficient is a quantitative measurement of this inequality, which equals 2 x the field
between the actual curve and the curve of absolute equality. It may take values from 0 –
absolute equality of production – to 1 – all production is accumulated in hands of one country
(Golasa et al., 2014).
Source materials included book publications, journal articles, and statistical data from the
Agricultural Market Agency, Central Statistical Office and Institute of Agricultural and Food
Economics. The results of research have been presented in the form of tables and figures.
Research results and discussion
Poland is ranked as one of the largest producers of milk in the European Union. Together
with Germany, France, the United Kingdom, the Netherlands and Italy, it accounts for 70% of
wholesale delivery of milk, an evidence of strong concentration of commercial milk production
in the EU. This is confirmed by a high Gini coefficient, which in 2013 was equal to 0.65. The
Lorenz curve shows the cumulative percentage of the 2013 production, ranked from highest to
lowest, in individual states (Figure 1). The larger the disparity between production values, the
more the curve deviates from the line of equality.

97
Source: author’s construction on the base of IAFE-NRI data
Fig. 1. Concentration of milk production in the EU (Lorenz curve)
Poland's accession to the European Union was a major challenge for the milk industry.
Circumstances imposed by the Common Agricultural Policy (compliance with production limits,
competition on the unified European market, sanitary and veterinary requirements, increased
production costs) served to stimulate the concentration of production and specialization and
were the main factor behind the restructuring of the milk sector during the last ten years
(Wilkin J., Milczarek D., Malak-Rawlikowska A., Falkowski J., 2007). Factors of importance in
this process included, inter alia, better product quality, pre-accession support for investments,
developing exports, rising prices of milk, introduction of direct subsidies, and the milk quota
system. Since 2004, producing, organizational and economic circumstances have changed,
resulting in altered behaviours of producers and processors.
In analyzed period during which milk quotas were in effect in Poland (milk production
subject to limits envisaged in the CAP and imposed upon accession to the EU), the number of
suppliers fell by around 55% (from 316,723 in 2004/2005 to 140,927 in 2012/2013). In each
quota year, the number of suppliers decreased by 22,000 on average. This development was
more intense in the years immediately following accession to the European Union. The largest
decrease in the number of suppliers, over 40,000, was noted between 2006/2007 and
2007/2008. Since 2010, while the downward trend remained steady, the drops were not so
pronounced.

98
Source: author’s construction based on data from ARR data
Fig. 2. The number of wholesale suppliers* and the average size of milk supply in
Poland
The diminishing number of suppliers combined with growing wholesale production of milk
means that the average delivery size has increased. Milk production became concentrated in
farms that survived on the market. Between 2004 and 2013, the average size of wholesale
deliveries to purchasing centres rose steadily, a quite positive sign that the market of milk
producers is becoming concentrated (Figure 2).
In the 2012/2013 quota year, the average wholesale delivery to purchasing centres was
about 150% larger than in the first year in which quotas were in effect. The average delivery
figure rose by more than 5,000 kg per year. The growth dynamics increased year by year as
well.
The milk market in Poland is also characterized by strong regional variation. A progressive
concentration of production in spatial terms was observed, evidenced, inter alia, by the
systematic increase of the Gini coefficient in the researched period (Figure 3). An upward trend
for the Gini coefficient can be observed since 2004/2005. This means that the diversification of
wholesale milk production in Poland is growing, suggesting that the largest producing regions
are increasing their production, while others are decreasing it.
* As at the last day of each quota year

99
Source: author’s construction based on ARR data
Fig. 3 Value of the Gini coefficient for the wholesale milk production in Poland
Parameters like production size, purchases of milk, milk yield per cow or concentration of
production take different values in each region. The accession of Poland to the European Union
and attempts to stay ahead of the changing market have further consolidated these
differences. As it turned out, regional differences on the milk market (Seremak-Bulge J., 2006)
are influenced by factors other than natural conditions, level of agricultural development, or
agrarian structure (the strong ties between milk and land notwithstanding) (Wysokinski M. M.,
Dziwulski M., 2013). The establishment of accelerated milk processing centres, presence of
strong processing entities, development of modern consulting, enterprises undertaken by
farmers, appetite for risk, aid in the restructuring process (advisory centres) and use of the EU
funds are some of the causes underlying the recent rise of milk production outside areas
known for their superior natural and production conditions. The current changes in the milk
industry run contrary to the common wisdom on agricultural development, according to which
the Eastern regions of Poland are characterized by less intensive farming and lower production
results. It is exactly these Eastern and Central Poland areas (for example Podlaskie and
Mazovia regions) that stand out as strong milk producers, defying general agricultural
development trends.
Regions with the largest production (Mazovia, Podlaskie, Wielkopolskie and Lodzkie) have
delivered 60% and 64% of commercial milk in 2004/2005 and 2012/2013, respectively.
Therefore, one fourth of Polish regions is accounting for more than 60% of milk deliveries to
purchasing centres, a tendency that is still on the rise. In the analyzed period, production rose
most strongly in Wielkopolskie (33%) and Podlaskie (32%) regions, with the average
nationwide growth figure on the level of 18%. Above average results were also noted in
Kuyavia-Pomerania, Mazovia and Warminsko-Mazurskie regions. The largest decrease in the
number of suppliers was observed in the Lower Silesia and Podkarpackie regions, respectively
by 74% and 72%. On average, the number of Polish producers subject to wholesale production
limits decreased by 55% in the researched period. Opposite to this tendency, the average size
of wholesale deliveries rose by 153%. The largest contribution to this figure came from the

100
Lower Silesia region (263%). In 2012/2013, the largest average wholesale deliveries were
made in Westpomeranian (201,245 kg per year), Lubuskie (177,185) and Opolskie (154,938)
regions, leading to the conclusion that these regions contain farms with the highest scale of
production. Farms with the smallest average wholesale deliveries came from Podkarpackie
(21,751 kg per year), Malopolskie (24,190) and Swietokrzyskie (28,780) regions.
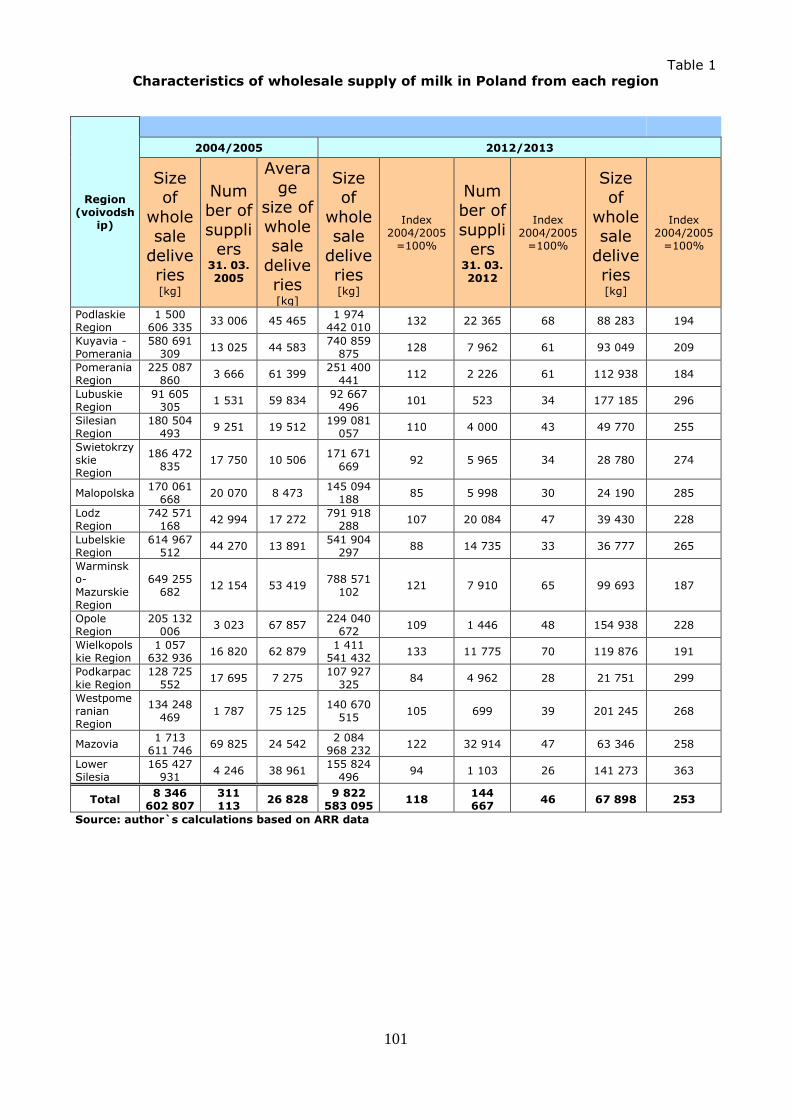
101
Table 1
Characteristics of wholesale supply of milk in Poland from each region
Region (voivodsh
ip)
2004/2005 2012/2013
Size of
wholesale
deliveries
[kg]
Number of
suppliers
31. 03. 2005
Avera
ge size of
wholesale
deliveries
[kg]
Size of
wholesale
deliveries
[kg]
Index 2004/2005
=100%
Number of
suppliers
31. 03. 2012
Index 2004/2005
=100%
Size of
wholesale
deliveries
[kg]
Index 2004/2005
=100%
Podlaskie Region
1 500 606 335
33 006 45 465 1 974
442 010 132 22 365 68 88 283 194
Kuyavia - Pomerania
580 691 309
13 025 44 583 740 859
875 128 7 962 61 93 049 209
Pomerania Region
225 087 860
3 666 61 399 251 400
441 112 2 226 61 112 938 184
Lubuskie Region
91 605 305
1 531 59 834 92 667
496 101 523 34 177 185 296
Silesian Region
180 504 493
9 251 19 512 199 081
057 110 4 000 43 49 770 255
Swietokrzyskie Region
186 472
835 17 750 10 506
171 671
669 92 5 965 34 28 780 274
Malopolska 170 061
668 20 070 8 473
145 094 188
85 5 998 30 24 190 285
Lodz Region
742 571 168
42 994 17 272 791 918
288 107 20 084 47 39 430 228
Lubelskie Region
614 967 512
44 270 13 891 541 904
297 88 14 735 33 36 777 265
Warminsko-Mazurskie Region
649 255 682
12 154 53 419 788 571
102 121 7 910 65 99 693 187
Opole Region
205 132 006
3 023 67 857 224 040
672 109 1 446 48 154 938 228
Wielkopolskie Region
1 057 632 936
16 820 62 879 1 411
541 432 133 11 775 70 119 876 191
Podkarpackie Region
128 725 552
17 695 7 275 107 927
325 84 4 962 28 21 751 299
Westpomeranian Region
134 248 469
1 787 75 125 140 670
515 105 699 39 201 245 268
Mazovia 1 713
611 746 69 825 24 542
2 084 968 232
122 32 914 47 63 346 258
Lower Silesia
165 427 931
4 246 38 961 155 824
496 94 1 103 26 141 273 363
Total 8 346
602 807 311 113
26 828 9 822
583 095 118
144 667
46 67 898 253
Source: author`s calculations based on ARR data

To recognize the changes in the structure of wholesale milk deliveries and suppliers, it was
proposed to subdivide all suppliers into seven ranges by delivery size.
In the period chosen for research, the importance of deliveries from each range clearly
changed. Firstly, there was a drastic reduction in importance of deliveries originating from
farms that output less than 50,000 kg of milk (their share falling from more than 41% in the
2004/2005 quota year to 17% in the 2012/2013 quota year). The share of farms delivering up
to 20,000 kg of milk decreased from 18.47% to about 4%, a clear proof of marginal
importance of this scale of deliveries in Poland.
Table 2
The structure of supply and suppliers of milk, depending on the compartment of
supply
Supply
compartments
(thousand kg)
Share of supply (%) Share of suppliers (%)
2004/2005 2012/2013 2004/2005 2012/2013
> 0 ≤ 20 18.47 4.34 68.73 33.7
> 20 ≤ 50 22.62 13.31 18.55 27.73
> 50 ≤ 100 22.77 20.62 8.67 20.35
> 100 ≤ 200 15.79 24.51 3.1 12.33
> 200 ≤ 500 7.93 20.29 0.74 4.94
> 500 ≤ 1000 2.89 6.41 0.11 0.67
> 1000 9.53 10.51 0.1 0.28 Source: author’s calculations based on ARR data
Another observed tendency was the growing share of deliveries in ranges upwards of
100,000 kg (an increase from 36% to 60%). The largest contribution to this growth was
definitely the increased share of deliveries in the 100,000 - 200,000 kg and 200,000 - 500,000
kg ranges in the total figure, a rise respectively from 16% to 24.51% and from 8% to 20%.
Deliveries in the 50,000 - 100,000 kg range accounted for 20%-22% of the total figure, while
deliveries in the 1,000,000+ kg range for about 10% of milk delivered for purchasing centres,
these percentages holding steady in every year.
In the entire researched period, the share of producers in the up to 20,000 kg range
decreased from 69% to 34%. In 2012/2013, while farmers delivering up to 50,000 kg per year
accounted for 62% of all wholesale producers, they delivered only 18% of wholesale milk
production in Poland. The average size of deliveries from farms, excluding those contributing
less than 50,000 kg per year, would equal 149,000 kg, a figure similar to the average level of
deliveries in the EU.
Conclusions
1. Surveys conducted showed the dynamic changes in the sectors wholesale milk
producers in the period of 2004-2013. The number of wholesale suppliers fell by 55%,
while the average size of deliveries rose by 150%. An increase in wholesale sales was
noted in each quota year, leading to a belief that this form of sales will continue

103
growing in line with more intense concentration of production and the decreasing
number of milk suppliers.
2. A steady growth of the level of concentration of wholesale milk production in spatial
terms was observed in Poland. The differences between production of milk in individual
regions are expanding. In particular, production becomes concentrated in a couple of
regions (Mazowieckie, Podlaskie, Wielkopolskie and Lodzkie), while Southern and
South-Eastern Poland is pushed to the margin.
3. It has been observed that farms selling less than 20,000 kg of milk per year are
becoming steadily marginalized. Nevertheless, there was a sharp rise in the share of
producers selling from 200,000 to 500,000 kg per year.
Bibliography:
1. Agencja Rynku Rolnego, pp. 1.
2. Baran, J., Zak, J. (2014). Multiple Criteria Evaluation of transportation performance for
selected agribusiness companies. Procedia - Social and Behavioral Sciences, Volume
111, pp. 320 – 329.
3. Birner, R., Resnick, D. (2005). Policy and Politics for Smallholder Agriculture. [W:] The
Future of Small Farms. Proceedings of a Research Workshop. Wyd. UK, June 26-29. pp.
283-311.
4. Coelli, T., J., Prasada Rao, D. S., O’donnell, C. J., Battese, G. E. (2005). An Introduction
to Efficiency and Productivity Analysis, Springer, New York, pp. 12-23.
5. Encyklopedia ekonomiczno-rolnicza (Agricultural Economy Encyclopaedia), 1984,
PWRiL, Warszawa, pp. 28-105.
6. Golasa, P., Lenort, R., Wysokinski, M., Baran, J., Bienkowska-Golasa, W. (2014).
Concentration of Greenhouse Gas Emissions in the European Union. In Metal 2014:
23th International Conference on Metallurgy and Materials. Ostrava: TANGER, 2014, pp.
1691-1696.
7. Hazel, P., Poulton, C., Wiggins, S., Dorward, A. (2007). The Future of Small Farms for
Poverty Reduction Growth. 2020 Discussion Paper 42. IFPRI, Washington DC, May.
8. Lenort, R., Baran, J., Wysokinski, M. (2014). Application of Data Envelopment Analysis
to Measure the Efficiency of the Metal Production Sector in Europe. In Metal 2014: 23th
International Conference on Metallurgy and Materials. Ostrava: TANGER, 2014, pp.
1795-1802.
9. Malak – Rawlikowska, A. (2005). Ekonomiczne i organizacyjne skutki wprowadzenia
systemu regulacji produkcji mleka w wybranych krajach Unii Europejskiej i w Polsce na
przykladzie systemu kwotowania produkcji mleka (Economic and organizational effects
of the control system of milk production in selected countries of the European Union
and Poland on the example of the milk quota). Wydawnictwo SGGW, Warszawa, pp. 21-
87.
10. Rokicki, T. (2013). The importance of logistics in agribusiness sector companies in
Poland, Economic Science for Rural Development: production and cooperation in
agriculture / finance and taxes. Proceedings of the International Scientific Conference,
Issue 30, pp. 116-120.
11. Runowski, H. (1994). Koncentracja produkcji zwierzęcej (Milk production
concentration). Wydawnictwo Fundacja Rozwoj SGGW, Warszawa, pp. 7-8, 19-20.
12. Rybicki, G. (2009). Koncentracja produkcji i przetworstwa mleka jako czynnik
konkurencyjnosci (Concentration of milk production and milk processing as a factor of
competitiveness). Roczniki Naukowe SERiA, T. 11, z. 3, pp. 299 – 303.
13. Rychlik, T., Kosieradzki, M. (1978). Podstawowe pojecie w ekonomice rolnictwa
(Elementary theory of agricultural economy). PWRiL, Warszawa, pp. 13-63.

104
14. Seremak – Bulge, J. (2005). Rozwoj rynku mleczarskiego i zmiany jego funkcjonowania
w latach 1990-2005 (Dairy market development and changes of its functioning in the
years 1990-2005). Praca zbiorowa, IERiGZ - PIB, Warszawa, pp. 19-142.
15. Seremak-Bulge, J. (2006). Regionalne zrożnicowanie mleczarstwa (Regional
diversification of dairy sector). Komunikaty Raporty Ekspertyzy IERiGZ-PIB, Warszawa,
nr 520, pp.6-9.
16. Slownik jezyka polskiego (Polish Leanguage dictionary), 1988. PWN, Warszawa, pp. 11-
15.
17. Wilkin, J., Milczarek, D., Malak-Rawlikowska, A., Falkowski, J. (2007). The dairy sector
in Poland, Regoverning Markets agrifood sector study. IIED, London, pp. 4-61.
18. Wos, A., Tomczak, F. (1979). Ekonomika rolnictwa. Zarys teorii (Economy of Agriculture
- basic theory), PWRiL, Warszawa, pp.193.
19. Wysokinski, M., Baran, J., Golasa, P., Lenort, R. (2014). Economic and Energy
Efficiency of the Mining and Quarrying Sector in European Countries, In Metal 2014:
23th International Conference on Metallurgy and Materials. Ostrava: TANGER, 2014, pp.
1965-1971.
20. Wysokinski, M. M., Dziwulski, M. (2013). Land as main production factor on dairy farms
in Poland. Economic Science for Rural Development: production and cooperation in
agriculture / finance and taxes. Proceedings of the International Scientific Conference,
Issue 30, pp.128-133.
21. Zegar, Stanisław J. (2009). Kwestia koncentracji ziemi w Polskim rolnictwie
indywidualnym (The issue of concentration of land in the Polish private farming).
Roczniki Nauk Rolniczych, Seria G, T. 96, z. 4, pp. 256-257.

105
RISK ASSESSMENT IN HEMP (Cannabis sativa L.) PRODUCTION AND
PROCESSING
Sandija Zēverte-Rivža*, Dr.oec.; Aleksandrs Adamovičs, Dr.agr.
Faculty of Economy and Social Development, Latvia University of Agriculture
Faculty of Agriculture, Latvia University of Agriculture
Abstract. Agriculture (including hemp production and processing) is one of the
industries subject to risks due to changing weather conditions, diseases, pests and volatile
market prices on inputs and products produced. However, the use of risk assessment
methodologies in hemp production and in agriculture as a whole are not widespread. This
article aims to reflect the preliminary results of the risk evaluation in hemp production and
processing. The following tasks were set to reach this aim: to analyze the risk evaluation
methodology and risk calculation methodology; to determine and systematize risks in hemp
production and to carry out a preliminary evaluation for risks in hemp production using semi-
quantitative evaluation. For the evaluation purposes the hemp production is divided in five
stages - preparation of soil and sowing of hemp; growing of hemp; hemp harvesting; hemp
processing; and selling of the produced output. The evaluation of risks was done within a
system of 18 risks, divided in six main groups – agro-meteorological; technological and
production; personnel; environment; legislative; economic, and market risks. The results
indicate that the highest risk level in the entire hemp production and processing process was
specific to the group of personnel risks, whereas the lowest – to the group of environmental
risks.
Key words: risk management, hemp production, hemp processing, risk evaluation.
JEL code: D81
Introduction
The sector of hemp growing and processing is subjected to significant changes through
the past decades. Historically hemp growing was widespread and in Latvia hemp was broadly
used in everyday life – in the local cuisine, for feeding animals and also as a building and
textile material. In the last decades the amounts of hemp growing reduced but following the
global tendencies in agriculture, growing and processing of hemp (cannabis sativa L.) is
regaining its popularity mainly due to the versatile possibilities of using hemp. Though, the
* Corresponding author. Tel. +371 26387278. E-mail [email protected]
Proceedings of the 2015 International Conference “ECONOMIC SCIENCE FOR RURAL DEVELOPMENT” No37
Jelgava, LLU ESAF, 23-24 April 2015, pp. 105-113

106
total number of hemp growers is significantly smaller nowadays as it has been historically, the
use of hemp is expanding and within recent years several enterprises have introduced new
products that include using hemp in food production, production of ecological construction
materials, paper, production of textiles, biodegradable plastics and renewable energy
production.
Agriculture, including hemp production and processing, is one of the industries subject
to risks due to changing weather conditions, diseases and pests and volatile market prices on
inputs and products produced. However, the use of risk assessment methodologies in
agriculture is not widespread but it is specific to the financial and investment sector. Risk
assessment is a process in which the significance of risk is determined (Ferraris, s.a.). Risks
may be managed in various ways, which, to some extent, allows forecasting the emergence of
risks and carrying out activities to reduce the level of risks. Nowadays, risk management is
understood as a set of methods, techniques and activities that assist in forecasting risks to a
certain extent and in designing activities to avoid the risks or to reduce their negative effects
(Rurane, 2001).
Materials and methods
After analysing the term risk in scientific literature (Hardaker, Huirne, 2004; Pettere,
Voronova, 2004; Arhipova, 2002; Suskevica, 2005; Boading, 2011; Definitions of Risk, s.a. et
al.) and the principles in risk definition set by a German sociologist Ortwin Renn (Renn, 2008),
risks within the present research are defined as follows: risk is a combination of the probability
of occurrence of an event and the severity level of negative effects caused by it.
Risk is calculated by the following formula:
Ri = Vi x Bi , (1)
where
Ri – numerical value of the i-th risk event;
Vi – probability of occurrence of the i-th risk event;
Bi – severity of losses from the occurrence of the i-th risk event.
Formula 1 includes two components: probability of occurrence of a risk and severity of
losses from the occurrence of the risk. To calculate the risk, two mentioned components have
to be expressed as quantitative values, and scales are often used to express them, defining
each interval of the scale in accordance with the specifics of any research performed. Such an
approach is employed further in the present research.
A classification of risks was performed by analyzing risk management studies in
agriculture and in production of renewable energy that allowed to identify dominant and
specific risk groups for the further evaluation. It can be concluded that technological,
environmental, legislative, financial and investment risks prevail (Olivier, s.a.; Financial Risk
Management, 2004; Froggatt, Lhan, 2010; Ferraris, s.a.), while such groups of risks as social,

107
macroeconomic, resource, short-term and long-term operational risks and reputational risks
are less frequent (Financial Risk Management, 2004; Froggatt, Lhan, 2010; Aragonés-Beltrán,
Pastor-Ferrando, 2009).
Three experts that are connected with growing hemp and/or research in hemp
production were questioned to obtain the preliminary risk evaluation results. They determined
the probability of occurrence of each risk and the potential severity of losses from these risks.
Based on the results, a risk level was calculated for each risk assessed by the experts; from it,
in its turn, the average risk level was calculated for all experts’ assessments as well as the
average risk group level for the six basic groups of risks and for each phase of the production
and processing process.
Research results and discussion
Given the above-mentioned, a risk assessment system was developed to assess risks in
hemp production and processing; the risks in it were classified into six basic groups:
technological and production, personnel, environmental, economic and market, and
agricultural and meteorological risks. Within the basic groups of risks, a detailed classification
of the specific risks affecting the production process was developed based on the analysis of
specific scientific literature (Strazds, et al., 2012; Vilnitis, et al. 2011; Industrial Hemp, 1999;
Environmental Risks…, 2013).
Agricultural
land tillage,
hemp sowing
Hemp growingHemp
harvesting
Hemp
processing
Selling the
products
produced
Agricultural and meteorological risks
Environmental
risks
Economic and market risks
Personnel risks
Technological and production risks
Legislative risks
Source: author’s construction
Fig.1. Classification of risks for assessing the risks in hemp production and
processing
The process of hemp production and processing is divided into five phases (Fig.1):
agricultural land tillage and hemp sowing – this phase involves the choice of hemp seed,
which is affected by legal provisions on hemp varieties that are entitled to the EU direct

108
payments, land tillage and hemp sowing. Both these processes are subject to economic and
market risks, agricultural and meteorological risks as well as environmental (use of fertilisers),
technological and production risks (working condition of machinery, availability and quality of
seed); hemp growing is subject to agricultural and meteorological, environmental,
technological and production as well as personnel risks. To a lesser extent, it is also subject to
economic and market and legislative risks.
Hemp harvesting, just like hemp growing, mainly involves agricultural and meteorological,
technological and production as well as personnel risks. The other groups of risks can affect
this process but to a smaller extent; at the phase of hemp processing, there are no effects of
agricultural and meteorological risks, while the effects of technological and production risks
increase. However, sales of the products produced are affected by the demand for these
products and their market price; accordingly, economic and market risks affect the sales in the
most direct way. Yet, even at this stage legislative risks might have their effects through
setting quality standards for product sales and changing taxes and in other cases.
A specific effect area and a risk level were determined for each of these factors. The
risks in hemp production and processing were classified based on an analysis of specific
scientific literature (Strazds, et al., 2012; Vilnitis, et al., 2011; Industrial Hemp, 1999;
Environmental risks…, 2013; Olivier, s.a.; Financial Risk Management, 2004; Froggatt, Lhan,
2010; Ferraris, s.a.). To assess the risks, the mentioned six groups of risks were divided into
18 particular factors (Table 1). According to Formula 1, before assessing the severity of a risk
probability of occurrence of the risk and severity of losses from the occurrence of the risk have
to be determined. The risk level is calculated by multiplying the two parameters. For each of
the 18 factors, a specific effect area was determined and the risk level was calculated using a
scale of 1 to 25, where 1-3 points meant acceptable risks, 4-9 – medium significant risks, 10-
19 – significant risks, and 20-25 – extreme risks (Guide to Risk Management, 2004).

109
Table 1
Characteristics of the risks in hemp production and processing and their
distribution by group of risks
Characteristics of risks Group of risks
Low qualification of personnel and the lack of their responsibility Personnel risks
Violations of occupational safety rules
Low quality of seed
Technological and
production risks
Unavailability of machinery
Machinery operational problems
Low quality of agricultural and technological operations
Delayed deliveries of spare parts for equipment and delayed
maintenance services
Changes in sale prices on products
Economic and market
risks
Changes in purchase prices on inputs (seed, plant protection
chemicals, fertilisers etc.)
Changes in other fixed and variable costs
Effects of meteorological conditions Agricultural and
meteorological risks Effects of pests and birds
Inadequacy of agricultural land for growing hemp
Environmental risks when fertilising fields Environmental risks
Environmental risks when processing hemp
Limitations of receiving direct payments
Legislative risks Changes in the tax policy
Changes in the quality and safety standards for the products
produced
Source: author’s construction
The results obtained from the risk assessment showed (Fig.2) that, on average, the
highest risk level in the entire hemp production and processing process was specific to the
group of personnel risks (6), whereas the lowest – to the group of environmental risks (1). The
group of personnel risks was the only group of risks that was homogenously assessed by the
experts as medium significant for all the phases of hemp production and processing. However,
some risks were assessed as the highest for the group of technological and production risks,
for instance, the unavailability of machinery during hemp harvesting and processing.

110
65 4 4
1
33
0 0 0 0 0
10
22
1011
87
0
5
10
15
20
25
0
5
10
15
20
25
Personnel risks Technological
and production
risks
Economic and
market risks
Agricultural
and
meteorological
risks
Environmental
risks
Legislative
risks
Average
Min
Max
Source: author’s construction
Fig.2. Dispersion of the significance of risks for the groups of risks for all the phases
of hemp production and processing
After analysing the results for each phase of hemp production and processing (Fig.3),
one can find that, on average, the risk effects were assessed as the highest for agricultural
land tillage and hemp sowing, while some very significant risks were specific to hemp
harvesting and processing, at 22 and 20 points, respectively, and, as mentioned before, this
was the risk of unavailability of machinery.
0 0 0 0 0
9 8
2220
10
53
45
2
0
5
10
15
20
25
0
5
10
15
20
25
Agricultural
land
tillage, hemp
sowing
Hemp growing Hemp
harvesting
Hemp
processing
Hemp selling
Average
Min
Max
Source: author’s construction
Fig.3. Dispersion of the significance of risks for the phases of hemp production and
processing

111
After analysing individual risks for each phase of hemp production and processing, it
can be concluded that the experts’ assessments for agricultural land tillage and hemp
sowing were quite different – on average, the most significant were the risk of changes in
purchase prices on inputs (seed, plant protection chemicals, fertilisers etc.) (9), the risk of low
quality of seed (7) and the risk of changes in the tax policy (7). For the phase of hemp
growing, the most significant were agricultural and meteorological risks, especially effects of
pests and birds, with the maximum of 20, and the inadequacy of agricultural land for growing
hemp; however, this phase does not involve several risks associated with hemp sowing and
processing. For the phase of hemp harvesting, the risk of unavailability of machinery was
extremely significant, 22 points; making this the most significant risk not only for a particular
phase but for the entire risk assessment. The following risks, for the same phase, were also
significant: effects of meteorological conditions, low quality of agricultural and technological
operations and low qualification of personnel and the lack of their responsibility, while
machinery operational problems were a medium significant risk. For the phase of hemp
processing, too, the most significant risks were unavailability of machinery (20) and
machinery operational problems (11); the two personnel risks, with 10 points, were also
significant. As regards the phase of sales of products, the risk effects were comparatively
lower; on average, significant risks were: changes in sale prices on products (10) and low
qualification of personnel and the lack of their responsibility (7). On the whole, the lowest
assessments were given to the groups of environmental and legislative risks – environmental
risks quite insignificantly affect the phases, while legislative risks can more affect several
phases; yet, since presently no changes are expected regarding legal provisions, standards or
taxes, the effects of these risks are small.
Further, the research will focus on the differences in risk effects depending on the ways
of using hemp. Since the present results show the distribution of significance of risks for hemp
production and processing but the experts, when doing their assessments, admitted that this
was a quite complicated and time-consuming activity the further research will omit
insignificant risks and will focus only on those presently having medium significant and
significant effects.
Conclusions
The obtained results showed that, on average, the highest risk level in the entire hemp
production and processing process was specific to the group of personnel risks, whereas, the
lowest – to the group of environmental risks. That indicates that the actions and the decisions
made by the employees are the one that affect the hemp growing and processing process the
most. However, some risks were assessed as the highest for the group of technological and
production risks, for instance, the unavailability of machinery during hemp harvesting and
processing.

112
The significance of risk groups and also individual risks differed among the risk groups,
for example, for the phase of hemp growing, the most significant were agricultural and
meteorological risks, especially effects of pests and birds, with the maximum of 20, and the
inadequacy of agricultural land for growing hemp but for the phase of hemp harvesting, the
risk of unavailability of machinery was extremely significant, and reaching 22 points.
The process of getting preliminary results showed that making the risk evaluation is
rather complicated and time-consuming for the farmers therefore in the further research
insignificant risks (following the results of the preliminary evaluation) would need to be
omitted.
Acknowledgements
The article is based on the empirical data obtained within the project “The Elaboration
of Growing and Processing Technologies for the use of Industrial Hemp (Cannabis Sativa) in
Development of Products with a High Added Value’’ no. 160413/S99, S254
Bibliography
1. Aragonés-Beltrán, P., Pastor-Ferrando, J.P., Chaparro-González, F., Bautista, R.P. (2009).
Selection of Photovoltaic Solar Power Plant Projects Using ANP. In: Proceedings of the
International Symposium on the Analytic Hierarchy Process. Pittsburgh, Pennsylvania, USA.
p. 11. Retrieved: http://www.isahp.org/2009Proceedings/Final_Papers/4_Aragones-
Beltran_SOLAR_REV_FIN.pdf
2. Arhipova, I. (2002). Risk Management Methodology in Latvian Economics. In: Proceedings
of the 6th ERC/METU Internationa lConference in Economics, Ankara, Turkey, pp. 252 – 260.
3. Boading, L. (2011). Uncertainty Theory. Department of Mathematical Sciences. Retrieved:
http://www.orsc.edu.cn/~liu/ut.pdf
4. Definitions of Risk Business Dictionary (s.a.). Retrieved:
http://www.businessdictionary.com/definition/risk.html
5. Ferraris, I., De la Canal, M.D., Labriola, C. (s.a.). Risk Analysis in Renewable Energy:
Assessment of the Vulnerability of the Environment and Community. Retrieved:
http://www.icrepq.com/icrepq07/363-ferraris.pdf
6. Financial Risk Management Instruments for Renewable Energy Projects: Summary
document (2004) United Nations Publication. Oxford, UK: Words and Publications, 52 p.
7. Froggatt, A., Lhan, G. (2010). Sustainable Energy Security. Strategic Risks and
Opportunities for Business: White Paper. Lloyds 3600 risk insight. London: Chatman House, 48
p.
8. Guide to Risk Management (2004). Australian Capital Territory Insurance Authority.
Retrieved: http://www.treasury.act.gov .au/actia/Risk.htm
9. Merna, T., Al-Thani, F. (2005). Corporate Risk Management. An Organisational Perspective.
West Sussex, England: John Wiley & Sons Ltd, 440 p.
10. Hardaker, J., Huirne, R.B.M., Anderson, J.R., Lien, G. (2004). Coping With Risk in
Agriculture. Cambridge: CABI, 332 p.
11. Industrial Hemp (1999). Speciality Crops Factsheet. British Columbia Ministry of Agriculture and Food. Retrieved: www.agf.gov.bc.ca/speccrop/publications/.../hempinfo.pdf

113
12. O`Hare, M., Shancez, L., Alstone, P. (2013). Environmental Risks and Opportunities in
Cannabis Cultivation. BOTEC analysis corporation. Retrieved: www.liq.wa.gov/.../SEPA/BOTEC_Whitepaper_Final.pdf
13. Olivier, T., Andlug Consulting, Rödl & Partner, (s.a.). Scoping Study on Financial Risk
Management Instruments for Renewable Energy Projects. United Nations Environment
Programme: Reference document Marsh and Mc Lennan Companies, 142p. Retrieved:
http://www.sefi.unep.org/ fileadmin/media/sefi/docs/publications/RiskMgt_full.pdf
14. Pettere, G., Voronova, I. (2003). Riski uznemejdarbiba un to vadiba: macibu lidzeklis
(Risks in Entrepreneurship: Study Material). Riga: ``Rasa ABC``, 176 lpp.
15. Renn, O. (2008). Concept of Risk: An Interdisciplinary Review In: Proceedings of the ISA
Conference, Barcelona, pp. 3 – 10. Retrieved: http://www.riskanduncertainty.net/TG04/
Ortwin_Renn_ concepts.pdf
16. Rurane, M. (2001). Uznemejdarbibas organizacija un planosana (Planning and organization
of entrepreneurship). Riga: Business College Turiba. 330 lpp.
17. Strazds, G., Stramkale, V., Laizans, T. (2012). Ieteikumi Rupniecisko Kanepju Audzetajiem
un Parstradatajiem (Recommendations for the Industrial Hemp Growers and Processors).
Business College Turiba, Riga, 52 lpp.
18. Santare, D., Rivza, S. (2007). Risku un Krizu Vadisanas Teorijas Iespejas un Metodes
(The Management Methods For Risks And Crisis). No: Lauksaimniecibas un Partikas Risku
Vadisana: Monografija (Risk Management in Agriculture and Food Production: Monograph).
Red. Peteris Rivza. Jelgava: LLU, PVD, RTU, 44. – 70. lpp.
19. Spogis, K. (2005). Risku Ekonomiskas Iespejas vai Draudi un to Seku Novertesana
(Economic Oppurtunities and Treats of Risks and the Risk Consequence Management). In:
Riski lauksaimnieciba un privataja mezsaimnieciba: monografija. (Risks in Agriculture and
Private Forestry: Monograph) Red. Peteris Rivza. Jelgava: LLU, RTU, 385. – 389. lpp.
20. Suskevica, J. (2005). Riska Vadibas Rokasgramata (Risk Management Handbook). Riga:
Dienas bizness, 12. – 38. lpp.
21. Trigilio, S. (2006). Applying the Principles of Risk Management to Nuclear Plant Safety.
International Foundation for Protection Officers, 12 p. Retrieved:
http://www.ifpo.org/articlebank/ Trigilio_Nuclear_Power.pdf
22. Vilnitis, G., Geiba, I., Laizans, T., Stramkale, V. (2011). Industrialo Kanepju Audzesana:
Lidzsineja Pieredze (Experience of Growing Industrial Hemp). Latvia Hemp Growers Association. Retrieved: lathemp.lv/wp-content/uploads/2010/11/Riga_03.11.11_GV.pdf
114
Proceedings of the 2015 International Conference „ECONOMIC SCIENCE FOR RURAL DEVELOPMENT” No37
Jelgava, LLU ESAF, 23-24 April 2015, pp.114-121
THE RELATIONSHIPS OF ECOLOGICAL AND ECONOMIC USE OF
NATURAL RESOURCES
Barbara Golebiewska*, PhD, professor
Faculty of Economics, Warsaw University of Life Sciences
Abstract. The objective of the study is to assess natural resources and draw attention to
economic and environmental aspects of natural resource management. It has been confirmed
that the economic perception of nature and its resources differs from the environmental
perspective. The necessity to reconcile these two approaches has been indicated in the present
work. In order to run a business and preserve the qualities of the natural environment at the
same time, it is necessary to use renewable resources in a manner that warrants that the level
of consumption of these is not higher than the level of production. The issue of balance of
pollutants entering the natural environment seems to be of essential significance. They must
not be generated in quantities that exceed the assimilative capacity of the environment.
Key words: ecology, economy, natural resources
JEL code: Q5
Introduction
The current model of processing of natural resources creates many environmental and
social problems. Disharmony between human activity and the functioning of nature is even
more visible. It is associated mainly with such phenomena as environmental pollution,
contamination, soil erosion, depletion of mineral deposits due to overexploitation, climate
changes etc. It seems necessary to verify the present rules of management. I.G. Simmons
(1979) summarizes this statement, quoting G. P. Marsh: “Man has too long forgotten that the
earth was given to him for usufruct alone, not for consumption, still less for profligate waste”.
Nowadays, however, human activity is focused mainly on making profits, which, to some
extent, shapes the human-nature relationship, in which man exercises (or wants to exercise)
“sovereign power” over nature. Yet, it is also becoming increasingly visible that the condition
of natural environment has impact on the quality of human life. Therefore, people have started
to pay attention to adequate use and consumption of the environmental resources.
Unfavourable changes taking place in the environment indicate the necessity to maintain
balance in natural resource management. If economy and the environment are to grow in
harmony, two principles must be respected: 1) it is necessary to use renewable resources in a
* Corresponding author. Tel. +48 22 5934228, fax: +48 22 5934229.
E-mail address: [email protected]

115
manner that warrants that the level of consumption of these is not higher than the level of
production, 2) pollutants must not be generated in quantities that exceed the assimilative
capacity of the environment (Wos A., Zegar J., 2002). Therefore, M. Deszczka and M.
Wasowicz rightly claim (2013) that the interdependent systems of economy and the
environment should always be reviewed and analysed together, from local to global level.
The objective of the study is to assess natural resources and to define an approach taking
into account the economic and environmental aspects of natural resource management.
Attention has been drawn to the fact that the economic perception of nature and its resources
differs from the environmental perspective. The following research tasks have been performed:
- description of categories of natural resources
- explanation of the meaning of undeveloped areas and their protection
- presentation of the diversified quantities of municipal waste processed in the EU member
states
- presentation of the level of financing of environment protection measures in the EU member
states.
Research results and discussion
Natural resources, their significance and use
Exhaustible and inexhaustible natural resources can be distinguished (Fig. 1). From the
economic point of view, the problem of scarcity is related to the concept stating that a limited
quantity of resources is at the disposal of individual participants of the management process.
Therefore, it seems necessary to choose the resources and their quantity to be dedicated to
produce specific economic goods. The problem of scarcity corresponds mainly to exhaustible
resources of quantity limited with regard to space and time, and it depends primarily on the
intensity and method of human exploitation of the natural environment (Deszczka M.,
Wasowicz M., 2013). The pace of consumption of resources mainly depends on intensity of this
exploitation.
Before man started to exploit the natural resources, the ecosystems were unspoilt (Fig. 2).
Nowadays, they are few places on Earth, in which they have been preserved in an unchanged
condition. Land transformation is defined as the ratio of the level of changes to the natural
conditions.

116
Source: Deszczka M., Wasowicz M., 2013: Economy, ecology, technological progress. W: Marciniak S. (ed.)
2013: Macro and micro economics. PWN, Warsaw, p. 116.
Fig. 1. Division of natural resources
Undeveloped and natural areas can be found only in areas, in which human settlements are
scarce and simple processing technologies are used.
Source: Simmons I.G. 1979: Ecology of natural resources. PWN, Warsaw, p. 75.
Fig. 2. Undeveloped areas and natural ecosystems
According to I.G. Simmons (1979), nowadays, natural areas include those in which natural
condition is maintained deliberately due to its value. These are the main national parks and
reserves. However, the advantages of protection of such areas (in their natural condition) are
often disregarded, as the author claims. Such protection is described as an asset that only
Natural resources
exhaustible
inexhaustible
renewable
non-renewable
mineral
biological
of single use in a
production process
with a possibility to be
used many times in a
production process and
be recovered

117
wealthy countries can afford. However, the problem with pollution has reached a level that
poses a threat to human health and life. Therefore, it is necessary to control business activity
and poorer countries sometimes are forced to bear the negative consequences, if the problem
of pollution is related to increasing prosperity. Here emerges the issue of relations between
economy and ecology. Are the two interdependent? Should they be? To what extent are they
in conflict?
The environment-focused perception of nature and its resources differs from the economic
approach. Under conditions of scarcity of resources, ecology stresses the necessity of
restrictions, whereas economy aims at continuous development. According to A. Hlobil (2009),
when it is necessary to give up the advantages of our civilization in order to protect nature, the
human race will always choose the comfort of civilization at the expense of the environmental
values. Figure 3 presents the relations between economy and ecology.
Source: Deszczka M. and Wasowicz M. (2013). Economy, ecology, technological progress. W: Marciniak S.
(ed.), Macro and micro economics. PWN, Warsaw, pp. 114.
Fig. 3. Relations between economy and ecology
As the diagram indicates, economic goods are made to satisfy the human needs; however, the
process of production and consumption generates (industrial and consumer) waste. Generated
waste can be reused in economy (economic advantage) or stored at a certain cost. If stored
waste is not properly protected, it has negative impact on the environment, leading to its
destruction. Resources used for production and for direct consumption by households or other
entities are subject to destruction. Contaminated and harmful substances reduce the quality of
goods produced and consumed. Generated waste can be recycled and re-used as raw materials
Economic system
Economic system
Consumption process
Ecological system
Resources for production
Substances polluting environment
Beyond production resources for direct
consumption, e.g. water
Industrial and consumer
waste

118
(the so-called secondary raw materials), at the same time reducing consumption of
environmental resources (Deszczka M., Wasowicz M., 2013).
It is an undeniable fact that in the 20th century, people started to consume too much
resources, generate too much waste and inflict irreversible damage to the environment. People
“return” various types of substances, often unfavourable for the environment or even
poisonous, while using natural resources, in order to extract or transform them. In the past,
the environment was able “to absorb” all pollution “generated” by man. The current
regenerative abilities are not sufficient, and negative results of production and consumption for
the environment keep increasing. All countries face the challenge of reducing of the pace of
economic growth and mitigating the impact of consumption of natural resources and waste
production, which is harmful for the environment (Zrownowazona .... 2007).
The impact of factors, which are harmful to the environment is associated, above all, with
industrial activity; however, statistical data indicate that exploitation of products and the
related post-consumed waste are more hazardous (Adamczyk W., 2004). The main sources of
waste in Poland are mining and quarrying (about 52% of the total quantity of generated
waste), industrial processing (20%) and production and transmission of electrical energy
(Environment 2014). Municipal waste is of lesser significance; however, it causes serious
problems in terms of waste disposal; it seems that the simplest method is to remove it to
waste dumps. Among the EU member states, Denmark, Cyprus and Germany produce the
highest levels of municipal waste (Fig. 4). Poland has one of the lowest indices, which kept
decreasing slowly between 2000 and 2012. However, as it was indicated in the Fourth
Assessment Report - European Environment (Zrownowazona ... 2007), the quantity of
municipal waste keeps increasing on average by 2% annually in the pan-European region.
There are considerable differences between individual countries as regards per capita
consumption of natural resources and effectiveness of their use. In Poland, effectiveness of
resource management is still lower than in the majority of the EU member states (Strategia...
2012). Consumption models change as a result of progressive social and economic changes.
Consumption categories, which are most burdensome for the environment, include food and
beverages, private transport and the residential sector.

119
Source: Environment 2014. Statistical Information and Elaborations. Central Statistical Office, Warsaw
2014.
Fig. 4. Changes in the quantity of municipal waste generated in the selected EU
member states in years 2000, 2005 and 2012.
In total, these three areas of consumption are responsible for 70-80% of overall
environmental impact (Zrownowazona ... 2007). However, in economy, production and
delivery of electrical energy, gas and water, transportation services and agriculture exert
pressure on the environment. Modern intensive farming often has negative impact on the
environment due to the associated exploitation and pollution of the air, water and soil. It has
been indicated in the studies of K. Piekut and M. Machnacki (2011), in which the authors claim
that intensification of agricultural production is still profitable and even environmental charges
do not encourage farmers to reduce it. The studies of B. Golebiewska (2012a) confirm this
finding. In analysis of environmental aspects of farming, it was indicated that contribution of
agri-environment payments and other payments to development of rural areas (including i.a.
payments aimed at maintaining ecological balance of the forest environment) was diversified
depending on the impact of individual farms on the environment. The highest payments were
charged for extensive farming (Golebiewska B., 2012b).
Economic issues associated with environmental pollution include financing of protective
measures. Involvement of individual countries in this respect can be assessed i.a. by analysing
the share of expenditures on environmental protection in gross domestic product (GDP). In
general, the share of public sector expenditures for environmental protection in the gross
domestic product varied, but it did not exceed 1.5% in any EU member state (Fig. 5). The

120
highest increase was recorded in Lithuania and in Poland, reaching the level of expenditures of
about 1.1% in GDP.
* Germany in 2012 – no data Source: Environment 2014. Statistical Information and Elaborations. Central Statistical Office, Warsaw
2014.
Fig. 5. The share of investment and current expenditures for environmental
protection in the gross domestic product in selected EU countries
The share ranged between 0.7-0.9% of the gross domestic product in the 1990s. It was
reduced to about 0.55% in 2004 – in the first decade of the 21st century. The index kept
increasing after this point (accession of Poland into the EU); however, it had not reached the
level of 1995 until 2011 (Golebiewska B., 2013). It was not until the year 2012 that a
considerable increase (1.38%) was noted.
Conclusion
It is an undeniable fact that rational use of natural resources and reasonable development of
environment are currently recognized among the most significant duties of the human race.
Unfavourable changes taking place in the environment indicate the necessity to maintain the
balance in management of natural resources. In order to reconcile business activity and
preservation of qualities of the natural environment, it is necessary to use renewable resources
in a manner that warrants that the level of consumption of these is not higher than the level of
production. The issue of balance of pollutants entering the natural environment seems to be of
essential significance. They must not be generated in quantities that exceed the assimilative
capacity of the environment.

121
As it has been indicated in the Assessment Report of the European Environment Agency, one
of the most significant objectives of the EU environmental policy is to eliminate the correlation
between economic development and growing consumption of resources and energy and the
associated environmental impact. It also seems necessary to aim at limiting consumption of
natural resources per product or service unit at all stages of production and consumption.
Therefore, at the current stage of societal development, it seems necessary to reconcile the
economic and the environmental perspective. The increasing environmental hazards,
associated with human activity, make it necessary to educate societies in order preserve the
Earth for future generations.
Bibliography
1. Adamczyk W. (2004). Ekologia wyrobow (Product Ecology). PWE, Warszawa. p. 244.
2. Deszczka M. i Wasowicz M. 2013: Gospodarka, ekologia, postep techniczny (Economy,
Ecology, Technical Progress). W: Marciniak S. (red.), Makro i mikroekonomia. PWN,
Warszawa, p. 663.
3. Environment (2014). Statistical Information and Elaborations. Central Statistical Office,
Warsaw 2014. p. 593.
4. Golebiewska B. (2012a). Evolution of Functions of Agriculture and Its Economic and
Ecological Effects. Zold gazdasoaag es versenykepesseg? Green economy and
competitiveness?: 13-th International Scientific Days - Gyongyos: Karoly Robert Foiskola,
p. 1531-1535.
5. Golebiewska B. (2012b). Economic and Environmental Objectives of the Agricultural
Production in Farms of Varied Relations with the Environment. Roczniki Naukowe SERiA.
Tom 14, z. 5, pp. 57-60.
6. Golebiewska B. (2013). Condition and Trends in Development of Environmental Protection
in Poland. International Scientific Electronic Journal “Earth Bioresources and Life Quality”,
nr 4. Retrieved: http://gchera-ejournal.nubip.edu.ua/ Access: 12.12.2014].
7. Hlobil A. (2009). Motywy ochrony srodowiska a zachowania proekologiczne czlowieka (The
Issues of Environmental Protection and Pre-ecological Behaviour of Humans). Monografie
Komitetu Inzynierii Srodowiska PAN nr 59. pp. 49-54. Retrieved: http://wis.pol.lublin.pl/
kongres3/tom2/6.pdf. Access: 2.01.2014.
8. Piekut K, Machnacki M. (2011). Ocena ekologiczno-ekonomiczna gospodarstw rolnych na
podstawie danych FADN. Woda-Srodowisko-Obszary Wiejskie (Ecological and Economic
Assessment of Farms Based on FADN Data. Water-Environment-Rural Areas). T.11, z. 1.
pp. 203-219.
9. Simmons I.G. (1979). The Ecology of Natural Resources. PWN, Warsaw, p. 501.
10. Strategia innowacyjnosci i efektywnosci gospodarki na lata 2012-2020. Dynamiczna
Polska. Ministerstwo Gospodarki (The Strategy of Innovation and Efficiency of the
Economy in 2012-2020. Dynamic Poland. Ministry of Economy). Warszawa 2012.
Retrieved: www.rpo.wzp.pl/download/ index/biblioteka/9491. Access: 31.12.2014.
11. Wos A., Zegar J. (2002). Rolnictwo spolecznie zrownowazone (Socially Sustainable
Agriculture). Wyd. IERiGZ, Warszawa. p. 111.
12. Zrownowazona produkcja i konsumpcja (Sustainable Production and Consumption), 2007.
Srodowisko Europy, Czwarty Raport Oceny, European Environment Agency. Retrieved:
www.eea.europa.eu/pl/publications/state_of_environment_report. Access: 30.12.2014.

122
LAND MANAGEMENT PATERNS IN LATVIA AND ITS REGIONS
Irina Pilvere1, Dr.oec.+*, Agnese Krievina2, Dr.oec., Aleksejs Nipers1,Dr.oec.
1 Latvia University of Agriculture, Faculty of Economics and Social Development
2 Latvian State Institute of Agrarian Economics
Abstract. Efficient land use plays an important role in the context of sustainable
agricultural development. Assuming that it will be viable only in cases when individuals
employed in agriculture can ensure themselves an income equivalent and not less than the
average wage in the national economy. Certain sizes of agricultural area, which are different
for every key agricultural sector, are required to achieve it. The present research analyses the
minimum land area needed in field crop, dairy and grazing livestock farming in Latvia and its
regions depending on land quality and the amount of support payments received. The research
sets the following aim: to identify the minimum areas needed in agriculture in Latvia in order
to ensure sustainable farm management depending on land quality and, in the regions, the
amount of support payments received. A minimum land area for sustainable farm management
in Latvia per individual varies from 48.3 ha in dairy farming to 65.5 ha in field crop farming.
However, there are major differences depending on land quality and in the amount of support
payments received.
Key words: agricultural land, area, income.
JEL code: Q01, Q15.
Introduction
Integrating the principles of sustainable development within sector policies is one of the
main strategic objectives of the European Union. As pointed by E.Majewski (2013), the concept
of “Sustainable Development” is multidimensional, and sustainability can be measured on
various levels, in space and time. This provides a wide field for the search of methods of
measuring “sustainability”, which are addressed to different sustainability aspects.
Every day, farmers and ranchers around the world develop new, innovative strategies to
produce and distribute food, fuel and fibber sustainably. While these strategies vary greatly,
they all embrace three broad goals or the 3 Pillars of Sustainability: 1) profit over the long
term; 2) stewardship of a nation’s land, air and water; 3) quality of life for farmers, ranchers
+Tel.:+371 29217851 E-mail address:[email protected]
Proceedings of the 2015 International Conference “ECONOMIC SCIENCE FOR RURAL DEVELOPMENT” No37
Jelgava, LLU ESAF, 23-24 April 2015, pp. 122-133

123
and their communities (Sustainable Agriculture Research…, s.a.). As farmers assume more
responsibility for managing natural resources, they play an increasingly important role in
assessing sustainable agriculture (Belanger et al., 2012). Serageldin I. (1999) stresses that
rethinking resource use is a major issue in terms of sustainability in the medium- to long term,
because it is a given that population pressure is going to be there. This also refers to land as
the key natural resource exploited in agricultural production.
Antonella Trisorio (2004) emphasises that the economic dimension of sustainability mainly
refers to: a) efficient use of resources; b) competitiveness and viability in the agriculture
sector; c) profitability of the agriculture sector; d) agriculture’s contribution to the
development and/or conservation of rural areas; e) the diversification of sources of income
within farming families.
Agriculture income derives from the revenues received from the labour input, interest
payments, rent of land payments and profit from agriculture activities. All these income flows
are generated by the factors of agriculture production: land, labour, capital and
entrepreneurship (Cepaitiene, Vinciuniene, 2009). But land is the key resource without which
no production and income generation in agriculture is possible.
Efficient land use in the context of sustainable agriculture has been widely researched by
scientists of various countries, for instance, C.Gutzler, K. Helming, D. Balla et al. (2015);
H.Wiggering, U.Steinhardt (2015); V.Popescu, G.Popescu, C. Popescu (2015); M. Hartvigsen
(2014); L.Latruffe and P. Laurent (2014) and others.
Since the potential of land use in agriculture in Latvia has not been fully exploited (Dobele,
2005; Baumane, 2012; Pilvere, Nipers, Upite, 2014 and others), it is important to identify the
minimum land areas, the management of which is profitable in various agricultural industries,
and the factors affecting it.
Therefore, the research sets the following aim: to identify the minimum areas needed in
agriculture in Latvia in order to ensure sustainable farm management depending on land
quality and, in the regions, the amount of support payments received (in this case term
sustainable farming is understood as one where individuals can ensure themselves an income
equivalent and not less than the average wage in the national economy).
In accordance with this aim, the following specific research tasks were defined:
to analyse the effects of land quality on land management in Latvia;
to assess the role of financial support in land management in Latvia and in its
regions.
Analysis, synthesis, logical and constructive methods were employed to tackle the research
tasks. The study analysed information and data from the Central Statistical Bureau (CSB) and
the Farm Accountancy Data Network (FADN).
In Latvia, the minimum land areas needed to ensure sustainable farm management are
different among various agricultural industries; accordingly, for a detailed analysis, the key

124
agricultural sectors associated with land use were selected: a) field crop farming; b) dairy
farming; c) grazing livestock farming, as these sectors contributed to 66% of the total output
of agricultural goods at base prices (product subsidies included) in Latvia in 2012 (MoA, 2013).
The research assumes that individuals employed on agricultural holdings can provide
themselves with an income equivalent to at least the average wage in the national economy.
Otherwise, one can consider that the mentioned way of earning one’s living is not sustainable.
It is assumed that in order an agricultural holding is viable, at least one individual has to gain
an income from agricultural activity that is equivalent to the average wage in Latvia (with
labour taxes paid). A widespread model of agricultural holdings in Latvia is a family farm in
which two adults work, as the average number of agricultural annual work units is equal to 2.2
(CSB, 2010). Therefore, calculations are performed also for an assumption that in order an
agricultural holding is viable, at least two individuals could gain an income from agricultural
activity that is equivalent to the average wage in Latvia (with labour taxes paid). The average
wage in the country is calculated based on the CSB data for 2013, and the calculations employ
the minimum income level (MIL): EUR 10 619 per employee and EUR 21 238 per two fulltime
employees (CSB, 2013).
With increase in the size of land area, farms gain greater revenue per ha. The increase may
be characterised by a function, according to which, on farms with a smaller land area, every
additional hectare of land increases total revenue (in the form of profit and wages) more than
on large farms. This situation may be described by a logarithmic function:
π / ha = b ln (ha + a) + c [1]
where π – revenue;
ha – land area of the farm;
a, b, c – equation coefficients.
At the same time, greater revenue per ha directly affects the area needed for ensuring the
minimum income level. In this case, the minimum land area for ensuring the minimum income
level may be expressed by means of the following equation:
hamin = πmin / (π / ha) [2]
where πmin – minimum revenue for sustainable farm management;
hamin – minimum land area for sustainable farm management.
By combining both equations, the functional dependence of the minimum land area on the
total area of a farm is as follows:
hamin = πmin / (b ln (ha + a) + c) [3]
The present research employed the FADN data. The FADN is a survey carried out by the EU
Member States. It was established in 1965 in accordance with Regulation No 79/65 of the
Council of 15 June 1965 setting up a network for the collection of data on the incomes and

125
business operation of agricultural holdings in the European Economic Community. The target
size of the sample for the FADN in Latvia is 1000 farms (Bratka, Praulins, 2007).
Based on the FADN data, the minimum income level is calculated as revenue made up of
the value of products, financial support for production and investment support minus the cost
of goods and services, depreciation of fixed assets, interest payments, rent and production
taxes. Accordingly, the revenue used in the analysis is calculated by the following formula:
π = q + sp + si - ic - d - i - r - t [4]
where π – revenue of the farm;
q – total output of the farm;
sp – financial support for production received by the farm;
si – investment support received by the farm;
ic – intermediate consumption by the farm;
d – depreciation of the farm’s fixed assets;
i – interest payments made by the farm;
r – rent paid by the farm;
t – production taxes paid by the farm.
In this case, the farm’s revenue is the remaining value that may be used for paying wages,
offsetting a decrease in equity capital and for profit.
The revenue calculated are then expressed per ha of farmed land, and the minimum area is
calculated by dividing the minimum income level that was set for ensuring sustainable farm
management by the return on land (according to Formula 2).
The calculations of minimum land areas needed to ensure a minimum income per employee
were performed based on the FADN data for groups of farms with standard outputs (SO) of, on
average, EUR 4-15 thou, EUR 15-25 thou or EUR 25-50 thou for a 5 year period (2008-2012).
Average land areas, which determine an approximate productivity level at a certain quantity
produced, are calculated for the groups of farms of particular specialisation.
The overall economic performance of farms of particular specialisation is assessed for
identifying the minimum land area in the particular industry.
The minimum land area in Latvia’s regions was identified taking into account only the
differences in land quality among the regions (average agricultural land qualitative estimates
were calculated and employed to provide the characteristics of the differences) and the related
Rural Development Programme measure “Payments to Farmers in Areas with Handicaps, Other
than Mountain Areas” (LFA). LFA support rates for the regions in accordance with the LFA
categories set for the level of rural territories were employed to identify the LFA support level.
The minimum land areas for the regions were calculated by adjusting the average farm
performance results in the country.

126
Sensitivity for a minimum land area needed, depending on land quality, was calculated
based on the FADN data, using only the data on products associated with a particular industry
and related costs. Given the fluctuations in land quality, a minimum land area was calculated
as follows:
hamin’ = πmin / (π’ / ha) [5]
where hamin’ – minimum land area needed for sustainable farm management, taking into
consideration the changes in land quality;
πmin – minimum revenue needed for sustainable farm management;
π’– revenue of the farm, taking into consideration the changes in land quality.
In the EU, the FADN data are classified by region, using the territorial division in accordance
with the Nomenclature of Territorial Units for Statistics (NUTS) classification. In Latvia, the
following administrative and territorial division exists in accordance with the NUTS
classification: the whole territory of the country corresponds to Level 1 and Level 2, there are
five agricultural regions at Level 3: Pieriga, Vidzeme, Kurzeme, Zemgale, and Latgale (LSAEI,
2012).
Research results and discussion
1. Effects of land quality on land management
Land quality directly affects the return on land. With costs being equal, quantities of
products produced on quality and low quality land are different, thus, affecting revenues and,
in their turn, incomes. Yet, it has to be stressed that these calculations were performed for
equal support payments (the payments were equal to the average national support payment
level in the period 2008-2012) for various land quality groups.
In case of high quality land, the minimum land area has to be smaller than the average.
However, in case of low quality land, the minimum land area has to be greater than the
average. To understand the scale of this effect, calculations were performed for field crops
(grains and rapeseed) and the results are presented in Table 1.
Table 1
Average minimum land areas required in field crop farming depending on land
quality in Latvia in the period 2008-2012
Indicators
Land quality
25
points
32
points
Average field
crop land
quality in the
country – 40
points
45
points
50
points
60
points
Minimum area, ha (MIL 1) 444.5 120.1 65.5 51 41.7 30.6
% of the average value 679 183 100 78 64 47
Minimum area, ha (MIL 2) 889.1 205.3 108.9 84.1 68.6 50.1
% of the average value 816 189 100 77 63 46 Source: authors’ calculations based on LSIAE 2009, 2010, 2011, 2012a, 2013

127
As shown in Table 1, given the different land quality in Latvia’s regions and, accordingly,
different rates of return on land, the minimum land area for a farm was adjusted based on
agricultural land qualitative estimates measured in points. The result obtained reflect the
situation for farms with a SO within a range from EUR 15 000 to EUR 25 000 at a MIL 1 and a
SO from EUR 25 000 to EUR 50 000 at a MIL 2. For farms with a higher agricultural land
qualitative estimate, the minimum land area is smaller. For instance, if the land qualitative
estimate is 60 points, on average, 30.6 ha had to be exploited to provide a MIL 1 in the period
2008-2012, while for a MIL 2 this required 50.1 ha. With decrease in land quality, the
minimum area to be exploited for ensuring a minimum income level increases. For example, at
a land qualitative estimate of 25 points, an agricultural area of more than 400 ha was needed
to provide a MIL 1 in the period 2008-2012. Yet, it should be emphasised that these
calculations were performed for equal financial support payments (the payments were equal to
the average national support payment level in the period 2008-2012) for various land quality
groups.
The calculation methodology provides that livestock farming – dairy and grazing livestock
farming – is associated with the areas of permanent grasses sown in arable land (PGSAL) and
permanent meadows and pastures (PMP), as these areas are the basis for milk and meat
production. The cost of milk production as well as the revenue from sales of milk was
calculated to determine the cost of producing permanent grasses sown in arable land. The
production cost of PGSAL and that of milk are interrelated to each other by a coefficient that
reflects the area needed per animal, taking into account the yield of sown grasses. In a similar
way, the area of PMP needed for raising grazing cattle was also determined.
The average quality of land under PMP and PGSAL in the country is equal to 36.9 points,
while changes in the minimum land area were assessed at agricultural land qualitative
estimates within a range from 25 to 60 points. As land quality varies, the minimum land area
for a farm was adjusted to examine the effect of the change. One has to conclude that the
effect of land quality change in dairy farming is smaller than for field crops. For example, if the
land quality declines from 36.9 to 32 points, the minimum land area needed increases by only
18%. If the land quality, in points, increases from 36.9 to 45, the minimum land area needed
decreases by 17% (Table 2).

128
Table 2
Average minimum land areas required in livestock farming depending on land quality
in Latvia in the period 2008-2012
Indicators
Land quality
25
points
32
points
Average PMP
and PGSAL land
quality in the
country – 36.9
points
45
points
60
points
Dairy farming
Minimum area, ha (MIL 1) 79.4 56.8 48.3 39.9 32.8
Minimum area, ha (MIL 2) 138.8 99.2 84.4 69.8 57.2
% of the average value (MIL 1 and MIL 2) 164 118 100 83 68
Grazing livestock farming
Minimum area, ha (MIL 1) 82.9 62 53.7 45.2 37.7
Minimum area, ha (MIL 2) 155.6 116.4 100.8 84.8 70.7
% of the average value (MIL 1 and MIL 2) 154 115 100 84 70
Source: authors’ calculations based on LSIAE 2009, 2010, 2011, 2012a, 2013
The range of change in the minimum land area, depending on land qualitative estimates, in
the sector of grazing livestock is smaller than for field crop farms and slightly smaller than in
the sector of dairy livestock. So, one can conclude that in the sector of grazing livestock, the
effect of land quality is not as important as for field crops. For instance, if the land quality is as
high as 60 points, in the period 2008-2012, 37.3 ha had to be exploited to provide a MIL 1 and
70.7 ha for a MIL 2. In contrast, at a land qualitative estimate of 25 points, 82.9 ha and 155.6
ha were needed to provide a MIL 1 and a MIL 2, respectively, in the period 2008-2012.
2. Effects of financial support on land management in Latvia and its regions
To take into account the differences in support payments, the minimum land area was
calculated not only for the entire country but also for its regions (Table 3).
Table 3
Average minimum land areas required to achieve a MIL 1 in Latvia and its regions in
the period 2008-2012
Indicators National
average
Average
in Pieriga
Average
in
Vidzeme
Average
in
Kurzeme
Average
in
Zemgale
Average
in
Latgale
Field crop farming
Total support per ha, EUR 177.1 163.9 188.4 178.2 172.1 202.4
Revenue per ha, EUR 162.2 161.5 158.3 167.5 185.2 158.4
Minimum area, ha (MIL 1) 65.5 65.8 67.1 63.4 57.3 67.0
Dairy farming
Total support per ha, EUR 236.6 205.2 239.3 227.9 249.3 243.9
Revenue per ha, EUR 219.8 198.4 214.9 216.0 248.9 213.4
Minimum area, ha (MIL 1) 48.3 53.5 49.4 49.2 42.7 49.8
Grazing livestock farming
Total support per ha, EUR 287.4 232.5 283.3 263.6 286.1 291.7
Revenue per ha, EUR 197.9 165.3 191.1 184.6 208 193.4
Minimum area, ha (MIL 1) 53.7 64.2 55.6 57.5 51.1 54.9 Source: authors’ calculations based on LSIAE 2009, 2010, 2011, 2012a, 2013

129
Receiving a total support of EUR 177.1 per ha, the production of field crops in Latvia
provides an income of EUR 162.2 per ha, and, in order to achieve a MIL 1 within a year, a farm
has to exploit at least 65.5 ha. Regionally, a substantially lower minimum area was identified
for farms in Zemgale region – 57.3 ha or 13% less than on average in the country (even
though support payments per ha were smaller there than on average in the country). This is
associated with higher returns on land for the farms located in this region. An income, too, per
ha on the farms of this region is much greater – by 14% more than in comparison with the
average situation in the country. In the regions of Latgale and Vidzeme, farms need a greater
minimum land area to provide a MIL 1, 67 ha and 67.1 ha, respectively, which may be
explained by the smallest quantity of products produced per ha.
In the five-year period, the situation in Latvia’s regions on dairy farms differs both in terms
of value of products produced and in terms of income and, accordingly, minimum land area. In
Latvia, dairy farms with a SO of EUR 15-25 thou, which employ one AWU, need to exploit, on
average, 48.3 ha. Such a performance result can be achieved producing products worth EUR
563.8 per ha, while the total cost is equal to EUR 580.6 and the investment and production
financial assistance amounts to EUR 236.6. The total income per ha on farms is equal to EUR
219.8. In Latvia’s regions, the minimum land area to provide a minimum income level varies
from 42.7 ha in Zemgale to 53.5 ha in Pieriga. Zemgale region is characterised by the highest
value of products produced per ha (EUR 641.3), which is 14% more than on average in Latvia.
An income per ha, too, is the highest, which results from the smallest difference between the
value of sold products and the total cost as well as the large amount of support.
In Pieriga region, however, farms need the largest area – 11% more than on average in
Latvia. A significantly lower total value of products per ha (94% of the average in Latvia) as
well as the smallest amount of support for this region’s farms generate the lowest income per
ha (EUR 198.4 or 90% of the average in Latvia). In Vidzeme, Kurzeme and Latgale, the
minimum area is relatively similar in size despite the differences in production efficiency, which
determines the value of products per ha.
Receiving a total support of EUR 287.4 per ha, the production of products of grazing
livestock generates, on average, an income of EUR 197.9 per ha in Latvia, and, in order to
achieve a MIL 1 within a year, a farm has to exploit at last 53.7 ha. Regionally, a slightly
smaller (5%) minimum area was identified for farms in Zemgale, 51.1 ha. The quantity of
products produced and an income per ha are greater on farms of this region in comparison
with the average situation in the country. One has to note that the amount of support received
by Zemgale region’s farms is among the highest (second position behind Latgale region). The
poorest performance results were presented by farms in Kurzeme and especially in Pieriga
where the largest minimum land area is required to provide a MIL 1, 57.5 ha and 64.2 ha,
respectively. The key reason relates to the facts that the smallest quantity of products and the
lowest amount of support per ha are observed for these regions.

130
Table 4
Average minimum land areas required to achieve a MIL 2 in Latvia and its regions in
the period 2008-2012
Indicators National
average
Average
in Pieriga
Average
in
Vidzeme
Average in
Kurzeme
Average
in
Zemgale
Average
in
Latgale
Field crop farming
Total support per ha, EUR 215.3 198.3 225.1 214.7 209.8 240.7
Revenue per ha, EUR 195.0 193.7 188.3 200.5 223.2 187.7
Minimum area, ha (MIL 2) 108.9 109.7 112.8 105.9 95.2 113.2
Dairy farming
Total support per ha, EUR 265 219.5 256.3 244.5 269.4 260.9
Revenue per ha, EUR 251.6 218 236.2 238 275.7 234.4
Minimum area, ha (MIL 2) 84.4 97.4 89.9 89.2 77.0 90.6
Grazing livestock farming
Total support per ha, EUR 297.1 247.5 300.5 280.2 304.7 309.1
Revenue per ha, EUR 210.7 181.1 208.6 201.8 226.9 211
Minimum area, ha (MIL 2) 100.8 117.3 101.8 105.3 93.6 100.6 Source: authors’ calculations based on LSIAE 2009, 2010, 2011, 2012a, 2013
To provide a MIL 2, a minimum land area for field crops, on average in Latvia, is equal to
108.9 ha. The calculations showed that to provide a MIL 2, the situation across the regions
was similar to that for a MIL 1. The smallest minimum land area is needed in Zemgale region,
95.2 ha, whereas the largest one is required on Latgale region’s farms, 113.2 ha. Like in
Latgale, about 113 ha for field crops are needed to provide a MIL 2 in Vidzeme, too, where
farms generate the largest income without financial support, while the financial support is EUR
15.6 per ha smaller there.
The situation in dairy farming in Latvia’s regions on farms employing 2 AWU and generating
a SO of EUR 25-50 thou is characterised by similar trends. On average, in the country, the
total quantity of products and the cost per ha make up a gap of EUR 13.1; an income per ha is
EUR 251.6, which is substantially affected by the total assistance of EUR 265 per ha.
Accordingly, on average, an area of 84.4 ha has to be annually exploited in Latvia to achieve
the required income level.
The smallest minimum area is needed on dairy farms in Zemgale, 77 ha or by 9% less than
on average in the country, whereas the largest one is required on farms located in Pieriga
region, 97.4 ha or by 15% more than on average in the country. The difference in the
minimum area is mainly determined by the differences in the total value of products produced
as well as the size of total cost per ha.
To provide a MIL 2 in the sector of grazing livestock, on average, a minimum area of 100.8
ha is needed in the country. According to the calculations, to provide a MIL 2, the situation
across the regions is similar to that for a MIL 1. The smallest minimum land area is needed in
Zemgale region, 93.6 ha (the quantity of products produced is the greatest as well as the
amount of support received is the greatest), whereas the largest minimum land area is needed
on Pieriga region’s farms, 117.3 ha.

131
A similar situation is observed on grazing livestock farms in Latgale and Vidzeme as well as
in Kurzeme where farms are only slightly in a poorer situation, receiving a comparatively
smaller amount of support.
Conclusions
Yields of agricultural crops and, thus, the size of land area needed to provide the minimum
income are significantly affected by land quality. In field crop farming, at the average land
qualitative estimate of 39.6 points, the minimum land area needed is 65.5 ha , while at a lower
estimate, 32 points, it is 120.1 ha and at an estimate of 50 points, the area needed decreases
to 41.7 ha. In dairy farming and in the sector of grazing livestock, the smallest effect of the
difference in land quality is observed for field crop farming, as the minimum land area needed
to generate the minimum income varies from 32.8 ha to 79.4 ha, while for grazing livestock it
ranges from 37.7 ha to 82.9 ha.
Regionally, the financial assistance received only partially offsets the differences created by
land quality. Regardless of the sizes of support payments, among the groups of farms
specialising in dairy and meat livestock, slightly better performance results are presented by
Zemgale region’s farmers; to earn the minimum income, 57.3 ha are needed in field crop
farming, 42.7 ha in dairy farming and 51.1 ha in grazing livestock farming, while 65.8 ha, 53.5
ha and 64.2 ha, respectively, are needed in Pieriga.
Acknowledgment
This research paper is prepared with the support of the JSC Latvijas valsts mezi and refers
to research carried out within the project “Social and Economic Assessment of Various Land
Management Models”.
Bibliography
1. Baumane, V. (2012). Analysis of Land Using in Latvia Municipalities Rural Territory of Ligo. Baltic
Surveying 2012: proceedings of the international scientific methodical conference. Tartu, Estonia
University of Life Sciences, pp. 26.-33.
2. Belanger, V., Vanasse, A., Parent, D., Allard, G., Pellerin, D. (2012). Development of Agri-
Environmental Indicators to Assess Dairy Farm Sustainability in Quebec, Eastern Canada.
Retrieved: http://ac.els-cdn.com.ezproxy.llu.lv/S1470160X12001963/1-s2.0-
S1470160X12001963-main.pdf?_tid=e9a66e40-8e83-11e4-bcd1-00000aab0f01&acdnat=
1419765974_eacd20c8eae1e2e1a76210566ba2d14f. Accessed: 28.12.2014.
3. Bratka, V., Praulins, A. (2007). Calculation of Replacement Value of Fixed Assets for the Purpose
of FADN in Latvia. The Economic and Social Issues of Sustainable Development Volume III,
Agricultural University of Szczecin, Poland, pp.5-12.
4. Central Statistical Bureau (CSB) (2010). Agricultural Census Results – 2010 data. LSK10-V03.
REGULAR LABOUR FORCE IN AGRICULTURE AND NUMBER OF ANNUAL WORK UNITS BY
COUNTY. Retrieved: http://data.csb.gov.lv/pxweb/lv/laukskait_10/laukskait_10__darb/LSK10-
V03.px/table/ tableViewLayout1/?rxid=f0b92386-198b-4591-a07f-8d4a907de219. Accessed:
20.12.2014.

132
5. Central Statistical Bureau (CSB) (2013). DSG01. AVERAGE MONTHLY WAGES AND SALARIES
(euro). Retrieved: http://data.csb.gov.lv/pxweb/lv/Sociala/Sociala__ikgad__dsamaksa/ DS0010_euro.px/table/tableViewLayout1/?rxid=cdcb978c-22b0-416a-aacc-aa650d3e2ce0.
Accessed: 22.12.2014.
6. Cepaitiene, N., Vinciuniene, V. (2009). Conceptual Issues of Comparative Analysis of Agriculture
Income in Lithuania. Proceedings of the International Scientific Conference: Rural Development,
vol. 4.1, pp. 172-177, Academic Search Complete, EBSCOhost. Accessed: 29.12.2014.
7. Dobele, A. (2005). Use of Land Resources in Latvia (in Latvian). Summary of Doctoral
Dissertation, Latvia University of Agriculture, Jelgava, p.33.
8. Gutzler, C., Helming, K., Balla, D., Dannowski, R., Deumlich, D., Glemnitz, M., Knierim, A.,
Mirschel, W., Nendel, C., Paul, C., Sieber, S., Stachow, U., Starick, A., Wieland, R., Wurbs, A., &
Zander, P. (2015). Agricultural Land Use Changes – a Scenario-Based Sustainability Impact
Assessment for Brandenburg, Germany. Ecological Indicators, 48, pp. 505-517, Academic
Search Complete, EBSCOhost. Accessed: 04.01.2015.
9. Hartvigsen, M. (2014). Land Reform and Land Fragmentation in Central and Eastern Europe.
Land Use Policy, No. 36 pp. 330–341.
10. Latruffe, L., Laurent, P. (2014). Does Land Fragmentation Affect Farm Performance? A Case
Study from Brittany, France. In: Agricultural Systems, Vol.129, pp. 68-80. Academic Search
Complete, EBSCOhost. Accessed: 28.12.2014.
11. Ministry of Agriculture of the Republic of Latvia (MoA) (2013). Agriculture of Latvia in 2013 (in
Latvian). Riga, p.157.
12. Latvian State Institute of Agrarian Economics (LSIAE) (2009). Agricultural Holdings. Results of
Economic Analysis 2008 (FADN), Riga. Retrieved:
https://sudat.lvaei.lv/Login.aspx?ReturnUrl=%2fDefault.aspx. Accessed: 08.2014.
13. Latvian State Institute of Agrarian Economics (LSIAE) (2010). Agricultural Holdings. Results of
Economic Analysis 2009 (FADN), Riga, Retrieved:
https://sudat.lvaei.lv/Login.aspx?ReturnUrl=%2fDefault.aspx. Accessed: 09.2014.
14. Latvian State Institute of Agrarian Economics (LSIAE) (2011). Agricultural Holdings. Results of
Economic Analysis 2010 (FADN), Riga. Retrieved:
https://sudat.lvaei.lv/Login.aspx?ReturnUrl=%2fDefault.aspx. Accessed: 10.2014.
15. Latvian State Institute of Agrarian Economics (LSIAE) (2012a). Agricultural Holdings. Results of
Economic Analysis 2011 (FADN), Riga. Retrieved:
https://sudat.lvaei.lv/Login.aspx?ReturnUrl=%2fDefault.aspx. Accessed: 11.2014.
16. Latvian State Institute of Agrarian Economics (LSIAE) (2012b). Methodology for the Farm
Accountancy Data Network (in Latvian). Riga, p.18.
17. Latvian State Institute of Agrarian Economics (LSIAE) (2013). ). Agricultural Holdings. Results
of Economic Analysis 2012 (FADN), Riga. Retrieved:
https://sudat.lvaei.lv/Login.aspx?ReturnUrl=%2fDefault.aspx. Accessed: 12.2014.
18. Majewski, E. (2013). Measuring and Modelling Farm Level Sustainability. Visegrad Journal on
Bioeconomy and Sustainable Development, vol. 2, 2013, no. 1, pp.2–10.
19. Pilvere, I., Nipers, A., Upite, I. (2014). Agricultural Land Utilization Efficiency: the Case of Latvia.
IJTEF International Journal of Trade, Economics and Finance. IACSITPRESS, Singapore, Vol.5,
No.1, February 2014, pp.65-71.
20. Popescu, V., Popescu, G., Popescu, C. (2015). The Relation Productivity - Environment in the
Context of Sustainable Development – Case Study on the Romanian Industry. Metalurgija,
No.54, 1, pp. 286-288, Academic Search Complete, EBSCOhost. Accessed: 06.01.2015.
21. Serageldin, I. (1999). Sustainable Agriculture for a Food Secure Third World. Social
Research, Vol. 66(1), pp.105-115.
22. Sustainable Agriculture Research & Education (SARE) Program by the National Institute of Food
and Agriculture, U.S. Department of Agriculture (s.a.). What is Sustainable Agriculture?

133
Retrieved: http://www.sare.org/Learning-Center/SARE-Program-Materials/National-Program-
Materials/What-is-Sustainable-Agriculture. Accessed: 28.12.2014.
23. Trisorio, A. (2004). Measuring Sustainability. Indicators for Italian Agriculture. Ministry for
Agricultural and Forestry Policies. National Institute of Agricultural Economics. p.178.
24. Wiggering, H., Steinhardt, U. (2015). A Conceptual Model for Site-Specific Agricultural Land-
Use. Ecological Modelling, No. 295, pp. 42-46, Academic Search Complete, EBSCOhost.
Accessed: 06.01.2015.

134
AGRICULTURAL BIOGAS PRODUCTION AND THE DEVELOPMENT OF
PROSUMER ENERGY IN POLAND*
Piotr Gołasa1, PhD
1 Warsaw University of Life Sciences (SGGW), Faculty of Economics Sciences
Abstract. The first part of the article presents basic information affecting the development of
renewable energy sources (RES) and the theoretical basis for state activities resulting from the
concept of external effects and public goods. In the second part data from the Agency for
Restructuring and Modernisation of Agriculture (ARMA) were used to estimate the possibility of
establishing agricultural biogas plants on Polish territory as well as their current number and
installed capacity. It has been found that the potential for production of agricultural biogas is
used to a small degree and by very large installations, which is not conducive to the
development of prosumer energy. Two reasons have been identified for the aforementioned
situation: the high start-up costs of such operations and inconsistent state policy aimed at
supporting RES. The situation is further worsened by a lack of RES legislation and the
directions of proposed changes, which are shifting to support for large energy producers at the
expense of prosumers.
Key words: agricultural biogas, renewable energy, prosumer
JEL code: Q5
Introduction
According to the latest results of observations conducted by the World Meteorological
Organization (WMO), the year 2014 has been the warmest year in the history of official
measurements (WMO, 2014) and even since the year 1500. This is confirmed by data from the
Polish Institute of Meteorology and Water Management (IMWM). What is more, the ten
warmest years in the history of observations have occurred since 2000 (National Climatic Data
Center). Therefore, an increasingly large part of society is taking notice of the changes in
climate and the need to take actions aimed at halting them. Despite significant problems of a
* Research funded under the NCN project "Ekonomiczne uwarunkowania produkcji bioenergii w gospodarstwach
rolnych" (Economic Conditions for Bioenergy Production on Farms) contract UMO-2011/01/B/HS4/06220 Corresponding author. Tel.: +48 225934083 fax: + 48 225934083
E-mail address: [email protected]
Proceedings of the 2015 International Conference “ECONOMIC SCIENCE FOR RURAL DEVELOPMENT” No37
Jelgava, LLU ESAF, 23-24 April 2015, pp. 134-141

135
political and economic nature, the UE implemented such actions. During a summit of the EU
leaders held in October 2014, they reached an agreement on climate protection. According to
it, firstly, the EU shall, as a whole, reduce CO2 emissions by 2030 by at least 40% when
compared to the year 1990. Secondly, the share of renewable energy sources in total electrical
energy used is to reach a minimum share of 27% by 2030. It remains an open question
whether these goals are not overly ambitious, taking into account the delays and resistance of
other countries to bearing the costs of climate protection (Golasa, P., Lenort, R., Wysokinski,
M., Baran, J., Bienkowska-Gołasa., 2014). However, the development of renewable energy
sources forced by this agreement has become a chance for the development of said sources,
especially in rural areas.
The aim of this article is to determine the possibilities for agricultural biogas production in
Poland and the opportunities for development of prosumer energy. To achieve the aim, the
following research tasks were set:
to analyse agricultural biogas production opportunities in particular regions in
Poland;
to identify existing biogas plants and to characterise their average power.
The first part of the article presents the theoretical basis of environmental economics, while
the second part uses data from the Agency for Restructuring and Modernisation of Agriculture
on farms, and from the Energy Regulatory Office (ERO) on the number and capacity of biogas
plants, in order to execute the study objectives.
Research results and discussion
Theoretical economic basis for RES support
With current technical capabilities, production of renewable energy production is
significantly more expensive than conventional energy. In order for it to develop, countries
must establish special conditions and support systems. Thus the question arises regarding the
theoretical basis for such an intervention, its sources and methods. This issue is the subject of
environmental economics. The problem can be approached from the perspective of two
imperfections in the market of external effects and public goods (Stiglitz I. E., 2004)
The first one occurs when the actions of one entity impact the state of other individuals.
This effect can generate costs for them, which is when negative external effects occur, or give
benefits (positive external effects). This results in sub-optimal allocation of resources, as per
the Pareto principle, as one of the optimum conditions, on the equality of marginal
transformations and substitutions, is broken (Acocella N., 2002). In the case of negative
external effects, entities behind them fail to bear the full costs of their actions, which leads to
the scale of their operations becoming excessively large. If the issue is examined from the

136
perspective of the environment being as a public good, there is a problem of no disclosure of
preferences in terms of both demand and supply of these goods. Public goods are used by
everybody, regardless of whether they bear the costs of their maintenance or not. Accordingly,
the phenomena of external effects and public goods are mutually aligned, since in both cases
discrepancies occur in terms of private and social costs (Fiedor B., 2002).
The question arises whether the state should intervene in such a situation. According to
Coase, it should not because each party, the one injured and the one benefiting, can conduct
negotiations on the removal of the effects in questions, so as to obtain the socially desired
effect (Coase R. H., 1960). In the current economic situation, negative external effects
resulting from the impact of businesses on the environment, have the most significance. As
negotiations between the parties polluting the environment and the rest of society are difficult
for organisational and technical reasons, it seems that Coase's approach is not really fitting
and the existence of these effects is the justification for state intervention. Society as a whole
is interested in increasing the scale of activities generating positive external effects and
reducing the negative effects, so the role of the state is to provide an appropriate framework
for this type of actions (Wysokinski M., Baran J., Gołasa P., Lenort R., 2014) . Meanwhile, the
answer to the question of whether these actions are to be performed by means of
administrative instruments - standards, or economic instruments (e.g. based on the Pigou tax)
remains up to the authorities of the particular state.
Biogas production
Biogas is a mixture of gases, consisting mainly of methane and carbon dioxide,
produced by microorganisms in the process of decomposition of organic substances under
anaerobic conditions. It includes - depending on the raw materials, conditions and technology -
methane (CH4) - 50% to 75%, carbon dioxide (CO2) - 25% to 45%, hydrogen sulphide (H2S)
20-20000 ppm, hydrogen <1% , carbon monoxide (CO) - 0.1%, nitrogen <2%, oxygen <2%.
The larger the share of methane in the biogas, the higher its calorific value. With a methane
content of 65%, a calorific value of 23 MJ/m3 is assumed. In practice, there are several types
of biogas plants, mainly differing by the substrate used for the creation of biogas. There are
biogas plants for agricultural materials, landfills, sewage treatment plants and mixed sources.
Currently, a major substrate for the production of agricultural biogas is animal
excrement, slurry in particular (Wysokinski, M. Dziwulski, M., 2013). The problem lies in its
low dry matter content and hence - low biogas production potential. For this reason substrates
used in a biogas plant are supplemented with energy crops. Corn is the prevalent choice. This
is supported by its extremely high energy yield per hectare, with German studies showing 45
Mg of fresh weight per hectare. In addition, the plant is quite easy to grow, it does not require
specialised equipment and storage is not a major problem. It can be placed in a silo, covered
with foil and subjected to an ensiling process. Although production of agricultural biogas from
corn itself is possible, for process technology reasons: stability of the process as well as an

137
increase in the production of methane, it is desirable to use slurry as a second substrate.
(Institut fur Energetik und Umweltg, 2005).
Photo 1: Corn storage facility for a biogas plant
Photo 2: Co-generation engine
Source: author’s photos
The final product from a biogas plant is biogas (with parameters similar to natural gas),
electricity, or electricity together with generated heat. The last of these products is the most
widespread for practical and economic reasons (high efficiency of cogenerative devices and the
possibility of selling both electricity and heat).
Production capacity in Poland
Agricultural biogas plants currently operating in Poland are focused on the following substrate:
corn, slurry, urine, solid manure. Consequently, the research has focused on these substrates.
It has also been taken into account that for technological reasons biogas plants require
substrates of vegetable and animal origins. Knowing the requirements for substrates for a
biogas plant with a capacity of 0.1-1 MWel (megawatt of electricity) and the number of farms
producing such materials from the Agency for Restructuring and Modernisation of Agriculture
(ARMA), estimated the possibilities for biogas plant development in Poland.

138
Source: author’s construction based on data from ARMA
Fig. 1. Possible agricultural biogas production in individual regions and its use
The best opportunities for agricultural biogas production were observed in the
Wielkopolskie region. There are nearly 4000 farms in whose case the scale of production would
allow for the operation of at least a small agricultural biogas plant. The possibilities for the
Mazowieckie, Kujawso-Pomorskie, Warmińsko-Mazurskie and Podlaskie regions are at a slightly
lower, albeit also high level, whereas in the case of regions in the South-East of Poland, the
capacity is at its lowest. In the document Directions for Development of Agricultural Biogas
Plants in Poland in the years 2010-2020, the Ministry of Economy has drawn up a plan to build
one agricultural biogas plant on average per commune. Theoretically, this should mean that
almost 2000 such installations should be built in Poland. The current state is much less
optimistic.

139
Table 1
Agricultural biogas plants in Poland in 2014
Region
Number of
biogas plants
Power
[MW]
Average power
[MW]
1 Dolnośląskie 6 7,123 1,19
2
Kujawsko-
Pomorskie 4 7,401 1,85
3 Lubelskie 5 5,661 1,13
4 Lubuskie 3 2,391 0,80
5 Łódzkie 2 2,498 1,25
6 Małopolskie 0 0
7 Mazowieckie 2 2,26 1,13
8 Opolskie 1 2 2,00
9 Podkarpackie 0 0
10 Podlaskie 1 1 1,00
11 Pomorskie 9 10,489
12 Śląskie 1 0,526 0,53
13 Świętokrzyskie 1 0,8 0,80
14
Warmińsko-
Mazurskie 7 7,726 1,10
15 Wielkopolskie 7 7,482 1,07
16 Zachodniopomorskie 6 6,678 1,11
Total 55 64,035 1,16 Source: author`s calculations based on data from Energy Regulatory Office (ERO)
Currently, 55 such facilities are operating in Poland, most of them in the Pomorskie (where
the highest capacity of such installations exists), Warmińsko-Mazurskie and Wielkopolskie
regions. In Poland, at a country level, large or very large installations with a capacity starting
at 600 kWel and up to even 2 MWel dominate. There are practically no small facilities up to
100 kWel. This is contrary to the idea of prosumer energy.
Prosumer energy
The concept of prosumer energy appeared in Jeremy Rifkin's works along with the concept
of the third industrial revolution based on the following pillars: transition to renewable energy,
equipping all buildings with micro-installations generating renewable energy on-site, use of the
Internet to build and manage an energy exchange network, so that excess energy can be sold
to other users (Rifkin I. R., 2012). Although the overall concept is utopian at this point in time,
this prosumer approach to energy production is absolutely practical. It is based on a micro-
generation of power, which entails producing energy primarily for one’s own use in systems
based on renewable energy sources. Entities undertaking such activities are prosumers -
playing the roles of both producer and consumer of energy, with sales limited to excess
energy. Such a solution has many advantages, ranging from eliminating losses associated with
excess energy through to mitigating the risks of power station or transmission network
failures. Moreover, such prosumer energy systems generate additional jobs, especially
important in the case of rural areas (Bienkowska W., 2013).

140
The assumptions of this model for biogas development were presented in the
aforementioned government document. The creation of a so-called distributed energy
infrastructure was planned, which would contribute to an increase in its safety. It would allow
a significant portion of the gas, electricity and heat supply to be based on many local biogas
production plants (Ministry of Economy, 2010). Unfortunately, given the previously presented
data on the number and size of agricultural biogas plants in operation at the beginning of
2015, it can be said that these plans are impossible to achieve. The main causes can be
attributed to two issues:
high start-up costs. For a typical prosumer installation with an installed capacity of 40
kWel they amount to about PLN 1.5 million*. These are extremely high costs and only
farms with the most robust income are able to meet this challenge;
uncertainty regarding the support system for renewable energy produced in biogas
plants. Late stage work on a new act on renewable energy sources is currently
underway in Poland. Unfortunately for the smallest installations, one can increasingly
observe a departure from the prosumer ideals to the benefit of large power generators.
On 16 December 2014, the Parliamentary Extraordinary Commission working on the
RES act draft rejected an amendment covering the introduction of guaranteed tariffs for
the smallest producers of energy from renewable sources - microprosumers. (IEO,
2014). This results in reduced support for small energy producers, which translates
directly into an increased operational risk.
Conclusions, proposals and recommendations
1. The project of developing agricultural biogas plants in rural areas based on the idea of
prosumer energy is a very interesting concept. Poland, as a country with a large
number of farms and regions of high agricultural biogas substrate production
capabilities, is a place where this could be implemented in practice, as in Germany.
2. Currently, with 55 agricultural biogas plants operating, this potential is virtually
unrealised.
3. Taking into account the theoretical premises of environmental economics and
commitments undertaken in the international arena, state activities in this area are
essential. The deciding factor will be the act on renewable energy sources planned for
2015.
4. Act on renewable energy sources will determine the direction for the development of
renewable energy sources in Poland in the coming decades - large power plants based
on co-generation or distributed power generation (prosumer-based) using more
* At a rate of 4.3 PLN/EUR = 348837 euro

141
expensive, but environmentally friendly, technologies. It is strongly advised to give a
chance to prosumer energy development.
Bibliography
1. Acocella, N. (2002). Zasady Polityki Gospodarczej: Wartosci i Metody Analizy (The
Foundations of Economic Policy : Values and Techniques). Warszawa: PWN, p. 119.
2. Bienkowska, W. (2013). Activities of Local Authorities in Promoting Entrepreneurship in
Poland. Rural Development and Entrepreneurship Marketing and Sustainable
Consumption, Book Series: Economic Science for Rural Development, Issue: 32, pp.
26-31.
3. Bukowski, M., Pakowiec, A., Szczerba, P., Sniegocki, A. (2014). Przełomowa energetyka
prosumencka (The Breakthrough Prosumer Energy). Warszawa: Warszawski Instytut
Studiów Ekonomicznych, p. 3.
4. Coase, R. H. (1960). The Problem of Social Cost, Journal of Law and Economics, Volume
3, pp. 1-44.
5. Fiedor, B. (2002). Podstawy Ekonomii Srodowiska i Zasobow Naturalnych
(Fundamentals of Environmental Economics and Natural Resources). Warszawa: C.H
Beck, p. 54.
6. Golasa, P., Lenort, R., Wysokinski, M., Baran, J. Bienkowska-Gołasa, W. (2014).
Concentration of Greenhouse Gas Emissions in the European Union. In Metal 2014:
23th International Conference on Metallurgy and Materials. Ostrava: TANGER, 2014,
pp. 1691-1696.
7. Institut fur Energetik und Umweltg GmbH. (2005). Biogaz, produkcja, wykorzystanie
(Biogas Production and Use). Leipzig. p. 109.
8. Instytut Energetyki Odnawialnej (2011). Przewodnik dla Inwestorów Zainteresowanych
Budową Biogazowni Rolniczych (Guide for Investors Interested in Building Biogas
Plants) Warszawa. p.28.
9. Ministerstwo Gospodarki. (2010). Kierunki Rozwoju Biogazowni Rolniczych w Polsce w
Latach 2010-2020 (Directions of Development for Agricultural Biogas Plants in Poland
between 2010-2020). Warszawa. p. 7.
10. Rifkin, J. (2012). Trzecia Rewolucja Przemysłowa. Jak Lateralny Model Władzy Inspiruje
Całe Pokolenie i Zmienia Oblicze Swiata. (The Third Industrial Revolution: How Lateral
Power is Transforming Energy, the Economy, and the World). Katowice: Wydawnictwo
Sonia Draga. p. 60.
11. Instytut Energi Odnawialnej. (2014). Stanowisko IEO po Odrzuceniu Poprawki
Prosumenckiej do Projektu Ustawy o Odnawialnych Zrodłach Energii. (IEO Opinion After
Rejection of Prosumer Amendments to the Draft Law on Renewable Energy Sources)
Retrieved: http://www.ieo.pl/pl/aktualnosci/910-stanowisko-ieo-po-odrzuceniu-
poprawki-prosumenckiej-do-projektu-ustawy-o-odnawialnych-rodach-energii.html.
Access 2.01.2015.
12. Stiglitz, J. E. (2004). Ekonomia Sektora Publicznego (Economics of the Public Sector).
Warszawa: PWN, p. 253.
13. Wysokinski, M. Baran, J. Gołasa, P. Lenort, R. (2014). Economic and Energy Efficiency
of the Mining and Quarrying Sector in European Countries. In Metal 2014: 23th
International Conference on Metallurgy and Materials. Ostrava: TANGER, 2014, pp.
1965-1971.
14. Wysokinski, M. Dziwulski, M. (2013). Land as Main Production Factor on Dairy Farms in
Poland. Economic Science for Rural Development: production and cooperation in
agriculture / finance and taxes. Proceedings of the International Scientific Conference.
Issue 30, pp.128-133.

142
PROVISION OF PUBLIC GOODS BY AGRICULTURE IN POLAND
Alina Danilowska*, PHD with habilitation/Professor of Warsaw University of Life Sciences –
SGGW
Department of Economics and Economic Policy, Warsaw School of Life Sciences-SGGW, Poland
Abstract. The concept of public goods connected with agriculture and environment gains more
and more attention of societies. It is taken into consideration by the environmental, rural and
agricultural policies as well. The aim of the paper is to examine the dimensions and the
particular features of the provision of the public goods by agriculture and to demonstrate the
involvement of the Polish agriculture in supply of such goods. The analyses showed that the
concept of public goods in agriculture evolved from externality oriented approach to very board
holistic approach. The provision of public goods is strongly supported as a part of the Common
Agricultural Policy. The interest of the Polish farmers in provision of public goods is quite high.
About 50% of famers got subsidies due to different measures connected with this activity.
Key words: public goods, agriculture, externalities, farmers, support
JEL code: H4, Q1, Q5
Introduction
Agriculture naturally linked with the nature is not longer seen only as a provider of food
that is a good essential for human existence but as an important producer of many other kinds
of goods which become important and desirable for modern societies. Among them, the so-
called public goods deserve a special attention. The concept of public goods connected with the
agriculture and environment develops gradually and influences noticeably the shape and scope
of environmental, rural and agricultural policies. The significance of agricultural public goods is
used to justify the support for agriculture as a sector of the economy.
The aim of the paper is to examine the dimensions and the particular features of the
provision of the public goods by agriculture and to show the involvement of the Polish
agriculture in supply of such goods.
In the paper the following questions were raised: (i) what is the scope of public goods
connected with agriculture, (ii) what is the nature of public goods provided by agriculture, (iii)
what is the scope of the provision of agricultural public goods by the Polish farmers.
The paper starts with the discussion on the origins and definitions of the public goods,
* Tel.: +48 22 5934039; fax: +48 22 5934031, E-mail address:[email protected].
Proceedings of the 2015 International Conference “ECONOMIC SCIENCE FOR RURAL DEVELOPMENT” No37
Jelgava, LLU ESAF, 23-24 April 2015, pp. 142-151

143
next the characteristics of agricultural public goods is presented. It is followed by analysis of
the provision of public goods by the Polish agriculture.
Materials and methods
There are several sources of materials used in the paper. The theory is based on scientific
literature on public goods and other relevant problems. The empirical data for the examination
of the Polish experiences were taken from the Reports of Agency of Restructuring and
Modernization of Agriculture which is responsible for the distribution of subsidies under the
frame of the Common Agricultural Policy (CAP) in Poland.
The study of literature and descriptive method supported by simple statistical analyses of
data are the main methods used in the article.
Research results and discussion
Public goods – theoretical background The concept of public goods originates from two well-known papers published by
Samuelson in 1954 and 1955 (Samuelson, 1954, 1955). However, as Samuelson indicated,
some economists who did not neglect the problem of the theory of optimal public expenditure -
E. Sax, K. Wicksell, E. Lindahl, R. Musgrave, H. Bowen could be treated as precursors of the
concept*. Samuelson distinguished two types of goods: private goods and public goods†.
Private consumption good can be parcelled out among individuals and total consumption of
particular j-good is the sum of individual consumptions‡. In the case of public good, each
individual’s consumption of such a good does not lead to subtraction from any other
individual’s consumption of that good so the individual consumption of any consumer equals
total consumption§. Defined in such way, the goods are extreme polar cases. The rivalry in
consumption is the criterion of division. The papers drew great attention and caused discussion
among scholars. The participants undertook problems of such aspects as congestion or
excludability from consumption. In result, many different classifications of goods were
recommended**. The classification joining two criteria: rivalry in consumption and excludability
became very popular. The result of the combination of these two criteria is shown in Table 1.
Public goods are those goods which simultaneously perform conditions of non-rivalry
and non-excludability. In real world not many goods have such characteristics so different
authors propose using different degrees of rivalry, excludability and congestion. Such solution
was used by Cooper et al. (2009). In their study they distinguished three kinds of rivalry (rival,
* The first three were named by R. Musgrave as Voluntary Exchange Theorists (Dougherty, 2003). † The term of public goods was introduced in the second paper in the first Samuelson used the term ”collective consumption goods”
‡ where Xj-the total consumption of j-good, X1j....Xs
j individual consumers of j-good
§ and and ** See: Davis O.A., Whinston A. B (1967), A. Randall (1983), E. Romstad (2002), Cooper T., Hart K., Baldock D. (2009)

144
non-rival for a small user group, non-rival), three kinds of excludability (excludable, excludable
only at high costs, non-excludable) and different levels of congestion risk (small group,
congestion as the number of users increases, certain degree of congestion, high risk of
congestion). As a result, they got three groups of goods according to the degree of publicness:
with low, medium and high degree of publicness. The last group includes two groups of public
goods: pure public goods and impure public goods. In both cases, there is no rivalry in
consumption but different kinds of excludability and susceptibility for congestion take places.
Although, it is a very valuable characteristics, it misses commons which are characterised by
no excludability* and rivalry in consumption.
Table 1
The classification of goods by excludability and rivalry in consumption
Excludability
YES NO
Rivalry in
consumption
YES Private goods ( bread) Commons (see shore, fishes in ocean)
NO Club goods (cinema, swimming pool) Public goods (national defence)
Source: Jakubowski, M. (2012). Dobra publiczne i dobra wspolne (Public Goods and Commons). In: Wilkin, J. (ed.). Teoria wyboru publicznego: glowne nurty i zastosowania (Public Choice Theory: Mainstreams and Applications). Wydawnictwo Naukowe SCHOLAR. Warsaw
Public goods are considered as market failure because the market cannot resolve the
problem of their optimal provision as no competitive market pricing mechanism for such goods
exists. When individual consumption equals total consumption there is no incentive for each
consumer to reveal his/her preferences for public goods consumption and even “it is in the
selfish interest of each person to give false signals to pretend to have less interest in a given
collective consumption activity than he really has” (Samuelson, 1954). The inclusion of the
excludability criterion makes the problem more complex.
Agriculture as a source of public goods
The concept of agricultural public goods underlines importance of agricultural goods for
human wellbeing and connections of agriculture with the environment. As Heal and Small
(2002) note, agriculture is the most important of the activities through which humanity
interacts with the natural world; farming’s impact on the global environment is greatly
disproportional to its share in the total economic activity. The list of agricultural and
environmental public goods in literature is long and not fixed. This phenomenon can be
connected with the approaches to multifunctional agriculture (Vanni, 2014). The supply-side
approach considers agricultural public goods as by-products stemmed from the phenomenon of
multiple joint outputs of a typical agricultural activity or of a combination of activities. The
“non-intentional” output can be positive (public goods as positive externality) and negative
(public bads as negative externality). The demand-side approach focuses on society demand
* Unless eligible agents do not resolve this problem

145
on different goods and services, which agriculture can provide. In this concept many aspects of
agricultural production, its characteristics and specific features are regarded as required,
useful, valuable. The third approach (holistic) goes further pointing out that the multifunctional
agriculture is a consequence of the changing needs and demands of consumers and society
(Van Huylenbroeck et al., 2007).
Short review of the lists of public goods considered by different authors shows the
prevalence of the last approach. In 2002, in the FAO’s publication “The State of Food and
Agriculture” the following environmental public goods (essential from global perspective*) were
discussed: ecosystem stability, biodiversity, wildlife, reduction of greenhouse gas emission
from forest fires, carbon sequestration, protection of water bodies, hydrological stability.
Several years later, Cooper et al. (2009) examined such public goods as agricultural
landscapes, water quality and water availability, soil functionality, air quality, resilience to
flooding, resilience to fire, rural vitality, food security, farm animal welfare and animal health
and Jürgen Fröhling (2007) included recreational value of the countryside, jobs and
employment in rural areas, sufficient feed, renewable resources and bio energy. The above
mentioned list of public goods shows that such goods can take a variety of forms: physical
goods like renewable resources, required features of goods like air quality, services like
resiliencies to fire, ethic value like animal welfare or even culture value like rural vitality. It
seems that nearly every positive phenomenon in agriculture, rural development or
environment can be called a “public good”. Such a broad attitude results a great ambiguity.
Nearly each presented public goods encompasses a collection of different goods and values of
a very subjective character. Moreover, it is worth to mention that unlike the supply side
approach in which negative externalities (sometimes called “public bads”) are considered and
discussed, the two other approaches focus on positive public goods as demanded by the
society. It can lead to the undermining and neglecting the importance of “public bads”
connected to agricultural production or to multiplication of expectations and requirements from
farmers conducting an agricultural activity.
A search for justification of governmental or the EU intervention involving great
subsidies for agriculture and rural areas is one of the main sources of such a vast range of
agricultural public goods. This problem can be examined from the perspective of rent-seeking
theory† or theory of the groups‡.
The provision of public goods in Poland
The concept of agricultural and rural public goods has gained more and more attention
in Poland within last years. The impact on the rise of such interest in that issue was given by
the Poland’s accession to the European Union followed by the Common Agricultural Policy. It is
* The goods have regional and local dimension too † G. Tullock and A. Krueger are prominent representatives of that theory. ‡ See M. Olson The Logic of Collective Action: Public Goods and the Theory of Groups Harvard University Press. 1971

146
difficult to point any scientific publications on this problem till late 90’s of the 20th century.
Some economic scientific papers on relations between environment and agriculture were
published only in 1998, 1999* but there were no analyses from the perspective of market
failures. It does not mean that some important problems as biodiversity or water pollution by
fertilisers (positive and negative externalities) were not recognised and neglected in Poland.
Generally, they were examined by researchers directly connected to the particular problem but
not by the agricultural economists. Certain law regulations against particularly negative
externalities of agricultural production existed too. But the awareness of the problem from
economic perspective was rather low.
With the accession to the EU the provision of public goods became one of required
activities of agriculture and has gained the financial support. What is more, the support
encompassed the decrease in production of negative externalities (public bads), as well.
In financial perspective 2004-2006, measures aimed at provision of public goods by farmers were
offered in the frame of Rural Development Plan (RDP†) 2004-2006 and Sectoral Operational Programme
(SOP) Restructuring and Modernisation of the Food Sector and Rural Development 2004-2006. Under the
RDP 2004-2006 two measures were aimed to encourage farmers to provide public goods: Measure 4
“Support for Agri-environmet and Animal Welfare” and Measure 5 “Afforestation of Agricultural Land”.
Part of funds under the SOP was directed for decreasing negative externalities of agricultural production
like solid waste (production of fuel from biomass such as hay, meadow and wood waste etc., within
measure: “Diversification of agricultural activities and activities close to agriculture to provide multiple
activities or alternative incomes”), waste water (measure: “Development and improvement of the
infrastructure related to agriculture”), animal waste (measure: “Investment in agricultural holdings”).
Steady development of the concept of agricultural and environmental public goods from
supply-side approach towards holistic approach was fully reflected in the next financial
perspective (2007-2013) in the form of much longer list of measures connected to the problem
of public goods by agriculture. Two differences between that and previous perspective were of
general character. First, the number of measures related to the provision of public goods by
agriculture increased noticeably. Second, the measures focused generally on provision of the
public goods not only in the form of positive externalities but new services (non-tradable
goods) as well while the reduction of agricultural public bads gained relatively much less
attention. Two out of four axes of the RDP 2007-2013: Axis 2: Improvement of the
environment and the countryside and Axis 3 Quality of life in rural areas and diversification of
rural economy were explicitly connected with the environment, countryside, quality of life in
rural areas and diversification of rural economy as well as with general support for the
provision of vast range of positive public goods. Axis 2 encompassed four measures: “Support
of management in mountain areas and in less-favoured areas (LFA)”, “Agri-environmental
programme”, “Afforestation of agricultural and non-agricultural land”, “Restoring forestry
* The list of such publications encompasses publication of Institute of Agricultural and Food Economics: W. Michna “Program of pro ecological development of the country, agriculture and food economy till 2015. Synthesis, and A. Wos “Tools of Environment Policy in the Process of Restructuring and Modernisation of Agriculture” (Zegar, 2002) † In Poland, PROW is the acronym of the name of this program.

147
production potential damaged by natural disasters and introducing appropriate prevention
instruments”. Axis 3 involved such measures like: “Diversification into non-agricultural
activities”, “Establishment and development of micro-enterprises”, “Basic services for the
economy and rural population”, “Village renewal and development”. Of course, not all
measures in every axes could support farmers’ activity, some of them were offered to rural
communities or other agents in rural areas (RDP 2007-2013).
Moreover, in Axis 1, the measure “Modernisation of agricultural holdings investment”
was directed to diminish public bads as it supported investments which contributed to
improvement in holdings as far as environmental protection or animal welfare was concerned.
Results of the support
The result of the support can be estimated by the number of measure participants and value of
the support. In some cases other indicators are available, for example, in the case of
afforestation the number of hectares of afforested land.

148
Table 2
The number of participants and value of subsidies under measures supporting
farmers’ provision of positive public goods and reduction of public bads
Programme Measure Number of
Participants Support value (mln PLN)3
Remarks
2004-2006
RDP Measure 4. “Support for Agri-environment and Animal Welfare” 1
79 867 approximately 3 000.0
Measure 5. “Afforestation of Agricultural Land”1
9 006 (new application
s)
385
SOP Priority I: measure: “Investment in agricultural
holdings”
24 231 2 209 (only 4% of investment were connected to
environment)
Priority II: measure: “Diversification of agricultural activities and activities close to agriculture to provide multiple activities or alternative incomes”
4 108 279
(2 075 new places of job connected to handicrafts and craftsmanship or agro tourism
Priority II: measure: “Development and improvement of the infrastructure related to agriculture”
3 394 146
967 sewage treatments (37% of investment were connected to wastes of water and energy)
2007-2013
RDP2
Axis 1. Measure “Modernisation
of agricultural holdings investment”
60 212
8 495
only 9% applications
were not for movable machines
Axis 2. “Improvement of the
environment and the countryside” Measure: “Agri-environmental programme” Measure: “Afforestation of
agricultural and non-agricultural land”
126 866
4 590
13 825
271
72 600 ha of new forest
Axis III. “Quality of life in rural areas and diversification of rural economy” Measure: “Diversification into
non-agricultural activities”
15 369 1 357 only 8.2% of applications were connected to handicrafts and craftsmanship or agro
tourism 1 the measure was continued in financial perspective 2007-2013. Year of 2011 was the last year in which farmers could apply for support under this measure 2 data at the end 2013 3 the value of agreements
Source: author’s calculations based on data Annual Reports on Activity of the ARMA (2008 - 2013), ARMA 2007-2014
Data in Table 2 show that environmental measures were very popular among farmers.
During two financial perspectives approximately 200 thousand of farmers participated in these
measures. In financial perspective 2004-2006 the package “Soil and water protection” was the
most popular (ARMA, 2008). Its share in the total support value equals 50%. The least interest
was in package “Maintenance of extensive pastures”. In the RDP 2007-2013, package “Organic

149
farming” was on the first place, whereas, “Buffer zone” on the last*. What is remarkable, the
package “Sustainable farming” (with the share 1,5%) was rather unpopular in the RDP 2004-
2006, however, in the next perspective it gained farmers’ attention and its share in support
exceeded 20%. It is necessary to add that in both financial perspectives measure “Support for
less-favoured areas (LFA)Ӡ was available. Every year, 600 Р700 thousand farms got subsidies
of total value approximately EUR 300 million (ARMA, 2014).
The measure “Afforestation of agricultural and non-agricultural land” attracted nearly
23 000 participants; within this measure 76 000 ha of forest was planted (ARMA, 2014).
Other measures had only a very small contribution to provision of public goods. For
example, in the SOP 2004-2006 only 4% of investments supported under the measure
“Investment in agricultural holdings” were connected with environment and in the similar
measure in the RDP 2007-2013 (“Modernisation of agricultural holdings investment”) merely
1% of investment were used for improvement of soil quality while 91% were used for movable
machines (ARMA, 2014).
The great support for provision of agricultural public goods is continued in financial
perspective 2014-2020. In the RDP for that period two out of six priorities are connected
strictly to environment protection. They are: “Restoring, preserving and enhancing ecosystems
related to agriculture and forestry” and “Promoting resource efficiency and supporting the shift
toward a low-carbon and climate-resilient economy in the agriculture, food and forestry
sectors” (European Commission, 2013). The particular measures will start operating in 2015.
Conclusions
From its nature, agriculture is connected with environment and generates positive and
negative effects for it. The concept of public goods in agriculture has been evolving from
supply oriented approach to holistic approach. As a result, the number of “public goods”
recognised is steadily growing and the list of such goods encompasses not only strict
environmental goods but social, ethical cultural values and climate phenomena. The public
goods as one of the market failures justify the support for agriculture. As the scope of the term
has been broadening steadily, the scope and value of support has increased.
The interest of the Polish farmers in provision of public goods has been quite high
mainly due to subsidies. Approximately 50% of them got subsidies. Farmers learn very quickly
how to apply for the support. Some ideas like sustainable and multifunctional agriculture
develop gradually and gain more and more farmers’ attention. So one can conclude that low
interest in particular measure in one perspective does not mean low interest in next
perspective because farmers and other agents should have time to get used to new ideas or
phenomena and adapt to them.
* It stemmed from the scope of the package and low level of support (PROW 2007-2013, 2014) † the measure is to prevent depopulation of LFA and losing their agricultural character, economic and environmental effects (Rural Development Programme for 2007-2013, 2007).

150
The outcomes of the support are undoubtedly positive but the question arises, if
farmers adjust their behaviours only to get subsidies or if they become gradually convinced of
the significance of public goods that they provide.
Bibliography
1. Agency for Restructuring and Modernisation of Agriculture. (2009-2014). Annual Reports
on Activity of the ARMA (2008, 2009, 2013). Poland.
2. Cooper, T., Hart, K., Baldock, D. (2009). Provision of Public Goods through Agriculture in
the European Union. Institute for European Environmental Policy. p. 351.
3. Davis, O.A., Whinston, A.B. (1967). On the Distinction between Private and Public Goods.
American Economic Review, Vol. 57, No 2, pp. 360-373.
4. Dougherty, K. L. (2003). Public Goods Theory from Eighteenth Century Political Philosophy
to Twentieth Century Economics. Public Choice, Volume 117, No 3-4, pp. 239–253.
5. European Commission (2013). Overview of CAP Reform 2014-2020. Agricultural Policy
Perspectives. Brief N°5/December. Retrieved: http://ec.europa.eu/agriculture/policy-
perspectives/policy-briefs/05_en.pdf. Access: 20.02.2014
6. Food and Agriculture Organization of the United Nations (FAO). (2002). The State of Food
and Agriculture. Rome. p. 229.
7. Fröhling, J. (2007). Provision of Public Goods from a Sustainable EU Agriculture,
Conference Proceedings European Young Farmers Day. Brussels. 17 April 2007. Retrieved: http://ec.europa.eu/agriculture/events/youngfarmers. Access: 20.02.2014
8. Heal, G.M., Small, A.A. (2002). Agriculture and Ecosystem Services. In: Gardner B.L.,
Rausser G.C. (eds.). Handbook of Agricultural Economics. Volume 2A. Elsevier. pp. 1343-
1369.
9. Jakubowski, M. (2012). Dobra publiczne i dobra wspolne (Public Goods and Commons). In:
Wilkin, J. (ed.). Teoria wyboru publicznego: glowne nurty i zastosowania (Public Choice
Theory: Mainstreams and Applications). Wydawnictwo Naukowe SCHOLAR. Warszawa. pp.
42 -65.
10. Ministry of Agriculture and Rural Development (2005). Rural Development Plan for Poland
2004 – 2006. Warsaw, December. Retrieved: http://www.minrol.gov.pl/. Access:
17.02.2014.
11. Ministry of Agriculture and Rural Development (2007). Sectoral Operational Programme
Restructuring and Modernisation of the Food Sector and Rural Development 2004-2006 Retrieved: http://www.minrol.gov.pl/. Access: 17.02.2014
12. Ministry of Agriculture and Rural Development (2007). Rural Development Programme for
2007-2013. Warsaw. July. Retrieved: http://www.minrol.gov.pl/. Access: 17.02.2014
13. Randall, A. (1983). The Problem of Market Failure. Natural Resources Journal, Volume 23,
pp. 131-148

151
14. Romstad, E. (2002). Policies for Promoting Public Goods in Agriculture. Xth EAAE
Congress. Zaragoza 28-31 August 2002. Retrieved: http://agecon.lib.umn.edu. Access:
19.02.2014
15. Samuelson, P. A. (1954). The Pure Theory of Public Expenditure, The Review of Economics
and Statistics, Volume 36, No. 4, pp. 387-389.
16. Samuelson, P. A. (1955). Diagrammatic Exposition of a Theory of Public Expenditure. The
Review of Economics and Statistics. Volume 37, No. 4, pp. 350-356.
17. Van Huylenbroeck, G., Vandermeule,n V., Mettepenningen E., Verspecht A. (2007).
Multifunctionality of Agriculture: A Review of Definitions, Evidence and Instruments Living
Reviews in Landscape Research 1, (2007), p. 1-43. Retrieved:
http://www.livingreviews.org/lrlr-2007-3. Access: 10.02.2014
18. Vanni F. (2014). Agricultural Public Goods. The Role of Collective Action. Springer. p.150.
19. Zegar, J. (2002). Programowanie ekorozwoju obszarow wiejskich (Rural Areas
Ecodevelopment Program Design. In: Jezowski, P. (ed.) Zarzadzanie w sektorze publicznym
(Management in Public Sector). Oficyna Wydawnicza Szkoły Glownej Handlowej. Warszawa.
pp. 87-112.
152
ECONOMIC EFFICIENCY OF FEEDING A PROTEIN CONCENTRATE ADDITIVE TO BROILER CHICKENS
Liga Proskina*, Dr.oec.; Sallija Ceriņa2, Dr.oec.
1Latvia University of Agriculture, Faculty of Economics and Social Development
2State Priekuli Plant Breeding Institute
Abstract. The EU Member States have a high deficit of domestic protein feeds, and
approximately 70% of protein products are imported; thus, feed price fluctuations make the
European livestock industry economically vulnerable. It is possible to use domestic agricultural
by-products as a feed for agricultural animals in order to reduce the deficit of protein feeds and
the cost with regard to purchasing such feeds. To tackle the problem regarding reducing the
production cost of livestock products, a feeding experiment on broiler chickens was conducted
using protein concentrate Baltiprot – an ethanol production by-product with high protein
content – produced in Latvia.
The hypothesis is as follows: using the ethanol industry by-product – protein concentrate – in
diets of poultry could increase broiler chicken productivity and reduce feed cost. In this aspect,
the aim was to identify the most economically efficient amount of protein feed in the diet of
broiler chickens. The research results showed that a greater slaughter weight of poultry
(+6.48%), a lower production cost per kg of poultry meat (-7.11%), a higher production
efficiency (386.2) and a lower feed conversion ratio (1.77) could be achieved by using the
protein additive in the diet of broiler chickens.
Key words: poultry production, production efficiency
JEL code: O 13
Introduction
In Europe, meat and other livestock products comprise 45% of the total value of products
produced by agriculture (Eurostat, 2013; Broring, 2010). Regardless of the significant
proportion of livestock farming, the total area sown with protein crops in the European Union
(EU) occupies only 3% of the total arable area, and this industry supplies only 30% of the total
quantity of protein crops consumed as animal feed (Report on…, 2011). As the deficit tended
to increase over the last decade, according to Eurostat, 70% of protein products, especially
soya flour, were imported mainly from Brazil, Argentina and the USA. Such large imports of
* Tel.:+371 28206624. E-mail address: [email protected]
Proceedings of the 2015 International Conference “ECONOMIC SCIENCE FOR RURAL DEVELOPMENT” No37
Jelgava, LLU ESAF, 23-24 April 2015, pp. 152-159

153
protein products make the European livestock industry vulnerable as well as cause feed price
fluctuations, reducing the profitability and stability of the livestock industry.
A significant economic effect on raising the production efficiency of livestock products and the
industry’s stability can be ensured by consuming domestic by-products of agricultural
processing (McDonald et al., 1995). The by-products of oil crops and grains produced by
domestic enterprises are extensively used in animal diets. The use of these by-products,
instead of imported ones, in animal diets may considerably enhance the quality of agricultural
products and increase the revenues of domestic enterprises.
As it is known, the need for protein among agricultural animals and poultry is different,
depending on the species, the kind of products produced, the physiological condition, etc.
Poultry, especially broiler chickens, feature an intensive growth rate and a high genetic
potential of productivity (Marcu A. et al., 2013); accordingly, broiler chickens need feed with a
high crude protein content (19.00-24.00%), while the cost of feed accounts for 60-75% of the
total production cost for poultry enterprises in the EU and Latvia (Damme, 2010; Demircan et
al., 2010; Poultry Meat and…, 2010; Onu et al., 2010; Adewunmi, 2008). So, in order to
reduce the costs of feed and production, relatively cheap quality protein-rich feeds have to be
used in poultry diets. In this aspect, it is required to assess the opportunity to use domestic
feeds – ethanol production by-products – in poultry diets.
It is economically efficient to produce ethanol from grain, and wheat is the best choice. The
main problem in the use of a by-product of the ethanol industry for poultry is its high
variability of nutrient content and availability (Bregendahl, 2008). Therefore, literature says
that different amounts of feed additives containing bio-ethanol industry by-products are used
in broiler chicken feed. By applying innovative solutions and technologies, ethanol production
waste is reprocessed in Latvia into a feed supplement registered as Baltiprot produced by
EthaProtTM Process technology (Bosenko et al., 2008). On average, it consists of 55-60% crude
protein, 1.28% lysine, 0.52% methionine, 1.71% arginine, and 94.5% dry matter. During the
production process the grain is divided into brans and milled endosperm, which contains starch
and protein. The starch is converted into ethanol, through the instrumentality of ferments and
food yeast Saccharomyces cerevisiae. Grain protein and yeast, that is, protein biomass is dried
using a stream of CO2 and dry concentrate containing protein is obtained – a feed additive
(hereinafter referred to as the protein concentrate) (Martinez-Amezcua et al., 2007; Noll et al.,
2007). The concentrate of protein feed, contrary to the mentioned one in literature, is of better
quality, as it contains relatively more crude protein and amino acids.
The obtained protein concentrate may be used in agricultural animal diets; yet, few studies are
available on its economic efficiency in poultry feed. The hypothesis is as follows: using the
ethanol industry by-product – protein concentrate Baltiprot – in total mixed diets of poultry
could increase broiler chicken productivity and reduce feed cost.

154
In this aspect, the aim was identify the most economically efficient amount of protein feed in
the diet of broiler chickens. The following research tasks were set: 1) to identify the effect of
the protein concentrate on the productivity of broiler chickens; 2) to determine the economic
efficiency characteristics of broiler chicken meat production.
Materials and methods
The main objective of this experiment was to evaluate the economic effects of incorporating
different amounts of protein concentrate in broiler performance trials. Commercial hybrid
ROSS-308 animals were used in an intensive system on a permanent litter, with a density of
12 chicks per m2. Broilers were randomly assigned into 4 equal groups in equal number per
each sex. Broiler chickens were reared in the same housing and environmental conditions, and
the composition of the basic diet was balanced according to the feeding instructions for the
commercial hybrid ROSS-308 (Ross Broiler Management Manual, 2009). The growth
technological system was in accordance with new European Union regulation on animal welfare
compulsory from 2012 in all EU Member States (Laying down…, 2007).
In order to define the most economically viable amount of protein concentrate for use in broiler
chicken feed, a feeding experiment using broiler chickens of cross ROSS 308 was performed
according to the scheme shown in Table 1.
Table 1
Experimental design
Broiler chickens aged 0-27 days
Group Protein, % Lysine, % Methionine, %
In basic diets, %
Fodder
yeast
Protein
concentrate
Group 1 – control 21.0 1.23 0.45 2.5 –
Group 2 – trial 21.0 1.23 0.45 – 2.5
Group 3 – trial 21.0 1.23 0.45 – 5.0
Group 4 – trial 21.0 1.23 0.45 – 6.0
Broiler chickens aged 28-42 days
Group 1 – control 19.0 1.0 0.37 3.0 -
Group 2 – trial 19.0 1.0 0.37 – 3.0
Group 3 – trial 19.0 1.0 0.37 – 5.0
Group 4 – trial 19.0 1.0 0.37 – 6.0
Broiler chickens of all the groups were fed with feed containing the same amounts of crude
protein, lysine, methionine, Ca, P and other nutrients according to the requirements of the
cross ROSS 308 standards. Feed and water were given ad libitum.

155
The feed of Group 1 broiler chickens contained 2.5–3.0% fodder yeast. The feeds of Group 2, 3
and 4 broiler chickens contained different amounts of protein concentrate to be studied (2.5-
3.0, 5.0 and 6.0%) instead of fodder yeast. The feeds of these groups’ broiler chickens
contained no fodder yeast.
The protein concentrate samples were analysed for dry matter (ISO 6496-1999), crude protein
(LVS EN ISO 5983-1:2005) and amino acids (LVS EN ISO13903:2005).
The optimal amount of protein concentrate used in broiler chicken feed was evaluated in terms
of productivity, live weight, carcass weight, breast muscle weight, and feed cost. Live
performance, feed conversion ratio (FCR), and the production efficiency factor (PEF) were
assessed at 42 days of age. Feed conversion ratio (FCR) (calculated as the amount of feed
consumed divided by the live weight of birds); the production efficiency factor (PEF) was
calculated by the formula:
100
kg kg ratio, conversion Feed FCR (days)depletion at Age
kgin weight Live %y Liveabilit1-
(Ross Broiler Management…, 2009).
Breast muscle weight was determined using gravimetric measurements after deboning
sampling 8 carcasses from each group, in equal number per each sex.
Results and discussion
Broiler chicken productivity
The efficiency of protein concentrate in the diet of broiler chickens was evaluated based on the
most important productivity indicators: live weight change, daily live-weight gain and feed
conversion ratio, production efficiency factor productivity index.
By feeding the broiler chickens with feed containing different protein concentrate amounts, the
live-weight thereof ranged within 2840.0–2894.0 g, the average live-weight gain per day
67.6–68.9 g, the feed consumption per 1 kg live-weight 1.77–1.94 kg, the pectoral muscle
mass 545.28–577.34 g and the production efficiency factor ranged within 349.20–386.20
(Table 2).
It means that 5% and 6% protein concentrate amounts in poultry feed promoted the
productivity of broiler chickens, though the feed contained the same amount of nutrients. It is
likely to be related to better availability of nutrients from the protein concentrate in the
digestive tract of broiler chickens. The 5.0% protein concentrate in the content of broiler
chicken feed (Group 3) ensured a higher PEF of poultry productivity.
The live-weight of broiler chickens accordingly increased by 3.54% (p<0.05) (Group 4), the
feed conversion – positively – decreased by 4.7% (p<0.05) (Group 3) and the PEF increased
by 28.5% (p<0.05) (Group 3), in comparison with the control group.

156
Table 2
Impacts of different protein concentrate amounts on the productivity of broiler
chickens
Parameters
Groups
Group 1 –
control
Group 2 –
trial
Group 3 –
trial
Group 4 –
trial
Live-weight at the age of 42
days, g 2795.0±47.0 2840.0±65.4 2876.0±66.5 2894.0±58.7
% to control - +1.61 +2.89 +3.54
Feed conversion ratio (FCR) 1.86 1.94 1.77 1.80
% to control - 4.1 -4.7 -3.4
Production efficiency factor (PEF) 357.70 349.2 386.2 383.50
± to control – -8.5 28.5 25.8
Live-weight gain per day, g 66.5 67.6 68.5 68.9
Breast muscle mass, g 536.64±21.0 545.28±34.1 557.34±19.8 558.54±22.1
Breast muscle mass, % of live-
weight 19.2 19.2 19.4 19.3
When the amount of protein concentrate in feed was increased from 5.0% to 6.0%, that is by
1.0%, the live-weight of broiler chickens tended to increase (p>0.05), whereas the production
efficiency factor decreased. The breast muscle is the most valuable portion of the chicken
carcass on the market; even small differences in breast muscle yield among broiler chickens
could have significant economic impact. The breast muscle mass of broiler chickens of the
experiment groups at the age of 42 days ranged within 536.64–577.34 g, which was 19.2–
19.4% of their live-weight. The differences in breast muscle mass between the groups were
not significant (p>0.05).
Expenses and revenues in broiler production
All the expenses associated with raising broiler chickens and all the revenues gained from
selling live broiler chickens were calculated to determine the most economically efficient size of
protein concentrate portion in a broiler chicken feed mixture. The total variable cost included
expenses on infrastructure, wages, etc., which were equal for all the groups (Table 3).
The lowest consumption of feed per 1000 broiler chickens raised was observed for Group 3,
5100.0 kg, or 1.9% less than for the control group. The cost of feed, too, to raise 1000 broiler
chickens in Group 3 was lower by EUR 111.6 or 5.5% in comparison with the cost of feed for
the broiler chickens of the control group.
However, the highest consumption of feed (5500 kg) and accordingly the highest cost of feed
(EUR 2114.18) were registered for Group 2.

157
The cost of feed per 1000 broiler chickens raised was determined by the cost of 1 kg feed and
the quantity of feed consumed. The price of 1 kg of feed for the control group was 0.39 EUR
kg-1. The cost of complete feed for the experiment groups of broiler chickens was determined
by the cost of the protein concentrate incorporated in feed (2.5-6%).
The lowest cost of 1 kg of feed was achieved for Group 3 because the 5.0% protein
concentrate was incorporated in the feed mixture, which was 3.65% less than for the control
group.
Table 3
Economic characteristics of feeding the protein concentrate
(in raising 1000 broiler chickens on the experimental conditions)
Parameters
Groups
Group 1 –
control
Group 2 –
trial
Group 3 –
trial
Group 4 –
trial
Number of poultry raised 1000 1000 1000 1000
Total slaughter weight of broiler
chickens, kg 1956.5 2025.8 1988.0 2083.2
± against the control group, kg - +69.3 +31.5 +126.7
Feed consumption for raising broiler
chickens, kg 5200 5500 5100 5200
Price of 1 kg of feed, EUR 0.390 0.384 0.376 0.386
Feed cost in raising broiler chickens,
EUR 2028.47 2114.18 1916.86 2006.6
Feed cost to produce 1 kg of
products, EUR 1.037 1.044 0.964 0.963
Total variable cost of broiler chickens
(feed costs excluded), EUR 845.67 845.67 845.67 845.67
Total cost, EUR 2874.15 2959.85 2762.53 2851.94
1 kg slaughter weight price, EUR 2 2 2 2
Revenues from selling live chickens,
EUR 3913.0 4051.6 3976.0 4166.4
± against the control group, % - +3.54 +1.61 +6.48
Difference between revenues and
expenses, EUR 1038.85 1091.75 1213.47 1314.46
± against the control group, % - +5.09 +16.81 +26.53
The economic efficiency of feed may be determined based on the cost of producing a unit of
products. The feed was most efficiently used for Group 4, as the cost of producing 1 kg of
broiler chicken meat was EUR 0.963, which was 7.11% less than for the control group.

158
In the aspect of production, meat quality, to a great extent, is determined by the proportion of
meat in animals’ live weight, as the remaining part is composed of sub-products, by-products
and waste (Melece, 2004). For this reason, bioeconomic aspects refer to the effects of the
entire set of these indicators on economic performance results.
In the aspect of meat production, the quality of products produced, which is mainly determined
by the proportion of meat in poultry’s live weight, as the rest is composed of sub-products, by-
products and waste, directly affect revenues from the products produced. The largest quantity
of products (2083.2 kg) and accordingly the greatest revenue from the products sold (EUR
4166.4) was provided by Group 4, which was 6.5% more than by the control group. Group 3,
in contrast, provided the smallest quantity of products (1988.0 kg) and the lowest revenue
from the products produced (EUR 3976.0), which might be explained by a smaller quantity of
feed consumed during the experiment and a lower proportion of meat in the poultry’s
carcasses. Yet, it has to be emphasised that all the experimental groups of poultry provided
greater amounts of products and revenues, compared with the control group.
The difference between revenues and expenses shows that the greatest profit is gained if
feeding broiler chickens with the 6% protein concentrate. In contrast, the 2.5-3.0% protein
concentrate fed to the broiler chickens of Group 2 did not produce a sufficiently positive result
– this was indicated by the high consumption of feed, the high feed cost and the high
production cost per kg of meat (EUR 1.044) reducing the profit.
Conclusions
To tackle the problem of how to reduce the production cost of broiler chicken meat, a
feeding experiment on broiler chickens was conducted using feed concentrates – by-products
from industrially processed agricultural products – produced in Latvia.
The feeding experiment used a feed of high protein content – high protein concentrate
Baltiprot.
1. The experimental results evaluated in terms of live weight of broiler chickens showed
that compared with the control group, Group 3, in which the broiler chickens’ feed was
supplemented with the 5% protein concentrate, presented:
the highest production efficiency (386.2),
the lowest feed conversion ratio, i.e. the necessary quantity of feed per kg live
weight gain (1.77 kg);
2. An analysis of the quantities of meat produced as well as the revenues and expenses
leads to a conclusion that, compared with the control group, Group 4, in which the broiler
chickens’ feed was supplemented with the 6% protein concentrate, presented:
the highest slaughter weight of poultry (+6.48%),
the lowest production cost per 1 kg of meat (-7.11%),
the highest profit (+26.53%).

159
3. The most economically efficient ration of protein concentrate in the diet of poultry is 6%
of the total quantity of feed.
Bibliography
1. Adewunmi, I.O. (2008) Economics of Poultry Production in Egba Division of Ogun State.
Agricultural Journal, Volume 3, Issue 1, pp. 10–13.
2. Bosenko A., Sargautis D., Vaitaitis D.(2008) Method for Production of Ethanol and Fodder
Product. European Patent Application EP 1988169 A1, 05.11.2008. Bulletin 2008/45.
3. Bregendahl, K. (2008). Use of Distillers Co – Products in Diets Fed to Poultry. In:
Babcock, B.A., Hayes, D.J., Lawrence, D.J. (eds.) Using Distillers Grains in the U.S. and
International Livestock and Poultry Industries, pp. 99-133.
4. Broring, S. (2010) Moving Toward Market Orientation in Agri-Food Chains: Challenges
forFeed industry. In: Lindgreen A., Hingley M.K. (Eds.) Market Orientation: Transforming
Food and Agribusiness Around the Customer. Gover Publishing Limited. pp. 53-68.
5. Damme, K. (2011) Economic Aspects of Poultry Meat Production in Germany. Lohmann
Information, Volume 46, Issue 1, pp. 38–43.
6. Demircan, V., Yilmaz, H., Dernek, Z., Bal, T., Gül, M., Koknaroglu, H. (2010) Economic
Analysis of Different Laying Hen Farm Capacities in Turkey. Agricultural Economics,
Volume 56, Issue 10, pp. 489–497.
7. Eurostat (2013) Detailed Statistics on The EU and Candidate Countries. Retrieved:
http://epp.eurostat.ec.europa.eu/portal/page/portal/eurostat/home/. Access:
15.11.2013.
8. Laying down Minimum Rules for The Protection of Chickens (2007). Council Directive
2007/43/EC–28.06.2007. Retrieved:http://eur-lex.europa.eu/legal-
content/EN/TXT/?uri=CELEX:32007L0043. Access: 04.12.2014.
9. Marcu, A., Vacaru-Opriş, I., Dumitrescu, G., Marcu, A., Ciochină Petculescu, L., Nicula,
M., Dronca, D., Kelciov, B. (2013) Effect of Diets with Different Energy and Protein Levels
on Breast Muscle Characteristics of Broiler Chickens
10. Martinez-Amezcua, C., Parsons ,C. M., Singh, V., Skrinivasan, R., Murthy, G. S. (2007).
Nutritional Characteristic of Corn Distillers Dried Grains with Solubles as Affected by the
Amounts of Grains versus Solubles and Different Processing Techniques. Poultry Science,
86, 2624-2630.
11. McDonald P., Eduards R.A., Greenhalgh J.F.D., Morgan C.A. (1995) Animal Nutrition, 4th
ed. Longman Scientific and Technical. p. 672.
12. Noll, S. L., Brannon, J., Parsons, C.M. (2007). Nutritional Value of Corn Distiller Dried
Grains with Solubles (DDGS): Influence of Solubles Addition. Poultry Science, 86, 68.
13. Onu P.N., Ayo-Enwerm M.C., Ahaotu E.O. (2010) Evaluation of Performance, Carcass
Characteristics and Cost Effectiveness of Broiler Chicks Fed Synthetic Lysine and
Methoinine Supplemented Soyabean-based Diets. International Jurnal of Science and
Nature, Volume 1, Issue 1, pp. 22–26.
14. Poultry Meat and Eggs. (2010). Agribusiness Handbook. Food and Agriculture
organization of the United Nations, Rome. p. 77.
15. Ross Broiler Managment Manual (2009). Ross Breeders Limited, Newbridge, Midlothian
EH28 8SZ, Scotland, UK, p 101.
16. Scheuermann, G. N., Bilgili, S. F., Hess J. B., Mulvaney, D. R. (2003) Breast Muscle
Development in Commercial Broiler Chickens. Poultry Science: 82, pp.1648–1658.
Retrieved: http://ps.oxfordjournals.org/content/82/10/1648.long. Access: 12.12.2014.
17. The EU Protein Deficit: What Solution for a Long-standing Problem? (2011) Report.
(2010/2111(INI)). Retrieved: http://www.europarl.europa.eu/sides/getDoc.do?pubRef=-
//EP//TEXT+REPORT+A7-2011-0026+0+DOC+XML+V0//LV Access: 08.12.2014.

160
DEVELOPMENT OF SUSTAINABLE INTENSIFICATION EVALUATION
METHODOLOGY FOR FARMLANDS IN LATVIA
Arnis Lenerts, Mag.oec., PhD student
Abstract. Land resources are not fully exploited for agricultural production in Latvia. According
to the Rural Support Service, in 2013 approximately 400 thousands ha of agricultural land
were not declared for Single Area Payment Scheme. Increases in bioresources and food
production in the world have become objective needs. Exploiting these land resources provides
a possibility to increase agricultural output and economic efficiency in Latvia’s rural areas. Yet,
agricultural growth in Latvia’s rural areas may not be in contradiction with sustainable
development principles. It is necessary to intensify agricultural production by increasing
agricultural output and contributing to comprehensively achieving sustainability indicators. To
ensure sustainable intensification of Latvia’s land resources, a theoretical model for calculating
sustainable intensification indicators for agricultural holdings in Latvia, which involves social,
economic, environmental and innovative sustainability, is being developed.
Key words: agriculture, sustainability, indicators, intensification.
JEL code: Q12, Q18 Q56
Introduction
According to Agricultural Census data, the utilized agricultural area (UAA) occupied 40% of
the EU-28 territory in 2013. In the EU, 12.2 million agricultural holdings farmed 174.1 million
UAA ha. The average size of agricultural holdings was 14.2 UAA ha. The greatest UAA per
agricultural holding was reported in the Czech Republic (152.4 hectares) and in the United
Kingdom (90.4 hectares). In Romania, 2/3 of the total agricultural holdings had less than 2
UAA ha (Eurostat, 2013).
UAA is an essential resource in any country’s national economy. Its use requires an
appropriate climate, rich soils and an advantageous geographic location. Research on the use
of land resources conducted by scientists plays the leading role in meeting the increasing
demand for food in the world, while at the same time avoiding global climate change. The
basic idea of sustainable intensification (SI) of agricultural production is to increase the
productivity of land resources, while at the same time enhancing environmental management.
Corresponding author. Tel.: + (37129282040); fax: + (371 630 84987).
E-mail address: ([email protected]).
Proceedings of the 2015 International Conference “ECONOMIC SCIENCE FOR RURAL DEVELOPMENT”, No37
Jelgava, LLU ESAF, 23-24 April 2015, pp. 160-170

161
This means that the combination of factors of production used in agricultural production will
not be the same for all management systems and industries.
The origin of the term sustainable intensification dates back to 1990 when development
professionals sought ways how to tackle the increasing deficit of food in developing countries
(Pretty J., 1997), (Beddingtonetal J.R., 2012), (De Schutter O., 2010) and (The Future of
Food…, 2011). The sustainability of agricultural production, under the conditions of
intensification, has to be measured. According to some authors, the most important dimension
of agricultural production is the social sustainability of agricultural holdings (David S., 1989
and Webster P., 1999). Social sustainability indicators are subjective in nature and differ
among farmers and other social groups in the way they are perceived (Van Calker et al.,
2007). From the perspective of farmers, the economic sustainability of agricultural holdings is
the most important. In scientific research, most often, the improvement of economic indicators
of agricultural production is associated with more intensive and sustainable uses of land
resources (Van Cauwenbergh N., et al., 2007). Scientific researches by some authors compare
the model of organic and conventional agricultural holdings in the context of sustainability
(Rasul G., Thapa G.B., 2003 and Proc R., Soc B., 2014). Yet, the newest scientific researches
involve in-depth examinations of all the dimensions of sustainability in order to find the
solutions to the use of land resources that balance the provision of socio-economic and eco-
system services (Pretty J., 2011, Foley J., 2011 and Geraldo M.B., 2012). An opinion is
supported that agricultural productivity has to be increased by employing innovative solutions
on the present land area without changing rural landscapes (FAO, 2010 and Jaggard K.W.,
2010). Such a development scenario may be provided by simultaneously controlling all the
indicators of sustainability dimensions to achieve the targets set.
An understanding of term sustainability improved since 1987 when the UN World
Commission on Environment and Development (the Brundtland Commission) produced a
report Our Common Future. Systems for tracing sustainable development have been designed
by creating indicators of progress. Some sustainable development indicators employed are as
follows: Indicators of Sustainable Development (UN, 2007); Eurostat Sustainable Development
Indicators (Eurostat, 2014); OECD Environmental Indicators (OECD, 2001); Environmental
Performance Index (EPI) (Environmental..., 2014); Ecological Footprint (Working Guidebook...,
2014).
Under agricultural intensification, it is important to identify sustainability at the level of
farms. Farms producing agricultural products are very diverse in terms of economic size and
specialisation. Based on SI indicators, it is possible to compare these different farms in terms
of social, economic, environmental as well as innovation sustainability.
Latvia’s Rural Development Plan 2014-2020 has set a target to exploit up to 2.1 million UAA
ha for agricultural production (Rural Development…, 2014). The total land area under crops
will increase by 11% in Latvia. Researches on efficient uses of land resources in Latvia have

162
been done (LLU, 2014), (Pilvere I., 2013) and (Lenerts A., 2013a), yet, opportunities for the
SI of UAA at the level of farms have not been scientifically assessed and compared.
In the present research, the author sets an aim to develop a theoretical model for
calculating sustainable intensification indicators (SIIs) for agricultural holdings in Latvia. The
research object is the sustainable intensification of UAA and the research subject is a
theoretical model for calculating SIIs of UAA. To achieve the aim, the following tasks were set:
1) to analyse the development of use of land resources in Latvia; 2) to define the indicators of
SI of UAA; 3) to develop a theoretical model for calculating SIIs.
To execute the research tasks, analysis, synthesis, the logical and constructive methods,
induction and deduction were employed. The study design process used special and general
literatures, methodological materials on land use etc.
The research results are useful for national institutions, for example, the Ministry of Agriculture
and the Ministry of Environmental Protection and Regional Development in order to provide a
long-term and sustainable land use in Latvia.
Research results and discussion
For a situation analysis and a selection of indicators, data of the Farm Accountancy Data
Network (FADN) and the information of Latvia’s Central Statistical Bureau (CSB) and National
Inventory Report (NIR, 2014) were employed. Researches by scientists of Latvia University of
Agriculture were used for identifying the potential of UAA.
1. Development of use of land resources in Latvia
Since the accession to the EU in 2004, agricultural production has grown in Latvia. With a
growth rate of 5.6%, agriculture is the second fastest growing sector in Latvia (Agriculture in
Latvia, 2014). Bioresources of agricultural origin are also used for biofuel (Lenerts A., 2013a)
and biogas production (Lenerts A., 2012). Increases in output and economic activity in Latvia
have to be ensured without increasing greenhouse gas (GHG) emissions from agriculture
(European Parliament…, 2009).
Agriculture faced a decrease in output in the 1990’s. Until 2000, the GHG emissions from
agriculture declined 67%.

163
0
500
1 000
1 500
2 000
2 500
3 000
3 500
2005 2006 2007 2008 2009 2010 2011 2012 2013Year
Th
s.
u.
2000
2050
2100
2150
2200
2250
2300
2350
2400
2450
Gg
CO
2 e
q.
Total output of key agricultural crops Total areaMilk output Number of cattleMeat output Emissions
Source: author’s construction based on the CSB, NIR, 2014
Fig.1. Changes in the main GHG emissions caused by agriculture
Yet, since 2000, with agricultural production growing, a gradual and stable increase in GHG
emissions has been observed in Latvia (Fig.1, +15% from 2005 to 2013). Latvia’s agricultural
sector contributes to about 22% of the country’s total GHG emissions (NIR, 2014).
Compared with the average EU indicators, agricultural production is still extensive and
inefficient in Latvia. It is indicated by agricultural value added and GHG emissions. In the
period 2005-2012, the use of fertilisers increased 52%, reaching 65.2 thousands a year, while
an increase in productivity varied within a range of 20-30% (Agriculture in Latvia, 2014).
The conception of SI of agricultural production became topical in the beginning of the 21st
century, responding to food security challenges in the world. Two clear trends emerged in rural
areas: 1) a decrease in the agricultural area; 2) a decrease in the available agricultural area
per capita (Koning N., 2009) and (Cassman K.G., 2010). In the period 2005-2012, according
to the FAO Statistics Division, the agricultural area decreased by 5470 ths ha in the world,
accounting for 0.2% of the total land area.
In Latvia, free agricultural land resources may be engaged in agricultural production by
accepting the SI model. It will contribute to an increase in agricultural output, reducing effects
on the environment. An indirect stimulus for assessing the sustainability of Latvia’s agricultural
production is the initiated negotiations on joining the Organisation for Economic Co-operation
and Development. Achieving the sustainability indicators of agricultural production is an
essential criterion for joining this organisation.
2. Indicators of SI of UAA
Agricultural sustainability is regarded as the key precondition for long-term agricultural
production profitability in rural areas. To fully assess and comprehend the sustainability of a
rural enterprise, indicators that are widely used and contain information on environmental
quality, economic viability, employment, social environment and innovation have to be
selected. The indicators may be used individually or as a component of a complex index. The
primary aim of the present research is to select SI indicators that make significant effects on

164
the social, economic, environmental and innovative sustainability of Latvia’s farms. These
indicators may be acquired from FADN, RSS and CSB databases compiling information on the
performance of rural enterprises. The calculation methodology is explained in the next chapter
of the paper.
The most characteristic indicator of SI is chosen for each dimension of sustainability based
on a methodology developed by S.Bell and S.Morsi in their work „Sustainability Indicators:
Measuring the Immeasurable?” (Bell S. and Morse S., 1999). Indicators are used in the EU to
achieve the targets set, as ...“indicators provide the basis for assessing progress towards the
long-term objective of sustainable development. Long-term targets only have meanings as
policy goals if progress towards them can be assessed objectively” (European Commission,
2001). So, sustainability indicators are needed to assess the implementation of sustainability
measures under the EU CAP.
Economic Indicators. The economic sustainability of farms in Latvia is strongly associated
with economic processes in global markets. Product prices and demand make significant
effects on these indicators. Five indicators, which indicate the productivity, profitability and
viability of farms, were selected in the present research. Ensuring the economic sustainability
of farms is not always possible by meeting environmental and sustainability requirements. The
source of indicator data is the FADN, and the data are summarised in Table 1.
Table 1
Economic sustainability indicators of agricultural holdings
Indicator Measure Unit
Productivity of labour Income per unpaid labour unit EUR/labour unit
Productivity of land Gross output per hectare EUR/hectare
Profitability Market based gross margin per hectare EUR/hectare
Viability of investment Farm is economically viable 1=viable, 0= not viable
Market orientation Output derived from the market %
Source: author’s construction
Environmental indicators. Scientific experience about the effects of farms on the
environment has become more profound. The leading EU Member States in agricultural
production have introduced a precise data collection system to determine the effects on the
environment. Latvia will have to introduce a similar data collection system for the purpose of
calculating environmental SIIs. The indicators of environmental sustainability are selected
taking into account the following: air quality/climate change; risk to water quality; habitat and
biodiversity.

165
Table 2
Environmental sustainability indicators of agricultural holdings
Indicator Measure Unit
GHG emissions per farm IPCC estimate/ farm Tonnes CO2
equivalent/farm
GHG emissions per kg of output IPCC estimate/ kg of output Kg CO2 equivalent/kg
output
Nitrogen (N) balance Risk to water quality Kg N surplus/hectare
Nitrogen (N) use efficiency Nitrogen use efficiency
/product
Kg N surplus/unit product
Emissions from fuel and electricity CO2 equivalent/kg output Kg CO2 equivalent/kg
Source: author’s construction
GHG emissions are the primary cause of global warming. One of the most pressing
challenges for Latvian agriculture will be to produce more food while reducing the GHG
emissions. Agriculture was Latvia’s second largest emission source by sector, accounting for
22% of the total GHG emissions in 2013 (NIR, 2014). Two greenhouse gas emission indicators
are developed. Both indicators are calculated using IPCC coefficients and conventions. One is
expressed on a per farm basis while the other is expressed per unit of product.
Social indicators. Agriculture provides the viability of rural environment and develops
territorial infrastructures. It is usually the only economic activity in rural areas.
Table 3
Social sustainability indicators of agricultural holdings
Indicator Measure Unit
Household
vulnerability
Farm business is not viable - no off-farm
employment
Binary, 1= Yes, 0= No
Education level Educational attainment Count variable 1 - 51
Isolation risk Farmer lives alone Binary, 1= Yes, 0= No
High age profile Farmer is over 60 years of age and no
household member is less than 45
Binary, 1= Yes, 0= No
Work life balance Work load of farmer Hours worked on the
farm
Source: author’s construction
When defining social SIIs, life quality indicators have to be considered depending on the kind
of chosen occupation. Farm revenues are not regarded as an indicator of social sustainability
because it is more important to assess the overall wellbeing and life quality of rural
communities in accordance with sustainability principles.

166
Innovation Indicators. The market of agricultural goods and the market of resources used in
production are constantly changeable. Innovation enables farms to remain competitive by
introducing innovations and producing more products with fewer resources. Innovation is a
broad term, as it means “new to the firm, new to the market or new to the world” (OECD and
Eurostat, 2005). Innovation is regarded as: a new process; a new product; new forms of
management; and new supply sources used.
Table 4
Innovation sustainability indicators of agricultural holdings
Dairy Cattle Sheep Tillage
Milk recording Quality assurance
member
Quality assurance
member
Forward selling
Discussion group
member
Reseeding Reseeding ICT usage
Spring slurry spreading Soil testing Soil testing Soil testing
Source: author’s construction
At the level of farms, there are a lot of innovations referring to the process of innovation: new
production techniques; higher resource use efficiency; new cooperation models etc. More
efficient uses of resources (land, livestock, fertilisers, labour and technologies) will lead to
reductions in production costs. Accordingly, the introduction of new technologies and
participation in advanced training courses are used as innovation sustainability indicators.
Regularly collecting such data allows assessing the efficiency of innovations and technologies in
the future. Employing SIIs enables assessing innovations at the level of farms, thus identifying
their economic efficiency and environmental protection effectiveness in achieving the overall
sustainability of farms.
3. Theoretical model for calculating sustainable intensification indicators
The present research aims to assess the sustainability of a particular industry numerically.
The most precise way of assessing it involves calculating a synthetic SII for various factor
groups. It is important that it is possible to identify changes in a process in time, and it is
desirable to shape a notion of the period when negative effects have been minimal. At the
same time, the indicators have to be instruments assisting in simplifying the obtaining and
analyses of information and in identifying problems well as in formulating and making a
government policy aimed at solving the problems.
Pair-wise analysis was employed to identify the significance of effects of the factors
affecting the sustainability of an industry. An analysis involved a matrix in which the factors
affecting the sustainability of an industry were put horizontally and vertically. The number of a
factor that is superior over another is written in an appropriate cell in the horizontal row. The
final cell of the row shows the number of advantages of the given factor. The total number of
advantages for all the factors is calculated summing up the values in the vertical column. This
sum is assumed to be equal to 1. The proportion of each factor’s number of advantages

167
indicates the given factor’s relative weight of effects in a range from 0 to 1. So, each factor’s
significance of effects is assessed. The SI model takes into consideration a factor’s numerical
value by multiplying it by the coefficient of significance.
Further, the indicators are normalised, the key purpose of which is to avoid a situation when
one or several factors may prevail, as the range of factor values may be very diverse. The
normalised indicators are derived from the initial indicators that are expressed in different
units of measurement. In the result of normalisation, the initial units of measurement
disappear and, consequently, different indicators become comparable. After analysing the most
popular data normalisation methods, the author has chosen min-max normalisation [from 0 to
1] in calculating the SIIs, which is performed if values are only positive and, in the result of
normalisation, they will be within a range from 0 to 1. The normalisation is performed
according to Formula 1:
minmax
min'
aa
aaa i
i
, (1)
where: '
ia - normalised value of a factor;
ia - actual value of a factor;
mina and maxa - minimum and maximum values of a factor.
The next stage involves the composition of a SII function. The sustainability model
developed by the author for Agricultural Industries III involves four groups of factors affecting
sustainability and is expressed with Formula 2:
1)`( 4321 INVSE FFFFIINI , (2)
where: SII – sustainable intensification index of an industry;
71... - relative weights of factors;
EF - economic sustainability index;
SF - social sustainability index;
VF - environmental sustainability index;
INF - innovation sustainability index.
In Formula 2, the agricultural industry’s SI tends towards 1, as a min-max
normalisation was performed, which means that a maximum value the SII can reach is 1.
Each factor group indicator nF is computed taking into account the indicators of the given
factor groups, applying the above mentioned min-max normalisation. To hold the index value
within a range from 0 to 1, an arithmetic mean of the indicators of certain factor groups is
computed (Formula 3).
nn
n
ff
ff
ff
ff
ff
ff
NF
n
n
minmax
min
minmax
min2
minmax
min1...
1
22
2
11
1
, (3)

168
where: nF - index of the group of factors affecting the agricultural industry’s SI;
nff ...1 - actual values of factor indicators;
maxmin , ff - minimum and maximum values of factor indicators;
N – number of factor indicators.
Conclusions
1. The UAA in the EU and Latvia is a significant resource and occupies 40% of the total
territory.
2. In Latvia, 1815.9 thousands ha of agricultural land is exploited in agricultural production,
and 400 thousands UAA ha are additionally available.
3. The agricultural sector contributes to 22% of Latvia’s total GHG emissions, with an increase
of 15% from the base year, which will surge owing to an increase in the UAA.
4. Employing adequate indicators of agricultural holdings, it is possible to compute SIIs in
order to identify sustainability in agricultural production in Latvia.
Acknowledgement
The research was promoted with the support of the National research programme project
"Value of Latvian Ecosystem and Its Dynamics in the Influence of Climate" (EVIDEnT),
Contract No 2014/VPP2014-2017.
Bibliography
1. Agriculture in Latvia (2014). Ministry of Agriculture of the Republic of Latvia (in Latvian).
2. Beddingtonet, J.R. al. (2012). The role for scientists in tackling food insecurity and climate
change. Agriculture & Food Security. Retrieved:
http://www.agricultureandfoodsecurity.com/content/1/1/10 Access: 04.12.2014.
3. Bell, S., Morse, S. (1999). Sustainability Indicators: Measuring the Immeasurable?
Earthscan Publications, London.
4. Cassman, K.G., Grassini, P., van Wart, J. (2010). Crop yield potential, yield trends, and
global food security in a changing climate. In: Rosenzweig, C., Hillel, D. (Eds.), Handbook
of Climate Change and Agroecosystems. Imperial College Press, London, pp. 37–51.
5. David, S. (1989). Sustainable Development: Theoretical Construct or Attainable Goal?.
Environmental Conservation, 16, pp 41-48. doi:10.1017/S0376892900008493.
6. De Schutter, O. (2010). Agro ecology and the Right to Food. Report presented at the 16th
Session of the United Nations Human Rights Council. Retrieved:
http://www2.ohchr.org/english/issues/food/docs/A-HRC-16-49.pdf
7. Decision of the European Parliament and of the Council (2009). No 406/2009/EC on the
effort of Member States to reduce their greenhouse gas emissions to meet the
Community's greenhouse gas emission reduction commitments up to 2020.
8. Environmental Performance Index (2014). JRC Analysis and Recommendations.
9. Eurostat (2014). Sustainable development in the European Union. Retrieved: http://ec.europa.eu/eurostat/web/products-statistical-books/-/KS-02-13-237 Access:
10.12.2014

169
10. Eurostat (2013). Agriculture, fishery and forestry statistics. Pocketbooks. Main results
2013. Retrieved: http://ec.europa.eu/eurostat/statistics Access: 1.12.2014
11. FAO (2010). State of Food and Agriculture. FAO, Rome, Italy. Retrieved:
http://www.fao.org/docrep/013/i2050e/i2050e.pdf Access: 01.12.2014
12. Foley, J., et al. (2011). Solutions for a cultivated planet. Nature 478, 337–342.
13. Geraldo, M.B., Alves, E., Contini, E. (2012). Land-saving approaches and beef production
growth in Brazil. Agric. Syst., Retrieved:
http://www.sciencedirect.com/science/article/pii/S0308521X12000340 Access: 24.11.2014
14. Jaggard, K.W., Qi, A., Ober, E.S. (2010). Possible changes to arable crop yields by 2050.
Philos. Trans. R. Soc. B 365, 2835–2851. Retrieved:
http://rstb.royalsocietypublishing.org/content/365/1554/2835 Access: 04.11.2014
15. Koning, N., van Ittersum, M.K. (2009). Will the world have enough to eat? Curr. Opin. Env.
Sustainabil. 1, 77–82.
16. Latvia’s National Inventory (2014). Latvian Environment, Geology and Meteorology Centre.
17. Lenerts, A. (2013). Sustainable Use of Bio-resources of Agricultural Origin: the Basis of
Bioeconomy in Latvia. In: RURAL DEVELOPMENT 2013: innovations and sustainability: The
sixth international scientific conference proceedings. Volume 6, Book 1 pp. 209-214.ISSN
2345-0916
18. Lenerts, A., Strikis, V. (2013.a). Bio-economy and a sustainable market for biofuels. In:
ECOLOGY, ECONOMICS, EDUCATION AND LEGISLATION: Proceedings of the International
Multidisciplinary Scientific Geoconference SGEM 2013. Volume II pp. 49-56. ISSN 134-
2704
19. Lenerts, A., Pilvere, I. (2012). Role of Land Resources in the Development of the Market of
Renewable Energy Sources of Agricultural Origin in Latvia. Economic Science for Rural
Development: Proceedings of the international Scientific Conference. No.29: Rural Business
and Finance,73-79.1691-3078
20. LLU (2014). Economically Efficient, Sustainable and Productive Use of Land for Producing
Agricultural and Forestry Products (In Latvian). Jelgava, p.204.
21. OECD (1999). Environmental Indicators for Agriculture. Publications Service.
22. OECD and Eurostat (2005). Oslo Manual: The Measurement of Scientific and Technological
Activities. Proposed Guidelines for Collecting and Interpreting Technological Innovation
Data. Joint publication OECD and Eurostat. Third edition. Retrieved:
http://www.oecd.org/science/inno/2367580.pdf Access: 4.12.2014.
23. Pilvere, I., Nipers, A., Zarins, J. (2013). Use of Agricultural Land in the Parishes of Latvia.
In: RURAL DEVELOPMENT 2013: innovations and sustainability: The sixth international
scientific conference proceedings. Volume 6, Book 1 pp. 591-598. ISSN 2345-0916
24. Proc. R., Soc. B. (2014). Diversification practices reduce organic to conventional yield gap.
The Royal Society. Retrieved:
http://rspb.royalsocietypublishing.org/content/282/1799/20141396. Access: 04.12.2014
25. Pretty, J. (1997).The sustainable intensification of agriculture. Natural Resources Forum.
21: 247-256.
26. Pretty, J., Toulim, C., Williams, S. (2011). Sustainable intensification: increasing pro-
ductivity in African food and agricultural systems. Int. J. Agric. Sustain. 9, 5–24.
27. Rasul, G., Thapa, G.B. (2003). Sustainability analysis of ecological and conventional
agricultural systems in Bangladesh. World Dev 31(10):1721–1741
28. Rural Development Programme 2014-2020 (2013). (In Latvian) Draft, 2013. p.142.
29. The Future of Food and Farming: Challenges and Choices for Global Sustainability (2011).
Final Project Report. Government Office for Science, London.
170
30. UN (2007). Indicators of Sustainable Development: Guidelines and Methodologies United
Nations publication. ISBN 978-92-1-104577-2
31. Van Cauwenbergh, N., Biala, K., Bielders, C., Brouckaert, V., Franchois, L., Cidad, V.G.,
Hermy, M., Mathijs, E., Muys, B., Reijnders, J., Sauvenier, X., Valckx, J., Vanclooster, M.,
der Veken, B.V., Wauters, E., Peeters, A. (2007). SAFE – a hierarchical framework for
assessing the sustainability of agricultural systems. Agric Ecosyst Environ 120:229–242.
32. van Calker, K.J., Berentsen, P.B.M., de Boer, I.J.M., Giesen, G.W.J., Huirne, R.B.M.(2007).
Modelling worker physical health and societal sustainability at farm level: an application to
conventional and organic dairy farming. Agr Syst 94:205–219. Retrieved:
http://www.sciencedirect.com/science/article/pii/S0308521X06001181 Access: 16.12.2014
33. Webster, P. (1999). The challenge of sustainability at the farm level: presidential address. J
Agric Econ 50(3):371–387
34. Working Guidebook to the National Footprint Accounts (2014). Global Footprint Network.

171
Proceedings of the 2015 International Conference “ECONOMIC SCIENCE FOR RURAL DEVELOPMENT”, No37
Jelgava, LLU ESAF, 23-24 April 2015, pp. 170-179
TENDENCY OF CHANGES IN EXPENDITURES FOR ENVIRONMENTAL
PROTECTION IN THE EUROPEAN UNION
Tomasz Pajewski*, MA
Faculty of Economics, Warsaw University of Fife Sciences
Abstract. The problem of protection of the natural environment has been underlined more and
more frequently by the academic world and by politicians alike. The EU legislation is
increasingly focused on environment-friendly activity. The private and the public sphere are
equally obligated to protect the natural environment. Expenditures of the European Union for
environmental protection are increased every year, which is associated with the development
of numerous environment-friendly investment projects.
Keywords: environmental protection, agro-environmental measures, funding
JEL code: ESRD 057
Introduction
Environmental protection is becoming an increasingly important issue for its citizens,
one of the key areas of activity of the state†. The global climate change is a new dimension of
the environmental protection policy. For the first time, this problem has been mentioned in the
international debate in the mid-1980s, and it became visible even more clearly in the last
decade‡. The issue of environmental protection exerts impact on every sphere of social and
economic life. Both economic operators and natural persons are obligated to comply with legal
provisions on protection of the natural environment. The scale of this activity is illustrated by
the level of expenditures designated for environmental protection, which is growing.
Expenditures for environmental protection constitute the total of the investment
capital and the running expenses for activities aimed at environmental protection§. Running
expenses are expenditures associated with prevention, limiting, eliminating or managing
pollution and other environmental losses due to day-to-day activity of business entities. These
are internal costs (including costs of operation and maintenance of environmental protection
* Tel. +48 0-22 5934231. Fax +48 0-22 5934230. E-mail [email protected]
† Rudzka B., 2011, Srodowisko w budzecie zadaniowym – 2011 rok, Polityki Europejskie, Finanse i Marketing, 5 (55),
p. 109
‡ Vogel D., Toffel M., Post D., Uludere Aragon N. Z., 2010, Environmental Federalism in the European Union and the
United States, Working Paper 10-085, February 21, 2010, http://www.hbs.edu/faculty/Publication%20Files/10-085.pdf
[access date: 30.12.2014], p. 3
§ Environmental expenditure statistics 2007 edition General Government and Specialised Producers data collection handbook, http://ec.europa.eu/eurostat/documents/1798247/6191545/2-KS-RA-07-012-EN.pdf/bbeaa287-1b04-4f54-adb2-ddbd04409b8c [access date: 30.12.2014], p. 63

172
installations and environmental charges), costs of services rendered by external entities,
payments for sewage treatment and collection of waste, costs of control systems, monitoring,
lab tests, management. Investment projects and running expenses for environmental
protection depending on the ownership sector include*:
the public sector;
the sector of enterprises;
manufacturers specializing in environmental protection, for whom the main field of
operation are environmental protection services, first of all, collection and treatment of
sewage;
the sector of households.
The mode of financing of activity in the field of environmental protection is subject to
evolution processes. There are several sources of funds for environment-friendly investment
projects. New foundations, banks and investment funds that provide support for environment-
friendly activity keep emerging. The share of the private sector is increasing, including the
internal funds of enterprises. It should be kept in mind that enterprises – through the
obligatory payments and fines charged – are the main source of funds for environmental
protection and water management, which makes this share even more significant†.
One of the main tasks of the European Union is protecting for the natural
environment. There are many instruments that contribute to this goal, funds for this purpose
being of the greatest significance. The most important tool that supports the environmental
policy of the European Union is the LIFE programme, established in 1992. It is increasingly
focused on programmes aimed at protection of the natural environment. The LIFE funds are
used to support strategies aimed at dealing with such issues as decreasing biodiversity, loss of
habitats, effective use of resources and responses to climate changes.‡ An important role in
the environmental policy of the European Union is also played by the Common Agricultural
Policy.
1. The objective and method of research
The aim of this study was to present changes in expenditures designated for
environmental protection in the European Union in the years 2003-2012. The number on
expenditures of the governmental sector and the local government sector for environmental
protection was analyzed. These expenditures included all activities aimed directly at
preventing, reducing and eliminating pollution or any other environmental degradation.
Graphics were used to present changes in the expenditures of the public sector for
* Broniewicz E., 2011, Environmental… , p. 22 † Fura B., 2010. Nakłady inwestycyjne w ochronie srodowiska a realizacja zalozen rozwoju zrownowazonego, Zeszyty Naukowe Uniwersytetu Rzeszowskiego, Nierownosci społeczne a wzrost gospodarczy. Spojnosc społeczno-ekonomiczna a modernizacja gospodarki, Zeszyt 17, p. 309 ‡ The EU explained: Environment, European Commission, Directorate-General for Communication, Publications, 2013, http://europa.eu/pol/pdf/flipbook/en/environment_en.pdf [access date: 10.01.2015] p. 7

173
environmental protection. It should be underlined that the numeric values presented in the
charts are estimates, published by Eurostat – the statistical portal of the European Union.
It should also be noted that the criteria, applied in Eurostat, distinguish nine areas of
environmental protection, in which investment projects were implemented. These include: air
and climate protection, sewage management, waste management, protection and
rehabilitation of the soil, groundwater and surface waters, noise and vibration reduction,
protection of biodiversity and the landscape; protection against radiation, other tasks in the
field of environmental protection and research and development*.
2. The environment-friendly policy under the Common Agricultural Policy of the
European Union
A significant role in emergence of global threats to the natural environment is said to
be played by developing countries and states of the Central and Eastern Europe. In general,
the poor condition of the natural environment is associated with the rather poor socioeconomic
status of these countries†. Environmental protection is thus a set of ideas, means and activities
aimed at retaining of the condition of the natural environment that going to warrant optimum
living conditions for humans and continuity of the key processes in the biosphere as the basis
for human production and consumption. Environmental protection is the activity aimed at more
comprehensive meet of needs of the human beings. It is not an antithesis to economic
business activity but a factor that regulates the scope and direction of this activity in the best
interest of the human race. Activities, which are aimed at environmental protection, should not
exert negative impact on other spheres of human activity. First of all, they should not cause an
additional financial burden in countries characterized by a low level of economic development.
The sector, which uses most natural resources in all of the Member States of the
European Union, is agriculture. Agricultural activity exerts strong impact on the environment in
the EU – both positive and negative. Due to the fact that the Common Agricultural Policy
(CAP), and, in particular, the institution of agricultural-environmental programmes, are the
main driving force behind the agricultural sector, it makes an excellent tool for environmental
management in the rural areas‡. Acceding to the European Union, Poland had to accept the
mechanisms of the Common Agricultural Policy, including the instruments of the agricultural-
environmental policy. It should be underlined that the scope of tasks associated with
environmental protection was broadened substantially after Poland’s succession to the
European Union. The numerous commitments, included in the accession treaty, obligate the
entrepreneurs to implement the environmental standards of the European Union§. It should be
stated that the principle confirm that the costs of prevention and of measures to deal
* Eurostat, http://ec.europa.eu/eurostat/cache/metadata/en/env_ac_exp1r2_esms.htm, [access date: 31.12.2014] † Gotkiewicz W., Mickiewicz B., 2008, Ochrona srodowiska na terenach rolniczych Euroregionu Niemen, Ochrona Srodowiska i Zasobow Naturalnych no.37, p. 210-211 ‡ Assessing environmental integration in EU agriculture policy, EEA Briefing 01/2006, p. 1 § Zbaraszewski W., 2008, Finansowanie ochrony srodowiska przez przedsiebiorstwa w Polsce, Zeszyty Naukowe SGGW Ekonomika i Organizacja Gospodarki Zywnosciowej, no. 66, p. 128

174
with pollution should be borne by the polluter removal is of the greatest fiscal significance in
the environmental protection policy of member states of the European Union.*
As a result of the reform of the Common Agricultural Policy (CAP) of 1992, the
Member States were obligated to introduce the agricultural and environmental programmes.
The reform of 2003 maintained the compulsory nature of agricultural and environmental
programmes for the Member States. Two types of these programmes are implemented: zone-
based (limited strictly to specific areas and associated mainly with protection of biodiversity)
and horizontal, which may be implemented across the entire country. Each Member States
develops their own agricultural and environmental programme, which should specify problems
and define objectives precisely†.
Environment-friendly activity in Poland in the years 2004-2006 was implemented
within the framework of the Programme for Development of the Rural Areas and the Sector
Operational Programme “Restructuring and Modernization of the Food Sector and Development
of the Rural Areas.” Allocation for environmental purposes amounted to about ¼ of all funds
designated for these programmes. In September 2005, a reform of the Common Agricultural
Policy was adopted for the years 2007 – 2013, focused on the policy of development of the
rural areas. The mode of financing of this policy was very much simplified‡. The European
Agricultural Guidance and Guarantee Fund, which had been the source of financing of the
agricultural policy of the European Union until the year 2006, was divided into two separate
funds: the European Agricultural Fund for Rural Development and the European Agricultural
Guarantee Fund, for expenditures associated with the market and direct payments§. Total
expenditures for environmental protection in the year 2007 cost the European economy about
EUR 220 billion**.In Poland in the new financing period, the Rural Development Programme for
the years 2007 – 2013 was implemented. The total amount of expenditures provided for the
“new” programme is approximately EUR 17.2 billion, including about 34% allocated for
environmental purposes. Most environment-friendly activities are a continuation of the tasks
supported in the previous financing period††.
The most recent reform of the Common Agricultural Policy still points to a tendency to
support and finance projects in the field of environmental protection‡‡. It is also aimed at
redistribution of payments from countries, in which the payments are currently higher, on
behalf of those countries, which receive less support. The general assumption of the CAP
reform of 2014 is to maintain the constant level of expenditures, and thus, to achieve a certain
* Zeber-Dzikowska I., Buchcic E., 2004, Modelowe tendencje rozwojowe w wdrazaniu zagadnien z ochrony srodowiska i regionalizmu w dobie Unii Europejskiej [in:] M. Strzyz (ed.), Perspektywy rozwoju regionu w swietle badan krajobrazowych Problemy Ekologii Krajobrazu PAEK, Kielce, p. 245 † Brodzinska K., 2008, Program rolno-srodowiskowy i jego zakres realizacji w aspekcie rozwoju rolnictwa i ochrony
srodowiska, Zeszyty Naukowe SGGW Problemy Rolnictwa Swiatowego, Volume 4 (19), p. 83-84 ‡ Broniewicz E, 2011, Environmental Protection Expenditure in European Union, Environmental Management in Practice, InTech, Chapters published July 05, p. 22 § Oleszko-Kurzyna B., 2008, Rozwoj zrownowazony rolnictwa wobec wymogow Unii Europejskiej w zakresie ochrony srodowiska, Zeszyty Naukowe SGGW Problemy Rolnictwa Swiatowego, Volume 4 (19), p. 330-331
** Broniewicz E., 2011, Environmental… p. 22
†† Oleszko-Kurzyna B., 2008, Rozwoj … p. 335
‡‡ Vapa Tankosic J., Stojsavljevic M., 2014, EU Common Agricultural Policy and pre-accession assistance measures for rural development, Economics of Agriculture 1/2014, p. 202

175
level of savings. Therefore, the expenditures for the years 2014-2020 have been planned to
reach the level of EUR 423 billion*.
Expenditures for environmental protection constitute the total of the investment
capital and the running expenses for activities aimed at environmental protection†. Running
expenses are expenditures associated with prevention, limiting, eliminating or managing
pollution and other environmental losses due to day-to-day activity of business entities. These
are internal costs (including costs of operation and maintenance of environmental protection
installations and environmental charges), costs of services rendered by external entities,
payments for sewage treatment and collection of waste, costs of control systems, monitoring,
lab tests, management. Investment projects and running expenses for environmental
protection depending on the ownership sector include‡:
the public sector;
the sector of enterprises;
manufacturers specializing in environmental protection, for whom the main field of
operation are environmental protection services, first of all, collection and treatment of
sewage;
the sector of households.
The mode of financing of activity in the field of environmental protection is subject to
evolution processes. There are several sources of funds for environment-friendly investment
projects. New foundations, banks and investment funds that provide support for environment-
friendly activity keep emerging. The share of the private sector is increasing, including the
internal funds of enterprises. It should be kept in mind that enterprises – through the
obligatory payments and fines charged – are the main source of funds for environmental
protection and water management, which makes this share even more significant§.
Analysis of expenditures for environmental protection is of strategic significance as it
allows for assessment of the environmental protection policy, which has already been
established. A low level of expenditures does not necessarily mean that a given country is not
able to protect the natural environment effectively**.
3. Expenditures for environmental protection in the EU-28
The funds used for environmental protection are of increasing significance in the
European Union. Although most obligations with regard to environmental protection are
imposed upon entities, which take direct advantage of the natural resources (the enterprises)
* Vapa Tankosic J., Stojsavljevic M., 2014, EU Common Agricultural Policy and pre-accession assistance measures for rural development, Economics of Agriculture 1/2014, p. 203 † Environmental expenditure statistics 2007 edition General Government and Specialised Producers data collection handbook, http://ec.europa.eu/eurostat/documents/1798247/6191545/2-KS-RA-07-012-EN.pdf/bbeaa287-1b04-4f54-adb2-ddbd04409b8c [access date: 30.12.2014], p. 63 ‡ Broniewicz E., 2011, Environmental… , p. 22 § Fura B., 2010. Nakłady inwestycyjne w ochronie srodowiska a realizacja założeń rozwoju zrownowazonego, Zeszyty Naukowe Uniwersytetu Rzeszowskiego, Nierownosci społeczne a wzrost gospodarczy. Spojnosc społeczno-ekonomiczna a modernizacja gospodarki, Zeszyt 17, p. 309 ** Broniewicz E., 2011, Environmental…, p. 35

176
in accordance with the polluter pays principle, it should be noted that such costs are borne by
the state as well. The countries of the European Union (the public sector) bear the costs
associated with protection of the natural resources. Since the very beginning of its existence
until the present, many amendments have been made to the environmental policy of the
European Union. These changes have been aimed at preservation of the natural environment
and they have progressed, serving as a basis for the present community policy, which puts
particular emphasis on environmental protection, treating it as a priority.
Figure 1.
Total expenditures for environmental protection in the public sector – EU 28
Source: own studies on the basis of Eurostat
Figure 1 presents the value of total expenditures for environmental protection in the
European Union in the period 2003-2012. It should be underlined that in the years 2003-2006,
there was an increase in the state expenditures for environmental protection from EUR 60
billion to approximately EUR 80 billion. These expenditures remained rather stable in the
period of 2007-2012 at the level of more than EUR 85 billion annually. Worth noting are also
the substantial differences in the level of these expenditures in individual countries. The
highest average level of expenditures in the analyzed period was recorded in Great Britain, and
the lowest - in Malta*.
Governmental expenditures associated with environmental protection in the European
Union have been presented in Figure 2 in the format of EUR 1 per person (per capita). In the
years 2003-2012, the amount ranged between EUR 126-177 per capita. In this period, the
highest average level of expenditures was recorded by Luxembourg – EUR 583.00 per-capita.
The lowest amount per capita was recorded in Bulgaria – it was equivalent to EUR 21.58†.
* The average value for the UK amounted to EUR 15531.14 million, and for Malta - EUR 85.24 million. The database of Eurostat also contains data for countries, which achieve a result lower than Malta – these included Serbia, Estonia, Cyprus and Croatia – they were not quoted in the work due to lack of the value of expenditures for environmental protection for all years in the period between 2003 and 2012. †Average values lower than the result of Bulgaria were recorded in Estonia, Croatia and Serbia; however, due to lack
of data for all years in the period between 2003 and 2012, average amounts were not taken into account.

177
Figure 2.
Total environmental protection expenditures in the public sector (EU-28) per capita
Source: own elaboration on the basis of Eurostat
Despite the growing interest in environmental protection in the European Union and
the increasing emphasis of the community policy on environmental issues, it should be noted
that the governmental expenditures for these purposes have remained rather low. This fact is
illustrated by the share of this group of expenditures in the Gross Domestic Product (GDP)
(Figure 3).
Figure 3.
Share of the public sector expenditures for environmental protection in the Gross
Domestic Product (GDP) – EU-28.
Source: own studies on the basis of Eurostat
In the years 2003-2012 , these expenditures constituted about 0.60 – 0.70% of GDP in the
EU-28. Only the year 2009 was characterized by a substantial increase in these values;

178
however, in the subsequent years, expenditures for environmental protection were kept at the
level of about 0.70% of GDP of the EU-28.
Conclusions
The growing concern for preservation of the natural environment results in increased
expenditures for environmental protection. Activity in this regard is increasingly visible in the
world. It is no longer associated only with fashionable slogans. At present, these activities are
more and more often regulated by legislation. A particular case in this regard is the European
Union, which imposes increasingly strict restrictions upon its Member States with regard to
environmental issues, which is due to the priorities associated with the functioning of the
Community that change over time.
Environmental protection depends on financial expenditures. Most charges associated
with use of natural resources are imposed upon entrepreneurs directly responsible for such
use. In the analyzed period between 2003 and 2012, expenditures of the European Union
member states (EU-28) for environmental purposes did not exceed 1% of the Gross Domestic
Product. These expenditures per capita ranged from EUR 120 to 170.
It should be noted, however, that the aggregated values of expenditures for
environmental protection across the entire European Union do not reflect differences between
individual countries. Information published by Eurostat indicate that such countries as Belgium,
Germany, the Netherlands – that is, the so-called highly developed countries – designate
higher amounts for environmental protection in comparison with less developed and
developing countries, such as Malta, Croatia, Romania, Poland or Bulgaria. It can thus be
stated that countries characterized by a higher level of economic development attach greater
importance to environmental issues.
Bibliography
1. Assessing environmental integration in EU agriculture policy, EEA Briefing 01 /2006
2. Brodzinska K. (2008). Program rolno-srodowiskowy i jego zakres realizacji w aspekcie
rozwoju rolnictwa i ochrony srodowiska, Zeszyty Naukowe SGGW Problemy Rolnictwa
Swiatowego, Volume 4 (19)
3. Broniewicz E. (2011). Environmental Protection Expenditure in European Union,
Environmental Management in Practice, InTech, Chapters published July 05,
4. Environmental expenditure statistics 2007 edition General Government and Specialised
Producers data collection handbook,
http://ec.europa.eu/eurostat/documents/1798247/6191545/2-KS-RA-07-012-
EN.pdf/bbeaa287-1b04-4f54-adb2-ddbd04409b8c [access date: 30.12.2014], p. 63
5. Eurostat, http://ec.europa.eu/eurostat/cache/metadata/en/env_ac_exp1r2_esms.htm,
[access date: 31.12.2014]
6. Fura B. (2010). Nakłady inwestycyjne w ochronie srodowiska a realizacja zalozen rozwoju
zrownowazonego, Zeszyty Naukowe Uniwersytetu Rzeszowskiego, Nierownosci spoleczne a
wzrost gospodarczy. Spojnosc spoleczno-ekonomiczna a modernizacja gospodarki, Zeszyt
17

179
7. Gotkiewicz W., Mickiewicz B. (2008). Ochrona srodowiska na terenach rolniczych
Euroregionu Niemen, Ochrona Srodowiska i Zasobow Naturalnych no. 37
8. Oleszko-Kurzyna B. (2008). Rozwój zrownoważony rolnictwa wobec wymogów Unii
Europejskiej w zakresie ochrony srodowiska, Zeszyty Naukowe SGGW Problemy Rolnictwa
Światowego, Volume 4 (19),
9. Rudzka B. (2011). Srodowisko w budzecie zadaniowym – 2011 rok, Polityki Europejskie,
Finanse i Marketing, 5 (55)
10. The EU explained: Environment, European Commission, Directorate-General for
Communication, Publications, 2013,
http://europa.eu/pol/pdf/flipbook/en/environment_en.pdf [access date: 10.01.2015]
11. Vapa Tankosic J., Stojsavljevic M. (2014). EU Common Agricultural Policy and pre-
accession assistance measures for rural development, Economics of Agriculture 1/2014
12. Vogel D., Toffel M., Post D., Uludere Aragon N. Z., 2010, Environmental Federalism in the
European Union and the United States, Working Paper 10-085, February 21,
http://www.hbs.edu/faculty/Publication%20Files/10-085.pdf [access date: 30.12.2014]
13. Zbaraszewski W. (2008). Finansowanie ochrony srodowiska przez przedsiębiorstwa w
Polsce, Zeszyty Naukowe SGGW Ekonomika i Organizacja Gospodarki Zywnosciowej, no. 66
14. Zeber-Dzikowska I., Buchcic E. (2004). Modelowe tendencje rozwojowe w wdrazaniu
zagadnien z ochrony srodowiska i regionalizmu w dobie Unii Europejskiej [in:] M. Strzyz
(ed.), Perspektywy rozwoju regionu w swietle badan krajobrazowych Problemy Ekologii
Krajobrazu PAEK, Kielce

180
Proceedings of the 2015 International Conference “ECONOMIC SCIENCE FOR RURAL DEVELOPMENT”, No37
Jelgava, LLU ESAF, 23-24 April 2015, pp. 180-189
INVESTMENT PLANNING IN THE CONTEXT OF VOLATILE BUSINESS
CYCLES
Jekaterina Nazarova1, Mg.oec., Inna Dovlabdekova2, Dr.oec.+ *
1,2 Riga Technical University, Faculty of Engineering Economics and Management
Abstract. The research “Investment planning in the context of volatile business cycles”
describes stock market activity – related efficient decision making and portfolio structure
optimisation methods, innovatively integrated into a single analytical framework, capable of
providing applicable solutions for the topical economic challenges and capital flow generation
issues. The newly developed forecasting and decision-making model, based on classic and time
– proven methodologies, was created in order to simultaneously preserve and thrive on the
existing expertise and acquired knowledge, while enhancing the existing paradigm capabilities
with the main goal of creating a scientifically justified, risk – wise and reasonably easy to use
equity management method, thus ensuring the appropriate financing of coherent and
consistent economic development, based on sustainable long – term growth. The efficiency of
the model had been quantitatively verified in terms of both empirical and applicable
employability and the acquired results of the conducted experimental implementation were
compared with the previously gained data form applying classic singular analytical approaches
in the broader context of the proposed research hypothesis verification. The main research
question had been provided with a scientifically rational answer, while solving the problem of
making a choice over the preferred strategy of stock market behaviour, adapting to the
existing investment environment and portfolio structure analysis and evaluation.
Keywords: technical analysis, fundamental analysis, stock analysis, decision-making models,
forecasting models, investment portfolio.
JEL code: G11, G17.
Introduction
Investing has always been a risky business, but obtaining from investing may cause an
even greater negative effect of financial asset liquidity and debt solvency, thus market actors
seek alternative methods of investment management in order to insure their capital and
financial reserve consistent, continuous and consequent growth. Stock markets provide
significant earning and finance allocation opportunity, which is the main reason for considering
+Corresponding author. Tel.: + 371 67409184.
E-mail address: [email protected].

181
the relevant activities an attractive concept of capital placing, despite the high risks involved
and being caused by unpredicted stock quote fluctuations and high price volatility. In order to
avoid the above mentioned risk of investment environment rapid changeability, investors use
various methods of analysis, forecasting and strategic decision-making, the most common
being fundamental and technical analysis.
Fundamental analysis provides an opportunity to analyse and forecast security price
dynamics caused by objective reasons, such as conditions of the macroeconomic environment,
sectors of the national economy or the intrinsic value of stock. The founders of the
fundamental analysis are David Dodd and Benjamin Graham, who were first to describe
principles of that methodology in their research called “Stock Analysis” in early 1934. But this
method is still popular among the investors who prefer it to other forecasting and analysis
methods.
Technical analysis – contrariwise, provides an opportunity to analyse and forecast security
price dynamics caused by subjective, sometimes even logically inexplicable, reasons, such as
mood and expectations of the market participants. The founder of Technical analysis was
Charles Dow, who was first to describe the method of forecasting stock price fluctuations by
using historical data and its graphical interpretation. Charles Dow described his method in the
“Wall Street” journal in the beginning of the 18th century. Even though this method turns out
to be even older, it still remains a topical issue and becomes more and more popular nowadays
(CEAE, 2012). It is used by such successful traders as Larry Williams (Williams, 2012).
The research goal of the current study was to determine which of the described above
methods turns out to be more precise and to find the way to combine them into one
forecasting and decision-making model in order to get better (more precise) results.
1. Used research methods and analytical techniques
As it was previously mentioned, the current research is focused on the forecasting, analysis
and decision-making models used in modern stock market. It means that it was necessary to
collect information about the main methods of security evaluation and analysis, ways of
constructing forecasting and decision-making models for investment projects and portfolio
structure. It was planned to try already existing classical methods in order to compare the
outputs with the results of the new offered model.
During the research the new stock quote forecasting combined stochastic model was
created and tested on the example of selected stocks in order to determine the synergetic
effect, caused by the merge of different instruments into one that is being an essence of the
developed model. It has been chosen as the most effective and efficient variation of the
offered model, in order to achieve better and more precise results in stock analysis, its future
price forecasting, linked with the investment process decision-making and optimization of the
investment portfolio. Taking into account the specifics of the conducted research, the following
methods were acknowledged being the most relevant for sustainable and transparent result

182
acquisition: monographic method, primary data analysis, secondary data analysis, graphical
analysis; mathematical analysis, econometric modelling, regression analysis and the case
study method.
2. Summary of the existing theoretical basis and review of the conducted research
The main focus area of the current research is that combination method of both forecasting
and analytical methodologies outperforms their parallel usage. The purpose of the treatise is
the experimental research of relevant forecasting techniques related to both fundamental and
technical analysis in order to work out the more optimal analysis and forecasting algorithm and
to create a stock quote forecasting combined stochastic model, achieving a positive synergetic
effect by simultaneous usage of the both approaches, quite different in their nature.
The creation of such a methodology will lead to the minimization of the risk that turns out to
be more and more significant nowadays (Cumov, 2005) of the forecasting error, easement of
the decision-making process, minimization of the role of subjectivity in a decision-making
process, more versatile analysis, more precise forecast, more effective investment portfolio
structure and maximization of income. A lot of various researches of the stock market
mechanisms and its forecasting instruments have been held, but since already 1934 experts
argue about which of the two forecasting and analysis methodologies is better: fundamental or
technical analysis.
Fundamental analysis is used to examine and evaluate the situation on the stock market
through the prism of political decisions, economic processes, financial and credit policy, to
analyse such events and processes as capital flows, production and trade dynamics, level of
inflation. Fundamental analysis school was funded by the Americans David Dodd and Benjamin
Graham in the scientific research "Securities Analysis", which was published in the 1934.
The second method is technical analysis, which is based on graphical techniques and its
mathematical interpretation methods. The first person who discovered the method of
forecasting of stock price future volatility based on historical price dynamics and fluctuations
was Charles Dow – describing this idea in the “Wall Street” magazine already in the 1790s.
Many researches, dedicated to the possibilities of parallel use of fundamental and technical
analysis instruments in a single decision-making model, were conducted and are being
considered quite efficient and applicably effective, for example, Tony Coopers’ research
“Optimal Rotational Strategies, using Combined Technical and Fundamental Analysis” (Cooper,
2011). Despite all known and discovered methods of forecasting and decision-making in the
stock market, economists, investors, traders and other experts continue searching some new,
more advanced techniques and methodologies.
The research “Investment planning in the context of volatile business cycles” provides
solutions for making the stock quote dynamics analysis, forecasting and linked with it decision-
making process much easier and precise and offers the ways of optimization of the process of
calculation of investment portfolio structure as well. The described research provides an

183
absolutely new way of forecasting and decision-making, by creating a generalizing complex-
weighted forecasting model that aids the application of a unified forecasting and decision
making system.
The efficiency of the model was applicably verified with the use of experimental modelling
approach and the results of the new model were compared with previous ones, using classical
models, in order to check the hypothesis. The research subject is classical analysis and widely
used decision-making models. During the research, new stock quote forecasting model was
created and tested on the example of selected stocks “Johnson & Johnson” USA (JNJ),
“Grindex” Latvian (GRD) and “Hoffmann La Roche” Swiss (ROC) enterprise stock price and
other financial ratio fluctuation statistics in a period of 10 years) in order to determine the
synergetic effect, caused by the merge of different instruments into one, that is being an
essence of the developed model.
Consequentially, the most effective and efficient variation of the offered model das been
chosen in order to achieve better and more precise results in stock analysis, its future price
forecasting, linked with the investment process decision-making and optimization of the
investment portfolio.
3. Analytical summary of the conducted research’s results
After studying the theoretical aspects of creation of forecasting, decision-making and
investment portfolios structures determining models, described in the theoretical part
instruments and methodologies were implemented in practice. The two following types of
analysis (fundamental and technical) had been used to analyse the available data, while
providing alternative price forecasts.
During the performance of the fundamental analysis the following steps had been made
(Forex Educational Portal, 2012): investment spheres’ and environments’ evaluation (PwC,
2013), (PwC: Russia, 2013); analysis of enterprise activity and ratios (BeInTrend, 2012), (EF,
2012); correlation analysis of macroeconomic factors and stock quote dynamics (WB, 2012),
(Latvian Central Statistical Bureau, 2012); regression analysis of macroeconomic factors and
stock quote dynamics (Freinats, 2008); single factor forecasting models’ implementation.
During conduction of the technical analysis the following steps had been made (Investment
Portal: Technical Analysis, 2013): implementation of the instruments of technical analysis:
analysis of the classical graphical shapes; analysis of the moving average dynamics and
performance of complex trading rules based on moving averages over longer horizons than
those usually considered (Isakov, Marti, 2011); analysis of the Bollinger Bounds (Naiman,
2009); analysis of the CCI oscillator (Kann, 2005), (Investment Portal „Bull&Bear”, 2012) was
used in order to analyse less volatile markets, because it is known that technical trading rules
are most (least) profitable during the period with the highest (lowest) volatility levels (Kazyra,
Lento, 2011); fractal analysis: Hurst coefficient and its interpretation (CTWM, 2012).

184
After the analysis of the selected stocks and their respected dynamics the structure of the
investment portfolio was determined, using various quantitatively – econometrical methods,
such as the implementation of the Harry Markowitz model (Markowitz, 1952), which the
acquired results being as follows: it has been offered to buy (so called “Bull” strategy) USA
enterprise “Johnson & Johnson” stocks that weight in the portfolio would be 63%; it has been
offered to buy (so called “Bull” strategy) Swiss enterprise „Hoffmann La Roche” stocks that
weight in the portfolio would be 29%; it has been offered to sell (so called “Bear” strategy)
Latvian enterprise „Grindex” stocks weight in the portfolio would be 8%.
All the forecasts were made for a yearlong period (12.2011 – 12.2012) and each of
instruments provided its own forecast.
The real (actual) prices in the twelfth month of 2012 were retrieved, analysed and found to
be accurately reflected in the following manner: “Johnson & Johnson” (JNJ) stock price was
USD 70.10 (Yahoo, 2012), (NASDAQ, 2012), (Johnson&Jonhson, 2013); „Grindex” (GRD) stock
price was USD 6.55; (Grindeks, 2013), (NASDAQ.OMX Baltics, 2012); „Hoffmann La Roche”
(ROC) stock price was USD 186.90. (Swiss Stock Exchange, 2012), (Hoffmann-La-Roche,
2013). The cumulative results of the analysed company price forecasting, using various
analytical approaches, are summarised in Table 1.
Table 1
Stock Future Value Forecasts
Stocks Forecast [USD]
JNJ GRD ROC
Fundamental analysis instruments
Trend determination by using correlative macroeconomic ratio
methodology 74.45 6.59 169.30
Single factor regression forecasting model 67.11 6.55 173.79
Technical analysis instruments
Analysis of the classical graphical shapes 74.88 7.30 179.19
Analysis of the moving average dynamics 72.56 6.31 179.19
Analysis of the Bollinger Bounds 72.56 6.31 168.78
Fractal analysis: Hurst coefficient 75.15 7.90 194.64
Source: author’s construction based on official statistical data (Johnson$Jonhson, 2013), (Grindeks,
2013), (Hoffmann-La-Roche, 2013), (NASDAQ.OMX Baltics, 2012), (Swiss Stock Exchange, 2012)
The next step after finishing the analytical part was the creation of the generalizing table,
which contributed to the evaluation of the preciseness of the forecasts by comparing dispersion
– forecasted price deviation from the actual one.
4. The layout and the result of the conducted empirical modelling experiment
The main research goal of the current research was the creation of unified forecasting and
decision-making combined stochastic model in order to achieve the positive synergetic effect,

185
which would provide an opportunity of making more precise forecasts, calculating more
optimal investment portfolio structure and facilitating the decision-making process by
minimizing the influence of the subjective judgments thereby levelling the risk.
The draft of the models’ graphical interpretation can be seen in Figure 1, where P stands for
“Price” and R is “Forecasting instrument rang”. The left part of the model combines different
forecasting instruments of the fundamental analysis but the right side - different forecasting
instruments of the technical analysis.
Fig. 1. The Empirically – functional framework of the developed model
The model in general enables the calculation of single forecasted value, which is being more
precise than the result of the classical model because of the positive synergetic effect caused
by the specific calculated combination of different methodologies. All the formulas are
simultaneously reflected in Figure1.
In order to create the mentioned above model, it was crucial to fulfil all of the below listed
steps: ranging of the used forecasting instruments within each of the analysis groups;
calculation of scales; creation of the forecasting model and its different variations; model
implementation - forecasting; defining the models’ optimal variant; calculation of the
investment portfolios’ structure; comparison and interpretation of the results; defining the
applicably – effective and generated result – efficient methodology; developing a conclusive
summary.
As it was mentioned previously, the first step was to rank all used forecasting and analysis
instruments from 1 to n (n being number of instruments and maximal rank). The most precise
instrument was ranked with the highest rank n, and the less precise with the lowest rank 1.
The results are as following.
Within the group of fundamental analysis instruments rank 1 was assigned to correlation
analysis of macroeconomic factors and stock quote dynamics (average forecasting error 5%)
and rang 2 - regression analysis of macroeconomic factors and stock quote dynamics (average
forecasting error 4%).
Within the group of technical analysis instruments maximal rang 4 was assigned to analysis
of the moving average dynamics (average forecasting error 6%); rang 3 - analysis of the

186
classical graphical shapes (average forecasting error 7%); rang 2 - analysis of the Bollinger
Bounds (average forecasting error 11% with minimal deviation) and minimal rang 1 - fractal
analysis: Hurst coefficient and its interpretation (average forecasting error 11% with high
deviation).
It means that both analysis and forecasting techniques will be equally represented in a
model but fundamental analysis may be represented, using two instruments (correlation
analysis of macroeconomic factors and stock quote dynamics with weights 33% and regression
analysis of macroeconomic factors and stock quote dynamics with weights 67%) and technical
– with four instruments (analysis of the moving average dynamics with weights 40%, analysis
of the classical graphical shapes 30%, analysis of the Bollinger Bounds 20% and fractal
analysis: Hurst coefficient and its interpretation 10%).
However, in order to minimize an average forecasting error among the instruments used in
the model it was qualitatively proved that exist more effective complex-weighted forecasting
models’ variation incorporated the above mentioned instruments within a single sliding –
weight framework or a broader econometrical calculation system of simultaneous indicator
analysis and generalizing current experimental modelling results may be summarised in the
following manner:
• complex-weighted forecasting model consists of two equal parts. Each element’s weight is
50%, i.e. final forecast will be calculated by using the average method;
• the first part of the model represents fundamental analysis as a technique which allows
predicting the future prices by analysing quotation fluctuations caused by objective factors
(for example changes in economic or political environment) and the second part of the
model represents technical analysis as a technique which allows predicting the future prices
by analysing quotation fluctuations caused by subjective factors (for example traders’
expectations, mood, etc.);
• the first part includes two fundamental analysis forecasting instruments: correlation analysis
of macroeconomic factors and stock quote dynamics with weights 33% and regression
analysis of macroeconomic factors and stock quote dynamics with weights 67% and the
second part includes two technical analysis forecasting instruments: analysis of the moving
average dynamics with weights 55% and analysis of the classical graphical shapes 45%;
• nevertheless both fundamental and technical analysis are considered as equal, technical
analysis results turned out to be less precise, that is why the difference of weights is more
“smoothed".
After getting the forecasted values for each stock, the structure of the investment portfolio
was determined by using special calculating table.
Mentioned investment portfolio structures’ determination instrument can be considered
more precise than classical ones, because it is based on the results of all previous analysis and
forecasting activities. Consequentially, it is worth mentioning that: “Johnson & Johnson” USA
enterprise forecasted future price is USD 71.46; “Hoffmann La Roche” Swiss enterprise

187
forecasted future price is USD 172.59; “Grindex” Latvian enterprise forecasted future price is
USD 6.71.
While comparing the acquired results, it can be verified that the newly developed
methodology had created a more efficient analytical system, which provided a more favourable
outcome of USD 96 570.33 total profit against the USD 10 445.99, generated by the classically
used singularized, mutually non – compliant methods, thus creating a scientifically rationalized
model of simultaneous precise forecasting and risk evasion investment portfolio structuring.
Conclusions and proposals
Summarizing the structural layout of the conducted research, the acquired results and their
applicable feasibility, the following conclusions can be made:
1. The research hypothesis had been positively verified via conduction of the described
research. The results of the carried out experimental modelling turned out to be positive,
thus confirming the research hypothesis and in addition demonstrating the logics of regional
diversification presumption, even despite the fact that the basic objective of the outlined
research was not the creation of an ideal investment portfolio;
2. The conducted analysis confirmed the adequacy of the forecasted growth of the selected
stock quotes (period: end of 2011 – end of 2012).
3. The conducted research had determinedly confirmed the general noting that the Markowitz
model is much more suitable for the existing situation than for example mentioned Sharp’s
or Tobin’s models, due to the fact that Markowitz model can be used for composing
structuring of an investment portfolio consisting of regionally different enterprise stocks (JNJ
– USA, GRD – Latvia and ROC - Swiss).
4. It had been proven that parallel use of various analytical methods in practice turns out to be
less efficient and precise than it’s combining technique.
5. The developed methodology in a functioning analytical algorithm that enables a more
precise forecasting instrument implementation, consequentially enhancing applicability of
the relevant decision-making process.
6. The use of both the complex-weighted forecasting model and the investment portfolio
calculation instrument, based on the developed model’s empirical derivative enables the
possibility of making a more lucrative decision.
7. The newly created model and its deriving working algorithm were implemented in a practical
experiment and proven the newly created methodology’s efficiency, thus raising the
maximum earning potential of the initially available financial basis, while simultaneously
meeting the crucial requirements of risk minimization and profit maximization.
Summarizing the conducted research, the acquired qualitative and quantitative analytical
results, the following proposals can be made:

188
1. It is offered to use the new complex-weighted stochastic forecasting model as well as
investment portfolio structures’ calculation table and offered working step-by-step
algorithm.
2. It is offered to use in a model following components: fundamental and technical analysis
techniques.
3. Fundamental analysis techniques, enabling the prediction the future prices by analysing
quotation fluctuations caused by objective factors will be presented in the developed model
with 33% and 67% weights.
4. Technical analysis enabling the prediction the future prices by analysing quotation
fluctuations caused by objective factors will be presented in the developed model with 45%
and 55% weights.
5. After the implementation of the developed investment portfolio structure determining
instrument, it had proven optimal to propose the following financial resource allocation
structure: 47% “Johnson & Johnson” USA enterprise stocks, 5% “Grindex” Latvian
enterprise stocks and 48% “Hoffmann La Roche” Swiss enterprise stocks.
Bibliography
1. Be In Trend. (2012). Bankruptcy Forecasting Altmans’ Model. Retrieved:
http://www.beintrend.ru/z-score-altman. Access: 05.09.2014.
2. Capital Times Wealth Management (CTWM). (2012) Trend Determination by Using Hurst.
Retrieved: http://www.capital-
times.com.ua/index.php?option=com_content&task=view&id=11623&Itemid=88888963.
Access: 19.10.2014.
3. Center of Economic Analysis and Expertise (CEAE). (2012) Technical Analysis – History of
Development. Retrieved: http://www.assessor.ru/forum/index.php?t=525 Access:
17.11.2014.
4. Cooper, T. (2011) Optimal Rotational Strategies using Combined Technical and
Fundamental Analysis. Retrieved: http://samuelssonsrapport.se/optimal-rotational-
strategies-using-combined-technical-and-fundamental-analysis-tony-cooper/. Access:
11.12.2014.
5. Cumov, D. (2005). Asset Allocation Based on Shortfall Risk. Chemnitz: Technischen
Universitat Chemnitz. p. 340.
6. Freinats L., Voronova I. (2008) Methodical Base of the Short-time Investment in the
Stock Market. 5th International Scientific Conference Business and Management, 194-
199. Retrieved:http://leidykla.vgtu.lt/conferences/BUS_AND_MANA_2008/fin-
engeneering/194-200-G-Art-Freinats_Voronova.pdf. Access: 11.12.2014.
7. Grindeks. (2013). Enterprise publicly available information and data. Retrieved:
http://www.grindeks.lv/lv. Access: 11.12.2014.
8. Hoffmann – La Roche (2013). Enterprise publically available information and data.
Retrieved: http://www.roche.com/index.htm#/browse/all. Access: 15.12.2013.
9. Isakov, D., Marti, D. (2011) Technical Analysis with a Long Term Perspective: Trading
Strategies and Market Timing Ability. Retrieved:
http://www.nbs.rs/export/sites/default/internet/latinica/90/90_9/IsakovDusan_wp.pdf.
Access: 17.07.2013.

189
10. Johnson & Johnson (2013). Enterprise publically available information and data.
Retrieved: http://www.jnj.com/connect/. Access: 15.12.2013.
11. Kann, M.N. (2005). Technical Analysis. St. Petersbourg: Piter. p. 275.
12. Kozyra, J., Lento, C. (2011) Using VIX Data to Enhance Technical Trading Signals. Social
Science Research Network. Retrieved:
http://papers.ssrn.com/sol3/papers.cfm?abstract_id=1930018. Access: 09.11.2014.
13. Latvian Central Statistical Bureau. (2012). Name type of data used www.csb.gov.lv <-
extend hyperlink to something
14. Markowitz, H. (1952) Portfolio Selection. The Journal of Finance, Volume 7, Issue 1. pp.
91, 7 –77. Retrieved:
https://www.math.ust.hk/~maykwok/courses/ma362/07F/markowitz_JF.pdf. Access:
17.09.2014.
15. Naiman, E. (2009). Trader Encyclopedia. Moscow: FIBO Group LTD. p. 455.
16. WEB Economic Faculty (EF). (2012). Finance Analysis. Retrieved:
http://books.efaculty.kiev.ua/finpd/1/r10/. Access: 01.03.2014.
17. NASDAQ. (2012) Stock exchange publically available information and data. Retrieved:
http://www.nasdaq.com/ Access: 05.07.2012.
18. NASDAQ.OMX Baltics (2012). Stock exchange publically available information and data.
Retrieved: http://www.nasdaqomxbaltic.com/market/?lang=lv. Access: 27.11.2012.
19. Nazarova, J. (2014). Portfolio Structure Planning and Its Future Price Forecasting
Model.Retrieved:http://www.bm.vgtu.lt/index.php/bm/bm_2014/paper/viewFile/293/498.
Access: 25.11.2014.
20. PwC. (2013). Report forecasts for pharmaceutical companies: Russia. Retrieved:
http://www.pwc.ru/en/. Access: 21.12.2013.
21. PwC. (2013). Report Forecasts for Pharmaceutical Companies. Retrieved:
http://www.pwc.com/us/en/press-releases/2012/pwc-report-forecasts-a-golden-era.jhtml.
Access: 25.11.2014.
22. Swiss Stock Exchange (2012). Stock exchange publically available information and data
Retrieved: http://www.six-swiss-exchange.com/index_fr.html. Access: 19.12.2012.
23. The World Bank. (2012) Database. Retrieved: http://www.worldbank.org/. Access:
17.10.2014.
24. Williams, L. (2012) The Way to Success and Big. Retrieved:
http://tvoidengy.ru/library/vilams_biography.html. Access: 14.07.2014.
25. Yahoo. (2012) Database. Retrieved:
http://finance.yahoo.com/;_ylt=AowscmWXZs.tNZTDeVxF6bUnv7gF. Access: 17.10.2014.

190
DEVELOPMENT OF SYSTEM OF STATE REVENUE SERVICE
PERFORMANCE INDICATORS
Mara Petersone 1*, Mg.oec.; Aivars Vilnis Krastins 2, Dr.oec.prof.;
Karlis Ketners 3, Dr.oec.prof.;
1-3 Riga Technical University
Abstract. In the public sector, performance-oriented reforms have become topical over the
last twenty years. The performance management documents such as Business Plan, Annual
Report, Service Delivery Standards and Surveys of Taxpayers as a good practice have been
adopted and are used in almost all of the countries considered; there are slight variations as to
which of these documents are publicly available. State Revenue Service (SRS) is no exception.
Latvian laws and regulations related to the development of performance include appropriate
well-known practices adopted in the world that ensure quality of the content of adequate
effectiveness measurement, however mentioned measurement indicators mainly used for state
budget planning purposes not for performance management. This study aims to investigate
the performance measurement system of the SRS as a tool to achieve the institution’s
strategic goals. In the paper possibility if introduction of integrated outcome-output indicator’s
matrix is proposed to ensure process management system and performance management
system integration. The research object is SRS performance measurement system. The
research is mainly based on the literature analysis, monographic descriptive method as well as
the methods of analysis and synthesis and content analysis.
Keywords: performance, public administration, performance indicators, process
management.
JEL code: H110
Introduction
In the public sector, performance-oriented reforms have become topical over the last twenty
years. The public sector has a limited opportunity to use efficient and targeted performance
evaluation elements characteristic of the private sector; therefore most developed countries
have gradually developed and implemented the system of performance indicators
characteristic only of the public sector for the evaluation of administration activities. As Raj
(2012) points out in his study the advent of the 21st century has altered the landscape of the
government structure and culture wherein the focus is on quicker delivery of the goods and
* Corresponding author. Tel.:+371 67089659; fax: +371 67089659; e-mail: [email protected]
Proceedings of the 2015 International Conference “ECONOMIC SCIENCE FOR RURAL DEVELOPMENT, No37
Jelgava, LLU ESAF, 23-24 April 2015, pp. 190-200

191
services on the one hand and also become accountable and responsible for the omissions and
commissions towards the people on the other (Raj, A. S., 2012).
Countries that have adopted a new public management approach determine its efficiency by
the compliance of state administration activities with the needs of society. National
governments, following the New Public Management (NPM) guidelines, introduced private
principles and instruments in the public field to improve the efficiency, effectiveness and
financial stability of state enterprise (Calogero, M.,2010). The way the performance
management systems are used affects organisational activities; in turn, the impact of these
activities depends on contractibility. Contractibility implies a clear understanding of the
objective, the ability to choose real performance indicators and the manager’s ability to
manage and control performance transformation processes. Authors concur to Speklea, R.F.,
Verbeetenb, F., H., M., 2014 pointed that the way in which these systems are being used
affects organizational performance, and that these performance effects depend on
contractibility.
Strengthening the performance approach to public service agencies has proved its merits, so
that in future it is of importance for public authorities to further develop the performance
measurement and other activities to improve the organisation’s performance. The economic
crisis provides some insights on the role of measurement systems. As shown by the ongoing
discussion of credit rating agencies by political actors and in the news media, measurement is
not a neutral device but an active agent in societal processes (Van Dooren, W., De Caluwe, C.,
Lonti, Z., 2012). Therefore, special attention should be devoted directly to the strategic
choices behind the selection and implementation of performance measurement practices in
public sector entities (Jaaskelainen, A., Laihonen, H., 2014).
Despite the fact that the performance management practices in public administration have
established some traditions, where countries try to take over the most appropriate expertise
from one another, public administration institutions often experience the situation when they
have to justify their performance as well as the use of financial resources to the society. It is
important for the society to know whether the use of financial resources in the public sector is
justified, as one of the factors that hinders business development and reduces the
competitiveness of enterprises is the existing administrative burden (Pilvere, I., Nipers, A.,
Upite, I., Bulderberga, Z., Popluga, D., Dobele, A., Dobele, L., 2012).
This study aims to investigate the performance measurement system of the State Revenue
Service (SRS) as a tool to achieve the institution’s strategic goals. The main task is to evaluate
the possibility of integrating the process management systems to improve the quality of
performance indicators. The research object is SRS performance measurement system. The
research is mainly based on the monographic descriptive method as well as the methods of
analysis and synthesis.

192
1. PERFORMANCE MEASUREMENT STRATEGIC GOAL
At present, in the tax and customs administrations of many countries, there is a tendency to
improve both financial planning performance and performance implementation management.
Although financial planning performance and performance implementation management are
considered to be distinct concepts, in practice many national governments have tried to
introduce a results-based approach in both management and financial planning contexts, in
which organisations are given some flexibility in the way, in which performance improvements
are achieved. Performance measurement in the public administration has two main functions:
to measure financial planning performance and to evaluate performance in order to modernise
management techniques in an organisation. However, there are countries, where the
organisations representing the public sector have to comply not only with uniform laws and
regulations that govern the scope of performance but also should establish their performance
management system in such a way to be able to perform the whole system target mandated.
Table 1
Revenue bodies’ mandated business performance targets
Country Business performance targets mandated for 2012 (and beyond)
Budge
ted
reven
ue
Tax debt
reduction
Tax gap
reduction
Improve
ment in
taxpayer
satisfacti
on
Complian
ce with
burden
reduction
Operating
costs/staf
f
reduction
Austria √ X X X X X
Denmark √ √ √ √ √ √
Estonia √ X X X X X
Greece √ √ √ √ √ √
Hungary √ X X √ X √
Ireland √ √ X X √ √
The
Netherlands
√ √ X X √ √
Portugal √ X X √ X √
Slovak
Republic
√ X X X X X
Spain √ √ √ √ √ √
Latvia √ X X √ X X
Romania √ √ X √ √ √
Source: OECD, 2013
The authors have considered revenue bodies’ mandated business performance targets of the
EU Member States, such as Austria, Denmark, Estonia, Greece, Hungary, Ireland, the
Netherlands, Portugal, the Slovak Republic, Spain, Romania and Latvia, which are the OECD
(Organisation for Economic Co-operation and Development) countries or candidate countries of
the OECD, and which have integrated their tax and customs administrations into one
organisation (Table 1). The degree of integration of tax and customs administrations can vary
considerably in various countries, for example, in Latvia tax and customs basic processes are
separated from each other, while in Estonia tax and customs basic processes are fully
integrated. Moreover, according to the model topology of customs authorities, by combining

193
the tax and customs administrations there are differences in the degree of their autonomy, for
example, a Revenue Department – the structural unit that performs tax and customs functions
at the national level as a single entity in the relevant ministry, usually the Ministry of Finance,
and a Revenue Service – a partially independent organisation, where tax and customs
administrations are integrated at the national level, the structure of which could be similar to a
Revenue Department; however, it is partially independent of the ministry to which it is
subordinated.
In Latvia, it is often emphasised that the merging of tax and customs administrations
happened based on Denmark’s experience; however, analysing the performance of the State
Revenue Service it can be concluded that the main incentive for the creation of SRS has been
the improvement of efficiency – budgeted revenue, improvement in taxpayer satisfaction and
compliance with the law in contrast to Denmark, where a productivity incentive was set as a
priority (Pētersone, M., Ketners, K., 2013).
2. SRS PERFORMANCE INDICATORS
In view of the new performance management trends in tax and customs administrations, other
countries’ best practices are gradually being taken over. The performance management
documents such as Business Plan, Annual Report, Service Delivery Standards and Surveys of
Taxpayers as a good practice have been adopted and are used in almost all of the countries
considered; there are slight variations as to which of these documents are publicly available.
Latvian laws and regulations related to the development of performance (Cabinet of Ministers,
2009a) include appropriate well-known practices adopted in the world that ensure quality of
the content of adequate effectiveness measurement. Since Latvia is one of those countries,
where the public administration has to comply with uniform laws and regulations governing the
scope of performance, the mutual policy cycle of outcomes and their performance indicators is
regulated, which also envisages the classification of performance indicators (Cabinet of
Ministers, 2009b):
1. input indicators (indicators of resources) - reflect the amount of investment and resources
required to achieve the objective or outcome;
indicators of resources – characterise the planned amount of financial resources of
direct administration institution, the administrative capacity, infrastructure required
to perform the functions of direct administration institution and ensure its operation;
direct performance indicators – reflect the institution’s internal activities that are
oriented to internal customers;
2. benefit indicators:

194
policy outcome indicators – priority monitoring indicators – changes in the society
(in the relevant policy) that are affected by a number of performance outcomes
achieved and partly by external factors;
performance indicators – task / event monitoring indicators – the end product – the
achievement level is fully dependent on the policy implementer;
3. macro-impact performance indicators – basic indicators for development assessment –
changes in the society that is affected by a number of policy outcomes and external
environmental factors;
4. analytical indicators reflect the relationship between inputs and outputs or the compliance
of intended benefits with the outcome or objective achieved:
economic performance indicators (efficiency) – the degree at which a system or its
component reaches the desired outcome (performs its functions) compared to
consumption of resources;
economic indicators characterise performers’ economy and the ability to
efficiently use the available resources. Economic indicators are only applicable to
the investment;
productivity indicators characterise the intensity of operation and the ability to
use time efficiently;
functional performance indicators (effectiveness) – describe the extent to which the
resources invested and the performance outcomes obtained have ensured the
achievement of intended policy outcomes;
quality indicators – characterise the compliance of services and products provided to
the society and public administration institutions with quality requirements and
standards set as well as reflect the satisfaction level of needs and desires of the society
and public administration institutions (The Guidelines on Outcomes and Performance
System for the Period of 2008–2013).
Traditionally, system performance management process takes place at three levels – strategic,
tactical, and operational. For example, in the Russian Customs Service the performance
system is divided into three levels – federal, regional and local customs authorities (Gubin, A.,
2011) each outcome level has its own strategic goals, objectives and performance indicators.
The SRS has a single-tier organisational structure, where each performance indicator level
performs only the functions assigned to its level. At present, the performance indicators of SRS
operation strategic management levels operate as a separate assessment tool without direct
interaction with the performance indicators of other SRS structural unit levels; namely, there is
no clear subordination, traceability and interaction of strategic level performance indicators,
tactical level performance indicators (structural unit (process) framework) and operational

195
level performance indicators (particular sphere of operation, persons (employees, service
users) and groups of persons involved) with the achievement of the SRS strategic goals and
objectives.
The system of strategic management level performance indicators or political outcomes
(according to the Cabinet of Ministers, 2009a) have been identified relatively recently (for the
first time available in the State Revenue Service Operations Strategy for the period of 2014–
2016). Therefore, it is difficult to assess whether the defined performance indicators fully
reflect the achievement of the SRS goals.
The tactical management level or performance outcomes (according to the Cabinet of
Ministers, 2009a) are characterised by the fact that there is a strict subordination of
operational results and performance indicators to strategic goals and objectives but there is
neither strict traceability with strategic level performance indicators nor subordination to the
performance indicators of operational management level.
At the operational management level for the purpose of performance outcome aggregation, the
SRS has recently developed the SRS performance aggregation matrix, which compiles
information on the SRS structural unit performance outcomes, which cannot be regarded as
performance indicators for measuring the implementation of the strategy. The SRS
performance aggregation matrix serves as a tool that exists in parallel to the calculation of
performance indicators and summarises the SRS structural unit operations results but there is
no clear link with other level performance indicators (Figure 1).
Operational level
Fiscal performance
indicators
Decision-making
indicators
Control process
indicators
Customs and tax
customer service
indicators
Fig. 1. The SRS performance aggregation matrix
In the SRS performance matrix, the operations objective, process and the responsible
structural unit are specified for each indicator. However, to accurately characterise the SRS
performance outcomes, the aggregation matrix should include a performance indicator
determined for each process operation.
3. INTEGRATED OUTCOME AGGREGATION MATRIX
Evaluating internal laws and regulations of the SRS performance management process, it
should be concluded that, although there is formally a sequential relationship among the SRS
operations strategy (the medium-term planning document), the SRS action plan (the short-
term planning document) and the SRS structural unit action plans, specific tasks for structural
units are not identified but exactly the execution of the tasks would affect the achievement of
all the strategy objectives in the short and medium terms. Within the framework of the SRS
structural units, there is no operation planning that focuses on the activities identified in the

196
SRS annual operation plan to achieve strategic goals. The authors believe that within the
framework of performance planning, it would also be useful to draw up a plan for each
employee, setting up individual tasks, the fulfilment of which would affect the achievement of
strategy’s goals. Setting of such annual tasks for employees would be related to annual
performance evaluation (Petersone, M., 2013a).
To make all performance planning documents interrelated, it is necessary to know the origin of
each performance indicator at all three levels; however, at present the procedure for the
calculation of a particular performance indicator is not developed and described in the SRS
operations strategy as well as the data sources are not listed. In the SRS basic structural units,
a variety of tools are used for the calculation of performance indicators. For example, the SRS
responsible Tax Administration Unit obtains data from the SRS data warehouse system, tax
information system (TIS) and other databases. Performance indicators are obtained through
standard data filtering; however, there are certain indicators that require manual accounting
and calculation. The responsible employee of the Planning and Coordination Department of
Customs Modernisation Unit of Customs Administration summarises the data sent by the SRS
structural units and performs repetitive manual data entry using MS Excel tables with built-in
formulas for the calculation of indicators. Performance indicators are not analysed in detail with
the aim to understand their sphere of influence and make adjustments to the operation of
structural units.
The SRS has ensured the quality of content of performance measurement, by linking it to the
process management system creating the SRS outcome matrix (On the State Revenue
Service’s Performance Outcome), where each indicator is linked to one process and process
activities. In the SRS performance aggregation matrix, 1,028 performance indicators are
identified. The SRS performance aggregation matrix is based on a process management
system (Petersone, M., 2013b), where the process and the responsible department are
specified for each performance indicator, so the matrix serves only as an overview of obtained
indicator group performance.
In an attempt to improve the financial planning performance and performance management
process, the authors propose complementing the existing SRS performance matrix with
analytical performance indicators as well as positioning a more appropriate level of
management to each performance outcome (Figure 2).

197
In the SRS performance aggregation matrix the performance indicators of tactical and
operational management levels are integrate, provided matrix is stipulating the compliance of
indicators with each management level and their potential impact on the strategic level. The
traceability and interrelation of performance outcomes at all levels would help manage the SRS
performance process. Thus by interconnecting performance indicators at all levels, it is
possible to establish the subordination of certain indicators and to relate them to the
achievement of strategic goals. At present, the group of analytical indicators of performance
measurement system by its functions is rather focused on disclosing organisation’s
performance to the society. The authors believe that introducing analytical indicators to the
performance aggregation matrix, the latter could be used more successfully for the purpose of
performance management.
The integrated outcome aggregation matrix based on the process management system
through the same operating principle affects other organisations in human resource
management areas (Petersone, M., Ketners, K., Krastins, A., 2013), such as talent
management (Petersone, M., Ketners, K., Krastins, A., 2014) or risk management (Petersone,
M., 2014), which implies a considerable opportunity to influence the achievement of strategic
goals and objectives. The regulatory documents of strategic management and the hierarchy of
performance indicators, respectively, are of importance.
Conclusions and recommendations
1. Performance management system implementation in the public administration institutions
has proved its merits in the world. Improving the performance management system in the
public administration, it is expected to enhance the employees’ understanding of their role
in the achievement of institution’s strategic goals; thus, it will be possible to continuously
monitor and control the strategic development.
2. In the tax and customs administrations of many countries, there is a tendency to improve
both financial planning performance and performance implementation management.
Fig. 2. The SRS integrated outcome aggregation matrix
SRS performance aggregation matrix
Tactical level
Operational level
Pro
cesses
Pro
cesses
Pro
cesses
Pro
cesses
Strategic level
Analytical indicators

198
3. The performance indicators of SRS operation strategic management levels operate as a
separate assessment tool without direct interaction with the performance indicators of
other SRS structural unit levels; namely, there is no clear subordination, traceability and
interaction of strategic level performance indicators, tactical level performance indicators
and operational level performance indicators with the achievement of the SRS strategic
goals and objectives.
4. Performance measurement is one of the decisive stages of the performance management
process. Improving the performance measurement system, it is necessary:
- to clearly define a hierarchy of performance system indicators and the
principles of interaction and subordination of performance indicators at all
levels;
- to describe the process of developing performance indicators;
- to assign employees responsible for the process implementation;
- to identify the selection principles of performance indicator types, the
selection principles of performance indicator values;
- to determine the evaluation criteria of efficiency and adequacy of
performance indicators;
- to define updating and valuation principles of performance indicators as
well as identification and accumulation principles of the necessary data
for measuring performance indicators;
- to determine the regularity for measuring performance indicators and the
application principles of performance indicators in the process of decision-
making.
5. The issue of modernisation of the performance management process is becoming ever
more urgent for the SRS; therefore, by integrating in the SRS performance aggregation
matrix the performance indicators of tactical and operational management levels, at the
same time stipulating the compliance of indicators with each management level and their
potential impact on the strategic level, the content quality of performance measurement
system would be improved.
6. Improving the performance management process, it is expected that one of the
improvement indicators will be the elaboration of internal laws and regulations, which will
describe the performance management process, including strategy development and
updating cycle as well as the subordination of performance indicators in all performance
management documents.
Bibliography
1. Cabinet of Ministers (2009). Methodology for the development and evaluation of the
outcomes and performance indicators of ministries and other central public authorities.
Retrieved:http://likumi.lv/doc.php?id=200935. Access: 30.12.2014.

199
2. Cabinet of Ministers (2009). The operation procedure of the system of outcomes and
performance indicators. Retrieved:http://likumi.lv//doc.php?id=197035. Access:
30.12.2014.
3. Calogero, M. (2010). The Introduction of New Public Management Principles in the
Italian Public Sector. In: Transylvanian Review of Administrative Sciences. Issue 30E,
pp. 30-54.
4. Gubin, A. (2011). Developing Performance Measurement for the Russian Customs
Service. In: World Customs Journal, September 2011, Vol. 5, Issue 2, ISSN: 1834-6707
(Print), 1834-6715 (Online).
5. Jaaskelainen, A., Laihonen, H. (2014). A Strategy Framework for Performance
Measurement in the Public Sector. In: Public Money & Management, Vol. 34, Issue 5,
pp.355-362, DOI: 10.1080/09540962.2014.945807.
6. On the State Revenue Service’s Performance Outcome, March 14, 2014. SRS Order No.
480.
7. Petersone, M. (2013). Features of Process Management in Customs. In: Creating a
Future: communication, education, business: XIV international scientific conference,
Latvia, Riga, 30 May 2013. Riga: Ltd "University Turiba", 2013, pp.209-220. ISSN
1691-6069.
8. Petersone, M. (20130. Human Resource Management Development at Latvian Tax and
Customs Administration. In: Proceedings of the International Scientific Conference on
International Masaryk Conference for Ph.D. Students and Young Researchers (MMK
2013), Czech Republic, Hradec Kralove, 9-13 December 2013. Hradec Kralove:
MAGNANIMITAS, 2013, pp.1112-1121. ISBN 978-80-87952-00-9.
9. Petersone, M. (2014). Practical Measures for Integrity Promotion at Latvian Customs.
In: QUAERE 2014: International Interdisciplinary Scientific Conference for PhD Students
and Lecturers, Czech Republic, Hradec Kralove, 26-30 May 2014. Hradec Kralove:
Magnanimitas, 2014, pp.530-539. ISBN 978-80-87952-04-7.
10. Petersone, M., Ketners, K. (2013). Institutional Division of Customs Administrations. In:
Production and Cooperation in Agriculture. Finance and Taxes: Proceedings of
International Scientific Conference “Economic Science for Rural Development”, Latvia,
Jelgava, 25-26 April, 2013. Jelgava: Latvia University of Agriculture, 2013, pp.207-213.
ISBN 9789934830464. ISSN 1691-3078.
11. Petersone, M., Ketners, K., Krastins, A. (2014). Talent Management in Public
Administration Institutions: the Case of Latvian Customs. In: The 8th International
Scientific Conference "Business and Management 2014": Selected Papers, Lithuania,
Vilnius, 15-16 May 2014. Vilnius: Vilnius Gediminas Technical University, 2014, pp.145-
153. ISBN 978-609-457-650-8. e-ISBN 978-609-457-649-2. ISSN 2029-4441. e-ISSN
2029-920X. Available from: doi:10.3846/bm.2014.019.
12. Petersone, M., Ketners, K., Krastins, A.(2013). On Some Aspects of Process
Management and Human Resource Management Interaction at the Customs Authorities.
In: Recent Advances in Education & Modern Educational Technologies: Educational
Technologies Series 9: International Conference on Education and Modern Educational
Technologies (EMET'13), Italy, Venice, 28-30 September, 2013. Venice: 2013, pp.82-
90. ISBN 978-1-61804-210-1. ISSN 2227-4618.
13. Pilvere, I., Nipers, A., Upite, I., Bulderberga, Z., Popluga, D., Dobele, A., Dobele, L.,
(2012). Evaluation of Administrative Burden in Municipalities of Latvia. Economic
Science for Rural Development: Integrated and Sustainable Development. Book Series:
Economic Science for Rural Development. Issue 27, pp. 179-183. Conference: 13th
International Scientific Conference on Economic Science for Rural Development.
14. Raj, A. S. (2012). A New Performance Management Framework for Public
Administration in the 21st Century. In: Proceedings of 2012 International Conference
on Public Administration (8th), Vol. 1, pp. 170-175.

200
15. Speklea, R.F., Verbeetenb, F., H., M. (2014). The use of performance measurement
systems in the public sector: Effects on performance. Management Accounting
Research, Vol.25, Issue 2, June 2014, pp. 131- 146.
16. The Guidelines on Outcomes and Performance System for the Period of 2008–2013,
approved by the Cabinet of Ministers Order No. 344 of June 18, 2008.
17. Van Dooren, W., De Caluwe, C., Lonti, Z. (2012). How to Measure Public Administration
Performance: A Conceptual Model with Applications for Budgeting, Human Resources
Management, and Open Government. In: Public Performance & Management Review.
Vol. 35, Issue 3, pp. 489-508. DOI: 10.2753/PMR1530-9576350306.

201
ASSESSMENT OF CORPORATE INCOME TAX IN THE BALTIC STATES
Irija Vitola1, Dr.oec.; Atrjoms Antonovs2, Ms.oec.
1,2 Faculty of Economics and Social Development, Latvia University of Agriculture
Abstract. A favourable and stable tax policy, predictability of taxes and well-structured taxes
are the key drivers for the development of new enterprises and the attraction of investment as
well as a significant driver for the sustainability of existing enterprises and economic growth in
the country. The aim of the research paper is to identify how some elements of the corporate
income tax of Lithuania and Estonia might be applied in Latvia. Both in Latvia and in Lithuania,
taxable income is adjusted for the depreciation of fixed assets. In Latvia and in Lithuania, the
taxable income is also adjusted for fines and penalties paid in the reporting year. Lithuania’s
enterprises are entitled to more favourable tax adjustments for costs unrelated to economic
activity, as theses costs do not have to be added to their pre-tax profit. In Latvia,
undistributed profit has to be taxed as in Estonia, setting a 0% enterprise income tax rate on
undistributed profit.
Key words: corporate income tax, tax calculations, tax adjustments
JEL code: H2
Introduction
Stabile, predictable and well-structured tax policies not only in Latvia but also in a greater
region, like in the Baltics, are one of the factors for sustainable economic growth in the
country. Every country’s sustainable development depends on planning the country’s
development, the government’s revenues and expenditures, developing priority industries as
well as efficient government budget management. Every country can plan its development only
based on its government budget revenues, most of which are composed of taxes collected in
the country.
Presently Latvia, Lithuania and Estonia have stabilised their government budget revenues
from taxes. In each country, the corporate income tax (CIT) rate is different; yet, given that
any state’s key purpose is to ensure preconditions for its economy’s sustainable development,
the elements and rates of the corporate income tax and its payments to their Treasury are
very important.
Corresponding author. Tel.: + (630 24214); fax: + 371 630 84987.
E-mail address: [email protected].
Proceedings of the 2015 International Conference “ECONOMIC SCIENCE FOR RURAL DEVELOPMENT”, No37
Jelgava, LLU ESAF, 23-24 April 2015, pp. 201-210

202
Hypothesis: the elements of Lithuania’s and Estonia’s corporate income tax systems may
be applied in Latvia as well.
Research aim: to identify how some elements of the corporate income tax of Lithuania and
Estonia might be applied in Latvia.
To achieve the aim, the following tasks are set:
1) to examine the theoretical aspects of corporate income tax;
2) to perform a comparative analysis of corporate income taxes in the Baltic States;
3) to perform a comparative analysis of corporate income tax calculations in the Baltic
States.
The following research methods were employed in the paper: abstract and logical analysis;
the monographic and descriptive methods; the graphic method; and statistical analysis
methods.
Materials used
The theoretical part was based on findings and perspectives of various authors, information
available in statistical databases as well as documents produced by the Cabinet of Ministers on
the tax system.
Research results and discussion
Theoretical aspects of corporate income tax
When doing accounting, any enterprise, in line with its field of economic activity, has to
calculate its estimated tax payments. Any enterprise has to make all tax payments in
accordance with the laws and rules being in effect in the country, for instance, excise,
customs, value added tax payments.
Corporate income tax is one of the taxes that, in accordance with a country’s legislation,
has to be calculated and paid into the government budget.
The government policy document Guidelines for the Development of the System of Taxes
and Duties stipulates that the problems to be tackled with regard to the enterprise income tax
are as follows: optimisation of the tax reliefs and strengthening of the tax base (Guidelines for
the Development…, 2003).
Any enterprise, when calculating its corporate income tax, has to take into consideration the
terms of the law passed in a country – criteria, tax reliefs and other important factors. The way
how genuinely enterprises keep records of all their revenues and expenses and calculate their
payable taxes as well as make tax payments cannot be traced by any institution. Accordingly,
it is very important that owners of an enterprise understand the need to keep correctly records
of all the enterprise’s assets, revenues and expenses and would not perceive the corporate
income tax as a penalty.

203
Stable corporate income tax rates are important both for businessmen to be able to budget
the costs of future periods and for the government to budget tax revenues.
Source: authors’ construction based on KPMG data Fig.1. Corporate income tax rates in the Baltic States in the period 2000-2014, %
Since the year 2000, the corporate income tax rates have changed many times in the Baltic
States – in Latvia and Estonia the rates only decreased, while in Lithuania, after the rate was
reduced to 15% in 2002, it was raised and reduced again until 2010 when it stabilised at 15%
(Fig.1).
Overall analysis of business activity
The purpose of reforming the corporate income tax in the Baltic States is to foster the
development of enterprises and to attract investors.
As shown in Figure 2, among the Baltic States, the greatest number of active enterprises
was observed in Lithuania in the period 2005-2012; according to the Statistics Lithuania, the
greatest number of enterprises was registered in 2008, reaching 169159 units.
Source: authors’ construction based on Eurostat data
Fig.2. Number of active enterprises in the Baltic States in the period 2005-2012
The trends in the Baltic States are similar; there are just a few exceptions. Increases in the
numbers of active enterprises were observed in the period of analysis in all the Baltic States.
Yea
r
Latvia Lithuania Estonia
%
Latvia Estonia Lithuania
Year
Number

204
Efficient attraction of investment is the determinant factor that creates favourable
conditions for overcoming an economic crisis, for structural changes in the national economy
and for fostering regional development and technological progress, which, in its turn, is a basis
for stable economic growth (Titarenko D., 2006).
Until 2008, a strong inflow of foreign investment was observed in Latvia. In 2008, compared
with the previous year, the weakest increase in the inflow of foreign investment was recorded,
only 11.69%. In 2005, too, an increase was insignificant, 10.01%, which may be explained by
the fact that on 1 May 2004 Latvia, just like the other Baltic States, was not a member of the
European Union.
Table 1
Foreign investment in Latvia in the period 2004-2010, mln EUR
Year 2004 2005 2006 2007 2008 2009 2010
Investment 1679.1 1847.3 2362.3 3142.3 3509.8 4687.7 5284.4
Annual increase, % - 10.01 27.87 33.01 11.69 33.56 12.72
Increase from 2004, % - 10.01 40.69 87.14 109.02 179.17 214.72
Source: authors’ calculations based on CSB data
According to the Central Statistical Bureau of the Republic of Latvia, most of the foreign
investment in Latvia originated in the European Union countries. Of the total foreign
investment in 2010, 73.68% was from the European Union. In Latvia, least foreign investment
came from the CIS countries.
Table 2
Foreign investment in Lithuania in the period 2004-2010, mln EUR
Year 2004 2005 2006 2007 2008 2009 2010
Investment 4698.69 6920.69 8377.14 10282.65 9190.6 9206.19 10030.97
Annual increase, % - 47.29 21.04 22.75 -10.62 0.17 8.96
Increase from 2004,
% - 47.29 78.29 118.84 95.60 95.93 113.48
Source: authors’ calculations based on the Statistics Lithuania
In Lithuania, an annual increase in foreign investments ranged from 10.62 to 47.29% in the
period 2004-2010. The fastest increase in foreign investments was observed in 2005 when,
compared with the previous year, they grew by 47.29%. In 2008 and 2009, the amount of
foreign investment, measured from the base year of 2004, was the same, with a slight
increase of 0.17% in 2009. The number of registered enterprises also declined in Lithuania in
these years.
As shown in Table 3, the situation with foreign investments in Estonia is similar to that in
Lithuania. In the period of analysis, an increase in foreign investments, on an annualised basis,
ranged from 0.89 to 29.65%. Just like in Lithuania, in Estonia, too, the fastest annual increase
was observed in 2005, reaching 29.65%. The next fastest increase was recorded in 2007,
which was 18.07% in comparison with the previous year. During the period 2007-2009, the
amount of accumulated foreign investment in Estonia was steady. At the end of the period of

205
analysis, compared with the base year, the amount of investment had increased by 69.45%,
which was the lowest growth rate among the Baltic States.
Table 3
Foreign investment in Estonia in the period 2004-2010, mln EUR
Year 2004 2005 2006 2007 2008 2009 2010
Investment 7374.30 9560.50 9643.80 11386.40 11774.60 11670.20 12495.40
Annual increase, % - 29.65 0.87 18.07 3.41 -0.89 7.07
Increase from 2004,
% - 29.65 30.78 54.41 59.67 58.26 69.45
Source: authors’ calculations based on Eesti Pank data
Even though the fastest increase in foreign investments was registered in Latvia in the
period of analysis, compared with the base year, the total amount of foreign investments in
Latvia in 2010 was smaller than in Lithuania in 2005 and Estonia in 2004. The greatest amount
of foreign investments was in Estonia regardless of the facts that in Estonia the number of
enterprises was smaller and the number of non-resident enterprises was considerably smaller
than in Latvia and in Lithuania. Estonia is attractive to investors due to the 0% corporate
income tax rate for undistributed profit, while Lithuania’s enterprises are entitled to more
favourable tax adjustments for costs unrelated to economic activity, as theses costs do not
have to be added to their pre-tax profit.
Corporate income tax burdens in the Baltic States
The key tax policy indicator is usually a tax burden expressed as a percentage of gross
domestic product (GDP), which shows the share of GDP to be redistributed by means of the
country’s tax policy (Ketners K., Lukasina O., 1993).
Source: authors’ construction based on Eurostat data
Fig.3. CIT revenues as a percentage of GDP in the Baltic States in the period 2004-2013
The CIT revenues paid into the government consolidated budget, expressed as a percentage
of GDP, characterise a tax burden in a particular country. As shown in Figure 3, until 2009 the
lowest CIT burden among the Baltic States was observed in Estonia, being quite steady within
a range from 1.43 to 1.66% of GDP. In 2010, CIT revenues in the consolidated budget of
Estonian’s government decreased by 24.41%, compared with the previous year; this was the
Year
Latvia Estonia Lithuania
%

206
reason why CIT revenues declined in terms of percentage of GDP. Over the entire period of
analysis in Estonia, the CIT burden was quite steady, varying between 1.24 and 1.88%.
The trends in CIT burdens in Latvia and Lithuania were similar. The highest CIT burden
among the Baltic States was observed in Latvia in 2008, accounting for 3.13% of GDP,
followed by a sharp decline up to 1.51% of GDP in 2009 and 0.88% of GDP in 2010. Over this
period, in Latvia, too, just like in Estonia, CIT revenues in the government consolidated budget
declined, which might be explained by the global economic crisis and decreases in the profits
of enterprises, as the number of enterprises did not grow in the period concerned. In 2009 in
Lithuania, the number of active enterprises sharply declined; consequently, CIT revenues, in
terms of percentage of GDP, also decreased. However, despite the fact that the number of
active enterprises rose in Lithuania over the next years, the CIT burden fell to 1.00% of GDP in
2010 and to 0.82% of GDP in 2011. This is explained by decreases in profits made by
enterprises and a CIT rate cut from 20% to 15% in 2009.
Comparison of corporate income tax calculations in the Baltic States
To illustratively show the key differences in corporate income tax among the Baltic States,
the paper shows the corporate income tax calculated in accordance with each country’s
legislation and tax declarations, taking into consideration taxable income adjustments –
increases or decreases in the tax – as well as applicable tax deductions (Table 4).
Both in Latvia and in Lithuania, taxable income is adjusted by adding the depreciation of
fixed assets. As regards depreciation, in both countries it is calculated in the same way – by
means of the straight-line method – the purchase value of fixed assets is spread over three
years, thus, obtaining a depreciation value of EUR 300 per year.
In Latvia and in Lithuania, penalties and fines paid in the reporting period have to be added
to taxable income.
As regards representation costs, Latvia’s Law on Enterprise Income Tax states that in
calculating the enterprise income tax, 60% of the representation costs have to be added to the
taxable income. It turns out in this case that if an enterprise has spent EUR 500 for
representation in the reporting period, EUR 300 have to be added to its taxable income. In
Lithuania, enterprises are allowed to incorporate in their costs up to 75% of their
representation cost, meaning that enterprises have to adjust their taxable income by adding
25% of their representation cost, which, in this example, amounts to EUR 125.
In both countries, the taxable income has to be also adjusted by adding the increase in the
allowance for doubtful receivables, which, in this case, is assumed to be EUR 200.
In total, given all the mentioned tax adjustments, the taxable income in Latvia increases by
EUR 830, while in Lithuania this amount is only EUR 655, which is EUR 175 less than in Latvia.

207
Table 4
Calculation of the corporate income tax in Latvia and Lithuania, EUR
Latvia Lithuania
Taxation period profit before the tax 10000 10000
Expenses unrelated to economic activity 650 -
Taxable income 10650 10000
Additions to taxable income
Sum of the depreciation of fixed assets and the write-off of intangible
investment reported in an annual report 300 300
Sum of penalties and fines 30 30
Representation costs 300 125
Increase in the allowance for doubtful receivables 200 200
Total increase in taxable income 830 655
Deductions from taxable income
Sum of the depreciation of fixed assets and the write-off of intangible
investment (630) (600)
Cost for providing a new special job for physically or mentally
disabled individuals (350) -
Total deduction from taxable income (980) (600)
Taxable income 10500 10055
Total loss reducing the taxable income 1500 1500
Adjusted taxable income 9000 8555
Tax on adjusted taxable income 1350 1283,25
Tax deductions (270) (513,3)
Estimated CIT 1080 769,95 Source: authors’ calculations based on each country’s legal acts
The next adjustment of taxable income, according to any enterprise profit and loss
statement, refers to deductions from taxable income.
Just like there are additions to taxable income, there are also deductions from taxable
income; taxable income is adjusted for depreciation. In Latvia, Section 13 of the Law on
Enterprise Income Tax stipulates five depreciation categories; computer equipment and
programs are included in Category 3 with a depreciation rate of 35% which is multiplied by a
coefficient of 2.
In Lithuania, no certain depreciation categories with certain depreciation rates are set for
enterprises; however, the law states that depreciation has to be calculated using the straight-
line method and spread over 3 years (for computer equipment) applying a coefficient of 2.
Latvia’s Law on Enterprise Income Tax also provides that an enterprise which has created a
new special job for a physically or mentally disabled individual and employs such an individual
for at least two years may deduct from its taxable income the cost of creating this job. The
authors assume that if an enterprise incurs such costs, they are deducted from its taxable
income at a full extent.
After the taxation period, given the additions to and deductions from taxable income, an
enterprise’s taxable income in Latvia would be equal to EUR 10500, while in Lithuania it would
be EUR 10055, which is significantly less than in Latvia.
In both countries, the legislation allows transferring losses of previous periods to the next
taxation period.

208
The corporate income tax is calculated from the adjusted taxable income, applying a 15%
rate both in Latvia and in Lithuania. The tax from the adjusted taxable income in Latvia would
be EUR 1353 and EUR 1283.25 in Lithuania, which is EUR 66.75 less than in Latvia.
In accordance with the legislation, tax reliefs may be applied to taxable income. Both in
Latvia and in Lithuania, there are tax deductions for charitable contributions. In Latvia, its
legislation strictly stipulates what charitable contributions may be made and whom they may
be given, thus, restricting potential abusive tax avoidance instances. In Latvia, enterprises
may be granted a tax relief of 85% for charitable contributions to governmental institutions
and government capital companies fulfilling national cultural functions delegated by the
Ministry of Culture as well as to associations, foundations and religious organisations registered
in the Republic of Latvia; however, the total amount of this relief may not be more than 20%
of the estimated corporate income tax. So, one can assume that if an enterprise, in a reporting
period, has donated EUR 500 to a governmental institution or a religious organisation, 85% of
this amount is equal to EUR 425 but this is more than 20% of the estimated corporate income
tax. Since the tax relief may not exceed 20% of the estimated corporate income tax, the
enterprise may be granted a tax relief of EUR 270 for its charitable contribution.
In Lithuania, enterprises may deduct from their taxable income a double amount of their
donation but it may not exceed 40% of the estimated corporate income tax. This tax relief in
Lithuania significantly affects the size of the corporate income tax calculated and presented in
the example, as this tax relief reduces the corporate income tax in Lithuania by 40%, which is
quite a lot, given the fact that in Latvia such a tax relief reduces the corporate income tax by
only 20%.
After deducting the tax relief from the estimated corporate income tax, the authors
conclude that in Lithuania, based on this example, EUR 769.95 have to be transferred to the
government consolidated budget, which is EUR 301.05 or 28.7% more than in Latvia. The
greatest difference between the sizes of corporate income tax calculated for both countries is
made up of tax relief deductions. Enterprises in Lithuania may deduct 20% more tax relief
related to charitable contributions than in Latvia, whereas in Latvia enterprises may deduct
only 85% of their donations; however, in Lithuania, the amount donated have to be multiplied
by 2 for the purpose of tax deductions.
To calculate the size of corporate income tax to be paid by an enterprise in Estonia, the
amounts of profit distributed in a reporting period in the Baltic States have to be identified, as
shown in Table 5.
In Estonia, the corporate income tax is paid only if profit is distributed. The tax rate on
dividends paid is 21% of the gross dividends, which is equal to EUR 10000, as shown in the
example in Table 5, or a 21/79 tax rate is applied to net dividends, which totals in this case
EUR 7900.

209
Table 5
Distributed profit of an enterprise in the Baltic States in the period of analysis,
EUR
Latvia Lithuania Estonia
Pre-tax profit in a taxation period 10000 10000 10000
Estimated CIT on profit 1080 769.95 -
Undistributed profit in a reporting year 8920 9230.05 10000
Estimated IIT on dividends paid 892 1846.01 -
Estimated CIT dividends paid - - 2100
Total estimated taxes 1972 2615.96 2100
Net dividends paid 8028 7384.04 7900 Source: authors’ calculations
Given the fact that when distributing a profit in dividends in Estonia, the profit is taxed by
only one tax – corporate income tax – and individual income tax is not applied to the profit;
the tax paid in Estonia is higher than in Latvia because the tax rate in Estonia is comparatively
higher, yet, it is lower than in Lithuania, as dividends paid in Lithuania are taxed also by
individual income tax, the rate of which for dividends is 20%. However, enterprises very often
choose not to distribute all their profit made during a reporting period; in this case, Estonia’s
tax system has some advantages, as the estimated tax is smaller.
The dividend systems in Latvia and Lithuania are similar: an estimated corporate income tax
of a reporting period is calculated from the pre-tax profit after the taxable income has been
adjusted, thus, obtaining an undistributed profit of the reporting period. When distributing this
profit to the owners or shareholders of an enterprise, it is taxed by the individual income tax.
In Latvia, the individual income tax rate on dividends is 10%, while in Lithuania this tax rate is
twice as high at 20%.
Conclusions, proposals, recommendations
1. Latvia, Estonia and Lithuania offer a favourable tax system as well as low tax rates for
foreign investors. Estonia is attractive to investors due to the 0% corporate income tax rate
for undistributed profit.
2. In the period 2005-2009, the number of active enterprises in Latvia rose 18.12% or by
19791 units, while in the period 2009-2012 their number grew at a slightly slower rate,
17.83%; however, this number rose by 22934 units, which indicated that conditions for
business were favourable in Latvia.
3. Despite the low tax burdens in all the Baltic States, foreign investments in Lithuania and
Estonia are considerably greater than in Latvia, which indicates more beneficial and better-
structured CIT systems there.
4. Lithuania’s enterprises are entitled to more favourable tax adjustments for costs unrelated
to economic activity (as these costs do not have to be added to their pre-tax profit,
representation costs increase the taxable income by only 25%, while in Latvia it is 60% as
well as tax reliefs for charity donors are greater in Lithuania).

210
5. Latvia’s enterprises, unlike those in Lithuania, are entitled to more favourable taxable
income adjustments. First, a taxable income is adjusted for the depreciation of fixed assets
(because depreciation categories with certain depreciation rates are set for enterprises in
Latvia, which are higher than if calculating using the straight-line method, as it is practised
in Lithuania. Tax adjustments for costs of providing a new special job for physically or
mentally disabled individuals in Latvia may be positively viewed).
6. Adjustments of taxable income and tax reliefs affect CIT revenues paid into the
government budget only in Latvia and Lithuania, while in Estonia revenues paid into the
government budget are influenced by the amount of profit distributed in a reporting period,
as adjustments of taxable income and tax reliefs are not available in Estonia.
7. The government should perfect the PIT policy in Latvia by amending the Law on Enterprise
Income Tax and introducing significant PIT reliefs for businessmen, thus, contributing to
business development and competitiveness in Latvia.
8. To maintain the competitiveness of enterprises, Latvia’s legislators have to retain the PIT
rate at 15%; this rate in Estonia is 21% and 15%, too, in Lithuania.
Bibliography
1. Cabinet of Ministers. (2003). Guidelines for the Development of the System of Taxes
and Duties (in Latvian). Retrieved: http://likumi.lv/doc.php?id=76127. Access:
24.03.2013.
2. Central Statistical Bureau. Databases. Retrieved:
http://www.csb.gov.lv/dati/statistikas-datubazes-28270.html. Access: 28.02.2014.
3. Eesti Pank. Databases. Retrieved:
http://statistika.eestipank.ee/?lng=en#treeMenu/FINANTSKONTO. Access: 02.03.2014.
4. Eurostat. Databases. Retrieved:
http://epp.eurostat.ec.europa.eu/portal/page/portal/statistics/search_database.
Access: 28.02.2014.
5. Ketners, K., Lukasina, O. (1993). Taxes in the European Union and Latvia (in Latvian).
Riga: Merkurijs Lat. p. 237. Retrieved: http://ocw.e-learning.lv/EK1301/lv/Nodokli%20-
%20gramata.pdf. Access: 19.12.2013.
6. KPMG. Corporate Tax Rates table. Retrieved:
http://www.kpmg.com/global/en/services/tax/tax-tools-and-
resources/pages/corporate-tax-rates-table.aspx. Access: 23.02.2013.
7. Saeima. (1995). Law on Enterprise Income Tax. Retrieved:
http://likumi.lv/doc.php?id=34094. Access: 10.01.2013.
8. Statistics Lithuania. Databases. Retrieved: http://osp.stat.gov.lt/en/temines-lenteles40.
Access: 28.02.2014.
9. Titarenko, D. (2006). Investment as a Growth Factor for the Economy of Latvia (in
Latvian). Riga: Transport and Communication Institute. p.151.

211
POSSIBILITY FOR PERSONAL WEALTH TAXATION SYSTEM IN LATVIA
Karlis Ketners1, Dr.oec.,prof.
1 Riga Technical university
Abstract. Taxation policy is one of the possible solutions to ensure development of the
economy and can affect possible regional and social disparities and market distortions. One of
the possible discussions in the field of the current Latvian tax policy is mainly based on
reduction of income inequality by some elements of tax policy. Research of the current status
of taxation policy and quality of the state budget revenue sources enabled to suggest some
solutions instead of personal income taxation to tax personal wealth with separate wealth tax.
As the main result this paper offers proposals on the personal wealth taxation system. The
research is based on traditional economic science methods, including monographic method,
analysis and synthesis, statistical analysis, and also comparative analysis and practical
experience of tax policy implementation. Implementation of prepared recommendations
provides an opportunity to ensure development of Latvian tax system.
Key words: wealth taxation, tax policy, Latvian tax system.
JEL code: H24, K34, D31
Introduction
One of the main ideas for improvement of tax policy in Latvia is introduction of progressive
rates within personal income tax. Argument for such solution is income inequality and income
distribution distortions. Equity and efficiency objectives have always been at the centre of the
analysis and search for improvement of taxation systems. In the context of the common
European policy and in the political discussions following the financial and economic crisis,
there is a specific interest in the fairness and redistribution aspects of the tax system. These
issues have traditionally been linked to the balance of the taxation system in relation to its
various components and, more specifically, to the analysis of the progressivity of personal
income tax provisions (European Commission, 2014; European Commission, 2013). Many
professionals study the impact of personal income tax on the income distribution. Common
complaints are that the tax system is unfair and wealthy taxpayers should be taxed at higher
rates. According to the author’s evaluation despite the considerable resources that will be
Corresponding author. Tel.: + 371 29437496; fax: + 371 67089354.
E-mail address: [email protected].
Proceedings of the 2015 International Conference “ECONOMIC SCIENCE FOR RURAL DEVELOPMENT”, No37
Jelgava, LLU ESAF, 23-24 April 2015, pp. 211-219

212
expended on compliance, the progressive tax within current income structure could raise only
a small portion of revenue. Another possible solution for reduction of inequality is introduction
of a regular wealth tax. It has been argued in the past that individuals benefit directly from
holding wealth and that the status and power it brings mean that additional taxation of wealth
is appropriate. However, wealth taxation is costly to administer, might raise little revenue and
could operate inefficiently. The aim of the research is to explore net-wealth tax systems in
Europe and to evaluate the possible proposals for the improvement of Latvian tax system. The
tasks of the research were set to achieve the aim of the paper – to analyse the development of
wealth tax reforms, to evaluate the impact on taxpayers and efficiency of the tax system. The
research is based on traditional economic science methods, including the monographic
method, analysis and synthesis, statistical analysis, and the graphic method, comparative
analysis of literature and practical experience of tax policy implementation. Although the global
economic crisis has posed hard questions, it also offers an opportunity to accelerate structural
tax reforms and to restart the discussion on the design of Latvian tax system beyond short-
term policy responses. Therefore, at the end of the paper there are outlined proposals to
reform personal wealth taxation.
Current wealth taxation situation in Europe
Fair tax system is one of topical issues in current tax policy researches. Inequality problems
and respective implications in tax policy strategy were discussed in Sproge (2011), Skapars,
Sumilo and Dunska (2010). According to recent researches, as Dubra, Vilcina (2014),
reduction of high poverty rate in Latvia is challenged by such factors as income inequality,
including low income of the employed and rather high tax burden on low income employees
(‘working poor’ problem), and limited budget resources in the upcoming years. Both problems
could be solved by tax policy decisions and possible reforms in taxation field. In theory as
noted by Ketners, Titova (2013) the main concepts of the fairness of tax system are -
horizontal and vertical equity. Horizontal equity is assumed to be if persons are treated equally
in terms of tax burden (flat tax example). Vertical equity is characterised by the situation when
taxpayers with a higher income should pay higher taxes, i.e. that the tax liability should
depend on the ability to pay. As to the author’s opinion equity concept could be achieved by
household taxation. Common view of different researches (Skapars, Sumilo and Dunska
(2010)) is that the tax system is unfair and wealthy taxpayers should be taxed at higher rates.
According to the author’s evaluation despite the considerable resources that will be expended
on compliance, the progressive personal income tax within the current income structure could
raise only a small portion of budget revenues. Another solution to be considered for reduction
of inequality is introduction of a regular wealth tax. It has been argued in the past that
individuals benefit directly from holding wealth and that the status and power it brings mean
that additional taxation of wealth is appropriate. However, wealth taxation is costly to
administer, might raise little revenue and could operate inefficiently.

213
In the field of the research of wealth taxation there are many publications in the world
scientific literature. As recent remarkable examples Profeta et.al. (2014), presented an
empirical model of wealth transfer taxation in the revenue systems of the G7 countries –
Canada, France, Germany, Italy, Japan, the UK, and the US – over the period from 1965 to
2009. Also the author agrees with Tamai (2014), who examined the relationship between
wealth distribution and economic growth in an endogenous growth model with heterogeneous
households and redistributive taxation. Some solutions for progressive taxation in Latvia were
provided by Repsa (2010) and general fairness of tax system was described in Vanags (2010).
Despite the popularity of tax policy research some aspects of specific wealth taxes – real
estate taxes are covered by Latvian scientists (Stucere, Mazure (2013)). As argued by Stucere,
Mazure (2012) in the future tax burden in Latvia, Lithuania, Estonia, and Poland should be
shifted from personal income to immovable property, since it is difficult to avoid paying of
immovable property tax and it leaves a less impact on the economic growth of the country.
Taxes on personal wealth and transfer of wealth trigger intense debate at all levels among
policy-makers, economists and the general public. According to Ketners, Titova (2013) wealth
taxes are commonly identified as taxes on the possession of net-wealth and group of wealth
taxes consists of taxes on property (including vehicles), inheritance and gift taxes, real estate
and land taxes and annual recurring taxes on the possession of wealth.
The author agrees with Boadway, Chamberlain, Emmerson (2010) conclusion that wealth
taxation is as an alternative to income taxes, at least for income generating wealth, because
an annual tax on wealth is roughly analogous to a tax on capital income from that wealth. To
the extent that one wants to include capital income in the tax base, wealth taxation may be
convenient for some types of assets, particularly those for which measures of asset income are
not readily observable. For example, taxes on the value of owner-occupied housing (net of
mortgage debt) are a way of taxing its imputed return, given that there is no tax paid on the
imputed rental income from owner-occupied housing. In an open economy setting where
capital income from abroad is not easily verifiable, a tax on wealth might be a rough-and-
ready way of taxing presumed income. Of course, it may be even more practically difficult to
measure the value of such wealth than to monitor the income it produces. Wealth taxation
may be a supplement to capital income taxation where the latter is constrained by policy
design. In a dual income tax system where capital income is taxed at a uniform rate, wealth
taxation may be used as an additional policy instrument to achieve redistributive objectives.
According to the European Commission (2014b) inheritances and gifts are taxed widely in
the EU-20 and EU-21 Member States respectively. For inheritances a separate tax is commonly
used. Gift taxation is more often part of a general tax but a separate tax is still the most
common approach. Most EU Member States using a separate tax for both inheritances and
gifts use the same tax law to regulate both. It must be noted at this stage that the in last
decade the number of Member States which tax inheritances and gifts has decreased. Since
the year 2000, five countries – Austria, Cyprus, the Czech Republic, Italy and Slovakia – have

214
abolished their inheritance and gift tax. Two countries - Greece and Portugal – have replaced
their inheritance tax with a new tax (Greece) or provision (Portugal). Lithuania has reformed
the system and abandoned the use of both a tax and provision for inheritances and gift in
favour of only a tax (inheritances) or only a provision (gifts). Only Italy has truly re-introduced
an inheritance and gift tax, while Latvia has introduced a gift tax provision in the income tax.
Real estate is taxed in every EU Member State. Possession of real estate is taxed the most
(27 Member States), closely followed by real estate transfers (26 Member States). Most
countries tax both real estate possession and real estate transfer. Malta, however, only taxes
real estate transfers, while Lithuania and Slovenia only tax real estate possession. Again a
separate tax is the most common way to tax real estate. Eight EU Member States tax the
possession of certain assets. Most of these, however, tax vehicles and the aim is more for
environmental purposes than to tax wealth. Only the Italian tax on bank accounts and financial
assets is clearly aimed at taxing wealth. Apart from these specific taxes, only some EU Member
States use general net-wealth as a taxable base. As shown in Figure 1 tax burden is
comparably low. The author agrees with the European Commission (2014a) analysis that there
is a clear trend of abolishing wealth taxes due to low tax revenues. However, Spain tax policy
shows an example of temporarily introduction of general wealth tax on net-wealth motivated
by revenue considerations.
Source: European Commission, 2014 a
Fig.1 Net-wealth tax and non-tax payment burden in Europe, % to GDP
Comparative analysis of net wealth taxes shows that the French and Spanish wealth taxes
are progressive, have top rates. Italy and the Netherlands have specific wealth taxes on
financial assets and as a part of income taxation.

215
Table 1
Main elements of wealth taxes in the EU
Member State Number of rate
scales
Tax rate range Threshold, EUR
Spain 8 0.2% - 2.5% 700,000
France 6 0% - 1.5% 1,300,000
Italy 0 Lump sum of EUR
34.20 for bank
account + 0.2% over
the value of other
assets.
5,000
0 0.2% None
Netherlands 0 1.2% (30% over a
fictitious 4% income).
21,140
Source: European Commission (2014 a)
General taxes on wealth raise less budget revenues as specific taxes since the rates
normally apply to the part of taxpayers, taking into consideration tax free thresholds (Table 1).
Spain and France provide large tax free thresholds. The Netherlands income tax provision
has lower exempt amount. In France, according to France statistic data (2014), about 160
thousand individuals were subject to wealth tax, which is about 0.5% of all respective income
tax payers. The comparative analysis shows also that considering the principle of equity some
countries are keeping wealth tax in the tax system. Also it should be remarked that abolition of
wealth tax in Finland was substantiated by unfair impact on enterprises and motivated by
many possibilities to evade tax. Luxembourg and Sweden abolished wealth taxes to create a
more attractive environment for high net worth individuals. According to comparative analysis
the annual taxes on net wealth could be characterized as taxes with tax base - assets less the
related liabilities of the taxpayer, with relatively low threshold. Also exemption from the tax
base on business assets is applicable. Taxes are progressive with rates between 0% and 3%.
(For country specific wealth taxation issues see also European Commission, 2014 b).
Possible wealth taxation reform for Latvia
Whereas EU Member States had significant development in the field of wealth taxation, for
Latvia it is different. As shown in Mazure, Viksne (2014), the current tax policy in Latvia is
mainly based on the continuation of the tax policy followed since the tax reform of 1995. The
recent developments in the tax system have been mainly targeted at abolishing discriminatory
and restrictive provisions by extending the relevant exemptions. Essential opportunity to
increase revenues from capital taxes is provided by differentiation of corporate income tax and
revision of corporate tax base. According to the legal acts that are in force in the EU, Member

216
States are not subject to any restrictions regarding corporate income tax. The EU Member
States are competent to apply different tax rates for different taxpayers, of course, taking into
account the EU regulations (Jakusonoka (2013)). In the field of personal income taxation,
Latvian approach seems to be simple and close to classical flat taxation system with some
semi-dual tax elements. However, recent statistics (Table 2) shows increase in implicit tax
rates.
Table 2
Development in tax burden and implicit tax rates in Latvia
2000 2005 2008 2009 2010 2011 2012
Total tax burden
in percentage of
GDP
29.7 29.2 29.2 26.6 27.2 27.6 27.9
Consumption 18.4 19.9 17.4 16.9 16.9 17.2 17.4
Labour
employed
36.7 33.2 28.4 29.2 33.1 33.3 33.0
Capital 12.3 10.6 17.7 10.2 7.9 9.5 9.9
Capital and
business income
6.9 7.4 14.0 6.6 3.9 5.3 5.8
Households 1.1 1.0 1.0 0.9 1.5 2.5 3.0
Source: European Commission, 2014 b
An international comparison of Latvian tax burden shows differences compared to developed
countries. As in 2013 Latvian tax-to-GDP ratio continued to fall, but OECD revenue statistics
shows (OECD (2014)) that tax burdens and revenue collection in advanced economies are
reaching record levels not seen since pre-crisis period, however, the tax mix continues to vary
widely across countries. OECD (2014) shows that the average tax burden in the OECD
countries increased by 0.4 percentage points in 2013 to 34.1% compared with 33.7% in 2012
and 33.3% in 2011. Historically, tax-to-GDP ratios rose through the 1990s, to a peak OECD
average of 34.3% in 2000. Tax burden fell back slightly between 2001 and 2004 but then rose
again between 2005 and 2007 before falling back following the crisis. In 2013, the tax burden
rose in 21 of 30 countries for which data is available, and fell in the remaining 9 OECD Member
States. A number of factors are behind the rise in tax ratios between 2012 and 2013. About
half of the increase is attributed to personal and corporate income taxes, which are typically
designed so that revenues rise faster than GDP during periods of economic recovery.
Discretionary tax changes have also played a role, as many countries raised tax rates and/or
broadened tax bases. Revenue considerations and necessity for additional fiscal policy
resources leads to possible tax revenue generating reforms. Since labour employed taxes are
comparable with the average EU Member State implicit tax rates and there is low possibility to
increase consumption taxes the only solution remains capital taxation. Despite trend to
increase capital taxation (OECD (2014), European Commission (2014b)) for Latvia additional

217
taxation of capital is still unused possibility. However, it must be remarked that to ensure
competitiveness of Latvian tax system for new businesses additional capital taxation should
not affect business assets. For wealth taxes as a part of household taxation it should be
mentioned that in case of Latvia there are no taxes regarding inheritances or gifts. As
described by Ketners, Titova (2013) taxation of gifts is represented by personal income
taxation. Gifts in amount exceeding EUR 1,425 annually, which are received from non-relatives
(the gift-giver is not related to the taxpayer by marriage or kinship to the third degree), are
subject to personal income tax. Gifts received from legal entities are wholly taxable. Gifts used
for medic treatment or higher education are, under certain conditions, exempt regardless of
the relation between the beneficiary and the donor. In wealth taxation field only real estate
taxation is relatively important. A real estate tax is applicable to land, buildings and
engineering constructions based on the cadastral value of land and buildings. Starting from
2013 local municipalities are delegated to determine the tax rate within the scope of the tax
rate corridor (0.2– 3%) provided by law: as a general rule tax rates should be set within the
0.2–1.5 % limits, and where real estate is not maintained according to the procedure provided
by law — within 1.5–3.0 % limits. Relative importance of the tax is 0.66% of GDP or 1.67% of
total tax revenues (European Commission, 2014b). Also in the real estate sector there is a
duty (state fee) on the registration of the title to immovable property. The person requesting
registration of ownership after the purchase of an immovable property is liable to a stamp duty
on registration of real estate with the Land Register. According to European Commission
(2014b) this “quasi tax” generates 0.28% of total tax revenues or 0.08% of GDP.
On December 15, 2011 the law on initial property declarations for private individuals, or so-
called "zero declarations" law, came in force in Latvia. It was obligatory for property condition
declarations to be submitted by people who, as at December 31, 2011, were Latvian citizens,
aliens or foreigners (who have received a permanent accommodation permit or permanent
stay certificate in Latvia) and who are also Latvian residents whose property condition on
December 31, 2011 corresponded to one or some of the criteria stated by law and including
cash, loans and property which exceeds given threshold. The State Revenue Service, 2013
initial property status declarations’ statistics shows the possibilities of introducing of net-wealth
taxation in case of Latvia. In total there are 131 992 declaration submitted to the State
Revenue Service, including 130,995 declarations of persons who were obliged to submit
declarations, 278 declarations for a minor or incapacitated person, 719 voluntary declarations,
which is covering around 17% of individual taxpayers. Instead of comprehensive personal
income taxation wealth taxation will affect smaller number of taxpayers and this will reduce
tax compliance costs. In total, 4,193 individuals indicated their ownership or co-ownership of
5526 real estates in foreign countries. In total, 1,019 individuals indicated that they owned
1,306 vehicles in foreign countries, including 1,122 cars, 47 motorcycles, 31 truck, 15 tractors,
11 auto trailers, 10 yachts. In total, 2,825 persons have indicated that they have foreign
companies’ shares (for example, equity share capital, investment shares) with a total

218
acquisition value of EUR 387 million. In total, 2,629 individuals indicated that they owned
Latvian financial instruments with a total acquisition value of EUR 206 million. The top 3
declared Latvian financial instruments owned by one person are with acquisition cost EUR 9.12
million, EUR 6.64 million, EUR 6.39 million. In total, 679 persons have indicated that they have
foreign-owned financial instruments whose value is EUR 79 million. Also 46,336 persons have
indicated that they have savings amounting total to EUR 3.26 billion. Based on evaluation of
property declarations and possible wealth tax rate of 0.05% the revenues from wealth taxation
could be estimated to EUR 99.45 million. On one hand, application of net wealth tax would
contribute to reduction of income inequality, but on the other hand would not affect labour
market, employees’ incomes and, thus, competitiveness and attractiveness of the national
economy.
Conclusions, proposals, recommendations
1. The annual taxes on net wealth could be characterized as taxes with tax base - assets
less the related liabilities of the taxpayer, with relatively low threshold. Also exemption from
the tax base on business assets is applicable. Taxes are progressive with rates between 0%
and 3%.
2. The number of net wealth taxes has declined over the last decade. Most OECD countries
have abolished wealth taxes.
3. In case of Latvia there are no taxes regarding inheritances or gifts in Latvia. Taxation of
gifts is represented by personal income taxation. Taxation of wealth is represented by real
estate tax.
4. Wealth taxation may be used as an additional tax policy instrument to achieve
redistributive objectives. This would preserve labour market, employees’ income, and, thus,
would not harm competitiveness and attractiveness of the national economy.
5. Another option that could be explored further is an annual tax targeted at a very high
value residential property with no reduction for debt. Perhaps the easiest way this could be
implemented would be through the imposition of an additional real estate tax which would only
affect occupiers of a residential property with a gross value above a large limit and would be
paid wherever the occupier was resident or domiciled.
Bibliography
1. Boadway, R., Chamberlain, E., Emmerson, C. (2010). Taxation of wealth and wealth
transfers. Dimensions of tax design: The Mirrlees review. London: Institute For Fiscal
Studies . 737-814.
2. Dubra, E., Vilcina, A. (2014). European Social Convergence and Its Implementation in
Latvia. In: Editors Economic Science for Rural Development Proceedings of the
International Scientific Conference No. 33. Jelgava: Latvian University of Agriculture.
3. European Commission (2014a). Cross country review of taxes on wealth and transfers of
wealth. Specific Contract No8 TAXUD/2013/DE/335. Based on Framework Contract No
TAXUD/2012/CC/117. Revised Final report. EY – October 2014. Available:

219
http://ec.europa.eu/taxation_customs/resources/documents/common/publications/studies/
2014_eu_wealth_tax_project_finale_report.pdf. Last accessed 12th December 2014.
4. European Commission (2014b). Taxation trends in the European Union: 2014 edition.
Luxembourg: Publications Office of the European Union. 314.
5. European Commission (2013). Taxation paper No 38: 'Tax Reforms in EU Member States'.
Luxembourg: Office for Official Publications of the European Communities. 123.
6. France statistic data. (2014). Open platform for French public data. Available:
https://www.data.gouv.fr/en/. Last accessed 12th December 2014.
7. Jakusonoka, I. (2013). Analysis of Trends in the Tax Burden in Latvia. In: Economic
Science for Rural Development: Proceedings of the International Scientific Conference No.
30. Jelgava: Latvian University of Agriculture. 278-285.
8. Ketners, K., Titova, S. (2013). Tax Policy in the European Union Environment. Riga: BA
School of Business and Finance Research Centre. 33-56.
9. Mazure, G., Viksne, D. (2014). Income Taxation Development Trends in the Baltic States.
In: Economic Science for Rural Development Proceedings of the International Scientific
Conference No. 33. Jelgava: Latvian University of Agriculture. p.34-44.
10. OECD (2014). Revenue Statistics 2014. Paris: OECD Publishing. DOI: 10.1787/rev_stats-
2014-en-fr
11. Profeta, P.A , Scabrosetti, S.B , Winer, S.L.C. . (2014). Wealth transfer taxation: An
empirical investigation. International Tax and Public Finance. 21 (4), p.720-767.
12. Repsa, I. (2010). Personal Income Tax Application in Latvia. Economics. Business
Administration. 758, p.180-188.
13. Skapars, R., Sumilo, E., Dunska, M. (2010). Legal and Economic Aspects of Tax Policy and
Their Impact on the Business Environment. Riga: University of Latvia. p230.
14. Sproge, I. (2011) Tax Policy for Economic Development in a Changing Environment.
Doctoral Thesis. Riga: University of Latvia.
15. State Revenue Service. (2013). Property status declaration statistics. Available:
http://www.plz.lv/wp-content/uploads/2013/03/0308_2013_NP_Mantiska-stavokla-
deklaresanas-statistika.pdf . Last accessed 12th December 2014.
16. Stucere, S. Mazure, G. (2012). Application of Immovable Property Tax in the EU Baltic Sea
Region Countries. In: Economic Science for Rural Development Conference Proceedings
(No. 28).. Jelgava: Latvian University of Agriculture p.231-237
17. Stucere, S., Mazure, G. (2013). Application of Immovable Property Tax in the Regions of
Latvia . In: XXX Economic Science for Rural Development: Proceedings of the International
Scientific Conference No. 30. Jelgava: Latvian University of Agriculture. p.182-189.
18. Tamai, T. (2014). Redistributive taxation, wealth distribution, and economic growth.
Journal of Economics/ Zeitschrift fur Nationalokonomie., p.1-20 DOI 10.1007/s00712-014-
0424-2
19. Vanags, A. (2010). Tax reform in Latvia: Could it be fair? (No. 8). . Available:
http://biceps.org/assets/docs/neregulara-rakstura/Tax_reform_paper_Final_11084_0.pdf.
Last accessed 15th December 2014.

220
CONTOURS OF THE BANKING UNION WITHIN THE INTEGRATED
EUROPE: THE LITHUANIAN CASE
Algis Junevicius1, Prof.dr.; Mindaugas Puidokas1*, Assoc.prof.dr.;
1 Faculty of Social Sciences, Arts and Humanities, Kaunas University of Technology
Abstract. The recent financial crisis has shown that certain institutions of the European
Union (EU) and its Member States are poorly prepared for solving the issues created by
difficulties experiencing banks in European markets. In order to be able to further provide
services for citizens and companies, the governments of EU Member States had to support
their banks with public finances and provide guarantees on an unprecedented scale. This
averted the collapse of some banks and disturbance of the economy but put the burden on
taxpayers. As a result, there was deterioration in public finances. The major responsibility for
avoiding further deterioration should be assumed by the European Banking Union (EBU), also
called as the Integrated Financial System (whose foundation occurred while Lithuania held the
presidency of the Council of the EU in the second half of 2013). Taking into account this fact,
there are several problematic aspects, connected to Lithuanian membership in the Banking
Union, which are discussed in this paper.
Key words: eurozone, banking union, single supervisory mechanism, single resolution
mechanism, single bank resolution fund
JEL code: H3, H7, F6, F5
Introduction
The euro crisis, which was caused by issues on global financial markets, made the EU
institutions and Member States to implement reforms of their finance sector. The European
Commission entrusted a group of high level experts, which was led by a former EC member,
the head of Finnish bank and board member of the European Central Bank (ECB) E. Liikanen,
to execute the report on demand assessment of structural reforms in the EU banking sector.
The experts group presented their report (Liikanen-report, 2012) in September, 2012. The
means proposed in E. Liikanen (2012) report were later implemented in many initiatives of the
European Commission.
* Corresponding author. Tel. +370 612 62362. Fax: +370 300102. E-mail [email protected]
Proceedings of the 2015 International Conference “ECONOMIC SCIENCE FOR RURAL DEVELOPMENT” No37
Jelgava, LLU ESAF, 23-24 April 2015, pp. 220-231

221
Issues surrounding the creation of the EBU have not been widely analysed in Lithuanian
scientific literature so far. In 2013, the Central Bank of Lithuania carried out a study on the
Euro introduction in Lithuania in 2015. The study analyses and makes the quantitative impact
assessment of Euro introduction for the national economy (Euro ivedimo Lietuvoje...., 2013).
However, this study is not directly associated with the creation of Banking Union. This subject
is seldom analysed in Lithuanian academic research literature. Some aspects of soon-to-be-
created EBU and public policy tendencies in the banking sector were analysed by V. Senavicius
(2012). The author aspired to evaluate the impact of centralization of bank risk supervision
and creation of the Single Resolution Mechanism (SRM) on the national public administration
systems of EU Member States. T. Ambrazas (2014) research object is the regulation of bank
(single) resolution mechanism and its application in the Republic of Lithuania. There are certain
mechanisms in Lithuania which help defeat bank solvency problems: bank nationalisation, the
transfer of the bank’s assets, rights, transactions and liabilities to another bank. A. Aslund
(2013) analyses the lessons of East European financial crisis in the period of 2008-2010. This
financial crisis was an ordinary credit boom and bust cycle, leading to a current account crisis.
A. Miskinis, E. Cipkute (2012) discuss some aspects of the inefficiency of the supervision
system of credit institutions. This was influenced by the securitization process.
The aim of this paper – to identify the major elements of single resolution mechanism for
the European Banking Union and to reveal the possible consequences of Lithuania’s
membership in the Banking Union.
The object of this paper - single resolution mechanism for European banks. This paper will
analyse only concisely the Single Supervisory Mechanism (SSM), because it constitutes a very
broad topic. Though the analysis has a special focus on 2 major pillars of the Integrated
financial system: the SSM and the SRM.
The research tasks:
1) define the key issues of eurozone;
2) identify the tools of the European Union for resolution of the financial sector;
3) determine and assess the measures applied for reforming of Lithuanian banking
sector.
Research methods. The logical method is used for making substantiated generalization of
collected facts and formulating transitional and final research conclusions. The method of
systematic analysis is applied seeking to evaluate the existing banking regulation in Lithuania
and the EU. The generalization method, together with the logical, will help identify the general
and major features and characteristics of the mechanisms, which were analysed in this paper.
Research results and discussion
State intervention to rescue the banking sector began in the period of 2008-2009 together
with the global financial crisis. According to the latest Eurostat data, it certainly has reached

222
dramatic proportions (Baciulis M., 2013; Eurostat, 2013). Support for national states was
provided in various forms: by buying out shares of banks in various countries, giving state
guarantees, using a variety of monetary policy operations and the overall fiscal support
measures. Net costs of bank rescue programmes (state performed a role of the “Lender of last
resort”) increased state debt, which compiled up to EUR 690 billion (or 5.2% of GDP) in the
EU-27 in 2012. Accordingly, in the eurozone countries, the debt amounted EUR 520 billion (or
5.5% of GDP). The net cost of bank rescue programme increased the budget deficit in the EU-
27 by 0.5% of GDP in 2010 (the year of the highest increase). In 2012, the budget deficit in
the EU-27 was still 0.4%, while in the eurozone countries – approximately 0.7%. Charles B.
Blankart (2011) noticed that state help for banking sector accounted for a large portion of
various countries’ GDP. For example, state support for banking sector in Ireland constituted
265% of its national GDP, in the United Stated it amounted 80% and in Germany – 20% of
their GDP (Blankart Ch. B., 2011).
Primarily, these actions by EU Member States had a negative impact on their public
finances. The EU-27 governments are often criticized that bank restructuring is financed by
taxpayer money, which fundamentally opposes to state public policy. It has also triggered
“moral hazard” – depositors and other parties (investors), seeing that their states spend
money for bank restructuring, take excessive risks (hoping that because of active state aid
instruments, the banks won’t go bankrupt) (Krimminger M., 2006).
Total expenditure for bank rescue programs in 27 European Union member states amounted EUR 1 trillion in 2008-2011.
Total expenditure of states for bank rescuing
Ratio of banks assets to GDP, times
UK
Germany
France
Spain
Netherlands
Belgium
Italy
Portugal
( EUR billion)
Source: European Central Bank, 2012
Fig. 1. Total expenditure for bank rescue programs in some European Union member
states, in EUR, 2008-2011
The EU Member States managed to evaluate the consequences of excessive risk too late.
Thus bank debt became an internal European banking sector problem. In the 1970s Member

223
State politicians had heavily liberalised (deregulated) financial markets to stimulate growth.
This enabled financial markets to avoid strict state regulation and control. Scientific studies
show the direct link between deregulation and financial crisis. For example, after the
bankruptcy of Lehman Brothers, the results of economic activity in 2008-2009 have decreased
more significantly in countries in which state regulation of banks was weaker (Weiss S.,
Hoffman I., 2012).
1. The Integrated financial system: its principles and features of activity
The financial crisis indicated that institutions of European Union and its member states
are poorly prepared for dealing with current issues of financially troubled banks in European
markets. The major situation changer should be the European Banking Union (EBU), also
called as the Integrated Financial System, which will be based on a single set of full and
comprehensive rules for financial services. These rules will ensure that the EU member states
have the necessary means for involvement and strong intervention in both cases: before
problems occurred and at the moment they started. The EBU is based on three stages model,
which consists of 3 pillars: 1) the Single Supervisory Mechanism (SSM), 2) the Single
Resolution Mechanism (SRM), 3) the Deposit Guarantee Schemes (DGS).

224
Source: authors’ construction
Fig. 2. The three pillars of the Banking Union
Firstly, Member States of the EU declared the SSM for European banks (Council
Regulation (EU) No 1024/2013). The SSM entered into force on 4 November 2014. The
European Central Bank (ECB) directly supervises 120 biggest (among 6000 operating banks)
eurozone banks now, representing almost 85% of total banking assets in the eurozone. The
mechanism is applied for the major and systemically most important eurozone banks. The
importance of the bank is evaluated on the basis of these criteria: size, importance for the
economy of the EU, or (and) of particular Member State and importance of the bank for the
cross-border activity among Member States. The ECB will directly supervise credit institutions,
financial holding companies or mixed financial holding companies that are deemed significant.
According to this, the credit institution, which is supervised by the ECB, must satisfy any of
these conditions: 1) hold assets worth more than EUR 30 billion, or 2) hold assets exceeding
one-fifth (20%) of the gross domestic product of the eurozone Member State; 3) be one of the
three largest lenders in the participating Member State. The ECB may consider at its own
Single Rulebook (CRD IV: Capital Requirements Directive)

225
initiative that the credit institution is extremely important if it has established banking
subsidiaries in more than one participating Member State and its cross-border assets or
liabilities represent a significant part of its total assets or liabilities. The ECB started direct
supervision of 3 most significant credit institutions at each participating member state from
November 2014. The major aim of this supervision is to ensure that credit institutions are
financially reliable and to protect the interests of depositors and the stability of financial
system. Other banks, which do not comply with above presented criteria, remain under the
surveillance of national authorities but the ECB intervenes, if it sees a need for it.
The other major pillar of the EBU is the Single Resolution Mechanism (SRM). It will
supplement the SSM and will be a second step in the creation of Banking Union. This system
will facilitate cooperation between national institutions in the cases of the collapse of cross-
border banking groups. The SRM will ensure that – not withstanding stronger supervision - if a
bank subject to the SSM faced serious difficulties, its resolution could be managed efficiently
with minimal costs to taxpayers and the real economy (EU Regulation No 806/2014). Its
essence is very simple: to ensure that in case of bankruptcy, a bank would not pose bigger
issues {not only for the state in which it operates but for the whole economy of eurozone too}.
The Single Resolution Mechanism includes only the banks, which enter into the sphere of SSM
activity. Smaller banks, which activity is cross-border (“neighbourhood effect”), have to obey
to the SRM rules too. The major principle of SRM is “bail in”. So, this should enable the
enforcement of a smooth transition from “bail-outs” to “bail-ins”. Thus bank supervision will be
supplemented with a strong and integrated system, dedicated for the resolution of troubled
banks. This mechanism will enter into force from January 1, 2016.
2. Problems with Lithuania’s membership in the Banking Union
Lithuania endorsed the creation of the Banking Union and joined the eurozone on January
1, 2015. Above all, the decision to introduce euro and transform the financial sector is of the
greatest political importance. The country is now liable to participate in the decision making
process which leads to the integration into the EU internal market. Naturally, that causes the
emergence of different issues, e.g. what are the possible consequences of the membership in
both the eurozone and the Banking Union? What sort of banking union can be most effective
for Lithuania? What are the main characteristics of the Lithuanian financial sector?
The answers to these questions are not so simple. The situation in the banking system of
each Member State is different. The differences between the bank assets (loans, securities)
and bank supervision as well as transformation peculiarities also exist. The new banking
system is to provide the possibility to measure and compare banking activities. A supranational
supervisory institution can also more efficiently harness the emergence of the so-called
“financial nationalism”, where the national supervisory institutions seek to restrict home bank
loans to foreign entities.

226
Source: Obserwatorfinansowy. K.Kozlovska. Unia bankowa w intelektualnym koglu-moglu, 2012.
Fig. 3. The estimated share of foreign banks in the national banking systems (%)
The analysis of Lithuanian banking sector shows that it is not exceptionally specific. Like
other East European countries, Lithuania is dominated by foreign banks, which control 60 to
100% of its market (Fig. 3). On the one hand, the domination of foreign banks increases the
number of entities and theoretically promotes competition. On the other hand, foreign banks,
as a rule, are huge companies able to promote the consolidation process. Such banks can take
the dominating position in the market and significantly influence the performance of minor
banks. Less com competition within the banking sector is detrimented to economic growth.
Currently, Lithuania has seven commercial banks having the license issued by the Central Bank
of Lithuania.
The management of the banks is rather specific: about 90% of the operating banks, such
as Swedish SEB and Swedbank, Norwegian DNB and Danish Danske Bank, are managed by the
Scandinavian countries which are not members of the eurozone. They can influence the whole
system and cause problems to the public finances. If certain banks are not members of the
Banking Union and have their homes outside the eurozone, they will be treated as any other
bank in Lithuania and other eurozone countries. They would be covered by the EBU and have
Western Europe
Eastern Europe
10% 20% 30% 40% 50% 60% 70% 80%
90%100%
Netherlands
Italy
France
Germany Greece Portugal
Austria
Belgium
Spain
Belarus
Slovenia
Moldova
Hungary
Latvia
Poland
Macedonia
Serbia
Bulgaria
Romania
Czech Republic
Slovakia
Croatia
Lithuania
Bosnia and Herzegovina
Albania
Estonia

227
to obey the regimes established, specifically, the regime of the general supervision and
transformation. The European Central Bank will take over the supervision of the three largest
banks registered in Lithuania, i.e. SEB, Swedbank and DNB, and the Central Bank of Lithuania
will assist in the supervision. The same model is going to be implemented in other Baltic
States. The costs of the Banking Union’s entrenchment in Lithuania should be smaller than
those of other eurozone countries. The Scandinavian countries have special funds for deposit
insurance and bank transformation. In 2009, thirty banks in Denmark were transformed
without using taxpayers’ money (Verslo zinios, 2013).
Following the EC directions, Lithuania will have to establish a national bank
transformation institution responsible for that transformation. The latter will have the right to
control the failing or the failed banks, to take over the role of the shareholders or managers, to
transfer property and liabilities as well as to ensure the execution of contracts. The
transformation institution in settling banking problems will have to keep contacts with other
international transformation institutions operating in some Member States and outside the EU.
It has to be noted that the influence of the EU regulations on different countries should be
different. Lithuania will only have to modify and adapt regulation of its financial sector. Certain
regulations have already been embedded in the Law on the Bank of Lithuania and the Law on
Financial Stability (Valstybes zinios, 2004, 2009). The European Commission does not identify
the institution in charge of the transformation. Therefore, Lithuania can appoint that institution
on its own, e.g. the central bank, the institution for financial supervision or the management of
deposits security system etc. The EC, however, provides that the supervision institution (The
Central Bank of Lithuania) can be a transforming institution only if the transformation functions
are distinctly separated from the pursued supervisory functions.
The European Parliament and the EC Regulation No 606/2014 provide that every Member
State is obliged to have its national transformation fund to be financed from the banks ex ante
contributions and which shall be set up to transform banks provided the financial means of the
transformation institution are insufficient. Ex ante support criteria shall be regularly reviewed.
The Lithuanian banks are also supposed to pay ex ante contributions. This is the way to reduce
the possibility of the state’s financial involvement in the transformation procedure. Similarly,
the banks registered in Lithuania shall accumulate around EUR 116 million in that fund. But
when Snoras Bank collapsed in 2011, the depositors’ indemnity required over EUR 1 billion
(Verslo Zinios, 2013). It has to be noted that the established minimal values for Lithuania, with
small and highly centralised financial system, can be too low while there is no prohibition on
Member States increasing those values. Currently, these problems in Lithuania are solved at
the expense of the state budget. When Ukio Bankas went bankrupt, the taxpayers’ money was
used and that was not the fund’s money. The bankruptcies of both banks cost around LT 1
million of the taxpayers’ money. At the end of 2013, seven banks and seventy-four credit
unions deposited money in the deposits insurance fund which accounted for around EUR 1
million.

228
It is also important to set up a stringent security mechanism to prevent financing of the
general transformation fund from the national budget.
Source: authors’ construction
Fig. 4. Single Resolution Fund (SRF)
The money accumulated in the national transformation funds shall go to the Common
(main) Transformation Fund and it can only be used for the rescue of the country’s national
banks. Consequently, the Lithuanian fund money in the transitional period cannot be used to
finance the transformation or rescue of any Latvian or Estonian bank. The money from the
Germany’s transformation fund shall be assigned solely for the rescue of the banks of that
country. Each country shall rescue its banks on its own account. However, with each year
national responsibility shall decrease and the EU responsibility shall increase. After the eight
year long transitional period, the national departments will be merged into a single EU
transformation fund. That way, ever increasing portion of the money raised by each country
shall go to the fund in charge of the transformation of all the eurozone banks. The fund money
shall be used for the rescue of all the EU banks. Until the year 2026 as much as EUR 55 billion
will be raised by collecting 1% of all the bank deposits. It is officially acknowledged that the
Bank Transformation Fund will have the greatest influence on the largest European banks.
Also, it is common knowledge that the German banking system is composed of small and
medium-sized banks. That means that out of the total EUR 55 billion of the Common
Transformation Fund, 90% will be raised from the largest banks of the eurozone, which,
according to the data available by the EC, account for about 85% of all the assets of the EU
banking system. The banks with the assets smaller than EUR 1 billion and with less than EUR
300 million in deposits are referred to as small size banks, therefore, they shall pay only 0.3%
of the money raised for bailing out the failing banks, even though it accounts for about 1%
share of the assets of all the eurozone banks. Medium-sized banks, which store about 14% of

229
all the assets of the eurozone banks, shall contribute 9.7% to the Common Transformation
Fund. That means that the Germany’s small and regional saving banks, which account for the
largest share of the banking system, will pay only 1000 to 50 000 EUR to the Common
Transformation Fund annually. The conception of the Common Transformation Fund is based
on the idea that the bank contributions will largely depend on their size and risk profile.
Currently, the EU institutions do not disclose the amount of each country’ contribution to the
Common Fund of EUR 55 billion (Ambrazas T., 2014).
The eurozone and Banking Union membership are related to other commitments for the
international institutions. Lithuania will have to make its contribution to the European Stability
Mechanism (ESM) established in 2012. Its mission is to render financial aid to the eurozone
countries facing financial problems which threaten the eurozone stability. Lithuania’s
contribution is going to amount to EUR 280 million. The payment of that amount will be
distributed gradually within five years, i.e. EUR 56 million per year seeking to evade dramatic
effect on public finances (The Central Bank of Lithuania, 2014).
Table 1
The contributions of some EU member states to the ESM
Country Percentage of
contributions
(%)
Paid-in capital
(billion EUR)
Capital
subscription
(billion EUR)
Percent of GDP
(%, 2012)
Estonia 0.19 0.2 1.3 7.6
Latvia 0.24 0.2 1.7 7.6
Lithuania 0.35 0.3 2.5 7.6
Slovakia 0.82 0.66 5.8 7.6
Germany 27.15 21.7 190 7.2 Source: authors’ calculations
Some analysts regard it as extremely big costs of Lithuania’s accession to the eurozone,
others – as investment into the ESM and ECB capital. Lithuania, as other Member States, could
seek a proportional share of the profit of those institutions. During nine months of the year
2013, ESM earned around EUR 185 million profit due to the repayment of loans by Spain and
Ireland (Veidas, 2014). Lithuania’s contributions might be somewhat higher than those of
Estonia and Latvia while lower than that of Slovakia (Table 1). This policy tends to cause some
doubts about the morality of such contributions.
Conclusions
1. For Lithuania as well as for other EU Member States, the accession to the EU banking union
means transfer of important powers of the national state to the EU institutions. Regardless of
the above mentioned problematic aspects, it can be stated that only the actions on the
European level can ensure that the failing banks are transformed with minimal side effects and
coherently in compliance with equal rules.
2. The Lithuanian banking sector is not in any way specific. Like other East European
countries, Lithuania is dominated by foreign banks. On the one hand, that domination

230
increases the number of subjects and theoretically activates competition. On the other hand,
foreign banks, as a rule, are large companies which tend to promote the consolidation process.
Such banks can occupy a dominating position on the market and significantly influence the
operation of smaller banks.
3. The question whether all the problems related to the accumulation and use of the Common
Bank Transformation funds are solved, naturally arises. What about the problems resulting
from the situation that the Fund was pegged to the rules regulating the uses of national funds
first, and only then followed by the money transfer to the Common Transformation Fund?
Bibliography
1. Ambrazas, T. (2014). Finansiniai susitarimai pagal bendra banku pertvarkymo mechanizma.
Keletas probleminiu aspektu. (The Financial Agreements Based on Single Resolution
Mechanism). Justitia, 2014/79, p.14-29; Banko pertvarkymo teisiniai mechanizmai. (Legal
Mechanisms for Bank Resolution). Jurisprudencija, 21(1), pp. 89-114.
2. Aslund, A. (2013). 2008 – 2010 m. Rytu Europos finansu krizes pamokos. (The Lessons of
Eastern European Financial Crisis in 2008-2010). Pinigu studijos, 2011, Nr. 1, pp.78-85.
3. Baciulis, M. (2013). Support for financial institutions increases government deficits in 2012.
Upward impact of 0.4 pp GDP in the EU and 0.6pp in the euro area. Economy and finance.
Eurostat. Statistics in Focus. 10/2013, 22. April 2013. Retrieved:
http://epp.eurostat.ec.europa.eu/cache/ITY_ OFFPUB/KS-SF-13-010/EN/KS-SF-13-010-
EN.PD. Access: 11.09.2014.
4. Liikanen, E. (2012). Liikanen-Report. High-level Expert Group on Reforming the Structure of
the EU Banking sector. Final Report, Brüssel. Retrieved:
http://ec.europa.eu/internal_market/bank/docs/high-level_expert_group/report_en.pdf
[2013 06 10]. Access: 20.10.2014.
5. Blankart, Ch. B. (2011). Der Staat - ein "Lender of Last Resort"?: „Ringvorlesung: "Die
internationale Banken-, Kredit- und Finanzkrise: Analyse, Ursachen, Lösungen". (The State
as “Lender of the Last Resort”: the Study: “International Banks, Credits and Financial Crisis:
Analysis, Causes, Decisions“). Retrieved: http://lvb.wiwi.hu-
berlin.de/vwl/wtm2/ringvl/ringvlblankart. Access: 15.09.2014.
6. Euro ivedimo Lietuvoje 2015 m. kiekybinio poveikio salies ekonomikai vertinimas (2013).
(The Study of the Impact of Euro Introduction on the National Economy in Lithuania in
2015). Teminiu straipsniu serija, Nr.1. Retrieved:
http://www.lb.lt/kiekybinis__euro_tyrimas. Access: 12.11.2014.
7. Regulation (EU) No 806/2014 of the European Parliament and of the Council (2014). (It is
establishing uniform rules and a uniform procedure for the resolution of credit institutions
and certain investment firms in the framework of a Single Resolution Mechanism and a
Single Resolution Fund and amending Regulation (EU) No 1093/2010). Retrieved:
http://eur-lex.europa.eu/legal-content/EN/TXT/PDF/?uri=OJ:L:2014:225:FULL &from=EN.
Access: 08.12.2014.
8. Krimminger, M. (2006). Controlling Moral Hazard in Bank Resolutions: Comparative Policies
& Considerations in System Design (July-2006). Retrieved:
http://ssrn.com/abstract=1123224 [2013-06-02]. Access: 21.12.2014.
9. Lietuvos bankas: euro finansine nauda sieks apie 38 mlrd. Lt. (The Central Bank of
Lithuania: the Financial Benefit Will Reach LT 38 BILLION). Retrieved:
http://vz.lt/article/2014/2/6/lietuvos-bankas-euro-finansine-nauda-sieks-apie-38-mlrd-lt.
Access: 10.24.2014.
10. Lietuvos Respublikos banku istatymas (2004). (The Republic of Lithuania Law on Banks)
Valstybes zinios, Nr.54-1832.

231
11. Lietuvos Respublikos finansinio tvarumo istatymas (2009). (The Republic of Lithuania Law
on Financial Stability). Valstybes zinios, Nr. 93-3985.
12. Miskinis, A., Cipkute, E. (2012). Assessing the Application of Securitisation in Lithuania,
Ekonomika, 91 (3), pp.72-84.
13. Kozlovska, K. (2012). Unia bankowa w intelektualnym koglu-moglu (Intellectual Reflection
on the Banking Union). Obserwatorfinansowy. Retrieved:
http://www.obserwatorfinansowy.pl/tematyka/bankowosc/unia-bankowa-w-
intelektualnym-koglu-moglu/ Access: 10.28.2014.
14. Senavicius, V. (2012). Europos Sajungos viesosios politikos tendencijos banku sektoriuje.
(The Public Policy Trends of European Union in the Banking Sector). Viesoji politika ir
administravimas, 11(1), p.405-416.
15. Council Regulation (EU) No 1024/2013 (2013). (It is conferring specific tasks on the European
Central Bank concerning policies relating to the prudential supervision of credit institutions).
Official Journal of the European Union, L 287, 29.10.2013.
16. Veidas (2014). Prognozes (Forecasts), Nr. 52.
17. Verslo zinios (2013). (Business News), Nr. 12.20.
18. Weiss, S., Hoffman I. (2012). Die Union gegen die Banken. Bertelsman Stiftung. (Union
Against Banks. Bertelsman Fund). Retrieved:
http://aei.pitt.edu/39400/1/BS_Spotlight07_DE_web.pdf Access: 11.11.2014.

232
ASSESSMENT OF THE GOVERNMENT DEBT POSITION IMPACT ON THE
GENERAL TAXATION POLICY
Nadezhda Semjonova , Mg.oec;
Riga Technical University
Abstract. During recent financial crisis number of researchers investigated mutual influence
of government debt on the fiscal policy. The present paper contributes to this topic by
observational analysis of the world economics, having the goal to evaluate correlation between
the value of debt and tax policy indicators over the recession period. The paper analyses public
data on 176 countries, extracted from the IMF and the World Bank databases. The findings
demonstrate general absence of correlation between the volumes of the state debt and the
amounts of the collected taxes both in short-term and long-term perspective. This implies that
world countries tend to increase debt and use refinancing to pay debt service costs to keep
taxes at the present level at all costs.
Key words: government debt, tax policy
JEL code: H63, H68
Introduction
Reicher (Reicher, 2014) indicated that literature on systematic fiscal policy and
macroeconomic performance in industrialized countries is large but fragmented. The empirical
literature points toward strong anticyclical policy, which consists of procyclical tax revenues,
acyclical tax rates and government purchases, and countercyclical transfer payments.
Consolidation in response to the debt has come primarily through adjustments to taxes and
possibly purchases. Large governments usually are associated with reduced macroeconomic
volatility. Meanwhile, the theoretical literature on anticyclical fiscal policy has turned from
focusing mostly on government purchases and tax rates toward transfer payments, although
quantitative link between theory and empiric data still is poor.
Díaz-Giménez, J., Giovannetti, G., Marimon, R., & Teles, P. (Díaz-Giménez et al., 2008)
considered fiscal discipline as a precondition for price stability, mentioning such rationale
behind the Growth and Stability Pact in Europe. The underlying policy debate shows the
concern regarding a time inconsistency problem associated with high levels of nominal debt
Corresponding author. Tel.: + 371 67089015; fax: + 371 67089345.
E-mail address: [email protected]
Proceedings of the 2015 International Conference “ECONOMIC SCIENCE FOR RURAL DEVELOPMENT” N037
Jelgava, LLU ESAF, 23-24 April 2015, pp. 232-240

233
that could be monetized. This model is describes the optimal sequential choice of monetary
policy in economies with either nominal or indexed debt.
During recent financial crisis, researchers investigated some effects of government debt
interaction with the fiscal policy. Klaus (Klaus, 2011) emphasised the fact that larger
government debt gives rise to larger risks to the fiscal budget and to the tax rate. This, in
turn, has important implications for optimal debt dynamics. In particular, it provides incentives
to reduce government debt over time to reduce budget risk (provided the initial debt level is
positive). As a result, debt dynamics deviates from random walk behaviour toward a second-
order approximation to optimize policy. Typical analyses assume passive fiscal behaviour that
couples higher government spending with an equivalent increase in lump-sum taxes to pay for
the spending, and active monetary policy (see, for example, Gali et al., 2007; Monacelli and
Perotti, 2008). Contrary to above approach, Davig & Leeper (Davig & Leeper, 2011) estimated
Markov-switching policy rules for the United States and found that monetary and fiscal policies
fluctuate between active and passive behaviour. Some authors are creating data sets for
deeper analysis in the Eurozone area. For instance, the policy modelling, displayed in Paredes J
et al. (Paredes at al., 2014), analyses fiscal and monetary consequences and points out that
the most recent crisis had the largest negative impact on total government revenues. Indeed,
in a historical period, which covers a number of economic downturns in the 1980s, in the mid-
1990s, in the 2000s and the most recent crisis, only the latest, also called by researchers
Great Recession, caused total government revenues of Euro zone countries to enter into
negative territory in nominal terms. Kirsanova, T. and Wren-Lewis, S. (Kirsanova at al., 2012)
analysed the impact of different degrees of fiscal feedback on debt when monetary policy is
determined optimally, rather than following a simple rule. Recent studies indicate that fiscal
and monetary policy regimes are not fixed over time and hence fiscal and monetary rules
equations should be estimated within a stochastic framework (Cevik at al., 2014; Favero and
Monacelli, 2005; Takero et al., 2012; Dewatcher and Toffano, 2011; Ito et al., 2011). For
Latvian realities, tax policy is considered separately from debt policy problems. For example,
S.Stucere and G.Mazure (Stucere and Mazure, 2013) analyzed tax policy as fundamental
instrument for investment promotion affecting the economic competitiveness. This research
was aimed on the analysis of basic socio-economic development indicators and the application
of immovable property tax. Some aspects of budget policy and state debt were analysed by
E.Zubule (Zubule, 2012) and S.Eglite (Eglite, 2006). N. Semjonova (Semjonova, 2012)
explored the correlations between public debt and average debt interest rate, taxation rate and
long-term growth (evaluated as GDP in 2011 in comparison to 2003).
The aim of the present research is to evaluate correlation between the value of debt and tax
policy indicators over the recession period. The corresponding tasks are to analyse correlation
between accumulation of the government debt, changes in the average tax rate and debt
service costs both in short-term and long-term perspective.

234
Data and methodology
The object of the research is the world countries economies. The research used public data
on 176 world countries from the IMF and the World Bank databases (World Economic Outlook
Databases, 2013, World Bank Open Data, 2013). Selection of these 176 countries was made
owing data availability: countries with no data were censored out. The analysis covered period
from 2003 to 2011.
The paper analyses the following indicators that characterize current economic situation and
allow evaluate long-term growth tendencies:
- D/Y - government debt to GDP ratio in 2003 and 2011;
- T - collected taxes to GDP ratio in 2003 and 2011;
- b - debt service costs share of the collected taxes in 2003 and 2011;
- T – long-term changes of the collected taxes, calculated as difference between T2011
and T2003;
- D/Y - long-term changes of the government debt to GDP ratio, calculated as difference
between D/Y 2011 and D/Y 2003.
While analysing taxes, one did not take into account the social insurance payments.
All 176 countries were broken down into six regions and two categories. Grouping by
regions was based on geographic and cultural closeness: Western Europe; Eastern Europe and
Central Asia (former CIS countries); South and East Asia and Pacific; Middle East and North
Africa; Sub-Saharan Africa; Latin America and Caribbean. The greatest world economies (USA,
Canada, Germany, France, Italy, UK, Spain, Japan and Korea) formed the G9 category. The
last category included the most significant players on the international debt market, whose
debts are indicated by the “Debt Clock” service: G9 plus Argentina, Australia, Brazil, China,
Greece, India, Ireland, Mexico, Portugal, Russia, Saudi Arabia (World Debt Clock, 2014).
The correlations between the value of state debt and other indicators were evaluated by
means of Pearson correlation coefficient. The statistical significance of the correlation
coefficient was tested using Student’s criterion with the level of significance α =0.05. Although
scatter diagrams were analysed as well, this paper presents only some most interesting
examples.
Research results and discussion
The topic of the present research is the relationship between the state debt policy and the
tax policy. The main question is whether the states increase their debts to reduce tax burden
and minimize distortional effect of taxes on economy. The USA is a typical example of such
behaviour (Martin, 2009).
Table 1 summarizes data on correlation between the volumes of the state debt and
collected taxes, broken down by world regions. The existence of negative correlation could

235
indicate, that, indeed, “low tax countries” tend to borrow more, and thus, have higher level of
the state debt.
Table 1
Correlation coefficients between collected taxes and the value of the government
debt (T - D/Y)
Group of countries Correlation with debt in
2003
Correlation with debt in
2011
G9 -0.23 (P=0.56) -0.19 (P=0.62)
“Debt Clock” countries -0.26 (P=0.31) 0.06 (P=0.83)
South and East Asia and Pacific -0.46 (P=0.05) -0.29 (P=0.26)
Western Europe 0.23 (P=0.19) 0.18 (P=0.31)
Eastern Europe and Central Asia -0.43 (P=0.29) 0.02 (P=0.95)
Latin America and Caribbean 0.30 (P=0.20) 0.50 (P=0.03)
Middle East and North Africa 0.65 (P=0.04) 0.15 (P=0.68)
Sub – Saharan Africa
Seychelles and Lesotho excluded
-0.31 -0.75
(P=0.23) (P=0.00*)
0.51 0.05
(P=0.04) (P=0.85)
Whole world -0.05 (P =0.72) 0.13 (P =0.17) Source: author’s calculations based on the World Bank data *P is < 0.005
Analysis of Table 1 data demonstrates that for the whole world there is no correlation
between volume of the state debt and collected taxes: the correlation coefficient is close to
zero and corresponding P-value is high. Graphic evaluation by the scattering diagram (Figure
1) leads to the same conclusion.
0
10
20
30
40
50
60
0 50 100 150 200 250
T, %
D/Y, %
2003
Malta
Japan
0
10
20
30
40
50
60
0 50 100 150 200 250
T, %
D/Y, %
2011
Japan
Fig.1. Correlation between collected taxes and government debt, world data
Nevertheless, while analysing situation by regions, one have observed statistically
significant correlation between the debt and taxes in some regions. First example is Sub –
Saharan Africa region, where, after exclusion of the two obvious outliers, Seychelles and
Lesotho, strong negative correlation exists for the year 2003 data (Figure 2). It is remarkable
that the correlation disappears in 2011. This could be linked to the debt relief initiative, from

236
which many Sub – Saharan Africa countries benefited between 2003 and 2011 (Debt Relief...,
2013).
0
5
10
15
20
25
30
35
40
0 50 100 150 200 250
T, %
D/Y, %
2003
Seychelles
Lesotho
0
5
10
15
20
25
30
35
40
0 20 40 60 80 100
T, %
D/Y, %
2011
Seychelles
Fig.2. Correlation between collected taxes and government debt for Sub-Saharan
Africa region
Moderate negative correlation existed in 2003 in the South and East Asia and Pacific region,
although there was no correlation in 2011.
Moderate positive correlation appeared in 2003 in the Middle East and North Africa region
and in 2011 in the Latin America and Caribbean region, the scatter diagrams for the latter are
presented in Figure 3. Such a positive correlation could indicate the attempts of these region
countries to keep up with the debt by they own.
0
5
10
15
20
25
30
0 50 100 150 200
T, %
D/Y, %
2003
Nicaragua
0
5
10
15
20
25
30
0 50 100 150 200
T, %
D/Y, %
2011
Trinidad
Fig.3. Correlation between collected taxes and government debt for Latin America
and Caribbean region

237
With the increment of the government debt, the debt service costs increases, too. Thus, the
share of the collected taxes to be spent on debt service has to increase. Generally, this is true
for the world economics, which demonstrated significant positive correlation between taxes
share, spent to the debt service and debt itself (Table 2).
Table 2
Correlation coefficients between debt service costs share from the collected taxes
and the value of the government debt (b-D/Y)
Group of countries Correlation with debt in
2003
Correlation with debt in
2011
G9 0.68 (P=0.05) 0.84 (P=0.01)
“Debt Clock” countries
Brasilia and India excluded
0.56
(P=0.01)
0.45
0.90
(P=0.07)
(P=0.00)
South and East Asia and Pacific
Japan and Singapore excluded
0.31
0.68
(P=0.23)
(P=0.01)
0.23
0.56
(P=0.37)
(P=0.03)
Western Europe 0.76 (P=0.00*) 0.77 (P=0.00*)
Eastern Europe and Central Asia 0.80 (P=0.02) 0.78 (P=0.01)
Latin America and Caribbean 0.58 (P=0.01) 0.69 (P=0.00*)
Middle East and North Africa 0.87 (P=0.00*) 0.91 (P=0.00*)
Sub – Saharan Africa 0.21 (P=0.41) 0.51 (P=0.04)
Whole world 0.51 (P =0.00*) 0.54 (P =0.00*) Source: author’s calculations based on the World Bank data *P is < 0.005
Nevertheless, this correlation appeared non-significant in some regions. Detailed analysis
demonstrated that such result is due to influence of some individual countries. For example in
the “Debt Clock” group (Figure 4), Brasilia and India have relatively small debt (about 66%)
but spend nearly 24% of the collected taxes for the debt service. Such a high expenditures
could appear due to low credit reputation of these countries.
0
5
10
15
20
25
30
35
40
0 50 100 150 200
b, %
D/Y, %
2003
Japan
Brazilia
India Argentina
0
5
10
15
20
25
30
0 100 200 300
b, %
D/Y, %
2011
Japan
Brazilia
India
Fig.3. Correlation between debt service costs (in % from the collected taxes) and
government debt for the “Debt Clock” countries

238
In turn, Japan and Singapore (in South and East Asia and Pacific region) have debt of 230%
and 105% of GDP, correspondingly, but spend only 16% and 0.01% from the collected taxes
to pay debt service.
In both considered cases, exclusion of the “outlying” countries from consideration bring
correlation coefficient between the share of the taxes that is spent on the debt service, and the
debt itself back to the significance.
Non-significant correlation in Sub–Saharan Africa in 2003 may indicate absence of the
sustainable debt policy in the region that finally led to the necessity to implement debt relief
initiative.
Another important question is whether the state increases the taxes to cope with the
increased debt corresponding service costs. Table 3 shows correlation between long-term
changes in the average tax rate and long-term change of the state debt over the period from
2003 to 2011.
Table 3
Correlation coefficients between long-term changes in the average tax rate and the
value of the government debt (D/Y – T)
Group of countries Correlation with debt
G9 0.44 (P=0.24)
“Debt Clock” countries -0.28 (P=0.28)
South and East Asia and Pacific -0.11 (P=0.68)
Western Europe 0.10 (P=0.60)
Eastern Europe and Central Asia 0.17 (P=0.71)
Latin America and Caribbean -0.19 (P=0.48)
Middle East and North Africa 0.22 (P=0.61)
Sub – Saharan Africa -0.22 (P=0.50)
Whole world -0.16 (P=0.13) Source: author’s calculations based on the World Bank data
The absence of correlation for the whole world and each group/region clearly demonstrates
that countries do not increase taxes in response to the increment of the state debt. Instead,
they could use other means, such as debt restructuring or re-financing.
Conclusions
1. There is no correlation between the state debt and the amounts of the collected taxes in
the whole world and in the major part of the world regions. Besides, in Latin America and
Caribbean region in 2011 countries with higher debt had higher level of taxes.
2. There is a significant moderate positive correlation in the world between the part of the
collected taxes, that states spend on debt service. Absence of such correlation for some
regions is due to influence of few countries that could be treated as exceptions.

239
3. There is no correlation between long-term changes of the state debt and corresponding
long-term changes in the average tax rate both in the whole world and in the each
considered region.
4. Observed behaviour implies that the world countries tend to increase debt and use
refinancing or re-borrowing to pay debt service costs to keep taxes at the present level,
possibly to prevent social tension.
Bibliography
1. Cevik, Emrah I., Dibooglu, S., Kutan, Ali M. (2014) Monetary and Fiscal Policy
Interactions: Evidence from Emerging European Economies, Journal of Comparative
Economics, Volume 42, pp. 1079-1091.
2. Davig, T., Leeper, Eric M., (2011), Monetary–Fiscal Policy Interactions and Fiscal Stimulus
European Economic Review, Volume 55, Issue 2, pp. 211-227.
3. Debt Relief under the Heavily Indebted Poor Countries (HIPC) Initiative. IMF Factsheet.
Retrieved: http://www.imf.org/. Access: 10.09.2013
4. Dewatcher, H., Toffano, P., (2011) Fiscal Activism and the Cost of Debt Financing
International Jornal of Finance & Economics, Volume 17, pp. 14–22.
5. Díaz-Giménez, J., Giovannetti, G., Marimon, R., & Teles, P. (2008). Nominal Debt as a
Burden on Monetary Policy. Review of Economic Dynamics, Volume 11(3), pp. 493-514.
6. Favero, Carlo A., Monacelli, T. (2005) Fiscal Policy Rules and Regime (In) Stability:
Evidence from the U.S., Working Paper No. 282, IGIER (Innocenzo Gasparini Institute for
Economic Research), Bocconi University.
http://EconPapers.repec.org/RePEc:igi:igierp:282/ Access: 10.11.2014
7. Gali, J., Lopez-Salido, J.D., Valles J. (2007) Understanding the Effects of Government
Spending on Consumption, Journal of the European Economic Association, Volume 5 (1),
pp. 227–270.
8. Ito, A., Wanatabe, T.,, Yabu, T. Fiscal Policy Switching in Japan, the US, and the UK
Journal of the Japanese and International Economies, Volume 25 (2011), pp. 380–413
9. Kirsanova, T. and Wren-Lewis, S. (2012), Optimal Fiscal Feedback on Debt in an Economy
with Nominal Rigidities. The Economic Journal, Volume 122, pp. 238–264.
10. Klaus, A. (2011) Government Debt and Optimal Monetary and Fiscal Policy, European
Economic Review, Volume 55, pp. 57-74.
11. Martin, F. M. (2009) A Positive Theory of Government Debt. Review of Economic
Dynamics. Journal of Monetary Economics, Vol. 12, pp. 608-631.
12. Monacelli, T., Perotti, R. (2008). Fiscal policy, wealth effects, and markups. NBER Working
Paper No. 14584. http://www.nber.org/papers/w14584/ Access: 05.11.2014
13. Paredes, J., Pedregal, Diego J., Pérez, Javier J. (2014) Fiscal Policy Analysis in the Euro
Area: Expanding the Toolkit Journal of Policy Modelling, Volume 36, Issue 5, pp. 800-823,
14. Reicher, C. (2014). Systematic Fiscal Policy and Macroeconomic Performance: A Critical
Overview of the Literature. Economics: The Open-Access, Volume 8, pp.1-37.
15. Stucere S., Mazure G. (2013) Application of Immovable Property Tax in the Regions of
Latvia. Economic Science for Rural Development’ 2013. Vol. 30, pp.182-189.
16. Takero, D., Takeo, H., Tatsuyoshi, O., 2012. Japanese Government Debt and Sustainability
of Fiscal Policy, NBER Working Paper Series. http://www.nber.org/papers/w17305/ .
Access: 02.01.2014
17. World Bank Open Data. Retrieved: http://data.worldbank.org/. Access: 05.11.2013

240
18. World Debt Clock. Retrieved: http://www.usdebtclock.org/world-debt-clock.html. Access:
02.01.2014
19. World Economic Outlook Databases. Retrieved: http://www.imf.org/. Access: 05.11.2013
20. Eglite, S. (2006). Fiskalas un monetaras politikas piemerosana Latvijas ekonomikas
attistiba. Promocijas darba kopsavilkums, Riga. Latvijas Universitate. (Application of Fiscal
and Monetary Policies during Development of Latvian Economy. Thesis)
21. Semjonova, N. (2012). Valsts parada ietekme uz noteiktiem ekonomiskiem raditajiem ES valstis. Economics & Business, Volume 25, pp. 68-73 (Government Debt Influence on Some
Economic Indicators in EU countries)
22. Zubule, E. (2012). Valsts budzeta procesa analize un pilnveidosana. Promocijas darba
kopsavilkums, Rīga. Latvijas Universitāte. (State Budget Process Analysis and
Improvement. Thesis)

241
Proceedings of the 2015 International Conference “ECONOPMIC SCIENCE AND RURAL DEVELOPMENT” No37
Jelgava, LLU ESAF, 23-24 April 2015, pp. 241-250
FOREIGN DIRECT REAL ESTATE INVESTMENTS IN LATVIA IN THE
CONTEXT OF THE DEVELOPMENT OF THE NATIONAL ECONOMY
Linda Kauškale1*, Mg.oec, Ineta Geipele2, Prof., Dr. oec.
1,2Institute of the Civil Engineering and Real Estate Economics. Faculty of Engineering
Economics and Management, Riga Technical University
Abstract. Real estate investing has a major role in the development of each country.
Nowadays, in the context of increasing globalization level, one of the most important objects of
the analysis is the foreign direct investment in real estate. The investment multiplier effect in
the real estate market is also very important, as the real estate market and construction
industry investments are approaching also other sectors, which is in turn increasing the gross
domestic product. The aim of the study is to analyze foreign real estate investments in Latvia,
by examining a number of scientific and practical aspects associated with this matter. The
statistical data analysis, comparative and logically constructive methods have been used in the
study. The importance of this matter and the direction of future researches have been defined.
The study also provides recommendations for branch regulation planning.
Key words: real estate investments, FDI, real estate market, construction development,
fiscal policy.
JEL code: E22; F21; F62; R30
Introduction
Real estate investments are one of the most popular types of investments. The total impact
of the foreign direct investments on the overall development of the country has been analysed
in the study. The aim of the research is to analyze foreign direct real estate investment
development tendencies in Latvia, by examining a number of scientific and practical aspects
associated with this issue as well as by defining their impact on the national economy. The
object of the research is the real estate market of Latvia. The statistical data analysis,
comparative and logically constructive methods have been used in the study. The importance
of this matter and the direction of future researches have been defined as well. The study also
provides recommendations for branch regulation. In the course of the study, it has been also
observed that the increase in the price level of the real estate objects is also related to the
increase in the foreign real estate direct investing. The importance of the study is also
determined by the fact that the study of investment is of great importance for the
understanding of the business cycles and economic activity (House, 2014).
* Corresponding author. Tel. +371 29963349. E-mail [email protected]

242
1. Theoretical Aspect Overview
It should be noted that the economies of several countries are interrelated, and the increase
in the foreign direct investing can be observed in many countries and regions. The interrelation
of investment flows and real estate market is being determined by the following major aspects
(Vanags, 2007):
• investment relationship with the real estate development process;
• dominant role of the real estate in business and its expansion;
• crucial role of land in agricultural production and construction, business expansion;
• significance of investments in the construction industry;
• impact of the state economic policy on the investment flow and real estate markets as
well as other aspects.
Fiscal policy of government plays a great role in regulating investment inflows and outflows.
By analysing Hungary, Latvia, Lithuania, Poland and Romania, for the period 2000-2010, the
strong support has been defined for the conjecture, which states fiscal policies are
determinants for FDI and fiscal competition between governments for FDI is a business
environment, which is determined primarily by fiscal policy (Göndör and Nistor, 2012).
Measuring the effects of discretionary fiscal policy is both difficult and controversial (Bouakez,
Chihi, and Normandin, 2014). At the same time a more countercyclical fiscal policy significantly
enhances output growth in more financially constrained industries, in which counterparts are
more dependent on external finance or display lower asset tangibility (Aghion, Hémous, and
Enisse Kharroubi, 2014).
Investment volumes in the country also affect the interest rates and capitalization rates.
Changes in monetary policy affect the conditional mean of the short-term interest rate which in
turn affects macroeconomic variables such as output, employment, and inflation (Gust and
López-Salido, 2014). A variety of internal and externals factors affects investment decision-
making, and one of the most important are provisional results of calculations before making a
decision. The choice of capitalization rate is important procedure - a slight change, increasing
or decreasing, of the capitalization rate corresponds to significant inverse variations in the
estimations (Manganelli, Morano, and Tajani, 2014). Real estate needs effective management
in order to generate income in a greater degree than other assets and at the same time
(Asaul, 2004):
• real estate is a fairly complicated product as an investment object for most investors;
• it can be the object of investment, allowing to derive more profit for investors with
sufficient knowledge in the field of real estate management.
The study of the foreign direct investments should involve also the consideration that
several phenomena have both positive and negative effects. In practice, different influences on
real estate market and construction sector are observed – at macro level (country and
industry), at mezzo level (projects and enterprises) and at micro level - project and
organization level (Tamosaitiene, Zavadskas, and Turskis, 2013). Both positive and negative

243
effects of FDI are obvious. FDI may be considered as a catalyst to business creation, especially
in combination with governance strength, by attracting desirable types of FDI (Herrera-
Echeverri, Haar, and Estevez-Breton, 2014). The estimated returns of FDI inflow in a host
country are technology diffusion, capital accumulation, intellectual property transfer, know-
how, acquisition of managerial experience and others (Temiz and Gökmen, 2014). It is
important to mention that FDI can have an impact on the economic growth also by affecting
technology transfer, mostly when an absorption capability of advanced technologies exists in
the national economy (Borensztein, Gregorio, and Lee, 1998). It has also been researched
(Aurangze and Borsa, 2014) that the countries with higher levels of FDI inflows have higher
factor-productivity in the export sector in comparison with the countries with low FDI inflows
and export-oriented policies play an important role during the development process.
At the same time, it is suspected that FDIRE may have a side effect of overheating the real
estate market (Hui and Chan, 2014). There are different versions about causes of real estate
market overheat. McDonald and Stokes (2013) divide real estate market bubbles reasons to
four parts – unsound lending practices created by financial sector, complex mortgage-backed
securities, the shadow banking system that relied on high degrees of financial leverage and
short-term borrowing as well as other reasons. Also if globalization actually increases within
and between countries, as diverse range of exports, inequality above moderate levels may cut
world aggregate demand and thereby world economic growth by rising world inequality and
slower world growth (Wade, 2004), so international contagion risks exists among real estate
markets requires international cooperation among financial regulators (Hatemi-J, Roca, and Al-
Shayeb, 2014). As FDI has the potential to provide both positive and negative macroeconomic
effects for the recipient countries, it is extremely difficult theoretically to predict the respective
degree of these countervailing effects, and therefore the empirical researches have to be made
(Iwasaki and Tokunaga, 2014).
Long-term investor experience is better to be captured by compounding short-term returns
in order to obtain long-term buy-and-hold returns (Fama, 1998). The nature of investor
protection and regulation of financial markets in each country is deeply rooted in the legal
structure of each country and in the origins of its laws (Porta, Lopez-de-Silanes, Shleifer, and
Vishny, 2000). In addition, there are fundamental differences between small and large
enterprises, such as the difference between the size of company and corporate finance
practices - small enterprises are less sophisticated when it comes to evaluating risky projects
than large enterprises (Graham and Harvey, 2001). The advent of the real estate securitization
mechanism provides increased liquidity for traditional real estate investment (Lee, Chien, and
Lin, 2012). In investment flow analysis it is necessary also to analyse the factors affecting the
demand. The non-price factors affecting the demand are the following (Vanags, 2010):
a) increase or decrease in the income of the participants forming the household and other
market demands;
b) state monetary and fiscal policy;

244
c) changes in state demographic situation;
d) state regional policy;
e) location of saleable immovable product;
f) future expectations of potential buyers;
g) attitude of potential buyers to the environment and other factors.
Demand analysis has a great role in real estate valuation as well. A link between real estate
valuation and the current account deficit follows from fact that the growing deficit of the
current account is a signal of a growing gap between the spending of domestic residents and
their output. This was observed in both periods before and after the crisis of 2008-09
(Aizenman and Jinjarak, 2014). Economy in general has range of tasks, which should be
solved, and it is a complicated process. The compromise should be found and the priority
targets should be selected. Therefore, the economic policy regulation should also take into
account the needs of the society, which would at the same time contribute to the development
of the total construction industry and the real estate market.
2. Practical Research Part
By analyzing FDI in Latvia, it can be concluded that the amount of direct investment of the
EU countries substantially exceeds the amount of direct investment of any other group of
countries, and this predominance is presented in Figure 1 and can be observed in 2012 and
2013.
Source: author’s construction based on Eurostat Statistical Data
Fig.1. FDI data in Latvia by countries
By analyzing results of the construction industry and real estate market, which are
presented in Figure 2, it can be concluded that over the period from the second quarter of
2012 to the second quarter of 2014, the ratio of the real estate transactions in the total foreign
investments exceeds the foreign investments in the construction industry by approximately
two times, and in the analysed period they ranged from 11.93% to 13.29% of the total foreign
investments in the real estate sectors, so the ratio of the foreign real estate investing over the
analysis period has kept its positions. Since the development of the construction industry
creates new jobs, it is advisable to take measures to increase the level of construction
investments in order to develop this industry and the economy in general.

245
Source: author’s construction based on Latvian Bank Statistical Data
Fig.2. The share of construction industry and real estate operations in GDP of Latvia,
%
Figure 3 presents the FDI data by kind of activity and house price index in Latvia over the
period from 2006 to 2013. By analyzing information, it can be concluded that FDI in real estate
development dynamics in Latvia has substantially avoided the crisis in 2009, and after the
amendments to the Immigration Law, the real estate investing in Latvia has only increased.
Figure 3 presents that the house price index and FDI in real estate had similar development
trends in Latvia starting from 2010.
Source: author’s construction based on Latvian Bank and Eurostat Statistical Data
Fig.3. FDI data by kind of activity and house price index in Latvia
From the first quarter of 2010 to the first quarter of 2014 the foreign direct investments
grew by 95.41% - from EUR 744.26 million to EUR 1454.34 million (see Figure 4). The
purchasing power does not grow so rapidly as the real estate prices, which are influenced by
the foreign investing. From the first quarter of 2010 to the first quarter of 2014 the average
wages in Latvia have grown by 23.97%, the house price index of the new dwellings grew by
78.99% and the house price index of the existing dwellings grew by 20.74%. The largest
number of transactions has long been observed in Riga, Riga region and Jurmala (Geipele et
al., 2013). The State Land service data (2013) shows that these are the most demanded areas
in Latvia for foreign investors.

246
Source: author’s construction based on Latvian Bank and Central Statistical Bureau of Latvia Statistical Data
Fig.4. FDI in real estate operations and house price index for new and existing
dwellings in Latvia
In the context of price level changes, the existing dwellings are less affected, because the
foreign investors prefer new dwellings. The average wages in Latvia are also not increasing so
rapidly as the number of real estate purchases (see Figure 5).
Source: author’s construction based on Central Statistical Bureau of Latvia and a State Unified Computerised Land Register Statistical Data
Fig.5. Real estate deals and average salary in Latvia a State Unified Computerised
Land Register
Since 2009 all confidence indexes in construction of buildings, civil engineering and specialized
construction activities have been improved, but in 2014 confidence index in civil engineering
has reduced in comparison with the previous year. Confidence indicators in construction in
Latvia are presented in Figure 6.
Source: author’s construction based on Central Statistical Bureau of Latvia
Fig.6. Confidence indicator in construction in Latvia (balance, %)

247
GDP indicators in construction and real estate operations, changes of dwellings price index
and unemployment level are presented in Figure 7. From the first quarter of 2010, GDP
indicators in construction and real estate operations as well as dwellings price index have been
improved, and the unemployment level has been reduced, which was the positive development
tendency of national economy.
Source: author’s construction based on Central Statistical Bureau of Latvia
Fig.7. Real estate market and economic indicators in Latvia
GDP in real estate operations also has a cyclical development tendency. Market integration
indicator - Foreign Direct Investment (FDI) intensity index in the Baltic States - varies, and is
lower in post-crisis period than in 2005-2007. Market integration indicator – FDI intensity in
the Baltic States over the period from 2004 to 2013 is presented in Figure 8.
Source: author’s construction based on Eurostat Statistical Data Fig.8. Market integration - Foreign Direct Investment intensity - Average value of
inward and outward Foreign Direct Investment flows divided by GDP,
multiplied by 100
FDI intensity indicator is one of the market integration indicators, which also presents a
globalization level dynamics and Estonia has a leading position and highest FDI intensity level
among all Baltic countries.

248
Conclusions
1. In the current study, the positive and negative FDI effects on the national economy have
been reviewed as well as the practical research has been carried out, mainly focusing on the
situation in Latvia. The real estate market can solve a number of socio-economic problems,
so its importance is growing in the course of time.
2. Taking into account the fact that the investments in real estate market and construction
industry are of great importance, they also affecting a national economy development.
During the research period, the higher FDI volumes have been invested in real estate
operations. In consequence of the development of the construction industry, the new
working places are being created, so it is advisable to take measures in order to increase
the investments in the construction industry and to develop this industry and the economy
in general.
3. Fiscal policy should take into account a number of potential problems, analyze them from
different perspectives as well as review the specifics of the investment decision making.
Business representatives should regularly follow the development trends of the
macroeconomic indicators, including the consumer confidence index as well as the
confidence indexes in the industries, in which they are operating. In the further researches,
the fiscal policy regulation shall be analysed in more details and more countries shall be
involved.
Bibliography
1. A State Unified Computerised Land Register. Statistics. Retrieved:
http://www.zemesgramata.lv/stat/stat.asp. Access: 10.10.2014
2. Aghion, P., Hemous, D. & , Kharroubi, E. (2014). Cyclical Fiscal Policy, Credit Constraints,
and Industry Growth. Journal of Monetary Economics, Volume 62, pp. 41–58.
3. Aizenman, J. & Jinjarak, Y. (2014). Real Estate Valuation, Current Account and Credit
Growth Patterns, Before and After the 2008-9 Crisis. Journal of International Money and
Finance, Volume 48, Part B, pp. 249-270.
4. Asaul, A.N. (2004). “Экономика недвижимости” [Real Estate Economics]. Piter: Publishing
House “Piter”, p. 512.
5. Aurangze, Z. & Borsa, T.S. (2014). The Role of Foreign Direct Investment (FDI) in a
Dualistic Growth Framework: A Smooth Coefficient Semi-parametric Approach. Istanbul
Review, Volume 14, Issue 3, pp. 133-144.
6. Bank of Latvia. Statistical database. Retrieved: http://statdb.bank.lv/lb/default.aspx?lv.
Access: 02.11.2014
7. Borensztein, E., Gregorio, J. & Lee, J.W. (1998). How does Foreign Direct Investment
Affect Economic Growth? Journal of International Economics, Volume 45, Issue 1, pp. 115-
135.
8. Bouakez, H., Chihi, F. & Normandin, M. (2014). Measuring the Effects of Fiscal Policy.
Journal of Economic Dynamics & Control, Volume 47, pp. 123–151.
9. Central Statistical Bureau of Latvia. Statistic database. Retrieved:
http://www.csb.gov.lv/dati/statistikas-datubazes-28270.html. Access: 01.11.2014

249
10. Eurostat. European statistics database. Retrieved:
http://epp.eurostat.ec.europa.eu/portal/page/portal/statistics/search_database. Access:
02.11.2014
11. Fama, E.F. (1998). Market Efficiency, Long-term Returns, and Behavioural Finance. Journal
of Financial Economics, Volume 49, pp. 283—306.
12. Geipele, I., Kauskale, L., Lepkova, N., Liias, R. (2014). Interaction of Socio-economic
Factors and Real Estate Market in the Context of Sustainable Urban Development.
Proceedings of 9th International Conference on Environmental Engineering, MAY 22-24,
2014, Vilnius, Vilnius Gediminas Technical University Press, 2014. ISSN 2029-7092 online;
ISBN 978-609-457-640-9 / 978-609-457-690-4 CD.
13. Göndör, M. & Nistor, P. (2012). Fiscal Policy and Foreign Direct Investment: Evidence from
some Emerging EU Economies. Procedia - Social and Behavioral Sciences, Volume 58, pp.
1256 – 1266.
14. Graham, J.R. & Harvey, C.R. (2001). The Theory and Practice of Corporate Finance:
Evidence from the Field. Journal of Financial Economics, Volume 60, pp. 187-243.
15. Gust, C. & Lopez-Salido, D. (2014). Monetary Policy and the Cyclicality of Risk. Journal of
Monetary Economics, Volume 62, pp. 59–77.
16. Hatemi-J, A., Roca, E. & Al-Shayeb, A. (2014). How Integrated are Real Estate Markets
with the World Market? Evidence from Case-Wise Bootstrap Analysis. Economic Modelling,
Volume 37, pp. 137-142.
17. Herrera-Echeverri, H., Haar, J. & Estevez-Breton, J.B. (2014). Foreign Direct Investment,
Institutional Quality, Economic Freedom and Entrepreneurship in Emerging Market. Journal
of Business Research, Volume 67, pp. 1921–1932.
18. House, C.L. (2014). Fixed Costs and Long-lived Investments. Journal of Monetary
Economics, Volume 68, pp. 86–100.
19. Hui, E.C.M., Chan, K.K. (2014). Foreign Direct Investment in China’s Real Estate Market.
Habitat International, Volume 43, pp. 231-239.
20. Iwasaki, I. & Tokunaga, M. (2014). Macroeconomic Impacts of FDI in Transition
Economies: A Meta-Analysis. World Development, Volume 61, pp. 53–69.
21. Lee, C.-C., Chien, M.-S. & Lin, T.C. (2012). Dynamic Modelling of Real Estate Investment
Trusts and Stock Markets. Economic Modelling, Volume 29, pp. 395-407.
22. Manganelli, B., Morano, P. & Tajani, F. (2014). Risk Assessment in Estimating the
Capitalization Rate. WSEAS Transactions on Business and Economy, Volume 11, Issue 1,
pp. 199-208. E-ISSN: 2224-2899
23. McDonald, J.F. & Stokes, H.H. (2013). Monetary Policy, Mortgage Rates and the Housing
Bubble. Economics & Finance Research: An Open Access Journal, Volume 1, Issue 1, pp.
82-91.
24. Porta, R., Lopez-de-Silanes, F., Shleifer, A., Vishny, R. (2000). Investor Protection and
Corporate Governance. Journal of Financial Economics, Volume 58, pp. 3-27.
25. Tamosaitiene, J., Zavadskas, E.K. & Turskis, Z. (2013). Multi-Criteria Risk Assessment of a
Construction Project. Procedia Computer Science, Volume 17, pp. 129 – 133.
26. Temiz, D. & Gokmen, A. (2014). FDI Inflow as an International Business Operation by
MNCs and Economic Growth: An Empirical Study on Turkey. International Business
Review, Volume 23, pp. 145–154.
27. The State Land service (2013). Real Estate Market Overviews - The Influence of Foreigners
on Real Estate Market in Latvia [Ārvalstnieku ietekme uz nekustamā īpašuma tirgu
Latvijā]. Retrieved: http://www.vzd.gov.lv/lv/parskati-un-statistika/tematiskie-
parskati/nekustama-ipasuma-tirgus-parskati/. Access 03.11.2014
28. Vanags, J. (2007). Investments in Real Estate. Riga: RTU Publishing House, p. 178.
29. Vanags, J. (2010). Real Estate Economics. Riga; RTU Publishing House, p. 297.

250
30. Wade, R.H. (2004). Is Globalization Reducing Poverty and Inequality? World Development,
Volume 32, Issue 4, pp. 567–589.

251
Proceedings of the 2015 International Conference “ECONOMIC SCIENCE FOR RURAL DEVELOPMENT”, No37
Jelgava, LLU ESAF, 23-24 April 2015, pp. 251-257
PUBLIC INTERNAL CONTROL IN THE EUROPEAN UNION
Ivita Faitusa*, Mg.oec, PhD student
University of Latvia
Abstract. Public internal control differs from country to country as it has to fit into the
respective overall governance arrangements with the government and the supreme audit
institution as well as the accountability arrangements that exist between stakeholders. The aim
of this research is to find out common and different internal control elements in twelve
European Union (EU-12) countries. The tasks of this research are: to analyse revenue
indicators in the EU countries, to analyse internal control systems in the EU countries, to make
conclusions and to make proposals for further research tasks about the internal control of the
administration of Latvia and improvements of the internal audit systems. The methods of this
research are economic analysis (monograph) method and graphic method. The main results
from this research – not all of the countries interpret the concept of internal control in the
same way – some countries have special independent internal control institutions, in some
countries, decentralised system of internal control is embedded and forms an integrated part
of the administration. More and more countries also require top managers to apply systems for
managing or mitigation of the risk of not achieving set objectives. Almost all of the EU member
states have established internal audit function, but do not cover all systems of public
administration.
Key words: internal control, audit, public administration
JEL code: M42
Introduction
Reforms in European Union Member States public administration systems could be
explained by the objective need to adjust general reforms and could also be related to trends,
such as recognition of the need to manage risk since 2000. In this period, public internal
control system has developed into a widely used, integral and vital part of most governance
systems in Europe (Compendium..., 2014).
Internal accountability arrangements are also a determining factor, as is the content of
accountability of those responsible for carrying out public tasks. A distinction can be drawn
here between legal accountability for compliance with rules and regulations and managerial
accountability for the use of public resources to achieve goals. Budgeting and accounting
* E-mail [email protected], tel. +371 26141974

252
arrangements also have to be taken into account. The need to establish an internal control,
report on it, and apply a risk management approach can be set out explicitly in laws and
regulations or derived from existing legal basis. In decentralised systems, top managers have
to report on the functioning of the internal control systems. Many countries also require top
managers to apply systems for managing or mitigating the risk of not achieving the set
objectives (Compendium..., 2014).
The aim of this research is to find out common and different internal control elements in
twelve European Union countries.
The tasks of this research are: to analyse the revenue indicators in the EU countries, to
analyse the internal control systems in the EU countries, to make conclusions and to make
proposals for further research of the internal control of the public administration of Latvia and
improvements of the internal audit systems.
The methods of this research are economic analysis (monograph) method and graphic
method.
EU countries in taxation perspective
For illustration of differences in all European Union Member States author has compared
Member States tax revenue indicators.
In previous researches author has found government revenue as a one of indicators for
implementing internal audit systems in Latvia local governments.
The first effects of the global economic crisis were felt on revenues already in 2008 even
though in the European Union the annual growth turned negative only the following year —
growth slowed down substantially during the third quarter of 2008 and turned negative in the
last quarter.
The crisis and the measures of fiscal policy adopted in the European Union countries have a
strong impact on the level and composition of tax revenue in 2009–2013, although the first
effects had already become visible in 2008.

253
Source: DG Taxation and Customs Union, Eurostat
Fig. No.1 Tax revenue (including social contributions), 2011-2012, % of GDP
In 2012, tax revenues in percentage of GDP increased in 22 European Union Member
States.
In 2013, estimates from main aggregates of general government and quarterly data show
that tax revenues as a percentage of GDP are set to continue rising (Taxation Trends in the
EU…, 2014)
Author in previous researches has found for Latvia situation government revenue as a one
of indicators for implementing internal audit systems in Latvia local governments.
In this research, twelve European Union Member States since 2004 and 2007 have been
compared (Bulgaria, Cyprus, Czech Republic, Estonia, Hungary, Latvia, Lithuania, Malta,
Poland, Romania, Slovakia, and Slovenia).
Source: author’s construction based on Eurostat data
Fig. No.2 Total general government revenue, percentage of GDP

254
In fig. No. 2 is shown the total general government revenue, percentage of GDP: Lithuania
and Latvia have similar indicators, but Estonia has the first place of all Baltic States and Malta
has the highest level of total government revenue. All new countries, except Hungary and
Malta total general government revenue, are at the average of about 25% of GDP.
The tax-to-GDP ratio of Baltic states – Estonia, Latvia, and Lithuania (including the social
contributions), since 2007 Estonia has a higher ratio than the other Baltic States, and Latvia
has the lowest indicators except for the year 2012.
Source: author’s construction based on Taxation trends…, 2014
Fig. No.3 Development of tax revenues (tax-to – GDP%)
In the fig. No.3, the ratio in Estonia has decreased in comparison with the level of crisis
years (peak in 2009 at 35.4%). In comparing the performance of the Baltic States, in year
2012 the Lithuanian tax-to-GDP ratio (27.2%) was close to Latvia (27.9%).
Accession to the European Union has clearly been of fundamental importance for the way in
which the newest Member States have reformed their public administration in general and
their public internal control systems in particular. (Compendium..., 2014)
Like tax revenue indicators differences in all European Union Member States and similar
closed indicators in Baltic States internal control systems in public administration show similar
picture.
Internal control and internal audit in EU member states
There are countries where administrative reforms have been aimed at fundamentally
devolving or decentralising central public powers (for example Italy and Spain). In other
countries reforms have been based in part of the view that some services that are delivered
today by non-public or partially competitive organisations (for example Sweden and United
Kingdom).
The most striking developments in public internal control components in Europe have
resulted from an increasing attention to objectives and performance management, to risks and

255
governance as a whole, including accountability, as well as to the quality of service delivery
and cost efficiency. These developments have led to the wide introduction international or
national standards; clearly defined legal basis and clearer mandates for control, internal audit
and- where it exists – financial inspection. The functional independence of internal auditors has
increased, and they are expected to deliver new or wider services, focusing on economy,
efficiency and effectiveness.
Internal accountability arrangements are also a determining factor, as is the content of
accountability of those responsible for carrying out public tasks. A distinction can be drawn
between legal accountability for compliance with rules and regulations, and managerial
accountability for the use of public resources to achieve goals. Budgeting and accounting
arrangements also have to be taken into account. The need to establish an internal control,
report on it, and apply a risk management approach can be set out explicitly in laws and
regulations or derived from existing legal basis. In decentralised systems, top managers have
to report on the functioning of internal control systems. Many countries also require top
managers to apply systems for managing or mitigating the risk of not achieving the set
objectives. (Compendium..., 2014)
Not all countries interpret the concept of internal control in the same way – some countries
have special independent internal control institutions, in other countries decentralised internal
control system is embedded, and forms an integrated part of the administration. The need to
establish an internal control, report, on it, and apply a risk management approach can be set
out in regulations and laws or derived from existing legal basis. Some European Union
countries also require top managers to apply systems for managing or mitigation the risk of
not achieving set objectives (Compendium..., 2014)
Almost all European Union member states have established internal audit function, but do
not cover all systems of public administration. Internal auditors use formal and informal ways
to achieve a relevant level of coordination and harmonisation. Traditional compliance and
financial audits are increasingly supplemented by various consultancy services and audits of
performance that require a professional and well trained internal audit staff. Some of the
member states have established audit boards or audit committees. The coordination and
harmonisation of the internal control and internal audit in the public sector at large or in the
government sector is achieved through many different means (Compendium..., 2014).
There are not many comparable internal control indicators for all 12 European Union
member states because of the different ways and systems of internal control and internal audit
approaches.
Internal control and internal audit systems in 12 European Union countries were established
in a period of three years:
2000- Latvia, Malta;
2001- Bulgaria, Estonia, Lithuania, Slovakia;
2002- Poland, Romania, Slovenia;

256
2003- Hungary, Check Republic, Cyprus.
Internal control and internal audit systems were one of the major elements for pre-
accession in the European Union. All these countries joined the European Union in 2004,
except Bulgaria and Romania, which joined the European Union in 2007.
All Baltic States established an internal audit system almost simultaneously in 2000 and
2001.
Audit activity of an effective public sector
European Union Member States are in different situation with internal audit implementation,
internal audit system in public sector.
Future plans for some countries are stated (Compendium..., 2014): reforms in public
administration or public internal control system, decisions to establish reporting, accounting,
internal control and audit systems at regional/local government levels or for non-public/partly
public services, with the ambition of ensuring and equal level of protection, transparency and
effectiveness, irrespective of where public resources are spent (Estonia, Lithuania, Romania).
Estonia, Lithuania, and Hungary are going to introduce systematic quality assessments, quality
monitoring (review systems). The Czech Republic, Latvia, and Slovakia plan to simplify the
streamline control and audit systems within the government sector, but also in other parts of
the public sector.
Public sector audit activities must be configured appropriately to enable public sector
organisations to fulfil their duty to be accountable and transparent to the public while
achieving their objectives effectively, efficiently, economically, and ethically.
Author fully agrees that nine key elements of an effective public sector audit activity (IIAs
2010 Global Audit Survey – 13500 responses around the world): are comprehensively
1) Organizational independence;
2) Formal mandate;
3) Unrestricted access;
4) Sufficient funding;
5) Competent leadership;
6) Objective staff;
7) Competent staff;
8) Stakeholder support;
9) Professional audit standards (Supplemental guidance..., 2012).
The opinion of the author of the paper is that in Latvia some political influence to
organizational independence in internal audit function is the key factor for the law added value
of our internal audit in public sector institutions.
Latvia legislation rules require a certification for audit function leaders and experience in
internal audit field. Changing of the internal audit function staff cannot provide a competent
and objective staff. There is no summarised data about Certified Internal Auditors (CIA) in

257
Public administration, but there are two internal auditors Certified Government Audit
Professional (CGAP).
Conclusions, proposals, recommendations
1. Many countries also require top managers to apply systems for managing or mitigating
the risk of not achieving set objectives.
2. Not all of countries interpret the concept of internal control in the same way- some
countries have special independent internal control institutions, in some countries
decentralised internal control system is embedded and forms an integrated part of the
administration.
3. Almost all EU member states have established internal audit function, but do not cover
all systems of public administration.
4. Public sector audit activities must be configured appropriately to enable public sector
organizations to fulfil their duty to be accountable and transparent to the public while
achieving their objectives effectively, efficiently, economically and ethically.
5. The opinion of the author of the paper is that in Latvia some political influence to
organisational independence in internal audit function is the key factor for the law added
value of our internal audit in public sector institutions.
Bibliography
1. Compendium of the Public Internal Control Systems in the EU Member States.
Luxembourg: Publications Office of the EU, 2011, ISBN:978-92-79-19982-0.
Retrieved: http://ec.europa.eu/budget/library/biblio/publications/2011/compendium_27
_countries_en.pdf. Access: 17.12.2014
2. Compendium of the Public Internal Control Systems in the EU Member States. Second
edition, Luxembourg: Publications Office of the European Union, 2014, ISBN:978-922-
79-37868-3. Retrieved: http://ec.europa.eu/budget/pic/compendium/index_en.cfm.
Access: 17.12.2014.
3. MacRae E, Gils D. (2014) Nine Elements Required for Internal Audit Effectiveness in the
Public Sector. IIARF, Altamonte Springs, Florida, p.48
4. Supplemental guidance: The Role of Auditing in Public Sector Governance, 2nd edition.
Altamote Springs, FL, The IIA, January, 2012, p. 6-8.
5. Taxation trends in the European Union.(2014 edition), Taxation and Customs Union, EU,
2014, p.308

258
BUSINESS ANGELS – POSSIBILITY FOR EUROPEAN SMES
Alina Dibrova*, Master degree in finance economy (present)
University of Latvia
Abstract. Access to finance remains one of the top problems for SMEs in Europe, mainly
because of their high relevance on traditional bank loans. In this paper, the main
characteristics of European SMEs will be analysed. As one of the top problems for this class of
enterprises in European Union is access to finance - the paper will evaluate the possibilities of
Business Angels in solving this issue. The paper will also seek the answer of whether the
possibilities of Business Angels meet the financial needs of SMEs and what could be done in
order to enhance the positive outcome of their possible cooperation.
The main conclusion of the paper stands that while having a great potential to finance and
enhance the outcome of SMEs, so far, the performance of Business Angles had been rather
poor. The broad fragmentation of the market, the lack of unified terminology and the absence
of well-formed unified legislative base are highlighted as the main reasons for poor private
investments in European SMEs.
Key words: SME, Business Angels, alternative investment
JEL code: O16
Introduction
This paper will stress the problem of SME’s access to finance paying special attention to
one of the alternative financing opportunities – Business Angels. The author will look through
statistic data, reviews and publications in order to examine whether Business Angels can be
considered as worthwhile opportunity for financing SME’s.
Annual report of European SME’s 2013/2014, presented by the European Commission
on July 2014, claims, that Small and Medium‐sized Enterprises (SMEs) still form the backbone
of the European economy. According to the statistical data mentioned in the report, some 21.6
million SMEs in the non‐financial business sector employed 88.8 million people and generated
EUR 3.666 trillion in value added. Expressed another way, 99 out of every 100 businesses are
SMEs, as are 2 in every 3 employees and 58 cents in every euro of value added. Stability and
growth of SME’s are vital in dealing with such topics as unemployment, increase of export
* Tel.: + 371 29355098. E-mail address: [email protected]
Proceedings of the 2015 International Conference “ECONOMIC SCIENCE FOR RURAL DEVELOPMENT” No37
Jelgava, LLU ESAF, 23-24 April 2015, pp. 258-267

259
market share as well as overall economic development. Even though there is a fair work done
so far, access to finance still remains one of the top problems for SMEs in Europe. Access to
finance was rated as the fifth most pressing problem SMEs face - 14% of EU28 Member State
SMEs stressed it to be the most pressing problem (Access to Finance…, 2014). Nevertheless,
the author assumes that the real size of this problem might be more intent. For instance bank
loans, which are wildly recognised, have several cons. After the crisis banks are less risk-
taking, thus, even if accessible this way of gaining the finance became more challenging.
Another problem which banks face is the quality of their capital, which is a certain boundary
for further credit activities. What is more, traditional bank lawns do not provide any additional
support except credits.
Alternative investment continues the development. Such topics as seed capital,
securitisation and other ways of funding have been wildly discussed, mainly because of the
extra possibilities they bring. In this paper the author will focus on Business Angels, a special
class of private investors. On the top of everything, Business Angels, besides the financial
investments can also help with business management and share their own business
experience, which at the end, can turn to be even more valuable. The top target of this paper
is to prove the hypothesis that Business Angels can be considered a good alternative of finance
captivation and that they can give the valuable support to SMEs. First thing to be done is the
analysis of the structure and main characteristics of SME’s in Europe. Then, a brief analysis of
alternative investments and evaluation of Business Angels will be done. In order to enhance
the analysis, the author will use the following research methods:
Monographic method;
The method of economic analysis;
The method of graphical visualisation.
The object of this paper is the access to finance for SMEs. The main aim of this research
is to evaluate the possibilities of Business Angels in financing the SMEs on the basis of the
analysis of SMEs in European Union and problems they face to access the finance.
In order to reach the aim mentioned, several tasks have been identified:
1) To analyse the structure of SMEs in European Union;
2) Highlighting the main problems SMEs face;
3) To understand if there is a need in finance and how big is it;
4) To analyse the activity of Business Angels in Europe;
5) To evaluate if Business Angels are capable to meet the needs of SMEs.
Research results and discussion
To start, it should be unified what types of enterprises are considered to be SMEs in
Europe. Within the framework of this paper the author will use the definition proposed at
Official journal of the European Union (European Commission, 2003).

260
Table 1
The criteria of SMEs in Europe
Category of a company Number of employees Turnover or Balance sheet total
Micro less than 10 < EUR 2 million or < EUR 2 million
Small less than 50 < EUR 10 million or < EUR 10 million
Medium less than 250 < EUR 50 million or < EUR 43 million
Source: author’s summary based on Official journal of the European Union l124/36, 20 may 2003
From the table above, one can conclude, that the SMEs are the enterprises with total balance
sheet less than EUR 43 million or turnover less than EUR 50 million and with less than 250
people employed. Second aspect to be aware of is the total amount of SMEs in Europe – or in
other words, SME’s market share.
Source: author’s construction based on Database for the Annual report on European SMEs 2014
Fig. 1. Number and size of SMEs in the EU28 by employees
While analysing the structure of SMEs micro enterprises should be highlighted as they form
approximately 92% of all European SMEs. This high proportion varies from 82% in Germany
up to 96% in smaller economies, such as Slovakia, remaining vital all over the EU (Annual
Report on…, 2014). SMEs have been called the backbone of the European economy and this is
not only because of their prevalence in the market. In 2014 SMEs formed around 67% of
working places and generated around 58% of all European Union GDP. These data becomes
even more interesting when it is reminded that those are for non-financial institutions only
(European Commission, 2014).

261
Source: author’s construction based on Database for the Annual report on European SMEs 2014
Fig. 2. Number of employees and value-added factor cost of European Union SMEs,
EUR million
Data above shows interesting dynamics – while working places declined for six years,
generated value added factor managed not only to regain the losses of 2009 but also tends for
new highs. On the one hand such tendency shows the increasing output of enterprises that
might be quite a positive aspect if problem of unemployment in Europe is not neglected.
Another important issue is the economic sector European SMEs represent. Besides all the data
on SME sector relevance are crucial for building the right strategy of finance attraction. Later
on the author will identify several reasons of why the support of Business Angels can be
considered as one of the alternatives for European SMEs. According to the statistics in 2014,
the further mentioned sectors formed approximately 78% of European Union SMEs accounting
71% of the value added created by SMEs: wholesale and retail trade, repair of motor vehicles
and motorcycles, construction, manufacturing, professional, scientific and technical activities
and accommodation and food (Survey on the Access…, 2014). While mentioning these leader
groups wholesale and retail trade sector was named as prior, strongly outperforming the
others in means of employment, value-added at factor costs and number of SMEs. When
speaking about the creation of new working places and boosting economy the question of
sector relevance is a must. Even though supporting the economy, retail trade, which was
identified being among the first rows, can’t handle the whole recovery of European economy.
The author suggests that going from money-movement boosting to value or product creation is
vital. Concluding the overall reasoning of what SMEs in European Union means for the
economic sustainability the expectations of SMEs to grow, creating up to 740000 new jobs in
2015 (European Commission, 2014) is highly crucial.

262
Source: author’s construction based on Database for the Annual Report on European SMEs 2014
Fig.3. SMEs growth projections 2014-2016
Such confidence of SMEs about the possibilities of upcoming growth is a very positive
feature. Several positive effects could be hit, for instance, by implementing new technologies
or investments in research and development. Survey done by the European Central bank
identified the most pressing problems SMEs had to face so far (Survey on the Access…, 2014).
According to the latest results, access to finance was named as the fifth most pressing problem
among European SMEs. The analytical part of the survey (European Commission, 2014)
stressed the following conclusions - micro enterprises consider the problem of access to
finance the most pressing, whereas large enterprises find it least pressing and more innovative
enterprises experience more access to finance problems than less innovative enterprises. From
all information presented above the author assumes, that access to finance will form a great
deal of everyday agenda and what is more, in the nearest future this problem might enhance.
This assumption finds support in the World Bank featured indicators. It was claimed, that quite
a part of SMEs already have outstanding loan or line of credit. For instance, in high-income
countries 46% of small SMEs and 60% of medium SMEs employing 20 to 99 employees
claimed to have outstanding loan or line of credit (World Bank, 2014). Both, assuming the
expectations on growth of SMEs to be right, and keeping in mind their towering place in the EU
economy the demand for finance in the upcoming years will grow. The author believes that
alternative investment might offer the necessary support for the development.
1. Alternative investment
The common problem of alternative investment sector is that so far, there is no unified
definition explaining what it is. Among all, Chartered Alternative Investment Analyst
Association also mentioned the absence of union consensus. In Introduction to Alternative
Investments paper it was stressed, that alternative investment is a largely new and rapidly
changing field. It was assumed that consensus would always remain elusive (www.caia.org).

263
Klausner (www.forbes.com, 2013) shared quite a similar view. Even more, in 2013 he noted
that the complexity of many alternative investments have necessitated that they have been
used by institutional or very high net worth investors only. Even though there is a lack of union
explanation the high necessity of alternative financing, especially in the SME sector, might play
a crucial role. In relation to this topic High Level expert group report might be recalled
(European Commission, 2013). The report was dedicated to SME and infrastructure financing
overall noting their high importance. Besides all, a well-known fact was recalled saying that
financial intermediation in Europe is still largely bank-based. It was claimed that around 80%
of debt financing to the economy is provided by banks, in contrast to the US where bank
financing is as low as 20% (High Level Expert…., 2013). Knowing the situation in bank sector
and related aspects, the author claims having such a high bondage on the bank sector in some
form might slag the overall development in Europe. This seeing finds support in mentioned
HELG report - outlined suggestions mentioned in the report were inspired by the aim to find
the proper balance of roles between bank and non-bank financing. While ascertaining that the
topic of alternative investment is crucial, the author will evaluate the possibilities of Business
Angels to solve the problem of access to finance and support the SMEs.
2. Evaluation of Business Angels
Concept of Business Angels is both – wildly known and poorly managed. On the one hand,
there is vast information available on this topic. EBAN Tool Kit wildly presented Business Angel
and Business Angel network definitions in June 2009 (Introduction to Business…, 2009). This
publication gave an introduction to Business Angel activity in Europe presenting a summary of
different Business Angel types and core elements of Business Angels’ networks. Prior to this,
Jeffrey Sohl gave a solid analysis in his working paper “Angel investing: changing strategies
during volatile times”, where he identified trends in the Angel market by examining changes in
characteristics and investment behaviour during a time of market expansion and contraction.
Finally, in 2012 the European Commission presented the “Evaluation of EU Member States’
Business Angel Markets and Policies” – where it was claimed that visible Business Angels
market in the EU27 may be a little below 30,000 members – those who are members of
networks that provide data on their activities in the EU and about 250000 Angels in networks
overall. The total Business Angel market being, perhaps seven time as big (Evaluation of EU …,
2012). In order to understand if Business Angels can be considered as worthwhile opportunity
for financing SMEs it would be wise to light a definition of who Business Angels are. As
European Trade Association for Business Angels, Seed Funds and other Early Stage Market
Players (www.eban.org, 2013) explains, a Business Angel is an individual investor that invests
directly or through their personal holding their own money predominantly in seed or start-up
companies with no family relationships. Business Angels make their own investment decisions
and are financially independent - a possible total loss of their Business Angel investments will
not significantly change the economic situation of their assets. They invest with a medium to
long term set time-frame and are ready to provide, on top of their individual investment,

264
follow-up strategic support to entrepreneurs from investment period to exit. They respect a
code of ethics including rules for confidentiality and fairness of treatment, and compliance to
anti-laundering. While acknowledging other offered definitions it can be concluded that there
are no mismatches in overall approach. There is one more common thing mentioned in many
sources. Business Angels market being mostly informal has a division in visible side where data
on networks and syndicates are more or less available and invisible side where no information
is strictly available (Evaluation of EU…, 2012). According to the data provided by EBAN, the
total value of the visible segment of the Business Angels’ market in Europe in 2010 was around
EUR 660 million. According the prior estimation the size of non-visible segment might vary
around EUR 4-5 billion, that is about 25% of the size of United States market (Evaluation of EU
…, 2012). Therefore, the assumption that Business Angels in Europe have vast possibilities to
expand their activity becomes rather sound. It is interesting, that according to the certain
estimates there are potentially 350000 individuals only in France with sufficient financial
resources to invest EUR 100000 without exposing themselves to that risk by over 5%.
(Evaluation of EU…, 2012).
Perhaps one of the main questions when evaluating the potential of Business Angels for
European SMEs is the correspondence of necessary and provided investment amount and
sector of the economy. According to SAFE report (European Commission, 2014) only 32% of
the EU27 SMEs reported of willingness to obtain more than EUR 250000. When comparing the
provided survey data to the information given by EBAN the author concludes that in case of
proper cooperation Business Angels and SMEs could find themselves in a win-win situation.
The data of EBAN suggests that investment per Business Angel tends to vary from as low as
EUR 18000 to over EUR 150000 (Evaluation of EU…, 2012). At this point it should be reminded
that Business Angels tend to co-invest with other investors, Business Angels, early stage funds
and others. It means that the demand of SMEs could be satisfied in quite a big extent. Another
question goes to sector relevance. In many countries analysed Business Angels (approximately
50%) invested in healthcare and biotech sectors. The top list implied creative industries,
environment and clean technologies, finance and business service (Evaluation of EU…, 2012).
All the highlighted sectors are of a great importance when speaking about research and
development, which stresses the possible positive outcome of better Business Angel inclusion.
European Business Angels carries quite a good potential to support SMEs. Firstly, the
average amount of money needed by SME corresponds to the possibilities of active or potential
Business Angels. Secondly, the attention should be given to possible expansion of Business
Angels, by latent and hidden Angel activation. Even though there is a great potential for
European SMEs to engage in more alternative finance captivation, the lack of unified and
arranged system is one of the main drawbacks to fully benefit from the possibilities Business
Angels might possess. Moreover, when reviewing 20 years of research on the Angel segment
of the venture capital market J. Freear called for longitudinal studies of Angel and
entrepreneurial behaviour, information flows, links to other market segments, information

265
quality, formal and informal networks and the latent Angel problem (J. Freear, 2002). There
seems to be quite a number of various Business Angel networks as well as different
opportunities for SMEs provided by regional government or the European Union. The author
believes that all the work and research done so far, even though valuable enough won’t give
the wanted effect as long as this information stays rifted. The author suggests thinking about
the creation of European Union Business Centre of Alternative Investment. Such an
organisation could bring together the needs of SMEs and the potential of Angels all over
European Union ensuring better cohesion and greater economic growth. This would strongly
ask for deep organisational scheme, division in regions or economic sectors and the possible
involvement of the European Investment Bank or equivalent. As long as there is no unified
legislative, academic and informative base created, the growth rate of various Business Angel
networks won’t meet the needs of SMEs. Moreover the unified support from the authorities all
over the EU would be highly beneficial. Few steps to be implemented in order to enhance the
positive outcome of Business Angel activity were reflected in the Evaluation of the European
Union Member States Business Angel markets (Evaluation of EU…, 2012):
• The support for the creation and operation of Business Angels networks;
• The tax incentives or tax relief schemes;
• The co-financing schemes.
Even though the study was based on only eight European countries, the country-to-country
results varied a lot. For instance, the effectiveness and success of tax schemes aiming to
support Business Angels varied greatly (Evaluation of EU…, 2012) - this again, might be
explained by the lack of unified and fine planned policies. According to the OECD study, the
initial support from the EU or national governments led to a dramatic increase in the number
of BANs in Europe while the investment activity of these BANs varied a lot (OECD, 2011).
When speaking about co-financing schemes they seem to be rather effective. Nevertheless, the
author would like to spotlight the question of differences and further possibilities of co-
investment schemes and various approaches used in different countries. Such an analysis
could be beneficial in order to understand the needs and best possible actions for the region or
a specific sector of economy. Summing up the research part of this paper it becomes clear that
with proper leading and effective government policy the alternative investment of Business
Angels can be boosted a lot. The author believes that Business Angels have the potential to
support European SMEs and boost the economic development, decrease the bank-addiction
and enlarge the research and development.
Conclusions, proposals, recommendations
1. Access to finance remains a high problem for SMEs in European Union.
2. Regarding the expectations of SMEs to grow, summarised using the method of graphical
visualisation, the need for additional finance resources in the upcoming years will
increase.

266
3. Business Angel market has the potential to satisfy the needs of SMEs in finance
resources.
4. Besides the possible financial investments Business Angels offer extra time for
development, more detailed product analysis and support in new strategy
implementation as well as management skills of experienced professionals.
5. Business Angels can’t be expected to be equally active in all sectors represented by
SMEs.
6. According to the statistics, Business Angels choose to invest in healthcare and biotech
sectors among others.
7. As it is stressed in various studies there is a lack of unified and arranged system that
would organise the market of alternative investment in Europe.
8. Creation of well-structured and single legislative and informative base might enlarge
the number of active Business Angels in the European Union.
Bibliography
Journal article with author(s)
1. Freear, J., Sohl., J. and Wetzel, W.E. (2002). Angles on Angels: Financing Technology-
Based Ventures - A Historical Perspective. Venture capital, Volume 4, Issue 4, pp 275-
287
2. OECD (2011). Executive Summary in Financing Gigh-growth Firms: The Role of Angel
Investors. OECD publishing.
3. Official journal of the European Union l124/36, (2003) Retrieved: http://eur-
lex.europa.eu/legalcontent/LV/TXT/?uri=OJ:L:2003:124:TOC. Access: 18.12.2014
4. Sohl, J. E., (2006). Angel Investing: Changing Strategies During Volatile Times. Journal
of Entrepreneurial Finance and Business Ventures: Vol. 11: Issue. 2, pp. 27-48.
Internet sources
5. CAIA Level 1, Part one - Introduction to Alternative Investments, Chapter 1 (2012).
Retrieved:https://www.caia.org/sites/default/files/curriculum-
download/lich1andlearningobjectives.pdf. Accessed: 22.12.2014
6. Doove, S., Gibcus, P., Kwaak, T., Smit, L., Span, T. (2014). Survey on the Access to
Finance of Enterprises (SAFE). Retrieved: http://ec.europa.eu/growth/access-to-
finance/data-surveys/safe/index_en.htm. Accessed: 22.12.2014
7. EBAN (2009). EBAN Tool Kit - Introduction to Business Angels and Business Angels
Network Activities in Europe. Retrieved: http://www.eban.org/wp-
content/uploads/2013/02/EBAN-ToolKit_EN-2009.pdf. Access: 25.12.2014
8. EBAN glossary (2013). Retrieved:http://www.eban.org/glossary/business-Angel-
ba/#.VJF2xiusXHU Accessed: 17.12 2014
9. European Central Bank, Survey on the Access to Finance of Enterprises (SAFE) (2014).
Retrieved:http://www.ecb.europa.eu/stats/money/surveys/sme/html/index.en.html.
Accessed: 22.12.2014
10. European Commission (2012). Evaluation of EU Member States’ Business Angel Markets
and Policies. Final report. Retrieved: http://ec.europa.eu/enterprise/dg/files/ba-
rep_en.pdf. Accessed: 20.12.2014
11. European Commission, (2013). Finance for Growth. Report of the High Level Expert
Group on SME and Infrastructure Financing. Retrieved:

267
http://ec.europa.eu/economy_finance/financial_operations/investment/long_term_finan
cing/index_en.htm. Access: 17:12.2014
12. European Parliament resolution of 23 October 2012 on Small and Medium Size
Enterprises (SMEs), (2012). Competitiveness and Business Opportunities
(2012/2042(INI)) Retrieved: http://eur-lex.europa.eu/legal-
content/EN/ALL/?uri=uriserv:OJ.CE.2014.068.01.0040.01.ENG. Access: 20.12.2014
13. Klausner, A., (2013). What is an Alternative Investment?
Retrieved:http://www.forbes.com/sites/advisor/2013/05/22/what-is-an-alternative-
investment/ Accessed: 19.12.2014
14. Muller, P., Gagliardi, D., Caliandro, C., Bohn N., Klitou. D., (2014). A Partial and Fragile
Recovery. Annual Report on European SME’s 2014 Retrieved:
http://ec.europa.eu/enterprise/policies/sme/facts-figures-analysis/performance-
review/files/supporting-documents/2014/annual-report-smes-2014_en.pdf. Access:
21.12.2014
15. World Bank, G20 Financial Inclusion Indicators (2011). Retrieved:
http://datatopics.worldbank.org/g20fidata/topic/sme-credit. Accessed: 22.12.2014

268
EXPORT-IMPORT DYNAMICS WITHIN THE EUROPEAN UNION TRADE
POLICY
Gunita Mazure, Dr.oec., assoc. professor, Sandra Tiltina, Bc.oec.
Faculty of Economics and Social Development, Latvia University of Agriculture
Abstract. International trade is an essential part of the market economy and provides
great opportunities for small countries to support the internal market with sufficient goods and
services as well as ensures an opportunity to participate on the external market. The research
aim is to explore export-import dynamics in Latvia and the European Union under the EU trade
policy. The following research tasks have been advanced to achieve the set aim: 1) to survey
the EU trade policy development; and 2) to analyse the export-import dynamics of the EU and
Latvia. The European Union is the leader in the world international trade having provided USD
2307 billion of total world export volume in 2013. The major international trading partners are
the United States and China; the main export products are machinery and transport
equipment, while the main import products are fuel, lubricants, and related materials. The
international trade balance of Latvia has remained negative for several years due to continuing
high volume of imports and low volume of exports. However, in 2013, export grew to EUR 10.2
million, while import - EUR 12.64 million. The basic export products are agricultural goods,
while import is governed by machinery products. The most important cooperation partners are
Lithuania, Estonia, Germany, Poland, and Russia. The research is mainly based on the
monographic descriptive method as well as the methods of analysis and synthesis are used to
study the problem elements and synthesise coherencies or formulate regularities.
Key words: export, import, trade, Latvia, the European Union.
JEL code: F16, F40, F63
Introduction
The European Union as the world's largest economy is also the biggest exporter and
importer, the leading investor and recipient of foreign investment and the biggest aid
supporter. With just only 7% of the world's population, it accounts for more than one quarter
of the world's wealth (Free Trade is ...., 2014). Therefore, Latvia's accession to the single
market in 2004 on the one hand opened a huge potential for the economic growth by
Corresponding author. Tel.: + 371 29844628; fax: + 371 630 84897
E-mail address: [email protected]
Proceedings of the 2015 International Conference “ECONOMIC SCIENCE FOR RURAL DEVELOPMENT” No37
Jelgava, LLU ESAF, 23-24 April 2015, pp. 268-279

269
developing export and offering its products for the entire European market, while on the other
hand, Latvia faces the big European countries with historical background and an important
position in international trade which means stiff competition. Export with the growth rate of
30.33% in 2010 was Latvia’s driver during the global financial crisis and still it has been
nominated as one of the most important economic objectives in the near future; although, the
growth of exports is decreasing in recent years (Zinojums par Latvijas ...., 2014). In the
European Union, international trade is a key factor contributing to the overall development of
the market. As stated in Latvia’s Stability Programme for 2014- 2017 "in 2011-2012, the
growth was largely based on foreign trade because improvements in the global economic
environment, which was weakened by the crisis, facilitated increase in demand in the major
partner countries of Latvia, despite the Eurozone crisis. This was an important precondition for
raising volumes of output in export-oriented sectors and for regaining competitiveness,
allowing corresponding to take a larger proportion in the development of the national
economy" (Latvijas stabilitates ...., 2013). Nevertheless, the year 2013 was more favourable
for companies serving the local market thanks to private consumption.
The EU trade policy has been viewed by several authors (Albornoz, Calvo Pardo et al.,
2012; Benkovskis and Worz, 2012; Brulhart and Matthews, 2007; Sen, 2010; Rugaja, 2006
etc.), while various aspects related with export and import have been discussed by Altintas
and Turker (2014), Benkovskis (2012), Priede (2013), Priede and Skapars (2011), Berman et
al., (2014), Davidsons and Vitola (2008), Lee (2011), Laskiene and Venckuviene (2014),
Pelece (2014), Rybakovas (2009), Pineres and Ferrantino (1997), Saboniene et al. (2013) and
others. The mentioned authors generally deal with the problem of competitiveness of national
commodities, though their studies lack a detailed EU export-import analysis. Therefore, the
hypothesis of the present research is that the structure of neither EU nor Latvia export-
import has changed during the analysed period. The research aim is to explore export-import
dynamics in Latvia and the European Union under the EU trade policy. The following research
tasks have been advanced to achieve the set aim: 1) to survey the EU trade policy
development; and 2) to analyse the export-import dynamics of the EU and Latvia.
The research covers the period of 2008-2013 and it is restricted to the analysis of
international trade of commodities. The information compiled by central statistical offices, like
Eurostat, scientific publications of foreign and local researchers, and other materials have been
used for the purpose of the study. The research is mainly based on the monographic
descriptive method as well as the methods of analysis and synthesis are used to study the
problem elements and synthesise coherencies or formulate regularities.
Research results and discussion
Survey on the EU trade policy development
H. Altintas and O. Turker believe that the export and import functions of any country
are crucial for the identification of trade dynamics of this country; and the variables forming

270
the export function are mainly national income, foreign income, foreign direct investment, real
exchange currency, and export and import prices (Altintas, Turker, 2014). The economy theory
makers have admitted the importance of increasing the level of national prosperity.
Mercantilists’ view was to increase export by minimizing import, and to export ready-made
goods instead of raw materials. Free trade theory, as opposed to the mercantilist policies of
protection, was championed by both Smith and Ricardo as a route to achieve production
efficiency at a global scale (Sen, 2010). The EU single market being the basis for one of the
EU’s pillars – economic integration of the Member States, is one of the most unique global
markets. The joint European Union trade policy is based on a set of uniform rules under the
Customs Union and the Common Customs Tariff and governs trade relations of the Member
States with the non-Member States. The result of this policy is clearly expressed in reduction
of rates in international movement of goods as well as in various aspects related to investment
and intellectual property right protection. Eicher et al. (Eicher, Henn, 2008) in their research
have proved that the single market establishment and tariff reduction have a positive impact
on the EU's trade performance being the basis for its growth. This is also evidenced by a
number of facts as the EU single market volumes have sweepingly increased after 20 years of
operation: from 345 million consumers in 1992 to over 500 million consumers in 2011 in 27 EU
Member States; for trade between EU countries it has grown from EUR 800 million in 1992 to
EUR 2800 billion in 2011 for the value of goods exchanged; for trade between the EU and the
rest of the world - from EUR 500 billion in 1992 to EUR 1500 billion in 2011 (20 years ...,
2012). Hanosek J. in his work has analysed factors affecting trade among European countries
and he has concluded that infrastructure exhibits larger effect than geography, culture or
institutions. He proved that even in a well functioning free trade area of Europe, the key aspect
of trade was the efficiency of how goods were transferred across the borders, along with the
level of information and communication technology enabling reduction of transaction costs.
These results indicate the key importance of trade between the old and new EU members
(Hanosek, 2013). However, the EU's policy requires changes after 20 years of successful
operation. According to Mario Monti report to José Manuel Barrosu “the development of the
single market has stopped following the crisis and a certain “market fatigue” has intervened
reducing confidence in the role of the market. In addition, problems arise in the process of
market integration delaying smooth development of the market” (Monti, 2010). The global
financial crisis revealed the current trade policy weaknesses - research, education,
employment, and energy sectors. As indicated by Karel De Gucht (Trade Policy ..., 2010), the
21st century marketing is a global engine for growth in the European Union contributing to
long-term jobs and providing consumers with lower prices and bigger choice. The Common
EU's Europe 2020 strategy focuses on five objectives - employment, innovation, education,
poverty reduction, climate, and energy. The strategy says that the key challenge will be given
to free trade agreements, so it assumes a greater role for removal of industrial and agricultural

271
goods rates as well as increase of market access to services and investment, intellectual
property rights and competition (Trade, Growth ..., 2010).
Analysis of the export-import dynamics of the EU and Latvia
According to M. Brulhart and A. Matthews, the external trade policy of the EU impinges
on nearly one fifth of the world trade (Brulhart, Matthews, 2007). In 2013, the European Union
took a leader position as the world’s largest exporter of goods - achieving a record mark of
exports volume of USD 2307 billion and a market share of 15.3%. The next largest exporters
in the world are China and the USA with USD 2209 billion and USD 1,580 billion export
volumes respectively and the corresponding market shares of 14.7% and 10.5%. The World
Trade Organisation has identified the largest world importers, which are the same as export
Top 3 leaders - the USA with USD 2329 billion (15.4%), the European Union with USD 2235
billion (14.8%), and China (12.9%). In 2013, total export volume equalled USD 15047 billion,
which is 18% less than in 2012, when the total world export reached USD 18401 billion. Total
import, in turn, evidenced the figure of USD 15121 billion being 19% less compared with USD
18601 billion in 2012 (International Trade ..., 2014).
The EU-28 Member States provide around 1/6 of the global trade volume. The EU
export volume has continued to increase every year reaching EUR 1737 billion in 2013, thus,
exceeding the 2008 level by EUR 428 billion or 33% (Figure 1).
Source: authors’ construction based on Eurostat, 2014
Fig. 1. Export-import in the European Union for the period of 2008-2013, billion EUR
As shown in Figure 1, total imports of the EU Member States during the period of 2008-
2012 have exceeded the volume of exports, thus, resulting in a negative trade balance.
However, in 2013 a record high level of export was reached totalling EUR 1737.02 billion, while
the level of import decreased by EUR 116.19 billion compared with 2012. This is the first time
when the trade balance is positive thanks to the successful implementation of trade policy.

272
The EU is one of the most open economies in the world owing to its common trade
policy and evidenced by the number of trading partners. In 2012, the EU was the largest
trading partner for 59 countries, while China and the USA was a trading partner for 36 and 24
countries, respectively. European goods and services account for 35% of the EU’s GDP - about
5 percentage points more than the USA (Free Trade is ...., 2014). During the period from 2008
to 2013, the main exporting and importing countries have not changed their positions;
Germany is the European leader in international trade both in export and import (Figure 2).
Source: authors’ construction based on Eurostat, 2014
Fig. 2. Export-import structure in the European Union in 2013, per cent
In 2013, Germany retained the leading position in the field of foreign trade with exported
goods amounting to 27.1% of goods export to the third countries and imported goods
accounting for almost one-fifth (18.8%) of the EU-28 Member States imports volume.
Germany is the third largest exporter and importer in the world. Much of Germany's export
focuses on industrially produced goods and services, in particular, German mechanical
engineering products, vehicles, and chemicals are highly valued across the globe. Export of
goods and services have also made up about 52% of its GDP. Significantly, the EU integration
has greatly intensified intra-European trade, with about 69% of German export shipped to
European countries and 58.2% delivered to the EU Member States (Germany ..., 2013).
According to M. Brulhart and A. Matthews, about 46% of extra-EU trade is directed
towards developed countries. Within the developed countries group, the United States is the
largest trading partner (Table 1) and both M. Brulhart and A. Matthews state that if intra-EU
trade is added to extra-EU trade with developed countries, more than four fifths of the Union’s
trade is with countries of broadly similar income levels. This is a familiar empirical
phenomenon world-wide but it runs counter to the expectation that trade flows should be
greatest between countries that are most different in economic structure. It has given rise to
new approaches to the theoretical modelling of the causes of trade (Brulhart, Matthews, 2007).

273
Table 1
The main trade partners of the European Union in 2008-2013 (in million EUR)
Export 2008 2009 2010 2011 2012 2013
Changes,
2013/2008
(%)
EU-28 1309147 1093962 1353195 1554252 1683088 1737022 32.68
USA 248057 203756 242672 264055 292815 288239 16.20
China 78301 82421 113454 136415 144012 148269 89.60
Russia 104970 65697 86308 108587 123401 119775 14.20
Switzerland 100623 88797 110475 142098 133509 169591 68.54
Norway 43719 37492 41933 46820 49915 50178 14.77
Turkey 54476 44486 61831 73275 75385 77750 42.72
Japan 42390 35978 43984 49075 55581 54040 27.48
Import 2008 2009 2010 2011 2012 2013
Changes,
2013/2008
(%)
EU-28 1585231 1235636 1532089 1728314 1798576 1682390 6.13
USA 182780 155250 173403 191977 206491 195989 7.23
China 249102 215274 283598 294835 291620 280055 12.43
Russia 180446 119569 162075 201327 215118 206478 14.43
Switzerland 82650 80909 85487 93486 105924 94266 14.05
Norway 95945 68918 79024 93851 101049 90008 -6.19
Turkey 46288 36446 42837 48387 48268 50383 8.85
Japan 76474 58440 67448 70755 64742 56530 -26.08 Source: authors’ construction based on Eurostat, 2014
In 2013, the USA, Switzerland and China are the major EU co-partners. Export to
Switzerland (up to 27%) has increased most, which is mainly related with the trade volume
growth of chemicals and medical products, machinery, instruments, and watches. Though,
exports to Turkey and China have shown a smaller increase (only 3.1% and 3.0%,
respectively), which can be explained by short-term cyclical changes in demand. In 2013,
export volumes showed a declining tendency with Russia and Japan - by 3% and 2.7%
respectively compared with 2012. The same refers to a decrease in the import volume for the
recent years. In 2013, the largest slow down was observed for Japan (-12.68%), Switzerland
(-11.01%), and Norway (-10.93%) compared with 2012. In 2013, the largest importer of the
EU’s goods has been China; although, the import volume has declined by 4% between 2012
and 2013. The slowdown is mainly due to increasing concerns about the Eurozone stability and
the possibility for the EU economy to fall back to the recession caused by the financial crisis.
In 2013, the performance of Latvia’s exports has been moderate which according to D.
Pelece, an expert from the Bank of Latvia, is a result of difficult situation on global markets,
problems in the Eurozone and total decrease in demand (Pelece, 2014). Figure 5 shows
Latvian export and import dynamics and the trade balance for the period of 2008-2013, which
proves an overall upward trend in foreign trade, yet, simultaneously signalling for the high
dependence on related markets, thus, affecting the overall foreign trade growth rates.

274
Source: authors’ construction based on the CSB data, 2014
Fig. 3. Export-import dynamics and growth of commodities in Latvia in 2008-2013
As shown in Figure 3 Latvia’s export growth rates have strongly changed for the recent
years. Facing the financial crisis in 2009 with a sharp decline in demand both on domestic and
foreign markets, volumes of exports and imports radically decreased – import by 37% and
export by 19%. The trade balance fell to a negative figure (- EUR 2 million) already showing
the signs of recovery from the lowest peak of the crisis. In 2010, the import volumes increased
by 26%, thus, evidencing, a recovery of domestic demand; while the export growth rate
amounted to +30%, thus, providing the export volume of EUR 6.68 million. Import growth
rate in 2010 shows that the volume of imports has increased during the crisis, though, the
growth is slower compared with the volume of exports. In 2012, imports have gone up by
30.57% compared with 2011, while exports produce a less growth (27.77%), again signalling
on the domestic demand recovery. In 2013, the export growth rate is much lower, though, it is
still positive at 1.52%.
Machinery and transport equipment are the most valuable products exported by the EU
Member States. In 2013, they accounting for EUR 709160 million or 41% of total export
volumes. Although, their export volumes have increased only slightly, i.e. by 0.6% in the
mentioned year, they are still major export products. Other manufactured goods take the
second position forming EUR 383034 million or 22% of the export volume and they have
increased by 1% compared with 2011. The most significant increase has been observed in the
group of food, drinks and tobacco, its value has reached a record value of EUR 104.3 billion
and the increase is 5.34% compared with 2012 (Figure 4).
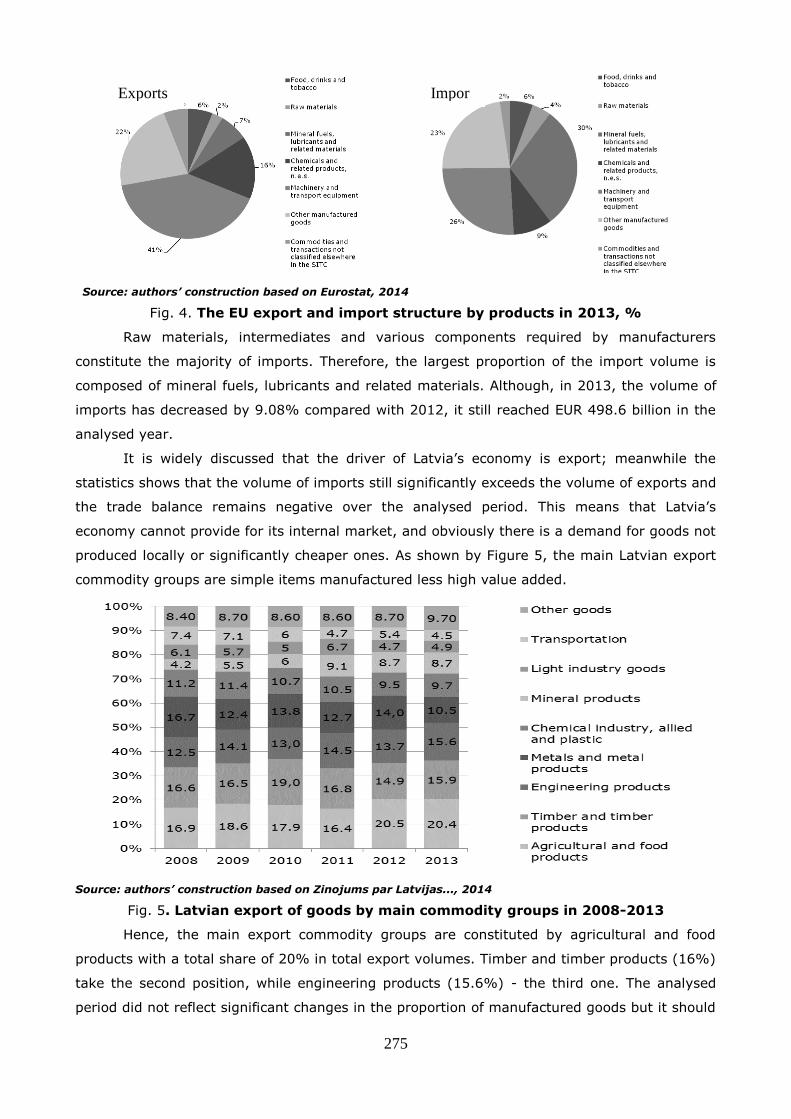
275
Source: authors’ construction based on Eurostat, 2014
Fig. 4. The EU export and import structure by products in 2013, %
Raw materials, intermediates and various components required by manufacturers
constitute the majority of imports. Therefore, the largest proportion of the import volume is
composed of mineral fuels, lubricants and related materials. Although, in 2013, the volume of
imports has decreased by 9.08% compared with 2012, it still reached EUR 498.6 billion in the
analysed year.
It is widely discussed that the driver of Latvia’s economy is export; meanwhile the
statistics shows that the volume of imports still significantly exceeds the volume of exports and
the trade balance remains negative over the analysed period. This means that Latvia’s
economy cannot provide for its internal market, and obviously there is a demand for goods not
produced locally or significantly cheaper ones. As shown by Figure 5, the main Latvian export
commodity groups are simple items manufactured less high value added.
Source: authors’ construction based on Zinojums par Latvijas..., 2014
Fig. 5. Latvian export of goods by main commodity groups in 2008-2013
Hence, the main export commodity groups are constituted by agricultural and food
products with a total share of 20% in total export volumes. Timber and timber products (16%)
take the second position, while engineering products (15.6%) - the third one. The analysed
period did not reflect significant changes in the proportion of manufactured goods but it should
Exports Impor
ts

276
be noted that the suspension of SIA Liepajas Metalurgs operation depicts in the decrease of
the export volumes in the group of metal and metal products by 3.5 percentage points in
2013. Majority of the exported and imported goods are intermediate goods – 58% of exports,
while consumption and capital goods account for only 24% and 10% respectively. For
example, the group of agricultural and food products is represented by fish, milk and dairy
products mainly exported to Russia, Lithuania, Estonia, and the USA. The group of timber and
timber products, in turn, mainly is represented by firewood, timber and wood products
exported to the UK, Sweden, and the Netherlands (Central Statistical Bureau, 2014). G.
Davidsons has noted that structural transformation is one of the economic growth processes
envisaging the transition from production of simpler goods with lower value added to the
output of more complex products. The economic development of country is associated with the
level of export complexicity (Davidsons, Vitola, 2008). Therefore, export should be encouraged
by increasing the production of value added goods and exporting of finished products instead
of raw materials.
Latvia’s import structure is formed mainly of intermediate goods, which form 59% of
the import volume. Consumption goods compose 24% ensuring consumers with wide range of
products. Figure 6 shows the structure of imports between 2008 and 2013 and it leads to the
conclusions that intermediate goods are mainly required for the production of final goods, such
as metal, automotive, and chemical industry products.
Source: authors’ construction based on Zinojums par Latvijas ..., 2014
Fig. 6. Latvia’s import of goods by main commodity groups in 2008-2013
The analysis of Latvia’s imports reveals that the most important goods include
engineering products - 18% on average, the second position is taken by agricultural and food
products – 16% on average, while the third position – by the chemical and plastic products. It
is interesting that the import of metal and metal products has also decreased in 2013 by 1.7
percentage points, which could mean that the suspension of SIA Liepajas Metalurgs operation
has also affected the decline of imports as various machinery and mechanical appliances,

277
electrical machinery and equipment are imported in the group of engineering products.
Imports in the group of agricultural and food products mostly refer to fresh chilled or frozen
poultry meat, cream, and milk products, while imports in the group of chemical industry go to
pharmaceutical products and plastic semi finished products. The main agricultural goods
importing countries are the Netherlands, Lithuania, and Denmark. Chemical industry products
are imported from Poland and Denmark, where raw materials have obviously lower prices.
Metal products are imported from the Netherlands, Finland, and Germany.
Conclusions, proposals, recommendations
1. The European Union as the world's largest economy and international trader assumes a
greater role for contributing to long-term jobs and providing consumers with lower prices
and bigger choice.
2. The global financial crisis has resulted in overall trade policies set as new directions of
development - more market liberalisation, market access to services and investment
promotion, elimination of industrial and agricultural goods tariff rates, unlimited supply of
raw materials and energy, and protection of intellectual property rights.
3. During the period of 2008-2012 the EU's trade balance remained negative, indicating the
excess of imports but the implementation of a targeted EU's common trade policy in 2013
resulted in the increase of exports over imports forming a positive trade balance.
4. In 2013, the USA, Switzerland and China were the major EU co-partners mostly importing
machinery and transportation equipment from the EU, while China, Russia and the USA
exported intermediate goods like fuel and lubricants, equipment, transportation facilities
and other manufactured goods needed for final production.
5. The main Latvian export commodity groups are constituted by agricultural and food
products, timber and timber products, and engineering products, while also engineering
products, agricultural and food products and chemical products are the main import
commodity groups. The main cooperation countries for Latvia are Lithuania, Estonia,
Germany, Poland, and Russia.
6. The Ministries of Finance and Economics of Latvia should facilitate the granting of aid to
sectors promoted in the total EU exports within the common trade policy.
7. In order to develop the competitiveness of Latvian exports, the Ministries of Finance and
Economics of Latvia should provide financial support in addition to tax incentives or other
bonuses for companies that engage in foreign trade with high added value products.
Bibliography
1. Albornoz, F., Calvo Pardo, H. F., Corcos, G. and Ornelas, E. (2012). Sequential Exporting,
Journal of International Economics, Vol. 88 No 1, p. 15. Retrieved:
http://www.economics.soton.ac.uk/staff/calvo/documents/Sequential_Exporting.pdf.
Access: 7 January 2015.

278
2. Altintas, H., Turker, O. (2014). The Dynamics of Export and Import Functions in Turkey:
Cointegration and Multivariate Granger Causation Analysis. International Journal of Asian
Social Science, No 4(5), pp. 676-689. Retrieved: http://www.aessweb.com/pdf-files/ijass-
2014-4(5)-676-689.pdf. Access: 2 January 2015.
3. Benkovskis, K. (2012). Competitiveness of Latvia’s Exporters. Bank of Latvia Working
Paper 3/2012. Retrieved:
https://www.bank.lv/images/stories/pielikumi/publikacijas/petijumi/WP_3-
2012_Benkovskis.pdf. Access: 2 January 2015.
4. Benkovskis, K., Worz, J. (2012). Evaluation of Non-Price Competitiveness of Exports from
Central, Eastern and Southeastern European Countries in the EU Market, Bank of Latvia, p. 30.
5. Berman, N., Berthou, A., Hericourt, J. (2014). Export Dynamics and Sales at Home. ECB
Working Paper Series No 1720. Retrieved:
http://www.ecb.europa.eu/pub/pdf/scpwps/ecbwp1720.pdf. Access: 2 January 2015.
6. Brulhart, M., Matthews, A. (2007). EU External Trade Policy. Retrieved:
http://www.hec.unil.ch/mbrulhar/papers/elagraa610.pdf. Access: 2 January 2015.
7. Central Statistical Bureau (2014). Retrieved: http://www.csb.gov.lv/statistikas-
temas/areja-tirdznieciba-datubaze-30104.html. Access: 4 December 2014.
8. Davidsons, G. Vitola, K. (2008). Eksporta strukturala transformacija precu telpas modeli
(Structural Transformation of Exports in Goods Area Model). Retrieved:
http://www.makroekonomika.lv/sites/default/files/pet_2008-4_vitola-davids.pdf. Access:
5 January 2015.
9. De Gucht, K. (2010). Trade, Growth and World Affairs. Retrieved:
http://trade.ec.europa.eu/doclib/docs/2010/november/tradoc_146955.pdf. Access: 15
January 2015.
10. Eicher, Theo S., Henn, C. (2011). In Search of WTO Trade Effects: Preferential Trade
Agreements Promote Trade Strongly but Unevenly. Retrieved:
http://www.sciencedirect.com/science/article/pii/S002219961100002X. Access: 5 January
2015.
11. Eurostat databases (2014). Retrieved:
http://epp.eurostat.ec.europa.eu/portal/page/portal/statistics/search_database. Access: 4
December 2014.
12. Free Trade is a Source of Economic Growth (2014). Retrieved:
http://europa.eu/pol/pdf/flipbook/en/trade_en.pdf. Access: 2 January 2015.
13. Germany Exports, Imports and Trade (2013). Retrieved:
http://www.economywatch.com/world_economy/germany/export-import.html. Access: 4
January 2015.
14. Hanosek, J., Koncenda, E. (2013). Factors of Trade in Europe. Retrieved:
http://www.sciencedirect.com/science/article/pii/S0939362514000703. Access: 2 January,
2015.
15. International Trade of Goods (2014). Retrieved: http://ec.europa.eu/eurostat/statistics-
explained/index.php/International_trade_in_goods. Access: 4 December 2014.
16. International Trade Statistics (2014). World Trade Organization. Retrieved:
http://www.wto.org/english/res_e/statis_e/its2014_e/its2014_e.pdf. Access: 2 January 2015.
17. Laskiene, D., Venckuviene, V. (2014). Lithuania’s Export Specialization According to
Technological Classification. Mediterranean Journal of Social Sciences, Vol. 5, No 7, pp.
680-690.
18. Latvijas Stabilitates programma 2014. - 2017. gadam (Latvia’s Stability Programme for
2014–2017). Ministry of Finance. Retrieved:
http://ec.europa.eu/europe2020/pdf/csr2014/sp2014_latvia_lv.pdf p 69. Access: 2
January 2015.

279
19. Lee, J. (2011). Export Specialization and Economic Growth around the World. Economic
Systems No 35, pp. 45–63. Retrieved:
http://www.sciencedirect.com/science/article/pii/S0939362510000749. Access: 2 January
2015.
20. Monti, M. (2010). A New Strategy for the Single Market.
Retrieved:http://ec.europa.eu/internal_market/strategy/docs/monti_report_final_10_05_2
010_lv.pdf. Access: 2 January, 2015.
21. Pelece, D. (2014). Latvijas precu eksports skersgriezuma (Latvian Exports of Goods in
Cross-Section). Retrieved: http://www.makroekonomika.lv/latvijas-precu-eksports-
skersgriezuma. Access: 5 January 2015.
22. Pineres, A. G., Ferrantino, M. (1997). Export Diversification and Structural Dynamics in the
Growth Process: the Case of Chile, Journal of Development Economics, 52, pp. 375-391.
23. Priede, J. (2013). Quality Competitiveness of Latvia’s Food Industry in the Fish Products
Group. Journal of Economics, Business and Management, Vol. 1, No 2, May 2013.
Retrieved: http://www.joebm.com/papers/41-E10016.pdf. Access: 3 January 2015.
24. Priede, J., Skapars, R. (2011). Quality Competitiveness of Latvia’s Wood Industry,
European Integration Studies, Research and Topicalities, Kaunas: Technologija Kaunas, No
5, pp. 229-236.
25. Rugaja, I. (2006). Areja tirdznieciba pec iestasanas Eiropas Savieniba (Foreign Trade after
Joining the European Union). Retrieved: http://www.makroekonomika.lv/areja-
tirdznieciba-pec-iestasanas-eiropas-savieniba. Access: 5 January 2015.
26. Rybakovas, E. (2009). Competitiveness of Lithuanian Manufacturing Industry. Economics and Management No
14. pp. 912-918.
27. Saboniene, A., Masteikiene, R., Venskuviene, V. (2013). Lithuanian‘s Export Specialization
According to Technological Classification. Mediterranean Journal of Social Sciences. Vol. 4,
No 11, pp. 346-351.
28. Sen, S. (2010). International Trade Theory and Policy: A Review of the Literature. Levy
Economics Institute of Bard College Working Paper No 635. Retrieved:
http://www.levyinstitute.org/pubs/wp_635.pdf. Access: 4 January 2015.
29. Tirdzniecibas politika ka strategijas “Eiropa 2020” galvena sastavdala (Trade Policy as a
Main Part in Strategy “Europe 2020”). Retrieved: http://bookshop.europa.eu/lv/tirdzniec-
ba-izaugsme-un-pasaules-norises-pbNG3110628/downloads/NG-31-10-628-LV-
C/NG3110628LVC_002.pdf;pgid=y8dIS7GUWMdSR0EAlMEUUsWb0000gmSWQzBi;sid=QW
LJGJoPBKDJEMhPU_tXv_gq46G1SDjMPTI=?FileName=NG3110628LVC_002.pdf&SKU=NG3
110628LVC_PDF&CatalogueNumber=NG-31-10-628-LV-C . Access: 4 January 2015.
30. Zinojums par Latvijas tautsaimniecibas attistibu (2014). (Report on the Development of
National Economy of Latvia). Retrieved:
https://www.em.gov.lv/lv/nozares_politika/tautsaimniecibas_attistiba/arhivs/. Access: 5
January 2015.
31. 20 years of European Single Market (2012). Retrieved:
http://ec.europa.eu/internal_market/publications/docs/20years/achievements-eb_en.pdf.
Access: 3 January 2015.

280
ASSESSING THE EXCHANGE RATE SENSITIVITY OF CZECH BILATERAL
AGRICULTURAL TRADE
Jana Simakova1, Ing.
1 Silesian University in Opava, School of Business Administration in Karvina
Abstract. This paper examines the short term and long term effects of exchange rate
changes on bilateral trade flows of agricultural products between the Czech Republic and its
major trading partners (Austria, Germany, Italy, Poland and Slovakia). In accordance with the
J-curve theory, the Johansen cointegration test was employed to analyse the long term
relationship and a vector error correction model to explore the short term effects of Czech
koruna exchange rate level. The dataset used in this study covers period from 1999:Q1 to
2013:Q4. Agricultural product groups are based on the SITC classification. Results show that if
the Czech foreign trade in agricultural sector is disaggregated into particular product
categories, there can be found only some sectors significantly connected with exchange rate
movements in the long term. The effects of currency depreciation are less than ambiguous and
cannot be generalized across the analysed product categories but increasing in particular trade
balances after currency depreciation dominates its decreasing. Theoretical short term and long
term assumptions were confirmed only in trade of meat and meat preparations with Slovakia.
Key words: exchange rate, agricultural sector, trade balance, cointegration.
JEL code: F1, F31
Introduction
Agricultural and food production is one of the traditional industries of the Czech economy
and despite the volume of this whole production was significantly reduced in recent years, the
volume and value of trade activities had been constantly growing (Bielik et al., 2010). During
the last two decades, agricultural trade in the Czech Republic passed through a series of
changes that influenced its shape and character. The Czech agricultural trade development was
influenced especially by successful transformation from centrally planned economy to market
economy; by entrance of Czechia to the EU; and according to Horska et al. (2011)
globalization and integration processes has played the important role as well. The transition
Corresponding author. Tel.: + 420 596 398 247.
E-mail address: [email protected].
Proceedings of the 2015 International Conference “ECONOMIC SCIENCE FOR RURAL DEVELOPMENT”, No37
Jelgava, LLU ESAF, 23-24 April 2015, pp. 280-291

281
process and membership in the EU caused changes in the commodity and especially territorial
structure of agricultural trade. The Czech Republic changed its trade orientation especially
towards the trade with other member states, which means an EU share of over 75% of its total
trade (Svatos and Smutka, 2012). Agri-food foreign trade turnover of the Czech Republic in
last decade, with exception of the year 2009, has been continuously growing, thanks to
increased exports as well as imports. A greater dynamics in the monitored period was shown
by exports, which is a very positive feature with regard to long-term trend. One of the
characteristics of agricultural foreign trade of the Czech Republic is a continuous negative trade
balance. According to Svatos and Smutka (2012), it can be said that the unit prices of Czech
agricultural imports have over the long term exceeded the unit prices of Czech agricultural
exports, resulting in negative balance of agricultural trade. This indicator has been gradually
increasing in its absolute values; however, as a result of faster dynamics of increasing exports,
its share in the volume of exports shows a declining tendency.
After joining the EU and the trade liberalization, the Czech agriculture also faced an inflow
of cheaper agri-food production from abroad. Insufficient domestic sales and low, respectively
unstable purchase prices are solved many times by decreasing or complete termination of
unprofitable agricultural production. One of the macroeconomic policy instruments is exchange
rate, which can influence the price competitiveness of international traded products. According
to Abeysinghe and Yeak (1998) policies prescriptions have generally assumed that currency
depreciation stimulates exports and curtail imports, while currency appreciation is detrimental
to exports and encourage imports. Domestic currency depreciation (devaluation in fixed
currency regimes) increases the price of imports in domestic currency terms, which means
more expensive imports. Simultaneously it decreases the price of exports in foreign currency
terms, in other words, exports become cheaper. Given the above, price effect of currency
depreciation can increase the volume of exports and decrease the volume of imports (Gupta-
Kapoor and Ramakrishnan, 1999). Based on this presumption, this paper considers exchange
rate as an instrument which plays a critical role in profitability of both export-oriented and
import-competing agriculture and can affect the agricultural trade balance.
The aim of this paper is to examine the relationship between exchange rate depreciation
and agricultural bilateral trade balances between the Czech Republic and its major trading
partners (Austria, Germany, Italy, Poland and Slovakia). Data used in this study cover period
from 1999:Q1 to 2013:Q4 and are based on the SITC classification. To distinguish the long
term effects from the short term ones, authors apply the J-curve theory which says that
currency depreciation improves the trade balance only from long run perspective; in the short
run it even worsens the trade balance before improving it (Bahmani-Oskooee and Ratha,
2004). In the study is employed a Johansen cointegration test to analyse the long term
relationship between variables. Short run effects are explored by estimating an error correction
model.

282
Research results and discussion
Review of relevant literature
J-curve theory is the traditional instrument to analyse the dynamic effect of exchange rate
changes on trade balance. J-curve theoretical basis comes from the Marshall-Lerner condition,
which states that the sum of export and import demand elasticity has to be at least one and
then the currency depreciation has a positive impact on the trade balance (Auboin and Ruta,
2012). Usually, Marshall-Lerner condition is not met in the short run, goods tend to be inelastic
and depreciation deteriorates the trade balance initially. In long run consumers can adjust to
the new prices, volume effect is generally believed to dominate the price effect and trade
balance will be improved. Short run effect of currency depreciation and related J-curve
phenomenon was first advanced by Magee (1973), who pointed that short run deterioration
and long run improvement of trade balance after depreciation resemble the letter J.
Literature concerning the J-curve issue tends to fall into one of the following three
categories: studies using aggregate trade data; studies employing disaggregate trade data at
bilateral level; and recent studies using disaggregate trade data at commodity level. The first
type of studies concentrates on the use of aggregate export and import data between a
country and the rest of the world in assessing the effectiveness of currency devaluation (e.g.
Felmingham, 1988). These studies have to employ the effective exchange rate, what can be
misleading when country´s currency appreciate against one currency and simultaneously
depreciate against another currency (Bahmani-Oskooee and Brooks, 1999). The weighted
averaging will therefore smooth out the effective exchange rate fluctuations, yielding an
insignificant link between the effective exchange rate and the trade balance. Therefore, many
other studies employ bilateral exchange rates and bilateral trade balance data between a
country and its major trading partners (Bahmani-Oskooee and Ratha, 2004). There has been a
growing body of literature arguing that the second-generation study may still suffer from the
aggregation bias problem, as significant exchange rate impacts with some commodities could
be more than offset by insignificant exchange rate effects with others, thereby resulting in an
insignificant exchange rate impact and vice versa. Therefore, the newest studies disaggregate
data to industry level (e.g. Bahmani-Oskooee and Hegerty, 2011).
In the agricultural trade literature, most studies have mainly concentrated on the effect of
changes in exchange rate on agricultural export volume and/or prices (e.g. Gardner, 1981;
Bradshaw and Orden, 1990). Limited studies have been made to investigate the impact of
exchange rate on the agricultural trade balance. Among studies applying the newest approach
to J-curve estimation can be found paper by Yazici (2006). He investigated whether the J-
curve hypothesis holds in Turkish agricultural sector. Based on the data covering the period
from 1986 to 1998, the results indicate that, following devaluation, agricultural trade balance
initially improves, then worsens, and then improves again. This pattern shows that J-curve

283
effect does not exist in Turkish agricultural sector. Another important finding is that
devaluation worsens the trade balance of the sector in the long run.
Douglason Godwin (2009) empirically tested the existence of the J-curve hypothesis using
Nigerian agricultural data. The hypothesis asserts that adjustment to a disturbance in
payments is not instantaneous since a certain period of time would have to elapse before
variation in the exchange-rate can restore equilibrium in the trade balance. The analysed
model is a multiplier based framework which imposes an Almon lag structure on the exchange
rate regimes. The empirical results indicate that the J-curve does not exist in Nigerian
agricultural sector precisely in the long-run since the pattern of lag between the exchange rate
depreciation and the trade balance resembles more of an asymmetric S-shape of a horizontal
S.
Yazdani and Shajari (2009) published study, where the impact of macroeconomic indicators
of Iran and its 20 trading partners on Iran’s agricultural trade balance had been investigated.
The ARDL approach was applied during the period of 1960 - 2005. They found out that real
exchange rate had the positive impact on trade balance indicating that the depreciation
improves trade balance.
There was made only few studies concerning the J-curve issue in Czechia, in addition, their
results are mixed. Among studies, which do not confirm the J-curve for Czechia is Bahmani-
Oskooee and Kutan (2009) who made an extensive study for emerging Europe. Based on data
from 12 countries covering the period 1990-2005 they found empirical support for the J-curve
effect in Bulgaria, Croatia and Russia. By contrast, no evidence of the J-curve effect was
revealed for the Czech Republic. By application a similar methodology, Nusair (2013) tested 17
aggregate trade balances of emerging and transition countries over the period 1991-2012.
While the J-curve effect was present in Armenia, Georgia and the Ukraine, the Czech economy
still remained free of the J-curve effect. No evidence of this effect can be found also in Hsing
(2009), who examined the J-curve for bilateral trade of six CEE countries including Czechia.
Contrary, two studies confirmed existence of some characteristics associated with the J-
curve effect on bilateral basis. Hacker and Hatemi (2004) tested the J-curve for Czechia,
Hungary and Poland in their bilateral trade with Germany. This study came to the conclusion
that trade balance deteriorates within a few months after depreciation and then rises to a long
run equilibrium value higher than the initial one. The J-curve effect in bilateral trade between
Czechia and Germany was empirically confirmed also in Simakova (2012) by applying a
traditional methodology comprising Johansen cointegration and error correction model.
Moreover, Simakova (2012) found the J-curve also in the Czechia’s trade with Poland.
The only study made for the Czech Republic in the third-generation way was paper by
Simakova and Stavarek (2014). They considered the major trading partners of the Czech
Republic (Austria, Germany, France, Italy, Poland and Slovakia) and selected product
categories, determined on the basis of SITC classification. They employed the Johansen
cointegration test to analyse the long term relationship and a vector error correction model to

284
explore the short term effects of exchange rate level of Czech koruna. Although their findings
suggest that product group of food and live animals is related with exchange rate in the long
term, the J-curve effect was not confirmed in this sector.
In summary, the existing empirical literature on the J-curve phenomenon concerning the
Czech Republic and its international trade is very limited. Results of the few previously
published studies indicate almost no evidence for the J-curve effect, i.e. no effect of the CZK
depreciation on the Czech trade balance. In addition, none of them is made in third-generation
way for the particular agricultural sector. As compared to other papers, this study uses the
most recent available data on international trade on the commodity level to avoid the
aggregation bias problem which can influence the results. Therefore, this study substantially
contributes to scientific discussion in this field and fills the gap in literature about bilateral
agricultural trade.
Model and data specification
This study employs a reduced form of trade balance model to analyse the long-run effects
of changes in exchange rate on the trade balance. They use a trade model in which trade
balance is expressed as a function of exchange rate and the domestic and foreign income. The
Johansen cointegration procedure is applied to avoid the main criticism of early studies, whose
results could suffer from spurious regression problem because of non-stationary data. For
empirical analysis of agricultural trade, the model is specified as follows (1):
𝑙𝑛𝑇𝐵𝑝,𝑡 = 𝛼 + 𝛽𝑙𝑛𝑌𝑑,𝑡 + 𝛾𝑙𝑛𝑌𝑓,𝑡 + 𝜆𝑙𝑛𝐸𝑅𝑓,𝑡 + 𝜀𝑡
(1)
where TBp is a measure of the trade balance in time period t defined as the ratio of exports of
the Czech Republic to country f over the Czech imports from country f in a selected product
group. Yd is measure of the Czech income (GDP) set in index form to make it unit free; Yf is
the income of trading partner f and ERf is the bilateral exchange rate. The exchange rate is
defined in a manner that an increase reflects a depreciation of the CZK. 𝜀𝑡 represents an error
term.
Since an increase in foreign income Yf is expected to increase the Czech exports to
respective country, an estimate of γ is expected to be positive. Contrary, since an increase in
Czech income Yd is assumed to increase the Czech imports, an estimate of β is expected to be
negative. Finally, the parameter λ is expected to be positive as the trade balance of respective
industry should improve due to CZK depreciation.
In order to test the short run relationship a short term dynamics is incorporated into the
long run model. According to Hsing (2009) we apply the following error correction model (2):
∆𝑙𝑛𝑇𝐵𝑝,𝑡 = 𝛼 + ∑ 𝜔𝑘∆𝑙𝑛𝑇𝐵𝑡−𝑘 + ∑ 𝛽𝑘∆𝑙𝑛𝑌𝑑,𝑡−𝑘𝑛𝑘=1 + ∑ 𝛾𝑘∆𝑙𝑛𝑌𝑓,𝑡−𝑘
𝑛𝑘=1 +𝑛
𝑘=1
∑ λ 𝑘∆𝑙𝑛𝐸𝑅𝑓,𝑡−𝑘
𝑛𝑘=1 + 𝜗𝑘𝐸𝐶𝑡−1 + 𝜀𝑡 (2)
where EC is the disequilibrium term and 𝜗𝑘𝐸𝐶𝑡−1 represents the error correction mechanism.

285
All time series used for estimation are in the quarterly frequency and cover the period from
1999:1 to 2013:4. Data for GDP and exchange rate are obtained from the OECD iLibrary
statistical database in current prices denominated in US dollars. Data for imports and exports
flows are obtained from the Czech Statistical Office in US dollars as well. Development of total
agricultural trade in the sample period can be seen in Figure 1.
Source: authors’ construction based on data from Czech Statistical Office Database
Fig. 1. Development of Czech Agricultural Trade (1999 – 2013, USD)
Estimated product groups representing the commodity structure of trade in agricultural
sector are determined on the basis of 2 digit SITC classification:
00 Live animals;
01 Meat and meat preparations;
02 Dairy products and eggs;
03 Fish, crustaceans, molluscs etc.;
04 Cereals and cereal preparations;
05 Vegetables and fruit;
06 Sugars, sugar prep. and honey;
07 Coffee, tea, cocoa, spices;
08 Animal feeds, excl. unmilled cereals;
09 Miscellaneous edible products;
11 Beverages;
12 Tobacco and tobacco manufactures;
41 Animal oils and fats;
42 Fixed vegetable fats and oils;
43 Animal/vegetable fats/oils,
processed
-4,000,000,000
-2,000,000,000
0
2,000,000,000
4,000,000,000
6,000,000,000
8,000,000,000
10,000,000,000
12,000,000,000
EXPORT
IMPORT
TRADE BALANCE

285
Empirical results
In empirical estimation we work with five largest trading partners of the Czech Republic
(Austria, Germany, Italy, Poland and Slovakia). The selection of trading partners is based on
total trade turnover in the Czech agricultural trade. The total share of selected countries is
more than 50% on average during the sample period. Logarithmic transformation was
performed to reduce skewness and heteroscedasticity and to stabilize variability. Integration of
time series was determined using the augmented Dickey-Fuller test. The augmented Dickey-
Fuller test for each individual time series confirmed the presence of unit roots, which is the
basic precondition of cointegration between variables.
Since the choice of lag orders of the variables in the vector error correction model
specification can have a significant effect on the inference drawn from the model, the
appropriate lag length for each variable is sequentially determined. The optimal lags for each
estimated trading partner within different product groups were determined on the basis of
Schwarz information criterion. Results of the cointegration procedure can be seen in Table 1.

286
Table 1
Estimated Long Run Coefficients of Trade Models
AT DE IT PL SK
Yd Yf ER Yd Yf ER Yd Yf ER Yd Yf ER Yd Yf ER
00 No cointegration -
4.00
-
2.97
-
1.31 Data not available
-
4.63 6.79 2.80
-
4.98 0.17 -1.08
01 -
3.77
-
1.63
-
6.69
-
6.22
-
3.97
-
1.06 -1.83 3.85
-
1.08
-
15.4 13.76
-
0.91
-
2.09 2.23 2.87
02 -
4.41 1.71
-
6.23 6.81 5.18 1.76 No cointegration
-
7.59 6.6
-
2.27
-
2.92 7.92 1.79
03 No cointegration -
8.94
-
6.52
-
2.34 No cointegration
-
5.34 6.26
-
3.67
-
0.90 -0.10 -4.52
04 No cointegration 9.78 7.08 2.69 No cointegration 0.17 0.49 3.37 -
7.48 2.66
-
10.84
05 No cointegration -
7.02 2.64
-
9.35 0.51 16.0 7.34
-
2.21 2.64 2.16 No cointegration
06 No cointegration No cointegration No cointegration No cointegration No cointegration
07 4.51 1.36 5.26 -
4.69
-
3.45
-
1.41 No cointegration
-
2.14 -0.24
-
1.99
-
8.15 7.74 4.61
08 -
4.46 6.55
-
1.43 3.08 5.85 1.32
-
13.63 1.28
-
4.67
-
2.04 -1.71
-
0.48 2.49 -0.25 3.28
09 No cointegration No cointegration No cointegration No cointegration -
0.39 0.58 1.22
11 -
2.20
-
2.43
-
1.19 No cointegration No cointegration
-
6.67 4.68
-
1.46 No cointegration
12 Data not available No cointegration Data not available Data not available Data not available
41 Data not available Data not available Data not available Data not available -
17.1 14.52
-
13.58
42 Data not available Data not available Data not available Data not available No cointegration
43 No cointegration -
15.9 19.6 2.55 Data not available
-
4.20 -2.37
-
3.32
-
16.7 10.66 -1.45
Source: author’s calculations
As can be seen in Table 1, only some product categories are significantly connected with
exchange rate movements in the long term. With respect to data availability, the least number
of cointegrated sectors are in trade with Italy (01, 05 and 08). Per contra, in trade flows with
Poland can be observe only two product categories not connected in the long run relationship
(06 and 09). Sectoral analysis confirmed the long term relationship between analysed
variables in product categories of meat, meat preparations and animal feeds. Among products
without any cointegration are sugar, sugar preparations, honey, tobacco, tobacco
manufactures and fixed vegetable fats and oils. In comparison to results of Simakova and
Stavarek (2014), who revealed long term relationship in overall sector of food and animals,

287
one can see that deeper data disaggregation can help to avoid the bias of different analysed
effects and to detect the particular analysed effects.
As regards domestic income, the theoretical assumption of its negative effect on trade
balance was confirmed for most of the country-product group models but each bilateral trade
flows contains the exemption. In case of foreign income, most of cases met the theoretical
assumption and confirm its long term positive relationship with Czech particular trade balances
development as well. The results for variable of exchange rate are more less than ambiguous
but the positive effect is dominating. The increase in trade balance after depreciation can be
observed for trade with Austria in 07; Germany in 02, 04, 08, 43; Italy in 05; Poland in 00, 04,
05 and Slovakia in 01, 02, 07, 08, 09. In summary of long term analysis can be stated that
the theoretical assumptions for all variables were revealed only in bilateral trade flows of
animal/vegetable fats/oils with Germany; animals, vegetables and fruit with Poland; meat,
meat preparations, dairy products and eggs with Slovakia.
The estimations of vector error correction model are realized only for the variables, which
are found to cointegrate (parameters are stable). Paper proceed to examine the dynamic
responses by generating impulse response functions showing the response of the trade balance
to the CZK depreciation. As indicated before, the short run effects of depreciation are reflected
in the coefficient estimates obtained for the lagged value of the first differenced exchange rate
variable. The J-curve phenomenon should be supported by negative coefficients followed by
positive ones reflected into shape of the estimated J-curves. The representatives of estimated
responses can be seen in Figure 2.

288
Austria
01 02 07 08 11
Germany
00 01 02 03 04
05 07 08 43
Italy
01 05 08
Poland
00 01 02 03 04
05 07 08 11 43
Slovakia
00 01 02 03 04
07 08 09 41 43 Source: authors’ construction
Fig. 2. Estimated Bilateral J-curves of Czechia in cointegrated product categories
Graphical representations of the impulse response functions present only few typical J-
curves. As indicated before, the short run effects of depreciation are reflected in the coefficient
estimates obtained for the lagged value of the first differenced exchange rate variable. The
traditional J-curve is, thus, confirmed if the estimate of coefficient for exchange rate is
significantly negative at lower lags and is followed by a significantly positive coefficient at
longer lags. In this study, impulse response functions confirm the theoretical short run
assumptions for Italy in trade with vegetables and fruit; Poland in trade with cereals and
animal feeds; Slovakia in trade with meat, meat preparations, dairy product, eggs and fish. For
-.09
-.08
-.07
-.06
-.05
-.04
-.03
-.02
-.01
.00
1 2 3 4 5 6 7 8 9 10
Response of LNT01 to CholeskyOne S.D. LNER Innovation
-.08
-.06
-.04
-.02
.00
.02
.04
.06
1 2 3 4 5 6 7 8 9 10
Response of LNT02 to CholeskyOne S.D. LNER Innovation
.00
.04
.08
.12
.16
.20
1 2 3 4 5 6 7 8 9 10
Response of LNT07 to CholeskyOne S.D. LNER Innovation
-.04
.00
.04
.08
.12
.16
1 2 3 4 5 6 7 8 9 10
Response of LNT08 to CholeskyOne S.D. LNER Innovation
-.08
-.06
-.04
-.02
.00
.02
1 2 3 4 5 6 7 8 9 10
Response of LNT11 to CholeskyOne S.D. LNER Innovation
-.08
-.04
.00
.04
.08
.12
1 2 3 4 5 6 7 8 9 10
Response of LNT00 to CholeskyOne S.D. LNER Innovation
-.16
-.14
-.12
-.10
-.08
-.06
-.04
-.02
.00
.02
1 2 3 4 5 6 7 8 9 10
Response of LNT01 to CholeskyOne S.D. LNER Innovation
.00
.02
.04
.06
.08
.10
.12
.14
.16
1 2 3 4 5 6 7 8 9 10
Response of LNT02 to CholeskyOne S.D. LNER Innovation
-.10
-.08
-.06
-.04
-.02
.00
1 2 3 4 5 6 7 8 9 10
Response of LNT03 to CholeskyOne S.D. LNER Innovation
-.12
-.08
-.04
.00
.04
.08
.12
.16
.20
1 2 3 4 5 6 7 8 9 10
Response of LNT04 to CholeskyOne S.D. LNER Innovation
-.20
-.16
-.12
-.08
-.04
.00
1 2 3 4 5 6 7 8 9 10
Response of LNT05 to CholeskyOne S.D. LNER Innovation
-.05
-.04
-.03
-.02
-.01
.00
.01
1 2 3 4 5 6 7 8 9 10
Response of LNT07 to CholeskyOne S.D. LNER Innovation
-.06
-.05
-.04
-.03
-.02
-.01
.00
1 2 3 4 5 6 7 8 9 10
Response of LNT08 to CholeskyOne S.D. LNER Innovation
-.12
-.08
-.04
.00
.04
.08
.12
.16
1 2 3 4 5 6 7 8 9 10
Response of LNT43 to CholeskyOne S.D. LNER Innovation
-.36
-.32
-.28
-.24
-.20
-.16
-.12
-.08
-.04
.00
1 2 3 4 5 6 7 8 9 10
Response of LNT01 to CholeskyOne S.D. LNER Innovation
-.20
-.15
-.10
-.05
.00
.05
.10
1 2 3 4 5 6 7 8 9 10
Response of LNT05 to CholeskyOne S.D. LNER Innovation
-.24
-.20
-.16
-.12
-.08
-.04
.00
.04
1 2 3 4 5 6 7 8 9 10
Response of LNT08 to CholeskyOne S.D. LNER Innovation
-.16
-.12
-.08
-.04
.00
.04
.08
1 2 3 4 5 6 7 8 9 10
Response of LNT00 to CholeskyOne S.D. LNER Innovation
-.28
-.24
-.20
-.16
-.12
-.08
-.04
.00
.04
.08
1 2 3 4 5 6 7 8 9 10
Response of LNT01 to CholeskyOne S.D. LNER Innovation
-.12
-.10
-.08
-.06
-.04
-.02
.00
1 2 3 4 5 6 7 8 9 10
Response of LNT02 to CholeskyOne S.D. LNER Innovation
-.12
-.08
-.04
.00
.04
.08
.12
.16
.20
.24
1 2 3 4 5 6 7 8 9 10
Response of LNT03 to CholeskyOne S.D. LNER Innovation
-.16
-.14
-.12
-.10
-.08
-.06
-.04
-.02
.00
.02
1 2 3 4 5 6 7 8 9 10
Response of LNT04 to CholeskyOne S.D. LNER Innovation
-.06
-.05
-.04
-.03
-.02
-.01
.00
.01
.02
.03
1 2 3 4 5 6 7 8 9 10
Response of LNT05 to CholeskyOne S.D. LNER Innovation
-.02
.00
.02
.04
.06
.08
.10
1 2 3 4 5 6 7 8 9 10
Response of LNT07 to CholeskyOne S.D. LNER Innovation
-.35
-.30
-.25
-.20
-.15
-.10
-.05
.00
.05
1 2 3 4 5 6 7 8 9 10
Response of LNT08 to CholeskyOne S.D. LNER Innovation
-.08
-.07
-.06
-.05
-.04
-.03
-.02
-.01
.00
1 2 3 4 5 6 7 8 9 10
Response of LNT11 to CholeskyOne S.D. LNER Innovation
-.4
-.2
.0
.2
.4
.6
.8
1 2 3 4 5 6 7 8 9 10
Response of LNT43 to CholeskyOne S.D. LNER Innovation
-.06
-.05
-.04
-.03
-.02
-.01
.00
.01
.02
1 2 3 4 5 6 7 8 9 10
Response of LNT00 to CholeskyOne S.D. LNER Innovation
-.12
-.10
-.08
-.06
-.04
-.02
.00
1 2 3 4 5 6 7 8 9 10
Response of LNT01 to CholeskyOne S.D. LNER Innovation
-.020
-.015
-.010
-.005
.000
.005
.010
.015
.020
1 2 3 4 5 6 7 8 9 10
Response of LNT02 to CholeskyOne S.D. LNER Innovation
-.09
-.08
-.07
-.06
-.05
-.04
-.03
-.02
-.01
.00
1 2 3 4 5 6 7 8 9 10
Response of LNT03 to CholeskyOne S.D. LNER Innovation
-.08
-.07
-.06
-.05
-.04
-.03
-.02
-.01
.00
1 2 3 4 5 6 7 8 9 10
Response of LNT04 to CholeskyOne S.D. LNER Innovation
-.06
-.04
-.02
.00
.02
.04
.06
.08
.10
1 2 3 4 5 6 7 8 9 10
Response of LNT07 to CholeskyOne S.D. LNER Innovation
.00
.02
.04
.06
.08
.10
.12
1 2 3 4 5 6 7 8 9 10
Response of LNT08 to CholeskyOne S.D. LNER Innovation
-.002
.000
.002
.004
.006
.008
.010
.012
.014
1 2 3 4 5 6 7 8 9 10
Response of LNT09 to CholeskyOne S.D. LNER Innovation
-.1
.0
.1
.2
.3
.4
.5
1 2 3 4 5 6 7 8 9 10
Response of LNT41 to CholeskyOne S.D. LNER Innovation
-.25
-.20
-.15
-.10
-.05
.00
1 2 3 4 5 6 7 8 9 10
Response of LNT43 to CholeskyOne S.D. LNER Innovation

289
other cases, the J-curve phenomenon is not supported by estimated coefficients of exchange
rates. The results are similar to other studies concerned on Czechia (Bahmani-Oskooee &
Kutan, 2009; Nusair, 2013) where (despite revealed long term relationship) does not exist
almost no support for the J-curve effect. Theoretical short term and long term assumptions
were confirmed for the Czechia only in trade of meat and meat preparations with Slovakia.
Conclusions, proposals, recommendations
1. The aim of this study was to examine the short and long run effects of exchange rate
development on trade flows in the context of disaggregated agricultural data of bilateral trade
between the Czech Republic and its major trading partners (Austria, Germany, Italy, Poland
and Slovakia). Special attention was given to assess the characteristics of the J-curve effect in
different product groups and empirically identify whether Czech agricultural foreign trade could
benefit from depreciation of CZK. The Johansen cointegration test and the vector error
correction model were used for this purpose. The dataset used in this paper covers period from
1999:Q1 to 2013:Q4. Agricultural product groups are based on the SITC classification.
2. By relying on a relatively new approach of testing this relationship, this study shows that
the long term relationship between analyzed variables can be found for product categories of
meat, meat preparations and animal feeds. Among products without any cointegration are
sugar, sugar preparations, honey, tobacco, tobacco manufactures and fixed vegetable fats and
oils. The supposed indirect relationship of particular trade balances with domestic income and
per contra direct relationship with foreign income and currency depreciation were revealed
only in bilateral trade flows of animal/vegetable fats/oils with Germany; animals, vegetables
and fruit with Poland; meat, meat preparations, dairy products and eggs with Slovakia.
3. The theoretical short run assumptions were confirmed for Italy in trade with vegetables
and fruit; Poland in trade with cereals and animal feeds; Slovakia in trade with meat, meat
preparations, dairy product, eggs and fish. For other cases, the J-curve phenomenon is not
supported by estimated coefficients of exchange rates.
4. The effects of currency depreciation are less than ambiguous and cannot be generalized
across the analyzed product categories but in the sample period, increasing in trade balances
after currency depreciation dominates its decreasing and exchange rate as a macroeconomic
tool can represent an effective instrument of stimulating the agricultural foreign trade.
Acknowledgement
The article is processed as an output of a research project SGS/7/2013. The support by the
Student Grant System of Silesian University is gratefully acknowledged.
290
Bibliography
1. Abeysinghe, T., Yeak, T. J. (1998). Exchange Rate Appreciation and Export
Competitiveness. The case of Singapore. Applied Economics, Volume 30, pp. 51-55.
2. Auboin, M., Ruta, M. (2013). The Relationship between Exchange Rates and International
Trade: A Literature Review. World Trade Review, Volume 12, Issue 3, pp. 577-605.
3. Bahmani-Oskooee, M., Brooks, T. (1999). Cointegration Approach to Estimating Bilateral
Trade Elasticities between U.S. and Her Trading Partners. International Economic Journal,
Volume 13, Issue 4, pp. 119-128.
4. Bahmani-Oskooee, M., Hegerty, S. W. (2011). The J-curve and NAFTA: Evidence from
Commodity Trade between the U.S. and Mexico. Applied Economics, Volume 43, Issue 13,
pp. 1579-1593.
5. Bahmani-Oskooee, M., Kutan, A. (2009). The J-curve in the Emerging Economies Of
Eastern Europe. Applied Economics, Volume 41, Issue 20, pp. 2523-2532.
6. Bahmani-Oskooee, M., Ratha, A. (2004). The J-Curve: A Literature Review. Applied
Economics, Volume 36, Issue 13, pp. 1377-1398.
7. Bielik et al. (2010). Economics, Social Policy and Citizenship in the EU Evidence of V4
Countries and Perspectives for Ukraine. Nitra: SPU Nitra, 263 p.
8. Bradshaw, G. W., Orden. D. (1990). Granger Causality from the Exchange Rate to
Agricultural Prices and Export Sales. Western Journal of Agricultural Economics, Volume
15, pp. 100-110.
9. Douglason Godwin, O. (2009). Is There a J-Curve in Nigerian Agricultural Sector?
Agricultura tropica et subtropica, Volume 42, Issue 1, pp. 10-14.
10. Felmingham, B. (1988). Where Is The Australian J-Curve? Bulletin of Economic Research,
Volume 40, Issue 1, pp. 43-56.
11. Gardner, B. L. (1981). The Governing of Agriculture. Lawrence: Regents Press of Kansas.
12. Gupta-Kapoor, A., Ramakrishnan, U. (1999). Is there a J-curve? A New Estimation for
Japan. International Economic Journal, Volume 13, Issue 4, pp. 71-79.
13. Hacker, R., Hatemi, A. (2004). The Effect of Exchange Rate Changes on Trade Balances in
the Short and Long Run. Evidence from German Trade with Transitional Central European
Economies. The Economics of Transition, Volume 12, Issue 4, pp. 777-799.
14. Horska et al. (2011). European Studies on Intercultural Dimension of International
Business. Nitra: SPU.
15. Hsing, Y. (2009). Test of the J-curve for Six Selected New EU Countries. International
Journal of Economic Policy in Emerging Economies, Volume 2, Issue 1, pp. 76-85.
16. Magee, S. P. (1973). Currency Contracts, Pass Through and Devaluation. Washington,
D.C.: Brooking Papers on Economic Activity, p. 303.
17. Nusair, S. A. (2013). The J-curve in Transition Economies: An Application of the ARDL
Model. Academic and Business Research Institute. Retrieved
http://www.aabri.com/NO2013Manuscripts/NO13042.pdf. Access :15.04.2014
18. Simakova, J. (2012). Estimation of the J-Curve Effect: The Case of Visegrad Group. In
EBES 2012 Warsaw Conference Proceedings (p. 9). Istanbul: Teknik Basim Matbaacilik.
19. Simakova, J., Stavarek, D. (2014). Exchange-Rate Impact on the Industry-Level Trade
Flows in the Czech Republic. Procedia Economics and Finance, Volume 1, pp. 679 – 686.
20. Svatos, M., Smutka, L. (2012). Development of Agricultural Trade and Competitiveness of
the Commodity Structures of Individual Countries of the Visegrad Group. Agricultural
Economics, Volume 58, Issue 5, pp. 222-238.

291
21. Yazdani, S., Shajari, S. (2009). The Impact of Macroeconomic Indicators on Agricultural
Trade Balance of Iran. American Journal of Applied Sciences, Volume 6, Issue 8, pp. 1473-
1477.
22. Yazici, M. (2006). Is There a J-Curve Effect Observable in Turkish Agricultural sector?
Journal of Central European Agriculture, Volume 7, Issue 2, pp. 319-322.