Economic Regulation Authority inquiry into water resources ... DOW - ERA inquiry into... ·...
81
Looking after all our water needs Economic Regulation Authority inquiry into water resources management and planning charges Costing of water activities
Transcript of Economic Regulation Authority inquiry into water resources ... DOW - ERA inquiry into... ·...
Looking after all our water needs
SCT_Online Print_Final_A4.indd 1 31/05/10 11:08 AM
Economic Regulation Authority inquiry into water resources management and planning charges
Costing of water activities

Economic Regulation Authority inquiry into water resources management and planning charges
Costing of water activities
Department of Water 168 St Georges Terrace Perth Western Australia 6000 Telephone +61 8 6364 7600 Facsimile +61 8 6364 7601 www.water.wa.gov.au
© Government of Western Australia 2010
May 2010
This work is copyright. You may download, display, print and reproduce this material in unaltered form only (retaining this notice) for your personal, non-commercial use or use within your organisation. Apart from any use as permitted under the Copyright Act 1968, all other rights are reserved. Requests and inquiries concerning reproduction and rights should be addressed to the Department of Water.
ISBN 978-1-921789-21-2 (online)
Disclaimer
This document has been published by the Department of Water. Any representation, statement, opinion or advice expressed or implied in this publication is made in good faith and on the basis that the Department of Water and its employees are not liable for any damage or loss whatsoever which may occur as a result of action taken or not taken, as the case may be in respect of any representation, statement, opinion or advice referred to herein. Professional advice should be obtained before applying the information contained in this document to particular circumstances.
This document represents the current views of the Department of Water only. It should not be taken to reflect the views of the Minister for Water, or the Government of Western Australia.
Enquiries
Any enquiries about the content of this document should be directed to Ms Naomi Arrowsmith, Manager, Strategic Projects, Office of Director General, telephone 98410100, or email [email protected]
Economic Regulation Authority inquiry into water resources management and planning charges, costing of water activities
____________________________________________________________________________________________________________
Department of Water iii
Contents Contents ..................................................................................................................... iii
Summary ..................................................................................................................... v
1 Purpose and content of this submission .................................................................. 1
1.1 Background ...................................................................................................................... 1 1.2 Content and structure of this submission ......................................................................... 2
2 Principles and approach .......................................................................................... 3
2.1 Principles for cost recovery .............................................................................................. 3 2.2 Approach .......................................................................................................................... 6 2.3 Functions and activities for cost recovery ........................................................................ 7 2.4 Methodology for identifying costs ................................................................................... 11
Sources of costing information .............................................................................................................. 11 Costing approach................................................................................................................................... 12 External funds ........................................................................................................................................ 13
2.5 Calculation of on-costs ................................................................................................... 13 2.6 Variation in unit costs between this submission and the department’s annual reports ... 15 2.7 Identifying the impactors, beneficiaries, and private/public benefit proportion of each
activity ............................................................................................................................ 15 Impactors and beneficiaries ................................................................................................................... 15 Private/public benefit proportion ............................................................................................................ 16
3 The cost of our activities ........................................................................................ 17
3.1 Urban water management and industry services ........................................................... 17 Drainage and water management planning ........................................................................................... 17 Arterial drainage studies ........................................................................................................................ 18 Statutory referrals .................................................................................................................................. 19 Floodplain management advice ............................................................................................................. 19 Water source protection planning .......................................................................................................... 20 Implementation of water source protection plans .................................................................................. 21 Preparation of guidance notes ............................................................................................................... 21
3.2 Water use allocation and optimisation ............................................................................ 22 Water allocation planning ...................................................................................................................... 22 Environmental water planning ............................................................................................................... 23 Water licensing policy ............................................................................................................................ 24 Water licensing and compliance ............................................................................................................ 25 Water licensing support ......................................................................................................................... 25 IWSS licensing ...................................................................................................................................... 26 Enforcement .......................................................................................................................................... 27 Metering 27
3.3 Water resource assessment, measurement and science ............................................... 28 Groundwater assessment, investigation and review .............................................................................. 28 Regional hydrogeological advice ........................................................................................................... 29 Surface water assessment .................................................................................................................... 30 Water information collection .................................................................................................................. 31 Water information management ............................................................................................................ 32 Water information provision ................................................................................................................... 33 Acquisition of P1 land ............................................................................................................................ 33 Land asset management ....................................................................................................................... 34
Economic Regulation Authority inquiry into water resources management and planning charges, costing of water activities
iv Department of Water
4 The cost of our services ........................................................................................ 35
4.1 Processing and assessment of applications for water licences and permits .................. 35 4.2 Licensing of the Water Corporation for the IWSS .......................................................... 42 4.3 Providing water allocations and managing the ongoing use of water ............................. 43 4.4 Protecting public drinking water sources ........................................................................ 56 4.5 Providing advice on statutory referrals ........................................................................... 60 4.6 Guiding urban drainage and water management ........................................................... 65 4.7 Providing floodplain management advice ....................................................................... 67 4.8 Providing water information ............................................................................................ 68
Economic Regulation Authority inquiry into water resources management and planning charges, costing of water activities
Department of Water v
Summary This submission provides information on the level of effort and costs involved in undertaking a range of water resource management and planning activities, as requested by the Economic Regulation Authority (ERA) related to its Inquiry in Water Resource Management and Planning Charges. The scope of the report is those activities which the ERA identified as potentially suitable for cost recovery in its draft report of December 2009.
This submission should be read in conjunction with our previous submission to the Inquiry – ‘Economic Regulation Authority inquiry into water resource management and planning charges – Response to the issues paper, June 2009’ - as we have not repeated the contextual information about the scope of, and rationale for, the activities we undertake.
Section 3 provides overall costing information at an activity level for three full financial years, 2006/07, 2007/08 and 2008/09, and for 8 months (July to February) of the current financial year. We have then used the 2008/09 financial year as the baseline to further analyse our activities on a cost per service basis.
The Department of Water’s total costs in 2008/09 were $107,974,000. This submission only addresses $55,543,684 (51 per cent) of these costs. This is the cost of activities which wholly or partly contribute to services which may be suitable for cost recovery.
The remaining costs, which are not addressed in this submission, are for those activities generally not suitable for cost recovery, either because they are for broader public benefit (such as waterways protection) or relate to issues such as legislation, strategic policy, or government processes.
Of the costs covered in this submission ($55,543,684), we identify that $39,755,591 (72 per cent) could be recovered from private parties. This amount reflects the proportion of these activities that contribute to the services we provide and the private benefit component for private parties who can be identified. For some activities, while we believe there is a private benefit component, we are unable to identify the private parties who derive this benefit; therefore we cannot recover the costs.
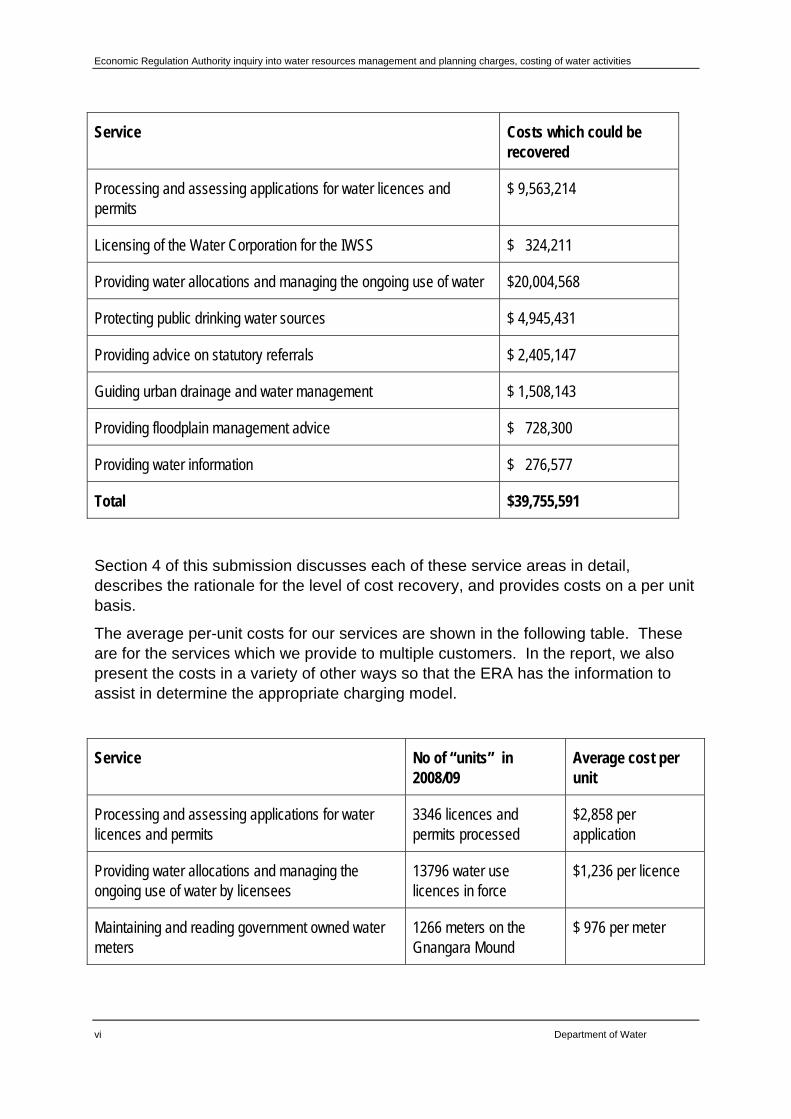
The following summary table shows the costs which could be recovered from private parties for each activity area. In providing these costings, we have used the best data available in the department. For some areas, we recognised the need to continue to collect costing data to further refine the costs of our services over time.
Economic Regulation Authority inquiry into water resources management and planning charges, costing of water activities
vi Department of Water
Service Costs which could be recovered
Processing and assessing applications for water licences and permits
$ 9,563,214
Licensing of the Water Corporation for the IWSS $ 324,211
Providing water allocations and managing the ongoing use of water $20,004,568
Protecting public drinking water sources $ 4,945,431
Providing advice on statutory referrals $ 2,405,147
Guiding urban drainage and water management $ 1,508,143
Providing floodplain management advice $ 728,300
Providing water information $ 276,577
Total $39,755,591
Section 4 of this submission discusses each of these service areas in detail, describes the rationale for the level of cost recovery, and provides costs on a per unit basis.
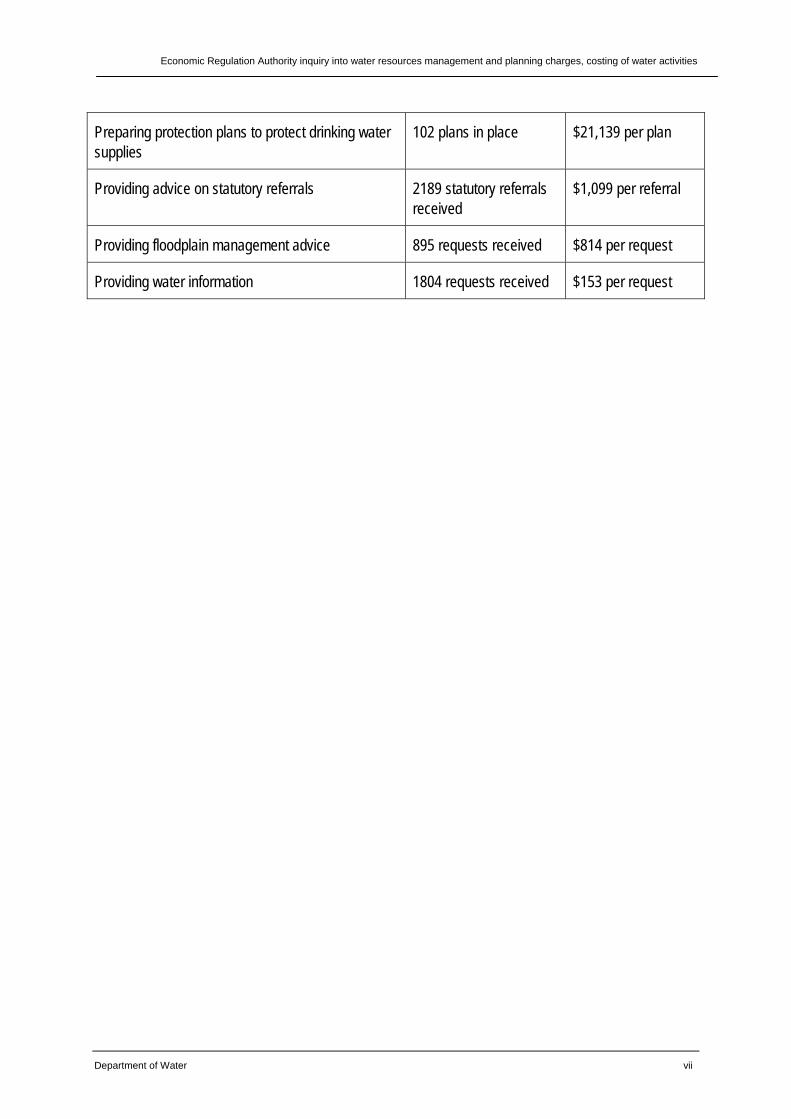
The average per-unit costs for our services are shown in the following table. These are for the services which we provide to multiple customers. In the report, we also present the costs in a variety of other ways so that the ERA has the information to assist in determine the appropriate charging model.
Service No of “units” in 2008/09
Average cost per unit
Processing and assessing applications for water licences and permits
3346 licences and permits processed
$2,858 per application
Providing water allocations and managing the ongoing use of water by licensees
13796 water use licences in force
$1,236 per licence
Maintaining and reading government owned water meters
1266 meters on the Gnangara Mound
$ 976 per meter
Economic Regulation Authority inquiry into water resources management and planning charges, costing of water activities
Department of Water vii
Preparing protection plans to protect drinking water supplies
102 plans in place $21,139 per plan
Providing advice on statutory referrals 2189 statutory referrals received
$1,099 per referral
Providing floodplain management advice 895 requests received $814 per request
Providing water information 1804 requests received $153 per request

Economic Regulation Authority inquiry into water resources management and planning charges, costing of water activities
____________________________________________________________________________________________________________
Department of Water 1
1 Purpose and content of this submission
1.1 Background
In December 2009, the Economic Regulation Authority (ERA) released a draft report on its ‘Inquiry into Water Resource Management and Planning Charges’. The draft report contains twenty three draft recommendations covering issues such as the principles for cost recovery, the allocation of costs between private and public users, and the recovery of costs for various water resource management and planning functions.
The draft report did not propose any indicative fees or charges, with the ERA saying that it required further information from the Department of Water before fees and charges can be determined. Specifically, the ERA made the following draft recommendations:
17. The Department is not able, at this stage, to provide the information need for the Authority to determine the efficiency or cost reflectivity of the costs to be allocated to licence holders.
18. The Department of Water is therefore asked to provide detailed information to the Authority about how its costs are incurred and allocated to various functions by the end of May 2010.
Through discussions with the department, it was agreed that the department would implement processes and systems to enable it to gather information on the levels of effort and costs involved in undertaking the water resource management and planning activities identified by the ERA for cost recovery.
The ERA also requested the department to provide advice on the allocation of the costs for each activity between private and public users, based on who is causing the costs to be incurred.
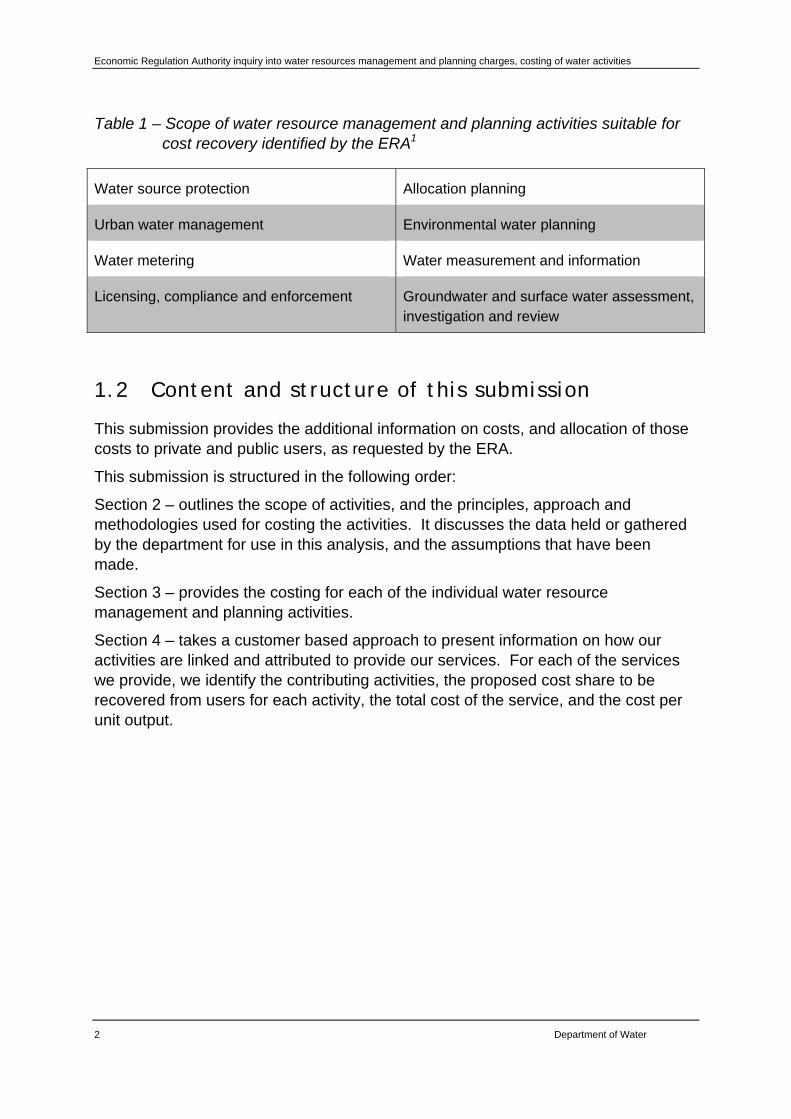
The scope of water resource management and planning activities covered in the draft report and in this submission is shown in Table 1.
The information requested by the ERA forms the content of this submission.
Economic Regulation Authority inquiry into water resources management and planning charges, costing of water activities
2 Department of Water
Table 1 – Scope of water resource management and planning activities suitable for cost recovery identified by the ERA1
Water source protection Allocation planning
Urban water management Environmental water planning
Water metering Water measurement and information
Licensing, compliance and enforcement Groundwater and surface water assessment, investigation and review
1.2 Content and structure of this submission
This submission provides the additional information on costs, and allocation of those costs to private and public users, as requested by the ERA.
This submission is structured in the following order:
Section 2 – outlines the scope of activities, and the principles, approach and methodologies used for costing the activities. It discusses the data held or gathered by the department for use in this analysis, and the assumptions that have been made.
Section 3 – provides the costing for each of the individual water resource management and planning activities.
Section 4 – takes a customer based approach to present information on how our activities are linked and attributed to provide our services. For each of the services we provide, we identify the contributing activities, the proposed cost share to be recovered from users for each activity, the total cost of the service, and the cost per unit output.
Economic Regulation Authority inquiry into water resources management and planning charges, costing of water activities
Department of Water 3
2 Principles and approach
2.1 Principles for cost recovery
Recommendation 1 of the ERA draft report outlines the principles which should apply to the recovery of water resource management and planning costs. Other recommendations (2, 5) also deal with the approach to cost recovery. These have been taken into account by the department in preparing the information in this submission.
However, the department has also taken account of the National Water Initiative (NWI) ‘Principles for recovering the costs of water planning and management activities’, as Western Australia will be required to demonstrate compliance with these principles through its participation in the NWI. The NWI principles are not inconsistent with the ERA principles.
Relevant excerpts of the ERA and NWI principles are shown in Table 2.
Economic Regulation Authority inquiry into water resources management and planning charges, costing of water activities
4 Department of Water
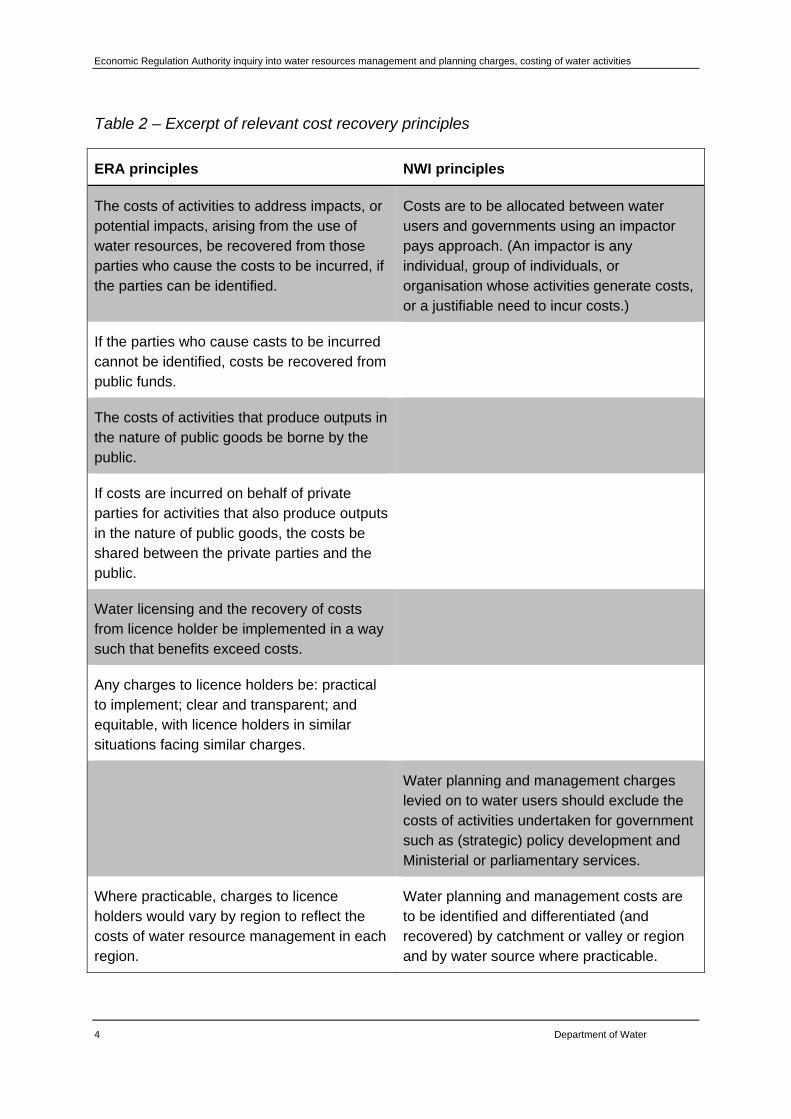
Table 2 – Excerpt of relevant cost recovery principles
ERA principles NWI principles
The costs of activities to address impacts, or potential impacts, arising from the use of water resources, be recovered from those parties who cause the costs to be incurred, if the parties can be identified.
Costs are to be allocated between water users and governments using an impactor pays approach. (An impactor is any individual, group of individuals, or organisation whose activities generate costs, or a justifiable need to incur costs.)
If the parties who cause casts to be incurred cannot be identified, costs be recovered from public funds.
The costs of activities that produce outputs in the nature of public goods be borne by the public.
If costs are incurred on behalf of private parties for activities that also produce outputs in the nature of public goods, the costs be shared between the private parties and the public.
Water licensing and the recovery of costs from licence holder be implemented in a way such that benefits exceed costs.
Any charges to licence holders be: practical to implement; clear and transparent; and equitable, with licence holders in similar situations facing similar charges.
Water planning and management charges levied on to water users should exclude the costs of activities undertaken for government such as (strategic) policy development and Ministerial or parliamentary services.
Where practicable, charges to licence holders would vary by region to reflect the costs of water resource management in each region.
Water planning and management costs are to be identified and differentiated (and recovered) by catchment or valley or region and by water source where practicable.

Economic Regulation Authority inquiry into water resources management and planning charges, costing of water activities
Department of Water 5
Economic Regulation Authority inquiry into water resources management and planning charges, costing of water activities
6 Department of Water
2.2 Approach
In preparing the information in this submission, the department has taken the general approach discussed below. This approach has been required because of the variety of activities that the department undertakes, and the functional dependencies of many of these activities.
1. Each of the department’s activities relevant to cost recovery has been divided down to the level required to reflect and differentiate the services provided, the functional dependencies between activities, and/or the private parties from who costs can be recovered. In some cases, this is to a finer level than discussed in the ERA draft report. The activities are further discussed in Section 2.3, and shown in Table 3.
2. Each of the activities has then been costed, using the methodology discussed in Section 2.4. The costing information for each activity is provided in Section 3.
3. Each activity has been then been apportioned to the various department services that it supports. Some activities support more than one service, and judgements have been made on the proportion of support provided to each service area. Where available, these judgements are based on data. The apportioning of activities to our services is discussed in Section 4.
4. Each activity within each of the service areas has also been apportioned to public or private benefit based on the cost-sharing principles given in section 2.1. The private benefit element is then the cost that should be recovered. This approach is further discussion in Section 2.7, and the results are given in Section 4.
5. The cost to be recovered for each service has been totalled from the private benefit component of various activities, or parts of activities, that it comprises.
6. The cost per unit output for each service has then been calculated, based on subsidiary information collected by the department.
Economic Regulation Authority inquiry into water resources management and planning charges, costing of water activities
Department of Water 7
2.3 Functions and activities for cost recovery
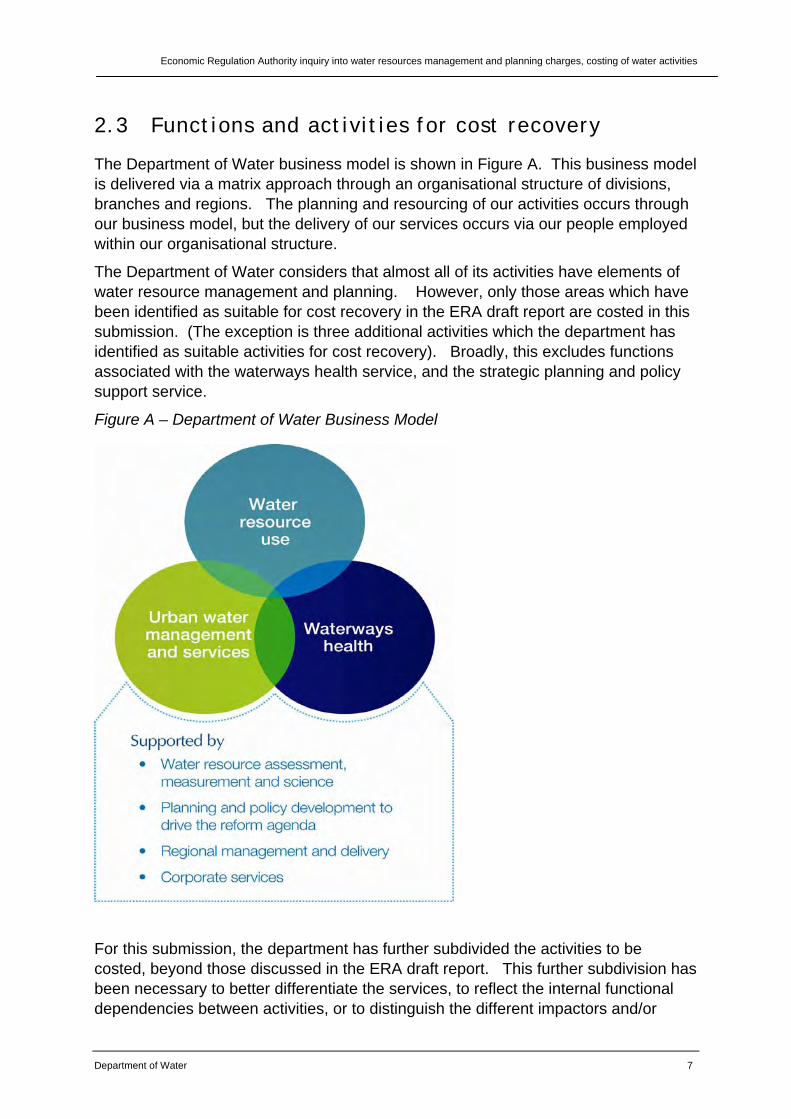
The Department of Water business model is shown in Figure A. This business model is delivered via a matrix approach through an organisational structure of divisions, branches and regions. The planning and resourcing of our activities occurs through our business model, but the delivery of our services occurs via our people employed within our organisational structure.
The Department of Water considers that almost all of its activities have elements of water resource management and planning. However, only those areas which have been identified as suitable for cost recovery in the ERA draft report are costed in this submission. (The exception is three additional activities which the department has identified as suitable activities for cost recovery). Broadly, this excludes functions associated with the waterways health service, and the strategic planning and policy support service.
Figure A – Department of Water Business Model
For this submission, the department has further subdivided the activities to be costed, beyond those discussed in the ERA draft report. This further subdivision has been necessary to better differentiate the services, to reflect the internal functional dependencies between activities, or to distinguish the different impactors and/or
Economic Regulation Authority inquiry into water resources management and planning charges, costing of water activities
8 Department of Water
beneficiaries of our services. The level of activities which have been costed in this submission, and their relationship to our business model and the functions discussed in the ERA draft report, are shown in Table 3.
Economic Regulation Authority inquiry into water resources management and planning charges, costing of water activities
Department of Water 9
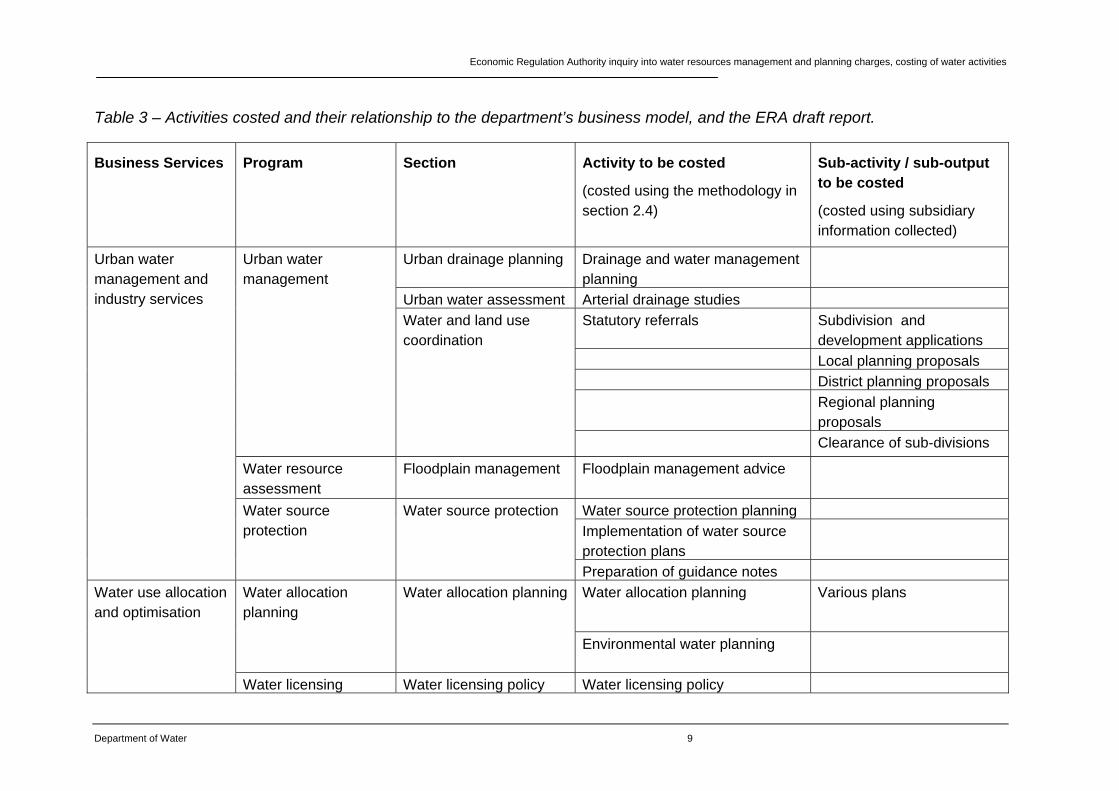
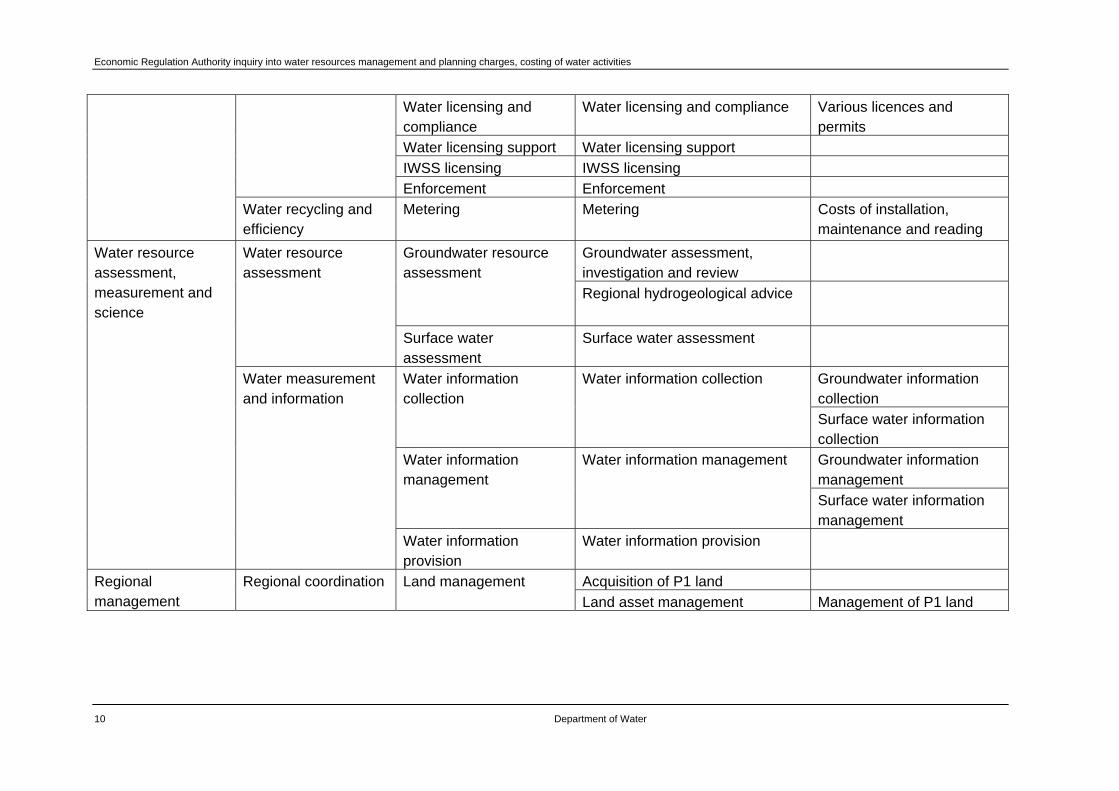
Table 3 – Activities costed and their relationship to the department’s business model, and the ERA draft report.
Business Services Program Section Activity to be costed
(costed using the methodology in section 2.4)
Sub-activity / sub-output to be costed
(costed using subsidiary information collected)
Urban water management and industry services
Urban water management
Urban drainage planning Drainage and water management planning
Urban water assessment Arterial drainage studies
Water and land use coordination
Statutory referrals Subdivision and development applications
Local planning proposals
District planning proposals
Regional planning proposals
Clearance of sub-divisions
Water resource assessment
Floodplain management Floodplain management advice
Water source protection
Water source protection Water source protection planning
Implementation of water source protection plans
Preparation of guidance notes
Water use allocation and optimisation
Water allocation planning
Water allocation planning Water allocation planning Various plans
Environmental water planning
Water licensing Water licensing policy Water licensing policy
Economic Regulation Authority inquiry into water resources management and planning charges, costing of water activities
10 Department of Water
Water licensing and compliance
Water licensing and compliance Various licences and permits
Water licensing support Water licensing support
IWSS licensing IWSS licensing
Enforcement Enforcement
Water recycling and efficiency
Metering Metering Costs of installation, maintenance and reading
Water resource assessment, measurement and science
Water resource assessment
Groundwater resource assessment
Groundwater assessment, investigation and review
Regional hydrogeological advice
Surface water assessment
Surface water assessment
Water measurement and information
Water information collection
Water information collection Groundwater information collection
Surface water information collection
Water information management
Water information management Groundwater information management
Surface water information management
Water information provision
Water information provision
Regional management
Regional coordination Land management Acquisition of P1 land
Land asset management Management of P1 land
Economic Regulation Authority inquiry into water resources management and planning charges, costing of water activities
Department of Water 11
2.4 Methodology for identifying costs
The department’s financial system is the primary source of information on the department’s costs. The cost centres in our financial system have been structured to report against the department’s outcome based management (OBM) approach, as required by government.
The finance system is not directly structured to provide activity based costs. Therefore, we have used a variety of systems and processes to complement the information from our finance system, so that we can provide the best information to the ERA.
Sources of costing information
The department has used three sources of information to provide the data in order to cost its activities. These data sources are described below, along with the assumptions that have been made and the limitations that apply to the data.
The department’s finance system
The primary data source for the cost information in this submission is the department’s finance system. The system is structured around projects aligned to the OBM model, rather than services we provide, but provides an auditable basis for costing projects. All department expenditure is allocated to a project code and therefore the finance system data provides the direct cost associated with each project code in terms of relevant labour costs, supplies and services.
The limitation of the finance system in costing activities is that the relationship between projects and activities is not consistent across the department. For some areas, the project level is not sufficiently detailed to attribute costs for individual services or support functions. In these cases, the department has used other sources of data discussed below.
For this submission, data from the finance system has been analysed for three full financial years (06-07, 07-08, 08-09), and for eight months of the existing financial year (1 July 2009 – 28 February 2010). This essentially captures costs of projects since the commencement of the Department of Water. Analysing costs over almost four financial years is essential as the duration of some of the department’s complex resource assessment and planning activities (eg allocation planning) is up to four years.
The department’s project management system
The department uses a project management system to maintain additional data on projects. Until the department rolled into the Office of Shared Services on 1 October 2009, the project management system was linked to the department’s finance system. This data includes the number and level of full time equivalent staff employed on each project.
Economic Regulation Authority inquiry into water resources management and planning charges, costing of water activities
12 Department of Water
Data on the project management system from 1 July 2006 has been used to provide FTE information so that on-costs for the corporate support activities could be attributed back to projects on an FTE basis. The approach to on-costs is discussed in more detail in Section 2.5.
The limitation of the project management system for this purpose is that the FTE data is planned FTE as of the commencement of the financial year, which does not correspond to actual FTE employed due to position vacancies. Overall, our vacancy rate averages around 10 per cent at any one time.
However, our project management system is the only readily available source of information on FTEs at a project level over the four year period, and as such has been used for distributing our on-costs. In using the planned FTE, we assume that the vacancy rate is evenly distributed over the department.
Subsidiary information - time sheets, service logs, branch and staff work plans
For two functions – water licensing and the provision of advice on statutory referrals – the department put in place a time-sheet process to capture staff time on an activity basis. The short duration of these two processes enabled the department to capture this data during early 2010 in order to provide a more robust basis for costing individual service activities or outputs in this submission.
Customer service logs were already maintained for a number of activities, generally to provide key performance indicator data. These include data on statutory referrals processed, the provision of water information to external customers, and the provision of floodplain management advice. Where available, this data was used to cost activities at a per output level.
The department’s branch and staff work plans provide information about the allocation of staff time to sub-projects or activities. This provided another mechanism to further analyse project information from the finance system in order to provide sub-activity costings. Branch and staff work plans are planning tools used by branches to allocate work among staff, and they do not provide information on actual time spent. However, they did provide some further subsidiary information where there was insufficient data from other sources.
Costing approach
The following methodology was used to cost activities in this submission:
1. For each of the activities listed in Table 3, the relevant project cost codes which contribute to that activity were identified from the finance system, for each of the four financial years.
2. The expenditure attributed to each project code was extracted from the finance system.
3. For each project code, the annual FTE was extracted from the project management system, and the FTEs were then apportioned to geographical locations based on advice from the project managers.
Economic Regulation Authority inquiry into water resources management and planning charges, costing of water activities
Department of Water 13
4. On-costs for each project were calculated, based on FTE by location, using the methodology described in section 2.5.
5. On-costs were then added to the expenditure information extracted from the financial system for each project.
6. The projects were then totalled for each activity to give the overall activity costs.
7. The costs of sub-activities which could not be directly costed from the financial system was then determined using one or more of the source of subsidiary information available.
External funds
In some instances, the department has included in the cost estimates, projects which received funds from external sources, primarily as commonwealth grants. We have only included those external funds which relate to necessary water management and planning activities and which have contributed directly to the delivery of services, or which have contributed to the efficiency of other activities. The costs of these projects (which are typically one off or short term arrangements) need to be included to provide a complete picture of the full cost of the department’s water resource management and planning activities. Where external funds have been included, we have shown the income and described its source.
2.5 Calculation of on-costs
There are three categories of on-costs that have been calculated for each project code, based on the number and location of FTE assigned to that project code. These are:
corporate on-costs (including finance and administration, human resources, information technology and the corporate executive);
regional administration on-costs (the costs of accommodation and operation of each regional office, being Kimberley, Kwinana Peel, Mid West Gascoyne, Perth, Pilbara, South Coast, South West and Swan Avon); and
divisional executive costs (the costs of the executive for the Water Resource Use, Water Resource Management and Regional Management and Water Information divisions).
A similar methodology was adopted to calculate an FTE rate for each on-cost category, as outlined below:
1. The relevant project codes within each of the on-cost categories were identified from the finance system for each of the four financial years.
Economic Regulation Authority inquiry into water resources management and planning charges, costing of water activities
14 Department of Water
2. Within each on-cost category, the expenditure information for each relevant project code was summed to determine the total cost of each corporate division, regional office and divisional executive listed above.
3. The total number of FTEs within each division and within each regional location were extracted from the project management system.
4. An on-cost FTE rate was calculated for each on-cost category.
the corporate on-cost FTE rates are based on all department FTEs;
the regional administration on-cost FTE rates are based on the FTEs within each region;
the divisional executive on-cost FTE rates are based on the FTE within each division.
5. These rates are then applied to the FTE figures and locations for each project code to calculate the appropriate on costs.
Those parts of the organisation that have been included in the on-cost model include the finance, human resources, information services branches and corporate executive (although some large one off corporate costs have been excluded such as the shared services implementation). Furthermore the costs associated with operating and administering the regional offices have also been included where appropriate. The department also identified internal branch support costs that underpin its core activities (for example, the licensing sub-program management supports the licensing branch activities). The costs of these support functions (including on-costs) have been reallocated across the branch activities on an FTE basis to determine the full cost of each core activity.
The costs associated with the Office of Director General (ODG) have been excluded from the on-cost model on the basis that:
the NWI cost recovery principles excludes costs associated with Ministerial and Parliamentary services, which are provided by the ODG;
the ODG includes functions associated with integrity and standards, and corporate reporting, which the department also considers should be exempt; and
while the ODG includes a communication group, this is focussed on strategic communication. All costs related to specific activity communications are captured within the project codes.
No projects which were externally funded have been included in the on cost categories.
Economic Regulation Authority inquiry into water resources management and planning charges, costing of water activities
Department of Water 15
2.6 Variation in unit costs between this submission and the department’s annual reports
This report presents cost per unit output for a number of activities undertaken by the department. Costs for some of these activities are also given in the department’s annual reports as part of the key performance indicators presented to government.
For a number of outputs, the costs in this report vary considerably from those in the annual report because different methodologies have been used. The differences generally relate to:
the extent to which activity costs of have been subdivided;
the extent to which indirect but contributing activities have been included in the costs; and/or
differences in dealing with output, such as plans, which take greater than one year to produce (for example, some KPIs are reported as rolling averages).
2.7 Identifying the impactors, beneficiaries, and private/public benefit proportion of each activity
Impactors and beneficiaries
In order to manage the impacts of land and water use on water resources, the department undertakes a range of water resource management and planning activities. The reason for undertaking these activities, and the costs which are incurred as a result, is the potential impact caused by the land and water users – that is, the impactors. However, there are also beneficiaries of the water resource management and planning activity that the department undertakes.
In order to apply the cost-recovery principles discussed in Section 2.1, the department has identified the impactors for its activities.
Impactors - individuals, groups or organisations who cause the service or activity to be undertaken, and therefore the costs to be incurred.
However, there are also beneficiaries of the water resource management and planning activity that the department undertakes. In some cases, the department believes it is appropriate to recover costs from the beneficiaries.
Beneficiaries - individuals, groups or organisation who derive a benefit from the service or activity (but who do not cause it to be undertaken).
In the case of both impactors and beneficiaries, recovering costs requires that they can be specifically identified. However, for some of the department’s activities, particularly those of a more strategic nature, the impactors or beneficiaries cannot be identified. In these cases the public bears the cost of the activity.
The department has analysed the impactors and beneficiaries for each of its activities, and the outcome of this assessment is provided in Section 4.
Economic Regulation Authority inquiry into water resources management and planning charges, costing of water activities
16 Department of Water
Private/public benefit proportion
Many of the activities undertaken by the department have both a private (either to impactors or beneficiaries) and public good element. In such cases, the cost is shared between the private parties and the public. This requires the department to identify the relative proportion of private/public benefit for each of its activities.
There is no direct way to measure the proportion of private/public benefit. It has required the department to make judgements based on the nature of the activity, the nature of the benefits, and the significance of the benefits.
Section 4 discusses the recommended proportions and rationale for each activity.
Economic Regulation Authority inquiry into water resources management and planning charges, costing of water activities
Department of Water 17
3 The cost of our activities
This section provides a detailed analysis of the costs of each of the department’s water resource management and planning activities listed in Table 3. Costs incurred are reported for three full financial years, 2006/07, 2007/08, 2008/09, and 8 months (July – Feb) of the current financial year, 2009/2010. The direct costs are determined from the Department’s financial system, and on-costs have been derived using the methodology discussed in sections 2.4 and 2.5.
3.1 Urban water management and industry services
Within this business area, we are responsible for developing strategies, management plans and land use planning initiatives to deliver sound and sustainable water, waterways and drainage management outcomes.
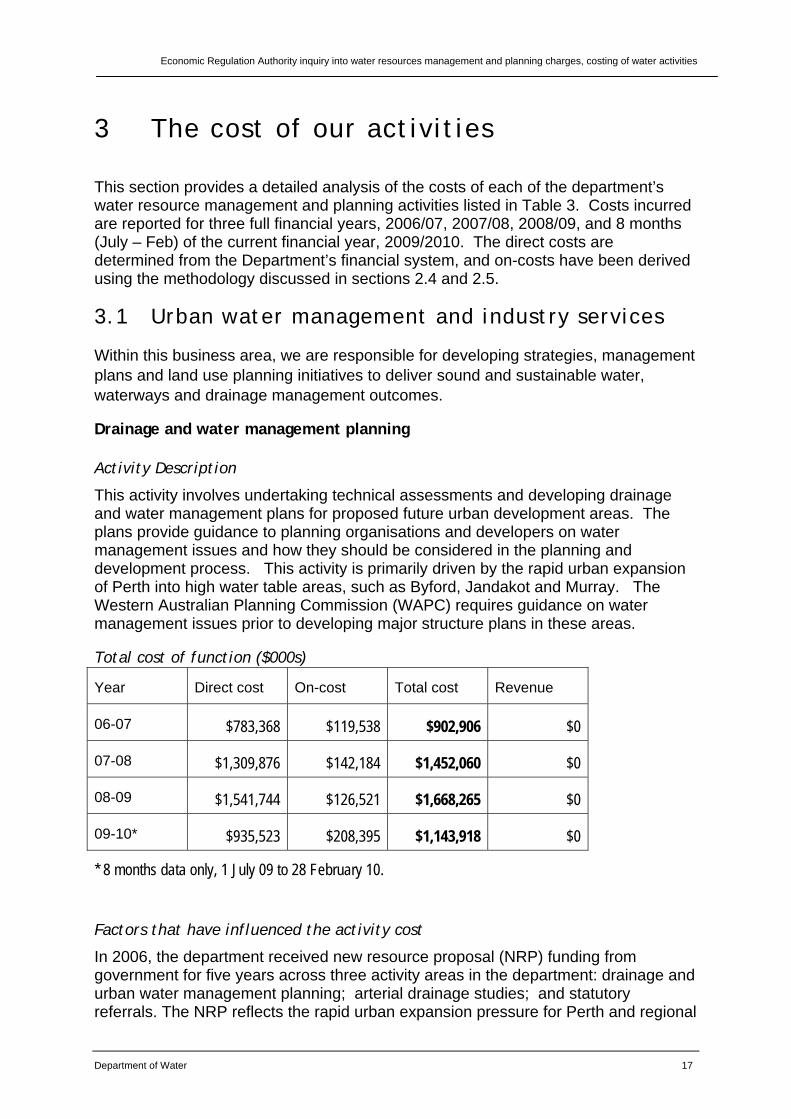
Drainage and water management planning
Activity Description
This activity involves undertaking technical assessments and developing drainage and water management plans for proposed future urban development areas. The plans provide guidance to planning organisations and developers on water management issues and how they should be considered in the planning and development process. This activity is primarily driven by the rapid urban expansion of Perth into high water table areas, such as Byford, Jandakot and Murray. The Western Australian Planning Commission (WAPC) requires guidance on water management issues prior to developing major structure plans in these areas.
Total cost of function ($000s)
Year Direct cost On-cost Total cost Revenue
06-07 $783,368 $119,538 $902,906 $0
07-08 $1,309,876 $142,184 $1,452,060 $0
08-09 $1,541,744 $126,521 $1,668,265 $0
09-10* $935,523 $208,395 $1,143,918 $0
* 8 months data only, 1 July 09 to 28 February 10.
Factors that have influenced the activity cost
In 2006, the department received new resource proposal (NRP) funding from government for five years across three activity areas in the department: drainage and urban water management planning; arterial drainage studies; and statutory referrals. The NRP reflects the rapid urban expansion pressure for Perth and regional
Economic Regulation Authority inquiry into water resources management and planning charges, costing of water activities
18 Department of Water
cities, and the need to address the impact of existing urban drainage on the Swan River and other waterways. The NRP was designed to increase in 2007/08, and this is reflected in the expenditure figures above. Subsequent changes in expenditure reflect small variations in the NRP, and some realignment in activity areas to reflect program focus and changing priorities.
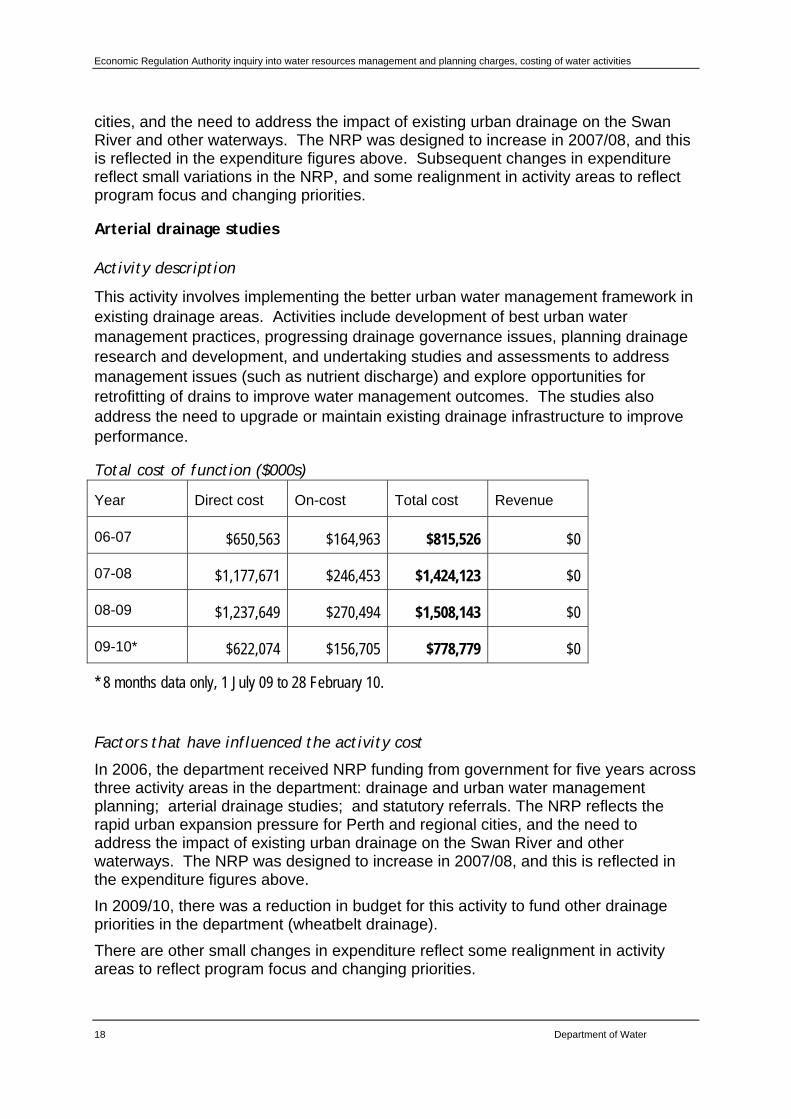
Arterial drainage studies
Activity description
This activity involves implementing the better urban water management framework in existing drainage areas. Activities include development of best urban water management practices, progressing drainage governance issues, planning drainage research and development, and undertaking studies and assessments to address management issues (such as nutrient discharge) and explore opportunities for retrofitting of drains to improve water management outcomes. The studies also address the need to upgrade or maintain existing drainage infrastructure to improve performance.
Total cost of function ($000s)
Year Direct cost On-cost Total cost Revenue
06-07 $650,563 $164,963 $815,526 $0
07-08 $1,177,671 $246,453 $1,424,123 $0
08-09 $1,237,649 $270,494 $1,508,143 $0
09-10* $622,074 $156,705 $778,779 $0
* 8 months data only, 1 July 09 to 28 February 10.
Factors that have influenced the activity cost
In 2006, the department received NRP funding from government for five years across three activity areas in the department: drainage and urban water management planning; arterial drainage studies; and statutory referrals. The NRP reflects the rapid urban expansion pressure for Perth and regional cities, and the need to address the impact of existing urban drainage on the Swan River and other waterways. The NRP was designed to increase in 2007/08, and this is reflected in the expenditure figures above.
In 2009/10, there was a reduction in budget for this activity to fund other drainage priorities in the department (wheatbelt drainage).
There are other small changes in expenditure reflect some realignment in activity areas to reflect program focus and changing priorities.
Economic Regulation Authority inquiry into water resources management and planning charges, costing of water activities
Department of Water 19
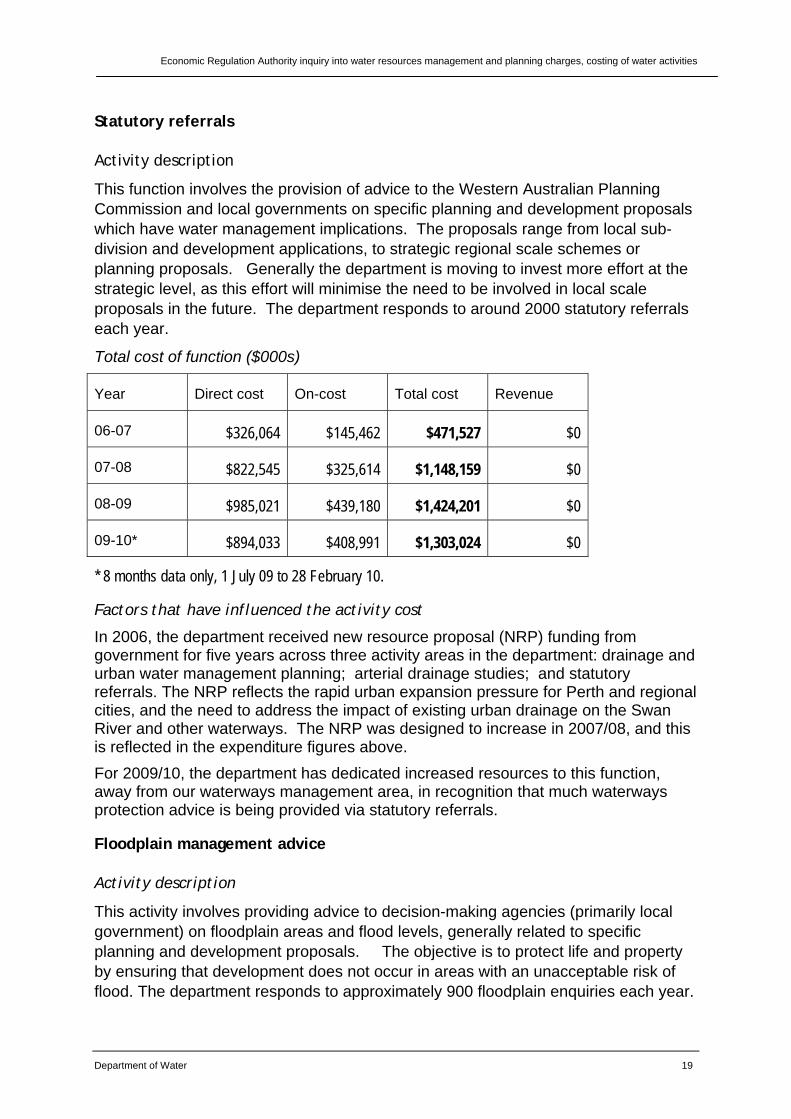
Statutory referrals
Activity description
This function involves the provision of advice to the Western Australian Planning Commission and local governments on specific planning and development proposals which have water management implications. The proposals range from local sub-division and development applications, to strategic regional scale schemes or planning proposals. Generally the department is moving to invest more effort at the strategic level, as this effort will minimise the need to be involved in local scale proposals in the future. The department responds to around 2000 statutory referrals each year.
Total cost of function ($000s)
Year Direct cost On-cost Total cost Revenue
06-07 $326,064 $145,462 $471,527 $0
07-08 $822,545 $325,614 $1,148,159 $0
08-09 $985,021 $439,180 $1,424,201 $0
09-10* $894,033 $408,991 $1,303,024 $0
* 8 months data only, 1 July 09 to 28 February 10.
Factors that have influenced the activity cost
In 2006, the department received new resource proposal (NRP) funding from government for five years across three activity areas in the department: drainage and urban water management planning; arterial drainage studies; and statutory referrals. The NRP reflects the rapid urban expansion pressure for Perth and regional cities, and the need to address the impact of existing urban drainage on the Swan River and other waterways. The NRP was designed to increase in 2007/08, and this is reflected in the expenditure figures above.
For 2009/10, the department has dedicated increased resources to this function, away from our waterways management area, in recognition that much waterways protection advice is being provided via statutory referrals.
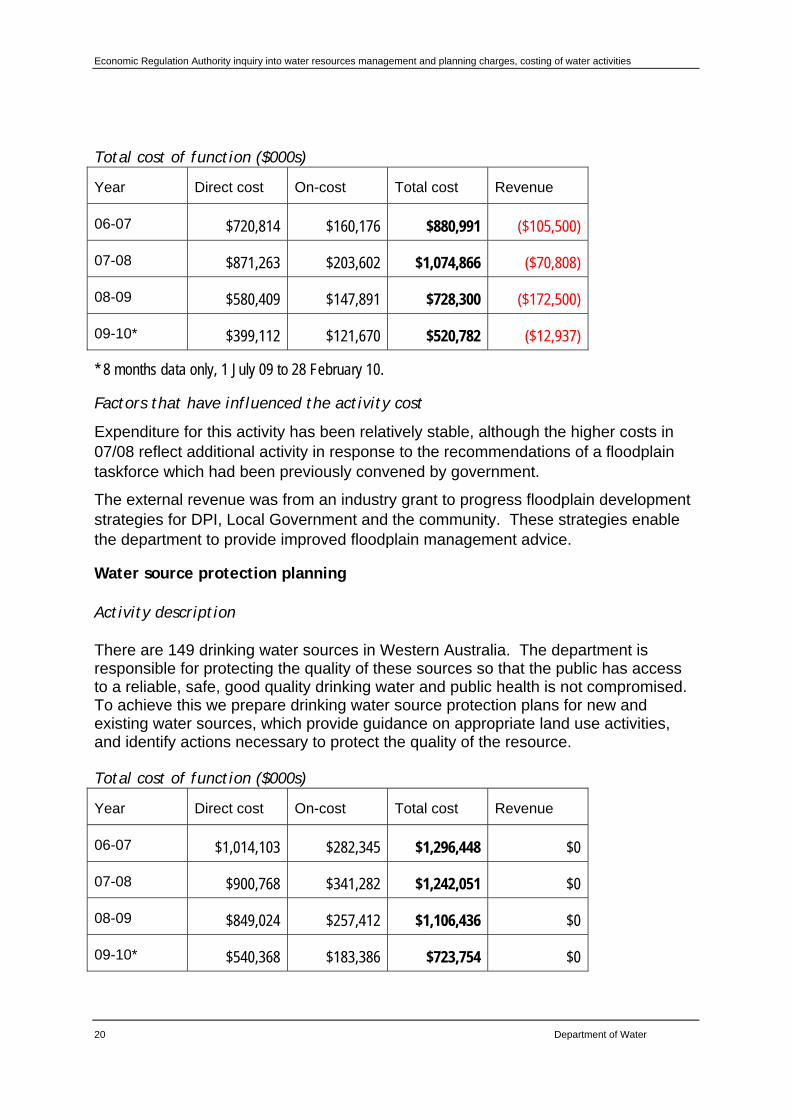
Floodplain management advice
Activity description
This activity involves providing advice to decision-making agencies (primarily local government) on floodplain areas and flood levels, generally related to specific planning and development proposals. The objective is to protect life and property by ensuring that development does not occur in areas with an unacceptable risk of flood. The department responds to approximately 900 floodplain enquiries each year.
Economic Regulation Authority inquiry into water resources management and planning charges, costing of water activities
20 Department of Water
Total cost of function ($000s)
Year Direct cost On-cost Total cost Revenue
06-07 $720,814 $160,176 $880,991 ($105,500)
07-08 $871,263 $203,602 $1,074,866 ($70,808)
08-09 $580,409 $147,891 $728,300 ($172,500)
09-10* $399,112 $121,670 $520,782 ($12,937)
* 8 months data only, 1 July 09 to 28 February 10.
Factors that have influenced the activity cost
Expenditure for this activity has been relatively stable, although the higher costs in 07/08 reflect additional activity in response to the recommendations of a floodplain taskforce which had been previously convened by government.
The external revenue was from an industry grant to progress floodplain development strategies for DPI, Local Government and the community. These strategies enable the department to provide improved floodplain management advice.
Water source protection planning
Activity description
There are 149 drinking water sources in Western Australia. The department is responsible for protecting the quality of these sources so that the public has access to a reliable, safe, good quality drinking water and public health is not compromised. To achieve this we prepare drinking water source protection plans for new and existing water sources, which provide guidance on appropriate land use activities, and identify actions necessary to protect the quality of the resource.
Total cost of function ($000s)
Year Direct cost On-cost Total cost Revenue
06-07 $1,014,103 $282,345 $1,296,448 $0
07-08 $900,768 $341,282 $1,242,051 $0
08-09 $849,024 $257,412 $1,106,436 $0
09-10* $540,368 $183,386 $723,754 $0
Economic Regulation Authority inquiry into water resources management and planning charges, costing of water activities
Department of Water 21
* 8 months data only, 1 July 09 to 28 February 10.
Factors that have influenced the activity cost
Water Source Protection received additional funding through an NRP from 06/07, following the Office of Auditor General’s 2003 report on the management of water resources. This provided funding to finalise 24 plans over 4 years.
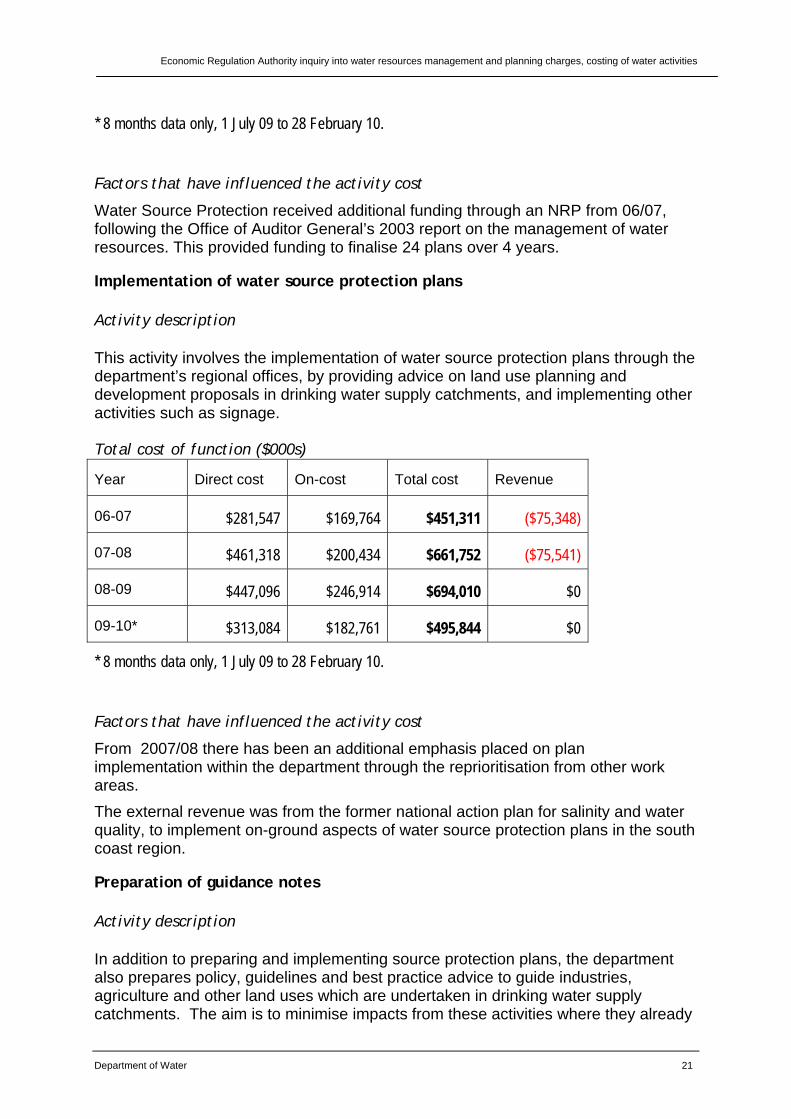
Implementation of water source protection plans
Activity description
This activity involves the implementation of water source protection plans through the department’s regional offices, by providing advice on land use planning and development proposals in drinking water supply catchments, and implementing other activities such as signage.
Total cost of function ($000s)
Year Direct cost On-cost Total cost Revenue
06-07 $281,547 $169,764 $451,311 ($75,348)
07-08 $461,318 $200,434 $661,752 ($75,541)
08-09 $447,096 $246,914 $694,010 $0
09-10* $313,084 $182,761 $495,844 $0
* 8 months data only, 1 July 09 to 28 February 10.
Factors that have influenced the activity cost
From 2007/08 there has been an additional emphasis placed on plan implementation within the department through the reprioritisation from other work areas.
The external revenue was from the former national action plan for salinity and water quality, to implement on-ground aspects of water source protection plans in the south coast region.
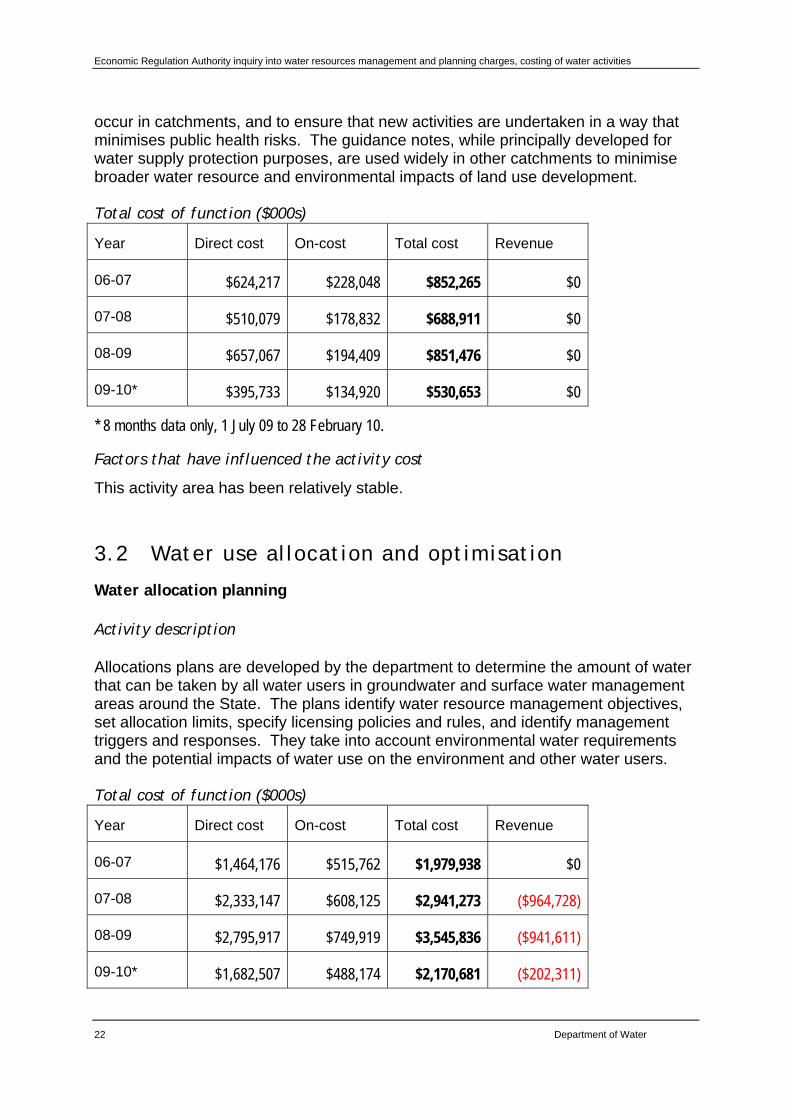
Preparation of guidance notes
Activity description
In addition to preparing and implementing source protection plans, the department also prepares policy, guidelines and best practice advice to guide industries, agriculture and other land uses which are undertaken in drinking water supply catchments. The aim is to minimise impacts from these activities where they already
Economic Regulation Authority inquiry into water resources management and planning charges, costing of water activities
22 Department of Water
occur in catchments, and to ensure that new activities are undertaken in a way that minimises public health risks. The guidance notes, while principally developed for water supply protection purposes, are used widely in other catchments to minimise broader water resource and environmental impacts of land use development.
Total cost of function ($000s)
Year Direct cost On-cost Total cost Revenue
06-07 $624,217 $228,048 $852,265 $0
07-08 $510,079 $178,832 $688,911 $0
08-09 $657,067 $194,409 $851,476 $0
09-10* $395,733 $134,920 $530,653 $0
* 8 months data only, 1 July 09 to 28 February 10.
Factors that have influenced the activity cost
This activity area has been relatively stable.
3.2 Water use allocation and optimisation
Water allocation planning
Activity description
Allocations plans are developed by the department to determine the amount of water that can be taken by all water users in groundwater and surface water management areas around the State. The plans identify water resource management objectives, set allocation limits, specify licensing policies and rules, and identify management triggers and responses. They take into account environmental water requirements and the potential impacts of water use on the environment and other water users.
Total cost of function ($000s)
Year Direct cost On-cost Total cost Revenue
06-07 $1,464,176 $515,762 $1,979,938 $0
07-08 $2,333,147 $608,125 $2,941,273 ($964,728)
08-09 $2,795,917 $749,919 $3,545,836 ($941,611)
09-10* $1,682,507 $488,174 $2,170,681 ($202,311)
Economic Regulation Authority inquiry into water resources management and planning charges, costing of water activities
Department of Water 23
* 8 months data only, 1 July 09 to 28 February 10.
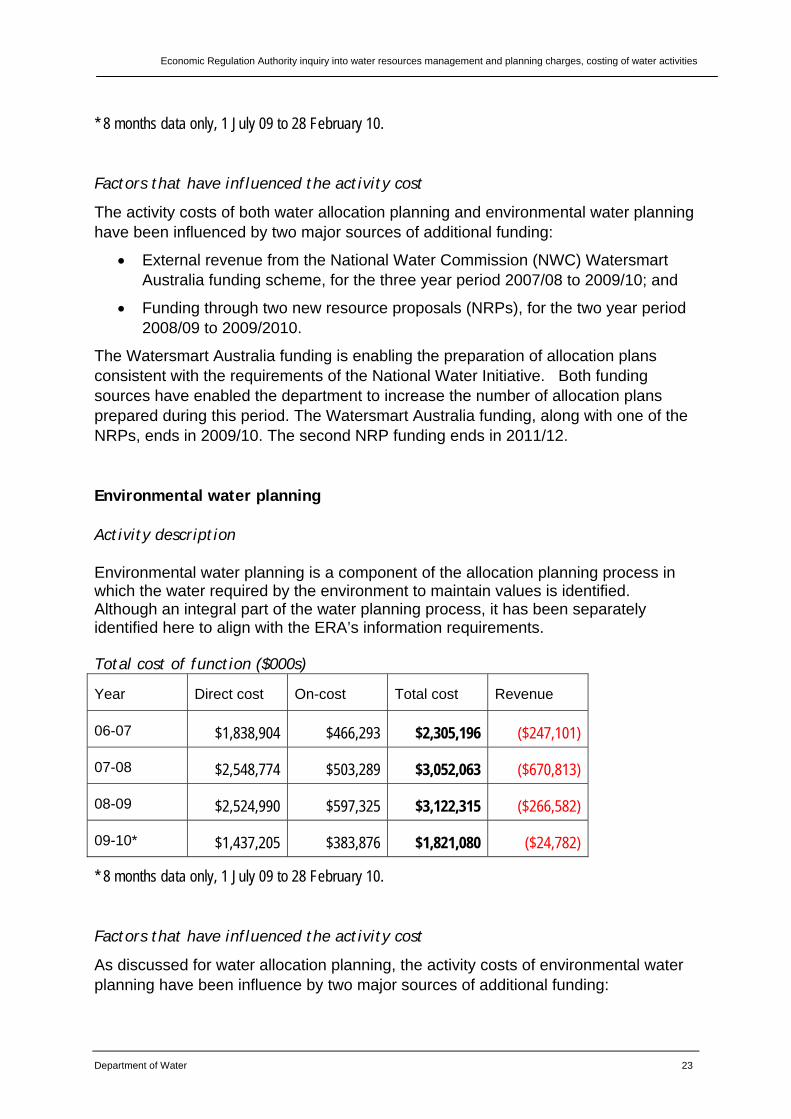
Factors that have influenced the activity cost
The activity costs of both water allocation planning and environmental water planning have been influenced by two major sources of additional funding:
External revenue from the National Water Commission (NWC) Watersmart Australia funding scheme, for the three year period 2007/08 to 2009/10; and
Funding through two new resource proposals (NRPs), for the two year period 2008/09 to 2009/2010.
The Watersmart Australia funding is enabling the preparation of allocation plans consistent with the requirements of the National Water Initiative. Both funding sources have enabled the department to increase the number of allocation plans prepared during this period. The Watersmart Australia funding, along with one of the NRPs, ends in 2009/10. The second NRP funding ends in 2011/12.
Environmental water planning
Activity description
Environmental water planning is a component of the allocation planning process in which the water required by the environment to maintain values is identified. Although an integral part of the water planning process, it has been separately identified here to align with the ERA’s information requirements.
Total cost of function ($000s)
Year Direct cost On-cost Total cost Revenue
06-07 $1,838,904 $466,293 $2,305,196 ($247,101)
07-08 $2,548,774 $503,289 $3,052,063 ($670,813)
08-09 $2,524,990 $597,325 $3,122,315 ($266,582)
09-10* $1,437,205 $383,876 $1,821,080 ($24,782)
* 8 months data only, 1 July 09 to 28 February 10.
Factors that have influenced the activity cost
As discussed for water allocation planning, the activity costs of environmental water planning have been influence by two major sources of additional funding:
Economic Regulation Authority inquiry into water resources management and planning charges, costing of water activities
24 Department of Water
External revenue from the NWC Watersmart Australia funding scheme, for the three year period 2007/08 to 2009/10; and
Funding through two new resource proposals, for the two year period 2008/09 to 2009/2010.
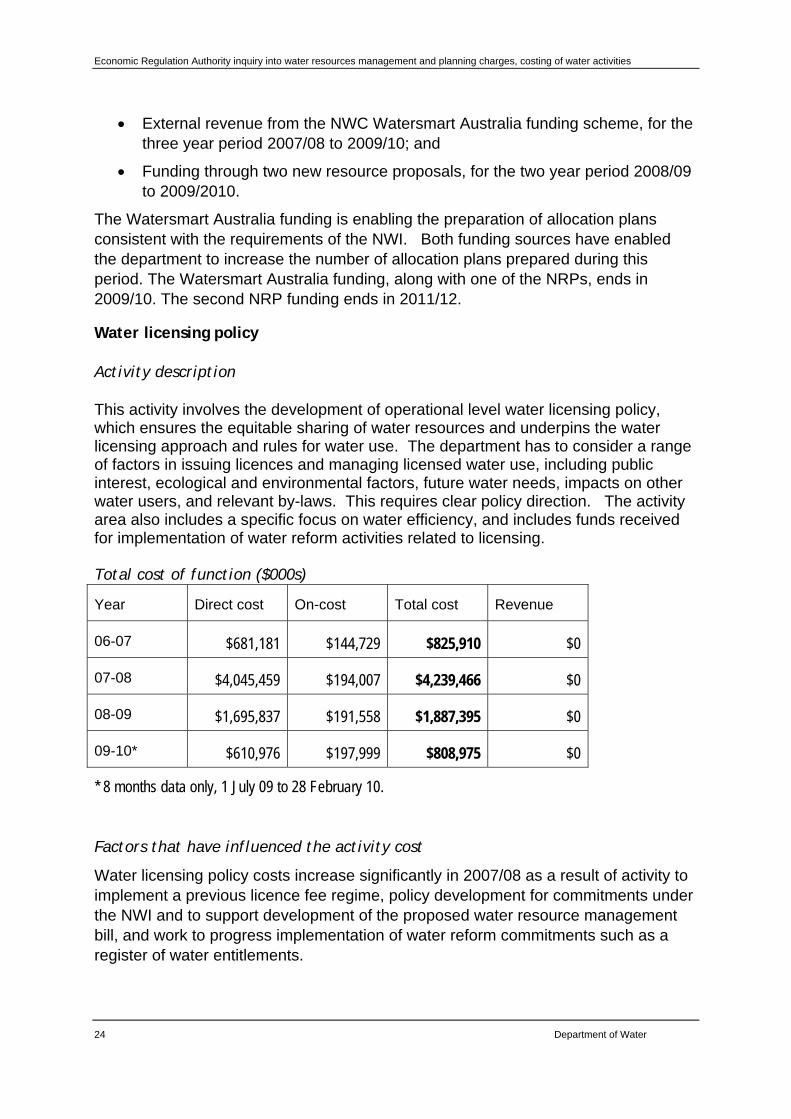
The Watersmart Australia funding is enabling the preparation of allocation plans consistent with the requirements of the NWI. Both funding sources have enabled the department to increase the number of allocation plans prepared during this period. The Watersmart Australia funding, along with one of the NRPs, ends in 2009/10. The second NRP funding ends in 2011/12.
Water licensing policy
Activity description
This activity involves the development of operational level water licensing policy, which ensures the equitable sharing of water resources and underpins the water licensing approach and rules for water use. The department has to consider a range of factors in issuing licences and managing licensed water use, including public interest, ecological and environmental factors, future water needs, impacts on other water users, and relevant by-laws. This requires clear policy direction. The activity area also includes a specific focus on water efficiency, and includes funds received for implementation of water reform activities related to licensing.
Total cost of function ($000s)
Year Direct cost On-cost Total cost Revenue
06-07 $681,181 $144,729 $825,910 $0
07-08 $4,045,459 $194,007 $4,239,466 $0
08-09 $1,695,837 $191,558 $1,887,395 $0
09-10* $610,976 $197,999 $808,975 $0
* 8 months data only, 1 July 09 to 28 February 10.
Factors that have influenced the activity cost
Water licensing policy costs increase significantly in 2007/08 as a result of activity to implement a previous licence fee regime, policy development for commitments under the NWI and to support development of the proposed water resource management bill, and work to progress implementation of water reform commitments such as a register of water entitlements.
Economic Regulation Authority inquiry into water resources management and planning charges, costing of water activities
Department of Water 25
Water licensing and compliance
Activity description
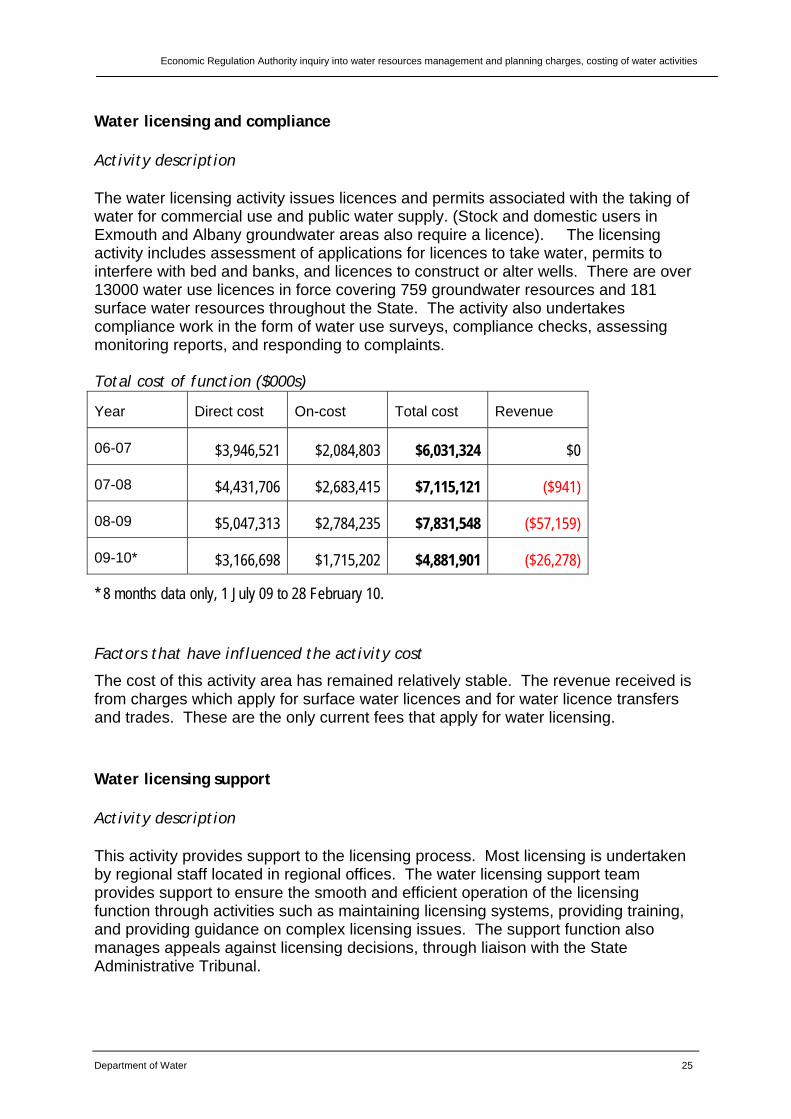
The water licensing activity issues licences and permits associated with the taking of water for commercial use and public water supply. (Stock and domestic users in Exmouth and Albany groundwater areas also require a licence). The licensing activity includes assessment of applications for licences to take water, permits to interfere with bed and banks, and licences to construct or alter wells. There are over 13000 water use licences in force covering 759 groundwater resources and 181 surface water resources throughout the State. The activity also undertakes compliance work in the form of water use surveys, compliance checks, assessing monitoring reports, and responding to complaints.
Total cost of function ($000s)
Year Direct cost On-cost Total cost Revenue
06-07 $3,946,521 $2,084,803 $6,031,324 $0
07-08 $4,431,706 $2,683,415 $7,115,121 ($941)
08-09 $5,047,313 $2,784,235 $7,831,548 ($57,159)
09-10* $3,166,698 $1,715,202 $4,881,901 ($26,278)
* 8 months data only, 1 July 09 to 28 February 10.
Factors that have influenced the activity cost
The cost of this activity area has remained relatively stable. The revenue received is from charges which apply for surface water licences and for water licence transfers and trades. These are the only current fees that apply for water licensing.
Water licensing support
Activity description
This activity provides support to the licensing process. Most licensing is undertaken by regional staff located in regional offices. The water licensing support team provides support to ensure the smooth and efficient operation of the licensing function through activities such as maintaining licensing systems, providing training, and providing guidance on complex licensing issues. The support function also manages appeals against licensing decisions, through liaison with the State Administrative Tribunal.

Economic Regulation Authority inquiry into water resources management and planning charges, costing of water activities
26 Department of Water
Total cost of function ($000s)
Year Direct cost On-cost Total cost Revenue
06-07 $417,018 $140,343 $557,361 $0
07-08 $499,326 $186,545 $685,871 $0
08-09 $878,658 $334,784 $1,213,442 $0
09-10* $409,830 $176,785 $586,615 ($4,490)
* 8 months data only, 1 July 09 to 28 February 10.
Factors that have influenced the activity cost
The additional cost of this activity area for 2008/09 was due to some additional effort from the allocation planning branch to support water licensing decision-making.
The revenue received is from charges which apply for surface water licences and for water licence transfers and trades. Some of the fees are used to support the water licensing support function.
IWSS licensing
Activity description
The Water Corporation is the public drinking water supply service provider which operates the integrated water supply scheme (IWSS). The IWSS provides water to metropolitan Perth, the Goldfields and some wheat belt towns. Licensing of the complex range of water sources which support the IWSS is undertaken in Perth and can be identified as a separate activity which supports a large individual user.
Total cost of function ($000s)
Year Direct cost On-cost Total cost Revenue
06-07 $268,501 $87,714 $356,216 $0
07-08 $246,043 $106,597 $352,641 $0
08-09 $237,139 $87,072 $324,211 $0
09-10* $124,741 $40,408 $165,149 $0
* 8 months data only, 1 July 09 to 28 February 10.
Economic Regulation Authority inquiry into water resources management and planning charges, costing of water activities
Department of Water 27
Factors that have influenced the activity cost
The cost of this activity area has remained relatively stable.
Enforcement
Activity description
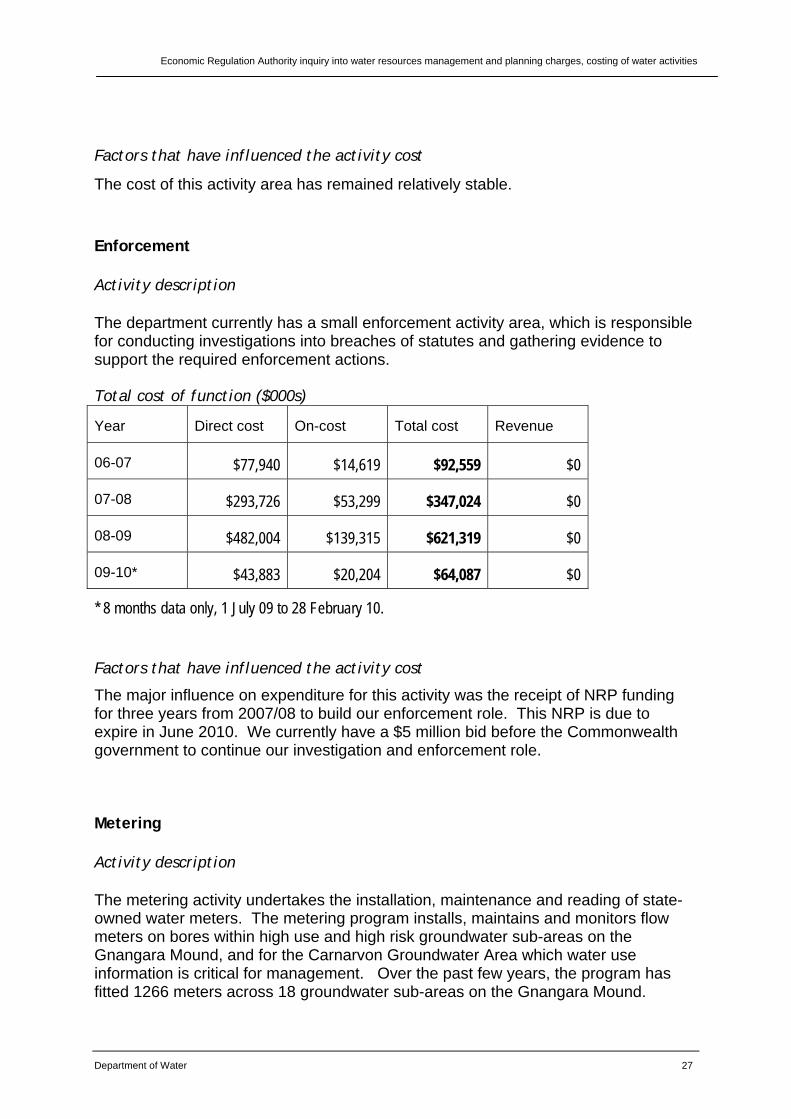
The department currently has a small enforcement activity area, which is responsible for conducting investigations into breaches of statutes and gathering evidence to support the required enforcement actions.
Total cost of function ($000s)
Year Direct cost On-cost Total cost Revenue
06-07 $77,940 $14,619 $92,559 $0
07-08 $293,726 $53,299 $347,024 $0
08-09 $482,004 $139,315 $621,319 $0
09-10* $43,883 $20,204 $64,087 $0
* 8 months data only, 1 July 09 to 28 February 10.
Factors that have influenced the activity cost
The major influence on expenditure for this activity was the receipt of NRP funding for three years from 2007/08 to build our enforcement role. This NRP is due to expire in June 2010. We currently have a $5 million bid before the Commonwealth government to continue our investigation and enforcement role.
Metering
Activity description
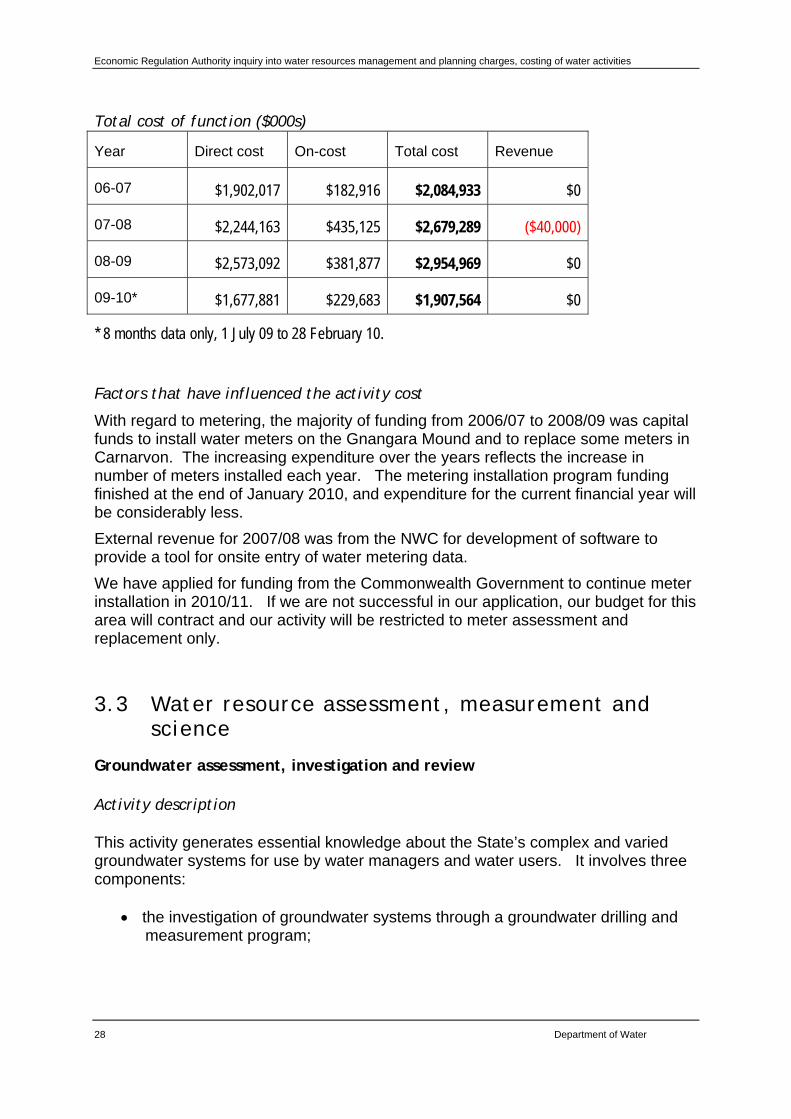
The metering activity undertakes the installation, maintenance and reading of state-owned water meters. The metering program installs, maintains and monitors flow meters on bores within high use and high risk groundwater sub-areas on the Gnangara Mound, and for the Carnarvon Groundwater Area which water use information is critical for management. Over the past few years, the program has fitted 1266 meters across 18 groundwater sub-areas on the Gnangara Mound.
Economic Regulation Authority inquiry into water resources management and planning charges, costing of water activities
28 Department of Water
Total cost of function ($000s)
Year Direct cost On-cost Total cost Revenue
06-07 $1,902,017 $182,916 $2,084,933 $0
07-08 $2,244,163 $435,125 $2,679,289 ($40,000)
08-09 $2,573,092 $381,877 $2,954,969 $0
09-10* $1,677,881 $229,683 $1,907,564 $0
* 8 months data only, 1 July 09 to 28 February 10.
Factors that have influenced the activity cost
With regard to metering, the majority of funding from 2006/07 to 2008/09 was capital funds to install water meters on the Gnangara Mound and to replace some meters in Carnarvon. The increasing expenditure over the years reflects the increase in number of meters installed each year. The metering installation program funding finished at the end of January 2010, and expenditure for the current financial year will be considerably less.
External revenue for 2007/08 was from the NWC for development of software to provide a tool for onsite entry of water metering data.
We have applied for funding from the Commonwealth Government to continue meter installation in 2010/11. If we are not successful in our application, our budget for this area will contract and our activity will be restricted to meter assessment and replacement only.
3.3 Water resource assessment, measurement and science
Groundwater assessment, investigation and review
Activity description
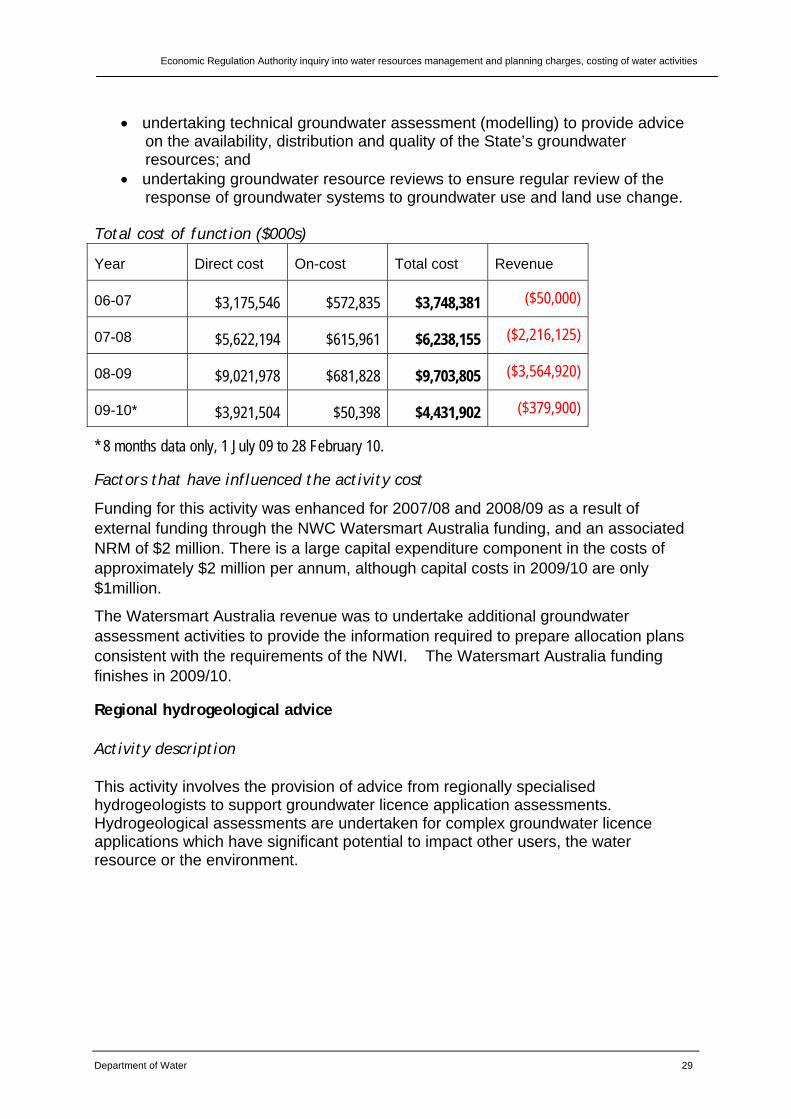
This activity generates essential knowledge about the State’s complex and varied groundwater systems for use by water managers and water users. It involves three components:
the investigation of groundwater systems through a groundwater drilling and measurement program;
Economic Regulation Authority inquiry into water resources management and planning charges, costing of water activities
Department of Water 29
undertaking technical groundwater assessment (modelling) to provide advice on the availability, distribution and quality of the State’s groundwater resources; and
undertaking groundwater resource reviews to ensure regular review of the response of groundwater systems to groundwater use and land use change.
Total cost of function ($000s)
Year Direct cost On-cost Total cost Revenue
06-07 $3,175,546 $572,835 $3,748,381 ($50,000)
07-08 $5,622,194 $615,961 $6,238,155 ($2,216,125)
08-09 $9,021,978 $681,828 $9,703,805 ($3,564,920)
09-10* $3,921,504 $50,398 $4,431,902 ($379,900)
* 8 months data only, 1 July 09 to 28 February 10.
Factors that have influenced the activity cost
Funding for this activity was enhanced for 2007/08 and 2008/09 as a result of external funding through the NWC Watersmart Australia funding, and an associated NRM of $2 million. There is a large capital expenditure component in the costs of approximately $2 million per annum, although capital costs in 2009/10 are only $1million.
The Watersmart Australia revenue was to undertake additional groundwater assessment activities to provide the information required to prepare allocation plans consistent with the requirements of the NWI. The Watersmart Australia funding finishes in 2009/10.
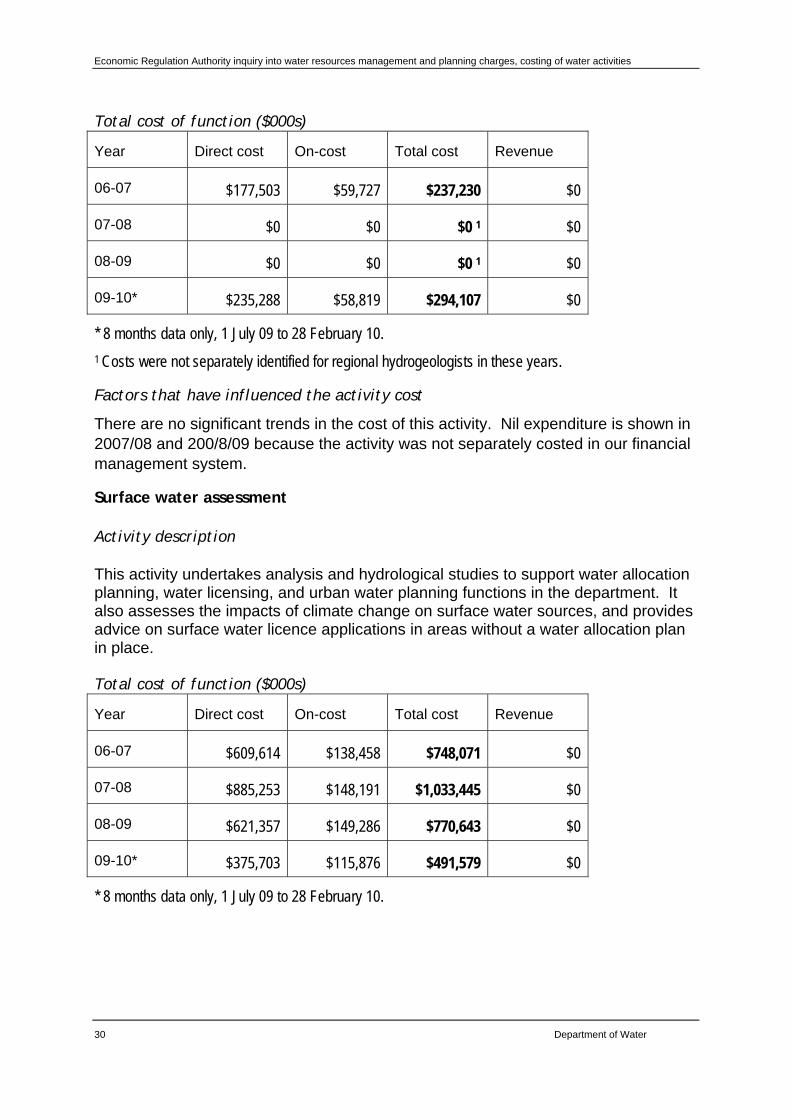
Regional hydrogeological advice
Activity description
This activity involves the provision of advice from regionally specialised hydrogeologists to support groundwater licence application assessments. Hydrogeological assessments are undertaken for complex groundwater licence applications which have significant potential to impact other users, the water resource or the environment.
Economic Regulation Authority inquiry into water resources management and planning charges, costing of water activities
30 Department of Water
Total cost of function ($000s)
Year Direct cost On-cost Total cost Revenue
06-07 $177,503 $59,727 $237,230 $0
07-08 $0 $0 $0 1 $0
08-09 $0 $0 $0 1 $0
09-10* $235,288 $58,819 $294,107 $0
* 8 months data only, 1 July 09 to 28 February 10.
1 Costs were not separately identified for regional hydrogeologists in these years.
Factors that have influenced the activity cost
There are no significant trends in the cost of this activity. Nil expenditure is shown in 2007/08 and 200/8/09 because the activity was not separately costed in our financial management system.
Surface water assessment
Activity description
This activity undertakes analysis and hydrological studies to support water allocation planning, water licensing, and urban water planning functions in the department. It also assesses the impacts of climate change on surface water sources, and provides advice on surface water licence applications in areas without a water allocation plan in place.
Total cost of function ($000s)
Year Direct cost On-cost Total cost Revenue
06-07 $609,614 $138,458 $748,071 $0
07-08 $885,253 $148,191 $1,033,445 $0
08-09 $621,357 $149,286 $770,643 $0
09-10* $375,703 $115,876 $491,579 $0
* 8 months data only, 1 July 09 to 28 February 10.
Economic Regulation Authority inquiry into water resources management and planning charges, costing of water activities
Department of Water 31
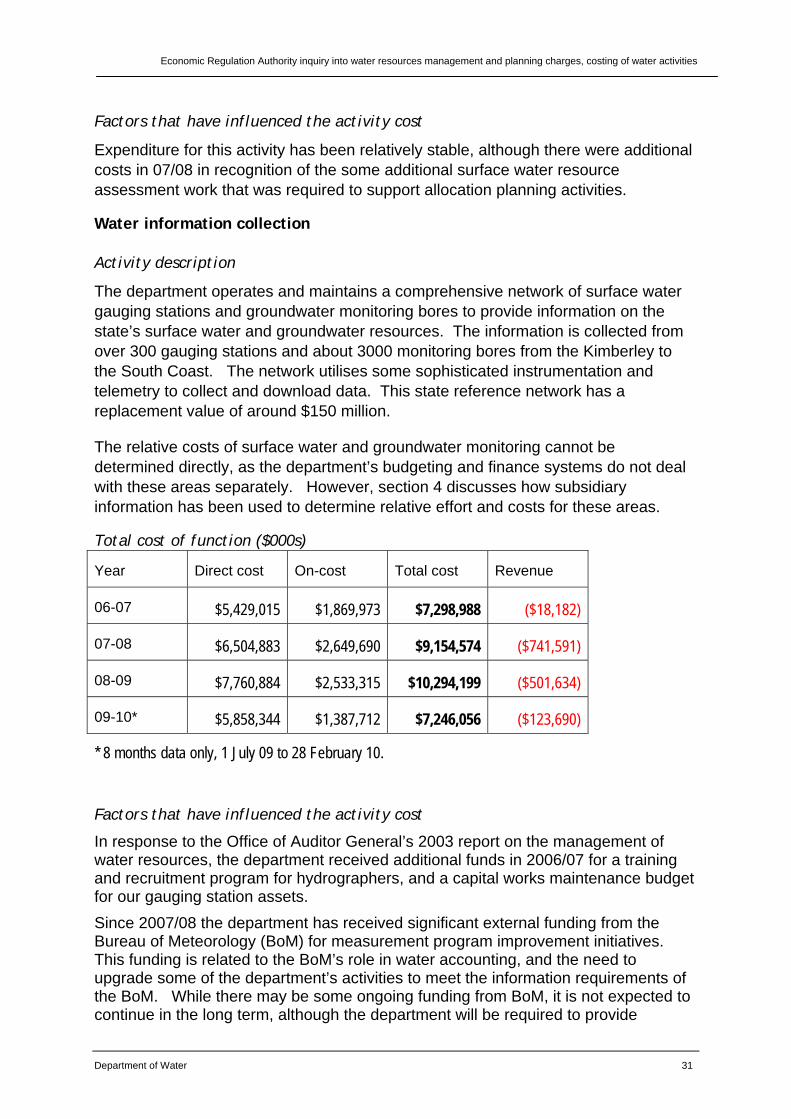
Factors that have influenced the activity cost
Expenditure for this activity has been relatively stable, although there were additional costs in 07/08 in recognition of the some additional surface water resource assessment work that was required to support allocation planning activities.
Water information collection
Activity description
The department operates and maintains a comprehensive network of surface water gauging stations and groundwater monitoring bores to provide information on the state’s surface water and groundwater resources. The information is collected from over 300 gauging stations and about 3000 monitoring bores from the Kimberley to the South Coast. The network utilises some sophisticated instrumentation and telemetry to collect and download data. This state reference network has a replacement value of around $150 million.
The relative costs of surface water and groundwater monitoring cannot be determined directly, as the department’s budgeting and finance systems do not deal with these areas separately. However, section 4 discusses how subsidiary information has been used to determine relative effort and costs for these areas.
Total cost of function ($000s)
Year Direct cost On-cost Total cost Revenue
06-07 $5,429,015 $1,869,973 $7,298,988 ($18,182)
07-08 $6,504,883 $2,649,690 $9,154,574 ($741,591)
08-09 $7,760,884 $2,533,315 $10,294,199 ($501,634)
09-10* $5,858,344 $1,387,712 $7,246,056 ($123,690)
* 8 months data only, 1 July 09 to 28 February 10.
Factors that have influenced the activity cost
In response to the Office of Auditor General’s 2003 report on the management of water resources, the department received additional funds in 2006/07 for a training and recruitment program for hydrographers, and a capital works maintenance budget for our gauging station assets.
Since 2007/08 the department has received significant external funding from the Bureau of Meteorology (BoM) for measurement program improvement initiatives. This funding is related to the BoM’s role in water accounting, and the need to upgrade some of the department’s activities to meet the information requirements of the BoM. While there may be some ongoing funding from BoM, it is not expected to continue in the long term, although the department will be required to provide
Economic Regulation Authority inquiry into water resources management and planning charges, costing of water activities
32 Department of Water
ongoing information to BoM under the requirements of the Commonwealth Water Act.
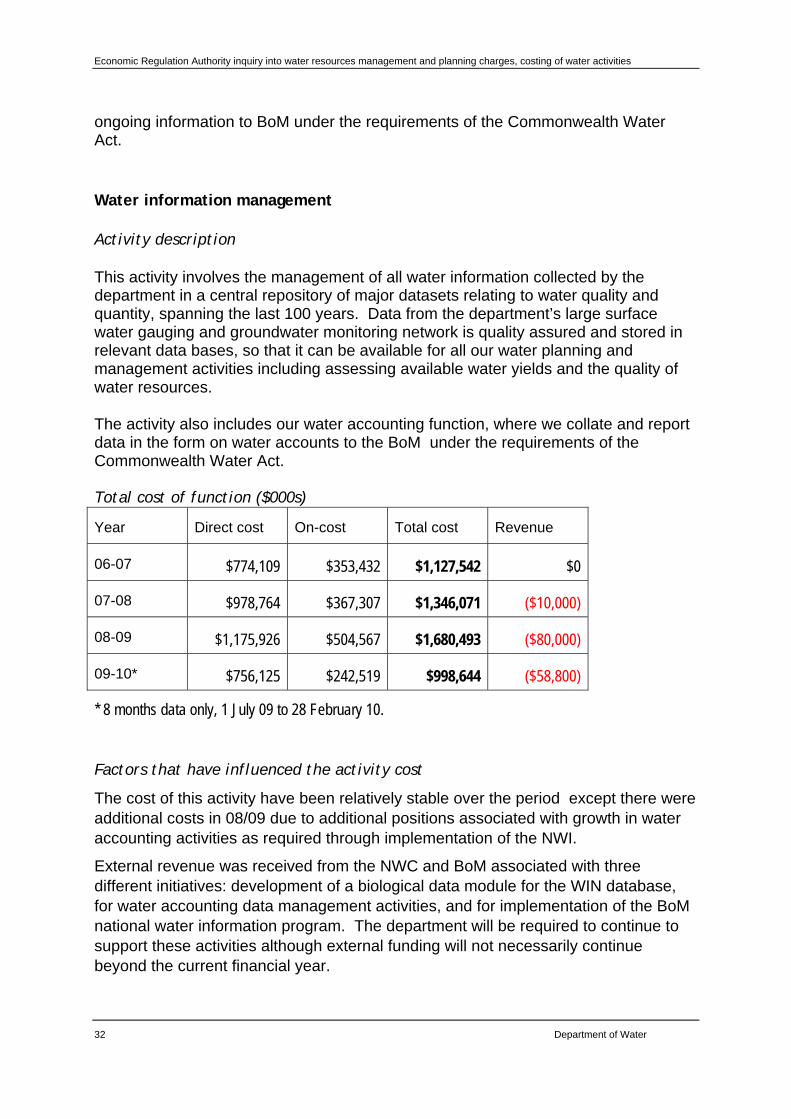
Water information management
Activity description
This activity involves the management of all water information collected by the department in a central repository of major datasets relating to water quality and quantity, spanning the last 100 years. Data from the department’s large surface water gauging and groundwater monitoring network is quality assured and stored in relevant data bases, so that it can be available for all our water planning and management activities including assessing available water yields and the quality of water resources.
The activity also includes our water accounting function, where we collate and report data in the form on water accounts to the BoM under the requirements of the Commonwealth Water Act.
Total cost of function ($000s)
Year Direct cost On-cost Total cost Revenue
06-07 $774,109 $353,432 $1,127,542 $0
07-08 $978,764 $367,307 $1,346,071 ($10,000)
08-09 $1,175,926 $504,567 $1,680,493 ($80,000)
09-10* $756,125 $242,519 $998,644 ($58,800)
* 8 months data only, 1 July 09 to 28 February 10.
Factors that have influenced the activity cost
The cost of this activity have been relatively stable over the period except there were additional costs in 08/09 due to additional positions associated with growth in water accounting activities as required through implementation of the NWI.
External revenue was received from the NWC and BoM associated with three different initiatives: development of a biological data module for the WIN database, for water accounting data management activities, and for implementation of the BoM national water information program. The department will be required to continue to support these activities although external funding will not necessarily continue beyond the current financial year.
Economic Regulation Authority inquiry into water resources management and planning charges, costing of water activities
Department of Water 33
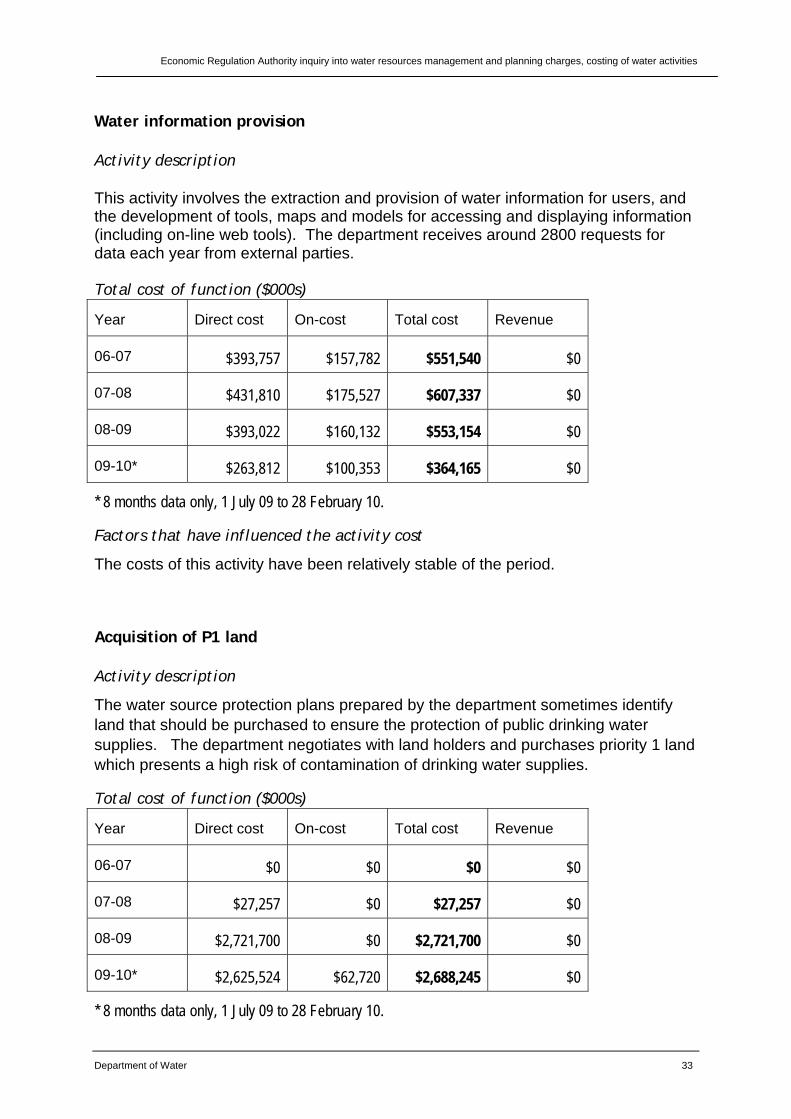
Water information provision
Activity description
This activity involves the extraction and provision of water information for users, and the development of tools, maps and models for accessing and displaying information (including on-line web tools). The department receives around 2800 requests for data each year from external parties.
Total cost of function ($000s)
Year Direct cost On-cost Total cost Revenue
06-07 $393,757 $157,782 $551,540 $0
07-08 $431,810 $175,527 $607,337 $0
08-09 $393,022 $160,132 $553,154 $0
09-10* $263,812 $100,353 $364,165 $0
* 8 months data only, 1 July 09 to 28 February 10.
Factors that have influenced the activity cost
The costs of this activity have been relatively stable of the period.
Acquisition of P1 land
Activity description
The water source protection plans prepared by the department sometimes identify land that should be purchased to ensure the protection of public drinking water supplies. The department negotiates with land holders and purchases priority 1 land which presents a high risk of contamination of drinking water supplies.
Total cost of function ($000s)
Year Direct cost On-cost Total cost Revenue
06-07 $0 $0 $0 $0
07-08 $27,257 $0 $27,257 $0
08-09 $2,721,700 $0 $2,721,700 $0
09-10* $2,625,524 $62,720 $2,688,245 $0
* 8 months data only, 1 July 09 to 28 February 10.
Economic Regulation Authority inquiry into water resources management and planning charges, costing of water activities
34 Department of Water
Factors that have influenced the activity cost
The significant annual cost variation for this activity is due to the ability to successfully conclude purchases on a “willing buyer – willing seller” basis. Also, the cost of land may exceed the annual budget, with the result that funds are accrued for purchase over two or more years.
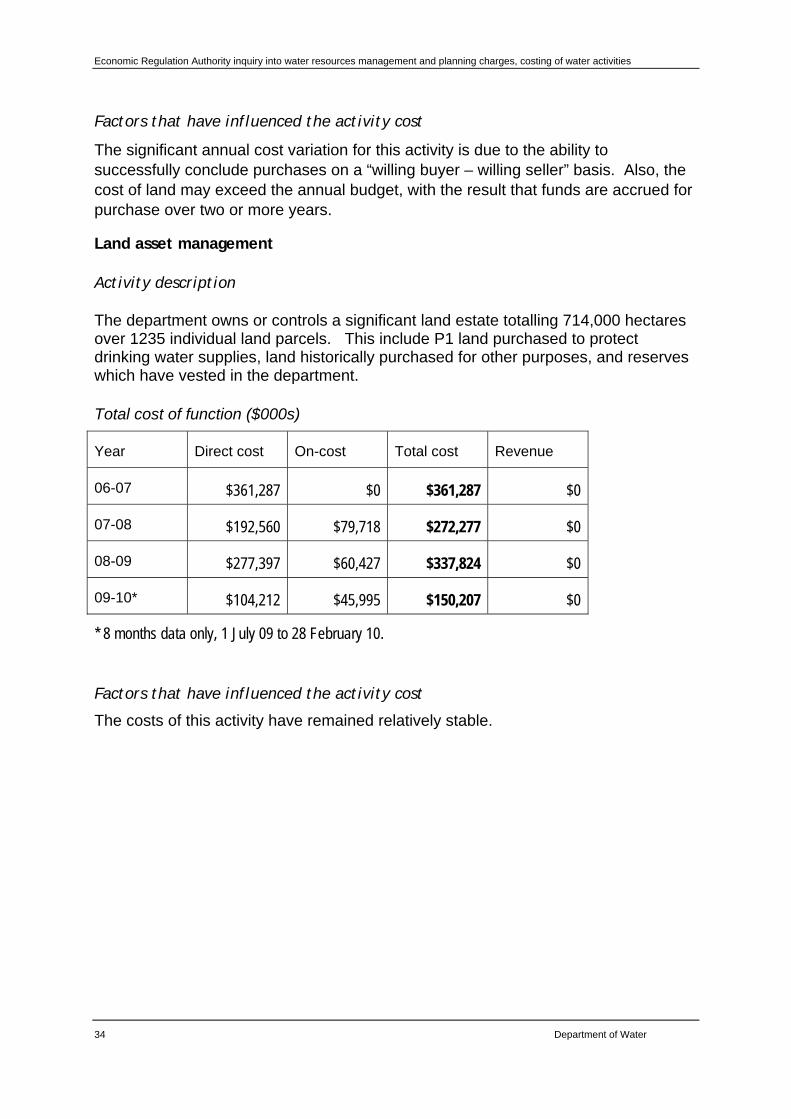
Land asset management
Activity description
The department owns or controls a significant land estate totalling 714,000 hectares over 1235 individual land parcels. This include P1 land purchased to protect drinking water supplies, land historically purchased for other purposes, and reserves which have vested in the department.
Total cost of function ($000s)
Year Direct cost On-cost Total cost Revenue
06-07 $361,287 $0 $361,287 $0
07-08 $192,560 $79,718 $272,277 $0
08-09 $277,397 $60,427 $337,824 $0
09-10* $104,212 $45,995 $150,207 $0
* 8 months data only, 1 July 09 to 28 February 10.
Factors that have influenced the activity cost
The costs of this activity have remained relatively stable.
Economic Regulation Authority inquiry into water resources management and planning charges, costing of water activities
Department of Water 35
4 The cost of our services As discussed in section 2.2, most of the department’s services are dependent on a range of activities within the department, and some activities support more than one service area. Therefore, the relative contribution of each activity needs to be determined to enable full costing of the services. The department has also been asked to advise ERA on the proportion of each activity that is for private benefit. These two factors both influence the extent to which the costs of our activities should be recovered.
This section takes a service based approach to present information on how our activities are linked and apportioned to manage the impacts of land and water use on water resources, and the extent to which they provide private benefit. For each of the services, we identify:
the supporting activities and relative proportion of them which contribute to provide that service
the proposed cost share to be recovered from users for each activity, or activity part, based on the cost sharing principles given in Section 2;
the total cost to be recovered for the service. Unless otherwise stated, costs are based on the department’s costs for the 08/09 financial year (as presented in section 3); and
where relevant and available, the cost per unit output.
For each service, we also discuss the likely future trends in costs, and highlight any feasibility issues for cost recover...
4.1 Processing and assessment of applications for water licences and permits
Service description
Each year, the department deals with over 3000 applications for licence or permits required under the Rights in Water and Irrigation Act. This service area covers the activities involved in assessing those applications and issuing the licence or permit. It includes the maintenance of licensing processes and support systems.
Private parties associated with this service
The private parties associated with this service are applicants for licences to take water, permits for interference with bed and banks, and licences to construct or alter a well. It should be noted that applicants do not necessarily receive a licence or permit, as some applications may be refused. The ERA recommended that costs associated with this service should be recovered from licence or permit applicants via an application fee.
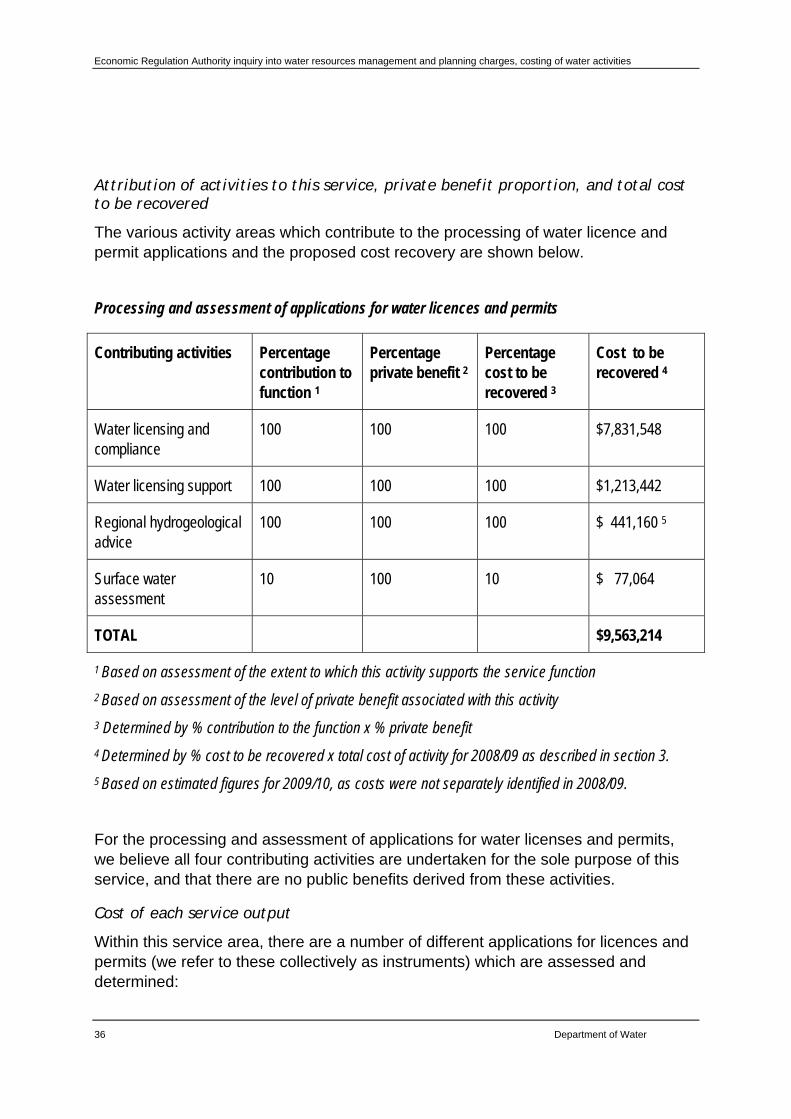
Economic Regulation Authority inquiry into water resources management and planning charges, costing of water activities
36 Department of Water
Attribution of activities to this service, private benefit proportion, and total cost to be recovered
The various activity areas which contribute to the processing of water licence and permit applications and the proposed cost recovery are shown below.
Processing and assessment of applications for water licences and permits
Contributing activities Percentage contribution to function 1
Percentage private benefit 2
Percentage cost to be recovered 3
Cost to be recovered 4
Water licensing and compliance
100 100 100 $7,831,548
Water licensing support 100 100 100 $1,213,442
Regional hydrogeological advice
100 100 100 $ 441,160 5
Surface water assessment
10 100 10 $ 77,064
TOTAL $9,563,214
1 Based on assessment of the extent to which this activity supports the service function
2 Based on assessment of the level of private benefit associated with this activity
3 Determined by % contribution to the function x % private benefit
4 Determined by % cost to be recovered x total cost of activity for 2008/09 as described in section 3.
5 Based on estimated figures for 2009/10, as costs were not separately identified in 2008/09.
For the processing and assessment of applications for water licenses and permits, we believe all four contributing activities are undertaken for the sole purpose of this service, and that there are no public benefits derived from these activities.
Cost of each service output
Within this service area, there are a number of different applications for licences and permits (we refer to these collectively as instruments) which are assessed and determined:
Economic Regulation Authority inquiry into water resources management and planning charges, costing of water activities
Department of Water 37
Licences to take water (5C licences), including new applications, renewals, amendments, transfers, trades and agreements;
Permits to interfere with bed and banks of surface water systems; and
Licences to construct or alter wells (26D licences).
In 2008/09, we issued a total of 3,346 instruments, comprising 2568 licences to take water, 726 licences to construct or alter a well, and 52 permits to interfere with bed or banks.
For each type of instrument, a number of individual process steps and activities are undertaken, from administration activities on receipt of the application, to assessment activities and issuing of the licence/permit.
In order to understand the effort involved in each type of instrument, and in the individual process steps, the department established a three month time keeping process for its licensing staff. Staff were asked to record the effort involved in each of 10 identified process steps, as well as recording various details about the type and complexity of the application. This time keeping exercise has enabled us to determine the costs of various types of applications, and the costs drivers for the effort involved.
The following tables present the data collected in a number of ways – by instrument type, by process step, by risk category, and by water type (groundwater or surface water). Data was collected at two office locations – Swan region and Busselton office. From the results, we do not believe that geographic location is a significant cost driver, except with respect to regional on-costs which apply to the northern parts of the state.
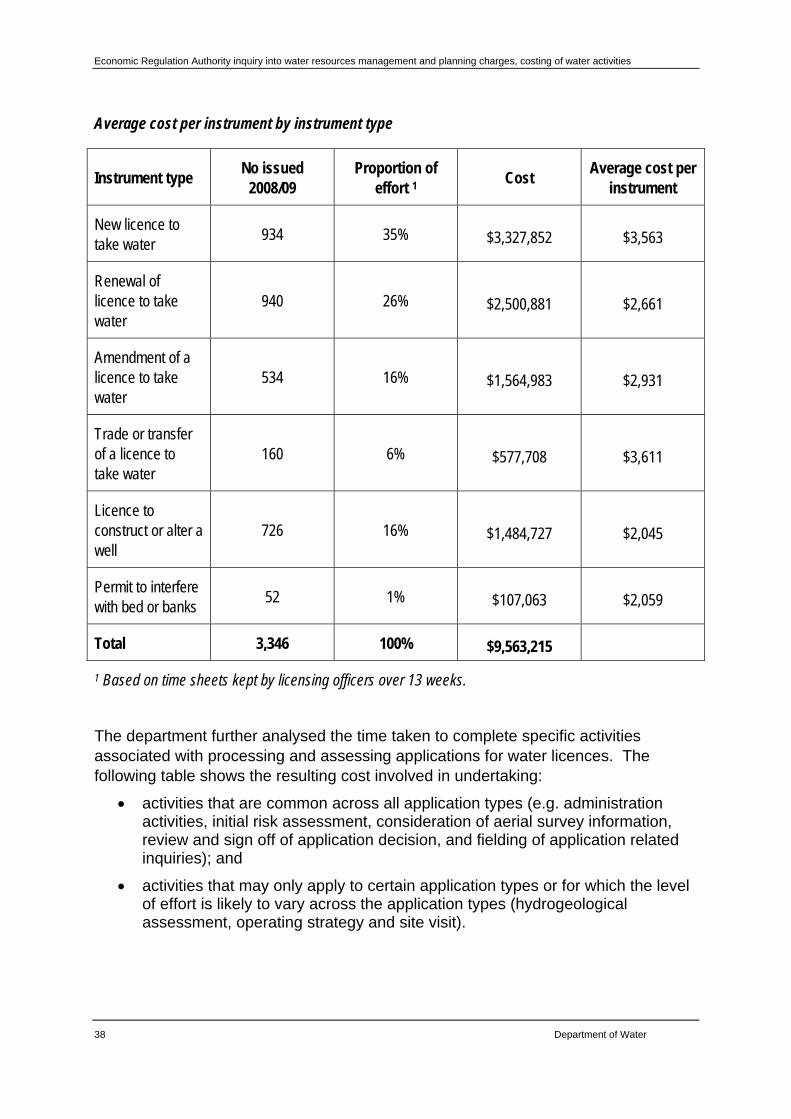
Economic Regulation Authority inquiry into water resources management and planning charges, costing of water activities
38 Department of Water
Average cost per instrument by instrument type
Instrument type No issued
2008/09 Proportion of
effort 1 Cost
Average cost per instrument
New licence to take water
934 35% $3,327,852 $3,563
Renewal of licence to take water
940 26% $2,500,881 $2,661
Amendment of a licence to take water
534 16% $1,564,983 $2,931
Trade or transfer of a licence to take water
160 6% $577,708 $3,611
Licence to construct or alter a well
726 16% $1,484,727 $2,045
Permit to interfere with bed or banks
52 1% $107,063 $2,059
Total 3,346 100% $9,563,215
1 Based on time sheets kept by licensing officers over 13 weeks.
The department further analysed the time taken to complete specific activities associated with processing and assessing applications for water licences. The following table shows the resulting cost involved in undertaking:
activities that are common across all application types (e.g. administration activities, initial risk assessment, consideration of aerial survey information, review and sign off of application decision, and fielding of application related inquiries); and
activities that may only apply to certain application types or for which the level of effort is likely to vary across the application types (hydrogeological assessment, operating strategy and site visit).
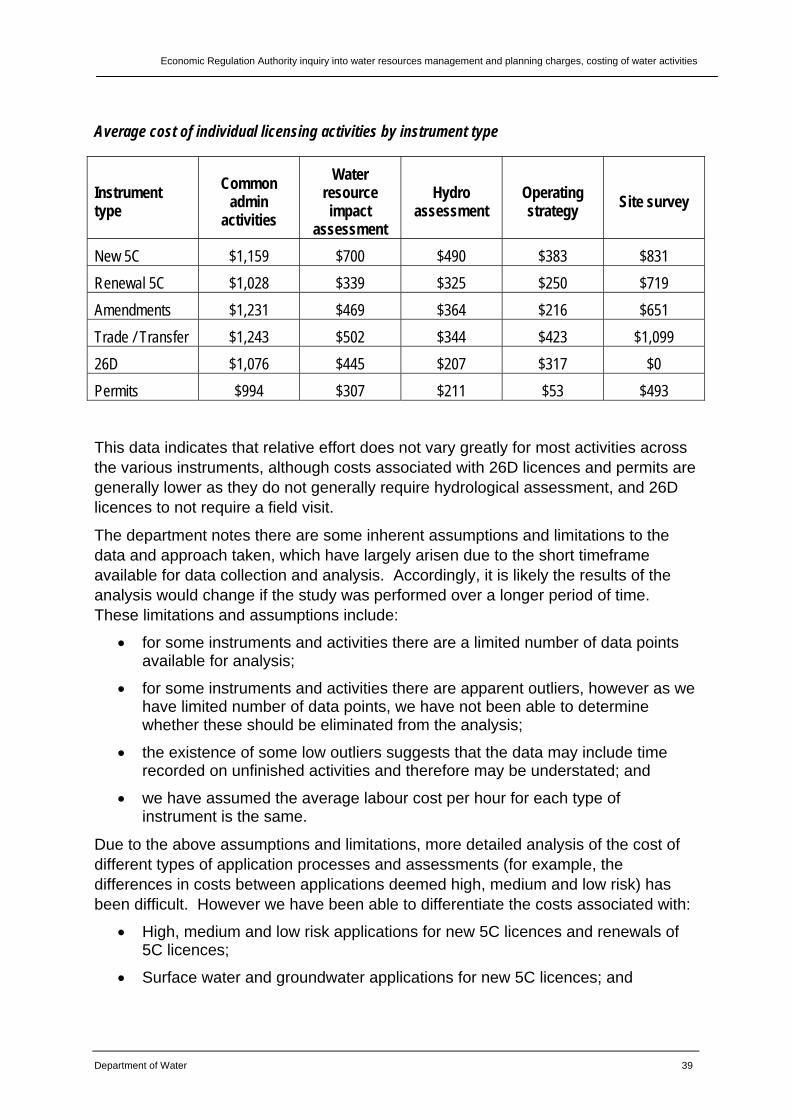
Economic Regulation Authority inquiry into water resources management and planning charges, costing of water activities
Department of Water 39
Average cost of individual licensing activities by instrument type
Instrument type
Common admin
activities
Water resource impact
assessment
Hydro assessment
Operating strategy
Site survey
New 5C $1,159 $700 $490 $383 $831
Renewal 5C $1,028 $339 $325 $250 $719
Amendments $1,231 $469 $364 $216 $651
Trade / Transfer $1,243 $502 $344 $423 $1,099
26D $1,076 $445 $207 $317 $0
Permits $994 $307 $211 $53 $493
This data indicates that relative effort does not vary greatly for most activities across the various instruments, although costs associated with 26D licences and permits are generally lower as they do not generally require hydrological assessment, and 26D licences to not require a field visit.
The department notes there are some inherent assumptions and limitations to the data and approach taken, which have largely arisen due to the short timeframe available for data collection and analysis. Accordingly, it is likely the results of the analysis would change if the study was performed over a longer period of time. These limitations and assumptions include:
for some instruments and activities there are a limited number of data points available for analysis;
for some instruments and activities there are apparent outliers, however as we have limited number of data points, we have not been able to determine whether these should be eliminated from the analysis;
the existence of some low outliers suggests that the data may include time recorded on unfinished activities and therefore may be understated; and
we have assumed the average labour cost per hour for each type of instrument is the same.
Due to the above assumptions and limitations, more detailed analysis of the cost of different types of application processes and assessments (for example, the differences in costs between applications deemed high, medium and low risk) has been difficult. However we have been able to differentiate the costs associated with:
High, medium and low risk applications for new 5C licences and renewals of 5C licences;
Surface water and groundwater applications for new 5C licences; and
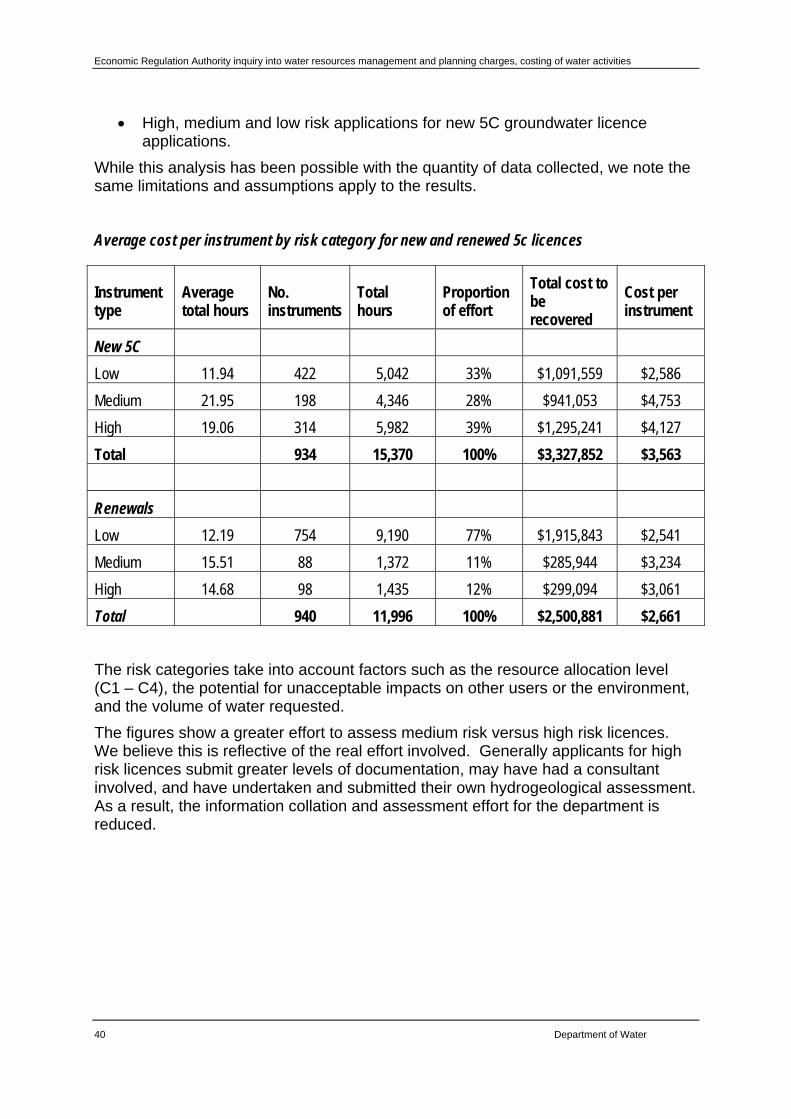
Economic Regulation Authority inquiry into water resources management and planning charges, costing of water activities
40 Department of Water
High, medium and low risk applications for new 5C groundwater licence applications.
While this analysis has been possible with the quantity of data collected, we note the same limitations and assumptions apply to the results.
Average cost per instrument by risk category for new and renewed 5c licences
Instrument type
Average total hours
No. instruments
Total hours
Proportion of effort
Total cost to be recovered
Cost per instrument
New 5C
Low 11.94 422 5,042 33% $1,091,559 $2,586
Medium 21.95 198 4,346 28% $941,053 $4,753
High 19.06 314 5,982 39% $1,295,241 $4,127
Total 934 15,370 100% $3,327,852 $3,563
Renewals
Low 12.19 754 9,190 77% $1,915,843 $2,541
Medium 15.51 88 1,372 11% $285,944 $3,234
High 14.68 98 1,435 12% $299,094 $3,061
Total 940 11,996 100% $2,500,881 $2,661
The risk categories take into account factors such as the resource allocation level (C1 – C4), the potential for unacceptable impacts on other users or the environment, and the volume of water requested.
The figures show a greater effort to assess medium risk versus high risk licences. We believe this is reflective of the real effort involved. Generally applicants for high risk licences submit greater levels of documentation, may have had a consultant involved, and have undertaken and submitted their own hydrogeological assessment. As a result, the information collation and assessment effort for the department is reduced.
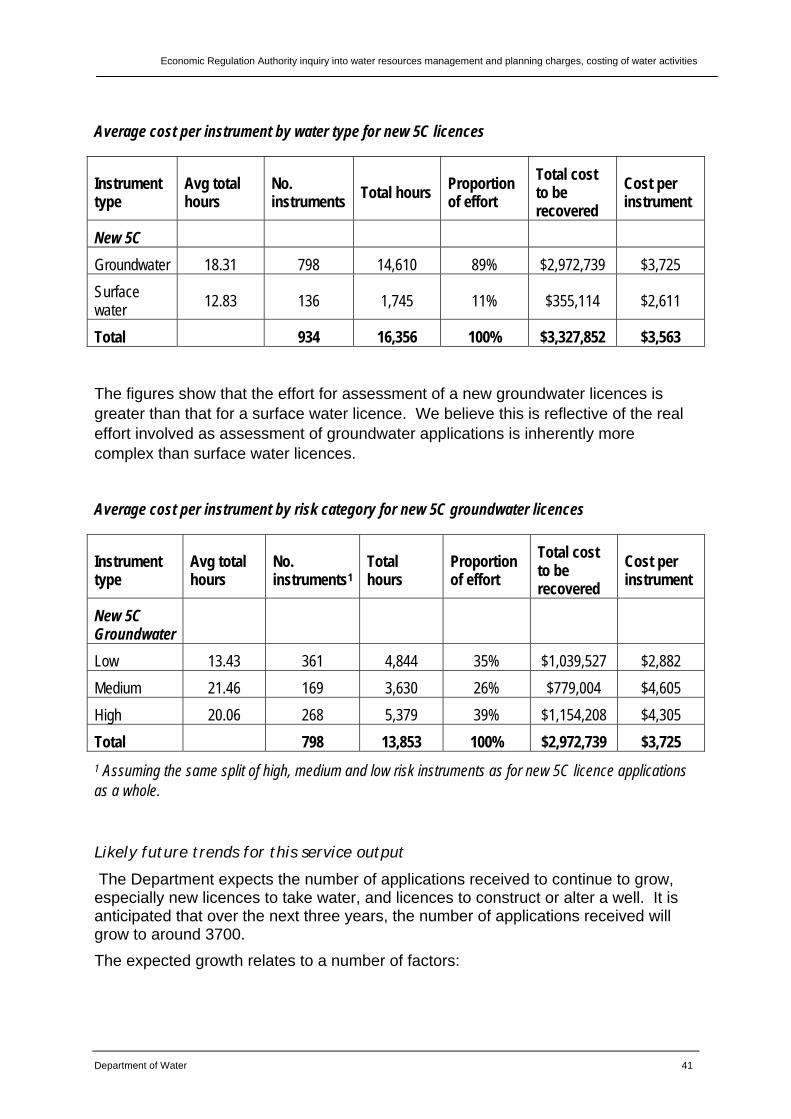
Economic Regulation Authority inquiry into water resources management and planning charges, costing of water activities
Department of Water 41
Average cost per instrument by water type for new 5C licences
Instrument type
Avg total hours
No. instruments
Total hours Proportion of effort
Total cost to be recovered
Cost per instrument
New 5C
Groundwater 18.31 798 14,610 89% $2,972,739 $3,725
Surface water
12.83 136 1,745 11% $355,114 $2,611
Total 934 16,356 100% $3,327,852 $3,563
The figures show that the effort for assessment of a new groundwater licences is greater than that for a surface water licence. We believe this is reflective of the real effort involved as assessment of groundwater applications is inherently more complex than surface water licences.
Average cost per instrument by risk category for new 5C groundwater licences
Instrument type
Avg total hours
No. instruments1
Total hours
Proportion of effort
Total cost to be recovered
Cost per instrument
New 5C Groundwater
Low 13.43 361 4,844 35% $1,039,527 $2,882
Medium 21.46 169 3,630 26% $779,004 $4,605
High 20.06 268 5,379 39% $1,154,208 $4,305
Total 798 13,853 100% $2,972,739 $3,725
1 Assuming the same split of high, medium and low risk instruments as for new 5C licence applications as a whole.
Likely future trends for this service output
The Department expects the number of applications received to continue to grow, especially new licences to take water, and licences to construct or alter a well. It is anticipated that over the next three years, the number of applications received will grow to around 3700.
The expected growth relates to a number of factors:
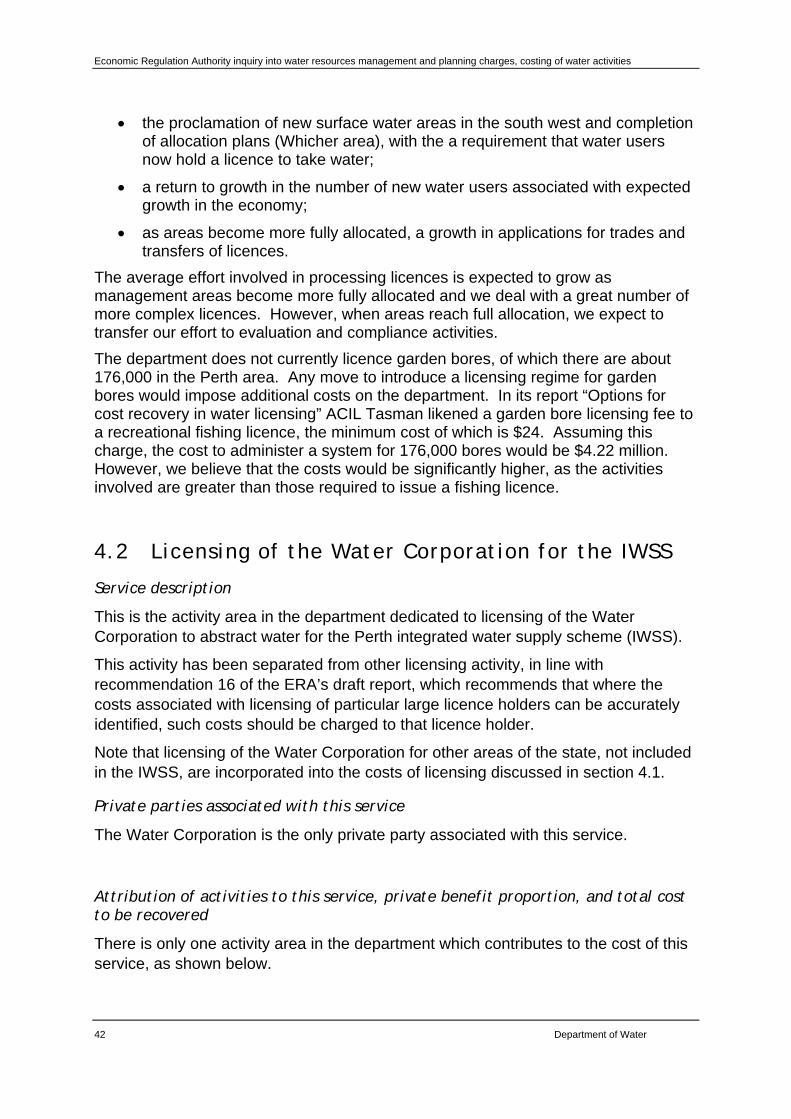
Economic Regulation Authority inquiry into water resources management and planning charges, costing of water activities
42 Department of Water
the proclamation of new surface water areas in the south west and completion of allocation plans (Whicher area), with the a requirement that water users now hold a licence to take water;
a return to growth in the number of new water users associated with expected growth in the economy;
as areas become more fully allocated, a growth in applications for trades and transfers of licences.
The average effort involved in processing licences is expected to grow as management areas become more fully allocated and we deal with a great number of more complex licences. However, when areas reach full allocation, we expect to transfer our effort to evaluation and compliance activities.
The department does not currently licence garden bores, of which there are about 176,000 in the Perth area. Any move to introduce a licensing regime for garden bores would impose additional costs on the department. In its report “Options for cost recovery in water licensing” ACIL Tasman likened a garden bore licensing fee to a recreational fishing licence, the minimum cost of which is $24. Assuming this charge, the cost to administer a system for 176,000 bores would be $4.22 million. However, we believe that the costs would be significantly higher, as the activities involved are greater than those required to issue a fishing licence.
4.2 Licensing of the Water Corporation for the IWSS
Service description
This is the activity area in the department dedicated to licensing of the Water Corporation to abstract water for the Perth integrated water supply scheme (IWSS).
This activity has been separated from other licensing activity, in line with recommendation 16 of the ERA’s draft report, which recommends that where the costs associated with licensing of particular large licence holders can be accurately identified, such costs should be charged to that licence holder.
Note that licensing of the Water Corporation for other areas of the state, not included in the IWSS, are incorporated into the costs of licensing discussed in section 4.1.
Private parties associated with this service
The Water Corporation is the only private party associated with this service.
Attribution of activities to this service, private benefit proportion, and total cost to be recovered
There is only one activity area in the department which contributes to the cost of this service, as shown below.
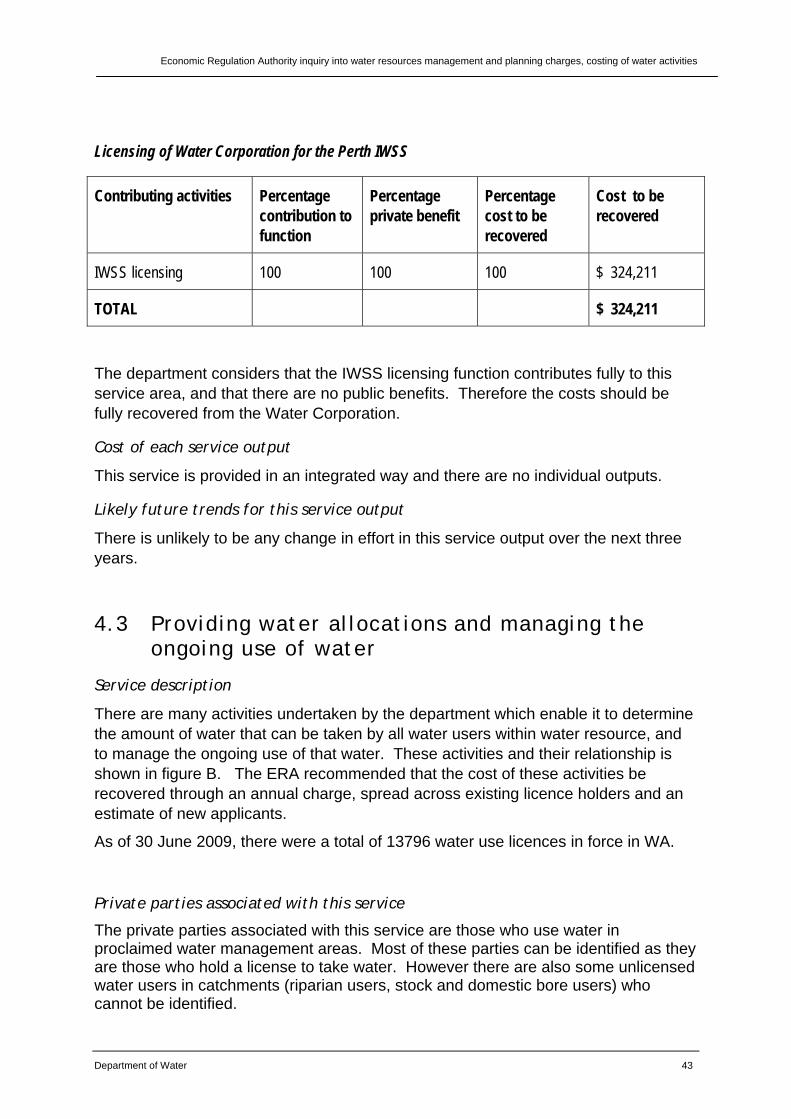
Economic Regulation Authority inquiry into water resources management and planning charges, costing of water activities
Department of Water 43
Licensing of Water Corporation for the Perth IWSS
Contributing activities Percentage contribution to function
Percentage private benefit
Percentage cost to be recovered
Cost to be recovered
IWSS licensing 100 100 100 $ 324,211
TOTAL $ 324,211
The department considers that the IWSS licensing function contributes fully to this service area, and that there are no public benefits. Therefore the costs should be fully recovered from the Water Corporation.
Cost of each service output
This service is provided in an integrated way and there are no individual outputs.
Likely future trends for this service output
There is unlikely to be any change in effort in this service output over the next three years.
4.3 Providing water allocations and managing the ongoing use of water
Service description
There are many activities undertaken by the department which enable it to determine the amount of water that can be taken by all water users within water resource, and to manage the ongoing use of that water. These activities and their relationship is shown in figure B. The ERA recommended that the cost of these activities be recovered through an annual charge, spread across existing licence holders and an estimate of new applicants.
As of 30 June 2009, there were a total of 13796 water use licences in force in WA.
Private parties associated with this service
The private parties associated with this service are those who use water in proclaimed water management areas. Most of these parties can be identified as they are those who hold a license to take water. However there are also some unlicensed water users in catchments (riparian users, stock and domestic bore users) who cannot be identified.
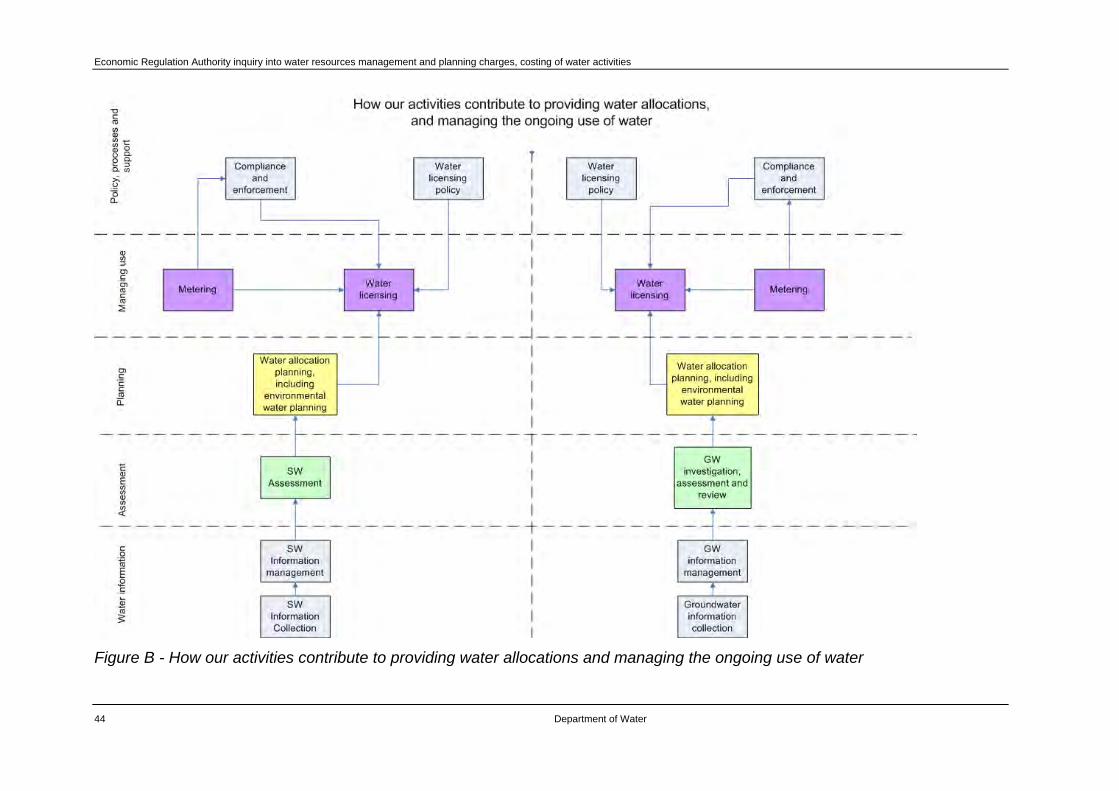
Economic Regulation Authority inquiry into water resources management and planning charges, costing of water activities
44 Department of Water
Figure B - How our activities contribute to providing water allocations and managing the ongoing use of water
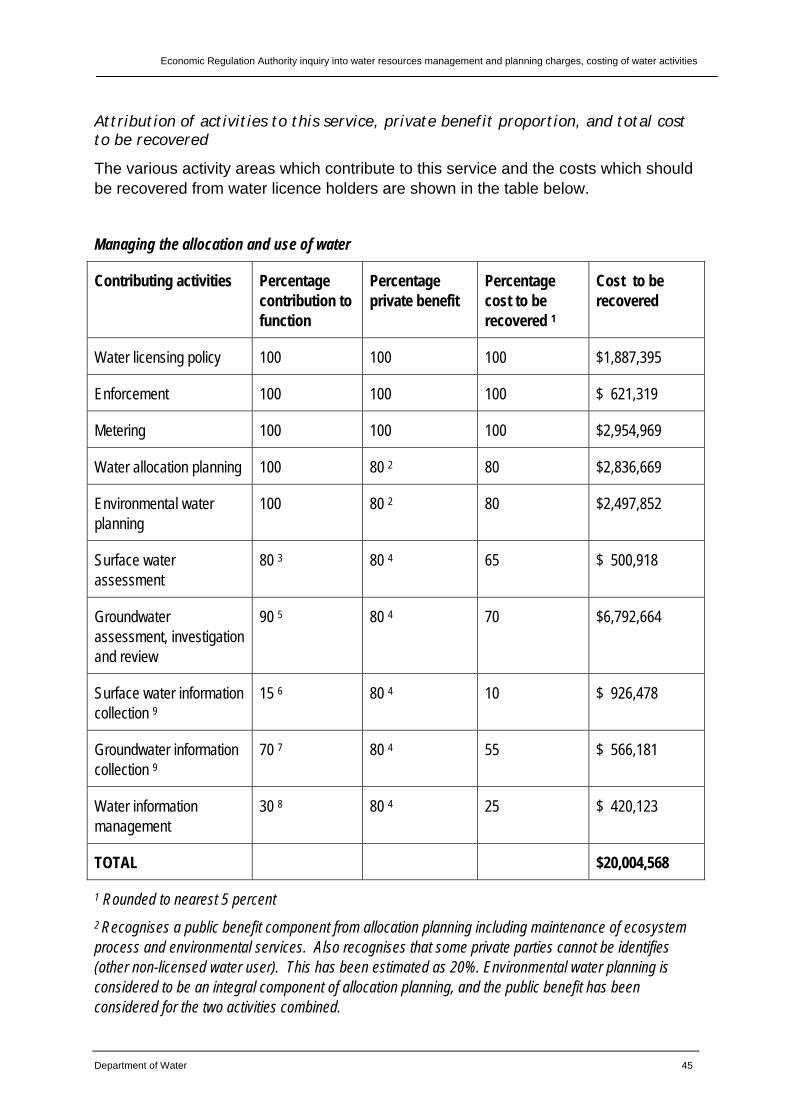
Economic Regulation Authority inquiry into water resources management and planning charges, costing of water activities
Department of Water 45
Attribution of activities to this service, private benefit proportion, and total cost to be recovered
The various activity areas which contribute to this service and the costs which should be recovered from water licence holders are shown in the table below.
Managing the allocation and use of water
Contributing activities Percentage contribution to function
Percentage private benefit
Percentage cost to be recovered 1
Cost to be recovered
Water licensing policy 100 100 100 $1,887,395
Enforcement 100 100 100 $ 621,319
Metering 100 100 100 $2,954,969
Water allocation planning 100 80 2 80 $2,836,669
Environmental water planning
100 80 2 80 $2,497,852
Surface water assessment
80 3 80 4 65 $ 500,918
Groundwater assessment, investigation and review
90 5 80 4 70 $6,792,664
Surface water information collection 9
15 6 80 4 10 $ 926,478
Groundwater information collection 9
70 7 80 4 55 $ 566,181
Water information management
30 8 80 4 25 $ 420,123
TOTAL $20,004,568
1 Rounded to nearest 5 percent
2 Recognises a public benefit component from allocation planning including maintenance of ecosystem process and environmental services. Also recognises that some private parties cannot be identifies (other non-licensed water user). This has been estimated as 20%. Environmental water planning is considered to be an integral component of allocation planning, and the public benefit has been considered for the two activities combined.
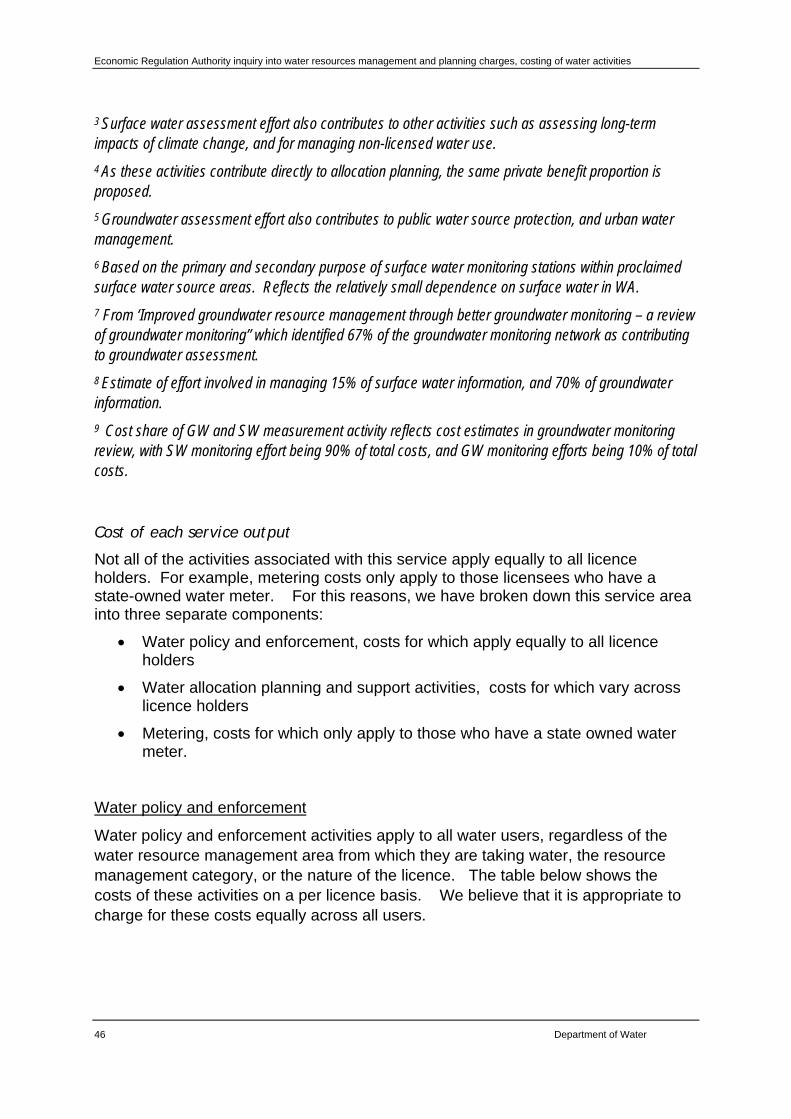
Economic Regulation Authority inquiry into water resources management and planning charges, costing of water activities
46 Department of Water
3 Surface water assessment effort also contributes to other activities such as assessing long-term impacts of climate change, and for managing non-licensed water use.
4 As these activities contribute directly to allocation planning, the same private benefit proportion is proposed.
5 Groundwater assessment effort also contributes to public water source protection, and urban water management.
6 Based on the primary and secondary purpose of surface water monitoring stations within proclaimed surface water source areas. Reflects the relatively small dependence on surface water in WA.
7 From ‘Improved groundwater resource management through better groundwater monitoring – a review of groundwater monitoring” which identified 67% of the groundwater monitoring network as contributing to groundwater assessment.
8 Estimate of effort involved in managing 15% of surface water information, and 70% of groundwater information.
9 Cost share of GW and SW measurement activity reflects cost estimates in groundwater monitoring review, with SW monitoring effort being 90% of total costs, and GW monitoring efforts being 10% of total costs.
Cost of each service output
Not all of the activities associated with this service apply equally to all licence holders. For example, metering costs only apply to those licensees who have a state-owned water meter. For this reasons, we have broken down this service area into three separate components:
Water policy and enforcement, costs for which apply equally to all licence holders
Water allocation planning and support activities, costs for which vary across licence holders
Metering, costs for which only apply to those who have a state owned water meter.
Water policy and enforcement
Water policy and enforcement activities apply to all water users, regardless of the water resource management area from which they are taking water, the resource management category, or the nature of the licence. The table below shows the costs of these activities on a per licence basis. We believe that it is appropriate to charge for these costs equally across all users.
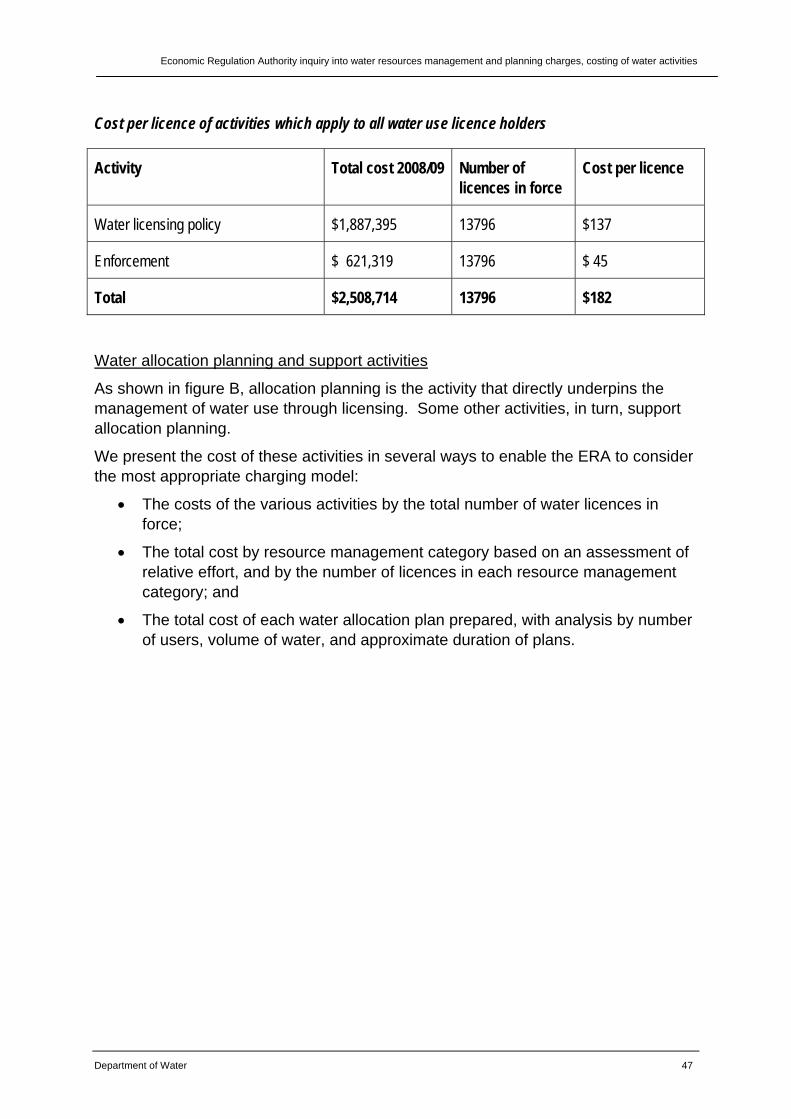
Economic Regulation Authority inquiry into water resources management and planning charges, costing of water activities
Department of Water 47
Cost per licence of activities which apply to all water use licence holders
Activity Total cost 2008/09 Number of licences in force
Cost per licence
Water licensing policy $1,887,395 13796 $137
Enforcement $ 621,319 13796 $ 45
Total $2,508,714 13796 $182
Water allocation planning and support activities
As shown in figure B, allocation planning is the activity that directly underpins the management of water use through licensing. Some other activities, in turn, support allocation planning.
We present the cost of these activities in several ways to enable the ERA to consider the most appropriate charging model:
The costs of the various activities by the total number of water licences in force;
The total cost by resource management category based on an assessment of relative effort, and by the number of licences in each resource management category; and
The total cost of each water allocation plan prepared, with analysis by number of users, volume of water, and approximate duration of plans.
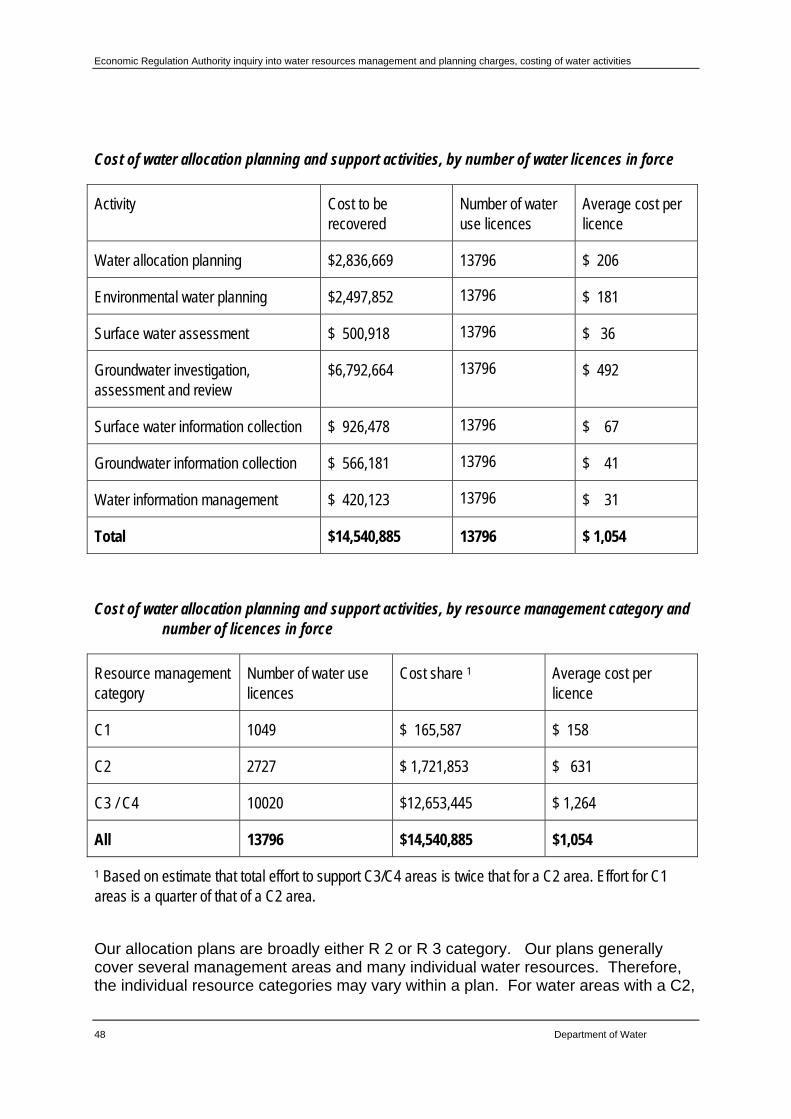
Economic Regulation Authority inquiry into water resources management and planning charges, costing of water activities
48 Department of Water
Cost of water allocation planning and support activities, by number of water licences in force
Activity Cost to be recovered
Number of water use licences
Average cost per licence
Water allocation planning $2,836,669 13796 $ 206
Environmental water planning $2,497,852 13796 $ 181
Surface water assessment $ 500,918 13796 $ 36
Groundwater investigation, assessment and review
$6,792,664 13796 $ 492
Surface water information collection $ 926,478 13796 $ 67
Groundwater information collection $ 566,181 13796 $ 41
Water information management $ 420,123 13796 $ 31
Total $14,540,885 13796 $ 1,054
Cost of water allocation planning and support activities, by resource management category and number of licences in force
Resource management category
Number of water use licences
Cost share 1 Average cost per licence
C1 1049 $ 165,587 $ 158
C2 2727 $ 1,721,853 $ 631
C3 / C4 10020 $12,653,445 $ 1,264
All 13796 $14,540,885 $1,054
1 Based on estimate that total effort to support C3/C4 areas is twice that for a C2 area. Effort for C1 areas is a quarter of that of a C2 area.
Our allocation plans are broadly either R 2 or R 3 category. Our plans generally cover several management areas and many individual water resources. Therefore, the individual resource categories may vary within a plan. For water areas with a C2,
Economic Regulation Authority inquiry into water resources management and planning charges, costing of water activities
Department of Water 49
C3 or C4 resource management category, we respond with an R 2 or R3 plan to set the allocation limits, resource objectives, licensing approach and monitoring approach. For the C4 resources within a plan, we specify a recovery strategy which varies depending on circumstances and may include:
a cap on use at current levels, recovery of water through licence and land use changes, and/or
targeted compliance and efficiency strategies.
As we don’t plan separately for C4 resources, there is no cost distinction between licences in a C3 and C4 area. Ideally, we could more actively monitor compliance in C4 areas, but given we have not been able to separately cost our current compliance effort, this has not been considered.
Allocations plans can take up to four years duration to complete, and therefore we have analysed financial data since 2006/07 and used work plan information from the Branch to estimate the full costs of those allocation plans prepared since this time. For the support activities, we have distributed them to the plans on a proportional basis because we have not had a mechanism in place to record the effort against each plan. The results are shown in the table below.
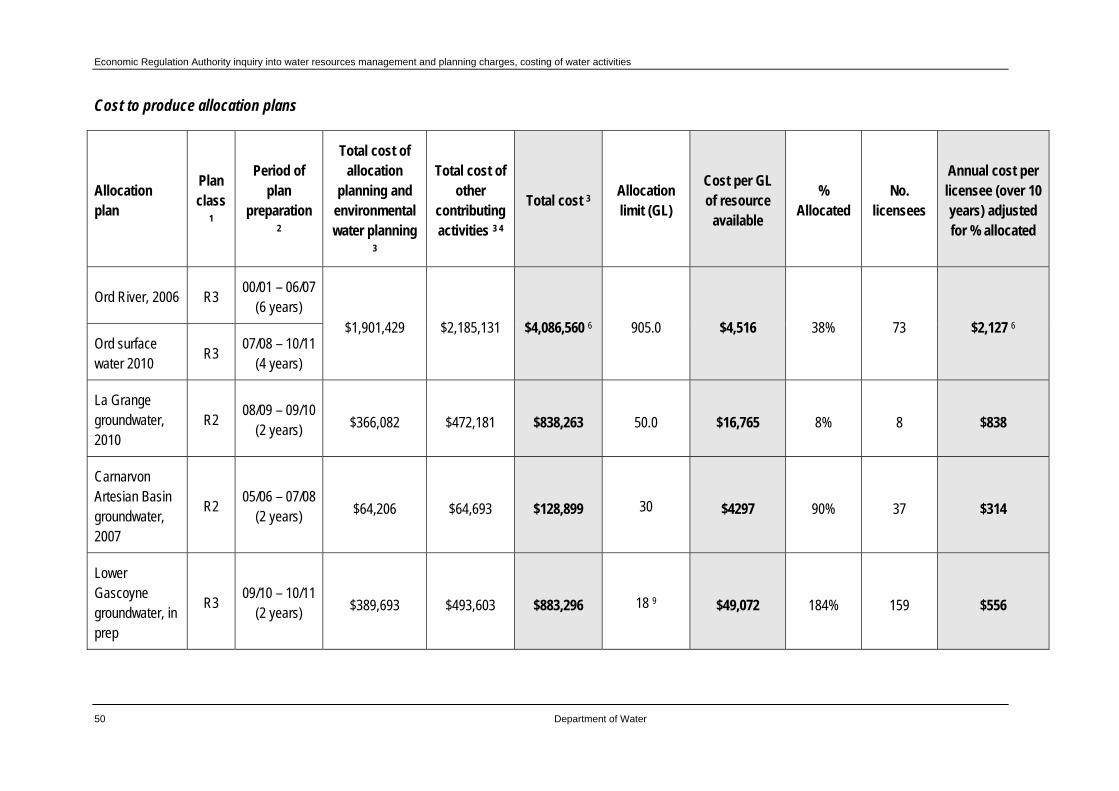
Economic Regulation Authority inquiry into water resources management and planning charges, costing of water activities
50 Department of Water
Cost to produce allocation plans
Allocation plan
Plan class
1
Period of plan
preparation 2
Total cost of allocation
planning and environmental water planning
3
Total cost of other
contributing activities 3 4
Total cost 3 Allocation limit (GL)
Cost per GL of resource
available
% Allocated
No. licensees
Annual cost per licensee (over 10 years) adjusted for % allocated
Ord River, 2006 R3 00/01 – 06/07
(6 years) $1,901,429 $2,185,131 $4,086,560 6 905.0 $4,516 38% 73 $2,127 6
Ord surface water 2010
R3 07/08 – 10/11
(4 years)
La Grange groundwater, 2010
R2 08/09 – 09/10
(2 years) $366,082 $472,181 $838,263 50.0 $16,765 8% 8 $838
Carnarvon Artesian Basin groundwater, 2007
R2 05/06 – 07/08
(2 years) $64,206 $64,693 $128,899 30 $4297 90% 37 $314
Lower Gascoyne groundwater, in prep
R3 09/10 – 10/11
(2 years) $389,693 $493,603 $883,296 18 9 $49,072 184% 159 $556
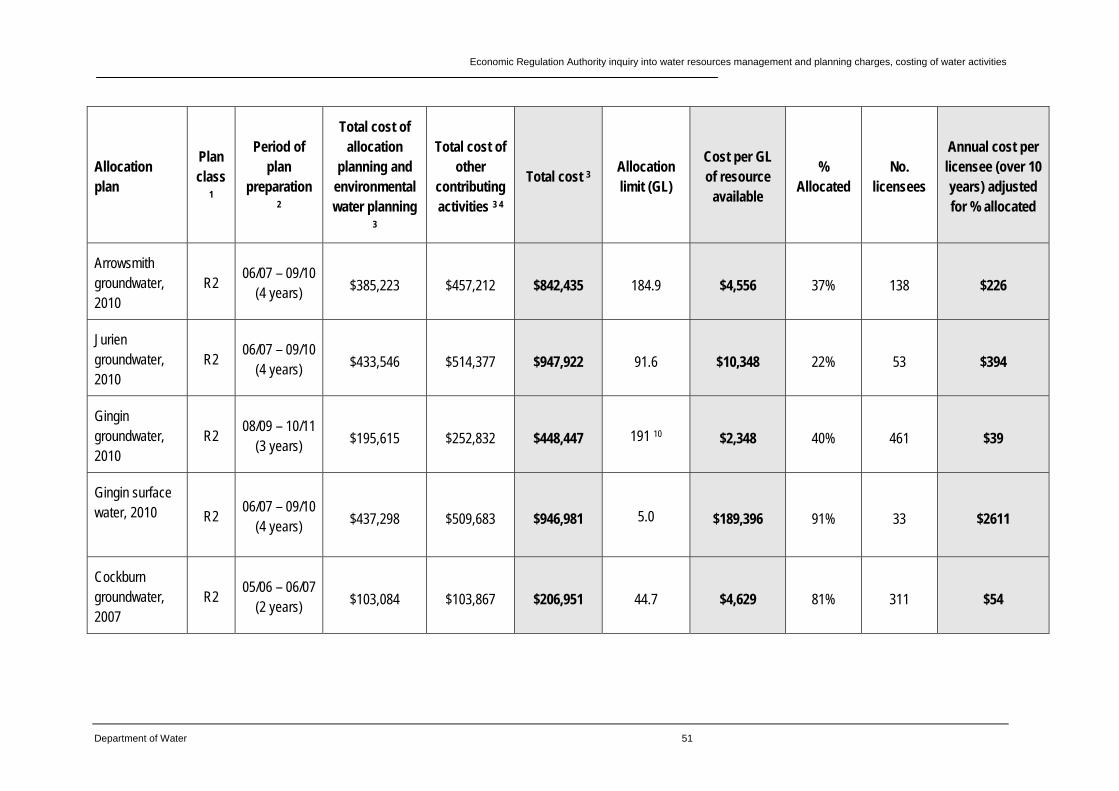
Economic Regulation Authority inquiry into water resources management and planning charges, costing of water activities
Department of Water 51
Allocation plan
Plan class
1
Period of plan
preparation 2
Total cost of allocation
planning and environmental water planning
3
Total cost of other
contributing activities 3 4
Total cost 3 Allocation limit (GL)
Cost per GL of resource
available
% Allocated
No. licensees
Annual cost per licensee (over 10 years) adjusted for % allocated
Arrowsmith groundwater, 2010
R2 06/07 – 09/10
(4 years) $385,223 $457,212 $842,435 184.9 $4,556 37% 138 $226
Jurien groundwater, 2010
R2 06/07 – 09/10
(4 years) $433,546 $514,377 $947,922 91.6 $10,348 22% 53 $394
Gingin groundwater, 2010
R2 08/09 – 10/11
(3 years) $195,615 $252,832 $448,447 191 10 $2,348 40% 461 $39
Gingin surface water, 2010
R2 06/07 – 09/10
(4 years) $437,298 $509,683 $946,981 5.0 $189,396 91% 33 $2611
Cockburn groundwater, 2007
R2 05/06 – 06/07
(2 years) $103,084 $103,867 $206,951 44.7 $4,629 81% 311 $54
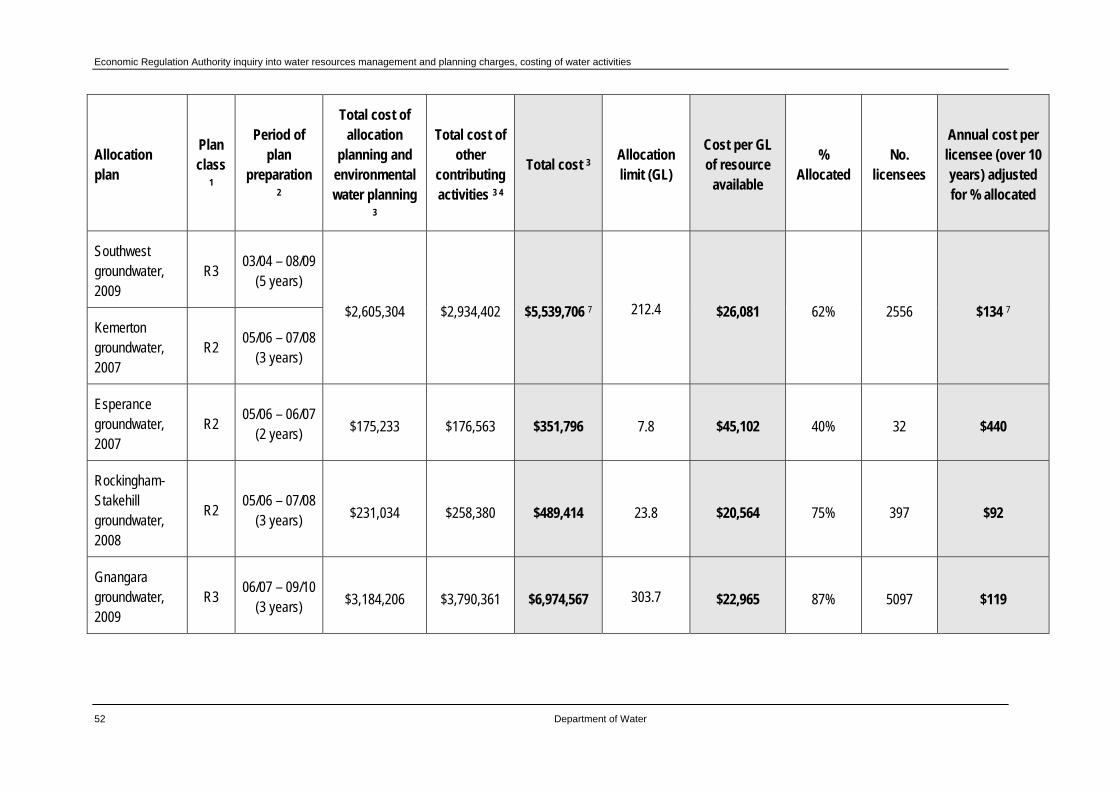
Economic Regulation Authority inquiry into water resources management and planning charges, costing of water activities
52 Department of Water
Allocation plan
Plan class
1
Period of plan
preparation 2
Total cost of allocation
planning and environmental water planning
3
Total cost of other
contributing activities 3 4
Total cost 3 Allocation limit (GL)
Cost per GL of resource
available
% Allocated
No. licensees
Annual cost per licensee (over 10 years) adjusted for % allocated
Southwest groundwater, 2009
R3 03/04 – 08/09
(5 years)
$2,605,304 $2,934,402 $5,539,706 7 212.4 $26,081 62% 2556 $134 7
Kemerton groundwater, 2007
R2 05/06 – 07/08
(3 years)
Esperance groundwater, 2007
R2 05/06 – 06/07
(2 years) $175,233 $176,563 $351,796 7.8 $45,102 40% 32 $440
Rockingham-Stakehill groundwater, 2008
R2 05/06 – 07/08
(3 years) $231,034 $258,380 $489,414 23.8 $20,564 75% 397 $92
Gnangara groundwater, 2009
R3 06/07 – 09/10
(3 years) $3,184,206 $3,790,361 $6,974,567 303.7 $22,965 87% 5097 $119
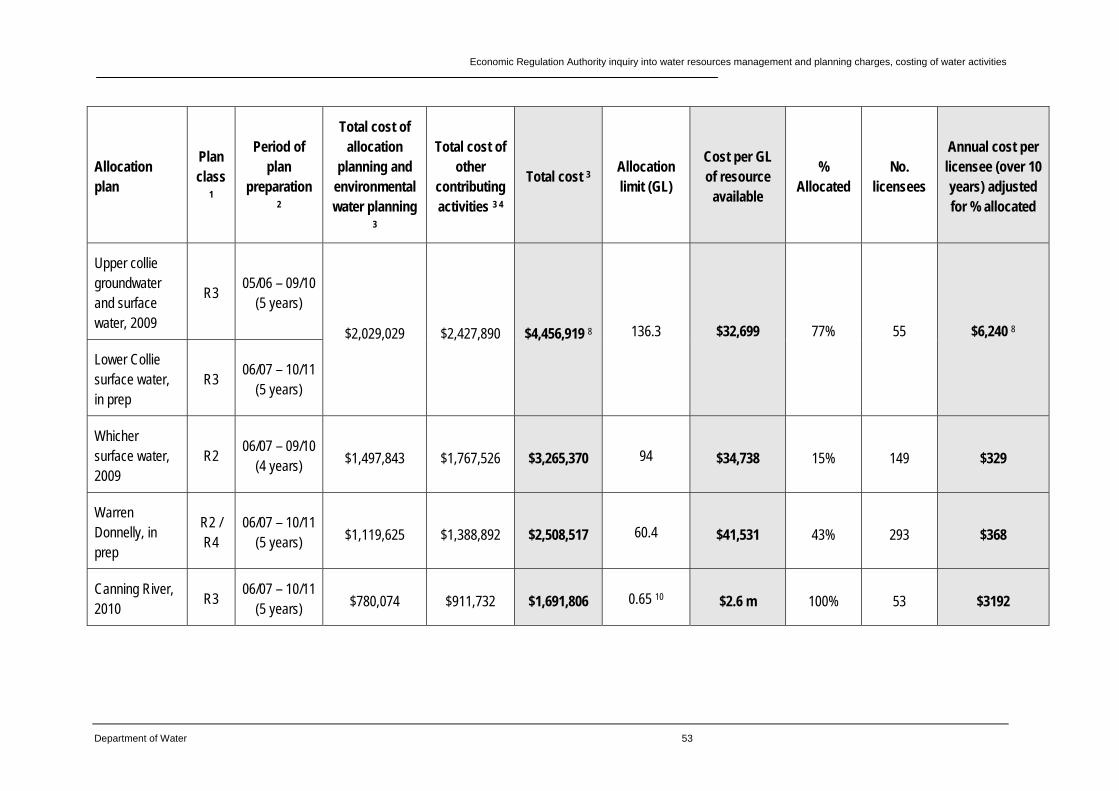
Economic Regulation Authority inquiry into water resources management and planning charges, costing of water activities
Department of Water 53
Allocation plan
Plan class
1
Period of plan
preparation 2
Total cost of allocation
planning and environmental water planning
3
Total cost of other
contributing activities 3 4
Total cost 3 Allocation limit (GL)
Cost per GL of resource
available
% Allocated
No. licensees
Annual cost per licensee (over 10 years) adjusted for % allocated
Upper collie groundwater and surface water, 2009
R3 05/06 – 09/10
(5 years)
$2,029,029 $2,427,890 $4,456,919 8 136.3 $32,699 77% 55 $6,240 8
Lower Collie surface water, in prep
R3 06/07 – 10/11
(5 years)
Whicher surface water, 2009
R2 06/07 – 09/10
(4 years) $1,497,843 $1,767,526 $3,265,370 94 $34,738 15% 149 $329
Warren Donnelly, in prep
R2 / R4
06/07 – 10/11 (5 years) $1,119,625 $1,388,892 $2,508,517 60.4 $41,531 43% 293 $368
Canning River, 2010
R3 06/07 – 10/11
(5 years) $780,074 $911,732 $1,691,806 0.65 10 $2.6 m 100% 53 $3192
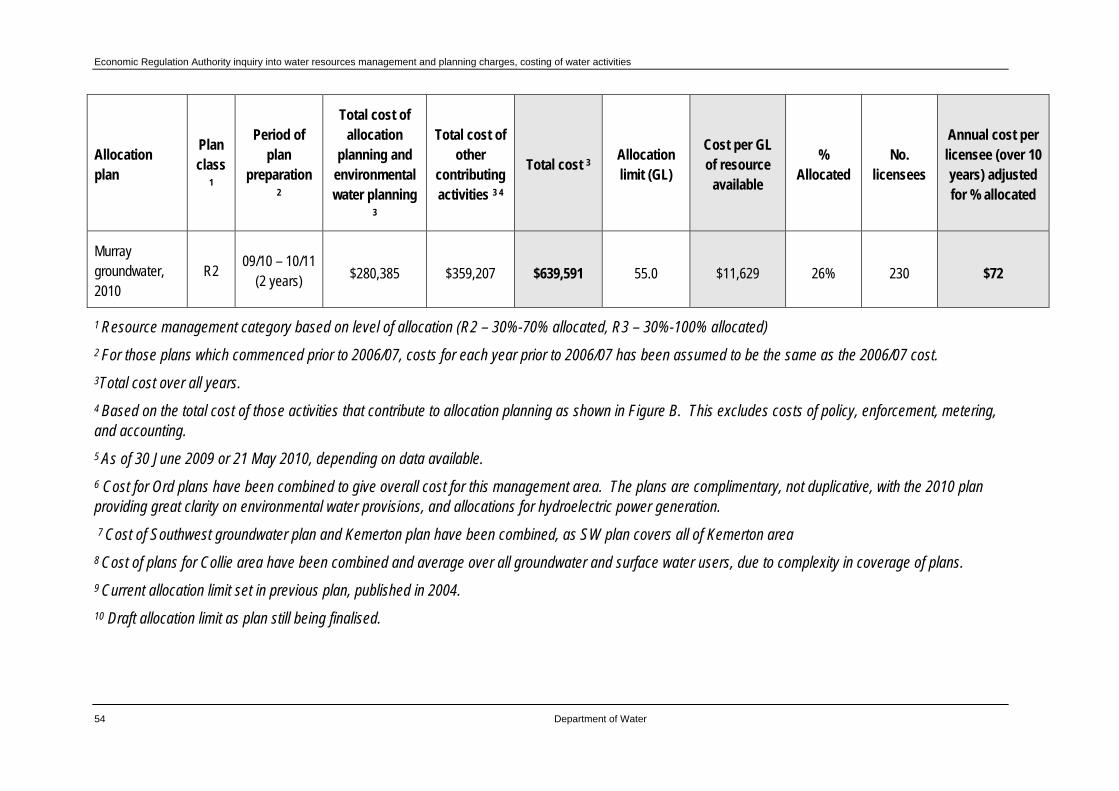
Economic Regulation Authority inquiry into water resources management and planning charges, costing of water activities
54 Department of Water
Allocation plan
Plan class
1
Period of plan
preparation 2
Total cost of allocation
planning and environmental water planning
3
Total cost of other
contributing activities 3 4
Total cost 3 Allocation limit (GL)
Cost per GL of resource
available
% Allocated
No. licensees
Annual cost per licensee (over 10 years) adjusted for % allocated
Murray groundwater, 2010
R2 09/10 – 10/11
(2 years) $280,385 $359,207 $639,591 55.0 $11,629 26% 230 $72
1 Resource management category based on level of allocation (R2 – 30%-70% allocated, R3 – 30%-100% allocated)
2 For those plans which commenced prior to 2006/07, costs for each year prior to 2006/07 has been assumed to be the same as the 2006/07 cost.
3Total cost over all years.
4 Based on the total cost of those activities that contribute to allocation planning as shown in Figure B. This excludes costs of policy, enforcement, metering, and accounting.
5 As of 30 June 2009 or 21 May 2010, depending on data available.
6 Cost for Ord plans have been combined to give overall cost for this management area. The plans are complimentary, not duplicative, with the 2010 plan providing great clarity on environmental water provisions, and allocations for hydroelectric power generation.
7 Cost of Southwest groundwater plan and Kemerton plan have been combined, as SW plan covers all of Kemerton area
8 Cost of plans for Collie area have been combined and average over all groundwater and surface water users, due to complexity in coverage of plans.
9 Current allocation limit set in previous plan, published in 2004.
10 Draft allocation limit as plan still being finalised.
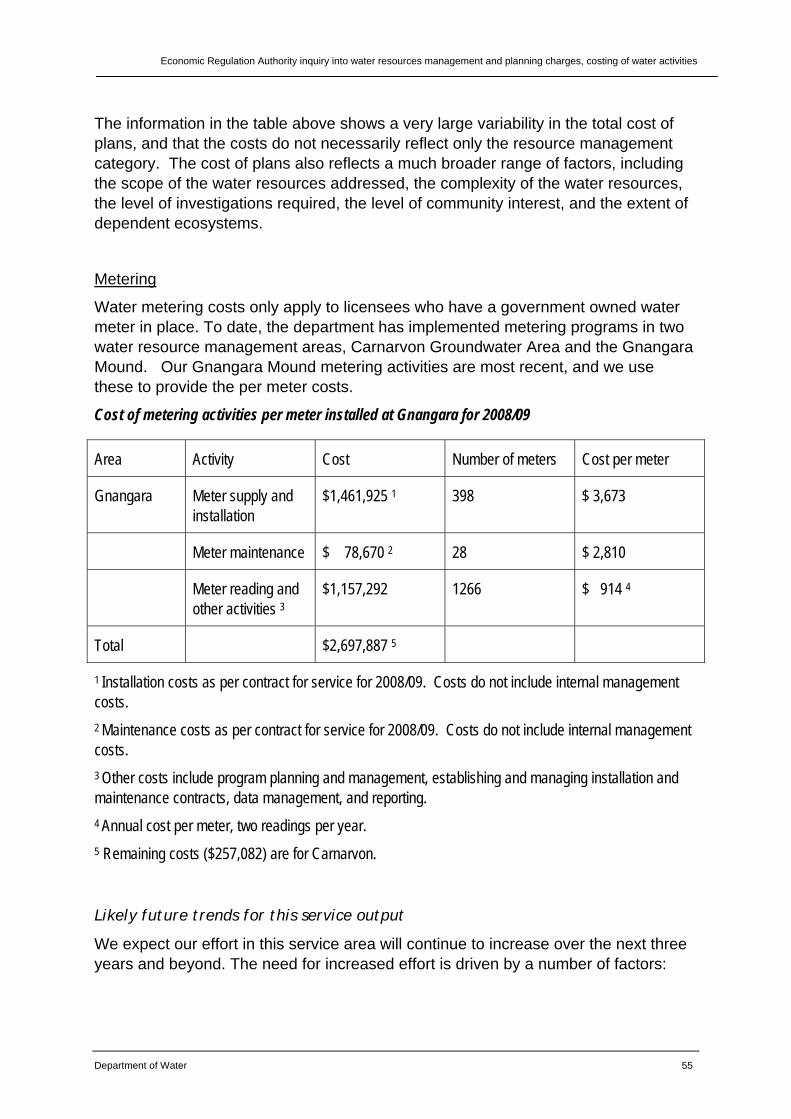
Economic Regulation Authority inquiry into water resources management and planning charges, costing of water activities
Department of Water 55
The information in the table above shows a very large variability in the total cost of plans, and that the costs do not necessarily reflect only the resource management category. The cost of plans also reflects a much broader range of factors, including the scope of the water resources addressed, the complexity of the water resources, the level of investigations required, the level of community interest, and the extent of dependent ecosystems.
Metering
Water metering costs only apply to licensees who have a government owned water meter in place. To date, the department has implemented metering programs in two water resource management areas, Carnarvon Groundwater Area and the Gnangara Mound. Our Gnangara Mound metering activities are most recent, and we use these to provide the per meter costs.
Cost of metering activities per meter installed at Gnangara for 2008/09
Area Activity Cost Number of meters Cost per meter
Gnangara Meter supply and installation
$1,461,925 1 398 $ 3,673
Meter maintenance $ 78,670 2 28 $ 2,810
Meter reading and other activities 3
$1,157,292 1266 $ 914 4
Total $2,697,887 5
1 Installation costs as per contract for service for 2008/09. Costs do not include internal management costs.
2 Maintenance costs as per contract for service for 2008/09. Costs do not include internal management costs.
3 Other costs include program planning and management, establishing and managing installation and maintenance contracts, data management, and reporting.
4 Annual cost per meter, two readings per year.
5 Remaining costs ($257,082) are for Carnarvon.
Likely future trends for this service output
We expect our effort in this service area will continue to increase over the next three years and beyond. The need for increased effort is driven by a number of factors:
Economic Regulation Authority inquiry into water resources management and planning charges, costing of water activities
56 Department of Water
The growth in water use in WA, with an increasing number of water resource reaching higher levels of allocation, requiring a more detailed assessment , planning and management response;
The commitment to the National Water Initiative to develop statutory plans which provide security for water users, based on a consumptive pool approach. This will require increasingly sophisticated planning and management response, with a great emphasis on monitoring and adaptive management.
An increase need to focus on compliance and enforcement as water resources become more fully allocated.
4.4 Protecting public drinking water sources
Service description
The department undertakes a range of activities with the aim of protecting drinking water sources used by the Water Corporation and other public water supply service providers to provide water supplies to customers. Other service providers include AQWEST, the Busselton Water Board, mining companies and local government authorities.
Private parties associated with this service
The private parties associated with this service are public water supply customers around the state, via the public water supply service providers.
Attribution of activities to this service, private benefit proportion, and total cost to be recovered
The various departmental activities which contribute to the protection of public water supplies are shown in the table below.
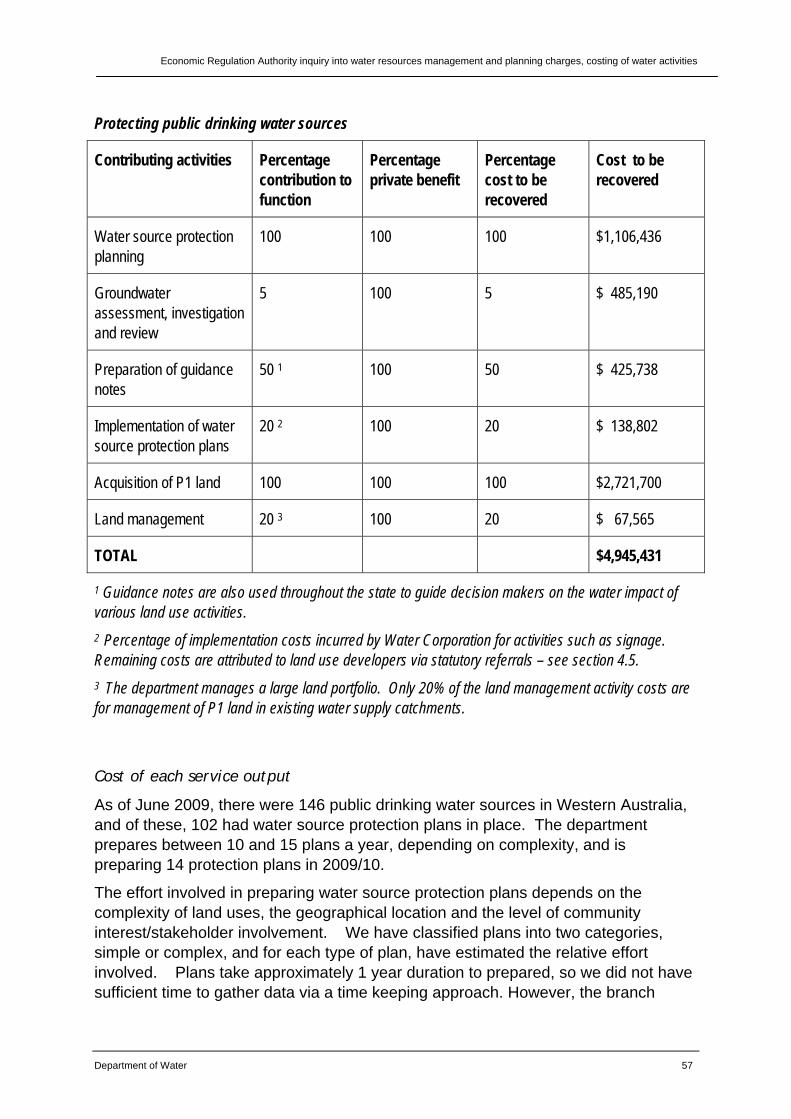
Economic Regulation Authority inquiry into water resources management and planning charges, costing of water activities
Department of Water 57
Protecting public drinking water sources
Contributing activities Percentage contribution to function
Percentage private benefit
Percentage cost to be recovered
Cost to be recovered
Water source protection planning
100 100 100 $1,106,436
Groundwater assessment, investigation and review
5 100 5 $ 485,190
Preparation of guidance notes
50 1 100 50 $ 425,738
Implementation of water source protection plans
20 2 100 20 $ 138,802
Acquisition of P1 land 100 100 100 $2,721,700
Land management 20 3 100 20 $ 67,565
TOTAL $4,945,431
1 Guidance notes are also used throughout the state to guide decision makers on the water impact of various land use activities.
2 Percentage of implementation costs incurred by Water Corporation for activities such as signage. Remaining costs are attributed to land use developers via statutory referrals – see section 4.5.
3 The department manages a large land portfolio. Only 20% of the land management activity costs are for management of P1 land in existing water supply catchments.
Cost of each service output
As of June 2009, there were 146 public drinking water sources in Western Australia, and of these, 102 had water source protection plans in place. The department prepares between 10 and 15 plans a year, depending on complexity, and is preparing 14 protection plans in 2009/10.
The effort involved in preparing water source protection plans depends on the complexity of land uses, the geographical location and the level of community interest/stakeholder involvement. We have classified plans into two categories, simple or complex, and for each type of plan, have estimated the relative effort involved. Plans take approximately 1 year duration to prepared, so we did not have sufficient time to gather data via a time keeping approach. However, the branch
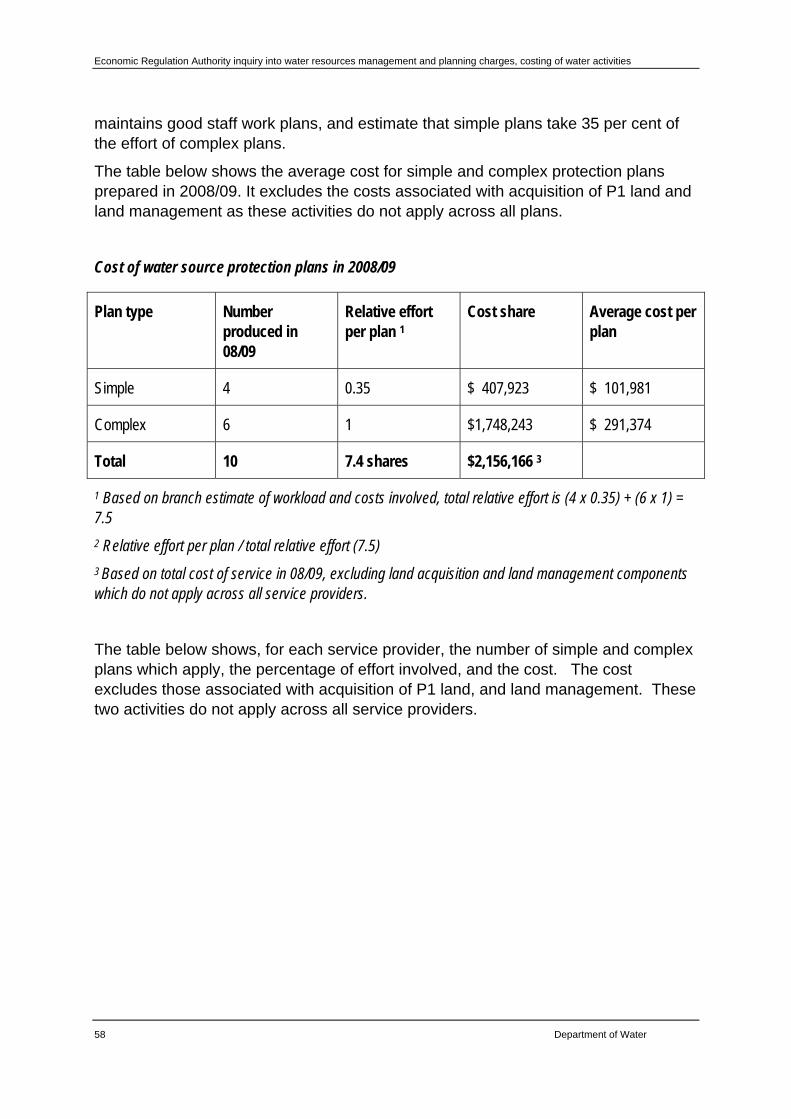
Economic Regulation Authority inquiry into water resources management and planning charges, costing of water activities
58 Department of Water
maintains good staff work plans, and estimate that simple plans take 35 per cent of the effort of complex plans.
The table below shows the average cost for simple and complex protection plans prepared in 2008/09. It excludes the costs associated with acquisition of P1 land and land management as these activities do not apply across all plans.
Cost of water source protection plans in 2008/09
Plan type Number produced in 08/09
Relative effort per plan 1
Cost share Average cost per plan
Simple 4 0.35 $ 407,923 $ 101,981
Complex 6 1 $1,748,243 $ 291,374
Total 10 7.4 shares $2,156,166 3
1 Based on branch estimate of workload and costs involved, total relative effort is (4 x 0.35) + (6 x 1) = 7.5
2 Relative effort per plan / total relative effort (7.5)
3 Based on total cost of service in 08/09, excluding land acquisition and land management components which do not apply across all service providers.
The table below shows, for each service provider, the number of simple and complex plans which apply, the percentage of effort involved, and the cost. The cost excludes those associated with acquisition of P1 land, and land management. These two activities do not apply across all service providers.
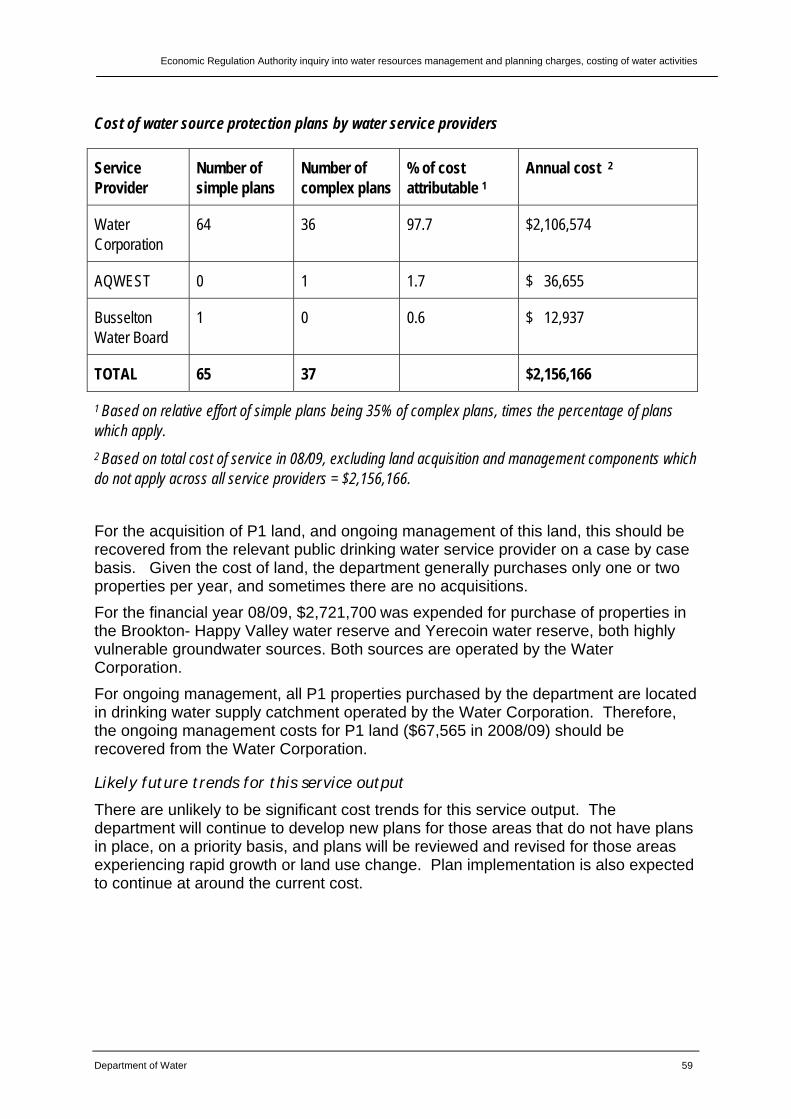
Economic Regulation Authority inquiry into water resources management and planning charges, costing of water activities
Department of Water 59
Cost of water source protection plans by water service providers
Service Provider
Number of simple plans
Number of complex plans
% of cost attributable 1
Annual cost 2
Water Corporation
64 36 97.7 $2,106,574
AQWEST 0 1 1.7 $ 36,655
Busselton Water Board
1 0 0.6 $ 12,937
TOTAL 65 37 $2,156,166
1 Based on relative effort of simple plans being 35% of complex plans, times the percentage of plans which apply.
2 Based on total cost of service in 08/09, excluding land acquisition and management components which do not apply across all service providers = $2,156,166.
For the acquisition of P1 land, and ongoing management of this land, this should be recovered from the relevant public drinking water service provider on a case by case basis. Given the cost of land, the department generally purchases only one or two properties per year, and sometimes there are no acquisitions.
For the financial year 08/09, $2,721,700 was expended for purchase of properties in the Brookton- Happy Valley water reserve and Yerecoin water reserve, both highly vulnerable groundwater sources. Both sources are operated by the Water Corporation.
For ongoing management, all P1 properties purchased by the department are located in drinking water supply catchment operated by the Water Corporation. Therefore, the ongoing management costs for P1 land ($67,565 in 2008/09) should be recovered from the Water Corporation.
Likely future trends for this service output
There are unlikely to be significant cost trends for this service output. The department will continue to develop new plans for those areas that do not have plans in place, on a priority basis, and plans will be reviewed and revised for those areas experiencing rapid growth or land use change. Plan implementation is also expected to continue at around the current cost.
Economic Regulation Authority inquiry into water resources management and planning charges, costing of water activities
60 Department of Water
4.5 Providing advice on statutory referrals
Service description
The department receives referrals of land planning and development applications from local government authorities (LGAs) and the Western Australian Planning Commission (WAPC). These referrals provide the opportunity for the department to provide advice to decision making authorities on water management impacts (including impact on water source protection areas) of proposed land use development.
Private parties associated with this service
The private parties associated with this service are land use development proponents, ranging from individuals to companies, and including proposals related to urban development, industrial development, and intensification of rural activities. Where the proposals are at a local scale (sub-divisions or local planning and development proposals) the proponents can be identified. Where they occur at a district or regional scale, the proponents generally cannot be identified as the planning is often done in anticipation of development, not triggered by individual development proposals. In these cases, the potential beneficiaries of the work could be any holders of land within the areas concerned.
Attribution of activities to this service, private benefit proportion, and total cost to be recovered
The following table shows the activities involved, the proposed percentage share of the cost of those activities which should be recovered, and the total costs to be recovered.

Economic Regulation Authority inquiry into water resources management and planning charges, costing of water activities
Department of Water 61
Statutory referrals
Contributing activities Percentage contribution to function
Percentage private benefit
Percentage cost to be recovered
Cost to be recovered
Statutory referrals 100 100 100 $1,424,201
Implementation of water source protection plans
80 1 100 80 $ 555,208
Preparation of guidance notes
50 2 100 50 $ 425,738
TOTAL $2,405,147
1 Reflects the component of water source protection plan implementation which relates to providing advice on land use and development proposals in public drinking water supply catchments.
2 Reflects the component of guidance notes that contributes to providing advice on the impact of land use and development proposals.
Cost of each service output
In 2008/09, the department responded to 2189 statutory referrals. This gives an average cost per referral of $1099. However the referrals we deal with range greatly in their complexity and the effort involved in responding.
The department receives five different types of statutory referral, as shown in the table below. The referrals range from specific local scale proposals, such as subdivisions, to regional scale, strategic planning scheme referrals. Some statutory referrals are accompanied by a technical report, which is assessed as part of the referral. Generally the more strategic the referral, the greater the effort required to respond. However, the effort involved in local scale proposals also varies considerably based on the complexity of the proposal, the water resource risk, and the level of public interest.
The departments Statutory Referrals System is used to record the statutory referrals received by the department, and to document the responses. This is used for key performance indicator reporting. The system enables the department to report on the total number of referrals received, but it does not allow differentiation into the five referral types. The number of technical reports assessed along with statutory referrals is recorded separately.
In order to understand the effort involved in the various statutory referrals we deal with, the department implemented a two month time keeping exercise for relevant staff. Staff were asked to record the effort involved in responding to the five different types of statutory referrals, and to record additional details around the complexity,
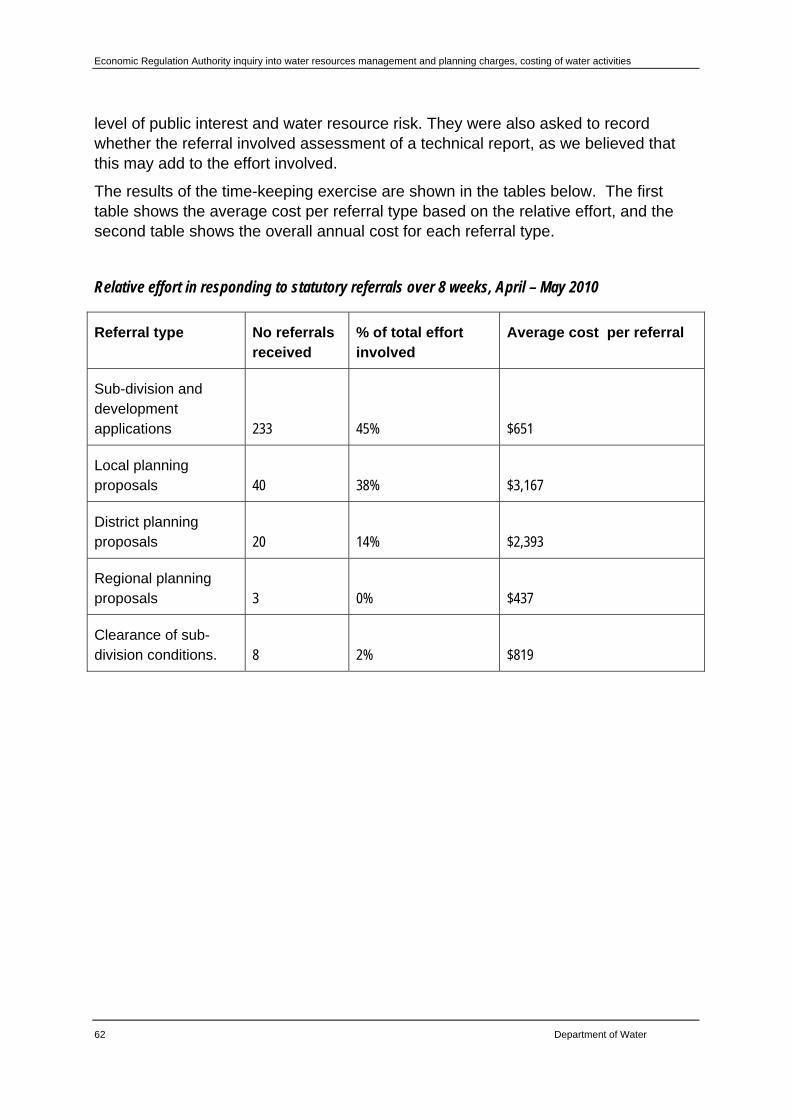
Economic Regulation Authority inquiry into water resources management and planning charges, costing of water activities
62 Department of Water
level of public interest and water resource risk. They were also asked to record whether the referral involved assessment of a technical report, as we believed that this may add to the effort involved.
The results of the time-keeping exercise are shown in the tables below. The first table shows the average cost per referral type based on the relative effort, and the second table shows the overall annual cost for each referral type.
Relative effort in responding to statutory referrals over 8 weeks, April – May 2010
Referral type No referrals received
% of total effort involved
Average cost per referral
Sub-division and development applications 233 45% $651
Local planning proposals 40 38% $3,167
District planning proposals 20 14% $2,393
Regional planning proposals 3 0% $437
Clearance of sub-division conditions. 8 2% $819
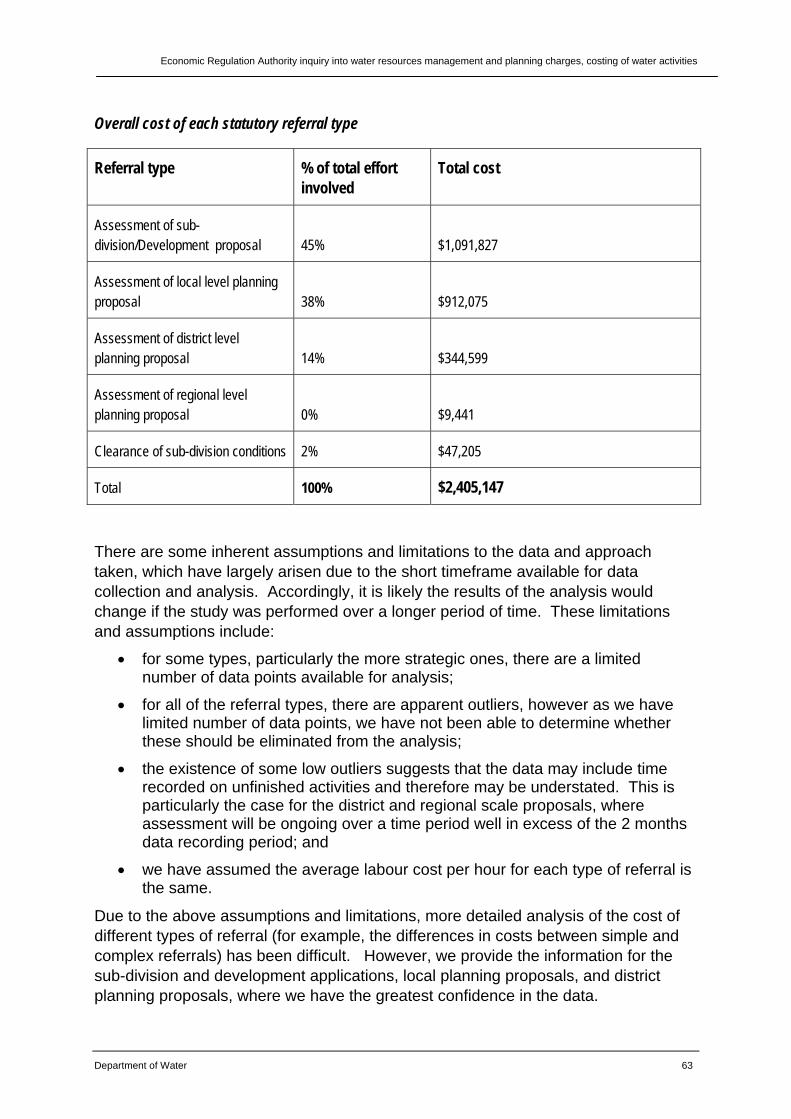
Economic Regulation Authority inquiry into water resources management and planning charges, costing of water activities
Department of Water 63
Overall cost of each statutory referral type
Referral type % of total effort involved
Total cost
Assessment of sub-division/Development proposal 45% $1,091,827
Assessment of local level planning proposal 38% $912,075
Assessment of district level planning proposal 14% $344,599
Assessment of regional level planning proposal 0% $9,441
Clearance of sub-division conditions 2% $47,205
Total 100% $2,405,147
There are some inherent assumptions and limitations to the data and approach taken, which have largely arisen due to the short timeframe available for data collection and analysis. Accordingly, it is likely the results of the analysis would change if the study was performed over a longer period of time. These limitations and assumptions include:
for some types, particularly the more strategic ones, there are a limited number of data points available for analysis;
for all of the referral types, there are apparent outliers, however as we have limited number of data points, we have not been able to determine whether these should be eliminated from the analysis;
the existence of some low outliers suggests that the data may include time recorded on unfinished activities and therefore may be understated. This is particularly the case for the district and regional scale proposals, where assessment will be ongoing over a time period well in excess of the 2 months data recording period; and
we have assumed the average labour cost per hour for each type of referral is the same.
Due to the above assumptions and limitations, more detailed analysis of the cost of different types of referral (for example, the differences in costs between simple and complex referrals) has been difficult. However, we provide the information for the sub-division and development applications, local planning proposals, and district planning proposals, where we have the greatest confidence in the data.
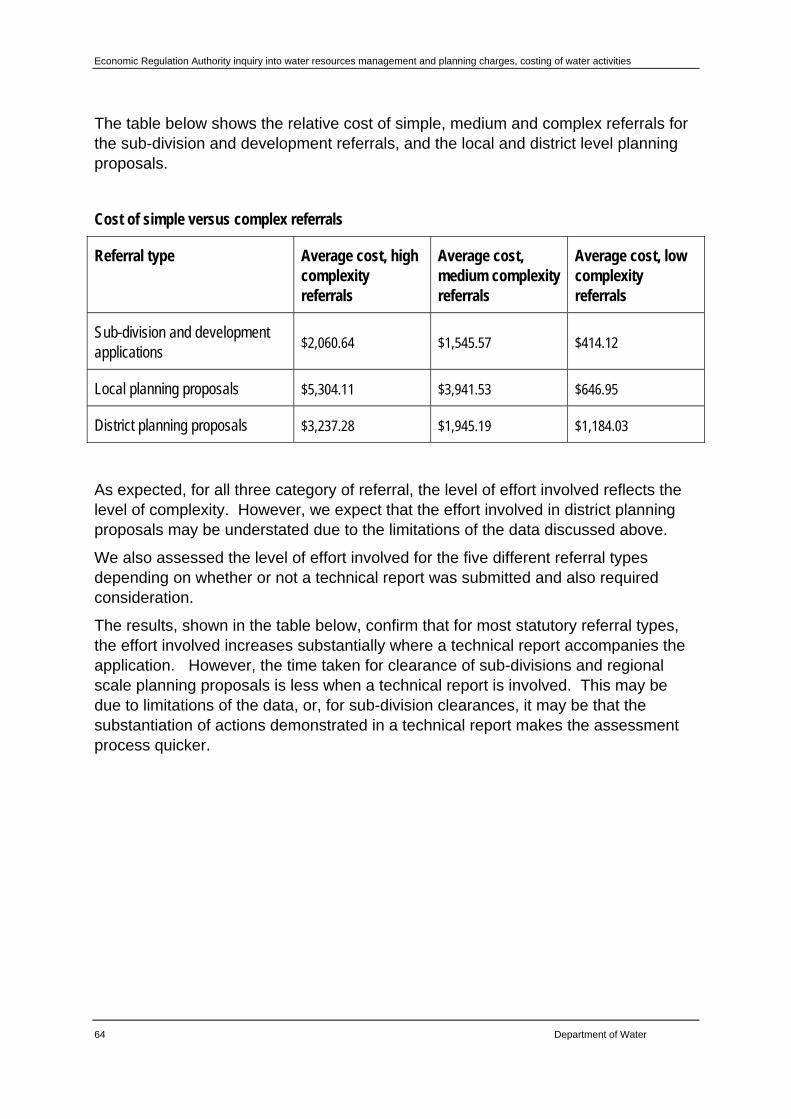
Economic Regulation Authority inquiry into water resources management and planning charges, costing of water activities
64 Department of Water
The table below shows the relative cost of simple, medium and complex referrals for the sub-division and development referrals, and the local and district level planning proposals.
Cost of simple versus complex referrals
Referral type Average cost, high complexity referrals
Average cost, medium complexity referrals
Average cost, low complexity referrals
Sub-division and development applications
$2,060.64 $1,545.57 $414.12
Local planning proposals $5,304.11 $3,941.53 $646.95
District planning proposals $3,237.28 $1,945.19 $1,184.03
As expected, for all three category of referral, the level of effort involved reflects the level of complexity. However, we expect that the effort involved in district planning proposals may be understated due to the limitations of the data discussed above.
We also assessed the level of effort involved for the five different referral types depending on whether or not a technical report was submitted and also required consideration.
The results, shown in the table below, confirm that for most statutory referral types, the effort involved increases substantially where a technical report accompanies the application. However, the time taken for clearance of sub-divisions and regional scale planning proposals is less when a technical report is involved. This may be due to limitations of the data, or, for sub-division clearances, it may be that the substantiation of actions demonstrated in a technical report makes the assessment process quicker.
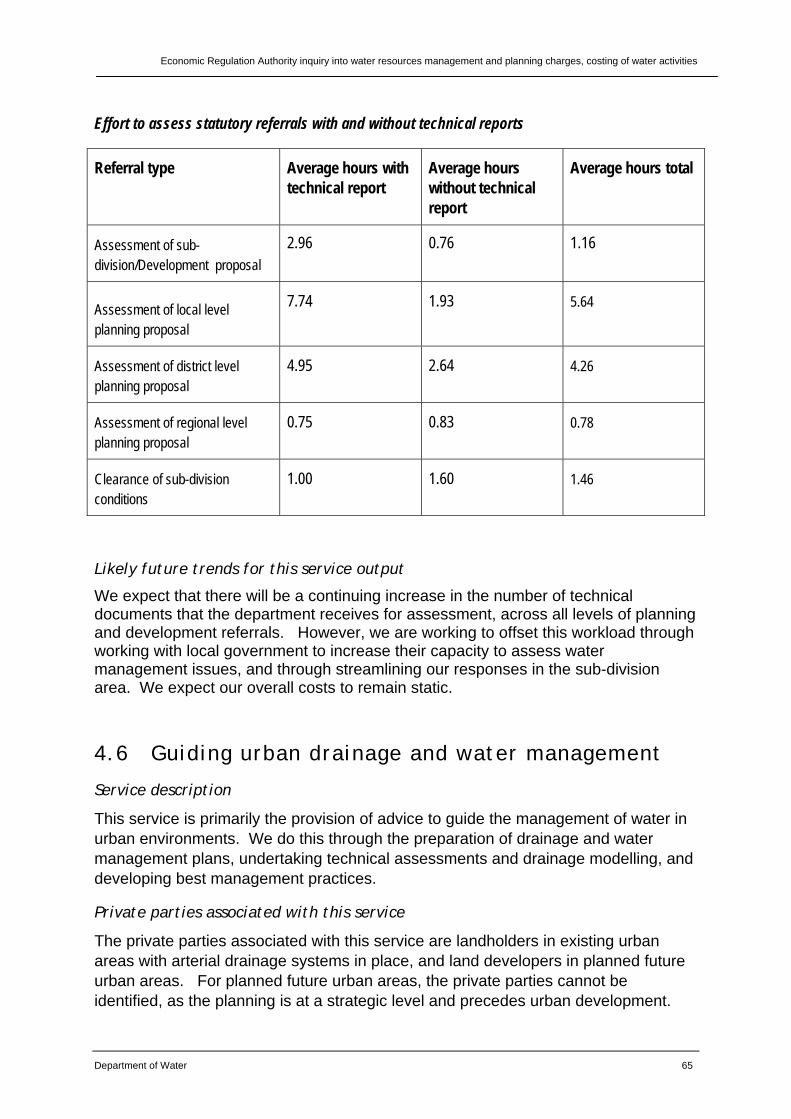
Economic Regulation Authority inquiry into water resources management and planning charges, costing of water activities
Department of Water 65
Effort to assess statutory referrals with and without technical reports
Referral type Average hours with technical report
Average hours without technical report
Average hours total
Assessment of sub-division/Development proposal
2.96 0.76 1.16
Assessment of local level planning proposal
7.74 1.93 5.64
Assessment of district level planning proposal
4.95 2.64 4.26
Assessment of regional level planning proposal
0.75 0.83 0.78
Clearance of sub-division conditions
1.00 1.60 1.46
Likely future trends for this service output
We expect that there will be a continuing increase in the number of technical documents that the department receives for assessment, across all levels of planning and development referrals. However, we are working to offset this workload through working with local government to increase their capacity to assess water management issues, and through streamlining our responses in the sub-division area. We expect our overall costs to remain static.
4.6 Guiding urban drainage and water management
Service description
This service is primarily the provision of advice to guide the management of water in urban environments. We do this through the preparation of drainage and water management plans, undertaking technical assessments and drainage modelling, and developing best management practices.
Private parties associated with this service
The private parties associated with this service are landholders in existing urban areas with arterial drainage systems in place, and land developers in planned future urban areas. For planned future urban areas, the private parties cannot be identified, as the planning is at a strategic level and precedes urban development.
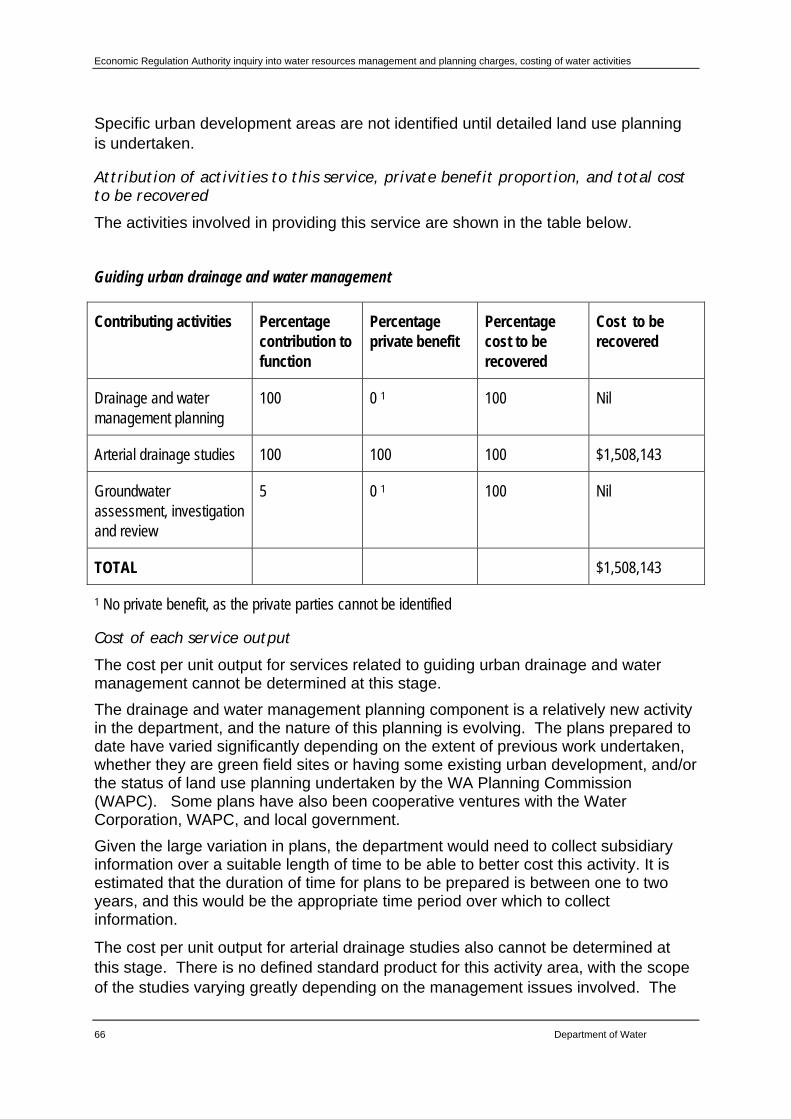
Economic Regulation Authority inquiry into water resources management and planning charges, costing of water activities
66 Department of Water
Specific urban development areas are not identified until detailed land use planning is undertaken.
Attribution of activities to this service, private benefit proportion, and total cost to be recovered
The activities involved in providing this service are shown in the table below.
Guiding urban drainage and water management
Contributing activities Percentage contribution to function
Percentage private benefit
Percentage cost to be recovered
Cost to be recovered
Drainage and water management planning
100 0 1 100 Nil
Arterial drainage studies 100 100 100 $1,508,143
Groundwater assessment, investigation and review
5 0 1 100 Nil
TOTAL $1,508,143
1 No private benefit, as the private parties cannot be identified
Cost of each service output
The cost per unit output for services related to guiding urban drainage and water management cannot be determined at this stage.
The drainage and water management planning component is a relatively new activity in the department, and the nature of this planning is evolving. The plans prepared to date have varied significantly depending on the extent of previous work undertaken, whether they are green field sites or having some existing urban development, and/or the status of land use planning undertaken by the WA Planning Commission (WAPC). Some plans have also been cooperative ventures with the Water Corporation, WAPC, and local government.
Given the large variation in plans, the department would need to collect subsidiary information over a suitable length of time to be able to better cost this activity. It is estimated that the duration of time for plans to be prepared is between one to two years, and this would be the appropriate time period over which to collect information.
The cost per unit output for arterial drainage studies also cannot be determined at this stage. There is no defined standard product for this activity area, with the scope of the studies varying greatly depending on the management issues involved. The
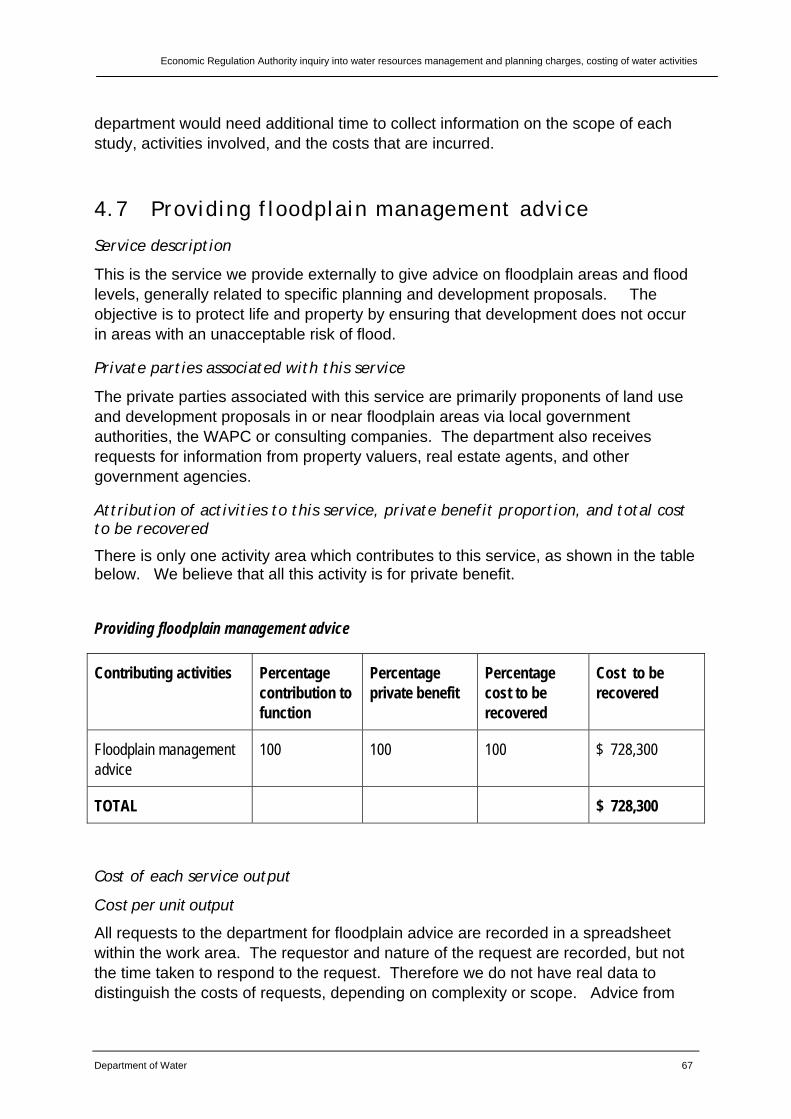
Economic Regulation Authority inquiry into water resources management and planning charges, costing of water activities
Department of Water 67
department would need additional time to collect information on the scope of each study, activities involved, and the costs that are incurred.
4.7 Providing floodplain management advice
Service description
This is the service we provide externally to give advice on floodplain areas and flood levels, generally related to specific planning and development proposals. The objective is to protect life and property by ensuring that development does not occur in areas with an unacceptable risk of flood.
Private parties associated with this service
The private parties associated with this service are primarily proponents of land use and development proposals in or near floodplain areas via local government authorities, the WAPC or consulting companies. The department also receives requests for information from property valuers, real estate agents, and other government agencies.
Attribution of activities to this service, private benefit proportion, and total cost to be recovered
There is only one activity area which contributes to this service, as shown in the table below. We believe that all this activity is for private benefit.
Providing floodplain management advice
Contributing activities Percentage contribution to function
Percentage private benefit
Percentage cost to be recovered
Cost to be recovered
Floodplain management advice
100 100 100 $ 728,300
TOTAL $ 728,300
Cost of each service output
Cost per unit output
All requests to the department for floodplain advice are recorded in a spreadsheet within the work area. The requestor and nature of the request are recorded, but not the time taken to respond to the request. Therefore we do not have real data to distinguish the costs of requests, depending on complexity or scope. Advice from
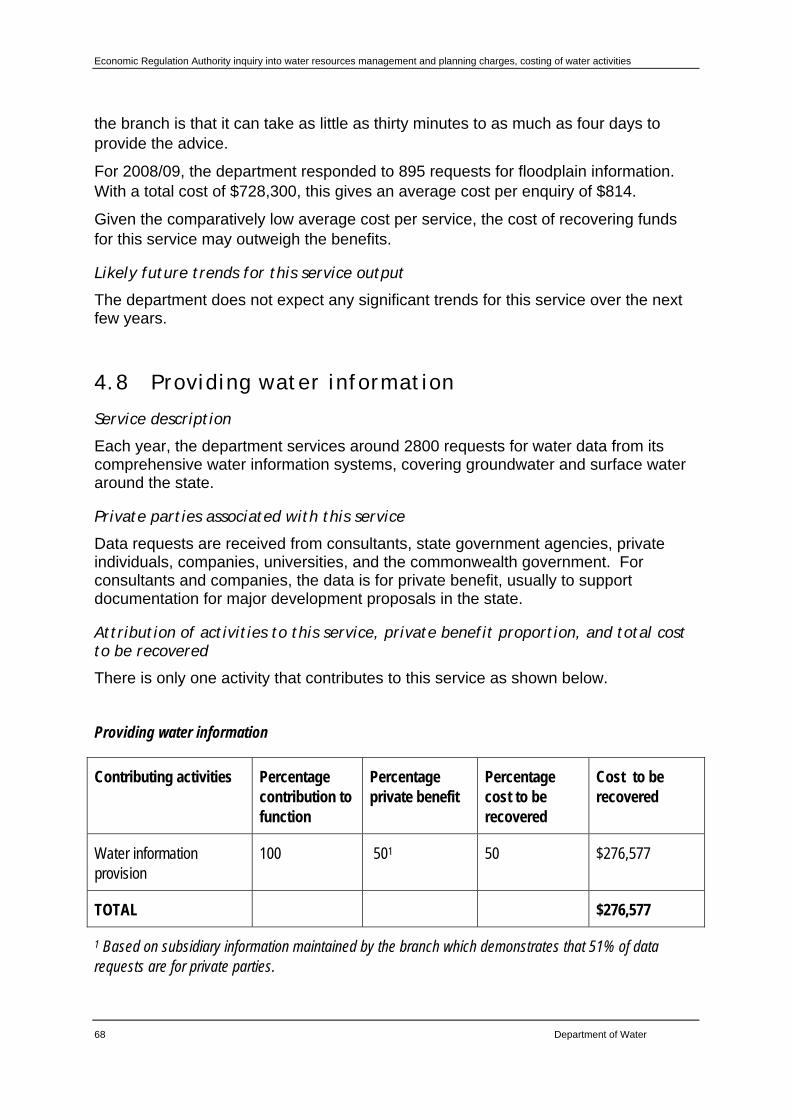
Economic Regulation Authority inquiry into water resources management and planning charges, costing of water activities
68 Department of Water
the branch is that it can take as little as thirty minutes to as much as four days to provide the advice.
For 2008/09, the department responded to 895 requests for floodplain information. With a total cost of $728,300, this gives an average cost per enquiry of $814.
Given the comparatively low average cost per service, the cost of recovering funds for this service may outweigh the benefits.
Likely future trends for this service output
The department does not expect any significant trends for this service over the next few years.
4.8 Providing water information
Service description
Each year, the department services around 2800 requests for water data from its comprehensive water information systems, covering groundwater and surface water around the state.
Private parties associated with this service
Data requests are received from consultants, state government agencies, private individuals, companies, universities, and the commonwealth government. For consultants and companies, the data is for private benefit, usually to support documentation for major development proposals in the state.
Attribution of activities to this service, private benefit proportion, and total cost to be recovered
There is only one activity that contributes to this service as shown below.
Providing water information
Contributing activities Percentage contribution to function
Percentage private benefit
Percentage cost to be recovered
Cost to be recovered
Water information provision
100 501 50 $276,577
TOTAL $276,577
1 Based on subsidiary information maintained by the branch which demonstrates that 51% of data requests are for private parties.
Economic Regulation Authority inquiry into water resources management and planning charges, costing of water activities
Department of Water 69
Cost of each service output
The data provision group in the department maintains records of all data provision requests, including the scope of the data and the requesting party. The records show that only about 51per cent of data requests are for private organisations. The remainder are from commonwealth, state and local governments, universities, and non-government organisations.
There were 1804 private sector data requests for the 2009 calendar year. This gives an average cost of each data request of $153.
Likely future trends for this service output
The Bureau of Meteorology (BoM) collects water information (at no cost to them) from the department under its powers in the Commonwealth Water Act 2007 (under that Act we are compelled to provide it promptly to BoM).
BOM will be making the supplied information available free from its Australian Water Resource Information System (AWRIS) platform in the near future. There may be less demand for data from DoW, although this will depend in the functionality of the BoM system.
With the introduction of the AWRIS as an alternative free service, there is likely to be a lower level of demand for this service from the department, and the cost of recovering funds is likely to outweigh the benefits.


Department of Water168 St Georges Terrace, Perth, Western Australia
PO Box K822 Perth Western Australia 6842Phone: 08 6364 7600
Fax: 08 6364 7601www.water.wa.gov.au
SCT_Online Print_Final_A4.indd 2 31/05/10 11:08 AM