Economic Performance Evaluation of Fragile 5 Countries ... 5_1_1.pdf · Economic Performance...
17
Journal of Applied Finance & Banking, vol. 5, no. 1, 2015, 1-17 ISSN: 1792-6580 (print version), 1792-6599 (online) Scienpress Ltd, 2015 Economic Performance Evaluation of Fragile 5 Countries after the Great Recession of 2008-2009 using Analytic Network Process and TOPSIS Methods Emrah Önder 1 , Nihat Taş 2 and Ali Hepşen 3 Abstract Economic performance evaluation problem consists many criteria and sub criteria. Therefore it is a kind of multi-criteria decision making (MCDM) problem. It is very important for a country to monitor performance parameters in order to ensure that appropriate and timely decisions and plans can be made. Suitable performance measures can ensure that governments adopt a long-term perspective and allocate the country’s resources to the most effective activities. Fragile five (F5) countries namely Brazil, Turkey, India, Indonesia and South Africa have large and fast growing economies. These developing countries are the members of the G20 countries. But F5 countries have also some economic problems such as current account deficit, external credit and currency. The aim of this study is to evaluate the economic performance model of F5 countries during 2001-2013 periods. Both Analytical Network Process (ANP) and Technique for Order Preference by Similarity to Ideal Solution (TOPSIS) methodologies are used for the outranking of countries using macroeconomic indicators including gross domestic product, current account balance, general government gross debt, general government revenue, general government total expenditure, gross national savings, inflation (average consumer prices), population, total investment, unemployment rate, volume of exports of goods and services, volume of imports of goods and services. In this study, subjective and objective opinions of economy expert turn into quantitative form with ANP. JEL classification numbers: C53, E00, E27, E29 Keywords: Fragile Five Countries, Economic Crisis, Macro Economic Parameters, Economic Performance Evaluation, Analytic Network Process, TOPSIS 1 Dr., Istanbul University, School of Business, Department of Quantitative Methods. Istanbul. 2 Dr., Istanbul University, School of Business, Department of Quantitative Methods. Istanbul 3 Assoc. Prof. Dr., Istanbul University, School of Business, Department of Finance. Istanbul. Article Info: Received : September 11, 2014. Revised : October 20, 2014. Published online : January 1, 2015
Transcript of Economic Performance Evaluation of Fragile 5 Countries ... 5_1_1.pdf · Economic Performance...

Journal of Applied Finance & Banking, vol. 5, no. 1, 2015, 1-17 ISSN: 1792-6580 (print version), 1792-6599 (online) Scienpress Ltd, 2015
Economic Performance Evaluation of Fragile 5 Countries
after the Great Recession of 2008-2009 using Analytic
Network Process and TOPSIS Methods
Emrah Önder1, Nihat Taş2 and Ali Hepşen3
Abstract Economic performance evaluation problem consists many criteria and sub criteria. Therefore it is a kind of multi-criteria decision making (MCDM) problem. It is very important for a country to monitor performance parameters in order to ensure that appropriate and timely decisions and plans can be made. Suitable performance measures can ensure that governments adopt a long-term perspective and allocate the country’s resources to the most effective activities. Fragile five (F5) countries namely Brazil, Turkey, India, Indonesia and South Africa have large and fast growing economies. These developing countries are the members of the G20 countries. But F5 countries have also some economic problems such as current account deficit, external credit and currency. The aim of this study is to evaluate the economic performance model of F5 countries during 2001-2013 periods. Both Analytical Network Process (ANP) and Technique for Order Preference by Similarity to Ideal Solution (TOPSIS) methodologies are used for the outranking of countries using macroeconomic indicators including gross domestic product, current account balance, general government gross debt, general government revenue, general government total expenditure, gross national savings, inflation (average consumer prices), population, total investment, unemployment rate, volume of exports of goods and services, volume of imports of goods and services. In this study, subjective and objective opinions of economy expert turn into quantitative form with ANP. JEL classification numbers: C53, E00, E27, E29 Keywords: Fragile Five Countries, Economic Crisis, Macro Economic Parameters, Economic Performance Evaluation, Analytic Network Process, TOPSIS
1Dr., Istanbul University, School of Business, Department of Quantitative Methods. Istanbul. 2Dr., Istanbul University, School of Business, Department of Quantitative Methods. Istanbul 3Assoc. Prof. Dr., Istanbul University, School of Business, Department of Finance. Istanbul. Article Info: Received : September 11, 2014. Revised : October 20, 2014. Published online : January 1, 2015
2 Emrah Önder, Nihat Taş and Ali Hepşen
1 Introduction An emerging market is a country that has some characteristics of a developed market but is not yet a developed market. This includes countries that may be developed markets in the future or were in the past. It may be a nation with social or business activity in the process of rapid growth and industrialization. The four largest emerging and developing economies by gross domestic product (GDP) are the BRIC countries (Brazil, Russia, India and China); the next four largest markets are MIKT (Mexico, Indonesia, South Korea and Turkey) and finally there is a new terminology named Fragile 5 (Brazil, India, Indonesia, Turkey and South Africa) in the emerging market. According to the International Monetary Fund (IMF), there are 25 countries classified as emerging market economies. They exhibit varying levels of economic growth, inflation, trade and fiscal conditions. Ten years ago, Goldman Sachs declared Brazil, Russia, India and China (BRIC) as the emerging markets with the brightest economic growth prospects. In the year 2013, Morgan Stanley declared the Brazilian real, the Indian rupee, the Indonesian rupiah, the South African rand and the Turkish lira as the "Fragile Five", or the troubled emerging market currencies under the most pressure against the U.S. dollar. According to [1],these countries have important things in common-high inflation, weakening growth, large external, and high dependence on fixed income inflows leave these currencies vulnerable. The risks associated with these particular five currencies are also evident from the fact that central banks in these countries have been among the most aggressive in their bid to support their currencies. The main purpose of this study is to evaluate economic performance of Fragile 5 Countries in order to identify the fragility of them in economic recession period and beyond. The rest of this article is organized as follows. The next two sections present a literature review and give brief information for the Great Recession of 2008-2009. The following section provides overview of fragile five countries and selected macroeconomic parameters. Section five and six explain the theoretical framework adopted in this study and the results. The final section is the conclusion.
2 Literature Review [2] studied the rank of performance of selected Middle East and North Africa (MANA) countries by employing Multiple Attribute Decision Making (MADM). The results of the study indicated that the MENA countries achieved higher values of desirable attributes and lower values of undesirable attributes. [3] adopted analytic network process to study the influence of Reverse Logistics practices in corporate performance in Brazil. They obtained coherent results to the reality of Brazilian companies and recommended the usage of ANP to identify how different Reverse Logistics programs can affect corporate performance indicators. [4] proposed an analytical network process approach based on balanced scorecard (BS) to evaluate banking performance. They chose twenty three indices fit for banking performance evaluation by using expert questionnaires and showed that their suggested ANP evaluation model for banking performance is both useful and effective assessment tool. [5] altered the modified Delphi and the analytic network process (ANP) methods to build an evaluation method and to ascertain ANP effectiveness. They concluded that ANP is an effective tool to provide an accurate solution for the decision makers. [6] developed a model to forecast the likelihood of a
Economic Performance Evaluation of Fragile 5 Countries using TOPSIS Methods 3
financial crisis based on an analytic network process framework. They argued their framework is more flexible and is more comprehensive than traditional methods and previous models. [7] investigated the impacts of the changes in the number of business owners on three measures of economic performance which are employment growth, GDP growth and labor productivity growth for twenty-one OECD countries. They showed the net effect is positive for employment and GDP growth but no effect on labor productivity. [8] examined the impact of liberal policies on the economic performance of labor and capital productivity in the Middle East and North African (MENA) countries, by using nonlinear panel least squares regression with regional dummies and period fixed effects (LSDV) for a sample of 18 MENA countries over the period 1995-2009. He estimated the impact of different aspects of economic freedom on labor and capital productivity. [9] evaluated the performance of OECD countries and identified the most critical science and technology factors in these countries by using the indicators of science and technology progress suggested by World Bank and exploiting Data Envelopment Analysis (DEA). They measured the efficiency of these countries. They ranked the countries and performed the sensitivity analyses of the factors by Norm-2 method in order to identify the most important factors. [10] examined growth rates (GDP) in developed and developing countries that is implement of inflation targeting strategy show how a change in the period before and after the crisis (2005-2011). They took into account the inflation performance of those countries for the same period. They compared growth and inflation performances of the countries by means of table and graphical form. [11] ranked stock exchange development level of forty countries including twenty developed and twenty developing countries by means of TOPSIS method during 2004-2008. They used depth, width and sophistication and considered these three criteria as indices of stock exchange development using TOPSIS method. They found average ranks of the countries based on depth, width and sophistication indices during the research time period.
3 The Great Recession of 2008-2009 The financial crisis that began in the US in the year 2007 became a full scale crisis in the year 2008 and 2009 which, in turn, affected each and every economy in some way or the other including the ones which were not directly related to the crisis. The year 2008 and 2009 is now known as the extreme recession time in the history of global economy, with major adverse consequences for banks and financial markets around the world. According to IMF report regarding GDP growth rate in the world, it had been growing around 5% since 2004. However, by the end of 2008, GDP growth declined to 3.1%, which was the lowest growth rate in the period 2003-2008. IMF also released 1.5% GDP growth rate in the year 2009. Most of all emerging countries have undergone through the volatile situation as a result of great recession, which made the shrinkage of growth rate and total investments, increase in inflation, unemployment and current account deficit.
4 Fragile Five Countries and Selected Macroeconomic Parameters As mentioned, Morgan Stanley declared Brazil, India, Indonesia, South Africa and Turkey as the "Fragile Five" countries in the year 2013 due to their vulnerable economies.

4 Emrah Önder, Nihat Taş and Ali Hepşen
The first country among them is Brazil. Brazil is recovering gradually from the growth slowdown that started in mid-2011, but the recovery remains uneven and inflation elevated. Output is estimated at potential with supply-side constraints, linked to tight labor market conditions and protracted weak investment since 2011, limiting near term growth. Excessive fine tuning of fiscal policy (including through public banks) has weakened the credibility of Brazil’s long-standing fiscal framework, while broader policy uncertainty has weighed on investment. On the other hand, global financial conditions and commodity prices may directly affect Brazilian GDP growth rate for the following years[12]. The tightening of global liquidity has increased external pressures and heightened the focus on India’s macroeconomic imbalances (high inflation, large current account and fiscal deficits) and structural weaknesses (particularly supply bottlenecks in infrastructure, power and mining). Growth is expected to slow to 5.4% in the year 2014, reflecting global developments and domestic supply constraints. The current account deficit is narrowing, driven by a significant improvement in exports, robust remittances flows, and a rapid diminution of gold imports. High and persistent inflation is a key macroeconomic challenge facing India. If external pressures from global financial market volatility resume, Indian rupee flexibility should be the first line of defense, complimented by use of reserves, increases in short-term interest rates, actions on the fiscal front, and further easing of constraints on capital inflows[13]. A slowdown in growth in major emerging market economies (EMEs) and decline in commodity prices, and more recently, a reversal in push factors tied to a prospective exit from extraordinarily easy global monetary conditions, has put pressure on Indonesia’s balance of payments and heightened its vulnerability to shocks. Domestic policy accommodation and rising energy subsidies have also given rise to increased external and fiscal imbalances. Recent policy tightening, fuel price hikes, and exchange rate flexibility have been firmly aimed at reducing these pressures. Growth is projected to slow to 5.36% in 2014. Inflation will likely peak at just below 10% at end2014, due mainly to the one-off effect of June 2013 fuel price increases and rupiah depreciation. The current account deficit is expected to exceed 3 percent of GDP in 2014 on weak commodity exports. Reserves have also come under pressure, partly due to Bank Indonesia’s heavy intervention in the foreign exchange market in mid-2013. Recent market volatility and reserve losses highlight the need to deal decisively with macroeconomic imbalances and contain financial stability risks [14]. South Africa has made impressive strides in economic development over the past two decades. But in recent years, lower growth has exacerbated high unemployment, inequality, and vulnerabilities. Although weak trading partner growth contributed, domestic factors were an important reason why South Africa’s growth has been below that of other emerging markets. Large current account and fiscal deficits, so far easily financed by global liquidity, have raised vulnerabilities[15]. Finally, Turkey has a stronger domestic demand, with the current account deficit is widening again from a high level, and inflation remains well above target (7.6%). Increasing national savings and improving competitiveness are central to addressing vulnerabilities. On the other hand, economic growth lost momentum in the course of 2013, as capital market tensions pushed interest rates up. Credit and private demand decelerated. Export growth fell, notably due to rapidly declining gold sales. Political tensions have dented confidence, provoking capital outflows and forcing the central bank to raise interest rates sharply in early 2014. Growth is projected to remain subdued

Economic Performance Evaluation of Fragile 5 Countries using TOPSIS Methods 5
through mid-2015, while the current account deficit will remain very high. Sustaining domestic and international confidence is crucial. Monetary, fiscal and financial policies should remain prudent. Improving fiscal transparency with timely general government accounts and comprehensive reporting on the activities of quasi-fiscal institutions is recommended. Disinflation is essential to preserve the bulk of recent competitiveness gains and to allow Turkey to benefit more from the projected recovery in global trade. Increasing the share of foreign direct investment inflows by improving business conditions in the formal sector would help reduce external vulnerability[16]. Our model comprises eleven variables that are received from [17] [gross domestic product (constant prices), current account balance, inflation (average consumer prices), unemployment rate, total investment, gross national savings, general government revenue, general government total expenditure, volume of export of goods and services, volume of imports of goods and services, and general government gross debt]to evaluate economic performance of these countries in order to identify the fragility of them in economic recession period and beyond.
5 Proposed Methodology In this part of the study, the Analytic Network Process, TOPSIS method and proposed converting scale method will be given.
5.1 Analytical Network Process ANP proposed by [18] is a general form of the Analytic Hierarchy Process (AHP). ANP is one of the multi criteria decision making techniques which consider the dependence among criteria and alternative. Therefore it offers several advantages over other MCDM techniques. There are mainly six steps in ANP. Step 1. Define decision problem Step 2. Determine dependencies among clusters (outer dependence) and elements of the clusters (inner dependence) Step 3. Pairwise comparisons of the elements and clusters Step 4. Determine the supermatrix and weighted supermatrix Step 5. Calculate the limit supermatrix. Step 6. Select the best alternative. The general form of the supermatrix can be described as follows:

6 Emrah Önder, Nihat Taş and Ali Hepşen
1 2
1
2
1 2
11 12 1 21 22 2 1 2
11 11 12 1
1 12
1
21
2 22 21 22 2
2
1
2
1 2
m
m
m
n n m m mn
m
n
m
n
m
m m
m m mmmn
C C Ce e e e e e e e e
e W W WC e
e
eW C e W W W
e
eC e
W W We
=
(1)
Where Cm denotes the mth cluster, emn denotes the nth element in the mth cluster and Wij is the principal eigenvector of the influence of the elements compared in jth cluster to the ith cluster. If the jth cluster has no influence on the ith cluster, then Wij=0 [19]. After forming the supermatrix, the weighted supermatrix is derived by transforming all column sums to unity exactly. This step is very similar to the concept of a Markov chain for ensuring the sum of these probabilities of all states is equal to 1[20]. Next, we raise the weighted supermatrix to limiting power such as lim k
kW
→∞to get the global priority vectors.
5.2 Using Technique for Order Preference by Similarity to Ideal Solution (TOPSIS) to rank the alternatives Technique for Order Preference by Similarity to Ideal Solution (TOPSIS) was first presented by [21] and [22], for solving multiple criteria decision making (MCDM) problems based upon the concept that the chosen alternative should have the shortest Euclidian distance from the positive ideal solution (PIS) and the farthest from the negative ideal solution (NIS). For instance, PIS maximizes the benefit and minimizes the cost, whereas the NIS maximizes the cost and minimizes the benefit. It assumes that each criterion require to be maximized or minimized. TOPSIS is a simple and useful technique for ranking a number of possible alternatives according to closeness to the ideal solution. Expanded developments of TOPSIS were done by [23] and [24]. This MCDM technique is widely used in many fields, including financial performance evaluation, supplier selection, tourism destination evaluation, location selection, company evaluation, selecting the most suitable machine, ranking the carrier alternatives [25]. One of the advantages of TOPSIS is that pair-wise comparisons are avoided. TOPSIS is conducted as follows [26]. Step 1.Establish a decision matrix for the ranking. TOPSIS uses all outcomes ( ijx ) in a decision matrix to develop a compromise rank. The viable alternatives of the decision process are A1, A2, ..., An. The structure of the decision matrix denoted by ( )ij n mX x ×= can be expressed as follows:

Economic Performance Evaluation of Fragile 5 Countries using TOPSIS Methods 7
1 2
11 12 1 1 1
21 22 2 2 2
1 2
1 2
j m
j m
j m
i i ij im i
n n nj nm n
m CriteriaC C C C
x x x x Ax x x x A
X n Alternativesx x x x A
x x x x A
=
(2)
ijx is the outcome of ith alternative with respect to jth criteria.
1 2( , , , , , )j mW w w w w= is the relative weight vector about the criteria, and jw
represents the weight of the jth attribute and 1
1mjj
w=
=∑ .
Step 2.Normalize the decision matrix using the following equation:
21
ijij n
ijk
wr
w=
=∑
i=1,2,3,…,n j=1,2,3,…,m (3)
Step 3.Weighted normalized decision matrix is calculated by multiplying the normalized decision matrix by its associated weights as:
ij j ijv w r= i=1,2,3,…,n j=1,2,3,…,m (4) Step 4.Identify the positive ideal solution (PIS) and negative ideal solution (NIS), respectively, as follows:
( ) ( ) * * * *1 2, ,..., max | , min |m ij b ij cii
PIS A v v v v j v j= = = ∈Ω ∈Ω (5)
( ) ( ) 1 2, ,..., min | , max |m ij b ij ci iNIS A v v v v j v j− − − −= = = ∈Ω ∈Ω
(6)
bΩ is associated with benefit criteria, and cΩ is associated with cost criteria. Step 5.Determine the Euclidean distance (separation measures) of each alternative from the ideal and negative-ideal solution as below respectively:
( )2* *
1
m
i ij jj
d v v=
= −∑ , i=1,2,3,…,n
(7)
( )2
1
m
i ij jj
d v v− −
=
= −∑ , i=1,2,3,…,n
(8)
Step 6. Calculate the relative closeness of the ith alternative to ideal solution using the following equation:

8 Emrah Önder, Nihat Taş and Ali Hepşen
*i
ii i
dRCd d
−
−=+
, i=1,2,3,…,n [ ]0,1iRC ∈ (9)
Step 7.By comparing RCi values, the ranking of alternatives are determined. The higher the closeness means the better the rank. Ranked the alternatives starting from the value that closest to 1 and in decreasing order.
5.3 Converting Simple Correlation Matrix into Saaty’s 1-9 Scale The method which is used to generate number of n score matrices from simple correlation matrix as an alternative to expert’s scores is briefly summarized below: For each of n criteria of 1 2, , ..., nx x x , Step 1. Simple correlation matrix (R) is calculated. Hypothesis testing for each simple correlation coefficient is performed at 10% significance level and the tested coefficient is replaced by zero when decision is “do not reject H0”. (H0: Coefficient of correlation is zero.)
ij n nR r
×= (10)
Step 2. A number named as scaling multiplier (SM) is defined:
Scaling Multiplier max min
nSM
r r= =
− (11)
Step 3. 1, 2,...,k n∀ = , Upper triangular score matrix kUN is obtained for kx :
( ) ( )1 1k ij n nUN n
− × −= (12)
and for , andi k j k i j≠ ≠ < 1, 2,..., ve 2,3,...,i n j n∀ = = ,
, if 0
1, if 0
ij ij
ij ijij
ij
RS RS
score nRS
RS
>
= =<
(13)
where ( ). sgn , if 0
1, if 0ij ij ij
ij ij
ij
SM AD AD ADRawScore RS
AD
+ ≠= =
=
(14)
and
ij ij ki kjAbsoluteDifference AD r r= = − (15) are defined as given.
( )sgn : Represents the sign (or signum) function that extracts the sign of a real number. For any real number c, it is defined as

Economic Performance Evaluation of Fragile 5 Countries using TOPSIS Methods 9
( ) , 0sgn
0, 0
cc
c cc
≠=
=
(16)
Step 4. Lower triangular score matrix ( ) ( )1 1k ji n n
LN l− × −
= (17)
is obtained for kx : 1
jiij
ln
= (18)
Step 5. Score matrix M is calculated and used instead of expert’s scores:
( ) ( ) ( ) ( )1 1 1 1n n n nM LN UN I − × − − × −
= + + (19)
5.4 Proposed Method In analyzing the data, Analytical Network Process (ANP) and Technique for Order Preference by Similarity to Ideal Solution (TOPSIS) methodologies are used for the outranking of F5 countries. Figure 1 shows the steps of the proposed method.
Figure1: Steps of proposed method
6 Combining ANP and TOPSIS to Determine the Rank of F5 Countries The proposed model of this paper uses an combined method of correlation analyze, Analytical Network Process (ANP) and Technique for Order Preference by Similarity to Ideal Solution (TOPSIS) for ranking the F5 countries depends on their macroeconomic performances. Figure 1 shows the steps of the proposed method. In this macroeconomic performance evaluation there are 11 criteria. An interview was performed with the economy expert in order to identify weight coefficients. Past experience and the back-

10 Emrah Önder, Nihat Taş and Ali Hepşen
ground of the economy expert are utilized in the determination of the criteria and 11 criteria to be used for F5 countries evaluation are established. The outputs of the ANP are determined as the input of TOPSIS method. Macroeconomic parameters have been grouped as “Gross domestic product, constant prices”, “Current account balance”, “Inflation, average consumer prices”, “Unemployment rate”, “Total investment”, “Gross national savings”, “General government revenue”, “General government total expenditure”, “Volume of export of goods and services”, “Volume of imports of goods and services” and “General government gross debt”. As a result, 11 criteria were used in evaluation and decision model is established accordingly. After forming the ANP diagram for the problem, the weights of the criteria to be used in evaluation process are calculated by using ANP method. In this phase, supermatrix is obtained by converting correlation matrix data into Saaty’s 1-9 scale. This transformation is possible, because all criteria data are quantitative. Also the economy expert is given the task of forming individual pairwise comparison matrix by using the Saaty’s 1-9 scale. Both output of the ANP method and expert judgments are used to calculate final weight values (arithmetic average of two outputs) of criteria.The limit supermatrix is derived by raising the supermatrix to powers.
Table 1: Simple Correlation Matrix X1 X2 X3 X4 X5 X6 X7 X8 X9 X10 X11 X1 1.0000 X2 0.9132 1.0000 X3 -0.1600 -0.0916 1.0000 X4 0.1966 0.1398 -0.2467 1.0000 X5 0.2247 0.1827 0.0328 0.5187 1.0000 X6 -0.4089 -0.4687 -0.1317 -0.0816 -0.1711 1.0000 X7 -0.7288 -0.8361 0.0805 -0.0253 -0.0410 0.0704 1.0000 X8 -0.6036 -0.6835 0.3496 -0.0861 0.0948 -0.0332 0.8730 1.0000 X9 0.0760 0.2236 0.2369 -0.0061 0.3185 -0.4490 0.0106 0.3350 1.0000 X100 0.0344 0.4388 0.1281 -0.0908 -0.0477 -0.2477 -0.4434 -0.3451 0.3808 1.0000 X11 0.5574 0.4761 -0.2573 0.6966 0.5033 -0.2393 -0.3446 -0.3732 0.0545 -0.0615 1.0000
Table 2: Modified Simple Correlation Matrix According to the Results of Hypothesis Testing
X1 X2 X3 X4 X5 X6 X7 X8 X9 X10 X11 X1 1.0000 X2 0.9132 1.0000 X3 0.0000 0.0000 1.0000 X4 0.0000 0.0000 -0.2467 1.0000 X5 0.2247 0.0000 0.0000 0.5187 1.0000 X6 -0.4089 -0.4687 0.0000 0.0000 0.0000 1.0000 X7 -0.7288 -0.8361 0.0000 0.0000 0.0000 0.0000 1.0000 X8 -0.6036 -0.6835 0.3496 0.0000 0.0000 0.0000 0.8730 1.0000 X9 0.0000 0.2236 0.2369 0.0000 0.3185 -0.4490 0.0000 0.3350 1.0000 X100 0.0000 0.4388 0.0000 0.0000 0.0000 -0.2477 -0.4434 -0.3451 0.3808 1.0000 X11 0.5574 0.4761 -0.2573 0.6966 0.5033 -0.2393 -0.3446 -0.3732 0.0000 0.0000 1.0000

Economic Performance Evaluation of Fragile 5 Countries using TOPSIS Methods 11
The modified simple correlation matrix given in Table 2 is obtained from the calculated correlation matrix (in Table 1) by testing each coefficient if the true value is zero at 10% significance level. Value is replaced by zero when H0 cannot be rejected.
Table 3: Supermatrix obtained from simple correlation matrices X1 X2 X3 X4 X5 X6 X7 X8 X9 X10 X11
X1 0.0000 0.2850 0.0507 0.0424 0.1052 0.1789 0.1849 0.1534 0.0359 0.0374 0.1694 X2 0.3173 0.0000 0.0507 0.0424 0.0410 0.2245 0.2454 0.1936 0.0885 0.2040 0.1228 X3 0.0227 0.0197 0.0000 0.1193 0.0410 0.0376 0.0246 0.0673 0.0936 0.0374 0.0521 X4 0.0227 0.0197 0.1540 0.0000 0.2594 0.0376 0.0246 0.0217 0.0359 0.0374 0.2693 X5 0.0496 0.0197 0.0507 0.2342 0.0000 0.0376 0.0246 0.0217 0.1321 0.0374 0.1371 X6 0.0821 0.0807 0.0507 0.0424 0.0410 0.0000 0.0246 0.0217 0.2268 0.0990 0.0486 X7 0.1984 0.2283 0.0507 0.0424 0.0410 0.0376 0.0000 0.3170 0.0359 0.2080 0.0731 X8 0.1397 0.1513 0.2330 0.0424 0.0410 0.0376 0.2746 0.0000 0.1421 0.1404 0.0821 X9 0.0227 0.0398 0.1474 0.0424 0.1428 0.2080 0.0246 0.0635 0.0000 0.1616 0.0228 X100 0.0227 0.0730 0.0507 0.0424 0.0410 0.1019 0.0969 0.0661 0.1731 0.0000 0.0228 X11 0.1220 0.0828 0.1615 0.3496 0.2467 0.0987 0.0753 0.0741 0.0359 0.0374 0.0000 Supermatrix must be a column stochastic matrix. The powers of the Supermatrix converge to Limit Matrix which is also stochastic with all columns equal. Limit Matrix is shown in Table 4.
Table 4: Limit Supermatrix X1 X2 X3 X4 X5 X6 X7 X8 X9 X10 X11
X1 0.1306 0.1306 0.1306 0.1306 0.1306 0.1306 0.1306 0.1306 0.1306 0.1306 0.1306 X2 0.1499 0.1499 0.1499 0.1499 0.1499 0.1499 0.1499 0.1499 0.1499 0.1499 0.1499 X3 0.0441 0.0441 0.0441 0.0441 0.0441 0.0441 0.0441 0.0441 0.0441 0.0441 0.0441 X4 0.0695 0.0695 0.0695 0.0695 0.0695 0.0695 0.0695 0.0695 0.0695 0.0695 0.0695 X5 0.0612 0.0612 0.0612 0.0612 0.0612 0.0612 0.0612 0.0612 0.0612 0.0612 0.0612 X6 0.0620 0.0620 0.0620 0.0620 0.0620 0.0620 0.0620 0.0620 0.0620 0.0620 0.0620 X7 0.1315 0.1315 0.1315 0.1315 0.1315 0.1315 0.1315 0.1315 0.1315 0.1315 0.1315 X8 0.1214 0.1214 0.1214 0.1214 0.1214 0.1214 0.1214 0.1214 0.1214 0.1214 0.1214 X9 0.0634 0.0634 0.0634 0.0634 0.0634 0.0634 0.0634 0.0634 0.0634 0.0634 0.0634 X100 0.0620 0.0620 0.0620 0.0620 0.0620 0.0620 0.0620 0.0620 0.0620 0.0620 0.0620 X11 0.1045 0.1045 0.1045 0.1045 0.1045 0.1045 0.1045 0.1045 0.1045 0.1045 0.1045
By analyzing the limit supermatrix, the macroeconomic parameter with maximum weight, namely “Gross national savings” is found. The results obtained from the calculations based on the pairwise comparison matrix of economy expert’s choice values are presented in Table 5. Consistency ratios of the expert’s pairwise comparison matrixes are calculated less than 0.1. So the weights are shown to be consistent and they are used in the economic performance evaluation.
12 Emrah Önder, Nihat Taş and Ali Hepşen
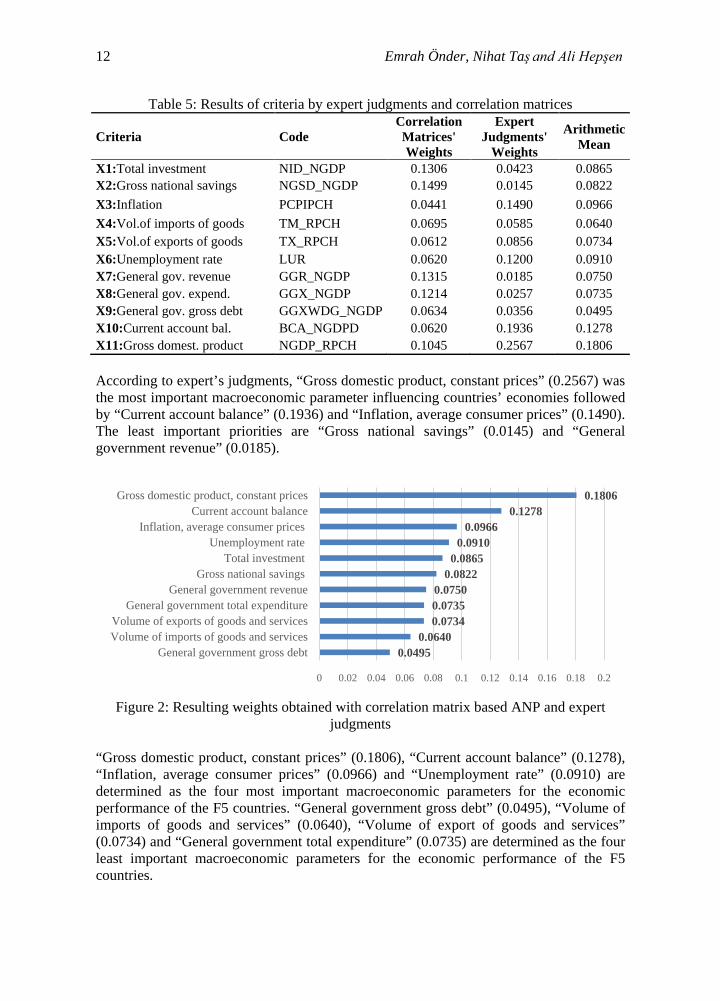
Table 5: Results of criteria by expert judgments and correlation matrices
Criteria Code Correlation Matrices' Weights
Expert Judgments'
Weights
Arithmetic Mean
X1:Total investment NID_NGDP 0.1306 0.0423 0.0865 X2:Gross national savings NGSD_NGDP 0.1499 0.0145 0.0822 X3:Inflation PCPIPCH 0.0441 0.1490 0.0966 X4:Vol.of imports of goods TM_RPCH 0.0695 0.0585 0.0640 X5:Vol.of exports of goods TX_RPCH 0.0612 0.0856 0.0734 X6:Unemployment rate LUR 0.0620 0.1200 0.0910 X7:General gov. revenue GGR_NGDP 0.1315 0.0185 0.0750 X8:General gov. expend. GGX_NGDP 0.1214 0.0257 0.0735 X9:General gov. gross debt GGXWDG_NGDP 0.0634 0.0356 0.0495 X10:Current account bal. BCA_NGDPD 0.0620 0.1936 0.1278 X11:Gross domest. product NGDP_RPCH 0.1045 0.2567 0.1806 According to expert’s judgments, “Gross domestic product, constant prices” (0.2567) was the most important macroeconomic parameter influencing countries’ economies followed by “Current account balance” (0.1936) and “Inflation, average consumer prices” (0.1490). The least important priorities are “Gross national savings” (0.0145) and “General government revenue” (0.0185).
Figure 2: Resulting weights obtained with correlation matrix based ANP and expert
judgments “Gross domestic product, constant prices” (0.1806), “Current account balance” (0.1278), “Inflation, average consumer prices” (0.0966) and “Unemployment rate” (0.0910) are determined as the four most important macroeconomic parameters for the economic performance of the F5 countries. “General government gross debt” (0.0495), “Volume of imports of goods and services” (0.0640), “Volume of export of goods and services” (0.0734) and “General government total expenditure” (0.0735) are determined as the four least important macroeconomic parameters for the economic performance of the F5 countries.
0.04950.0640
0.07340.07350.0750
0.08220.0865
0.09100.0966
0.12780.1806
0 0.02 0.04 0.06 0.08 0.1 0.12 0.14 0.16 0.18 0.2
General government gross debtVolume of imports of goods and servicesVolume of exports of goods and services
General government total expenditureGeneral government revenue
Gross national savings Total investment
Unemployment rate Inflation, average consumer prices
Current account balanceGross domestic product, constant prices

Economic Performance Evaluation of Fragile 5 Countries using TOPSIS Methods 13
Table 6: Input values of the TOPSIS analysis for the year 2013 Weights 0.087 0.082 0.097 0.064 0.073 0.091 0.075 0.074 0.050 0.128 0.181
Crit
eria
X1 X2 X3 X4 X5 X6 X7 X8 X9 X10 X11
Countries
Brazil 18.285 14.656 6.204 8.628 3.118 5.383 37.223 40.480 66.335 -3.628 2.284 India 34.733 32.743 9.478 -2.116 5.030 10.253 19.999 27.255 66.717 -1.990 4.351 Indonesia 33.642 30.373 6.413 -0.442 2.173 6.250 17.854 20.003 26.105 -3.269 5.781 South Africa 19.363 13.539 5.752 4.732 4.221 24.742 28.900 33.180 45.231 -5.824 1.891 Turkey 21.574 13.716 7.493 8.370 0.471 9.728 36.057 37.561 35.849 -7.858 4.290 Finally, TOPSIS method is applied to rank the F5 countries. The priority weightsof macroeconomic indicators, calculated by using pairwise comparison of expert, correlation matrix and ANP shown in Figure 2, can be used as input of TOPSIS (Table 6). The weighted normalized decision matrix can be seen from Table 7.
Table 7: Weighted performance evaluation for the year 2013
Crit
eria
X1 X2 X3 X4 X5 X6 X7 X8 X9 X10 X11 Countries
Brazil 0.027 0.024 0.037 0.042 0.030 0.017 0.043 0.041 0.029 -0.042 0.046 India 0.051 0.053 0.057 -0.010 0.049 0.032 0.023 0.028 0.029 -0.023 0.088 Indonesia 0.049 0.049 0.039 -0.002 0.021 0.019 0.021 0.020 0.011 -0.038 0.117 South Africa 0.028 0.022 0.035 0.023 0.041 0.076 0.033 0.034 0.020 -0.067 0.038 Turkey 0.032 0.022 0.045 0.041 0.005 0.030 0.042 0.038 0.016 -0.090 0.087
Min or Max + + - - + - + - - - + A*
0.051 0.053 0.035 -0.010 0.049 0.017 0.043 0.020 0.011 -0.090 0.117
A- 0.027 0.022 0.057 0.042 0.005 0.076 0.021 0.041 0.029 -0.023 0.038
By using TOPSIS method, the ranking of countries are calculated. Table 8 shows the evaluation results and final ranking of countries.
Table 8: TOPSIS results for the year 2013 Countries di
* di- RCi
Brazil 0.0127 0.0055 0.3970 India 0.0069 0.0109 0.5570 Indonesia 0.0042 0.0142 0.6490 South Africa 0.0133 0.0044 0.3661 Turkey 0.0074 0.0098 0.5353
Depends on the RCi values, the rankings of the alternatives for the years 2001-2013 are shown in Table 9.Columns for the years 2008 and 2009 show the economic performance of F5 countries for the economic recession period.

14 Emrah Önder, Nihat Taş and Ali Hepşen
Table 9: Performance rankings for the period 2001-2013 Countries
2001
2002
2003
2004
2005
2006
2007
2008 2009 2010
2011
2012
2013
Brazil 1 1 4 4 5 5 4 4 3 3 4 4 4 India 2 2 2 3 2 2 1 2 1 2 2 1 2 Indonesi
4 5 5 5 4 4 5 5 2 4 3 2 1 S.Africa 3 4 3 2 3 3 3 1 4 5 5 5 5 Turkey 5 3 1 1 1 1 2 3 5 1 1 3 3
Recession
P i d Although Turkey has the most fragile economy, Turkish economy recovers quickly after 2008-2009 recession periods (Table 9).
Figure 3: Economic performance changes of F5 countries during 2001-2013
7 Conclusion and Suggestions This research aims to apply integrated ANP and TOPSIS to evaluate economic performance of Fragile 5 Countries in order to identify the fragility of them in economic recession period and beyond. After a comprehensive literature review and economy expert’s guidance 11 macroeconomic parameters were determined for evaluating economic performance of F5 countries. The proposed method takes advantage of ANP to determine weights using dependencies. Supermatrix is obtained by converting correlation
0.00
0.05
0.10
0.15
0.20
0.25
0.30
0.35
Brazil India Indonesia South Africa Turkey

Economic Performance Evaluation of Fragile 5 Countries using TOPSIS Methods 15
matrix data into Saaty’s 1-9 scale. After ANP and correlation analysis most important ratios are found. “Gross domestic product, constant prices” (0.1806), “Current account balance” (0.1278), “Inflation, average consumer prices” (0.0966) and “Unemployment rate” (0.0910) are determined as the four most important macroeconomic parameters for the economic performance of the F5 countries. “General government gross debt” (0.0495), “Volume of imports of goods and services” (0.0640), “Volume of export of goods and services” (0.0734) and “General government total expenditure” (0.0735) are determined as the four least important macroeconomic parameters for the economic performance of the F5 countries. Finally, TOPSIS method is applied to rank the Fragile 5 countries. Our model shows that although Turkey has the most fragile economy during great recession period (2008-2009), but afterwards the performance of Turkish economy is relatively high. India has stable economy and generally it has a rank of 1 and 2. Indonesia is the best performing country in 2013 (Figure 3). Looking beyond, according to OECD and the IMF predictions, Indonesia is projected to be the fastest-growing economy within Fragile 5 countries, with an average annual growth rate of 6.0%, followed by India with the growth 5.9% in 2014-18. For the rest of three countries, annual average GDP is expected no more than 3%. The biggest impact would be on GDP growth and on external and fiscal sustainability, which could be undermined by weaker external demand, lower commodity prices, political uncertainty, and greater global risk aversion. The findings of this paper would help governments for taking necessary precautions and foreign investors for creating more effective investment strategies.
References [1] Morgan Stanley, FX Pulse Preparing for Volatility, Morgan Stanley Research
Paper, 2013. [2] M. Ashourian, Evaluating the Rank of Performance of Countries of the Middle East
and North Africa with MADM,Journal of Informatics and Mathematical Sciences, 4(3), (2012), 269-283.
[3] C.T. Hernández et al., Using the Analytic Network Process to Evaluate the Relation between Reverse Logistics and Corporate Performance in Brazilian Companies, Revista Investigación Operacional, 33(1), (2012), 13-22.
[4] M.P. Amiri et al., An analytical network process approach for evaluating banking performance based on balanced scorecard, Trends in Applied Sciences Research, 7(6), (2012), 456-466.
[5] Y.S. Chen, C.T. Lin and J.H. Lu, The analytic network process for the banking sector: An approach to evaluate the creditability of emerging industries, African Journal of Business Management, 5(4), (2010), 1343-1352.
[6] M.P. Niemira and T.L. Saaty, An Analytic Network Process model for financial-crisis forecasting, International Journal of Forecasting, 20(4), (2004), 573-587.
[7] M.A. Carree and A.R. Turik, The lag structure of the impact of business ownership on economic performance in OECD countries, Small Business Economics, 30(1), (2007), 101-110
[8] N. Emara, Quantitative Evaluation of the Struggle of Economic Performance: The Case of MENA Countries, Topics in Middle Eastern and African Economies, 16(2), (2014), 184-191.

16 Emrah Önder, Nihat Taş and Ali Hepşen
[9] M. Saljoughian et al., Performance Evaluation of OECD Countries by Data Envelopment analysis based on Science and Technology Factors, Journal of Applied Science and Engineering Management, 1(1), (2013), 24-35.
[10] S. Öztürk, A. Sözdemir and Ö. Ülger, The Effects of Inflation Targeting Strategy on the Growing Performance of Developed and Developing Countries: Evaluation of Pre and Post Stages of Global Financial Crisis, Procedia - Social and Behavioral Sciences, 109, (2014), 57-64.
[11] Ketabi et al., Ranking Stock Exchange Development of the Selected Countries Using TOPSIS Method, Journal of Basic and Applied Scientific Research, 2(8), (2012), 8311-8320.
[12] International Monetary Fund (IMF), IMF, Brazil Country Report, No: 13/312, 2013. [13] International Monetary Fund (IMF), IMF, India Country Report, No: 14/57, 2013. [14] International Monetary Fund (IMF), IMF, Indonesia Country Report, No: 13/362,
2013. [15] International Monetary Fund (IMF), IMF, South Africa Country Report, No: 13/303,
2013. [16] The Organization for Economic Co-operation and Development (OECD), Economic
Outlook, 2014. [17] International Monetary Fund (IMF), IMF World Economic Outlook Database,2014. [18] T.L. Saaty, Decision Making with Dependence and Feedback: The Analytic Network
Process, RWS Publications, Pittsburgh, 1996. [19] G.H. Tzeng and J.J. Huang, Multi Attribute Decision Making: Methods and
Applications, CRC Press, USA, 2011. [20] A. Ishizaka and P. Nemery, Multi-Criteria Decision Analysis: Methods and
Software, John Wiley & Sons Ltd, United Kingdom, 2013. [21] K. Yoon, Systems selection by multiple attributes decision making, PhD
Dissertation, Kansas State University, Manhattan, 1980. [22] C.L. Hwang and K. Yoon, Multiple attribute decision making: Method and
application, Spring-Verlag, New York, 1981. [23] S.J. Chen and C.L. Hwang, Fuzzy multiple attribute decision making: Methods and
applications, Springer- Verlag, Berlin, 1992. [24] Y.J. Lai, T.Y. Liu and C.L. Hwang, TOPSIS for MODM, European Journal of
Operational Research, 76(3), (1994), 486-500. [25] M. Behzadian et al., A state-of the-art survey of TOPSIS applications, Expert
Systems with Applications, 39(17), (2012) 13051–13069. [26] R.C. Tsaur, Decision risk analysis for an interval TOPSIS method, Applied
Mathematics and Computation, 218, (2011), 4295–4304.
Economic Performance Evaluation of Fragile 5 Countries using TOPSIS Methods 17
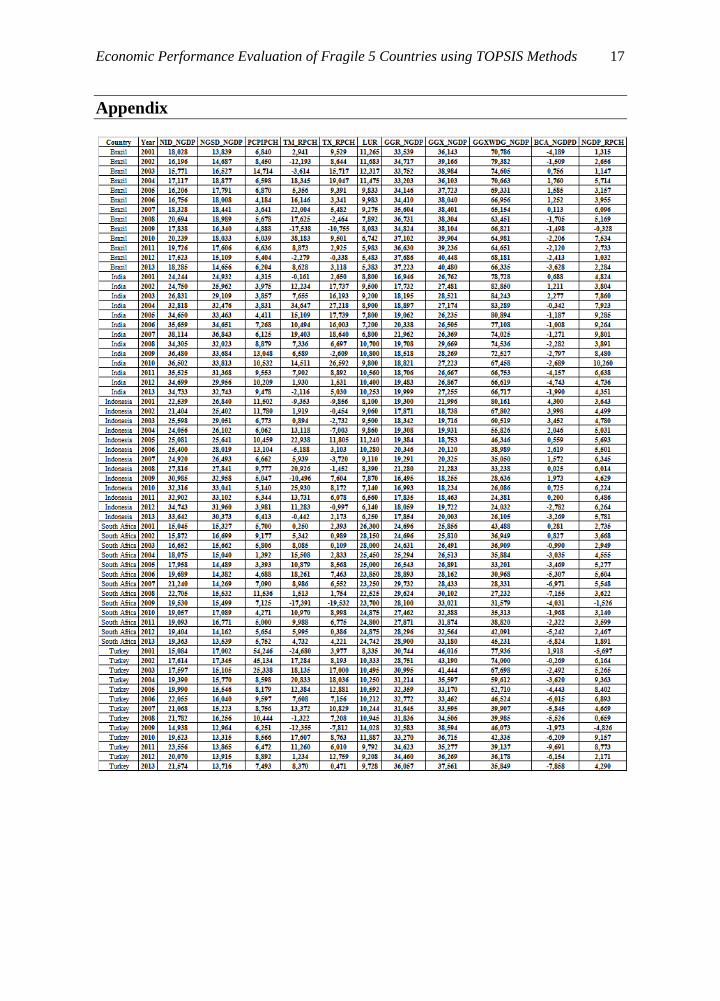
Appendix