ECONOMIC INEQUALITY IN NORTH AMERICA:...
13
Proceedings of ASBBS Volume 20 Number 1 ASBBS Annual Conference: Las Vegas 255 February 2013 ECONOMIC INEQUALITY IN NORTH AMERICA: WHO SHOULD BE PAYING ATTENTION? Beukes, Anna Northern Alberta Institute of Technology Varela, Max Northern Alberta Institute of Technology Abstract Recent awareness of how economic inequality has increased in the US and Canada, combined with the jobless recovery, poses challenges to business opportunities that have not existed since the decade of the 1930’s. These challenges are unlikely to disappear in the short run with the application of existing macroeconomic policy measures. While some inequality is integral for incentives and effectiveness of markets, too much of it can be destructive to growth. The financial crisis of 2008 confronts business with the question: should it merely wait for matters to improve or consider contributing to dealing with it – possibly by exploring new approaches to doing business. This paper will focus on the causes of growing inequality, and discuss to what degree policy responses have been successful. The paper looks at macroeconomic trends and policies leading up to the crisis of 2008. It will show that tax and monetary policies implemented by US governments during much of the 2000’s mostly exacerbated the inequality issue. The controversial bailouts of big financial institutions and the lack of economic opportunities for those in the lower income brackets compounded the problem. The paper finally raises discussion points about the implications of a depressed consumer demand for business, structural change in the US economy, what governments can do to alleviate inequality and if there is room for partnerships between business and government. 1. Introduction Rising inequality – both income inequality and opportunity inequality – is a growing reality internationally; not only in the USA, the UK and Canada but also in Russia and China. Nonetheless inequality does not get investigated, analysed or discussed in any way comparable to poverty and unemployment. The consensus has long been that a growing economy raises all boats, and that redistribution reduces the incentive to generate wealth. However, a recent special report by The Economist presents growing inequality as one of the biggest social, economic and political challenges of our time (Oct. 13, 2012). This echoed the seventh edition of the World Economic Forum’s Global Risks Report (2012). Concern is raised that today’s economic and social inequality may reverse the gains of globalization and hamper economic progress.
Transcript of ECONOMIC INEQUALITY IN NORTH AMERICA:...

Proceedings of ASBBS Volume 20 Number 1
ASBBS Annual Conference: Las Vegas 255 February 2013
ECONOMIC INEQUALITY IN NORTH AMERICA:
WHO SHOULD BE PAYING ATTENTION?
Beukes, Anna
Northern Alberta Institute of Technology
Varela, Max
Northern Alberta Institute of Technology
Abstract
Recent awareness of how economic inequality has increased in the US and Canada, combined
with the jobless recovery, poses challenges to business opportunities that have not existed since
the decade of the 1930’s. These challenges are unlikely to disappear in the short run with the
application of existing macroeconomic policy measures. While some inequality is integral for
incentives and effectiveness of markets, too much of it can be destructive to growth. The financial
crisis of 2008 confronts business with the question: should it merely wait for matters to improve
or consider contributing to dealing with it – possibly by exploring new approaches to doing
business.
This paper will focus on the causes of growing inequality, and discuss to what degree policy
responses have been successful. The paper looks at macroeconomic trends and policies leading
up to the crisis of 2008. It will show that tax and monetary policies implemented by US
governments during much of the 2000’s mostly exacerbated the inequality issue. The
controversial bailouts of big financial institutions and the lack of economic opportunities for
those in the lower income brackets compounded the problem.
The paper finally raises discussion points about the implications of a depressed consumer
demand for business, structural change in the US economy, what governments can do to alleviate
inequality and if there is room for partnerships between business and government.
1. Introduction
Rising inequality – both income inequality and opportunity inequality – is a growing reality
internationally; not only in the USA, the UK and Canada but also in Russia and China.
Nonetheless inequality does not get investigated, analysed or discussed in any way comparable to
poverty and unemployment. The consensus has long been that a growing economy raises all
boats, and that redistribution reduces the incentive to generate wealth. However, a recent special
report by The Economist presents growing inequality as one of the biggest social, economic and
political challenges of our time (Oct. 13, 2012). This echoed the seventh edition of the World
Economic Forum’s Global Risks Report (2012). Concern is raised that today’s economic and
social inequality may reverse the gains of globalization and hamper economic progress.

Proceedings of ASBBS Volume 20 Number 1
ASBBS Annual Conference: Las Vegas 256 February 2013
This paper investigates two of the points made by The Economist magazine: First, “although the
modern global economy is leading to wider gaps between the more and the less educated, a big
driver of today’s income distributions is government policy.” Second, a lot of today’s inequality
is inefficient reflecting market and government failures that reduce growth and future prosperity.
(The Economist, Oct 13, 2012:6).
In order to limit the scope, the focus of this paper will be the inequality situation in the USA - the
largest, most influential economy in the world and where the Occupy Wall Street movement
began. Analysis and discussion will also focus on the distribution of income and economic
opportunities rather than wealth, despite even greater inequality in wealth distribution. The
question that arises from current concern about income inequality in the USA is whether it now
needs more serious attention. Are there urgent enough reasons to attempt steps to mitigate the
inequality or will it dissipate of its own accord if the dynamics of markets are left to deal with it?
2. Does inequality matter?
A certain level of inequality has always been assumed to be both necessary and beneficial for
growth in market economies, because it encourages risk taking and compensates entrepreneurs
for innovations. The question now is if we have crossed the threshold where the cost of economic
inequality is more than the benefit?
The relationship between economic growth and income inequality is uncertain. Analysis by Berg
& Ostry suggests that “inequality can bring significant longer-run benefits for growth” (2011:3) –
the rising tide lifts all boats analogy. Evidence on whether economic growth can in turn lead to a
more equitable distribution of income over the long run is not conclusive. A UK roundtable (De
Lontelo, 2011) concluded that economic growth on its own is insufficient for reducing
inequalities. Furthermore, high levels of inequalities can impede economic growth by reducing
productivity, lengthening the period before recovery of growth resumes after downturns,
inhibiting the evolution of economic and political institutions of accountability and undermining
civic and social life that sustains effective collective decision-making.
In a recent and influential book Wilkinson and Pickett (2009) show that inequality has far-
reaching negative effects. Using data for 23 countries, the authors regressed health and social
indicators with levels of income inequality and found that more negative values on health and
social indicators are consistently correlated with higher income inequality. Their findings
indicate that the cost of inequality is the deterioration of social relations and mental health,
weaker educational performance, higher levels of violence, imprisonment and generally more
dysfunctional societies.
The Wilkinson and Pickett (2009) study was met with substantial criticism ranging from data
quality, selective choice of health and social problems and the exclusion of certain countries. The
authors responded to the criticism in detail, maintaining that they used official data from
reputable sources such as UNICEF, often used more than one source of data and acknowledging
that not all the social problems included in the study supported their hypothesis.
Various obvious economic reasons exist for paying attention to the distribution of rewards in a
free society. Stiglitz (2011) proposes that growing inequality is the flip side of shrinking
opportunity. Diminished opportunity leads to labour market inefficiency because human capital
is not used in the most productive way. In addition, many of the distortions that lead to inequality
undermine efficiency by diverting resources away from the real economy. Most important,
according to Stiglitz, is the lack of public investment in infrastructure, education and technology
that follows today’s declining public revenue.

Proceedings of ASBBS Volume 20 Number 1
ASBBS Annual Conference: Las Vegas 257 February 2013
3. What the data shows
There is no consensus among researchers regarding data or methods appropriate to evaluate
whether inequality has grown. In an extensive review article about distribution over the long run
Atkinson, Piketty and Saez showed that the pattern and trends of inequality in the USA exhibit
the same characteristics that can be found in many countries (JEL, 2011). Their key empirical
findings are that in the more than twenty countries studied, almost all experienced a dramatic
drop in top income shares in the first part of the twentieth century, mostly due to the two world
wars and the inter-war depression. Top income shares did not recover in the immediate decades
following the end of WWII. However, over the last thirty years, top income shares have
increased substantially in English speaking countries as well as in India and China.
Investigation by Piketty and Saez (2012) shows that in the US, the top decile income share
increased from less than 35% during the 1970s to about 50% in the last decade. This increase is
in large part due to an unprecedented surge in top wage and other incomes. More than 15% of
US national income shifted from the bottom 90% to the top 10% over the past 30 years.
Graph 1 clearly shows a broadly U-shaped trend in the share of income going to the rich in the
US over the course of the last 100 years, with a fairly drastic acceleration since the middle of the
1970’s. In 1979 members of the top one per cent got 9% of total income while in 2009 they got
20%. In effect, real income of the top 1% in the USA grew 7 times faster than the real income of
the bottom 99% between 1976 and 2007. These findings are corroborated by the research of
Bakija, Cole and Heim (2010).
Source: Piketty and Saez (2003), series updated to 2010. (Income is defined as market income
including capital gains but excludes all government transfers)
Graph 1: US top decile income share 1917 - 2010
Graph 2: US top 15% income share 1913-2010

Proceedings of ASBBS Volume 20 Number 1
ASBBS Annual Conference: Las Vegas 258 February 2013
When the trend for the top 10% is broken up into smaller subgroups, the topmost 1% experienced
the most dramatic growth. In effect, the top 1% alone absorbed almost 60% of aggregate US
income growth between 1976 and 2007 (Piketty and Saez, 2012). On the other hand, the average
hourly earnings of the average production worker effectively stagnated from 1979 to 2008, and
compared to 1972 earnings have actually decreased (Bureau of Labour Statistics, 2010).
One of the most talked about aspects of the changing US income distribution pattern is the
stagnation of income in the US middle class. Data shows median inflation-adjusted family
income peaked in 2000 at $64,232, and it has fallen by roughly 6 percent since then (David
Leonhart, NY Times Online, July 23, 2012).
The conclusions of Saez and Pikketty are not universally shared. Burkhauser, Larrimore, and
Simon (2012) suggest that when focusing on households rather than tax units, different results
emerge regarding growth in middle class incomes. They argue that households may be more
appropriate units because family structure has changed and the rise of cohabitation means that
adults sharing a household might be in fact separate tax units. With different assumptions about
household sharing units, Burkhauser, Larrimore, and Simon suggest that middle incomes have
grown more than the tax data would suggest. They argue that in effect, modest improvement in
post-tax-and-transfer disposable income occurred for middle-income groups over the period from
1979 to 2007. However, this debate continues.
4. Reasons for growing inequality
It is not straightforward to identify the reasons for the growing trend of inequality in the US. A
measure of agreement exists about the contributions of the following:
i. The government’s tax policies – moving away from using the tax system to lessen
income differentials.
ii. Shifts in the labour market that
a. diminished the availability of less-skilled blue collar jobs,
b. created a growing demand for higher skilled information, health and financial
management services, and
c. originate from changes in technology and globalization.
iii. The events that led to the collapse of the housing market and the bailout of large financial
institutions.
(i) The first reason for the growing inequality is the US government’s tax policy. The
proponents of supply-side thinking suggest that tax breaks for the wealthy will lead to economic
growth, and everyone will be better off as growth creates wealth that “trickles down” to all strata
of society. The Bush-era tax cuts of the 2000’s provide a test to these claims.
Hungerford (2012) shows that throughout the late-1940s and 1950s, the top marginal tax rate was
typically above 90%; while today it is 35%. Additionally, the top capital gains tax rate was 25%
in the 1950s and 1960s, 35% in the 1970s; today it is 15%. Piketty and Saez (2007) findings
about the trend in federal taxes over the last 50 years support Hungerford’s study. Individual
income taxes declined sharply from 2000 to 2004 following the tax cuts of the Bush
administration, falling from 10.3 percent of GDP in 2000 to 7.0 percent of GDP in 2004. The
corporate income tax has also shrunk dramatically: it was typically 3.5– 4.0 percent of GDP in the
1960s, but had fallen to 1.6 percent of GDP by 2004. The same is true for the estate tax; it
collected about 0.6 percent of GDP in the 1960s but declined to 0.25 percent of GDP in 2004.
The most telling finding regarding the effect of US taxes on income distribution that emerges
from the data is that the progressivity of the U.S. federal tax system at the top of the income

Proceedings of ASBBS Volume 20 Number 1
ASBBS Annual Conference: Las Vegas 259 February 2013
distribution has declined dramatically since the 1960s. For example, the top 0.01 percent of
earners paid over 70 percent of their income in federal taxes in 1960, while they paid only about
35 percent of their income in 2005. Table 1 shows that in 1960, average taxes collected were
fairly flat from the 20th to the 90th percentile, and then rose sharply. By 1980, average taxes
collected from the very top income groups, especially within the top percentile, had declined
sharply, while average tax rates collected from the 40th to the 95th percentiles had risen. From
1980 to 1990, tax rates at the top declined, while tax rates in the middle class stayed constant.
Average federal tax rates for the middle class have remained roughly constant over time.
In addition to promised broadly spread economic benefits, it was argued the large tax cuts would
not translate into a deficit, because growth would be so strong that the tax cuts would pay for
themselves. Even those who admitted that the tax cuts might not be fully self-financing still
made strong claims about faster economic growth offsetting much of the lost revenue. When
evaluating if tax cuts lead to real GDP growth, Hungerford (2012) shows that the growth rate of
real per capita GDP increased annually by 2.4% in the 1950s, compared to less than 1% in the
2000’s, after the Bush tax cuts. Hungerford’s report concludes there is no definite evidence to
support a clear relationship between the reduction of top marginal tax rates and economic growth.
Not only is the relationship between tax cuts and economic growth not clear, but most of the
gains from economic growth in recent decades have gone to the top of the income distribution
while the inflation adjusted wages of the working class have been relatively flat. While CEO pay
and corporate profits rose impressively over the past 20 years, the pay of production workers only
rose by 4%. (Anderson S, et. al., 2006). In addition, the tax cuts did not pay for themselves, as
the US deficit ballooned. While state and local tax revenues and spending have increased, federal
revenues have declined to the lowest level in decades. This resulted in annual deficits and
increasing long-term debt (NY Times, Nov 29, 2012).
Source: Piketty and Saez, 2007
(ii) The second group of factors flow from changes and shifts in the US labour market in
what can be called America’s de-industrialization.
The fact that employment in routine occupations has been disappearing is well documented by
recent job polarization literature (Acemoglu 1999, Autor et al. 2006, Goos and Manning 2007,
Autor and Dorn 2012). This literature finds that occupations focused on routine tasks tend to be
middle-waged. Thus, the disappearance of routine occupations in the past 30 years represents a
Table 1 Federal Tax Rates by Income Group from 1960 to 2004

Proceedings of ASBBS Volume 20 Number 1
ASBBS Annual Conference: Las Vegas 260 February 2013
‘polarization’ of employment because the middle of the wage distribution has been hollowed out.
Following each of the 1991, 2001, and 2009 recessions, per capita employment in routine
occupations fell and never recovered. This lack of recovery in routine employment accounts for
the jobless recoveries experienced in the aggregate. Prior to 1991, routine job losses in recessions
were accompanied by strong routine job recoveries (Thoma, 2012).
A recent report by McKinsey (Manyika et. al., 2012) also supports these changes in the labour
market. It shows that in the United States nearly all net new job creation over the past decade has
been in interaction jobs (those involving complex problem solving); nearly five million
interaction jobs were created between 2000 and 2009. At the same time more than three million
jobs in production (involving the conversion of physical material into finished products) and
transaction (those that can be scripted, routinized or automated) disappeared. Many of those
interaction jobs were added in “non-tradable” sectors, such as health care, government services,
and education that are not exposed to global competition. Going further back, data from the
Bureau of Labor Statistics show that between 1962 and 2008, employment in manufacturing jobs
decreased by 23%, while employment in construction more than doubled and in financial services
more than tripled.
In a study for the Business Council, Michael Mandel offered some salient facts about the long-
term job situation in the US economy (Mandel, 2010). He found that the abovementioned job
losses from the beginning of the 2008 recession followed a trend that already showed up in the
business cycle that began in 2001 and ended in 2007 (See graph below).
In addition, Mandel argues that expectations in recent times about where new jobs would come
from in the US did not materialize. When globalization and IT made it possible and profitable to
shift the production of manufactured goods to low-wage countries, it was expected that jobs
creation would come from designing new, advanced products and pursuing breakthrough
innovations that set up entire new industries in the US. While some of the latter did occur,
Mandel suggests that a wide range of potential breakthroughs have fallen short since 1998.
Examples are in: cancer treatment; cloning; fuel-cell vehicles; gene therapy; miniaturized
machines; and tissue engineering. While the Bureau of Labor Statistics projected a net gain of
almost 3 million jobs in leading-edge industries over the period 1998-2008, in reality these
industries lost 68,000 jobs in this period.
Graph 3: Total nonfarm and health care indexes of employment, seasonally adjusted, 1990-2010
Proceedings of ASBBS Volume 20 Number 1
ASBBS Annual Conference: Las Vegas 261 February 2013
The above traits in the current situation bring forward the notion that perhaps we are in the midst
of a major technological and economic shift. Globalization allowed companies to take advantage
of lower relative costs around the world, aided by low transportation costs and improvements in
telecommunication. This process left blue-collar workers particularly vulnerable to the crisis of
2008-2009. Automation and technological improvements further meant fewer factory jobs for
low skilled workers. Workers with strong cognitive, communication, and problem-solving
abilities that are required for the most sophisticated types of work have experienced low
unemployment and rising wages—the opposite of what has been happening to workers at lower
skill levels. The result is growing polarization of opportunities in the labour market.
The polarization of the labour market is evident in the fact that, even though the unemployment
rate remains stubbornly high, companies around the US find it difficult to fill some vacancies. In
2011, when the US unemployment rate exceeded 9 percent, a McKinsey Global Institute survey
of 2,000 US companies found that 30 percent had positions open for more than six months that
they could not filled. This suggests growing evidence of a mismatch between the jobs available
and the education workers pursue (Manyika, 2011). This same research also projects that the
United States may have 1.5 million too few workers with college or graduate degrees—and
nearly 6 million more workers lacking a high school diploma than employers will demand.
McKinsey’s report therefore suggests that major changes in the educational system are needed to
provide job-specific skills to students who will not go on to college. The opportunity thus exists
to amend non-university post-secondary education to focus community college and trade school
programs on the skills needed for specific jobs.
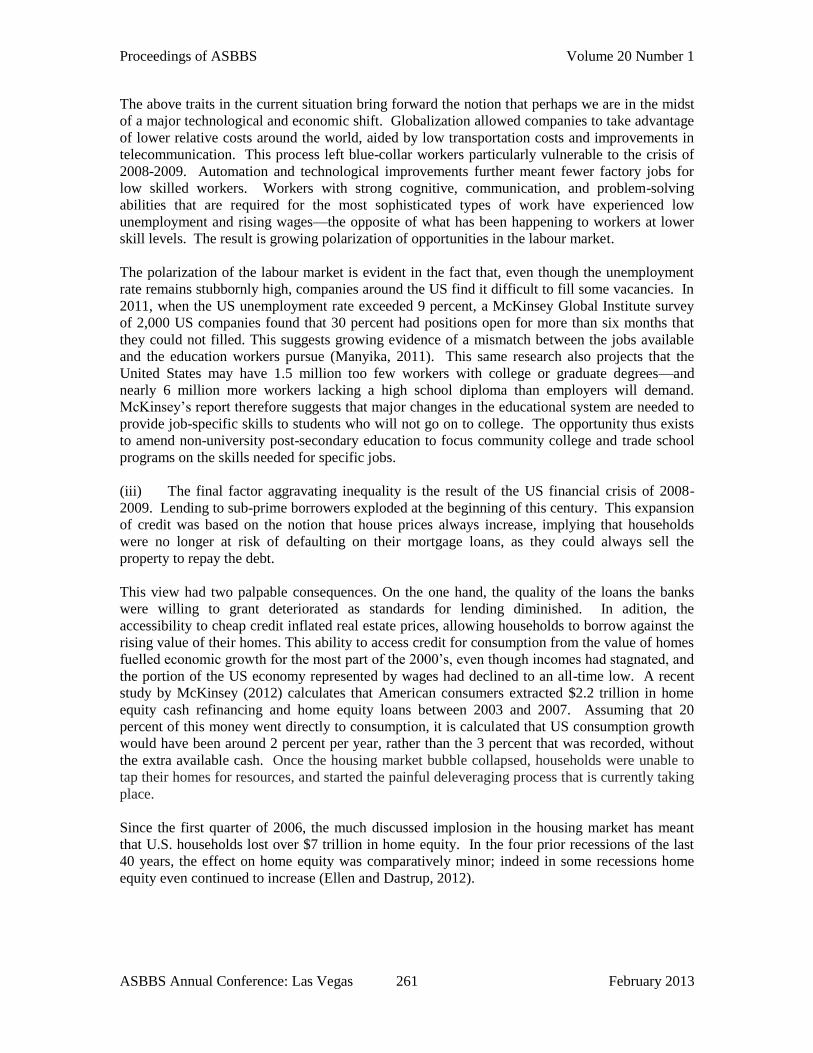
(iii) The final factor aggravating inequality is the result of the US financial crisis of 2008-
2009. Lending to sub-prime borrowers exploded at the beginning of this century. This expansion
of credit was based on the notion that house prices always increase, implying that households
were no longer at risk of defaulting on their mortgage loans, as they could always sell the
property to repay the debt.
This view had two palpable consequences. On the one hand, the quality of the loans the banks
were willing to grant deteriorated as standards for lending diminished. In adition, the
accessibility to cheap credit inflated real estate prices, allowing households to borrow against the
rising value of their homes. This ability to access credit for consumption from the value of homes
fuelled economic growth for the most part of the 2000’s, even though incomes had stagnated, and
the portion of the US economy represented by wages had declined to an all-time low. A recent
study by McKinsey (2012) calculates that American consumers extracted $2.2 trillion in home
equity cash refinancing and home equity loans between 2003 and 2007. Assuming that 20
percent of this money went directly to consumption, it is calculated that US consumption growth
would have been around 2 percent per year, rather than the 3 percent that was recorded, without
the extra available cash. Once the housing market bubble collapsed, households were unable to
tap their homes for resources, and started the painful deleveraging process that is currently taking
place.
Since the first quarter of 2006, the much discussed implosion in the housing market has meant
that U.S. households lost over $7 trillion in home equity. In the four prior recessions of the last
40 years, the effect on home equity was comparatively minor; indeed in some recessions home
equity even continued to increase (Ellen and Dastrup, 2012).
Proceedings of ASBBS Volume 20 Number 1
ASBBS Annual Conference: Las Vegas 262 February 2013
With the burst of the financial bubble, the US economy found it had nothing to fall back on. De-
industrialization had left the US vulnerable to a shock in the construction and real estate markets,
as well as the banks vulnerable to a fall in house prices. As home prices began to collapse,
financial institutions found themselves at the brink of bankruptcy as the market for asset-backed
securities froze. The government in the US decided to bail out the financial industry in an
attempt to avoid a 1930’s-style meltdown. This left households and governments in an
unsustainable position: overburdened with debt and with a rising jobless rate. This aggravated
the inequality issue, as rich bankers that had imperiled the economy were handed billions of
dollars whilst the rest of America suffered the direct impact of growing joblessness. The situation
of households was also aggravated by the fact that they had borrowed against the sinking value of
their homes. In fact, total credit market debt owned by households almost doubled between 2000
and 2008, reaching the staggering amount of 14 trillion dollars.
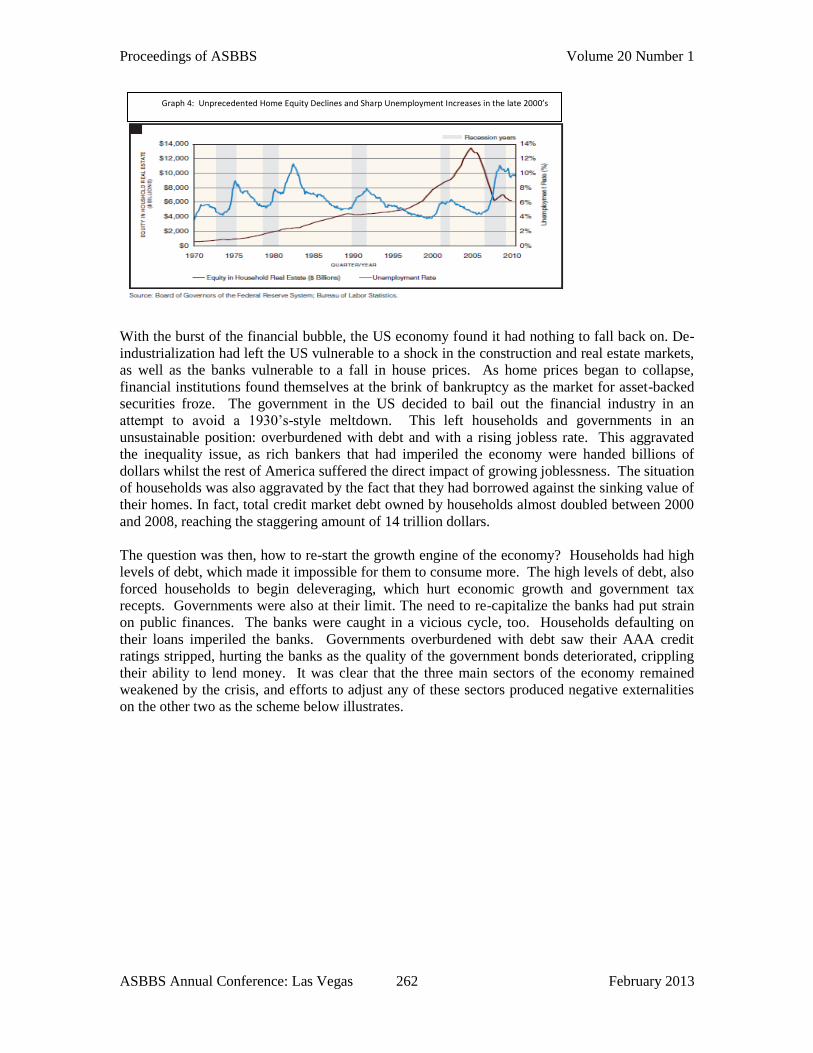
The question was then, how to re-start the growth engine of the economy? Households had high
levels of debt, which made it impossible for them to consume more. The high levels of debt, also
forced households to begin deleveraging, which hurt economic growth and government tax
recepts. Governments were also at their limit. The need to re-capitalize the banks had put strain
on public finances. The banks were caught in a vicious cycle, too. Households defaulting on
their loans imperiled the banks. Governments overburdened with debt saw their AAA credit
ratings stripped, hurting the banks as the quality of the government bonds deteriorated, crippling
their ability to lend money. It was clear that the three main sectors of the economy remained
weakened by the crisis, and efforts to adjust any of these sectors produced negative externalities
on the other two as the scheme below illustrates.
Graph 4: Unprecedented Home Equity Declines and Sharp Unemployment Increases in the late 2000’s

Proceedings of ASBBS Volume 20 Number 1
ASBBS Annual Conference: Las Vegas 263 February 2013
With the government, households and banks unable to respond effectively to the crisis, the
attention then turned to the Federal Reserve. In December 2008, the Federal Reserve interest rate
was lowered to near zero, and has remained at that level since then. In addition, the Fed started
an asset purchasing program that came to be known as the round one of quantitative easing, (QE)
increasing its balance sheet assets from 880 million dollars at the end of the third quarter of 2008
to over 2.3 trillion dollars in May 2009. Round two of quantitative easing took total assets to
over 2.8 trillion, and round three –announced in September 2012 – promised to buy 40 billion
dollars a month worth of mortgage backed securities with no pre-announced ending date.
The consequence of quantitative easing was that it supported stock and bond prices and directly
bolstered the net worth of the top 10% of Americans who own stocks, bonds and other financial
instruments. The ownership of stocks, bonds and pooled investment funds is such that the richest
10% of Americans own more than 77% while the bottom 50% own merely 1.1% of these
financial assets. Quantitative easing then could not but aggravate economic inequality in
America by inflating the price levels of financial assets of the richest Americans while doing little
to support economic growth or create jobs for the average person.
Perhaps, one of the most salient dimensions of the recent recession (2007 to 2009) has been its
exceptional nature in both the suddenness of the economic collapse and the long duration of its
employment consequences. Unemployment more than doubled, from 4.5 percent to 10.6 percent
in the 26 months from the onset of recession to the peak of unemployment in January 2010. By
contrast, it took 38 months for unemployment to double in the recession of the early 1980s. A
year after the peak joblessness of the recent recession, the unemployment rate had fallen only 1.5
percentage points below the peak, whereas by January 1984 it had fallen 2.6 percentage points
below the peak (Hout and Cumberworth, 2012:4). These results are substantiated by similar
research from the Fed (Aaronson, Mazumder, and Schechter, 2010)
The pace of economic growth has been unable to make up for the losses in the labour market
during the financial crisis. In addition, the labour force participation rate fell to a 30-year
minimum, indicating a rise in the “discouraged worker” phenomenon. The question has to be
asked: What happens to the unemployment rate if the current expansion lasts as long as any of the
three most recent expansions? Employment may not recover fully until 2020. The basic
questions for business that depends on US consumer demand thus become increasingly important:
Graph 5: The vicious cycle of the economic melt-down

Proceedings of ASBBS Volume 20 Number 1
ASBBS Annual Conference: Las Vegas 264 February 2013
Where would consumption come from? If the basic mechanism for putting purchasing power
into the hands of consumers, namely jobs, breaks down, mass-market business models could
become unsustainable.
5. Who should pay attention?
From the data and analysis provided above it is clear that serious grounds exist for concern about
the possible economic and political fallout from the rising gap between the very rich and the rest
of US society.
Effective responses require a reasonable degree of consensus about the causes and possible
solutions to the inequality issue. The recent presidential race in the US showed that such
consensus is nowhere in sight. Yet business (especially small to medium sized) has to perform its
task and pursue its objectives in this unsettled context, one in which the buying power of
consumers has taken a serious blow, public and private debt burdens are enormous and
unemployment is high and stubborn.
When the reasons for the current state of inequality were discussed above, the first thing that
became evident was the diminishing use of taxation to ameliorate the asymmetric remuneration
outcomes of participation in the economy. In some constructive way greater progressivity has to
be restored. The issue is how? Various proposals to acquire a larger contribution to income tax
revenue from the very wealthy have been proposed and merit exploration and discussion. This
includes:
Introducing several higher income tax brackets for millionaires: the proposed Fairness in
Taxation Act (HR 1124) would address this by adding five additional tax brackets for
incomes over $1 million;
Limiting overseas corporate tax havens abuse;
Introducing a tax on stock and derivatives transactions (like the EU is on its way to do);
Revamping the estate tax to include progressive rates on large estates;
Ending preferential treatment for income from dividends and capital gains.
Studies (Anderson et. al., 2011) have calculated conservatively that these changes to the tax
situation could contribute $400-500 billion annually to government revenue. Tax increases for
the rich have until recently been out of the question in the political arena in Washington. One
reason is the successful political lobbying of very wealthy corporations and individuals –
something that middle class consumer or smaller business groups cannot afford to match.
Another reason is what Suzanne Mettler (2011) called the “submerged state” in which Americans
are unaware of the social benefits provided by the state and strongly oppose them in principle
even though they are the recipients of those very benefits.
Although it can be a complicated topic, monetary policy and easing could be directed more
explicitly towards bringing greater room for new financing within smaller and more local
financial institutions. The question then is whether the business sector can benefit from
addressing inequality, and if there is room for partnerships between business and government.
Possible co-operation emerged in the aftermath of the crash in the US housing market. As
indicated, home ownership is a major form of household equity. This provides room for
initiatives that allow local governments to assist neighborhoods blighted by toxic home loans and
foreclosures through the use of eminent domain. A town would essentially “buy” seized home
loans from the banks at fair current market value and then arrange for private lenders to help
homeowners buy back their own homes, only at a current market price, thus rescuing the
homeowner from being underwater.

Proceedings of ASBBS Volume 20 Number 1
ASBBS Annual Conference: Las Vegas 265 February 2013
In the longer term, the financial crisis made it clear there is a need for better cooperation among
different levels of government. While the federal government was able to implement some anti-
cyclical fiscal and monetary policies, the effectiveness of these policies may have been watered
down as governments at the state and municipal level had to cut expenditures and raise taxes to
deal with slumping tax receipts, economic activity and housing valuations.
There is also a need to address the gap between the skills of American workers and job vacancies.
Policies that facilitate access to relevant post-secondary education will play a paramount role in
the future, as well as re-training programs for low-skill workers and the long-term unemployed.
It also appears that businesses, educational institutions and students would benefit much from
increasing communication among them to help students target the skills and jobs that industry
demands.
It is clear that business alone cannot be burdened with solving the current inequality reality. Tax
reforms, investment in education, new technologies and active labour market policies are an
integral part of an action plan aimed at reducing inequality. There is likely room for cooperation
and partnerships between government and business, especially at local level.
References
Aaronson, D, Mazumder, B and Schechter, S (2010). “What is behind the rise in long-term
unemployment?” Federal Reserve Bank of Chicago Economic Perspectives, Second Quarter
Acemoglu, D (1999). “Changes in unemployment and wage inequality: An alternative theory and
some evidence”, American Economic Review, 89(5), 1259–1278
Anderson S, et. al. (2006). “Executive Excess 2006”, 13th Annual CEO Compensation Survey,
New York: Institute for Policy Studies,
http://www.faireconomy.org/files/ExecutiveExcess2006.pdf
Anderson S, et. al. (2011). “America is not broke”, Special Report, Washington: Institute for
Policy Studies, http://www.ips-dc.org/reports/america_is_not_broke
Aron-Dine, A, Stone, C and Kogan R (2008). “How robust was the 2001-2007 economic
expansion?”, Center on Budget and Policy Priorities, http://www.cbpp.org/cms/?fa=view&id=575
Autor, D H and D Dorn (2012). “The growth of low skill service jobs and the polarization of the
U.S. labor market”, American Economic Review, forthcoming.
Autor, D H, L F Katz, and M S Kearney (2006). “The polarization of the U.S. labor market”,
American Economic Review: Papers & Proceedings, 96(2), 189–194.
Bargain, O et.al. (2011). “Tax policy and income inequality in the U.S.: 1978—2009: A
decomposition approach”, ECINEQ WP 2011 – 215, Society for the Study of Economic
Inequality, http://www.ecineq.org/
Belfield, C R, Levin, H M and Rosen R (2012). “The economic value of opportunity youth,”
Corporation for National and Community Service and the White House Council for Community
Solutions, http://knowledgecenter.completionbydesign.org/resource/488

Proceedings of ASBBS Volume 20 Number 1
ASBBS Annual Conference: Las Vegas 266 February 2013
Bureau of Labor Statistics (2010). “Average Hourly Earnings in 1982 dollars”, Current
Employment Statistics, Washington DC, http://www.bls.gov/ces/
Burkhauser, R V., Larrimore, J and Kosali, S (2012). "A Second Opinion on the Economic
Health of the American Middle Class and Why it Matters in Gauging the Impact of Government
Policy." National Tax Journal, 65 (March): 7-32
Cecchetti, Stephen and Hoffman, Boris (2012) “Breaking the vicious cycle: Restoring balanced
and sustainable growth in the global economy”
De Lintelo D (2011). “Inequality and Social Justice Roundtable Consultation”, Brighton, Institute
of Development Studies, http://www.ids.ac.uk/idspublication/inequality-and-social-justice-
roundtable-consultation
Ford, M (2012). “To the Jobless Economy”, Project Syndicate, http://www.project-
syndicate.org/commentary/to-the-jobless-economy
Goos, M and Manning, A (2007). “Lousy and lovely jobs: The rising polarization of work in
Britain”, Review of Economics and Statistics, 89(1), 118–133.
Ellen, I G and Dastrup, S (2012) . “Housing and the Great Recession”, Great Recession Brief,
Stanford Center on Poverty and Inequality, http://www.russellsage.org/research/reports/housing-
great-recession
Gupta, A (2012). “Response to Saez-Piketty on Inequality”, The Agenda, National Review,
http://www.nationalreview.com/agenda/296498/guest-post-arpit-gupta-response-saez-piketty-
inequality-arpit-gupta#
Hout, M.and Cumberworth, E. (2012). “The Labor Force and the Great Recession”, Stanford
Center on Poverty and Inequality, http://www.stanford.edu/group/recessiontrends/cgi-
bin/web/sites/all/themes/barron/pdf/LaborMarkets_fact_sheet.pdf
Hungerford, T L (2012). “Taxes and the Economy: An Economic Analysis of the Top Tax Rates
Since 1945 (Updated)”, CRS Report for Congress, Washington: Congressional Research Service,
http://graphics8.nytimes.com/news/business/0915taxesandeconomy.pdf
Mandel, M (2010). “The Jobs Crisis: The Long-term View”, Business Council Report,
http://innovationandgrowth.wordpress.com/
Manyika, J et. al. (2011) “An economy that works: Job creation and America's future”, Report,
McKinsey Global Institute,
http://www.mckinsey.com/insights/mgi/research/labor_markets/an_economy_that_works_for_us
_job_creation
Manyika, J et. al. (2012). “Help wanted: The future of work in advanced economies”,
Discussion Paper, McKinsey Global Institute,
http://www.mckinsey.com/insights/mgi/research/labor_markets/future_of_work_in_advanced_ec
onomies

Proceedings of ASBBS Volume 20 Number 1
ASBBS Annual Conference: Las Vegas 267 February 2013
Mettler, S (2011). The Submerged State, Chicago: University Of Chicago Press
Norton, M I and Ariely, D (2011). “ Building a better America - One Wealth quintile at a time”,
Perspectives on Psychological Science, 6(1), 9-12
Piketty, T and Saez, E (2003). “Income Inequality in the United States, 1913-1998”, Quarterly
Journal of Economics, 118(1), 1-39 (series updated to 2010 in March 2011)
Piketty, T and Saez, E (2007). “How Progressive is the U.S. Federal Tax System? A Historical
and International Perspective”, Journal of Economic Perspectives, 21(1), 3–24
Piketty, T and Saez E (2012). “Top Incomes and the Great Recession: Recent Evolutions and
Policy Implications”, Annual Research Conference, Washington: IMF,
http://www.imf.org/external/np/res/seminars/2012/arc/pdf/PS.pdf
Roxburgh, C, et. al. (2012). “ Debt and deleveraging: Uneven progress on the path to growth”,
McKinsey Global Institute,
http://www.mckinsey.com/insights/mgi/research/financial_markets/uneven_progress_on_the_pat
h_to_growth
Stiglitz, J (2011). “Of the 1%, by the 1%, for the 1%”, Vanity Fair Online, May,
http://www.vanityfair.com/society/features/2011/05/top-one-percent-201105
Thoma, M (2012). “Jobless Recoveries and the Disappearance of Routine Occupations”,
Economist`s View Online, Nov. 6,
http://economistsview.typepad.com/economistsview/2012/11/jobless-recoveries-and-the-
disappearance-of-routine-occupations.html
US Census Bureau (2012), “Annual Social and Economic Supplements 1968 to 2012”, Current
Population Survey, , Washington D.C.,
http://www.census.gov/newsroom/releases/pdf/20120912_ip_%20slides_noplotpoints.pdf
Wilkinson R and Pickett K (2010). The Spirit Level: Why more equal societies almost always do
better, London: Penguin Books