Economic Indicators of Agriculture's Future in Skagit County, Tasks 1 ...
115
Economic Indicators of Agriculture ! s Future in Skagit County Tasks 1 & 2 Final Report November 2010 Prepared by 99 W. 10 th Avenue, Suite 400 Eugene, OR 97401 Phone: 541-687-0051 www.econw.com Prepared for !"#" !"#$%$&" !"#$%& © ECONorthwest 2010
Transcript of Economic Indicators of Agriculture's Future in Skagit County, Tasks 1 ...

Economic Ind ica tors o f Agr icu l ture !s
Future in Skag i t County
Tasks 1 & 2 Final Report
N o v e m b e r 2 0 1 0
Prepared by
99 W. 10th Avenue, Suite 400
Eugene, OR 97401
Phone: 541-687-0051
www.econw.com
Prepared for
!"#"$
!"#$%$&"'!"#$%&'
© ECONorthwest 2010

ECONorthwest Economic Indicators of Agriculture in Skagit County i
ABOUT THIS REPORT
This report supports efforts by Skagit County and its partners, through the Envision Skagit 2060 project, to consider alternative future scenarios regarding the county’s natural resources, land uses, and economic development, and make decisions aimed at guiding the county toward the most desirable outcomes. Skagit County commissioned this report to describe economic variables that indicate the strengths, weaknesses, and long-run viability of agriculture and related industries in Skagit County, Washington. It addresses widely expressed concerns about the importance of protecting land and water resources so they are available for use by farmers to produce crop and animal products.
This report was prepared for Skagit County by Mark Buckley, Ernie Niemi, Sarah Reich, and Tom Souhlas of ECONorthwest, with assistance from Mike Leech and Danielle Pierce of ESAAdolfson. ECONorthwest is solely responsible for its content.
ECONorthwest specializes in the economic and financial analysis of public policy. Its staff of economists, policy analysts, and planners have analyzed the economics of resource-management, land-use development, and growth-management issues for municipalities, state and federal agencies, and private clients for more than 30 years.
For more information about this report, please contact:
Ernie Niemi ECONorthwest 99 W Tenth St., Suite 400 Eugene, Oregon 97401 541-687-0051 [email protected] www.econw.com
For more information about ECONorthwest’s work related to agriculture, natural resources, and regional economic development, visit the Natural Resources section of our website: ECONorthwest–Natural Resources.
This project has been funded wholly or in part by the United Stated Environmental Protection Agency under assistance agreement PO-00J08201-0 to Skagit County. The contents of this document do not necessarily reflect the views and policies of the environmental Protection Agency, nor does mention of trade names or commercial products constitute endorsement or recommendation for use.

ECONorthwest Economic Indicators of Agriculture in Skagit County ii
EXECUTIVE SUMMARY
This report is part of Skagit County’s effort, through the Envision Skagit 2060 project, to consider alternative futures regarding the county’s natural resources, land uses, and economic development. Skagit County commissioned this report to describe the strengths, weaknesses, and long-run viability of agricultural activities in the county. The report addresses widely expressed concerns about the importance of understanding opportunities for enhancing the sustainability of agriculture in the county. Our presentation describes the current status of agriculture’s role in the county’s economy and the outlook for sustaining agriculture in the future.
A. Current Status of Agriculture
Decades ago, the relationship between agriculture and Skagit County’s economy was straightforward. Agriculture dominated economic activities for most families, there were few alternative opportunities to earn a living, and farming was widely recognized as the best—perhaps only—use of the land that made economic sense. Today, the economy has evolved, and the relationship is more complex, with these core characteristics:
1. Agriculture and the Urban Economy Depend on One Another. Agriculture is an important element of the County’s economy, but is no longer the largest sector, and many farmers are able to sustain their farming activities because they earn income from other sources.
• Skagit County’s farmers produce a diverse array of economically-important goods and services, including food, animal feed, flowers, and seeds; value-added products, such as artisanal cheese; experiences, such as hay rides and wine tours; and ecosystem services, such as bird habitat and open space, for local and regional consumers and national and global markets.
• In 2007, Skagit County’s 1,215 farms (defined as operations where $1,000 or more of agricultural products were produced and sold during a year) covered about 109,000 acres of land. They consumed goods and services worth $198 million to produce crops and livestock products with a value of $290 million, for net earnings of $92 million, in 2010 dollars. The gross revenue of crops sold, per acre, was about $2,900 and the net earnings about $850.
• The agricultural sector accounted for about 3 percent of total earnings, and about 4 percent of total employment in Skagit County in 2007. The percentages are declining, as farm earnings, after adjustment for inflation, show little long-term growth over the past four decades.
• In most years, most farms have farm expenses greater than farm revenues. About two-thirds of all farms had negative net farm income in 2007.
• The county’s farmers have been successful in adapting so that their aggre gate net income, adjusted for inflation, has increased from about $20 million in 1969 to about $80 to $100 million today.
• National data suggest that most farm families depend on income from off-farm sources, e.g., a job in town, for most of their income. Small farms depend almost exclusively on off-farm sources for their income. Even the largest farms, with annual agricultural

ECONorthwest Economic Indicators of Agriculture in Skagit County iii
production worth more than $250,000 receive about one-quarter of their income from off-farm sources, on average. In 2007, about 60 percent of all principal farm operators had a primary occupation other than farming.
• Tax revenues generated by agricultural activities and property are greater than the cost of the services they demand from local government.
2. Rural/Agricultural Lifestyle Is Important. Agricultural activities occur across much of the county’s landscape, but many agricultural lands are used more to support a rural lifestyle for their landowners than for the industrial production of crops and livestock.
• About two-thirds of the county’s farms are smaller than 50 acres; about one-half have sales of crops and livestock of less than $2,500. Farms with annual sales less than $250,000 (considered small farms by the U.S. Department of Agriculture) constitute 88 percent of all farms and occupy 42 percent of the total acreage dedicated to farming in the county. Farms larger than 1,000 acres account for less than 2 percent of all farms.
• The U.S. Department of Agriculture categorizes 41 percent of the county’s farms, and 17 percent of total farm acreage, as “residential or lifestyle” farms, which means that they are owned by people whose primary occupation is something other than farming. People who are retired from farming own another 20 percent of farms, and 9 percent of farm acreage. The sum, 61 percent of the farms, and 26 percent of farm acreage, have owners who are oriented toward a rural lifestyle rather than commercial agricultural production.
• Most of the value associated with sales of agricultural products comes from about 13 percent of the farms, covering 62 percent of the land in farms in Skagit County.
• Although many of the farms in Skagit County produce small amounts of agricultural products, they serve an important role in maintaining the agricultural character of the County and produce quality-of-life amenities that are important to the County’s economy in their own right.
3. Agriculture is Adaptive. Farmers in Skagit County have often changed their farming practices and products to sustain their operations.
• Once noted for their production of peas, they shifted to producing other crops in response to contraction in the processing sector that reduced demand.
• Some farmers earn revenue from marketing their farming operations as places for people to visit and recreate. Data collected by U.S. Department of Agriculture show 11 farms earned $223,000 (2007 dollars) from agri-tourism and recreation. Data on expenditures generated by the region’s agricultural festivals and events suggest the total value associated with agri-tourism and recreation exceeds $67 million each year.

ECONorthwest Economic Indicators of Agriculture in Skagit County iv
4. There Is Strong Competition for the County’s Land and Water Resources. Competition for resources materializes through market and regulatory forces across two primary competing demands: residential and commercial development; and environmental restoration and protection. Agricultural use of resources can diminish the production of goods and services that satisfy competing demands. If farmers have the opportunity to satisfy certain competing demands, such as for the provision of ecosystem goods and services, new revenue opportunities can arise that maintain agricultural-related activities and lifestyles.
• The value the Washington Department of Revenue assigns to some lands in agricultural, timber, and open space classifications is, on average, about one-quarter the value they would obtain if the land were available for commercial or residential development. This differential is similar to that for the state as a whole, but smaller than those for Whatcom and Snohomish Counties.
• Agricultural activities contribute to reductions in the ecosystem’s ability to produce salmon, purify water in wetlands, and other valuable goods and services. The scarce data available suggest that sometimes the value of the reductions can exceed the net value of the agricultural output.
B. Sustaining Agriculture in the Future
Many residents express a desire to sustain agriculture in Skagit County, but there is no uniform definition of what this means. We address two major concerns. One is that the land and water allocated to agriculture should not fall below levels considered to constitute the critical mass for agriculture. The other is that finding ways to increase farmers’ income is necessary to ensure that they continue to use their lands for agriculture. We also identify indicators the county and others might use to monitor the sustainability of agriculture in the future.
1. Critical Mass Likely Will Play a Limited Role in the Long Run. A common belief is that sustaining agriculture can be accomplished by maintaining the amount of land and water currently reserved for agricultural use. This view assumes that, if the supplies of land and water are adequate—above a critical mass—the agriculture sector will be sustainable. The economic reasoning behind this hypothesis is that there are efficiencies, called economies of scale or scope, associated with the amount of land mass, and these dissipate quickly as the land mass drops below the critical-mass threshold.
Several researchers have tested the hypothesis across the U.S. Those with results supporting the hypothesis tend to have flaws that undermine the reliability of their results. The few studies that have been more successful in avoiding these flaws find, at most, incomplete evidence supporting the hypothesis. Overall, the evidence suggests that the notion of an agricultural critical land mass:
• Might exist for a point in time, a particular crop, or a specific set of producers, but it likely will dissipate over time as agricultural activities shift in response to competitive and other pressures.
• Likely does not exist for the entire agricultural sector in an area over a long period of time. Too many factors—especially the prices of inputs and farm products—determining the agricultural activities in the area change too frequently (due largely to external forces) for a critical mass to be stable over a long period of time, across all farmers, crops, and farming methods.
ECONorthwest Economic Indicators of Agriculture in Skagit County v
Obviously in most cases, all else equal, more land in agricultural production within Skagit County does increase the overall financial viability of the agricultural sector. However, setting land and water aside for farming cannot guarantee that farming in Skagit County will yield enough income so that landowners will continue to use their land for farming. Rather, the sustainability of agriculture in the county depends primarily on the extent to which farming can compete successfully against other demands for land and water, producing goods and services worth more than those that would be produced if the resources were used for other purposes. That is, the demand for agricultural products, and the income farmers can earn from farming activities, determine the amount of land and water used for farming, not the other way around. Most, if not all, farmers want to see the land stay in farming but, at some point, if the value of the land for other purposes becomes sufficiently greater than the value of using it for agriculture, the land will be converted to non-farm use. Thus, enhancing the future sustainability of agriculture in the county likely will depend more on finding ways to increase the value of the goods and services produced by farmers than on trying to set land and water aside for agriculture without regard for the underlying economic forces.
This conclusion applies in the long run and across the overall landscape, but it may not apply in the short run or for specific landowners or crops. The production of seed crops, for example, is made possible because farmers in the county have access to enough land dispersed widely enough to meet volume and quality requirements. In the future, however, competitive pressures may induce farmers to shift to other products, as has occurred in the past. Some farmers likely will be successful in adapting so that they continue to experience growth in net farm incomes from the sale of crops and livestock products. Others, however, likely will have a more difficult time of it, and experience declining net farm incomes.
2. Opportunities Will Emerge for Farmers to Increase Their Income. It is reasonable to assume that farmers will continue to respond to market forces and find opportunities for new crops and farming practices that have the potential to maximize their incomes. Additional opportunities likely will emerge in the future for some farmers to earn income from conservation activities. These opportunities currently are limited, but public officials and economists are considering many possibilities. For example, municipal or commercial entities facing large costs to reduce their emissions of pollutants to the county’s surface waters may find it would be less costly to pay farmers to plant trees and grass in buffer strips along streams. Wildlife watchers may be willing to pay farmers to maintain habitat for birds and other wildlife. Urban neighborhoods may be willing to pay the owners of adjacent farmlands to keep their land in open space rather than allow it to become paved over.
Further opportunities might materialize for some farmers to produce more than just the crops or livestock products derived from conventional farm operations. Other opportunities include value-added processing, such as producing artisanal cheeses from milk or jams from berries, and farm-related tourism. The increasing demand for local and environmentally-sustainable agricultural products can offer opportunities for value-added and locally-new crops as well.
3. Several Variables Can Provide Indicators of Agriculture’s Sustainability. In Table 11 of the report, we present a list of indicators of agricultural sustainability that we recommend Skagit County consider incorporating into its current and future efforts to monitor the sustainability of agriculture in the county and support decisions about reinforcing agriculture’s sustainability. The indicators fall into three categories:

ECONorthwest Economic Indicators of Agriculture in Skagit County vi
• The strength of agriculture-related demands for land and other natural resources. Of primary concern are indicators of the ability of farm families to earn on- and off-farm income.
• The strength of competing demands for these resources. Farmers should expect mounting pressures to convert lands to residential and commercial use and to help correct environmental problems.
• Policies to enhance the sustainability of agriculture. The most important focus should be to help farmers realize additional net income through the provision of conservation services, and the development of value-added processing of crops and livestock products.
We have compiled the historical data for the indicators from national sources, such as the U.S. Department of Agriculture’s Census of Agriculture,1 state sources, such as income reports, and local sources, such as land in agricultural-use zones. In general, the data suggest no single variable, or small set of variables, determines the sustainability of agriculture. Moreover, agriculture is not subject to abrupt thresholds, on one side of which it is sustainable and on the other side it is not. Instead, many factors influence the sustainability of agriculture in the county, and their influence shifts gradually over time and space. The current, precise pattern of agriculture almost certainly will not be sustained for long, but will shift as farmers adapt to changing market conditions and other factors. If enough farmers can earn high-enough incomes from farming to resist pressures to convert their lands to other uses, then farming has a long future ahead of it. We recommend that the county, with its Agricultural Technical Committee, develop a viable plan for providing decision-makers and the public with annual updates of the data.
1 Researchers at Washington State University and elsewhere have recognized that the Census data may not precisely represent all agricultural activity taking place in the state. After reviewing these concerns, and considering analogous concerns about other data sources, however, we conclude that the U.S. Agricultural Census data are suitable for this report. Nonetheless, we encourage readers to realize that the Census data are not perfect, but they provide a reasonably accurate portrait of agricultural activities in the county.
ECONorthwest Economic Indicators of Agriculture in Skagit County vii
CONTENTS
About this Report ........................................................................................................................................i
Executive Summary ...................................................................................................................................ii
Contents ....................................................................................................................................................vii
I. Assessing the Economic Role of Agriculture: Analytical Framework and Literature Review.....1
A. Economic Importance......................................................................................................................................1
B. Sustainability ..................................................................................................................................................11
C. Sustainability Indicators................................................................................................................................15
II. Agriculture and Skagit County!s Economy .....................................................................................17
A. Agriculture in Skagit County.........................................................................................................................17
B. Economic Benefits and Costs of Agriculture in Skagit County ................................................................29
C. Economic Impacts (Jobs and Incomes) Associated with Agriculture in Skagit County.........................43
D. Financial Flows Associated with Agriculture in Skagit County ................................................................48
E. Uncertainty and Risk Associated with Agriculture in Skagit County .......................................................49
F. Distribution of Economic Consequences of Agriculture in Skagit County..............................................50
III. Characteristics of Competing Demands for Land and Other Resources ....................................51
A. Demands from Residential and Commercial Development .......................................................................51
B. Demands from Environmental Restoration and Protection.......................................................................53
IV. Economic Indicators of Agriculture!s Sustainability in Skagit County ........................................59
A. Indicators of Agriculture!s Strength.............................................................................................................59
B. Competing Demands .....................................................................................................................................61
C. Policy Options ................................................................................................................................................62
D. Recommendations .........................................................................................................................................62
Appendix I: Historical Data ................................................................................................................I-1
Appendix II: Spatial Data and Detailed Tables .................................................................................II-1
Appendix III: Opportunities and Constraints in Ecosystem-Service Markets ..............................III-1
ECONorthwest Economic Indicators of Agriculture in Skagit County 1
I. ASSESSING THE ECONOMIC ROLE OF AGRICULTURE:
ANALYTICAL FRAMEWORK AND LITERATURE REVIEW
This section presents a framework for assessing the economic strengths, weaknesses, and sustainability of agriculture in Skagit County. The framework provides the conceptual and empirical basis for understanding the current and future status of agriculture in the county’s economy, developing indicators of its outlook, and evaluating potential actions the county might take to enhance its long-run sustainability. The framework has three core components:
A. Economic importance of agriculture to Skagit County
This part of the framework provides an approach for identifying agriculture’s different contributions—positive and negative—to the economy, as well as the basis for evaluating the economic rationale for taking actions, such as protecting land and water for use by farmers, to strengthen the agricultural sector.
B. Sustainability of agriculture in Skagit County
This part of the framework describes different perspectives of sustainability and their implications for future actions the county might take to strengthen agriculture and its positive contributions to the economy without adversely affecting other aspects of the economy
C. Indicators of sustainability for agriculture in Skagit County
This part of the framework explains the desired characteristics of indicators for monitoring the strengths and weaknesses of agriculture in the county and for identifying appropriate interventions to enhance its sustainability.
A. Economic Importance
Decades ago, the relationship between agriculture and Skagit County’s economy was straightforward. Agriculture dominated economic activities for most families, there were few alternative opportunities to earn a living, and using land to produce crops or livestock was widely recognized as the best—perhaps only—use of the land that made economic sense. Today, the relationship is more complex. The economy has evolved so that, although agriculture remains a vital component of the economy, most commercial/industrial growth occurs in sectors with little or no direct connection to industrial agricultural production. Economic strength increasingly comes from the county’s ability to attract productive people, and its attractiveness depends largely on the county’s amenities, such as its open spaces, outdoor recreational opportunities, and healthy environment. The county’s residents have expressed a shared preference to sustain agricultural activity across the landscape, but there are powerful competing demands for the land, coming from both development and conservation interests. Prices for energy and other production inputs, the evolution of world markets, and changes in climate create both challenges and opportunities not imaginable just a few years ago. Within this setting, actions by
ECONorthwest Economic Indicators of Agriculture in Skagit County 2
the county to maintain or increase the agricultural sector will have multiple economic consequences.
To help understand and sort through these consequences, we employ an analytical framework that has these core elements:
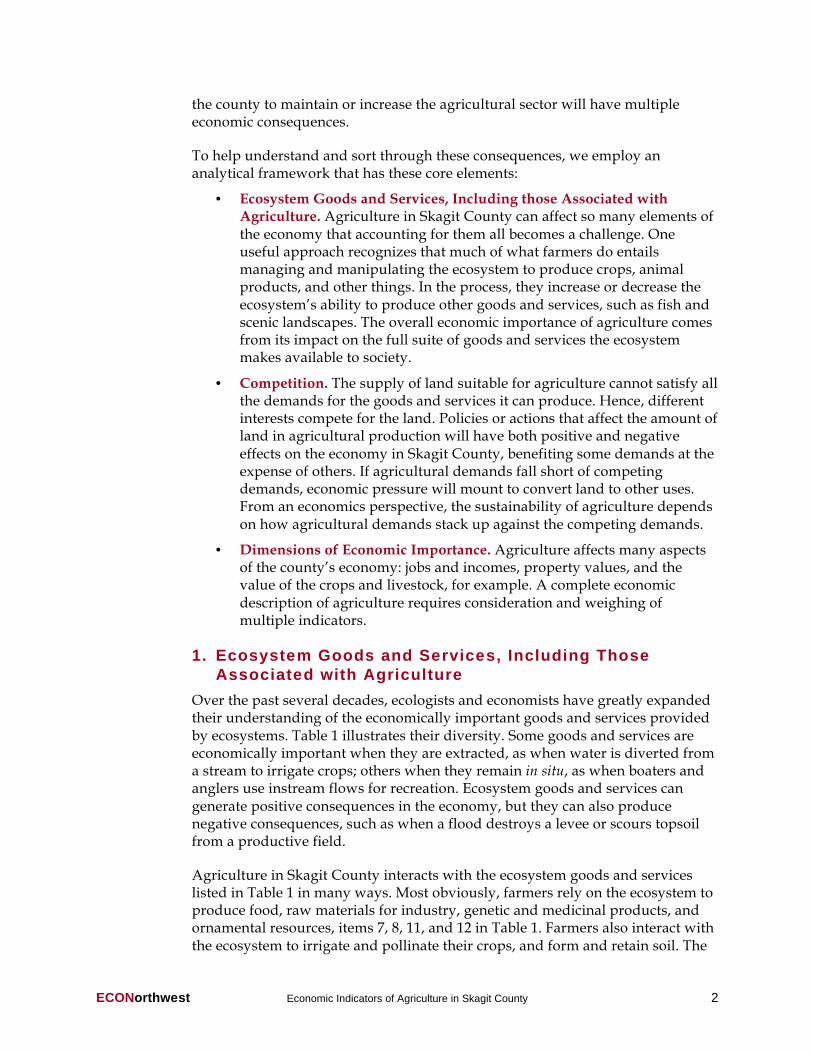
• Ecosystem Goods and Services, Including those Associated with Agriculture. Agriculture in Skagit County can affect so many elements of the economy that accounting for them all becomes a challenge. One useful approach recognizes that much of what farmers do entails managing and manipulating the ecosystem to produce crops, animal products, and other things. In the process, they increase or decrease the ecosystem’s ability to produce other goods and services, such as fish and scenic landscapes. The overall economic importance of agriculture comes from its impact on the full suite of goods and services the ecosystem makes available to society.
• Competition. The supply of land suitable for agriculture cannot satisfy all the demands for the goods and services it can produce. Hence, different interests compete for the land. Policies or actions that affect the amount of land in agricultural production will have both positive and negative effects on the economy in Skagit County, benefiting some demands at the expense of others. If agricultural demands fall short of competing demands, economic pressure will mount to convert land to other uses. From an economics perspective, the sustainability of agriculture depends on how agricultural demands stack up against the competing demands.
• Dimensions of Economic Importance. Agriculture affects many aspects of the county’s economy: jobs and incomes, property values, and the value of the crops and livestock, for example. A complete economic description of agriculture requires consideration and weighing of multiple indicators.
1. Ecosystem Goods and Services, Including Those
Associated with Agriculture
Over the past several decades, ecologists and economists have greatly expanded their understanding of the economically important goods and services provided by ecosystems. Table 1 illustrates their diversity. Some goods and services are economically important when they are extracted, as when water is diverted from a stream to irrigate crops; others when they remain in situ, as when boaters and anglers use instream flows for recreation. Ecosystem goods and services can generate positive consequences in the economy, but they can also produce negative consequences, such as when a flood destroys a levee or scours topsoil from a productive field.
Agriculture in Skagit County interacts with the ecosystem goods and services listed in Table 1 in many ways. Most obviously, farmers rely on the ecosystem to produce food, raw materials for industry, genetic and medicinal products, and ornamental resources, items 7, 8, 11, and 12 in Table 1. Farmers also interact with the ecosystem to irrigate and pollinate their crops, and form and retain soil. The

ECONorthwest Economic Indicators of Agriculture in Skagit County 3
ecosystem introduces pests and diseases, but also provides opportunities for farmers to control pests and diseases. The ecosystem supports farmers in providing aesthetic resources and recreational resources for residents and visitors of Skagit County. Some farmers also foster biodiversity on their land by providing habitat for fish and wildlife, and provide opportunities for scientific and educational study of ecological processes on their land. The ecosystem helps farmers assimilate waste and pollution, and provides a sense of place, to which farmers and residents of Skagit County attach spiritual and cultural value. Agriculture can diminish some ecosystem goods and services, as well: some farming activities can diminish the ecosystem’s ability to regulate nutrients and pollution, provide fish and wildlife habitat, regulate floods, form and retain soil, and pollinate wild plants.
2. Competition for Natural Resources
In most times and places there are insufficient resources to satisfy all the demands for all of the goods and services in Table 1. Hence, there is competition for the resources and, when they are used to produce one set of goods and services, the demands for others go unmet. In some situations, altering resource-use activities to expand the set of goods and services being produced can diminish the competition. Because they both reflect and shape the economic
Table 1. Summary of Goods and Services Provided by Skagit County!s
Ecosystems
Examples of Goods and Services Produced
1 Production and
regulation of water
7 Production of food for
humans
12 Production of
ornamental resources
2 Formation &
retention of soil
8 Production of raw
materials for industry
13 Production of aesthetic
resources
3 Regulation of
atmosphere & climate
9 Pollination of wild
plants and agricultural crops
14 Production of
recreational resources
4 Regulation of
floods and other disturbances
10 Biological control of pests & diseases
15 Production of spiritual,
historic, & cultural resources
5 Regulation of
nutrients and pollution
11 Production of genetic & medicinal resources
16 Production of scientific & educational resources
6 Provision of fish and wildlife habitat
Source: Adapted by ECONorthwest from De Groot, R., M. Wilson, and R. Boumans. 2002. “A Typology for
the Classification, Description and Valuation of Ecosystem Functions, Goods and Services.”
Ecological Economics 41: 393-408; Kusler, J. 2003. Assessing Functions and Values. Institute for
Wetland Science and Public Policy and the Association of Wetland Managers, Inc.; and Postel, S.
and S. Carpenter. 1997. “Freshwater Ecosystem Services.” in Nature's Services: Societal
Dependence on Natural Ecosystems. Edited by G.C. Daily. Washington, D.C.: Island Press, pgs.
195-214.
ECONorthwest Economic Indicators of Agriculture in Skagit County 4
importance of different goods and services, the characteristics of this competition provide useful insights into the economic consequences of future changes to agriculture in Skagit County.
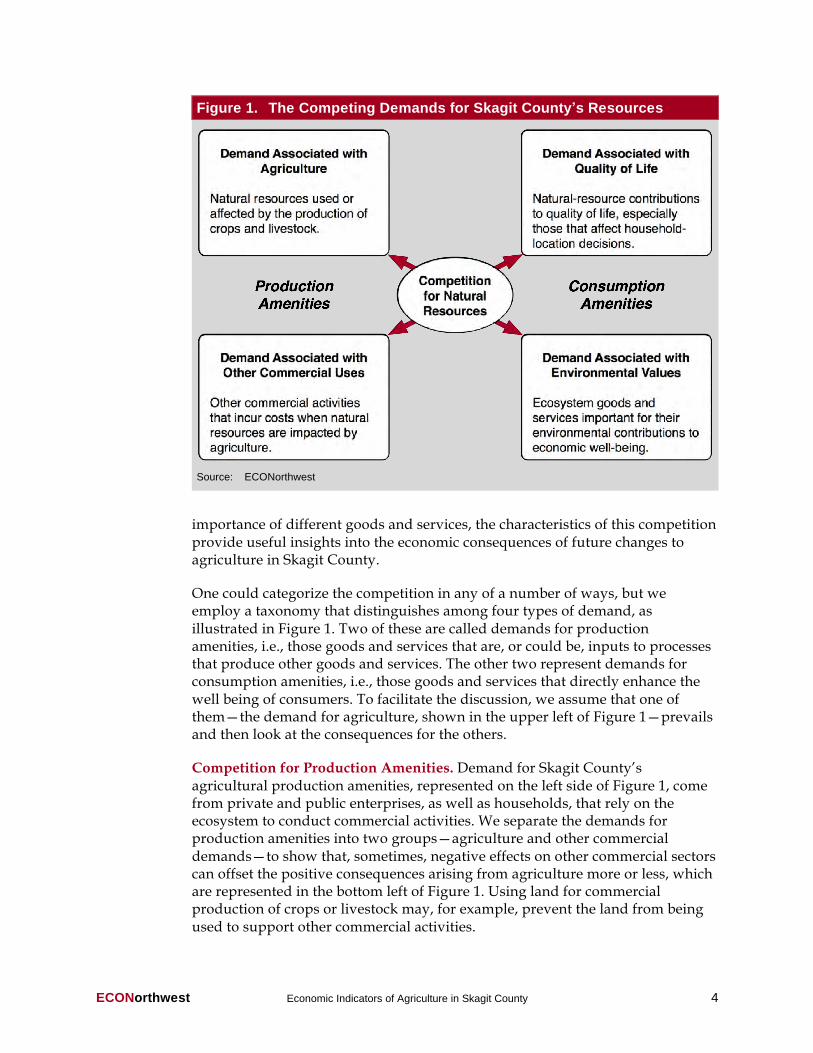
One could categorize the competition in any of a number of ways, but we employ a taxonomy that distinguishes among four types of demand, as illustrated in Figure 1. Two of these are called demands for production amenities, i.e., those goods and services that are, or could be, inputs to processes that produce other goods and services. The other two represent demands for consumption amenities, i.e., those goods and services that directly enhance the well being of consumers. To facilitate the discussion, we assume that one of them—the demand for agriculture, shown in the upper left of Figure 1—prevails and then look at the consequences for the others.
Competition for Production Amenities. Demand for Skagit County’s agricultural production amenities, represented on the left side of Figure 1, come from private and public enterprises, as well as households, that rely on the ecosystem to conduct commercial activities. We separate the demands for production amenities into two groups—agriculture and other commercial demands—to show that, sometimes, negative effects on other commercial sectors can offset the positive consequences arising from agriculture more or less, which are represented in the bottom left of Figure 1. Using land for commercial production of crops or livestock may, for example, prevent the land from being used to support other commercial activities.
Figure 1. The Competing Demands for Skagit County!s Resources
Source: ECONorthwest

ECONorthwest Economic Indicators of Agriculture in Skagit County 5
Competition Directly from Consumers. On the left side of Figure 1, ecosystem goods and services are economically important because they are inputs in the production of other things, notably crops and livestock that consumers want to have. On the right side, the connection to consumers is more direct. Here, consumers consider Skagit County’s natural resources economically important for how they directly contribute to their well-being. In economic parlance, these are known as consumption amenities.
Some ecosystem goods and services, such as recreational opportunities and scenic vistas, contribute directly to the well-being of people who have access to them. Their contribution to consumers’ well-being makes them economically important in their own right, but they have additional economic importance when they also influence the location decisions of households and firms. We show the demands for consumption amenities that influence location decisions of households sensitive to spatial variation in the quality of life, in the upper right portion of Figure 1. In general, the nearer people live to amenities, the lower their cost of using them. Thus, consumers can increase their economic well-being by living in a place that offers recreational opportunities, pleasant scenery, wildlife viewing, and other amenities they consider important.
Quality-of-life values can be powerful. All else equal, if the county’s consumption amenities improve, some people already here would tend to stay and additional people would tend to move in; degradation would have the reverse impacts. The natural-resource amenities available in Skagit County are among the highest in the nation, and they explain much of the county’s population growth.2 One consequence is that the amenities lead to higher demand for housing and consumer-oriented commercial products. The higher demand raises land value for these uses higher than otherwise would exist.3 Differences in quality of life also explain about half the interstate variation in job growth during periods of economic growth.4 This relationship also has been found at sub-national perspectives.5 Some in Skagit County undoubtedly could enjoy higher earnings living elsewhere, but choose not to do so because their overall economic welfare—the sum of their earnings plus quality of life—is higher here. Some aspects of this quality of life—the strength of communities, schools, and churches, for example—are not directly related to natural resources,
2 David McGranahan, D. 1999. Natural Amenities Drive Rural Population Change. USDA Economic Research Service. Agricultural Economic Report No. (AER781). October.
3 Roback, J. 1982. “Wages, Rents, and the Quality of Life.” Journal of Political Economy. 90, 1257-1278; 1988. “Wages, Rents, and Amenities: Differences among Workers and Regions.” Economic Inquiry. 26, 23-41.
4 Partridge, M. and D. Rickman. 2003. “The Waxing and Waning of Regional Economies: The Chicken-Egg Question of Jobs Versus People.” Journal of Urban Economics 53: 76-97.
5 For a more thorough discussion of relevant research, see, for example, Power, T.M. and R.N. Barrett. 2001. Post-Cowboy Economics: Pay and Prosperity in the New American West. Island Press, and Kim, K.-K., D.W. Marcouiller, and S.C. Deller. 2005. “Natural Amenities and Rural Development: Understanding Spatial and Distributional Attributes.” Growth and Change 36 (2): 273-297.

ECONorthwest Economic Indicators of Agriculture in Skagit County 6
but others are: open space, way of life, and opportunities for fishing and hunting, to mention a few.
The lower right portion of Figure 1 represents demands associated with economic values that do not necessarily entail a conscious, explicit use of ecosystem goods and services. We call these environmental values. There are two general categories: nonuse values and values of goods and services that generally go unrecognized. Nonuse values arise whenever people place a value on maintaining some aspect of the environment, even though they do not use it and have no intention to do so. Research has documented nonuse values for maintaining the existence of species threatened with extinction, for example, and for special natural areas, such as national parks. They also can materialize when people want to maintain a particular cultural or ecological characteristic of a resource, as when people want to maintain the existence of landscapes associated with traditional agriculture or native wilderness, for enjoyment by future generations.
Environmental values also can be important when the county’s ecosystem provides valuable services that people generally consume without being aware of them. Some of these are part of the so-called web of life. Others, such as the ability of wetlands to purify water and mitigate flood damage, have a more direct link to the well-being of Skagit County’s residents. Some scientists and economists believe many services have great economic value, even though people generally are unaware of their importance.6 Environmental values typically increase as people learn more about the environment, the services it provides, and environmental degradation.7 Many people today, for example, consciously consider the economic values associated with the services produced by the global climate in ways that were unknown, even to scientists, just a few years ago.
The demands associated with the consumer amenities represented on the right side of Figure 1 are typically harder to measure, or even to observe, than the commercial demands shown on the left side of the diagram. This difficulty does not diminish their value or impact on jobs and incomes, however. Instead, it merely reflects the lack of tools for measuring them.
3. Dimensions of Economic Importance
Figure 2 illustrates conceptually five distinct ways in which one can consider agriculture’s economic importance and sustainability. Three of these represent core interactions between agriculture and the economy.
6 Daily, G.C. (ed). 1997. Nature's Services: Societal Dependence on Natural Ecosystems. Washington, D.C.: Island Press.
7 Blomquist, G.C. and D.R. Johnson. 1998. “Resource Quality Information and Validity of Willingness to Pay in Contingent Valuation.” Resource and Energy Economics. 20:179-196.

ECONorthwest Economic Indicators of Agriculture in Skagit County 7
The benefits and costs of agriculture activities in the county are increases and decreases, respectively, in the value of goods and services available to society because of the activities, related commercial activities, and the public policies and programs associated with agriculture. Benefits can materialize, for example, as farmers combine the productivity of their lands with multiple inputs, such as fertilizers from local vendors, the labor of farm workers, and transportation facilities provided by local governments, to produce valuable crops and processed food products. At the same time, though, these activities can generate economic costs. Farming, for example, can generate economic costs by decreasing the value of salmon derived from the county’s waters.
The ecosystem’s contributions to the economy are realized through the two pathways shown in Figure 3. In one pathway, ecosystem goods and services are economically important because they become production amenities, i.e., they facilitate and are inputs in the production of other things that consumers want to
Figure 2. Ways in which Agriculture Can Be Important to Skagit County!s
Economy
Source: ECONorthwest
Figure 3. Ecosystem Goods and Services Contribute to Economic Well-
Being Via Two Major Pathways
Source: ECONorthwest

ECONorthwest Economic Indicators of Agriculture in Skagit County 8
have. Some of these goods and services are produced by commercial enterprises, such as farmers, who use the county’s soils and water to produce seeds that farmers elsewhere use to grow food crops. Developers use other county lands to construct housing, shopping malls, roads and other infrastructure for the general use of households.
In the other pathway, the connection to consumers is more direct. Here, the county’s natural resources directly contribute to consumers’ well-being, by producing verdant vistas, outdoor recreational opportunities, or opportunities to watch and hunt wildlife, or by providing the spatial and ecological basis for the way of life and cultural identity of rural and urban residents alike. The county’s ecosystem also provides economic benefits directly to consumers on larger scales: to the residents of the Puget Sound basin by regulating the movement of water, nutrients, fish, and wildlife; and to the world as a whole by sustaining the world’s biological diversity and regulating levels of carbon dioxide and other gases in the atmosphere. Such goods and services are known as consumption amenities.
Table 2 lists some of the positive amenities produced by farming operations. Farming operations can also produce effects that are perceived as negative, such as odor, nutrient and pesticide runoff, soil erosion, and ecosystem fragmentation. The benefits and costs associated with farming’s effects on these amenities, and on other ecosystem goods and services, typically accrue not just to farmers and the members of their families, but also to nearby residents and visitors.
Economists typically measure the economic value of a good or service in terms of what a person, business, or community, which does not have it, is willing to give up to acquire it. It is not necessary to measure value in monetary terms, but
Table 2. Amenities the Public Can Derive from Agricultural Lands
Rural
Development
Rural income and employment
Viability of rural communities Economic diversification
Social Amenities Country lifestyle
Cultural heritage
Environmental Amenities
Open Space
Isolation from Congestion
Biodiversity
Recreational Opportunities
Flood Control
Soil Conservation
Wildlife Habitat
Scenic Vistas
Watershed Protection Groundwater Recharge
Source: Hellerstein, D., C. Nickerson, J. Cooper, et al. 2002. Farmland Production: The Role of Public
Preferences for Rural Amenities. U.S. Department of Agriculture, Economic Research Service. Agricultural
Economic Report No. 815. October.

ECONorthwest Economic Indicators of Agriculture in Skagit County 9
doing so simplifies the measurement of what amount the person, group, or business is willing to pay. When a person, group, or business already possesses a good or service, the value equals the amount the owner is willing to accept as compensation for relinquishing it. In most settings, the two indicators of value, willingness to pay and willingness to accept compensation, are the same or similar. But, in some settings—when relinquishing control of a resource would lead to an outcome seen as morally repugnant, for example—the amount people require as compensation to relinquish a good or service can exceed, sometimes by a large margin, the willingness-to-pay measure of value.8 For example, members of a farming family desiring to sustain their way of life may have little money they would be willing to pay to gain access to additional croplands, but would require considerable compensation before they would relinquish control over lands they already control.
Market transactions indicate the value of some goods and services providing production amenities, as when a landowner rents land to a farmer seeking access to the land’s crop-producing opportunities, or hunters pay for access to the hunting opportunities at a particular site. Market prices often are poor indicators of value, however. Most ecosystem goods and services, especially those that provide consumption amenities, are not traded in markets. This does not mean they have no value, only that they are not traded. Economists use non-market techniques for measuring their value, but these are cumbersome, and few have been completed in this region. Hence, indicators of value must come from studies completed elsewhere, with appropriate care to see that the results are reasonable.9 A comprehensive assessment must consider the values, called use values, that involve human interaction with the ecosystem as well as those, called nonuse values, that do not.10 Some use values involve direct interaction, as when farmers plow a field. With others, the involvement is indirect, as when people rely on the biota to recycle soil nutrients to maintain soil productivity and prevent nutrients from reaching waterways. Nonuse values can have great value. In general, they represent the importance people place on being responsible stewards of natural resources. Many want to conserve the county’s agricultural heritage, for example, or to prevent the extinction of salmon in its streams.
Many people accent the economic importance of agriculture’s impacts on jobs and incomes, and related indicators of economic activity. Some of these impacts occur directly, as farmers create job opportunities and incomes for themselves and their workers. Others occur indirectly, as farmers purchase goods and
8 Amiran, E.Y., and D.A. Hagen. 2003. “Willingness To Pay and Willingness To Accept: How Much Can They Differ? Comment.” American Economic Review. March. 93: 458–463. Hanemann, W.M. 1991. “Willingness to pay and willingness to accept: How much can they differ?.” American Economic Review June. 81:635–647; and 2003. "Willingness To Pay and Willingness To Accept: How Much Can They Differ? Reply." American Economic Review. March 93): 464–464.
9 U.S. Environmental Protection Agency. 2000. Guidelines for Preparing Economic Analyses.
10 National Research Council. 2004. Valuing Ecosystem Services: Toward Better Environmental Decision-Making.

ECONorthwest Economic Indicators of Agriculture in Skagit County 10
services from private entities and governmental agencies, creating job opportunities and incomes for their employees, and as these employees, in turn, spend their incomes on locally produced goods and services.
The indirect impacts lead to something economists call a ripple, or multiplier effect in the economy. When a farmer earns $1 from selling her crops, she will spend some of this amount to purchase goods and services from outside the local area, but will spend the remainder in local businesses, creating income for the business owners and their workers. They, in turn, will spend some outside and some locally, and this process will repeat itself until, after several iterations, none of the farmer’s initial income remains in the local economy. The overall income will be greater than the farmer’s initial income resulting from the production of crops, and the ratio of the overall income to the farmer’s initial income is a measure of the multiplier effect. Regional- and county-level multipliers are usually smaller than state-level multipliers, because the smaller the area, the more likely it is that spending occurs outside of it.11 We anticipate that the county-level multiplier for changes in expenditures in Skagit County is smaller than 1.5. This multiplier seems reasonable insofar as it is consistent with the county’s much smaller size than the state as a whole, for which the Washington Office of Financial Management uses a multiplier of 2.3 for crop production in its input-output model.12 Skagit County represents a small portion, about 1.6 percent of the state’s economy.
Two major factors limit the size of the multiplier and the ability to estimate it with greater precision. One is the broad regional, national, and even international integration of today’s economy, which increases the percentage of income that households and firms use to purchase goods and services from outside the local economy. The other is the competition for natural resources, which means that an increase in jobs and income associated with agricultural production often is offset by a decrease in other sectors of the economy. This latter factor is reinforced when the economy is operating at its full capacity, so that agriculture can attract capital investment, workers, and supplies only by drawing them away from other enterprises. These limitations also restrict the ability to estimate the county-level multiplier more precisely and accurately. The relationship between agriculture and the economy is dynamic, not static, and the economy’s actual response to future changes in agricultural production likely will vary, depending on crops affected, the production process of the affected farmer(s), the extent to which adjustments by other farmers compensate for the initial effect, and the extent to which other users of the affected land, water, and other natural resources adjust to changes.
11 See, for example, California Economic Strategy Panel. 2002. Using Multipliers to Measure Economic Impacts. Retrieved August 24, 2010, from http://www.labor.ca.gov/panel/pdf/Multipliers.pdf
12 Washington Office of Financial Management. 2008. “Chapter 4: The Input-Output Impact Multipliers.” 2002 Washington Input Output Model. Retrieved September 23, 2010, from http://www.ofm.wa.gov/economy/io/2002/default.asp
ECONorthwest Economic Indicators of Agriculture in Skagit County 11
For some in the county, agriculture is especially important when farm-related financial flows and property taxes generate cash revenue for governmental agencies, businesses, or households enabling them to do things that otherwise would not be possible. Financial resources can be distinct from economic value. The market value for land used for agricultural purposes may be equivalent to or higher than the market value for similar land in residential use nearby, but tax revenues from that land may be lower because its assessed value is pegged to its use to produce agricultural products. Some may place a high value on improving drainage and diking infrastructure or fish habitat in the county, for example, but find they cannot undertake these actions unless funding is available.
Figure 2 shows two categories of economic importance overlaying the three core categories. One involves uncertainty and risk associated with using land and other resources for agricultural production. Increases or decreases in uncertainty or risk resulting from agricultural activities can have socioeconomic importance, especially for individuals, firms, groups, and communities that are risk-averse. The other involves the distribution of the agriculture-related economic consequences among different groups, especially when groups that enjoy the benefits, jobs, incomes, and financial advantages of an activity do not also bear the costs.
That uncertainty and risk carry important socioeconomic implications is well established in the economic literature.13 Most people dislike uncertainty and risk, i.e., they are risk averse, and an increase in uncertainty or risk lowers the economic well-being of individuals and families, and the expected profits of businesses. Consequently, actions that lower the uncertainty and risk for agriculture in the county likely increase its sustainability, and vice versa, all else equal. Similarly, most people dislike circumstances in which the distribution of benefits and costs seems unfair. Actions that make the perceived fairness of benefits and costs associated with agriculture seem more fair likely increase its sustainability.
B. Sustainability
“Some terms defy definition. ‘Sustainable agriculture’ has become one of them.”14
This observation, from USDA’s review of the literature on sustainable agriculture, highlights an important reality: different people can mean different things when they talk about what constitutes sustainable agriculture in Skagit County and consider actions intended to reinforce it. Many in the county, however, place an emphasis on describing sustainability in terms of the amount of land available for farming activities. This view assumes that, if the supply of
13 See, for example, Samuelson, P., and W. Nordhaus. 2005. Economics. 18th Edition. McGraw-Hill.
14 Gold, M.V. 2009. Sustainable Agriculture: Definitions and Terms. USDA, National Agricultural Library. Special References Brief SRB 99-02. Last Modified November 20. Retrieved 18 March 2010 from http://www.nal.usda.gov/afsic/pubs/terms/srb9902.shtml.
ECONorthwest Economic Indicators of Agriculture in Skagit County 12
land is adequate—above a critical mass—the agriculture sector will be economically competitive and sustainable. This view puts the cart before the horse, however.
From an economics perspective, the sustainability of agriculture in the county depends on the extent to which society’s demands for the goods and services available when land and water are used for farming exceed the competing demands for the goods and services that would be available if farming were replaced by housing development, ecosystem restoration, or other activities. Thus, an investigation of the sustainability of agriculture in the county should focus first on the competition for ecosystem goods and services, and then on the implications for the amounts of land and water available for use by farmers.
1. Competition and Sustainability
Competitive pressures affect the sustainability of the county’s agricultural sector in several ways. Three categories of competition are especially important, associated with: farm products, land development, and environmental quality.
Farm products. Farm producers in the county compete with producers elsewhere: in other Washington counties, other states, and other countries. All else equal, greater competition from farm producers elsewhere lowers the prices local producers can receive for their farm products, their net earnings and, hence, their ability to sustain farm operations. Farmers can increase their competitiveness by lowering their costs and increasing their efficiency, shifting to the production of other products, or finding alternative sources of income; the converse lowers their competitiveness.
Lowering operating costs and increasing net earnings entails finding new ways of producing farm products. One common strategy involves farm-specific decisions to adopt seeds, breeds, and farming methods that increase output, lower costs, or both. Often, opportunities arise from public or private investments in research and the dissemination of research results. Another strategy involves cooperation, which can occur among multiple farms or between a farm and its suppliers or buyers. By banding together, for example, farmers can solve drainage problems that would be too costly to address one-by-one. An agreement with a buyer that gives a farmer a guaranteed market for his crops can reduce uncertainty and risk and the costs of searching for a buyer.
Farmers in Skagit County have often shifted from one product to another to sustain their operations. Once noted for their production of peas, for example, contraction in the processing sector and increased competition from pea producers in eastern Washington reduced demand for peas from Skagit County. Farmers have shifted to producing other crops after the local processor closed and the costs of getting their peas to market increased dramatically. This adaptability distinguishes agriculture here from what occurs in many other areas, such as the Palouse and its concentrated production of grains.

ECONorthwest Economic Indicators of Agriculture in Skagit County 13
There are three primary sources of income for farm families, other than earnings from the sale of farm products: income farm families earn from activities other than farming, government payments and subsidies, and payments for providing ecosystem services. The U.S. Department of Agriculture (USDA) reports that, for 2010, it expects the average U.S. family farm to receive about 10 percent of its household income from farm sources, the rest from earned and unearned off-farm income. Specifically, it expects the average farm family will have on-farm income of about $8,000, off-farm earned income of about $52,000, and off-farm unearned income (e.g., pension income) of about $20,000.15 Figure 4 shows that off-farm income is important for farms of all sizes, but especially for small farms. For farms producing high-value crops, such as fruits, nuts, vegetables, and nursery products, the 2008 incomes of farm-operator households averaged more than $100,000, with more than half of this coming from off-farm sources.
Government payments can materialize directly, in the form of farm-related income, or indirectly, as farms are able to pass some of the costs associated with their operations onto federal, state, and local taxpayers and others. Many justifications for farm subsidies have been offered, but they often seem related to an expressed concern that they are worthwhile to sustain agricultural production. When a farm (or any other) product is subsidized, however, it encourages people to buy it when, without the subsidy, they would have bought something else or saved their money. Hence, subsidies, whether direct or indirect, necessarily diminish economic activity elsewhere in the economy.
15 U.S. Department of Agriculture, Economic Research Service. 2010. Farm Household Economics and Well-Being: Farm Household Income. February 11. Retrieved March 20, 2010, from http://www.ers.usda.gov/Briefing/WellBeing/farmhouseincome.htm.

ECONorthwest Economic Indicators of Agriculture in Skagit County 14
2. Critical Land Mass
The U.S. has long experienced the conversion of land from agricultural to other uses. Some have argued that, for a given area, region, or country, this process can continue slowly until the land mass reaches some critical level, after which the process proceeds rapidly. The economic reasoning behind this hypothesis is that there are efficiencies, called economies of scale or scope, associated with the amount of land mass, and these dissipate quickly as the land mass drops below the critical-mass threshold.
Several researchers have tested the hypothesis for counties in different parts of the country, with somewhat mixed results. Those with results supporting the hypothesis tend to have flaws in their analytical design that undermine the reliability of their results. The few studies that have been more successful in avoiding these flaws find, at most, incomplete evidence supporting the hypothesis.16 One of the most notable studies, for example, concluded, “even if a
16 Lynch, L. 2006. “Critical Mass: Does the Number of Productive Farmland Acres or Of Farms Affect Farmland Loss?” R.J. Johnston and S.K. Swallow (eds) Economics and Contemporary Land Use Policy: Development and Conservation at the Rural-Urban Fringe. Washington, DC.: Resources for the Future, 119-146
Figure 4. Off-Farm Income Varies Inversely with On-Farm Income

ECONorthwest Economic Indicators of Agriculture in Skagit County 15
threshold existed, our results suggest it might dissipate over time.”17 Overall, the evidence suggests that the notion of an agricultural critical land mass:
• Might exist for a point in time, a particular crop, or a specific set of producers, but it likely will dissipate over time as agricultural activities shift in response to competitive and other pressures.
• Likely does not exist for the entire agricultural sector in an area over a long period of time. Too many factors—especially the prices of inputs and farm products—determining the agricultural activities in the area change too frequently for a critical mass to be stable over a long period of time, across all farmers, crops, and farming methods.
C. Sustainability Indicators
The discussion above shows that economic indicators of agricultural sustainability must reflect the realities of the economic forces and dynamics that shape agricultural activities over time. In particular, they must provide insights into the competition for land and water resources, and into the options available to the county for reinforcing the sustainability of agriculture. In other words, the indicators should fall into three groups:
• The strength of the agriculture-related demands for ecosystem goods and services. Indicators should show both the current status as well as significant trends associated with these demands. Some of the demands are tied to the crops and animal products farmers produce and sell into the marketplace. Others are not. They are linked to the generally less tangible and non-market products from agricultural activities, most notably the positive contributions to the quality of life enjoyed by farm families and those who enjoy living amid the landscapes and culture of farming.
• The strength of the competing demands for ecosystem goods and services. Indicators should show both the current status as well as significant trends associated with these demands. Some of these demands are tied to markets, with developers seeking to buy farmland for the development of housing and commercial space to serve the households and businesses attracted. Others are not. These tend to focus on environmental restoration, such as demand for fish and wildlife habitat or improved water quality.
• The actual and potential performance of policies to sustain agriculture in Skagit County. Such policies might aim to strengthen agriculture-related demands, weaken the competing demands, or both. Indicators might reflect the extent of the effects of one or more policies, or the degree of the benefits and costs associated with them.
17 Lynch, L., and Carpenter, J. 2002. Does The Farm Sector Have A Critical Mass? University of Maryland, Department of Agricultural and Resource Economics Working Paper 28552.

ECONorthwest Economic Indicators of Agriculture in Skagit County 16
It also is important for indicators of agricultural sustainability to exhibit characteristics that enhance their utility to farmers, public officials, and the public. Any indicator of economic conditions is better to the extent that:
• It correlates with phenomena that matter to specific target questions and objectives
• Reliable data are available in a timely manner
• The data primarily indicate variation in the phenomenon of interest
• The data fluctuate in some explainable relationship (mechanism) with the target phenomenon
• The data exhibit enough fluctuation to support meaningful analysis
• It is comprehensible and makes sense to a lay audience
• If it is an index of multiple data sources, it implies reasonable tradeoff relationships between metrics. For example, if an indicator is an index that represents a simple sum of two metrics, A and B—so that the index remains unchanged if A increases by 1 and B decreases by 1—then the index implies that a unit of A is equal to a unit of B across the entire range of potentially observable data for the indicator.
• If the indicator becomes the focus of management decisions, it must have a reasonable, discernible relationship with the primary objectives.
• It is responsive to possible policy and behavior changes.

ECONorthwest Economic Indicators of Agriculture in Skagit County 17
II. AGRICULTURE AND SKAGIT COUNTY!S ECONOMY
This section provides an overview of the economic importance of agriculture in Skagit County, following the framework we introduce in Section I. We begin with a brief description of the agricultural sector in Skagit County. We then present data on the economic benefits and costs of agriculture in Skagit County, the economic impacts (jobs and incomes) associated with agriculture in Skagit County, the financial flows, uncertainty and risk, and distribution of the economic consequences of agriculture in Skagit County. These data provide the foundation for the indicators of economic viability for the county’s agricultural sector, which we present in Section IV.
A. Agriculture in Skagit County
1. Current Status and Recent Trends in the Use of Land
and Water Resources
The number of acres of land in farms made up about 8 percent of the total land area in Skagit County in 2007.18 Of the land in farms, about 60 percent is harvested and pastured cropland, 3 percent is fallow, and 11 percent is in buildings, roads, and other infrastructure. Table 3 shows how these values have changed over time. The land in buildings, roads, and other infrastructure has more than doubled over the last 20 years. Cropland designated for pasture has decreased slightly, and while harvested cropland has fluctuated over the years, it remains about what it was in 1987.
Other efforts to quantify the amount of agricultural land in Skagit County have found less land available for agricultural production. Mapping efforts by Skagit County, using land-cover data produced from satellite images, identified approximately 67,000 acres of farmland within the area of land zoned for agriculture in Skagit County. The land cover data showed an additional 20,000 acres of land used for agriculture outside the land zoned for agriculture.19
Figure 5 shows a map of Skagit County with land zoned as Agriculture-Natural Resource Land (Ag-NRL) highlighted pale yellow. The agricultural land in the county is concentrated in the Skagit River delta, and upstream along the Skagit River. The most recent zoning maps indicate the county has reserved almost
18 The U.S. Agricultural Census defines the land in farms as primarily agricultural land used for crops, pasture, or grazing. It also includes woodland and wasteland not actually under cultivation or used for pasture or grazing, provided it was part of the farm operator’s total operation. We use the U.S. Agricultural Census definition here to maintain consistency with the other data from the Agricultural Census that describe agricultural production in Skagit County. The Agricultural Census definition of a farm is any place from which $1,000 or more of agricultural products were produced and sold, or normally would have been sold, during the census year.
19 Greenberg, J. 2010. Email between Mark Buckley and Josh Greenberg, Skagit County GIS/Mapping Office, May 4, 2010.

ECONorthwest Economic Indicators of Agriculture in Skagit County 18
89,500 acres, or about 7 percent of the total land area in the county for agricultural uses. Most of this agricultural land is privately held. Some land owners have protected their land from development with conservation easements. Currently, there are 6,669 acres protected in conservation easements that are part of Skagit County’s Farmland Legacy Program, with another 1,346 acres pending enrollment in the program.20 These protected acres are shown in Figure 5.
Figures II-1a and II-1b, in Appendix II, shows the other major zoning classifications, the urban growth boundaries around the cities and towns, the major transportation corridors, and other major landforms in Skagit County.
20 Skagit County, Farmland Legacy Program. 2009 Annual Report. Retrieved April 6, 2010, from http://www.skagitcounty.net/ConservationFutures/Documents/FarmlandLegacy.pdf
Table 3. Acres of Land in Farms, by Type of Use, 1987–2007
Cropland
Year
Total Land in Farms Total
a Harvested Pastured Fallow
Other
Land in Farms
b
Buildings, Roads, etc.
1987 95,357 73,548 57,226 11,361 2,948 16,870 4,939
1992 92,074 72,576 57,946 11,590 2,560 16,428 3,070
1997 93,495 73,028 61,257 9,074 (D)c 16,155 4,312
2002 113,821 76,178 62,074 9,483 4,507 28,312 9,331
2007 108,541 69,810 58,163 8,246 3,152 26,841 11,890
Source: ECONorthwest, with data from U.S. Census of Agriculture, 1987–2007
Notes: aTotal includes cropland that was harvested, pastured, and fallow, and cropland on which all crops failed.
bOther land in farms includes pastured and unpastured woodland, and permanent pasture and rangeland other than
pastured land in cropland or woodland. a(D) indicates data withheld to avoid disclosing data for individual farms.

ECONorthwest Economic Indicators of Agriculture in Skagit County 19
Figure 5. Land Zoned Agricultural and Acres in Agricultural Conservation,
by Organization

ECONorthwest Economic Indicators of Agriculture in Skagit County 20
About 20 percent of the farms in Skagit County reported irrigating crops in the last Census of Agriculture in 2007. The census showed that about 26 percent of the total crops harvested in Skagit County were produced with irrigation in 2007. The U.S. Geological Survey tracks water use for agricultural purposes, and in 2005, found that agriculture withdrew almost 17 million gallons per day from surface and groundwater sources, combined. Figure 6 shows that, since 1990, agricultural water use has increased in Skagit County. Groundwater withdrawals account for more than two-thirds of all water use. Figure 7 compares the agricultural water use to all water use in Skagit County since 1990. In 2005, agricultural water use represented almost 40 percent of all water use in the county, up from 20 percent in 2000, but about the same as its share in 1990.
Figure 6. Agricultural Use of Surface and Groundwater, 1990–2005
Source: ECONorthwest, with data from the USGS Water Census, 1990–2005
Figure 7. Comparison of Agricultural Use to All Uses of Water, 1990–2005
Source: ECONorthwest, with data from the USGS Water Census, 1990–2005

ECONorthwest Economic Indicators of Agriculture in Skagit County 21
Figure 8 shows the crops grown in the Skagit River delta, the primary agricultural region in Skagit County, in 2008. Crops were also grown elsewhere in the county, but crop data are not available spatially for the entire county. Table II-1 in Appendix II shows a detailed list of the crops grown and the acres dedicated to each crop in 2008.
Figure 8. Crops Grown in the Skagit County Delta Region in 2008

ECONorthwest Economic Indicators of Agriculture in Skagit County 22
2. Current Status and Recent Trends in the Structure of
Agriculture
The agricultural sector accounted for about 3 percent of total earnings, and about 4 percent of total employment in Skagit County in 2007. This is a larger share of the economy than for Washington State, where farm-related earnings and employment represented about 1 percent and 2 percent of the statewide total, respectively, and for the nation, where farm-related earnings and employment made up about 0.6 percent and 1.6 of the national total respectively. Figure 9 presents the breakdown of total earnings and employment by industry for Skagit County in 2007.
Figure 9. Total Earnings and Employment by Industry, 2007
Source: ECONorthwest, with data from the U.S. Bureau of Economic Analysis, Regional Economic Accounts,
2007
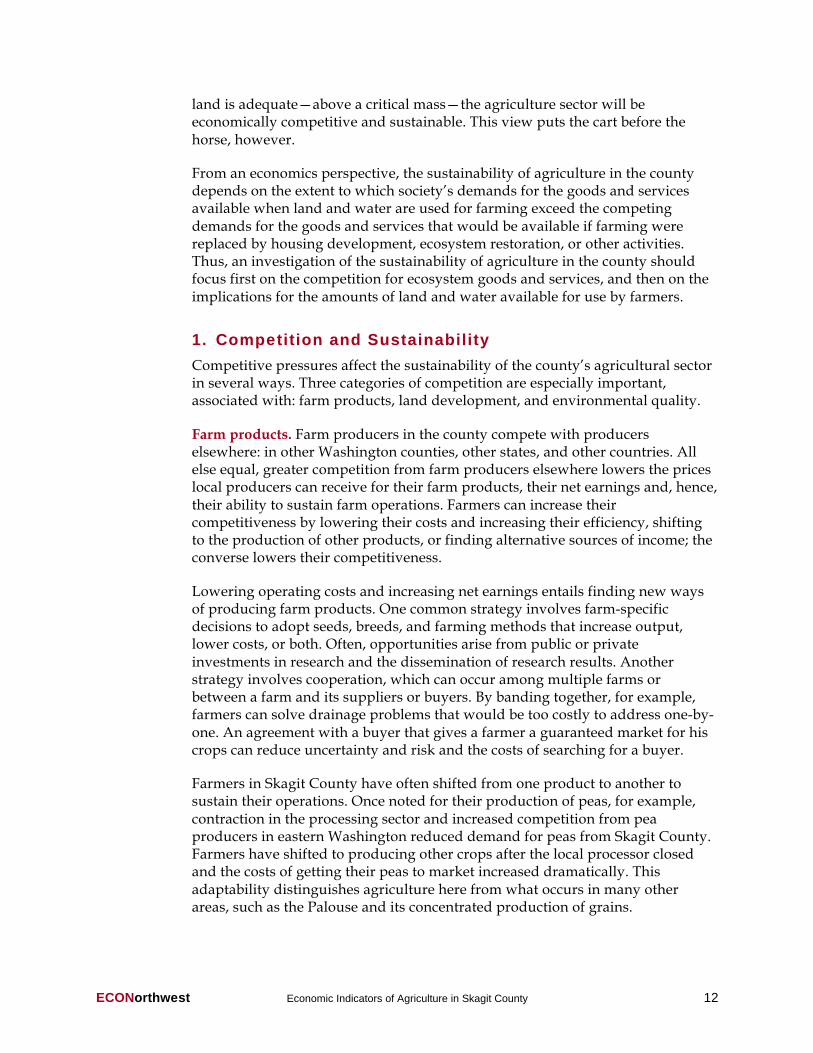
In 2007, there were 1,215 farms21 in Skagit County, covering about 109,000 acres of land. The average size of a farm in 2007 was 89 acres. Figure 10 shows the trends in the number and average size of farms since 1987. During that time, the number of farms in Skagit County has increased by nearly 40 percent, and the average farm size has decreased by about 30 percent. The total amount of land in farms has increased by about 15 percent.
21 These data are based on the U.S. Department of Agriculture’s definition of a farm for the purposes of the Agricultural Census. The census definition of a farm is any place from which $1,000 or more of agricultural products were produced and sold, or normally would have been sold, during the census year.
ECONorthwest Economic Indicators of Agriculture in Skagit County 23
Figure 10. Number of Farms and Average Acres per Farm, 1987-2007
Source: ECONorthwest, with data from the U.S. Census of Agriculture, 1987–2007
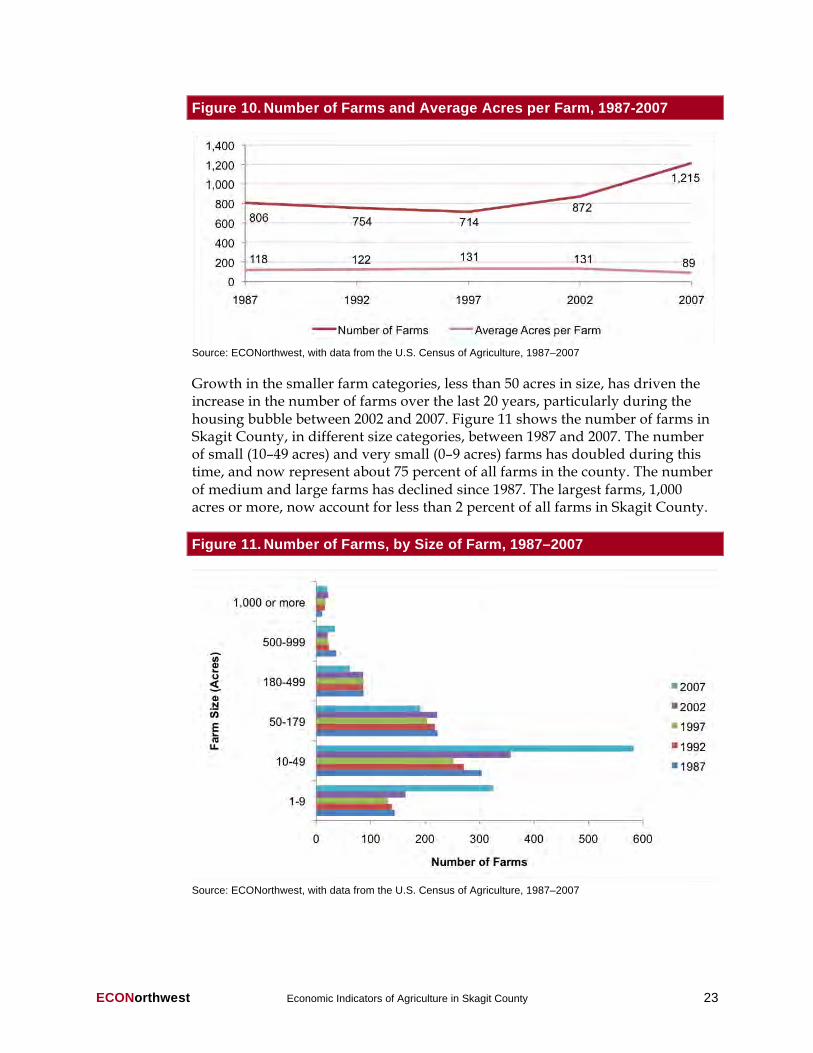
Growth in the smaller farm categories, less than 50 acres in size, has driven the increase in the number of farms over the last 20 years, particularly during the housing bubble between 2002 and 2007. Figure 11 shows the number of farms in Skagit County, in different size categories, between 1987 and 2007. The number of small (10–49 acres) and very small (0–9 acres) farms has doubled during this time, and now represent about 75 percent of all farms in the county. The number of medium and large farms has declined since 1987. The largest farms, 1,000 acres or more, now account for less than 2 percent of all farms in Skagit County.
Figure 11. Number of Farms, by Size of Farm, 1987–2007
Source: ECONorthwest, with data from the U.S. Census of Agriculture, 1987–2007

ECONorthwest Economic Indicators of Agriculture in Skagit County 24
Figure 12 shows another view of the changes in Skagit County farms since 1987: the value of sales among farms of different sizes. The most striking change has been the increase in number of farms with sales less than $2,500 per year, which doubled between 1987 and 2007. In 2007, over 50 percent of the farms in the county sold less than $2,500 of agricultural products. The number of farms with sales of $100,000 or more declined in 2007, after remaining more or less stable between 1987 and 2002.
Figure 12. Value of Sales per Farm, 1987–2007
Source: ECONorthwest, with data from the U.S. Census of Agriculture, 1987–2007
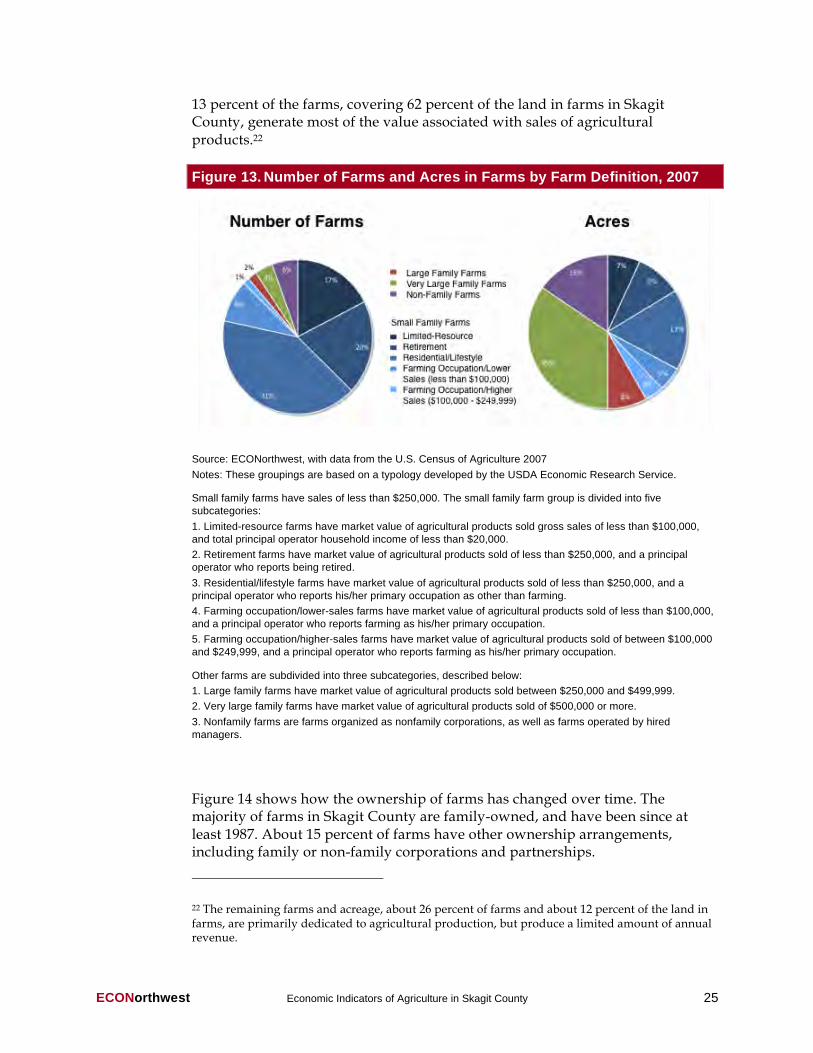
As Figures 11 and 12 make evident, the composition of farms in Skagit County is shifting toward more and smaller farms with a larger percent of farms contributing a smaller share of agricultural sales per farm. A new category of data collected in 2007, through the Census of Agriculture, helps tell the story of these small farms. The several blue segments in the charts in Figure 13 show different categories of small farms, defined as farms with annual revenues less than $250,000. While small farms constitute the overwhelming majority of farms in Skagit County (88 percent), they make up less than half of the total acreage dedicated to farming in the county (42 percent).
Of the farms in Skagit County, 41 percent are categorized as “residential or lifestyle” farms, which means that they are owned by people whose primary occupation is something other than farming. These farms make up about 17 percent of the total acres of farms in Skagit County. Another 20 percent of farms are owned by people who are retired from farming, accounting for 9 percent of the acres in farms. This means that 61 percent of the farms, which cover 26 percent of the land in farms in Skagit County, are not oriented toward commercial agricultural production, but instead are oriented toward people’s well being by providing a place to live and spend leisure time. In contrast, about
ECONorthwest Economic Indicators of Agriculture in Skagit County 25
13 percent of the farms, covering 62 percent of the land in farms in Skagit County, generate most of the value associated with sales of agricultural products.22
Figure 13. Number of Farms and Acres in Farms by Farm Definition, 2007
Source: ECONorthwest, with data from the U.S. Census of Agriculture 2007
Notes: These groupings are based on a typology developed by the USDA Economic Research Service.
Small family farms have sales of less than $250,000. The small family farm group is divided into five
subcategories:
1. Limited-resource farms have market value of agricultural products sold gross sales of less than $100,000,
and total principal operator household income of less than $20,000.
2. Retirement farms have market value of agricultural products sold of less than $250,000, and a principal
operator who reports being retired.
3. Residential/lifestyle farms have market value of agricultural products sold of less than $250,000, and a
principal operator who reports his/her primary occupation as other than farming.
4. Farming occupation/lower-sales farms have market value of agricultural products sold of less than $100,000,
and a principal operator who reports farming as his/her primary occupation.
5. Farming occupation/higher-sales farms have market value of agricultural products sold of between $100,000
and $249,999, and a principal operator who reports farming as his/her primary occupation.
Other farms are subdivided into three subcategories, described below:
1. Large family farms have market value of agricultural products sold between $250,000 and $499,999.
2. Very large family farms have market value of agricultural products sold of $500,000 or more.
3. Nonfamily farms are farms organized as nonfamily corporations, as well as farms operated by hired
managers.
Figure 14 shows how the ownership of farms has changed over time. The majority of farms in Skagit County are family-owned, and have been since at least 1987. About 15 percent of farms have other ownership arrangements, including family or non-family corporations and partnerships.
22 The remaining farms and acreage, about 26 percent of farms and about 12 percent of the land in farms, are primarily dedicated to agricultural production, but produce a limited amount of annual revenue.

ECONorthwest Economic Indicators of Agriculture in Skagit County 26
Figure 14. Ownership Structure of Farms, 1987–2007
Source: ECONorthwest, with data from the U.S. Census of Agriculture, 1987–2007
Another factor of interest, with potential implications for the structure of agriculture in Skagit County, is the age of farm proprietors. Figure 15 illustrates the ages of farm proprietors in Skagit County. The average age of farm proprietors was about 56 in 2007. In 1987, the average age was 50, which indicates the average farm proprietor is older today than twenty years ago. The number of farms whose proprietor is between 55 and 64 years of age has doubled since 2002. While the number of farm proprietors between 25 and 34 years of age also doubled between 2002 and 2007, it remains less than half what it was in 1987. These numbers may indicate significant changes in future farming activities. Farming would decline, for example, if retiring farmers sell their land to new owners less interested in farming.
Figure 15. Age of Farm Proprietors by Number of Farms, 1987–2007
Source: ECONorthwest, with data from the U.S. Census of Agriculture, 1987–2007
In recent decades, the primary markets for Skagit County farmers’ crops and livestock products have been large-scale processing plants, and national purchasers and distributors. These remain important today, but the last decade has brought more options for direct-to-consumer sales for farm products,

ECONorthwest Economic Indicators of Agriculture in Skagit County 27
through farmers markets, community-supported agriculture, and other niche markets. Growing consumer interest in how and where food is produced is driving demand in these new markets. The Northwest Agriculture Business Center (NABC) has focused on helping farmers access these markets by providing businesses with guidance on developing value-added or innovative agricultural products and services. For example, the NABC created the Puget Sound Food Network to support connections among growers, retailers and food service businesses, processors, and other infrastructure providers to increase sales of locally-produced products in the Puget Sound region. It also has supported efforts to increase access to local and regional processing facilities, to help farmers expand value-added production and local distribution opportunities.
3. Trends in External Factors Affecting Agriculture
Changing trends in markets, social preferences, and ecological and climate conditions at the local, regional, national, and international scales affect agriculture in Skagit County. These external changes exert pressures on farmers and communities that inevitably result in increased uncertainty and heightened tension among people who care about the sustainability of agriculture and the quality of life in Skagit County. Some of these changes, such as fluctuations in international markets for agricultural products and other inputs to agriculture, are largely outside the control of individual farmers and decision-makers in Skagit County. Other changes, such as increases in population and demand for land, may, to some extent, fall within local decision-makers’ sphere of influence.
Increasing Demand for Land for Residential, Commercial, and Industrial Purposes. Figures II-2a and II-2b and Figures II-3a and II-3b in Appendix II show the land cover types, including land dedicated to agriculture and developed land, in western and eastern Skagit County in 2001 and 2006. Skagit County has responded to increasing urban growth pressures by establishing urban growth boundaries, zoning land for agriculture, and enacting policies to ensure land stays in agricultural production.
• Skagit County requires a 40-acre minimum lot size in land zoned for agriculture, to discourage non-farm-related residential development and sprawl outside urban growth boundaries.
• In the fall of 2009, new county rules enhanced these protections, requiring people who apply for a county permit to build a house on farmland to sign a sworn affidavit showing they are actively farming the land and producing income from agricultural production.
Increasing Demand for Improving Environmental Quality and Conserving Natural Resources. Scientists have warned that the Puget Sound ecosystem is deteriorating, driven by pollution and changes in land use.23 Three species of
23 Puget Sound Partnership. 2010. 2009 State of the Sound. January. Retrieved March 31, 2010, from http://www.psp.wa.gov/downloads/SOS09/09-04534-000_State_of_the_Sound-1.pdf

ECONorthwest Economic Indicators of Agriculture in Skagit County 28
salmon in the Skagit River Basin are listed under the Endangered Species Act, and 45 water bodies within the basin violate Washington’s water quality standards for temperature, phosphorus, or bacteria. Multiple efforts are underway to arrest the deterioration and restore the ecosystem.
• Agricultural landowners in the Skagit River delta are participating in voluntary and collaborative initiatives to minimize their impact on watershed health and existing salmon habitat by protecting water quality and restoring critical habitat. At least six specific strategies have been developed and are at varying stages of implementation, including the Drainage and Fish Initiative, the Tidegates and Fish Initiative, a Comprehensive Irrigation District Management Plan, the Pumps and Fish Initiative, the Water Quality Initiative, and the Water Management Initiative.24
• Regulatory efforts to meet water quality standards in the Skagit River basin currently affect some agricultural activities. Efforts to address fecal coliform bacteria levels in the Samish River have focused, in part, on getting farm owners to voluntarily change their land management activities to move livestock away from the river.
• Regulatory efforts to protect listed species of salmon in the Skagit River basin have focused on improving and restoring estuarine habitat and tidal flooding throughout the Skagit River delta. Some of these activities could occur on agricultural land, a major land use in the delta. Recent efforts to restore Wiley Slough, for example, incorporated a new dike and tide gates to protect farmland, while breaching old dikes and restoring historic drainage networks to provide habitat for fish and wildlife.
Changing Global Climate. A recent assessment by the Climate Impacts Group at the University of Washington concluded that increases in average global temperature will impact the climate of the Pacific Northwest. The expected changes likely will increase sea level; reduce the quality and extent of freshwater salmon habitat; increase extreme high-precipitation events, which may threaten existing drainage infrastructure; and reduce snowpack, which may change the seasonal timing of streamflows and reduce flows from snowmelt.25
• Sea level rise could inundate thousands of acres of prime farmland in the Skagit River delta, unless extensive efforts are undertaken to reinforce the existing dike and drainage system. On the Swinomish Reservation alone, which is located in southwestern Skagit County, sea level rise could
24 Western Washington Agricultural Association. No Date. Creating Strategies to Preserve the Environment and the Agricultural Community: Changing the Paradigm in the Skagit Delta.
25 Climate Impacts Group. 2009. The Washington Climate Change Impacts Assessment. McGuire Elsner, M., J. Littell, and L. Whitely Binder (eds). Center for Science in the Earth System, Joint Institute for the Study of the Atmosphere and Oceans, University of Washington, Seattle, Washington. Retrieved March 31, 2010, from http://www.cses.washington.edu/db/pdf/wacciareport681.pdf

ECONorthwest Economic Indicators of Agriculture in Skagit County 29
inundate 1,100 total acres, including low-lying agricultural acres at the northern end of the reservation.26
• Rising sea levels would most likely require the construction of new dikes and raising existing dikes to prevent flooding of agricultural lands in the delta.
• Increased frequency and magnitude of flood events may put additional stress on dike and drainage infrastructure, and increase the erosion of farmland adjacent to rivers and streams. Efforts to reduce flood hazards may require dike setbacks, which may take land out of agricultural production.
Increasing Competition and Cost Pressures. Skagit County’s agricultural producers compete in a global market for agricultural commodities; trends and developments worldwide affect the county’s farmers. Increases in demand for oil and other commodities have affected the costs of fertilizer, fuel, seeds, and other inputs to farm production. External forces, such as increasing international demand for agricultural inputs, and pending regulatory action on carbon dioxide, mean prices for these inputs are not likely to diminish.
Global competition is especially important for seed crops. Skagit County has long been a leading global producer of seed. Many factors influence the demand for Skagit County’s seed, including international exchange rates, tastes and preferences for specific seed varieties, technological changes, and ongoing consolidation and changes in ownership of major firms in the seed industry.
B. Economic Benefits and Costs of Agriculture in Skagit
County
Agriculture in Skagit County generates an economic benefit when it increases the value of goods and services, e.g., by growing crops, available to consumers and an economic cost when it decreases their value, e.g., by using land, labor, and fertilizer that otherwise would be available for other uses. In this section, we describe the economic benefits and costs of agriculture and discuss the overall net benefits (or costs). We generally quantify value in terms of the public’s total willingness to pay for a good or service (or for a set of goods and services). This measure can have two components. One is the amount people actually pay for the good or service, i.e., their expenditures. The other exists if the amount they pay is less than what they would be willing to pay. In such an instance, the difference between the two is a net economic benefit consumers enjoy from acquiring the good or service. This net economic benefit is called consumer surplus.
26 Swinomish Indian Tribal Community, Office of Planning and Community Development. 2009. Swinomish Climate Change Initiative: Impact Assessment Technical Report. October.

ECONorthwest Economic Indicators of Agriculture in Skagit County 30
1. Benefits and Costs to Farmers in Skagit County
Farms generate economic benefits when they produce crops and animal products that otherwise would not be available for consumers. The value of these benefits generally is indicated by the price that society is willing to pay for them. The total, gross value of crop and animal products produced by the county’s farms in 2007 was $290 million. Farming activities also generate economic costs, by taking goods and services that otherwise would have been used for other purposes, and using them to produce the crops and animal products. In producing the crops and animal products in 2007, the county’s farmers consumed goods and services with a total, gross value of $198 million. The total, net benefits, which represent the incremental increase in the value of goods and services resulting from farming activities, was $92 million.
Gross Value of Crops and Livestock. Over the last 40 years, the gross value of crops and livestock27 sold has increased, both year-to-year and adjusted for inflation. Figure 16 shows the trend in gross farm income from marketing crops and livestock, measured in inflation-adjusted 2010 dollars.
Figure 16. Gross Value of Crops and Animal Products, 1969–2007, in 2010
Dollars
Source: ECONorthwest, with data from the U.S. Bureau of Economic Analysis, Regional Economic Accounts,
1969–2007
The types and quantities of crops and livestock produced in Skagit County have varied over time. For a description of this variation, see Appendix I. In 2008, the last year for which data are available, livestock and their products contributed about 25 percent of the gross value to Skagit County’s farmers, and crops contributed the remaining 75 percent. Nursery and floriculture crops, and peas were the top grossing crops, at about $70 million each. Figure 17 shows the
27 We use the term livestock in this report to include both livestock and animal products, including dairy, eggs, and wool.

ECONorthwest Economic Indicators of Agriculture in Skagit County 31
market value of the major crops and livestock produced in Skagit County in 2008.
Figure 17. Market Value of Major Crops and Livestock, 2008
Source: ECONorthwest, with data from Washington Department of Agriculture and the Washington State
University Agriculture Extension Service, Skagit County
The gross revenue of crops sold, per acre of harvested cropland in Skagit County in 2007 was about $2,900, in 2010 dollars. This more than doubles the gross revenue per acre in 1987, which was about $1,300, in 2010 dollars. Figure 18 shows that the value per acre increased in inflation-adjusted dollars to about $3,300 in 2002, but then declined 13 percent in 2007.
Figure 18. Gross Revenue per Acre, 1987–2007, in 2010 Dollars
Source: ECONorthwest, with data from the U.S. Census of Agriculture, 1987–2007
Figure 19 shows a map of the average value per acre, by parcel, of the crops grown in the Skagit River delta region, where data on gross revenue per acre are

ECONorthwest Economic Indicators of Agriculture in Skagit County 32
available. Data are unavailable for the entire county. The map indicates the value per acre—and by extension, the type of crop grown—is distributed somewhat randomly throughout the delta.
Figure 19. Gross Revenue of Crops, per Acre, 2008
Value of Government Payments. Another source of revenue for farmers in Skagit County is payments from the federal government. The data in Figure 20
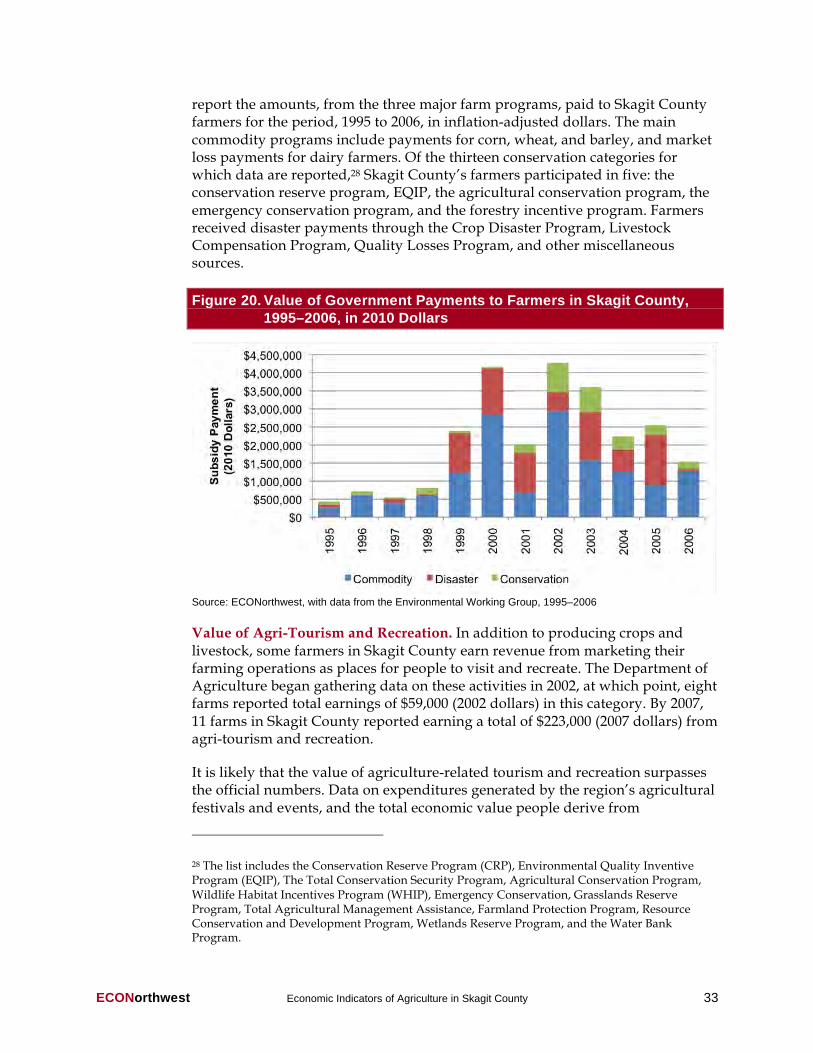
ECONorthwest Economic Indicators of Agriculture in Skagit County 33
report the amounts, from the three major farm programs, paid to Skagit County farmers for the period, 1995 to 2006, in inflation-adjusted dollars. The main commodity programs include payments for corn, wheat, and barley, and market loss payments for dairy farmers. Of the thirteen conservation categories for which data are reported,28 Skagit County’s farmers participated in five: the conservation reserve program, EQIP, the agricultural conservation program, the emergency conservation program, and the forestry incentive program. Farmers received disaster payments through the Crop Disaster Program, Livestock Compensation Program, Quality Losses Program, and other miscellaneous sources.
Figure 20. Value of Government Payments to Farmers in Skagit County,
1995–2006, in 2010 Dollars
Source: ECONorthwest, with data from the Environmental Working Group, 1995–2006
Value of Agri-Tourism and Recreation. In addition to producing crops and livestock, some farmers in Skagit County earn revenue from marketing their farming operations as places for people to visit and recreate. The Department of Agriculture began gathering data on these activities in 2002, at which point, eight farms reported total earnings of $59,000 (2002 dollars) in this category. By 2007, 11 farms in Skagit County reported earning a total of $223,000 (2007 dollars) from agri-tourism and recreation.
It is likely that the value of agriculture-related tourism and recreation surpasses the official numbers. Data on expenditures generated by the region’s agricultural festivals and events, and the total economic value people derive from
28 The list includes the Conservation Reserve Program (CRP), Environmental Quality Inventive Program (EQIP), The Total Conservation Security Program, Agricultural Conservation Program, Wildlife Habitat Incentives Program (WHIP), Emergency Conservation, Grasslands Reserve Program, Total Agricultural Management Assistance, Farmland Protection Program, Resource Conservation and Development Program, Wetlands Reserve Program, and the Water Bank Program.

ECONorthwest Economic Indicators of Agriculture in Skagit County 34
recreational activities supported, at least in part, by the region’s agricultural lands suggest the actual value associated with agri-tourism and recreation in Skagit County likely exceeds $67 million each year, as Table 4, below, summarizes.
Skagit County agriculture is the focus of several regional festivals throughout the year, including the annual Tulip Festival. In 2000, the Tulip Festival drew about 350,000 visitors, the majority from outside Skagit County, who spent about $14 million during their visit.29 More recent reports suggest the number of visitors has grown closer to 1 million, and presumably the direct expenditures associated with the festival have also increased.30 The Harvest Festival and the Skagit County Fair also attract thousands of visitors to Skagit County each year—56,000 in 2002—some of whom also spend money they wouldn’t otherwise have spent in the county. A 2003 study estimated the direct expenditures associated with these events totaled approximately $1.3 million.31
Agriculture also supports recreational activities, such as hunting, wildlife watching, and freshwater fishing that may generate some revenue for some farmers, and create income for Skagit County businesses. In 2008, 5,663 hunters spent 38,732 days hunting game birds and small mammals, primarily ducks and geese, in Skagit County.32 A 2006 survey of hunters, anglers, and wildlife watchers in Washington found that hunters in Washington spend an average of $37 per day on trip-related expenditures.33 Assuming the hunters in Skagit County spent the statewide average at Skagit County business, such as food providers, gas stations, hotels, and hunting equipment stores, hunting-related income to Skagit County businesses would have totaled around $1.5 million in 2008. Although hunting participation has fallen in Washington in recent years, hunting statistics collected by the Washington Department of Fish and Wildlife suggest that participation in Skagit County has remained steady over the last 10 years.
29 Dean Runyan Associates. 2000. Skagit Valley Tulip Festival, April 2000, Economic Impacts and Visitor Profile. Washington State Community Trade and Economic Development, Washington State Tourism. June. Retrieved April 5, 2010, from http://www.deanrunyan.com/doc_library/ TulipFestival2000.pdf
30 Visit Skagit Valley. 2010. 27th Annual Skagit Valley Tulip Festival–Spring 2010–Tulip Festival, WA State. Retrieved April 5, 2010, from http://www.skagittourism.com/event_show.cfm?id=24
31 Skagit County, Planning and Permit Center. 2003. Draft Programmatic Environmental Impact Statement: Development of a Critical Areas Ordinance for Application to Designated Agricultural Natural Resource Lands (Ag-NRL) and Rural Resource National Resource Lands (RRc-NRL) Engaged in Ongoing Agricultural Activity. Volume 2 (Technical Appendices). February. Pg. 21.
32 Washington Department of Fish and Wildlife. 2009. Statewide Small Game Harvest Statistics for the 2008 Hunting Season. Retrieved April 5, 2010, from http://wdfw.wa.gov/hunting/harvest/2008/ reports/small_game.php
33 U.S. Department of the Interior, Fish and Wildlife Service, and U.S. Department of Commerce, U.S. Census Bureau. 2008. 2006 National Survey of Fishing, Hunting, and Wildlife-Associated Recreation: Washington. Report No. FHW/06-WA. May. Adjusted to 2010 dollars.

ECONorthwest Economic Indicators of Agriculture in Skagit County 35
Agricultural lands in Skagit County provide important habitat for some waterfowl and other birds, offsetting losses of habitat that have occurred through the loss and degradation of wetlands, riparian forests, and other actions.34 Flooded fields can attract ducks by protecting them from predators, foraging sites, and refuge for resting. This habitat is especially important given the extensive loss of wetlands in the county, the Puget Sound basin, and the Pacific Northwest. Food supplies on agricultural lands, especially from forage crops planted by Washington Department of Fish and Wildlife, sustain wintering populations of geese and swans. Agricultural habitats seem less important to shorebirds, although population densities on farmlands do rise during the spring migration. Overall, the undeveloped habitats in the Puget Sound basin appear unable to support existing bird populations, let alone provide the basis for population increases. In this context, although restoration of natural habitats may be preferred in the long run, agricultural habitats currently play an essential role in bird conservation and likely will continue to do so for the foreseeable future.
Wildlife watching is an increasingly popular activity in Washington and nation-wide. In 2006, 2.3 million people 16 or older participated in wildlife watching in Washington. While participation in hunting in Washington fell between 1996 and 2006 by 33 percent, wildlife watching in Washington increased by 23 percent.35 Official data on participation are not available at the county level, but anecdotal reports by wildlife managers suggest many people are drawn to Skagit County to watch wildlife. Based on unofficial reports of car counts and participation in wildlife festivals, wildlife mangers estimated that at least 500,000 people participated in wildlife watching in Skagit County in 2002.36 The 2006 survey of hunters, anglers, and wildlife watchers in Washington found that wildlife watchers spent an average of $52 per day on trip-related expenditures.37 Assuming the 500,000 count represents the number of days people spent watching wildlife in Skagit County and that their spending in the county equaled the statewide average, the income generated for Skagit County businesses in 2002 would have been close to $26 million.
34 Slater, G. No Date. “Waterbird Abundance and Habitat Use in Estuarine and Agricultural Habitats of the Skagit and Stillaguamish River Deltas.” Ecostudies Institute. Retrieved September 21, 2010, from www.skagitcoop.org/documents/Waterbird_final_draft.pdf.
35 U.S. Department of the Interior, Fish and Wildlife Service, and U.S. Department of Commerce, U.S. Census Bureau. 2008. 2006 National Survey of Fishing, Hunting, and Wildlife-Associated Recreation: Washington. Report No. FHW/06-WA. May. Pg. 14.
36 Skagit County, Planning and Permit Center. 2003. Draft Programmatic Environmental Impact Statement: Development of a Critical Areas Ordinance for Application to Designated Agricultural Natural Resource Lands (Ag-NRL) and Rural Resource National Resource Lands (RRc-NRL) Engaged in Ongoing Agricultural Activity. Volume 2 (Technical Appendices). February.
37 U.S. Department of the Interior, Fish and Wildlife Service, and U.S. Department of Commerce, U.S. Census Bureau. 2008. 2006 National Survey of Fishing, Hunting, and Wildlife-Associated Recreation: Washington. Report No. FHW/06-WA. May. Adjusted to 2010 dollars.

ECONorthwest Economic Indicators of Agriculture in Skagit County 36
Agricultural lands provide access to fishing sites and, in some cases, may help support high-quality fish habitat. Data are not available to reliably estimate the number of days spent fishing in the freshwater streams and rivers within Skagit County.38 In 2002, about 15,000 salmon were caught in the Skagit and Samish Rivers by recreational freshwater anglers.39 In 1997, about 22,500 salmon were caught in these rivers.40 Despite this drop in salmon caught, the number of catch record cards issued to residents of Skagit County has increased from about 16,000 in 1997 to about 20,500 in 2002, and the number of catch record cards issued throughout the state has more than doubled from about 330,000 to more than 750,000 over that same period. To a lesser extent, recreational anglers in the region also fish for other species such as steelhead and sturgeon. The 2006 survey of hunters, anglers, and wildlife watchers in Washington found that recreational anglers spent an average of $42 per day on trip-related expenditures.41
People who participate in hunting, wildlife watching, and fishing spend money when they participate in these activities, and we document these expenditures in the preceding paragraphs. For many people, the amount they spend to hunt, watch wildlife, or fish is less than the amount they would be willing to spend. The difference between what they would be willing to spend and what they actually spend is a value economists call consumer surplus. The total economic value associated with an activity is the sum of the direct cost of participation plus the value of the consumer surplus. Economic studies have measured the average consumer surplus for people who participate in various types of recreation in the Pacific Coast region.42 On average, hunters who hunt waterfowl experience a consumer surplus of $45 per person per day, people who participate in wildlife watching experience a consumer surplus of $32 per person per day, and anglers experience a consumer surplus of $41 per person per day. Table 4 estimates the total consumer surplus associated with these activities in Skagit County based on the estimated annual participation described above. It is possible, indeed likely, that visitors to the agricultural festivals in Skagit County also experience
38 A 2003 study suggests there were about 2,500 freshwater anglers in Skagit County in the late 1990s, each fishing in the County an average of about 11 times per year (Skagit County, Planning and Permit Center, 2003). We were unable to reliably reproduce the study’s estimates and hence do not extrapolate their results to the present in our analysis.
39 Washington Department of Fish and Wildlife. 2008. Washington State Sport Catch Report 2002. April. Pp. 43-44.
40 Washington Department of Fish and Wildlife. 1999. Washington State Sport Catch Report 1997. December. Pg. 41.
41 U.S. Department of the Interior, Fish and Wildlife Service, and U.S. Department of Commerce, U.S. Census Bureau. 2008. 2006 National Survey of Fishing, Hunting, and Wildlife-Associated Recreation: Washington. Report No. FHW/06-WA. May. Adjusted to 2010 dollars.
42 Rosenberger, R. S. and Loomis, J.B. 2001. Benefit transfer of outdoor recreation use values: A technical document supporting the Forest Service Strategic Plan (2000 revision). Gen. Tech. Rep. RMRS-GTR-72. Fort Collins, CO: U.S. Department of Agriculture, Forest Service, Rocky Mountain Research Station.

ECONorthwest Economic Indicators of Agriculture in Skagit County 37
consumer surplus associated with their visit, however we are not aware of any study that has measured this value.
Table 4. Estimated Economic Value Associated with Agri-Tourism and
Recreation in Skagit County per Year
Activity
Annual Value (Adjusted to 2010 Dollars)
Direct Expenditures
Agricultural Festivals and Events $19 Million
Hunting $1.5 Million
Wildlife Watching $26 Million
Fishing Unknown
Consumer Surplus
Agricultural Festivals and Events Unknown
Hunting (Waterfowl) $1.7 Million
Wildlife Watching $19.5 Million
Fishing Unknown
Total Economic Value Greater than $ 67.7 Million
Source: ECONorthwest, with data from sources described in the text.

ECONorthwest Economic Indicators of Agriculture in Skagit County 38
Costs Associated with Producing Crops and Livestock. The major costs for producing crops include seed, commercial fertilizer and chemicals, fuel and electricity, labor, and land. Producing livestock and their products also requires the animals themselves and feed. The graphs in Figure 21 show the trend in the cost of these inputs over the last 40 years, adjusted for inflation. The cost of these inputs has increased over time in most cases, with marked increases in petroleum products and fertilizers and chemicals, which are heavily influenced by the market value for petroleum products. The costs of seed, feed, and labor have also increased over time, with small declines in recent years.
Figure 21. Costs Associated with Producing Crops and Livestock, 1969–
2007, in 2010 Dollars
Source: ECONorthwest, with data from the U.S. Bureau of Economic Analysis, Regional Economic Accounts,
1969–2007

ECONorthwest Economic Indicators of Agriculture in Skagit County 39
Overall, total production expenses have increased in inflation-adjusted terms over the last 40 years, with a small decline in the last decade, as Figure 22 shows.
Figure 22. Total Costs Associated with Producing Crops and Livestock,
1969–2007, in 2010 Dollars
Source: ECONorthwest, with data from the U.S. Bureau of Economic Analysis, Regional Economic Accounts,
1969–2007
Net Farm Income. Net farm income represents the gross value of crops and livestock, government payments, and other sources of income, minus the expenses associated with producing the crops and livestock. Figure 23 shows the net farm income, in 2010 dollars, for two groups: all farms, and farms that are sole proprietorships or partnerships. Net farm income in inflation-adjusted dollars for all farming operations has increased at an average rate of about 7 percent per year, over the past 40 years. For sole proprietorships or partnerships, net farm income has fluctuated, but remained largely unchanged over the same period, as the trend line in Figure 23 illustrates.
Figure 23. Net Farm Income, 1969–2007, in 2010 Dollars
Source: ECONorthwest, with data from the U.S. Bureau of Economic Analysis, Regional Economic Accounts,
1969–2007

ECONorthwest Economic Indicators of Agriculture in Skagit County 40
Although total net farm income in Skagit County has been consistently positive over the last 40 years, it is not uncommon for some—indeed many—farms to operate with negative net income in any given year. The 2007 Census of Agriculture found that about one-third of farms in Skagit County had positive net farm income, while two-thirds had a net loss. In total, however, net farm income was positive, because the farms with net gains outweighed farms with net losses. Figure 24 shows the average net income and loss for the two groups for every five years between 1987 and 2007. Figure 25 shows the number of farms with net gains and net losses over the same period. While 2007 was extreme, four of the five years for which we have data indicate that more farms lost income than gained income. In every period, however, the average net income of farms with net gains far outweighed the average net income of farms with net losses.
Figure 24. Number of Farms with Net Gains and Net Losses, 1987–2007
Source: ECONorthwest, with data from the U.S. Census of Agriculture, 1987–2007
Figure 25. Average Net Income per Farm for Farms with Net Gains and Net
Losses, 1987–2007, in 2010 Dollars
Source: ECONorthwest, with data from the U.S. Census of Agriculture, 1987–2007

ECONorthwest Economic Indicators of Agriculture in Skagit County 41
2. Benefits and Costs to Other Residents of Skagit County
Farmers’ net farm earnings tell only part of the story about the overall net benefits and costs of agriculture in Skagit County. Also important are the economic consequences that accrue to others, which economists call externalities. Externalities can be positive or negative. Many arise from agriculture’s impact on the ecosystem’s ability to provide goods and services other than those that support agricultural production. In this section, we summarize information regarding the general value of different types of externalities that might accompany changes in agriculture in Skagit County. We emphasize that this information does not necessarily represent the externalities that would accompany any specific change. Instead, it identifies the types of externalities that might be important and illustrates their potential importance.
Through its impacts on the environment, agriculture can yield many economic benefits and costs that accrue to households and firms other than farmers. Table 5 illustrates some of these externalities, identifying some of the ways in which
Table 5. Illustration of Potential Positive and Negative Externalities of
Agriculture in Skagit County
Potential Positive Externalities Potential Negative Externalities
Commercial Demands
• Agriculture-related business opportunities
• Secondary business opportunities supported by agriculture-related business opportunities
• Groundwater recharge from infiltration of irrigation water
Commercial Demands
• Reduced supply of water and land available for other commercial uses
• Off-farm costs to cope with agriculture-related erosion and sediment
• Off-farm costs to remove agriculture-related nutrients and pollutants from water supplies
Quality-of-Life Demands
• Contributions to recreation:
o Opportunities for agri-tourism
o Opportunities for hunting and wildlife watching
• Contributions to communities:
o Agricultural contributions to economies
o Access to local food resources
o Traditional agricultural lifestyle
• Maintenance of agricultural open space and
scenic vistas
Quality-of-Life Demands
• Detriments for recreation:
o Reductions in water quality
• Detriments for communities:
o Reductions in water quality
o Reductions in wetlands and other natural resources
• Loss of natural open space and scenic vistas
Environmental-Value Demands
• Natural wetlands and man-made wetlands resulting from irrigation run-off
• Dam and levee related flood control
• Improved habitat for species, especially birds
Environmental-Value Demands
• Loss of wetlands
• Reduction in ability of floodplains to control floods
• Loss of natural habitats
• Degradation of water quality
• Threats of extinction for some species dependent on water and land diverted to agriculture
• Ecosystem fragmentation and loss of biodiversity
Source: ECONorthwest

ECONorthwest Economic Indicators of Agriculture in Skagit County 42
agriculture affects the competing demands for the county’s natural resources (see the discussion, above, in conjunction with Figure 1). The list demonstrates that agriculture can have both positive and negative externalities. Most of the externalities are familiar, at least in concept, but some warrant further explanation.
Quality of Life. Two positive externalities related to quality of life stand out. One that many county residents consider valuable materializes when agricultural land provides open space and improves the quality of life for nearby residents. The rise of regulatory and voluntary, market-based mechanisms to protect agriculture, such as agricultural zoning, transfer of development rights, conservation easements, and agricultural land trusts, indicate a broad public preference for maintaining undeveloped agricultural land and open space.43 No economic studies have been undertaken locally, but studies conducted elsewhere have found that the presence of rural open space and agricultural land can increase the demand for and, hence, the prices of nearby land and houses, and that people generally are willing to pay to protect farmland where they live.44
In addition, some Skagit County residents realize a benefit through the traditional agricultural lifestyles and landscapes they consider to have value, even though they do not live this lifestyle or manage lands to sustain this landscape.
Ecosystem Goods and Services. Table 6 provides insight into the potential, general magnitude of some of the ecosystem values that might be affected as farming activities in the county increase or decrease the supply of ecosystem goods and services. Most of the numbers in the table come from research conducted elsewhere and, hence, provide only a rough indication of the values applicable in Skagit County. Furthermore, these values likely will change over time. The authors of one study concluded, for example, that the economic values associated with outdoor recreation in the U.S., as a whole, are growing faster than inflation, with the value of an outdoor recreational activity-day growing by about $1.00 per year.45
43 Hellerstein, D., C. Nickerson, J. Cooper, et al. 2002. Farmland Protection: The Role of Public Preferences for Rural Amenities.” U.S. Department of Agriculture, Economic Research Service. October.; and U.S. Department of Agriculture, Economic Research Service. 2002. “Farmland Protection Programs: What Does the Public Want?” Agricultural Outlook. May.
44 See, for example, Bowker, J.M., and D.D. Didychuk. 1994. “Estimation of the Nonmarket Benefits of Agricultural Land Retention in Eastern Canada.” Agricultural and Resource Economics Review. 23:2. pp. 218-225.; Beasely, S., Workman, W., and N. Williams. 1986. “Estimating Amenity Values of Urban Fringe Farmland: A Contingent Valuation Approach.” Growth and Change. 17:4. pp. 70-78.; Ready, R., M. Berger, G. Blomquist. 1997. “Measuring Amenity Benefits from Farmland: Hedonic Pricing vs. Contingent Valuation.” Growth and Change. 28:4. pp. 438-458.
45 Rosenberger, R. and J. Loomis. 2001. Benefit Transfer of Outdoor Recreation Use Values (2000 Revision). Gen. Tech. Rep. RMRS-GTR-72. Fort Collins, Colorado, U.S. Department of Agriculture, Forest Service, Rocky Mountain Research Station, pp. 19-20.

ECONorthwest Economic Indicators of Agriculture in Skagit County 43
C. Economic Impacts (Jobs and Incomes) Associated
with Agriculture in Skagit County
Agriculture-related goods and services have economic importance not just for their economic value, but also for their economic impacts, i.e., their ability to generate jobs and income. Economic values and impacts are not the same thing. Something with a high value may generate few jobs and little income, and vice versa. In general, goods and services generate impacts when people spend money on them, and the expenditures course through the commercial sectors of the economy; this is what happens when land is used to grow crops. They also can have impacts by influencing household-location decisions that, in turn, influence business-investment decisions. Others have high environmental values, which
Table 6. Estimates of Economic Value for Some Ecosystem Goods and
Services That Agriculture Might Affect
Goods and Services Valued
Habitat for Sensitive Species ($ per household per year)
a
Spotted Owl $41–$138
Salmon $325
Freshwater Fish $243
Saltwater Fish $330
Recreation (Mean $ per person per day)b
Fishing $48
Waterfowl hunting $44
Wildlife watching $39
Amenity and Quality of Lifec
Increase in property value near suburban riparian greenways 10–15%
Source: ECONorthwest, with data from the indicated sources. Values shown illustrate the results of recent
studies, many of which were conducted elsewhere. To the extent Skagit County!s ecosystems potentially function at different levels and/or have different demand for their services, values might be higher or lower.
Notes: a This study presents a meta-analysis of studies that gauged people!s willingness to pay to protect sensitive
and endangered species. Richardson, L. and J. Loomis. 2009. “The Total Economic Value of Threatened,
Endangered, and Rare Species: An Updated Meta-Analysis.” Ecological Economics 68 (5). b Recreation values from a meta-analysis of recreation valuation studies. Values are for the Pacific Coast
Area. Rosenberger, R.S. and J.B. Loomis. 2001. Benefit Transfer of Outdoor Recreation Use Values: A
Technical Document Supporting the Forest Service Strategic Plan. GTR No. RMRS-GTR-72. Retrieved
September 23, 2010, from http://www.fs.fed.us/rm/pubs/rmrs_gtr72.html c This study reports the economic effect of riparian greenways on adjacent property values in suburban
communities in Vancouver B.C. and Vancouver Island. Citation: Quayle, M and S. Hamilton. 1999. Corridors
of Green and Gold: Impact of Riparian Suburban Greenways on Property Values. Department of Fisheries
and Oceans, Vancouver B.C. and University of British Columbia. April. Retrieved September 23, 2010, from
http://www.dfo-mpo.gc.ca/Library/241452.pdf d We converted values in the original studies to their equivalent in the dollars of 2010.

ECONorthwest Economic Indicators of Agriculture in Skagit County 44
can have indirect impacts by affecting the cost of living and doing business in a location and by stimulating voluntary or regulatory changes in behavior.
To describe the net economic impacts of agriculture we first examine jobs and incomes derived directly from agriculture in Skagit County and then we look at the potential impacts that derive from agriculture’s externalities, i.e., its consequences for other elements of the economy.
Agricultural Employment. Total employment across all sectors has risen steadily in Skagit County since 1969, while farm-related employment, which includes hired farm labor and farm proprietors whose primary occupation is working on the farm, has remained mostly unchanged. Figure 26 compares farm and non-farm employment in Skagit County between 1969 and 2007. It shows that the percent of total employment from farming has steadily decreased, as Skagit County’s economy has diversified. In 1969, farm employment represented about 11 percent of total employment, with 2,414 workers, but by 2007, while farms in Skagit County employed about the same number of people, 2,457, they represented less than 4 percent of all workers in Skagit County. This percentage remains higher than the percentage for the state as a whole, however. Since 1969, the ratio of farm-related employment to total employment state-wide has decreased from 4.6 percent to 1.8 percent in 2007. National statistics closely resemble the statewide trend.
Figure 26. Farm and Non-Farm Employment, 1969–2007
Source: ECONorthwest, with data from the U.S. Bureau of Economic Analysis, Regional Economic Accounts,
1969–2007
Figure 27 shows farm employment in greater detail, and indicates that fluctuations in total farm employment have been common over the last 40 years. Farm proprietorship—the number of people who own farms and count as the main employee on the farm—has declined, especially over the last decade. On the surface, this seems inconsistent with the rising trend in total number of farms in Skagit County. As we illustrate in Figure 11, however, the increase in farms

ECONorthwest Economic Indicators of Agriculture in Skagit County 45
has occurred primarily among small farms, a large number of which are owned by people whose primary occupation is in a non-farm-related business. People in this category would not be counted as farm proprietors in Figure 27.
Figure 27. Total Farm and Farm Proprietor Employment, 1969–2007
Source: ECONorthwest, with data from the U.S. Bureau of Economic Analysis, Regional Economic Accounts,
1969–2007
The downward trend over the last decade in farm proprietorship in Figure 27 indicates that, although more people own farms today than a decade ago in Skagit County, fewer count farming as their primary occupation. Data from the Agricultural Census confirm this: in 2007, 60 percent of the principal operators of Skagit County farms had a primary occupation other than farming. In previous years, the proportion was weighted towards farming as the primary occupation, as Figure 28 shows.
Figure 28. Primary Occupation of Principal Operator, 1987–2007
Source: ECONorthwest, with data from the U.S. Census of Agriculture, 1987–2007

ECONorthwest Economic Indicators of Agriculture in Skagit County 46
Agricultural Earnings. Section II, B, above, details the levels of gross and net income farmers received from marketing crops and livestock. Some of the money earned from these activities is passed through as employee wages and benefits. Farm earnings in Skagit County represent about 3 percent of total earnings from all industries in the county. Earnings in the agricultural sector have remained relatively constant, in inflation-adjusted dollars, over the last 40 years, as Figure 29 shows.
Figure 29. Farm and Non-Farm Earnings, 1969–2007, in 2010 Dollars
Source: ECONorthwest, with data from the U.S. Bureau of Economic Analysis, Regional Economic Accounts,
1969–2007
Figure 30 illustrates farm earnings in more detail between 1969 and 2007, in inflation-adjusted 2010 dollars. The graph shows that total farm earnings in 2007 are equivalent to what they were in the mid 1980s and the early 1970s, about $70 million in 2010 dollars.
Figure 30. Farm Earnings, 1969–2007, in 2010 Dollars
Source: ECONorthwest, with data from the U.S. Bureau of Economic Analysis, Regional Economic Accounts,
1969–2007
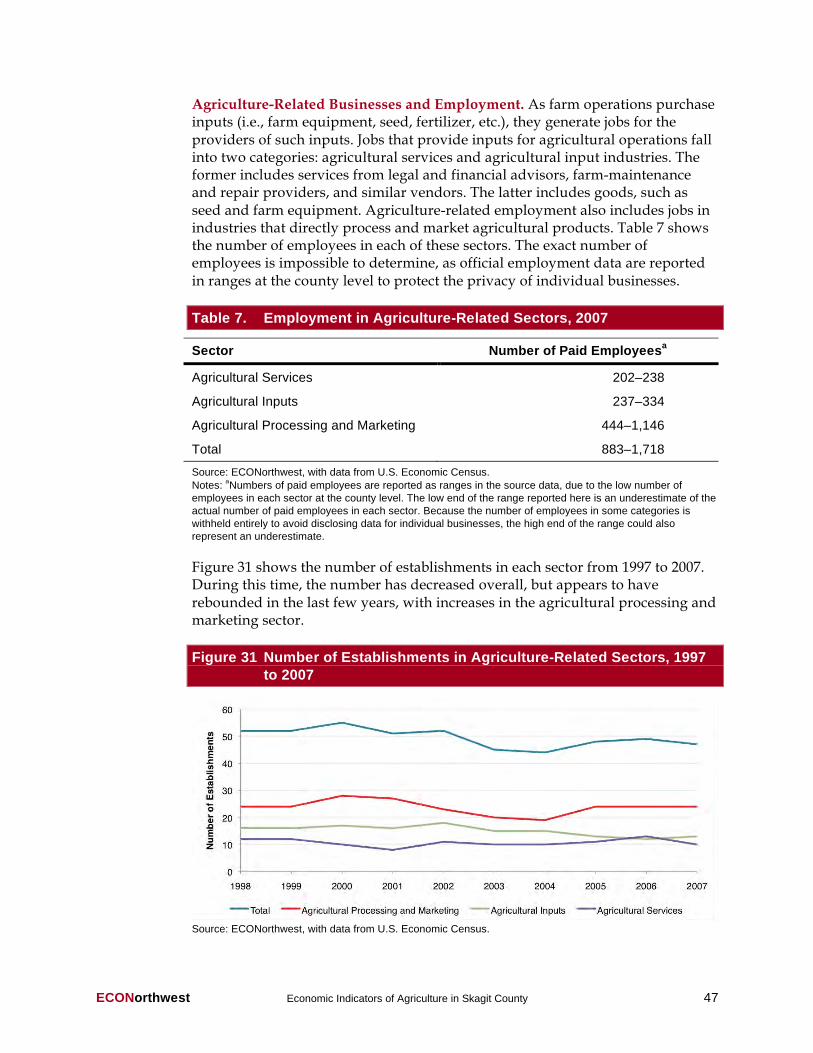
ECONorthwest Economic Indicators of Agriculture in Skagit County 47
Agriculture-Related Businesses and Employment. As farm operations purchase inputs (i.e., farm equipment, seed, fertilizer, etc.), they generate jobs for the providers of such inputs. Jobs that provide inputs for agricultural operations fall into two categories: agricultural services and agricultural input industries. The former includes services from legal and financial advisors, farm-maintenance and repair providers, and similar vendors. The latter includes goods, such as seed and farm equipment. Agriculture-related employment also includes jobs in industries that directly process and market agricultural products. Table 7 shows the number of employees in each of these sectors. The exact number of employees is impossible to determine, as official employment data are reported in ranges at the county level to protect the privacy of individual businesses.
Table 7. Employment in Agriculture-Related Sectors, 2007
Sector Number of Paid Employeesa
Agricultural Services 202–238
Agricultural Inputs 237–334
Agricultural Processing and Marketing 444–1,146
Total 883–1,718
Source: ECONorthwest, with data from U.S. Economic Census.
Notes: aNumbers of paid employees are reported as ranges in the source data, due to the low number of
employees in each sector at the county level. The low end of the range reported here is an underestimate of the
actual number of paid employees in each sector. Because the number of employees in some categories is
withheld entirely to avoid disclosing data for individual businesses, the high end of the range could also
represent an underestimate.
Figure 31 shows the number of establishments in each sector from 1997 to 2007. During this time, the number has decreased overall, but appears to have rebounded in the last few years, with increases in the agricultural processing and marketing sector.
Figure 31 Number of Establishments in Agriculture-Related Sectors, 1997
to 2007
Source: ECONorthwest, with data from U.S. Economic Census.

ECONorthwest Economic Indicators of Agriculture in Skagit County 48
D. Financial Flows Associated with Agriculture in Skagit
County
Agricultural land contributes tax revenues to the county, and, in return, receives services, such as transportation infrastructure, law enforcement, and noxious weed control, provided by the county. Taxes are assessed on the value of the real property (land and buildings) owned by agricultural operations, as determined by the county assessor. In 2009, land and buildings classified in agricultural use in Skagit County,46 about 95,000 acres, had an assessed market value of about $1 billion. Figure 32 shows the average market value of land and buildings per acre, in Washington and Skagit County, as reported in the U.S. Census of Agriculture. It shows the average value has increased over the last twenty years. The data underlying Figure 32 have not been adjusted for inflation, because of the difficulty with differentiating between the component of value associated with agricultural production and the component associated with housing and non-agricultural activities.
Figure 32. Average Market Value of Land and Buildings in Farms, per Acre
in Skagit County and Washington State, 1987 to 2007
Source: ECONorthwest, with data from U.S. Census of Agriculture, 1987–2007.
Some studies show that the tax revenues generated by agricultural activities and property are greater than the cost of the services they demand from local government. For 1997, for example, the American Farmland Trust found that, for every dollar that farm, forest, and open land contributes to Skagit County in taxes, the county provides these lands with services costing fifty-one cents.47 This calculation contrasts with those for residential and commercial development, which shows that, together, they consume services that cost more than what they
46 Property categorized as “Agriculture, Non-Classified Open Space,” “Open Space Farm and Ag,” and “Agriculture Related Activities.”
47 American Farmland Trust. 1999. Cost of Community Services: Skagit County, Washington.
ECONorthwest Economic Indicators of Agriculture in Skagit County 49
contribute in tax revenue. The study’s authors point out that their calculations do not capture all the financial flows associated with different types of land uses and, hence, one should interpret their findings carefully. The net fiscal contribution from farmlands, alone, probably differs from the average for all farm, forest, and open lands, for example, and the net fiscal impacts of new development can differ markedly from current averages.
These limitations notwithstanding, the findings from this study, together with those presented earlier, reinforce a central characteristic of the relationship between agriculture and the rest of the county’s economy: each depends on and derives strength from the other. Previous sections show, for example, that having commercial development nearby is essential for most farm families, who depend on off-farm jobs for much, if not most of their annual income. Commercial development also provides farmers with nearby sources of farm equipment and other inputs, while nearby residential development provides farm labor. Together, residential and commercial development provides farm families and corporations with a wide range of services, such as those provided by doctors, lawyers, restaurants, and shopping centers. Agriculture’s net fiscal contribution to the county is but one piece of these interdependencies.
E. Uncertainty and Risk Associated with Agriculture in
Skagit County
Elements of uncertainty and risk surround the future of agricultural sustainability in Skagit County. These elements are both external and internal to the agricultural sector, and we discuss many of them above. Among the external sources of uncertainty and risk are uncertainties in national and international market conditions for agricultural inputs and products,48 climate change and potential sea level rise, population growth, and regulatory pressures from the state and federal government for clean water and endangered species protections. Internal sources of uncertainty include changes in the availability of local processors, the shifting demographics of farm operators, and the decisions of individual farmers about whether to maintain production or sell land to buyers willing to pay more than agricultural production can support. The short- and long-term trends in these, and other factors, are likely to influence the sustainability of agricultural in Skagit County. Decision-makers can recognize how these factors are likely to influence agriculture in Skagit County, and may be able to control some of them, but others will remain largely out of the reach of local policy actions.
48 Future prices for agricultural products likely will vary, perhaps wildly, in response to changes in climate, global economic conditions, and other factors. These changes likely will not have a uniform impact on farmers in Skagit County relative to farmers elsewhere, or on all farmers in the county. If the county’s farmers experience sustained increases in the prices they receive for their products, relative to general inflation, then their importance to the county’s economy, all else equal, will increase. Conversely, if farm prices decline, then agriculture’s importance will decrease, all else equal.

ECONorthwest Economic Indicators of Agriculture in Skagit County 50
F. Distribution of Economic Consequences of
Agriculture in Skagit County
A description of the net economic benefits and impacts is not complete unless it addresses the distribution of effects among different groups. Table 5, above, illustrates the potential positive and negative externalities of agriculture in Skagit County. These externalities represent benefits and costs borne by people other than farm operators, and suggest that the people who enjoy the benefits of sustaining agriculture in Skagit County aren’t always the same people who bear the costs of sustaining agricultural production. Any action that addresses natural resource use or allocation in Skagit County will produce winners and losers. Whether one is a winner or a loser will, of course, affect one’s assessment of the immediate economic importance of sustaining agriculture in Skagit County. Sometimes, though, the distribution has broader consequences. Decisions that impose costs on an already disadvantaged group, for example, might be widely seen in a negative light not just by those in that group but by others as well. Past experience indicates that these concerns may be important:
• Differential consequences for rural and urban residents, with one group incurring costs to benefit the other.
• Benefits accruing primarily to households with high levels of wealth and income, and costs accruing to households with low levels of wealth and income.
• The gross and net benefits and impacts accruing to tribal members.
• Activities that lower the ability of the county’s land and other natural resources to contribute to the well-being of future generations.
ECONorthwest Economic Indicators of Agriculture in Skagit County 51
III. CHARACTERISTICS OF COMPETING DEMANDS FOR LAND
AND OTHER RESOURCES
The resources utilized by Skagit County agriculture also have the potential to contribute to other socially-beneficial uses, primarily residential and commercial development and the maintenance of ecosystem health. Natural resources, such as land and water, are limiting factors for goals of increased housing, commercial services, and improved habitat quantity and quality. Competition for resources currently serving agriculture comes in the form of both market and regulatory forces across two primary competing demands: residential and commercial development and environmental restoration and protection.
A. Demands from Residential and Commercial
Development
Private residential and commercial developers are often willing buyers of agricultural land, often at prices higher than other farmers are willing to pay for the land. The map in Figure 33 shows the average value per acre by parcel of land the county assessor has classified as in agricultural use.
Under Washington’s tax rules, agricultural land can be valued at a level equivalent to its current use, rather than its fair market value. In Skagit County, 2,618 agricultural, timber, and open space lands covering 105,475 acres were enrolled so that their value, for tax purposes, would be determined by their current agricultural use in 2008. The differential for current use value to the true and fair market value for all land, including agriculture, timber, and open space, in Skagit County was 3.8 in 2008. In other words, the fair market value for these land classifications was almost 4 times higher than the value the Washington Department of Revenue assigns to the current use of the property. Skagit County’s differential is similar to that for the state as a whole, which was 3.9 in 2008, but lower than for surrounding counties. In 2008, Whatcom County’s differential was 6.4 and Snohomish County’s was 5.8, which suggests that the demand to convert land from agricultural use to residential and commercial development is even greater to the south and north of Skagit County.49
These data suggest that the market for residential and commercial land in Skagit County is exerting upward pressure on the value of agricultural land, in some cases beyond where it may make financial sense, from the owner’s perspective, to maintain it as an input to agricultural production.
49 Washington Department of Revenue. 2009. “Table 19: 2008 Valuation of Current Use Land by County Agricultural, Timber, and Open Space Lands Approved for their Current Use Assessment.” Property Tax Statistics 2009. September. Revised February 22, 2010. Retrieved April 6, 2010, from http://dor.wa.gov/Content/AboutUs/StatisticsAndReports/2009/Property_Tax_Statistics_2009/default.aspx
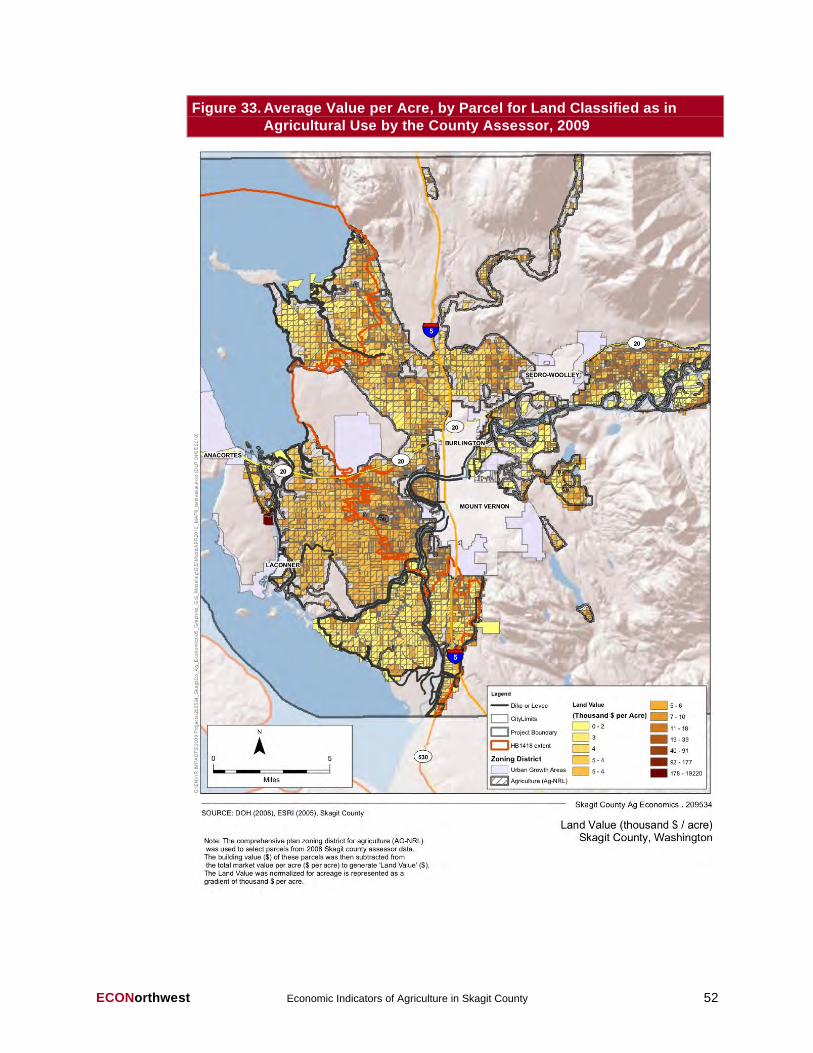
ECONorthwest Economic Indicators of Agriculture in Skagit County 52
Figure 33. Average Value per Acre, by Parcel for Land Classified as in
Agricultural Use by the County Assessor, 2009
ECONorthwest Economic Indicators of Agriculture in Skagit County 53
B. Demands from Environmental Restoration and
Protection
Changes in ecosystem conditions, and increasing public interest and understanding of the goods and services ecosystem provide are driving demand for environmental restoration and protection in Skagit County. Recent studies show the health of the entire Puget Sound ecosystem is in decline, and current land use practices are, in part, driving this change.50 Loss of wetland and estuarine habitat, declining salmon stocks, and degraded water quality have all received attention from state and federal regulators and environmental conservation groups. Actions to reverse the current trends likely will affect existing land uses and management practices in the county.
Salmon Protection. In response to declines in salmon populations in the Puget Sound region, the state and federal governments have designated several salmon populations as threatened or species of concern. In 2002, the status of the Chinook salmon in the Skagit River remained depressed.51 Reductions in salmon populations diminish the economic well-being of those who have cultural, spiritual, recreational, or commercial demands for salmon. They also diminish the well-being of those who desire to sustain the existence of salmon and their habitat for future generations.
We discuss the value of recreational fishing above, in the context of ways agriculture may increase access to fishing sites and thereby enhance the value of an experience, while at the same time, earning income from recreational anglers. Agriculture interacts with the value associated with salmon populations in other ways, by affecting—positively or negatively—stream conditions and the quality of salmon habitat. Depending on the direction of these effects, agriculture may increase or reduce regulatory costs associated with managing salmon populations, and increase or reduce the value associated with salmon. Salmon generate economic value through the commercial and tribal salmon harvests, through recreational fishing, and through their very existence. Because the health and fate of salmon populations are intertwined with the sense of place and perceived health of the entire Pacific Northwest region, people in the Pacific Northwest and elsewhere derive value from knowing that salmon exist, whether or not they ever enjoy eating fish, fishing, or watching spawning salmon return to their natal streams.
There are insufficient data to reliably estimate the full value of sustaining salmon populations in the Skagit and Samish Rivers. A 2003 study quantified the value
50 Puget Sound Partnership. 2010. 2009 State of the Sound. January. Retrieved March 31, 2010, from http://www.psp.wa.gov/downloads/SOS09/09-04534-000_State_of_the_Sound-1.pdf
51 Washington Department of Fish and Wildlife. No date. Salmonid Stock Inventory: WRIA 03–Lower Skagit. Retrieved April 6, 2010, from http://wdfw.wa.gov/cgi-bin/database/ sasi_search_new_db.cgi?keyword=03&field=4&search_sort=sort&srchtype=within&job=search&wria=wria
ECONorthwest Economic Indicators of Agriculture in Skagit County 54
of Skagit and Samish River salmon to commercial and tribal fisheries at about $1.6 million (in 2010 dollars) in the late 1990s.52 The 2003 study similarly quantified the expenditures associated with the marine and freshwater recreational salmon fishery at over $3 million (in 2010 dollars). This value does not include the net benefits (the difference between what anglers are willing to pay to fish and what they actually pay to fish) associated with the recreational fishing experience—a value economists have estimated to be, on average, about $41 per angler per day.
In addition to these market values and use values of the Skagit and Samish River salmon populations, people also place existence, or passive use values on the salmon’s continued existence. No studies have estimated the value of preserving the salmon populations in the Skagit River, but studies of avoiding the extinction of salmon in other river systems in Washington show that the value is not trivial.53 One study found the passive use value associated with a doubling of migratory fish populations in western Washington and Puget Sound from the levels that existed in 1999 was about $350 household per year (in 2010 dollars).54 Another study of dam removal on the Elwha River found the passive use value associated with restoring salmon to the river was $95 per household per year (in 2010 dollars).55 The Confederated Tribes of the Umatilla Reservation, and other tribal groups throughout the Pacific Northwest that depend on viable salmon runs to exercise their reserved right to fish, believe the traditional, cultural, and religious nature of the salmon makes its value to the tribe immeasurable.
Other Recreational Opportunities. Other recreational uses of the natural resources in Skagit County, such as hunting and wildlife watching, can benefit from agriculture as we describe in Section II. Agricultural also can adversely impact these activities, if it reduces water quality, habitat, or food sources that wildlife depends on. To the extent that agriculture diminishes the quality or quantity of these recreational opportunities, it may impose costs on recreational users and the businesses in Skagit County that earn revenue from them.
Wetland and Estuarine Restoration. Wetlands can provide especially important goods and services. Some agricultural policies provide incentives for farmers to restore wetlands that have been lost to agricultural production over the last century. Table 8 illustrates the goods and services wetlands provide. Skagit
52 Skagit County, Planning and Permit Center. 2003. Draft Programmatic Environmental Impact Statement: Development of a Critical Areas Ordinance for Application to Designated Agricultural Natural Resource Lands (Ag-NRL) and Rural Resource National Resource Lands (RRc-NRL) Engaged in Ongoing Agricultural Activity. Volume 2 (Technical Appendices). February.
53 Loomis, J. 1999. Passive Use Values of Wild Salmon and Free-Flowing Rivers. Retrieved April 6, 2010, from http://www.nww.usace.army.mil/lsr/REPORTS/misc_reports/passive.htm.
54 Layton, D., G. Brown, and M. Plummer. 1999. Valuing Multiple Programs to Improve Fish Populations. Washington State Department of Ecology. April.
55 Loomis, J. 1996. “Measuring the Economic Benefits of Removing Dams and Restoring the Elwha River: Results of a Contingent Valuation Survey.” Water Resources Research 32(2): 441-447.
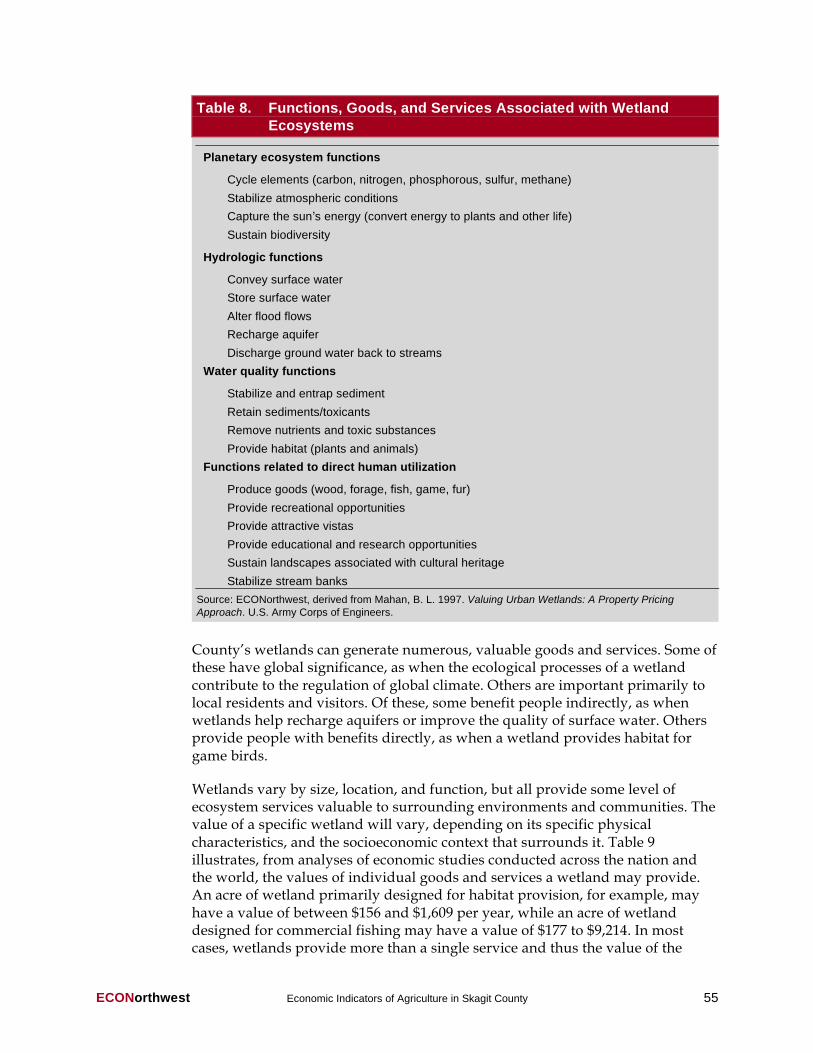
ECONorthwest Economic Indicators of Agriculture in Skagit County 55
County’s wetlands can generate numerous, valuable goods and services. Some of these have global significance, as when the ecological processes of a wetland contribute to the regulation of global climate. Others are important primarily to local residents and visitors. Of these, some benefit people indirectly, as when wetlands help recharge aquifers or improve the quality of surface water. Others provide people with benefits directly, as when a wetland provides habitat for game birds.
Wetlands vary by size, location, and function, but all provide some level of ecosystem services valuable to surrounding environments and communities. The value of a specific wetland will vary, depending on its specific physical characteristics, and the socioeconomic context that surrounds it. Table 9 illustrates, from analyses of economic studies conducted across the nation and the world, the values of individual goods and services a wetland may provide. An acre of wetland primarily designed for habitat provision, for example, may have a value of between $156 and $1,609 per year, while an acre of wetland designed for commercial fishing may have a value of $177 to $9,214. In most cases, wetlands provide more than a single service and thus the value of the
Table 8. Functions, Goods, and Services Associated with Wetland
Ecosystems
Planetary ecosystem functions
Cycle elements (carbon, nitrogen, phosphorous, sulfur, methane)
Stabilize atmospheric conditions
Capture the sun!s energy (convert energy to plants and other life)
Sustain biodiversity
Hydrologic functions
Convey surface water
Store surface water
Alter flood flows
Recharge aquifer
Discharge ground water back to streams
Water quality functions
Stabilize and entrap sediment
Retain sediments/toxicants
Remove nutrients and toxic substances
Provide habitat (plants and animals)
Functions related to direct human utilization
Produce goods (wood, forage, fish, game, fur)
Provide recreational opportunities
Provide attractive vistas
Provide educational and research opportunities
Sustain landscapes associated with cultural heritage
Stabilize stream banks
Source: ECONorthwest, derived from Mahan, B. L. 1997. Valuing Urban Wetlands: A Property Pricing
Approach. U.S. Army Corps of Engineers.

ECONorthwest Economic Indicators of Agriculture in Skagit County 56
services provided by a specific, multi-service wetland likely is higher than the value attributable to a single wetland. The individual values shown in Table 9, however, are not necessarily additive.
The range of values associated with the ecosystem services wetlands provide is large. A 2008 study linked past wetland valuation studies with the ecological productivity of those areas. The study found that the services provided by wetlands in highly productive environments (about $14,050 per acre per year)
Table 9. Illustrative Values of Goods and Services Provided by Wetland
Habitat ($/Acre/Year)
Woodward and Wui 2001 Mean Value Range of Values
Flood $645 $146–$2,865
Water Quality $684 $207–$2,260
Water Quantity $208 $10–$4,216
Recreational Fishing $585 $156–$2,201
Commercial Fishing $1,276 $177–$9,214
Bird Hunting $115 $41–$323
Bird Watching $1,988 $866–$4,562
Amenity $5 $2–$23
Habitat $502 $156–$1,609
Storm $389 $18–$8,433
Heimlich et al 1998 Mean Value Range of Values
Fish and Shellfish Support $9,382 $11–$67,210
Fur Bearing Animals $210 $20–$399
General-Nonusers $127,233 $176–$531,748
General-Users $3,843 $161–$15,084
Fishing-Users $10,054 $145–$44,133
Hunting-Users $1,559 $28–$4,745
Recreation-Users $1,743 $139–$6,559
Ecological Functions $49,188 $1,836–$1,521
Amenity/Cultural $4,165 $127–$15,162
Source: Woodward, R., and Y. Wui. 2001. “The Economic Value of Wetland Services: A Meta-Analysis”.
Ecological Economics.. 37: 257-270; Heimlich, R., K. Wiebe, R. Claassen, D. Gadbsy, and R. House. 1998.
Wetlands and Agriculture: Private Interests and Public Benefits. U.S. Department of Agriculture. Agricultural
Economic Report No. 765.

ECONorthwest Economic Indicators of Agriculture in Skagit County 57
were more valuable than the services provided by wetlands in environments with low productivity (about $2,720).56
To our knowledge, no studies have estimated the economic value of the goods and services produced by wetlands in Skagit County. Studies elsewhere, however, have documented the values of some goods and services. A study conducted in Lynnwood and Renton, Washington, for example, examined the value of increasing the storage capacity of existing wetlands. It found, using the costs of projects intended to duplicate wetlands services to represent the value of wetland services, that the annualized value of the services provided by the wetlands is between $500 and $2,700 per acre per year (in 2010 dollars).57
Several studies have estimated the savings communities have realized by being able to rely on wetlands and riparian ecosystems to provide some services rather than having to invest in alternatives, such as water-treatment facilities. Table 10
56 Ingraham, M. and S. Foster. 2008. “The Value of Ecosystem Services Provided by the U.S. National Wildlife Refuge System in the Contiguous U.S”. Ecological Economics. 67:608-618.
Table 10. Economic Benefits from Wetlands and Riparian Areas
Economic Benefit Derived from Wetlands
and Riparian Areas
Estimated Amount
Loss of wetlands increased dredging costs downstream. (California)
$2.8 million one-time capital cost
Loss of swamp lands and their ability to cleanse surface water increased water-treatment costs. (South Carolina)
$5 million one-time capital cost
Loss of wetlands and their ability to cleanse surface water
caused a community to incur additional sewer-system costs.
(Pennsylvania)
$1.5 million one-time capital cost
Loss of wetlands and their ability to store water causes
communities to build additional storage facilities. (Minnesota)
$1.5 million per year for 5,000 acres of
wetlands lost each year.
Preserving wetlands, and their ability to absorb floodwater,
allowed communities to avoid building dams. (Massachusetts)
$10 million purchase of wetlands
offset $100 million cost of dams.
Restoration of vegetation on streamside lands, and their
ability to absorb floodwater, allowed communities to avoid costs of stormwater-control facilities. (Kansas)
$600,000 cost of restoration precluded
$120 million cost of stormwater facilities.
Protection and restoration of riparian vegetation enabled a
community to avoid costs of dredging and wastewater treatment. (Oregon)
$660,000 annual restoration cost
precluded $1.6 million annual cost.
Improvement of riparian vegetation reduced stream sediment
and water-treatment costs, and improved agricultural production. (Ohio)
$2.7 million per year in reduced water
treatment costs.
Source: ECONorthwest, adapted from U.S. Environmental Protection Agency. 2005. National Management
Measures to Protect and Restore Wetlands and Riparian Areas for the Abatement of Nonpoint Source
Pollution. Office of Water. EPA 841-B-05-003. July. Retrieved April 6, 2010, from http://www.epa.gov/nps/
wetmeasures/.

ECONorthwest Economic Indicators of Agriculture in Skagit County 58
summarizes the findings of some of these studies, as reported by the U.S. Environmental Protection Agency. These findings indicate that, in some settings at least, communities can reap substantial savings from having a healthy ecosystem capable of providing services, even though the value of these services generally goes unnoticed. We presume that these findings apply generally in Skagit County, but going beyond this general observation would require additional study.
Water Quality. Skagit County has established water quality standards to improve pollution levels for three pollutants: total phosphorus, fecal coliform, and temperature. Several waterbodies throughout the county exceed current standards, including Campbell Lake (total phosphorus), Erie Lake (total phosphorus), the Samish Watershed (fecal coliform), the Skagit River Basin (fecal coliform), and the Skagit River tributaries (temperature).58 In 2009, the Skagit County Monitoring Program, which conducts an annual water quality assessment similar to that of the Department of Ecology, identified significant trends in the County’s water quality. Of those trends, 100 represent improved conditions and 32 represent deleterious conditions. Of the deleterious trends the County reported, most were due to increased nutrient concentrations, which can cause algal blooms that disrupt normal ecosystem function, and high ammonia concentrations.59
57 Leschine, T., K. Wellman, and T. Green. 1997. The Economic Value of Wetlands: Wetlands’ Role in Flood Protection in Western Washington. Washington State Department of Ecology. October.
58 Washington State Department of Ecology. 2010. Water Quality Improvement Projects for Skagit County. Retrieved on May 4, 2010, from http://www.ecy.wa.gov/programs/wq/tmdl/TMDLsbyCounty/skagit.html.
59 Skagit County Public Works. 2009. Skagit County Monitoring Program: Annual Report – 2008 Water Year (October 2007 – September 2008). Retrieved on May 4, 2010, from http://www.skagitcounty.net/Common/Asp/Default.asp?d=PublicWorksSurfaceWaterManagement&c=General&p=WQ.htm.
ECONorthwest Economic Indicators of Agriculture in Skagit County 59
IV. ECONOMIC INDICATORS OF AGRICULTURE!S
SUSTAINABILITY IN SKAGIT COUNTY
In Table 11, we present a list of indicators of agricultural sustainability that we recommend Skagit County consider incorporating into its current and future efforts to monitor the sustainability of agriculture in the county and support decisions about reinforcing agriculture’s sustainability. Our recommendation is built on the framework and analysis of agriculture in Skagit County we present in the preceding sections. The indicators fall into three categories:
• The strength of agriculture-related demands for land and other natural resources.
• The strength of competing demands for these resources.
• Policies to enhance the sustainability of agriculture.
For each of these purposes, we consider indicators that reflect conditions and trends in the aggregate and, where appropriate data exist, across the landscape. We also consider indicators based on data that can be directly incorporated into, or are already available in the Envision model.
A. Indicators of Agriculture !s Strength
The data presented above, in Section II, provide a number of indicators that align with the economic factors identified as likely related to agriculture’s sustainability in Skagit County. The indicators generally apply to the county as a whole, though the underlying data for indicators in bold show variations across the county’s landscape. The sign next to each indicator denotes whether the indicator in general has a positive (+) or negative (-) relationship with agriculture’s sustainability, or can have a positive relationship at some values and a negative relationship at others (+/-). For example, too low of densities of farmers can be detrimental, but too high of densities can cause crowding problems.
1. Income
Income, while not the only factor influencing decisions and forces affecting the sustainability of agriculture in Skagit County, is arguably the most crucial. Farmers must derive sufficient income from the land to continue using land for farming rather than for other purposes. No single variable supported by available data fully captures this relationship, so we identify these several variables to provide distinct insights into trends in farmer’s income.
Total Farm Net Income +
Average Net Income/Acre in Farms +
Average Net Income/Farm +
Share of Farms with Positive Net Income +

ECONorthwest Economic Indicators of Agriculture in Skagit County 60
Average Market Value/Acre in Farms +
2. Resource Productivity and Availability
Agriculture depends on access to land and water resources, and on the productivity of those resources. Both the quantity and quality of resources are significant, but data generally are lacking for quality. Data also are lacking for actions taken by farmers to improve efficiency, such as resource conservation, improved tilling, crop rotations, nutrient management, and weed and pest management. There is not a clear prioritization of lands in terms of importance to agricultural sustainability, but the rental rates and crop values associated with lands in the Skagit River Delta relative to lands upriver support the widespread belief that lands in the Delta have greater importance for the county’s sustainability goals.
Total Acres in Agriculture +
Total Acres in Production +
Percent of County in Agriculture +
Acres in agriculture west of I-5 +
3. Demand
Forces that are external to Skagit County play important roles for determining income levels, crop type, and local value-added.
Rate of Change of Agricultural Prices +/-
Share of Agricultural Land Not in Crop Production -
4. Costs
The higher are its production costs, the lower will be the sustainability of agriculture in Skagit County, all else equal. Costs can influence net earnings as well as crop selection, timing of operations, and input mix selection, such as tradeoffs between capital equipment and labor.
Total Cost of Production/Acre in Production -
Labor Costs -
5. Infrastructure
The riparian and coastal geography of Skagit County’s agriculture, combined with the rainfall and streamflow patterns, put high importance on dikes, levees, and drainage. The status of this infrastructure affects the amount and productivity of agricultural lands in the lower portions of the county.
Acres of Agricultural Land Protected by Levees and Dikes +
6. Industry Organization
The relationships among the number of farms, size of farms, and overall sustainability of agriculture in Skagit County remain unclear. Nonetheless, it

ECONorthwest Economic Indicators of Agriculture in Skagit County 61
seems important to monitor these variables to see if significant changes occur, which may serve as warning signs. In general, greater numbers of farms and larger farms mean greater acreage and revenues, although tradeoffs between the two can have mixed implications. Small farms are correlated with hobby and residential use of agricultural areas, and reduced revenue generation in the agriculture sector.
Number of Farms +
Average Farm Size +
Share of Farms Greater than 50 Acres +
7. Quality of life
Quality of life is difficult to measure. A general indication of changes in quality of life may be revealed by trends in the relationship between farm and non-farm income, which demonstrate the relevance of non-income factors to decisions that maintain agriculture. Affordability of the lifestyle can contribute to the ability to appreciate quality of life benefits, particularly in terms of housing costs.
Ratio of Cost of Housing to Farm Income -
Number of Farm Operators +
Ratio of Average Farm Worker Income to Average Non-Farm Worker Income –
B. Indicators for Competing Demands
1. Competition for Land and Water
Population growth and urban development in the county fuel competition for land and water resources.
Average Value of Residential Land/Acre -
Average Value of Commercial Land/Acre -
Ratio of Value of Agricultural Land/Value of Residential Land +
Ratio of Value of Agricultural Land/Value of Commercial and Industrial Land +
Population Density on Lands Zoned Ag-NRL +/-
Population Density Inside the Urban Growth Boundary +/-
2. Regulatory Constraints
Given the environmental importance of the Skagit River watershed and estuary, interests within the county and beyond have significant demands for enhanced environmental quality and ecosystem productivity of natural resources and ecosystem services in the agricultural zone of Skagit County. If environmental conditions degrade, this pressure will increase, all else equal. To the extent that agriculture is compatible with and supportive of ecosystem services, particularly in comparison to more intensive development uses, these groups can potentially be cooperators rather than competitors.

ECONorthwest Economic Indicators of Agriculture in Skagit County 62
Water Bodies Out of TMDL Attainment +/-
Salmon Production +/-
Number of Endangered Species -
Acres of Estuary Habitat +/-
C. Indicators for Policy Options
As farmers increase their production of consumption amenities, such as recreational opportunities and fish and wildlife habitat, they broaden the base of households with an interest in keeping the lands in agricultural production rather than converting them to urban uses. If farmers take actions that lead to reduced regulatory constraints, and increase their net earnings by using land and water resources to produce environmental amenities, they probably will be less likely to seek to convert their lands to urban uses.
Payments to Farmers for Conservation Activities +
Earnings from Recreation and Tourism +
D. Recommendations
Some of the variables listed in the previous section are better than others as indicators of agriculture’s sustainability in the county. In Table 11 we highlight, in bold-italic, those we believe will best serve the county’s objectives with respect to having an early-warning system for identifying potential threats to sustainability, and for evaluating policies and programs for enhancing sustainability. The highlighted indicators cover many of the factors that likely will influence agricultural sustainability in the future. Where feasible, we have included spatial indicators able to discern patterns and trends across the county’s landscape.
We base our recommendations on our review of the availability and quality of relevant data, our understanding of the factors driving the viability of agriculture in Skagit County, and our sensitivity to the applications of the data. In general, we find that the existing data do not provide a sound, timely basis for monitoring important factors likely to influence the sustainability of the county’s agricultural sector. If the county desires to fill this gap, it likely will have to collect new data, without waiting for the Census Bureau or others to do so. Many familiar with the sector believe the best approach would be to conduct an annual survey of farmers, gathering information about their purchases, sales, net farm income, opportunities, and constraints. Other communities have considered conducting such surveys and found they could not justify the cost, develop a survey methodology that would yield reliable, unbiased information, or both. This is in part due to the fact that farmers do not wish to reveal their internal level of profitability. If the county proceeds in this manner, we strongly recommend that it take all appropriate steps to ensure that it compiles reliable, useful information.

ECONorthwest Economic Indicators of Agriculture in Skagit County 63
We emphasize that the purpose of this report is not to provide a full analysis of alternative policies Skagit County might consider for accomplishing it agriculture-related objectives. Instead, it provides and overview of the roles agriculture plays in the county’s economy and assesses some indicators the county might consider as it monitors the sustainability of agricultural activities. Hence, this list of indicators constitutes only the beginning, not the end, of an effort to monitor and make meaningful decisions regarding the county’s progress in meeting its objectives for sustaining agriculture sector. We recommend the county continue its efforts to improve the indicators, both individually and as a set.

ECONorthwest Economic Indicators of Agriculture in Skagit County 64
Table 11. Recommended Indicators of Agriculture!s Sustainability in Skagit County
Indicator Description Spatial Basis
Data Source(s) Data Availability
INDICATORS OF AGRICULTURE!S STRENGTH
1. INCOME
Total Farm Net
Income
The total net farm income for all farms in Skagit County is the
net income (total cash receipts and other income less total
production expenses) that is received by the sole
proprietorships, partnerships, and corporations that operate farms in Skagit County.
No BEA, Net Farm Income (including
corporate farms and proprietors)
Annual
Average Net
Income/Acre in Farms
The average net income per acre in farms in Skagit County is the net
income (total cash receipts and other income less total production
expenses) that is received by the sole proprietorships, partnerships,
and corporations that operate farms in Skagit County, divided by the number of acres in farms in Skagit County.
No BEA, Net Farm Income (including corporate farms)
U.S. Census of Ag, Number of Acres in Farms
Annual
Every 5 years
Average Net Income/Farm
The average net farm income per farm in Skagit County is the net
income (total cash receipts and other income less total production
expenses) that is received by the sole proprietorships, partnerships,
and corporations that operate farms in Skagit County, divided by the
number of farms in Skagit County. A “farm” is defined as any place
from which $1,000 or more of agricultural products were produced and sold.
No BEA, Net Farm Income (including corporate farms)
U.S. Census of Ag, Number of Farms
Annual
Every 5 years
Share of Farms with Positive Net Income
The percent of farms with net gains (including operations that broke
even). Net cash farm income is total sales, government payments, and other farm-related income less farm expenses.
No U.S. Census of Ag, Average per farm for Farms with net gains
Every 5 years
Average Market
Value/Acre in Farms
The average market value per acre of land in farms is the market
value of land and buildings that are part of farm operations
divided by the number of acres of land in farms.
Yes (2 options) 1. U.S. Census of Ag,
Estimated market value of land and buildings, average per farm
2. Skagit County Assessor, total
market value of agricultural
properties divided by acres in
agricultural properties from Assessor
Every 5 Years
Annual

ECONorthwest Economic Indicators of Agriculture in Skagit County 65
Indicator Description Spatial
Basis
Data Source(s) Data
Availability
2. RESOURCE PRODUCTIVITY
Total Acres in Agriculture
The total acres in agriculture in Skagit County is the number of
acres in farms, as defined by the U.S. Census of Agriculture. The
land in farms consists primarily of agricultural land used for
crops, pasture, or grazing. It also includes woodland and
wasteland not actually under cultivation or used for pasture or
grazing, provided it was part of the farm operator!s total operation.
Yes (2 Options) 1. U.S. Census of
Agriculture, Number of Acres in Farms
2. Skagit County Assessor, Number of Acres Zoned in Ag-NRL
Every 5
years
Annual
Total Acres in Production
The total acres in production in Skagit County is the number of acres
in cropland, including harvested land, land used only for pasture and
grazing, land in cultivated summer fallow, cropland on which all crops
failed, and cropland used for cover crops or soil improvement, but not harvested or pastured or grazed.
Yes U.S. Census of Agriculture, Total Number of Acres of Cropland
Every 5 years
Percent of County in Agriculture
The area the county in agriculture is defined as the number of acres
in farms (land in farms consists primarily of agricultural land used for
crops, pasture, or grazing. It also includes woodland and wasteland
not actually under cultivation or used for pasture or grazing, provided
it was part of the farm operator!s total operation) divided by the total area of the county (1,288,229 acres).
Yes (2 Options) 1. U.S. Census of Ag, Number of Acres in Farms
2. Skagit County Assessor, Number of Acres Zoned in Ag-NRL
Every 5 years
Annual
Total Acres in
Production West of I-5
The total number of acres zoned Ag-NRL west of I-5. Yes Skagit County Assessor, Number of
Acres Zoned in Ag-NRL west of I-5 (calculated in GIS)
Annual
3. DEMAND
Rate of Change of
Agricultural Prices
The rate of change of agricultural prices can be determined from the
Agricultural Prices Received Index for all farm products. This is a
national index, but will give a general idea of demand for agricultural commodities from national and international markets.
No U.S. Department of Agriculture,
National Agricultural Statistics Service
Monthly
Share of
Agricultural Land
Not in Crop Production
The total number of acres in farms les the number of acres of
harvested cropland (defined as land from which crops were
harvested and hay was cut, land used to grow short-rotation
woody crops, and land in orchards, Christmas trees, vineyards,
nurseries, and greenhouses), divided by the total number of acres in farms.
Yes U.S. Census of Agriculture, Total
Harvested Acres and Total Land in Farms.
Every 5
years

ECONorthwest Economic Indicators of Agriculture in Skagit County 66
Indicator Description Spatial
Basis
Data Source(s) Data
Availability
4. COSTS
Total Cost of
Production per Acre in Production
The total cost of inputs to agriculture (labor, fertilizer and chemicals,
fuel, feed, seed, livestock, and other production expenses) divided by
the number of acres in production (defined as the number of acres in
cropland, including harvested land, land used only for pasture and
grazing, land in cultivated summer fallow, cropland on which all crops
failed, and cropland used for cover crops or soil improvement, but not harvested or pastured or grazed.)
No BEA, Total Farm Production Expenses
U.S. Agricultural Census, Total Number of Acres of Cropland
Annual
Every 5 years
Labor Costs The total compensation (including wage and salary and employer
contributions for benefits) per farm employee (including hired labor, proprietors, and partnerships).
No BEA, Farm compensation divided by number of farm employees
Annual
5. INFRASTRUCTURE
Acres of
Agricultural Land
Protected by Levees and Dikes
This is the total number of acres of Ag-NRL land that would be inundated without levees and dikes by a 100 year flood.
Yes Area between levees/dikes and the
100 year floodplain and HB 1418 boundaries.
Current
6. INDUSTRY ORGANIZATION
Number of Farms The total number of farms in Skagit County is based on the U.S.
Department of Agriculture definition of a farm: any place from
which $1,000 or more of agricultural products were produced
and sold.
No
U.S. Census of Agriculture, Number of Farms
Every 5 years
Average Farm Size The average farm size is the total number of land in farms in Skagit
County (land in farms consists primarily of agricultural land used for
crops, pasture, or grazing. It also includes woodland and wasteland
not actually under cultivation or used for pasture or grazing, provided
it was part of the farm operator!s total operation), divided by the total
number of farms in Skagit County (any place from which $1,000 or more of agricultural products were produced and sold).
No U.S. Census of Agriculture, Land in
Farms and Number of Farms
Every 5
years
Share of Farms
Greater than 50 Acres
The share of farms greater than 50 acres is the number of farm
operations that are 50 acres or greater in size, divided by the total number of farms in Skagit County.
No U.S. Census of Agriculture, Number of
Farms 50 acres, Total Number of Farms
Every 5
years
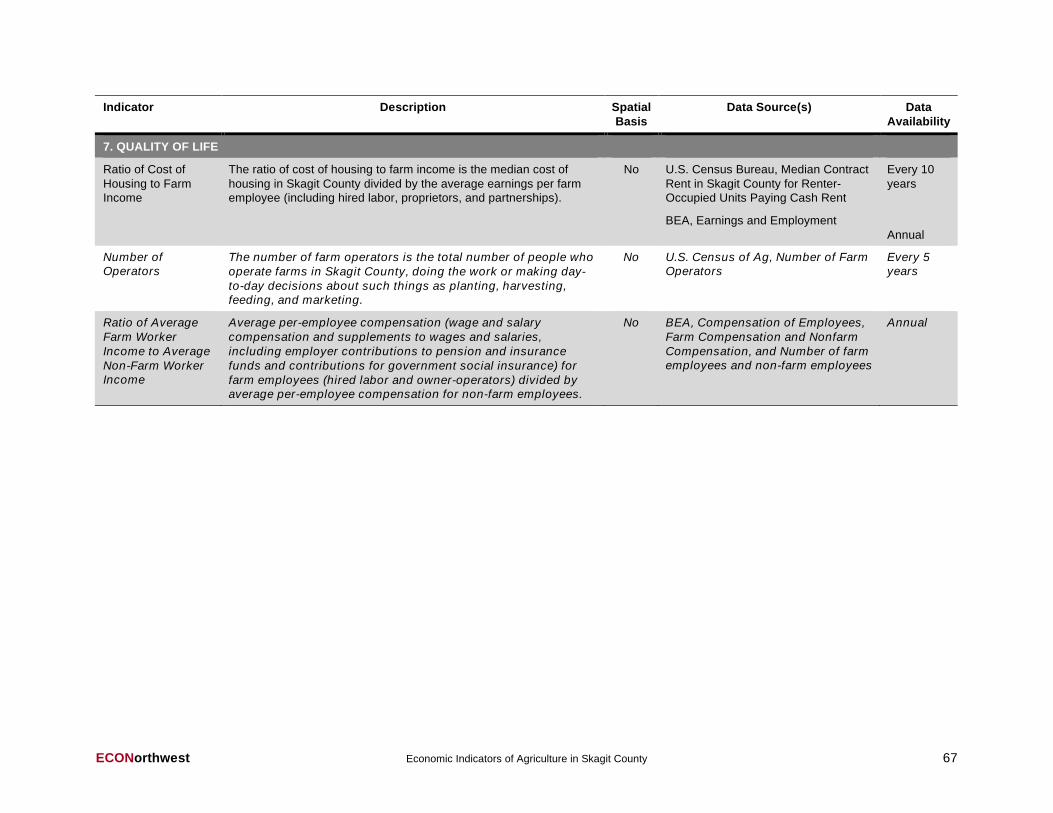
ECONorthwest Economic Indicators of Agriculture in Skagit County 67
Indicator Description Spatial
Basis
Data Source(s) Data
Availability
7. QUALITY OF LIFE
Ratio of Cost of
Housing to Farm Income
The ratio of cost of housing to farm income is the median cost of
housing in Skagit County divided by the average earnings per farm employee (including hired labor, proprietors, and partnerships).
No U.S. Census Bureau, Median Contract
Rent in Skagit County for Renter-Occupied Units Paying Cash Rent
BEA, Earnings and Employment
Every 10
years
Annual
Number of Operators
The number of farm operators is the total number of people who
operate farms in Skagit County, doing the work or making day-
to-day decisions about such things as planting, harvesting, feeding, and marketing.
No U.S. Census of Ag, Number of Farm Operators
Every 5 years
Ratio of Average
Farm Worker
Income to Average
Non-Farm Worker Income
Average per-employee compensation (wage and salary
compensation and supplements to wages and salaries,
including employer contributions to pension and insurance
funds and contributions for government social insurance) for
farm employees (hired labor and owner-operators) divided by average per-employee compensation for non-farm employees.
No BEA, Compensation of Employees,
Farm Compensation and Nonfarm
Compensation, and Number of farm employees and non-farm employees
Annual

ECONorthwest Economic Indicators of Agriculture in Skagit County 68
Indicator Description Spatial
Basis
Data Source(s) Data
Availability
INDICATORS FOR COMPETING DEMANDS
1. LAND AND WATER
Average Value of
Residential Land per Acre
The average value of residential land per acre in Skagit County is the
total market value of land zoned for residential purposes, divided by
the number of acres of land zoned for residential purposes in Skagit County.
Yes Skagit County Assessor, Total Market
Value of Land Zoned Residential, Number of Acres Zoned Residential
Annual
Average Value of
Commercial and
Industrial Land per Acre
The average value of commercial and industrial land per acre in
Skagit County is the total market value of land zoned for commercial
and industrial purposes, divided by the number of acres of land zoned for residential purposes in Skagit County.
Yes Skagit County Assessor, Total Market
Value of Land Zoned C&I, Number of Acres Zoned C&I
Annual
Ratio of Value of
Agricultural Land
to Value of Residential Land
The ratio of the value of agricultural land to the value of
residential land is the average value of an acre of land zoned Ag-
NRL divided by the average value of an acre of land zoned for residential purposes in Skagit County.
No Skagit County Assessor, Market
Value of Residential and Ag-NRL Land
Annual
Ratio of Value of
Agricultural Land to
Value of Commercial and Industrial Land
The ratio of the value of agricultural land to the value of residential
land is the average value of an acre of land zoned Ag-NRL divided by
the average value of an acre of land zoned for commercial and industrial purposes in Skagit County.
No Skagit County Assessor, Market Value of C&I and Ag-NRL Land
Annual
Population density inside UGB
The population density within the Urban Growth Boundaries within Skagit County
Yes US Census population by census tract
to get population within UGB
(approximate) divided by acres in UGB (GIS)
Every 10 years
Population density in Ag-NRL Zone
The population density within land zoned for agriculture in Skagit County
Yes US Census population by census
tract to get population within UGB
(approximate) divided by acres in Ag-NRL zone
Every 10 years

ECONorthwest Economic Indicators of Agriculture in Skagit County 69
Indicator Description Spatial
Basis
Data Source(s) Data
Availability
2. REGULATORY CONSTRAINTS
Water Bodies Out of TMDL Attainment
The number of water bodies in Skagit County out of TMDL attainment
are those water bodies with established TMDLs that are currently not meeting the TMDL standards.
Yes Washington Department of Ecology, List of Streams with TMDLs
Annual
Salmon Production Salmon production is defined as the total number of escapements of all salmonid species from the Skagit and Samish Rivers.
No WDFW Escapement Totals Annual
Number of Endangered Species
The number of listed sensitive threatened and endangered species on WDFW!s, which historically were present in Skagit County.
No WDFW list of sensitive species Annual
Acres of Estuary Habitat
The number of acres of estuary habitat in Skagit County, as defined by the National Land Use and Land Cover Dataset
Yes USGS, National Land Use Land Cover GIS layer
Irregular

ECONorthwest Economic Indicators of Agriculture in Skagit County 70
Indicator Description Spatial
Basis
Data Source(s) Data
Availability
INDICATORS OF POLICY OPTIONS
Payments to
Farmers for
Conservation Activities
Payments to farmers for conservation activities is the annual value of
government payments to farmers in Skagit County from 13
conservation programs, including Conservation Reserve Program
(CRP), Environmental Quality Inventive Program (EQIP), The Total
Conservation Security Program, Agricultural Conservation Program,
Wildlife Habitat Incentives Program (WHIP), Emergency
Conservation, Grasslands Reserve Program, Total Agricultural
Management Assistance, Farmland Protection Program, Resource
Conservation and Development Program, Wetlands Reserve Program, and the Water Bank Program.
No Environmental Working Group,
Database of Government Payments, Payments for Conservation
Annual
Earnings from
Recreation and Tourism
The earnings from recreation and tourism is the annual income
farms receive from providing access to recreation users, such
as hunters and wildlife watchers, and income from agri-tourism activities, such as hay rides and wine tours.
No U.S. Agricultural Census, Income from Agri-Tourism and Recreation
Every 5 years
ECONorthwest Economic Indicators: Appendix I I-1
APPENDIX I: HISTORICAL DATA
This appendix presents data that depict the historical production and trends in agriculture in Skagit County from the turn of the twentieth century forward. The data were compiled by ECONorthwest, to highlight major assertions and conclusions of a draft retrospective on the county’s agriculture prepared by Hector Saez for the county’s Envision Skagit project. The data come from all reliable sources that are relevant to this exercise: the U.S. Census of Agriculture, Skagit County’s Washington State University Extension office, the Washington Department of Agriculture, and the U.S. Department of Agriculture. Nonetheless, the data, especially for the first half of the twentieth century, are spotty, and continuous trends are often indiscernible. For a more detailed narrative description of the history of agriculture in Skagit County, please consult Hector Saez’s draft report, available from Kirk Johnson, at Skagit County Planning & Development Services.
A. Historical Overview of Agriculture in Skagit County
Prior to European settlement of Skagit County, the native people of the Puget Sound region used fire to encourage bracken fern and camas to grown on natural prairies in the Skagit River Valley, fished for salmon in the Skagit River and its tributaries, hunted across the area, and collected clams and mussels from the Skagit River Delta region.
Agricultural production by non-native residents of Skagit County probably began during the mid-1800s, after the Oregon Treaty between the United States and Great Britain in 1846 opened the area to settlement. The earliest settlers planted potatoes in the meadows and prairies where the native population had cultivated camas, near the Skagit River Delta. Upriver settlement did not occur until the 1860s. During the 1860s, the settlers started building the dike and levy system in the Delta to protect the soils from saltwater intrusion and annual flooding. Agricultural production of potatoes continued, and farmers began planting grain crops, such as oats and barley, that did well in the salty soils.
By the beginning of the twentieth century, a seed crop industry had begun to emerge, with Skagit County farmers providing beet, cabbage, flax, spinach, and mustard seed, as well as tulip bulbs, to farmers throughout the region and the country. Starting in the 1920s, farmers began growing vegetables commercially for packing and processing. Peas became the primary crop, with green beans, spinach, and berries also important. Hay was another major crop, supporting a growing dairy industry.
Trends in Skagit County agriculture during the middle of the twentieth century mirrored national trends. Demand for agricultural products grew during World War II. New technology and chemical inputs made agricultural production more efficient, especially in the years immediately following the war. A trend toward fewer and larger farms, with increasing corporate ownership occurred in both crop and livestock production. The number of dairies and dairy herds declined,
ECONorthwest Economic Indicators: Appendix I I-2
but the number of cows per herd increased, while large canneries and processors drove demand for a few crops, and dictated the operations of many independent farms. Farms began to rely increasingly on migrant labor, especially from Mexico. Peas continued to be the primary crop, although other vegetables and berries, especially strawberries, were important.
During the 1970s and 1980s, both the decrease in the number of farms and the increase in the average size of farms leveled out. Increasing input prices, and diminishing benefits from technology and scale likely influenced these trends, along with changes in demand and competition from international markets. Population growth from the urban areas in Skagit County and the greater Puget Sound region put upward pressure on the value of agricultural land during the last decades of the twentieth century.
Recent years have seen an increase in the number of small farms oriented more toward providing owners with a rural lifestyle than toward industrial crop or livestock production. Demands for organic foods and locally grown crops have created new markets and diversified the mix of farm products produced in the county. Rapid urbanization of farmland elsewhere in the Puget Sound basin has promoted support for local and state action to prevent, or at least retard, similar conversions of land use here. At the same time, evidence has mounted of ecosystem degradation throughout the Puget Sound basin, increasing pressure to arrest and roll back the adverse ecological effects of human activities in Skagit County and elsewhere. As a major land use in the county, agriculture has become the focus of much of this pressure.
B. Historical Trends in Agricultural Land and Farms in
Skagit County
Figures A1, A2, A3, and A4 illustrate the changes in acres dedicated to farming in Skagit County, the number of farms engaged in agricultural production, and the value of agriculture-related land and buildings over the last century. The number of acres and number of farms reflect a similar trend of growth during the first half of the twentieth century, and decline after 1950. The declining trend reversed during the last decade, as both the number of acres in farms and the number of farms have climbed since 2000. With the exception of a small decline the mid-1980s, the average, per-acre market value of land and buildings has grown exponentially.
Saez attributes the increasing trend during the first half of the twentieth century to growing demand in the region for farm products, associated with rapid population growth in Skagit County and the surrounding area, as well as budding demand from national and international markets as the country engaged in two world wars. He attributes the decline starting in the 1950s to increasing technological efficiency, making each unit of land more productive. During this period, farming began to shift from individual operations to corporate farming, which is evident in the increase in average farm size starting in the 1950s.

ECONorthwest Economic Indicators: Appendix I I-3
Figure I-1. Acres in Farms, 1900–2007
Source: ECONorthwest, with data from the U.S. Census of Agriculture, 1920–2007
Figure I-2. Number of Farms, 1900–2007
Source: ECONorthwest, with data from the U.S. Census of Agriculture, 1920–2007

ECONorthwest Economic Indicators: Appendix I I-4
Figure I-3. Average Farm Size, 1900–2007
Source: ECONorthwest, with data from the U.S. Census of Agriculture, 1920–2007
Figure I-4. Average Per-Acre Market Value of Land and Buildings, 1920–
2007
Source: ECONorthwest, with data from the U.S. Census of Agriculture, 1920–2007
C. Historical Trends in Agricultural Production in Skagit
County
Several crops have been important to the story of Skagit County agriculture throughout the last century. Peas and potatoes were both early crops, along with seeds and berries. The following pages show trends in these crops since the 1940s—the earliest years for which consistent data are available.

ECONorthwest Economic Indicators: Appendix I I-5
Figure I-5. Trends in Potato Acreage, Revenues, and Revenue per Acre,
1940–2007
Source: ECONorthwest, with data from Washington Department of Agriculture

ECONorthwest Economic Indicators: Appendix I I-6
Figure I-6. Trends in Pea Acreage, Revenues, and Revenue per Acre, 1940–
2007
Source: ECONorthwest, with data from Washington Department of Agriculture

ECONorthwest Economic Indicators: Appendix I I-7
Figure I-8. Trends in Seed Acreage, Revenues, and Revenue per Acre,
1940–2007
Source: ECONorthwest, with data from Washington Department of Agriculture
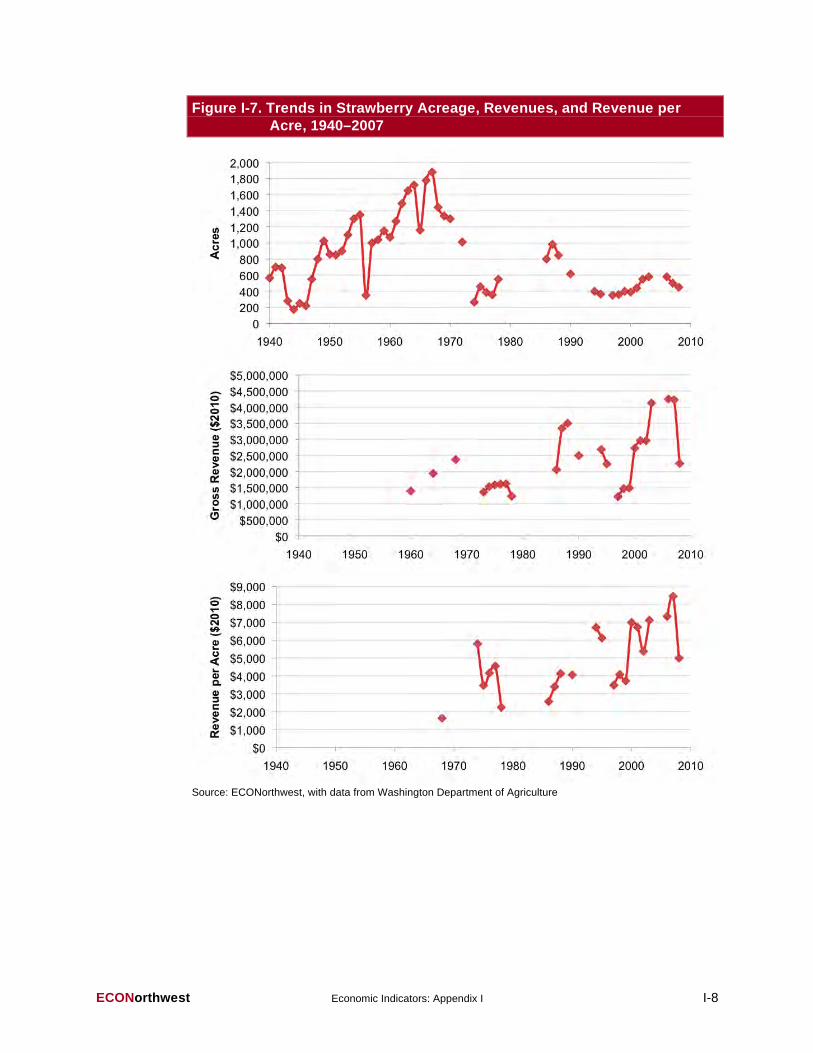
ECONorthwest Economic Indicators: Appendix I I-8
Figure I-7. Trends in Strawberry Acreage, Revenues, and Revenue per
Acre, 1940–2007
Source: ECONorthwest, with data from Washington Department of Agriculture

ECONorthwest Economic Indicators: Appendix II II-1
APPENDIX II: SPATIAL DATA AND DETAILED TABLES
Figure II-1a. Zoning Districts in West Skagit County

ECONorthwest Economic Indicators: Appendix II II-2
Figure II-1b. Zoning Districts in East Skagit County

ECONorthwest Economic Indicators: Appendix II II-3
Table II-1. Crops Grown in Skagit by Area in Production in 2008
Crop Area (Acres)
Berry 2,847
Cereal Grain 16,319
Christmas Tree 30
Commercial Tree 332
Flower Bulb 1,404
Green Manure 389
Hay/Silage 9,259
Herb 7
Mint 12
Nursery 904
Orchard 290
Seed 3,082
Turfgrass 848
Vegetable 16,377
Vineyard 27
Source: Washington Department of Agriculture and Skagit County Extension, 2008.

ECONorthwest Economic Indicators: Appendix II II-4
Figure II-2a. Land Cover in West Skagit County, 2001
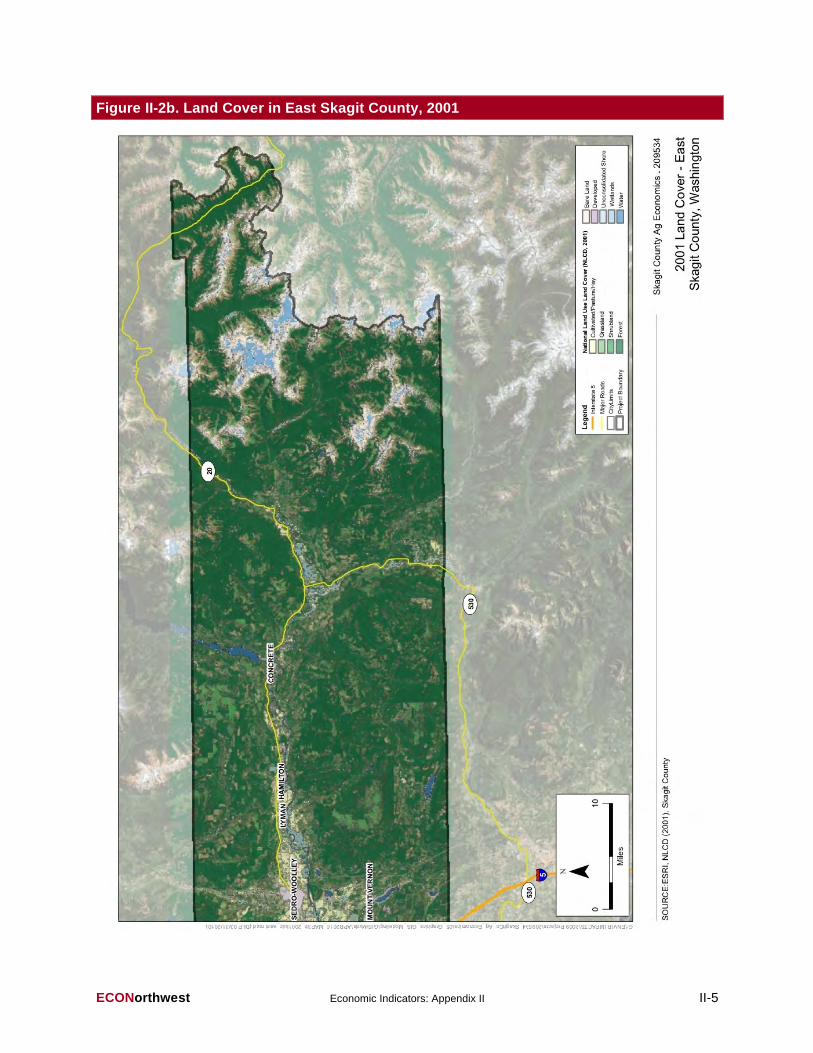
ECONorthwest Economic Indicators: Appendix II II-5
Figure II-2b. Land Cover in East Skagit County, 2001

ECONorthwest Economic Indicators: Appendix II II-6
Figure II-3a. Land Cover in West Skagit County, 2006
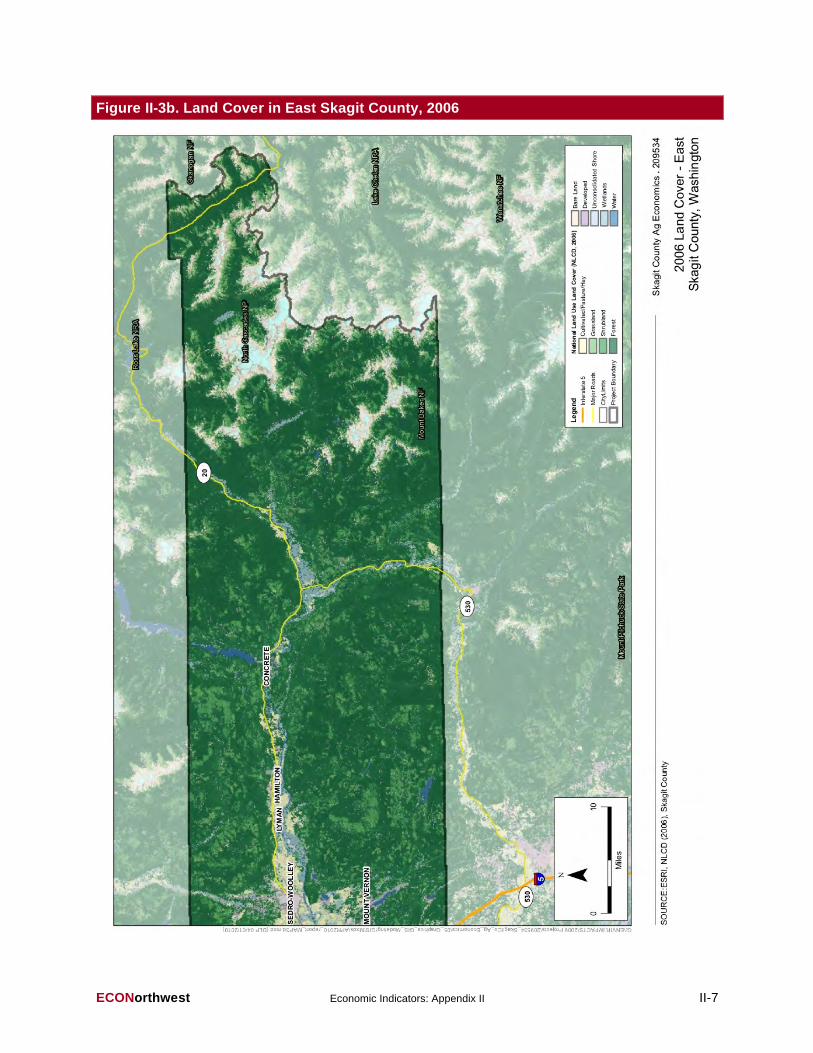
ECONorthwest Economic Indicators: Appendix II II-7
Figure II-3b. Land Cover in East Skagit County, 2006

ECONorthwest Economic Indicators: Appendix III III-1
APPENDIX III: OPPORTUNITIES AND CONSTRAINTS IN
ECOSYSTEM-SERVICE MARKETS
Ecosystem services are the valuable functions provided to society by the natural processes of ecosystems. As demand for environmental quality increases and society better understands the types of goods and services ecosystems provide, there is a growing interest in finding ways for agricultural land owners to receive compensation for the services their lands provide. Table III-1 lists some of the ecosystem goods and services associated with agricultural lands. In some cases, markets for ecosystem services have developed that provide a mechanism for the beneficiaries of services to compensate the providers. These markets are most developed for services related to carbon sequestration, instream flow augmentation, and wetland provision. Markets for services related to water quality and biodiversity are also emerging.
The federal government is paying increased attention to ecosystem services and market-based approaches to their development. In 2008, the Secretary of Agriculture formed the Office of Ecosystem Services and Markets, recently renamed the Office of Environmental Markets. The Secretary established this office in order to build “technical guidelines that outline science-based methods to measure the environmental services benefits from conservation and land management activities in order to facilitate the participation of farmers, ranchers, and forest landowners in emerging environmental services markets.”60 State and local government agencies in Washington are involved in associated efforts as well.
This Appendix provides an overview of the types of opportunities available to farmers seeking to receive payments for providing environmental services, with a focus on opportunities currently available to farmers in Skagit County.
A. Ecosystem-Service Markets
Theory and Background
When markets meet certain conditions, they can, in theory, lead to efficient levels of goods and services without government intervention. Ecosystem services, however, typically do not meet these conditions on their own. The most important of these conditions are:
• Rivalry of use
• Excludability of use
• Low information costs
• Low transaction costs
60 Schafer, E. 2008. Secretary’s Memorandum 1056-001. U.S. Department of Agriculture. Retrieved on May 27, 2010, from http://www.ocio.usda.gov/directives/doc/SM1056-001.htm.

ECONorthwest Economic Indicators: Appendix III III-2
Table III-2 illustrates the characteristics of different kinds of goods and services, depending on whether they are rival or non-rival and excludable or non-excludable. Rivalry occurs when one person’s use of a good or service infringes on the capacity of another person to use it, i.e., when use consumes or degrades the good. Excludability occurs when one individual can exclude another from using a good or service. Non-excludable goods are problematic because
Table III-1. Summary of Functions, Goods, and Services of Ecosystems
Potentially Provided by Skagit County Agricultural Lands
Functions Examples of Goods and Services Produced
1 Production and regulation
of water
Natural and human-built features of an ecosystem capture precipitation; filter,
retain, and store water; regulate levels and timing of runoff and stream flows; and influence drainage.
2 Formation &
retention of soil
Wetlands and biota accumulate organic matter, and prevent erosion to help
maintain productivity of soils.
3 Regulation of atmosphere
& climate
Biota produce oxygen, and help maintain good air quality and a favorable climate
for human habitation, health, and cultivation.
4 Regulation of disturbances Wetlands and reservoirs reduce economic flood damage by storing flood waters,
reducing flood height, and slowing a flood!s velocity.
5 Regulation of nutrients and
pollution
Wetlands and riparian vegetation improve water quality by trapping pollutants
before they reach streams and aquifers; natural processes improve water quality by removing pollutants from streams.
6 Provision of habitat Wetlands, riparian vegetation, streams, and reservoirs provide habitat for economically important fish and wildlife.
7 Food production Biota convert solar energy into plants and animals edible by humans.
8 Production of raw materials Streams and biota generate materials for construction, fuel, and fodder; streams possess energy convertible to electricity.
9 Pollination Insects facilitate pollination of economically important wild plants and agricultural crops.
10 Biological control Water-related birds and microorganisms control pests and diseases.
11 Production of genetic & medicinal resources
Genetic material in wild plants and animals provide potential basis for drugs and pharmaceuticals.
12 Production of ornamental resources
Products from water-related plants and animals provide materials for handicraft, jewelry, worship, decoration, and souvenirs.
13 Production of aesthetic resources
Wetlands, riparian vegetation, streams, and reservoirs provide basis for enjoyment of scenery from roads, housing, parks, trails, etc.
14 Production of recreational resources
Streams, reservoirs, riparian vegetation, fish, waterfowl, and other wildlife provide basis for outdoor sports, eco-tourism, etc.
15 Production of spiritual,
historic, cultural, and artistic resources
Wetlands, riparian vegetation, streams, and reservoirs serve as basis for spiritual renewal, focus of folklore, symbols of group identity, motif for advertising, etc.
16 Production of scientific and educational resources
Wetlands, riparian vegetation, streams, and reservoirs provide inputs for research and focus for on-site education.
Source: Adapted by ECONorthwest from De Groot, R., M. Wilson, and R. Boumans. 2002. “A Typology for the
Classification, Description and Valuation of Ecosystem Functions, Goods and Services.” Ecological Economics
41: 393-408; Kusler, J. 2003. Assessing Functions and Values. Institute for Wetland Science and Public Policy
and the Association of Wetland Managers, Inc.; and Postel, S. and S. Carpenter. 1997. “Freshwater Ecosystem
Services.” in Nature's Services: Societal Dependence on Natural Ecosystems. Edited by G.C. Daily.
Washington, D.C.: Island Press, pgs. 195-214.
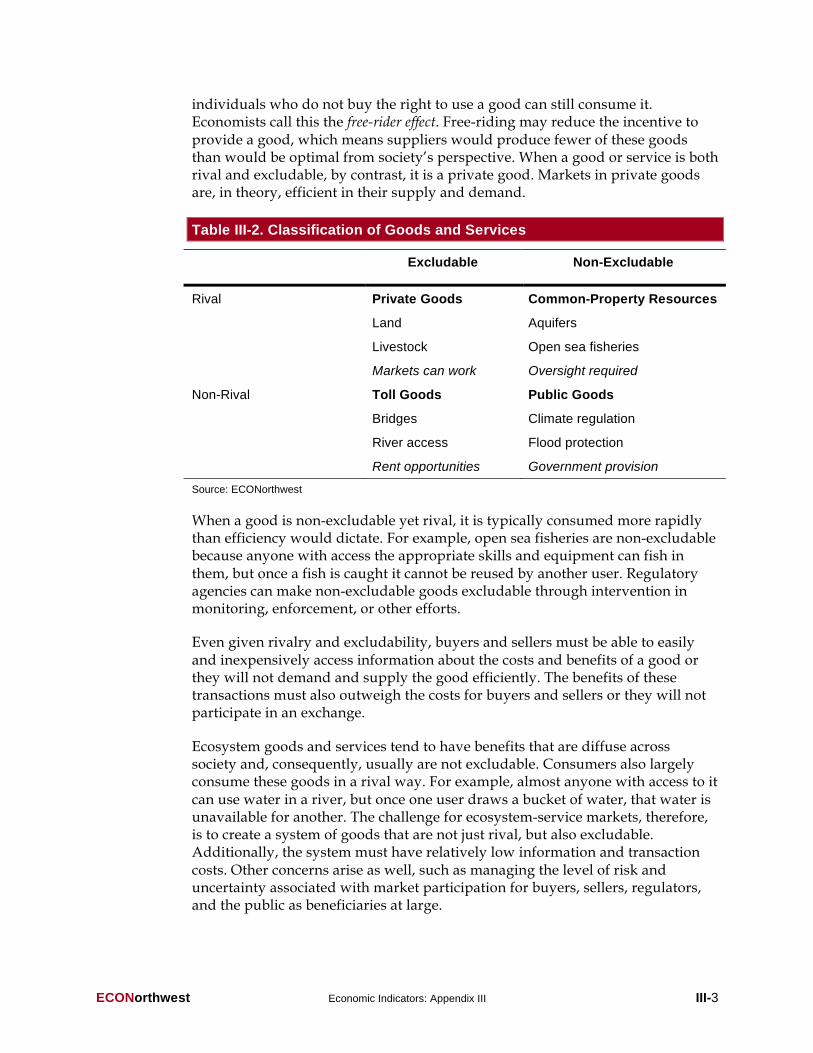
ECONorthwest Economic Indicators: Appendix III III-3
individuals who do not buy the right to use a good can still consume it. Economists call this the free-rider effect. Free-riding may reduce the incentive to provide a good, which means suppliers would produce fewer of these goods than would be optimal from society’s perspective. When a good or service is both rival and excludable, by contrast, it is a private good. Markets in private goods are, in theory, efficient in their supply and demand.
Table III-2. Classification of Goods and Services
Excludable Non-Excludable
Rival Private Goods
Land
Livestock
Markets can work
Common-Property Resources
Aquifers
Open sea fisheries
Oversight required
Non-Rival Toll Goods
Bridges
River access
Rent opportunities
Public Goods
Climate regulation
Flood protection
Government provision
Source: ECONorthwest
When a good is non-excludable yet rival, it is typically consumed more rapidly than efficiency would dictate. For example, open sea fisheries are non-excludable because anyone with access the appropriate skills and equipment can fish in them, but once a fish is caught it cannot be reused by another user. Regulatory agencies can make non-excludable goods excludable through intervention in monitoring, enforcement, or other efforts.
Even given rivalry and excludability, buyers and sellers must be able to easily and inexpensively access information about the costs and benefits of a good or they will not demand and supply the good efficiently. The benefits of these transactions must also outweigh the costs for buyers and sellers or they will not participate in an exchange.
Ecosystem goods and services tend to have benefits that are diffuse across society and, consequently, usually are not excludable. Consumers also largely consume these goods in a rival way. For example, almost anyone with access to it can use water in a river, but once one user draws a bucket of water, that water is unavailable for another. The challenge for ecosystem-service markets, therefore, is to create a system of goods that are not just rival, but also excludable. Additionally, the system must have relatively low information and transaction costs. Other concerns arise as well, such as managing the level of risk and uncertainty associated with market participation for buyers, sellers, regulators, and the public as beneficiaries at large.

ECONorthwest Economic Indicators: Appendix III III-4
When regulated polluters use ecosystem services via payments or markets to meet requirements, liability issues for market participators can limit the set of potential trading partners. Buyers must feel confident that the purchased offset will satisfy regulatory requirements. Otherwise, regulators might fine them and require them to undertake conventional compliance. Sellers worry that they may bear some of the liability, or that by identifying their low-cost opportunities for pollution abatement, they open themselves up to future regulation. Regulatory agency staff and the public must be concerned if pollution abatement is less effective among non-point sources, such as farms, than in point-sources, like factories. Many of these concerns can be alleviated if trades are of a similar nature, such as point source-to-point source or non-point source-to-non-point source.
Some agencies are developing mechanisms to address risk and uncertainty associated with market-based approaches to ecosystem services. In some cases, government entities have acted as brokers to address information and transaction costs, as well as managing a share of the liability. To protect themselves from future liability, buyers can draw additional credits from banks when credit projects fail, for example when a restoration project does not perform as expected. Additionally, buyers can use trading ratios greater than one-to-one to address uncertainty for unknown project failures. For example, a two-to-one trading ratio would require the transaction to generate two acres of benefit for each acre of lost benefit offset.
Existing Markets and Application
Despite the challenges, market-based approaches to provisioning ecosystem services are in place and under development worldwide. Voluntary markets, such as much of the U.S. carbon sequestration market, rely on a mix of private and public motivations. These voluntary markets, while beneficial, do not typically provide a reliable and sufficient level of provision. Achieving socially-identified levels of ecosystem service-provision typically requires a regulatory mandate for provision of the service or a constraint on the degradation of the service. Once a mandate or constraint is in place, regulators can achieve efficiencies with market-based goods in the form of credits, conditional on monitoring and enforcement of the credit and regulation terms. In some cases, activities described as markets are actually payments for ecosystem services (PES), facilitated between private individuals, corporations, organizations, and/or governments as one-time solutions to regulatory requirements.
In general, farm operators participating in ecosystem-service markets restore or manage their land beyond current regulatory requirements. These changes in management may generate payments or credits that farmers can sell to businesses, cities, utilities, or other entities seeking to offset environmental degradation. These markets provide a means by which entities that cannot avoid environmental degradation in conducting their business can offset their negative impact in a cost-effective manner. Non-regulated entities may choose to voluntarily purchase ecosystem services credits for marketing purposes or to comply with their internal environmental management goals.

ECONorthwest Economic Indicators: Appendix III III-5
Site-specific demands tend to determine the viability of these transactions. A local example is the City of Portland, which wanted to avoid the costs associated with investing in a filtration system to treat its drinking water. Instead of spending $200 million on a new filtration system, the City of Portland protected 102 square miles of its watershed from activities that might introduce pollution and other impurities into its drinking water. This equates to an avoided-cost benefit of $3,000 per acre for water filtration services.61 Similarly, Clean Water Services, a water-resource management utility in northwestern Oregon avoided investing in a chiller for a water treatment plant on the Tualatin River by planting riparian vegetation to shade and cool the river, for a savings of $50 million. 62 Clean Water Services managed risk and uncertainty by purchasing cold-water releases from an upstream reservoir. Given the concerted efforts at the state and federal level, opportunities for revenues from ecosystem-service provision are likely to increase in the region.
Other countries are developing markets that value, purchase, and trade water quality and quantity, habitat, biodiversity, and other ecosystem services. Business and individuals may employ these credit techniques to adhere to regulations while avoiding other more costly compliance techniques. The carbon-emissions market (in terms of carbon sequestration) is much larger than other ecosystem services markets and has developed a sturdier institutional framework. Including market-based actions under the Kyoto Protocol and the European Union Emissions Trading Scheme, the total market volume is now over $100 billion annually, with prices ranging to over $40 per ton of carbon dioxide-equivalent.63
In the following sections, we present the current status for several ecosystem service-based markets. With the exception of voluntary carbon markets, these markets typically require local entities to drive demand. In the Puget Sound region, for example, the Puget Sound Partnership is a leading driver for demand. It has established an in-lieu fee program for purchasing ecosystem services with funds raised from activities that degrade Puget Sound. While actual markets are not yet in place, conditions exist that could offer cost-savings for efforts to restore various ecosystem services important to the Skagit Watershed and Puget Sound as a whole, while offering revenue sources for farmers.
61 ECONorthwest, with data from the Portland Water Bureau, http://www.portlandonline.com/ water/index.cfm?c=29784; and Krieger, D. 2001. Economic Value of Forest Ecosystem Services: A Review. The Wilderness Society.
62 Niemi, E., K. Lee and T. Raterman. Net Economic Benefits of Using Ecosystem Restoration to Meet Stream Temperature Requirements. ECONorthwest.
63 Point Carbon. 2009. Carbon Market North America. August 29. Retrieved from http://www.agcarbonmarkets.com/documents/Point%20Carbon_Offsets_Likely_Senate.pdf

ECONorthwest Economic Indicators: Appendix III III-6
B. Water Markets
Ensuring the public’s continued access to water supplies of sufficient quantity and quality is a pressing issue regionally and locally. It is an issue that is likely to grow in importance as climate change impacts the availability and reliability of water resources. Population growth, changing water-use patterns, and new regulatory demands have and likely will continue to pressure water users and suppliers. In the face of these challenges, regulators and water-resource managers are increasingly turning to market-based tools to manage water supplies.
There are two types of market-based mechanisms to address water-resource issues: markets primarily designed to manage water quality and markets primarily designed to manage water quantity. Water-quantity markets usually allow participants to buy and sell consumptive water rights. In some cases, water quantity markets can improve river and stream flows by allowing public or private entities to lease or buy the water rights of a third party, who then leaves the water instream, increasing stream flows. Water-quality markets employ a similar approach to reduce water pollution by developing credits for regulated pollutants. Water-quality trading offers the possibility of meeting a watershed’s water quality goals with its most cost-effective opportunities and creates incentives for water quality improvement.
Water Quantity and Quality Markets and Agriculture
Instream flow leasing is an example of water quantity trading that allows agricultural producers to participate. In these models, public and private entities pay the owners of water rights to leave a portion of their water right instream or to put water back into the stream channel. For example, the Washington Water Trust partnered with John Crosetto, the General Manager of Teanaway Valley Family Farm, located on the North Fork of the Teanaway River in Washington. According to this lease, Washington Water Trust reimburses the Teanaway Valley Farm for a lease of 102 acre-feet until 2023. With this project and seven others like it, the Washington Water Trust has increased flows by up to 5.5 cubic feet per second in the North Fork of the Teanaway River.64
In addition to water-quantity trading, water-quality trading is a tool that industrial and municipal facilities may use to lower their costs of meeting water-quality standards. Regulated facilities might compensate agricultural producers for a less costly, but equivalent, pollutant or temperature reduction. To achieve this end, trading partners enter into a contractual agreement, which financially benefits both parties and improves water quality with a lower financial investment. A water-quality trading market exists only when these parties have different costs to reduce their respective pollutant contributions, which creates
64 Colombia Basin Water Transactions Program. No date. Stories from the Field: Salmon Return as Long-Term Leases Restore Water to the Teanaway. Retrieved on June 1, 2010, from http://www.cbwtp.org/jsp/cbwtp/stories/stories.jsp?year=2006.

ECONorthwest Economic Indicators: Appendix III III-7
an efficient market for less-expensive approaches to improving water quality. These markets have also employed Agricultural Best Management Practices (BMPs) in the Chesapeake Bay and the Ohio River drainage.
Some farmers in the Pacific Northwest already augment their incomes by providing water quality improvements. Producers in Washington County, Oregon who are enrolled in the Conservation Reserve Enhancement Program (CREP) earn additional revenue through the Tualatin Soil and Water Conservation District. These producers receive the standard $265 per acre per year for tree plantings to cool the Tualatin River through the CREP, but can also net an additional $128 per acre per year for improving water quality.65 Clean Water Services, a wastewater and stormwater public utility that must reduce the amount of heated water entering the Tualatin River from its facilities, provides these additional funds.
Water-Quantity Markets in Washington State
The Colombia Basin Water Transactions Program. In 2002 the National Fish and Wildlife Foundation (the Foundation) created the Columbia Basin Water Transactions Program (CBWTP) to address regional water supply challenges. The Foundation noticed that as a result of legal water withdrawals during the peak growing season, stretches of many streams and rivers would run low—and sometimes dry—with significant consequences for imperiled salmon, steelhead, and trout.66 To mitigate this problem, the CBWTP uses permanent acquisitions, leases, investments in efficiency, and other incentive-based approaches, along with program partners in Oregon, Washington, Idaho and Montana, to fund landowners to restore flows to existing habitat. The Foundation and the Bonneville Power Administration (BPA) jointly manage the CBWTP. The BPA, along with the Northwest Power and Conservation Council, also provides the majority of the funding for the program.
Washington Water Trust. Established in 1998, the Washington Water Trust (WWT) is another independent, non-profit that works to increase stream flows using a market-based approach. Like the CBWTP, the WWT purchases or leases ecologically significant water rights from voluntary public or private sellers, and then dedicates the acquired water to instream use to increase tributary flows. The Washington State Trust Water Program, along with a variety of private partners, provides funding for the Washington Water Trust.
Washington Water Acquisition Program. Washington State launched the Washington Water Acquisition Program in 2003 with the goal of increasing stream flows in 16 watersheds. This program uses funds from the state and
65 Conservation Technology Information Center. 2006. Getting Paid for Stewardship: An Agricultural Community Water Quality Trading Guide. July.
66 Colombia Basin Water Transactions Program. No date. Retrieved on May 6, 2010, from http://www.cbwtp.org/jsp/cbwtp/program.jsp.
ECONorthwest Economic Indicators: Appendix III III-8
federal governments, along with program sponsors, to buy or lease water rights from farmers, ranchers and other water-rights holders. The program then returns the water it obtains to the creeks, streams, and rivers where it was originally withdrawn.
Participants in the Washington Water Acquisition Program have the option of selling all or part of their water rights or leasing all or part of their water rights. If a participant chooses to sell his or her water right, program sponsors will work to negotiate a sale price that is based on a fair market value. At the conclusion of the sale, the state will hold the water in trust permanently. If a participant wishes to lease his or her water right, a fair market value is again assessed, and there is no risk of relinquishing the water, though long-term leases have a higher priority.67
Water-Quality Markets
Background and Developments. While there are no active water quality trading markets in Washington State, there are several regional and national examples that might provide reference points for Washington landowners interested in future opportunities in these markets.
Sources of water quality pollutants and impairment are generally divided into two categories: point sources and non-point sources. Point sources, like factories and sewage treatment plants, are those entities that discharge pollutants from a single point or a concentrated body of points. A non-point source, like a farm or urban runoff, by contrast, is typically diffuse. Non-point sources often do not have a precise original source of pollution and so are typically unregulated.
To address growing concerns over water quality, some U.S. local and state government agencies have implemented nutrient caps or limits on discharge of pollutants into waterways. In some cases, regulated entities can use water-quality trading to reduce the costs associated with the caps and still offset the water quality degradation. In these instances, trading allows sources with relatively higher abatement costs to purchase pollution reductions from sources that have lower abatement costs. Water quality trading can occur from point-to-non-point sources, point-to-point sources or non-point-to-non-point sources.
Table III-3 illustrates four broad market structures in water quality trading: bilateral trades, sole source offsets, clearinghouses, and exchange markets. Some trading programs combine elements of two or more of these structures.68 To reduce concerns over risk and uncertainty, some programs require greater than a
67 Department of Ecology, State of Washington. No date. Water Acquisition: Increasing Stream Flows in Critical River Basins. Retrieved on May 6, 2010, from http://www.ecy.wa.gov/programs/wr/market/wacq.html.
68 Selman, M., S. Greenhalgh, E. Branosky, C. Jones, and J. Guiling. 2009. Water Quality Trading Programs: An International Overview. WRI Issue Brief: Water Quality Trading, No. 1. March.
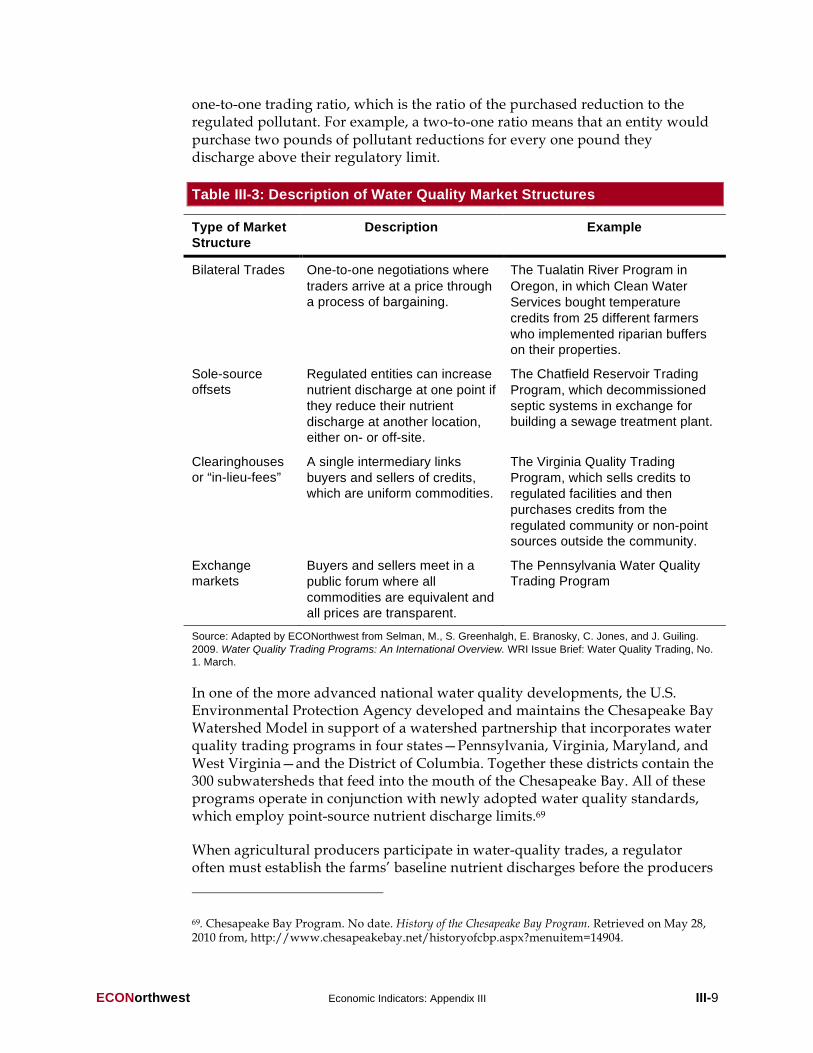
ECONorthwest Economic Indicators: Appendix III III-9
one-to-one trading ratio, which is the ratio of the purchased reduction to the regulated pollutant. For example, a two-to-one ratio means that an entity would purchase two pounds of pollutant reductions for every one pound they discharge above their regulatory limit.
Table III-3: Description of Water Quality Market Structures
Type of Market Structure
Description Example
Bilateral Trades One-to-one negotiations where
traders arrive at a price through a process of bargaining.
The Tualatin River Program in
Oregon, in which Clean Water
Services bought temperature
credits from 25 different farmers
who implemented riparian buffers on their properties.
Sole-source offsets
Regulated entities can increase
nutrient discharge at one point if
they reduce their nutrient
discharge at another location, either on- or off-site.
The Chatfield Reservoir Trading
Program, which decommissioned
septic systems in exchange for building a sewage treatment plant.
Clearinghouses or “in-lieu-fees”
A single intermediary links
buyers and sellers of credits, which are uniform commodities.
The Virginia Quality Trading
Program, which sells credits to
regulated facilities and then
purchases credits from the
regulated community or non-point sources outside the community.
Exchange markets
Buyers and sellers meet in a
public forum where all
commodities are equivalent and all prices are transparent.
The Pennsylvania Water Quality Trading Program
Source: Adapted by ECONorthwest from Selman, M., S. Greenhalgh, E. Branosky, C. Jones, and J. Guiling.
2009. Water Quality Trading Programs: An International Overview. WRI Issue Brief: Water Quality Trading, No.
1. March.
In one of the more advanced national water quality developments, the U.S. Environmental Protection Agency developed and maintains the Chesapeake Bay Watershed Model in support of a watershed partnership that incorporates water quality trading programs in four states—Pennsylvania, Virginia, Maryland, and West Virginia—and the District of Columbia. Together these districts contain the 300 subwatersheds that feed into the mouth of the Chesapeake Bay. All of these programs operate in conjunction with newly adopted water quality standards, which employ point-source nutrient discharge limits.69
When agricultural producers participate in water-quality trades, a regulator often must establish the farms’ baseline nutrient discharges before the producers
69. Chesapeake Bay Program. No date. History of the Chesapeake Bay Program. Retrieved on May 28, 2010 from, http://www.chesapeakebay.net/historyofcbp.aspx?menuitem=14904.

ECONorthwest Economic Indicators: Appendix III III-10
can generate and trade any nutrient reduction credits. In Virginia, for example, there is a performance-based baseline for agriculture. Participating farmers must implement riparian buffers, streambank fencing, cover crops, and no-till agriculture before they gain eligibility for Virginia’s trading program and can generate credits.70
C. Biodiversity (Habitat) Markets
The explicit goal of a biodiversity market is to protect wildlife through the provision of habitat. For this reason, biodiversity payment schemes must include some characteristics of habitat enhancement and management. Payments for biodiversity services, therefore, include any payment for the protection, restoration, or management of habitat. Examples include biodiversity offsets, conservation easements, payments for biodiversity management, transfers of development rights, and habitat credit markets.
Biodiversity Markets and Agriculture
Agriculture occupies a significant portion of land in Washington, forming the most predominant land use type in many eastern basins and the second most common land use in western Washington. Agriculture in Washington is frequently located along streams and in the lower portions of watersheds, where historically, the most productive salmon habitat occurred. About 37 percent of salmon streams in Washington pass through private land used for agriculture.71
Agricultural land may also play an increasingly critical role in preserving ecosystems as developers convert rural land in surrounding areas into urban and industrial land uses. In Washington State, between 1982 and 1997, about 20 percent of the farmland in the Puget Sound region was lost to other uses, especially in King and Snohomish Counties where urban growth has been high.72 As a result of these dynamics, agriculture likely will play an important role in maintaining healthy ecosystems and biodiversity in the coming years in Washington State.
Some organizations and local governments have implanted pilot programs for improving biodiversity and habitat in Washington. Farmers in Skagit County, for example, have joined a pilot program with The Nature Conservancy to earn additional income for innovative integration of active agriculture and environmental services. In this program, the farmers flood one third of the 210 acres of dedicated land to produce critical habitat for migratory birds. Of the
70 Selman, M., S. Greenhalgh, E. Branosky, C. Jones, and J. Guiling. 2009. Water Quality Trading Programs: An International Overview. WRI Issue Brief: Water Quality Trading, No. 1. March.
71 Smith, C. 2006. Evaluation of CREP Riparian Buffers in Washington State. Washington State Conservation Commission. April.
72Smith, C. 2006. Evaluation of CREP Riparian Buffers in Washington State. Washington State Conservation Commission. April.
ECONorthwest Economic Indicators: Appendix III III-11
other two-thirds, the farmers mow one and use the other for grazing livestock or planting row crops. In exchange for their labor, expense, and the use of their land, the farmers have earned $350,000 over the first three years of the program.73
Biodiversity Markets in Washington State
Conservation Reserve Enhancement Program. The Conservation Reserve Enhancement Program (CREP) is a voluntary federal incentive program for farmers, which aims to improve water quality and biodiversity along streams nationwide. This program aims to improve riparian habitat while lessening farmers’ financial burden for restoration and conservation. The U.S. Department of Agriculture’s Farm Service Agency administers CREP, in partnership with state, tribal, and private agencies.
In Washington State, the federal CREP program has partnered with the Washington State Conservation Commission and the Farm Service Agency (FSA). These agencies have cooperatively administered Washington CREP since its inception in 1999. This program provides incentives to restore and improve salmon and steelhead habitat on private land.74 It is voluntary and offers financial incentives for farmers to restore native vegetation to buffers along salmon streams and to preclude agricultural activities in those areas during the contract duration, which is 10 to 15 years.75
There are number of eligibility requirements for participation in CREP, which include requirements for the land, stream, and participant. Basic eligibility requirements oblige the potential land to: (1) have the required cropping history, (2) support the required vegetation, and (3) be parallel and adjacent to an eligible stream.76 For the CREP forested riparian buffer, there are 10,000 miles of streams designated as eligible. Only landowners are eligible to participate in the contract. The landowner furthermore must have owned or operated the property for at least 12 months prior to offering it for CREP. 77
73 American Farmland Trust. No date. Washington: Partnering for Farms and Salmon. Retrieved on June 1, 2010 from http://www.farmland.org/resources/reports/default.asp.
74 Washington State Conservation Commission. 2010. Fact Sheet: Conservation Reserve Enhancement Program (CREP) Washington State. April.
75 Smith, C. 2006. Evaluation of CREP Riparian Buffers in Washington State. Washington State Conservation Commission. April.
76 Washington State Conservation Commission. 2010. Fact Sheet: Conservation Reserve Enhancement Program (CREP) Washington State. April.
77 Washington State Conservation Commission. 2010. Fact Sheet: Conservation Reserve Enhancement Program (CREP) Washington State. April.

ECONorthwest Economic Indicators: Appendix III III-12
Table III-4: Financial Reimbursement within the CREP Washington State Program
Type of Reimbursement Amount of Reimbursement
Details
Annual Rental Payments CREP rental rate incentives are based on the average “soil rental
rates” (SRR) for the site times at the following rental rates:1
Forested Riparian Buffers 200% Must be planted to native trees and shrubs
suitable to the site. Grasses will also be
included if necessary. The minimum buffer width is 35! and the maximum is 180!.
Hedgerow Buffers 175% Hedgerows are a 15! buffer planted to woody
vegetation. The species planted must be
native. These are limited to salmonid-bearing streams 15! wide or less.
Grass Filter Strips 150% Can range from 20! to 120!. Enrollment is
limited to non-salmonid bearing water
courses within the watershed containing a designated stream.
Signing Incentive Payments (SIP) $100 per enrolled acre
Issued shortly after the contract is approved.
Cost share reimbursement for establishment
50% from FSA
10% from Washington State
Issued in two components. The components
are limited to normal, eligible installation
costs approved by the FSA and all are issued after installation of the practice.
Practice Incentive Payment (PIP) 40% May not be issued until the entire practice is installed. See Practice Installation Loans.
Maintenance Payments 100% of eligible
costs
After CREP is installed, Washington State
will pay costs of maintaining the cover to specifications for up to 5 years.
Practice Installation Loans PIP cannot be issued until installation is
complete. To limit the financial burden,
conservation districts can proved 0% interest loans for the PIP portion of reimbursement.
1Average SRRs for enrolled land can vary from $50 to $215, times the associated rental rate percentages. SRRs are based on
dryland agricultural rents in the county, adjusted for the enrolled soils! inherent productivity.
Source: Adapted by ECONorthwest from Washington State Conservation Commission. 2010. Fact Sheet: Conservation Reserve
Enhancement Program (CREP) Washington State. April.
Program participants are eligible for financial reimbursements outlined in Table III-4. FSA annual rental payments, including the incentives, SIPs and PIPs, are subject to a $50,000 per-year payment limitation that applies to all other CRP payments the participants may earn.78 There is no limitation on cost share payments or the State maintenance payments other than eligible cost caps.
78 Washington State Conservation Commission. 2010. Fact Sheet: Conservation Reserve Enhancement Program (CREP) Washington State. April.

ECONorthwest Economic Indicators: Appendix III III-13
Since the program began in Washington State, participants have signed 576 contracts and planted 9,565 acres of riparian buffer at an average width of 150 feet and spanning a length of 553 miles.79 The U.S. Department of Agriculture (USDA) has paid an average of $1,008,045 each year to Washington landowners in rental payments for these protected buffers.80
Mitigation Banking. In addition to conservation banking, mitigation banking is a market-based approach to preserving wetlands. Public or private entities, called mitigation bankers or bank sponsors, can restore and preserve wetlands, streams, and other aquatic resources in exchange for credits. Mitigation bankers can sell these credits to regulated parties who must provide wetland or buffer mitigation for a permitted project. The Mitigation Bank Review Team (MBRT), a group of regulatory agencies on the local, state, and federal level, regulates mitigation banks nationwide. The MBRT is also responsible for issuing credits and approving the sale of those credits.
Clean Water Act. Section 404 of the Clean Water Act (CWA §404) establishes a federal program to regulate the discharge of material into federally jurisdictional wetlands, streams, and other waters. As part of the CWA §404, regulated entities must compensate for unavoidable impacts to waters by purchasing offset credits. A regulatory guidance document directs mitigation banks, which can generate wetland and stream credits. The guidance document describes the physical and legal characteristics of the bank, the proposed litigation design, the net ecological benefit that will result from implementation of the proposal, the total number of mitigation credits generated at the bank, and the schedule for releasing those credits.81
There are a number of criteria used to evaluate a site’s potential for developing a successful mitigation bank. These criteria include the market and land-use considerations outlined in Table III-5.
79 Becker, D. Conservation Commission, quoted in Smith, C. 2006. Evaluation of Riparian Buffers in Washington State.
80 Smith, C. 2006. Evaluation of CREP Riparian Buffers in Washington State. Washington State Conservation Commission. April.
81 Normanly, B. 2007. A Primer on Mitigation Banking: Process and Potential Revenue. Forest Landowner. November/December.

ECONorthwest Economic Indicators: Appendix III III-14
Table III-5: Clean Water Act Site Selection Criteria
Banking Market Criteria Land-Use Criteria
The potential bank site is located in a high-
growth watershed that is not saturated with existing mitigation banks.
Mitigation banking is consistent with
adjacent land uses and will not create
complications arising from neighboring
properties or infrastructure (e.g., existing roads, utility lines, impoundments, etc.).
The potential bank is located within an
area in which credits are required for large
local, state, and federal projects, e.g., state
department of transportation road projects,
military base expansion, reservoirs, landfills, etc.
The potential bank site contains ditches,
constructed waterways, tile drainage,
levees, and other manmade structures that
have altered the site!s natural hydrologic regime.
The potential bank is located within a
watershed listed, or is otherwise
considered by the regulatory agencies as high priority.
The potential bank site contains
impounded, channelized, or straightened
streams in which natural channel form can be restored.
The potential bank site contains wetland or
stream buffers in which vegetation
consisting of planted pine monoculture,
pasture grasses, or agricultural crops can be replaced with native species.
Source: Normanly, B. 2007. A Primer on Mitigation Banking: Process and Potential Revenue. Forest
Landowner. November/December.
Habitat Bank: Mitigation Banking in Washington State. Habitat Bank is a private organization that develops and operates mitigation banks in Washington State. This program has five current mitigation bank projects, which Table III-6 outlines below. Washington State’s Department of Ecology has approved the Habitat Bank through its pilot banking program.

ECONorthwest Economic Indicators: Appendix III III-15
Table III-6: Available Mitigation Banks in Washington
Mitigation Bank Details
Snohomish Basin Mitigation Bank This bank serves the Snohomish,
Skykomish and Snoqualmie drainage
basins. It has credits available for sale for critical area impacts within its service area.
Colombia River Mitigation Basin In conjunction with the Port of Vancouver,
this bank serves 162 acres of the Colombia
River floodplain in Clark, Cowlitz, and
Skamania Counties. Credits will be available in 2010.
Lake Washington-Sammamish Watershed Bank
This bank will serve King and Snohomish
Counties, WRIA 8 and the Lake
Washington and Sammamish watershed.
The proposal is currently under evaluation by the MBRT.
East Fork Lewis Mitigation Bank This bank will restore approximately 100
acres of wetland habitat and provide
mitigation credits for the East Fork Lewis
Watershed. This bank will serve portions of
the cities of Battleground, Ridgefield and La
Center and drainages such as Gee, Allen
and the upper end of Mill Creek. Credits will be available in 2010.
Battle Ground Mitigation Project Located in the City of Battle Ground, this
project will restore approximately 60 acres
of wetland habitat and provide credits for projects within in the city.
Source: Adapted by ECONorthwest from Habitat Bank and Mitigation Banking. No date. Retrieved 5 May 2010
from http://www.habitatbank.com/home.html
Cascade Land Conservancy: Transfer of Development Rights. The Cascade Land Conservancy (CLC) works with landowners, local governments, and developers to identify and conserve priority natural areas. The Conservancy compensates farm and forest owners using traditional approaches such as land purchases, conservation easements and donations of land, as well as innovative tools such as mitigation banking, transfer of development rights, and conservation development.
In 2007 CLC cooperated with Pierce County, Washington to create a voluntary transfer of development rights (TDR) program that partners farm owners and developers.82 In these initiatives, agricultural landowners sell the development rights to their properties to developers who want to build in greater density
82 The Cascade Agenda. No date. Cascade Land Conservancy TDR Activities. Retrieved on May 28, 2010, from http://cascadeagenda.com/tdr/cascade-land-conservancy-activities.

ECONorthwest Economic Indicators: Appendix III III-16
areas. The program’s first two transactions protected 89 acres of family-owned forested land in June, 2009.83 CLC has developed or is developing similar TDR programs with Kittitas County, the City of Tacoma, the City of Sammamish, and the City of Snohomish. King County has developed its own, similar TDR program without the participation of CLC.
D. Carbon Markets
Increased attention to the potential impacts of climate change has sparked efforts to develop initiatives aimed at curbing greenhouse gas emissions through carbon markets. These markets could provide farmers in Washington State with an additional revenue stream. While there are no federal regulations currently in place, several voluntary carbon markets have emerged. In these markets, farmers who practice enhanced agricultural techniques may earn credits for storing carbon or reducing their outputs of methane. Farmers may then sell these credits in a market to entities seeking to offset their carbon emissions. In 2009, U.S. carbon prices ranged from $1 to $50 per metric ton of carbon dioxide-equivalent.84 In Europe, however, where many governments regulate carbon emissions, the demand for carbon credits is stronger and carbon prices are higher at about $20 per metric ton of carbon dioxide.85 If the United States begins to regulate carbon emissions, and creates an official carbon market, the price of carbon dioxide on U.S. markets will likely rise to an estimated $15.86
Carbon Markets and Agriculture
There are two types of greenhouse gases (GHG) for which farmers can receive credits: carbon dioxide (CO2) and methane (CH4). The earth’s soil can store or sequester carbon through the natural process of photosynthesis and a variety of agricultural practices can accelerate this process. Since soil stores carbon naturally in decayed vegetation, litter and roots, agricultural practices such as tillage, release carbon into the atmosphere as farmers stir up soils. As a result, changes in agricultural practices can either reduce the amount of carbon which agriculture releases into the atmosphere or increase the amount of carbon which agricultural soils store. Table III-7 details a variety of agricultural practices that can reduce carbon emissions or augment carbon sequestration.
83 Tacoma Daily Index. 2009. Cascade Land Conservancy: TDR program saves 90 acres of Pierce County Forest. July 19.
84 Hamilton, K., M. Sjardin, A. Shapiro, and T. Marcello. 2009. Fortifying to Foundation: State of the
Voluntary Carbon Markets 2009. Ecosystem Marketplace & New Carbon Finance. May.
85 Hamilton, K., M. Sjardin, A. Shapiro, and T. Marcello. 2009. Fortifying to Foundation: State of the Voluntary Carbon Markets 2009. Ecosystem Marketplace & New Carbon Finance. May.
86 Congressional Budget Office. 2009. H.R. 2454: American Clean Energy and Security Act of 2009. June 5.
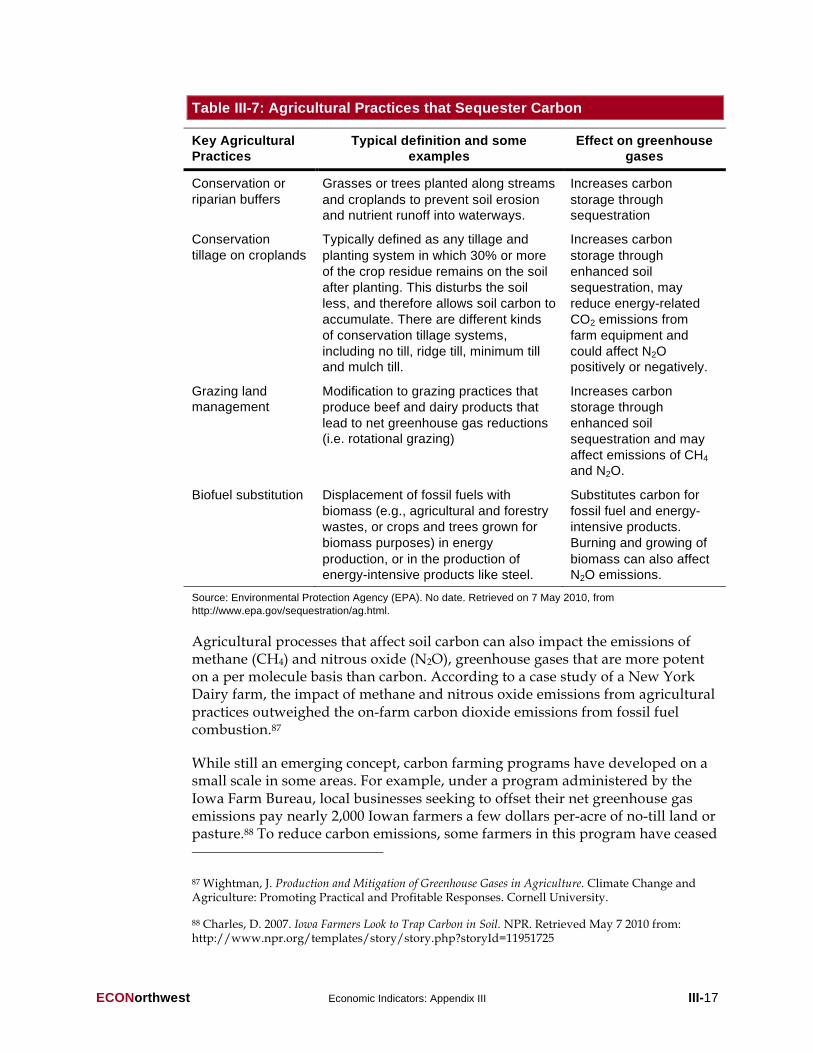
ECONorthwest Economic Indicators: Appendix III III-17
Table III-7: Agricultural Practices that Sequester Carbon
Key Agricultural Practices
Typical definition and some examples
Effect on greenhouse gases
Conservation or
riparian buffers
Grasses or trees planted along streams
and croplands to prevent soil erosion and nutrient runoff into waterways.
Increases carbon
storage through sequestration
Conservation
tillage on croplands
Typically defined as any tillage and
planting system in which 30% or more
of the crop residue remains on the soil
after planting. This disturbs the soil
less, and therefore allows soil carbon to
accumulate. There are different kinds
of conservation tillage systems,
including no till, ridge till, minimum till and mulch till.
Increases carbon
storage through
enhanced soil
sequestration, may
reduce energy-related
CO2 emissions from
farm equipment and
could affect N2O positively or negatively.
Grazing land management
Modification to grazing practices that
produce beef and dairy products that
lead to net greenhouse gas reductions (i.e. rotational grazing)
Increases carbon
storage through
enhanced soil
sequestration and may
affect emissions of CH4 and N2O.
Biofuel substitution Displacement of fossil fuels with
biomass (e.g., agricultural and forestry
wastes, or crops and trees grown for
biomass purposes) in energy
production, or in the production of energy-intensive products like steel.
Substitutes carbon for
fossil fuel and energy-
intensive products.
Burning and growing of
biomass can also affect N2O emissions.
Source: Environmental Protection Agency (EPA). No date. Retrieved on 7 May 2010, from
http://www.epa.gov/sequestration/ag.html.
Agricultural processes that affect soil carbon can also impact the emissions of methane (CH4) and nitrous oxide (N2O), greenhouse gases that are more potent on a per molecule basis than carbon. According to a case study of a New York Dairy farm, the impact of methane and nitrous oxide emissions from agricultural practices outweighed the on-farm carbon dioxide emissions from fossil fuel combustion.87
While still an emerging concept, carbon farming programs have developed on a small scale in some areas. For example, under a program administered by the Iowa Farm Bureau, local businesses seeking to offset their net greenhouse gas emissions pay nearly 2,000 Iowan farmers a few dollars per-acre of no-till land or pasture.88 To reduce carbon emissions, some farmers in this program have ceased
87 Wightman, J. Production and Mitigation of Greenhouse Gases in Agriculture. Climate Change and Agriculture: Promoting Practical and Profitable Responses. Cornell University.
88 Charles, D. 2007. Iowa Farmers Look to Trap Carbon in Soil. NPR. Retrieved May 7 2010 from: http://www.npr.org/templates/story/story.php?storyId=11951725

ECONorthwest Economic Indicators: Appendix III III-18
growing corn and soybeans on sections of land and transformed that land into pasture for cattle, which practice even grazing techniques. Grass and clover, whose roots grow deep and store more carbon, now cover this ground.
Carbon Markets in Washington State
In the United States, entities can buy and sell carbon offset credits on exchanges. The two prominent U.S. carbon markets are the Chicago Climate Exchange (CCX) and the Climate Action Reserve (CAR or Reserve). In 2009, carbon prices on these exchanges ranged from $1 to $50 per metric ton of carbon dioxide-equivalent and had a volume-weighted average price of $8.44.89 Both the CCX and the CAR provide opportunities for agricultural producers to earn credits through ecologically enhanced agricultural practices, which those farmers can later sell to businesses interested in offsetting greenhouse gas emissions. While these markets are voluntary, a federally mandated cap and trade program may emerge in the coming years.
Climate Action Reserve. The Climate Action Reserve is a national offsets program that has established regulatory-quality standards for the development, quantification and verification of greenhouse gas emissions reduction projects. The CAR issues carbon offset credits known as Climate Reserve Tonnes (CRT), which approved carbon reduction projects can generate. The Reserve tracks the transaction of these CRT credits over time in a publicly-accessible system.
The CAR currently has one project available for agricultural producers to earn CRT credits. In this program, livestock farmers install biogas control systems that capture and destroy methane from manure treatment and storage facilities on livestock operations. The project accepts the following types of technologies: 1) centralized digesters; 2) co-digestion of organic waste; 3) on- or off-site methane destruction; 5) methane destroyed as fuel for vehicles; and 6) biogas destruction in fuel cells.
Eligibility for this project, requires a performance standard and a regulatory test, which ensures that the project exceeds reductions that would have occurred under federal, state or local regulations. The project is furthermore subject to a baseline assessment, which determines what the “business as usual” conditions are, or in other words, what would have happened without the biogas system installation. Projects may receive credits for 10 years from their start dates and require annual accounting with at least one verification per year.90
While there are no other eligible agricultural offset projects available under the CAR, the Reserve is assessing other types of projects that would allow
89 Hamilton, K., M. Sjardin, A. Shapiro, and T. Marcello. 2009. Fortifying to Foundation: State of the
Voluntary Carbon Markets 2009. Ecosystem Marketplace & New Carbon Finance. May.
90 Climate Action Reserve. No date. Livestock Project Reporting Protocol v2.1: Protocol Summary.
ECONorthwest Economic Indicators: Appendix III III-19
agricultural producers to earn offset credits. Their investigation is currently focused on the viability of carbon soil sequestration in cropland and rangeland.91
Chicago Climate Exchange. The second prominent national carbon offset market is the Chicago Climate Exchange (CCX). Established in 2003, the CCX is an “active voluntary, legally binding integrated trading system to reduce emissions of all six greenhouse gases, with offset projects worldwide.” CCX issues tradable Carbon Financial Instrument (CFI) contracts to owners of eligible projects, which sequester, destroy, or displace GHG emissions. Since May, 2007 farmers have generated carbon credits to sell on the Chicago Climate Exchange (CCX) by implementing eligible projects that increase the rate at which carbon is sequestered in their soils.92 Eligible projects for agricultural producers include a methane offset program, similar to its CAR counterpart, and an agricultural and rangeland soil carbon sequestration offset program.
Like the CAR, the CCX has developed standardized rules for issuing carbon credits for agricultural carbon-emission reductions and soil sequestration. Eligible projects include: 1) methane capture and combustion; 2) continuous no-till and strip-till cropping; 3) grass planting; 5) tree planting; and 6) improved rangeland management. The following projects are the two currently eligible agriculture offset projects available under the CCX.
• Methane Offset Projects. The basic CCX specifications for these projects require farmers seeking these credits to have activated their methane projects on or after January 1, 1999 and to have demonstrated clear ownership rights of the emission reductions from the destruction of methane. The CCX issues offsets at a rate of 21 metric tons of carbon dioxide per ton of methane combusted and at a rate equal to the lesser of the metered amount and a per animal default methane emissions rate.93
• Conservation Tillage. CCX issues CFI contracts for conservation tillage at a rate between 0.2 and 0.6 metric tons CO2 per acre per year. The basic CCX specifications for soil carbon management offset projects require a five year minimum contractual commitment to continuous no-till or strip-till (conservation tillage) on enrolled areas. The tillage practice furthermore must leave at least two-thirds of the soil surface undisturbed and at least two-thirds of the residue remaining on the field surface. Participants must enroll all carbon
91 Climate Action Reserve. No date. Future Protocol Development. Retrieved on May 7, 2010: http://www.climateactionreserve.org/how/protocols/future-protocol-development/#soilseq-cropland
92 National Carbon Offset Coalition. No date. “CCX Rangeland Soil Carbon Management Offsets.” Retrieved on March 27, 2008, from http://www.ncoc.us/images/Downloads/rangelandeligibilityandcounties.pdf
93 Chicago Climate Exchange. 2007. Agricultural Methane Emissions Offsets. August.

ECONorthwest Economic Indicators: Appendix III III-20
sequestration projects through a CCX-registered Offset Aggregator, which can schedule the projects for independent verification.94
Western Climate Initiative. In addition to these prominent national carbon markets, there are a number of statewide regional developments that may impact the future of greenhouse gas offset trading and markets in Washington State. The two most prominent examples are the Western Climate Initiative (WCI) and the recent legislation passed by the State legislature that may eventually result in the creation of a state- or region-wide carbon market.
In 2007 the Governors of Washington, Oregon, California, Arizona, and New Mexico established the Western Climate Initiative (WCI), which aims to tackle climate change by identifying, evaluating, and implementing policies that reduce GHG emissions. In the establishment of the WCI, the Governors specifically called for including an emissions registry and the design of an economy-wide market-based offset system.95
In September 2008, the WCI released its Design Recommendations for the WCI Regional Cap-and-Trade Program, which lays out the framework for a cap-and-trade program for GHG emissions. This cap-and-trade scheme, scheduled to commence on January 1, 2012, will cover companies in the electricity generation sector and industrial or combustion practices that emit more that 25,000 tons of CO2e annually. In 2015, the coverage is scheduled to expand to incorporate transportation and domestic fuels as well as industrial combustion below the 25,000 threshold.96 While these recommendations represent a significant step forward, there is still a great deal of work that must be done before these states can implement a comprehensive cap-and-trade program. To that end, the WCI has scheduled its next work plan, which will set out tasks and timelines for completion.97
The WCI design recommends agriculture as one of its three areas of priority for offset projects; the others are forestry and waste management. The program limits the use of offset credits to 49 percent of the total required reductions. There will be no restrictions on the location of these offset projects, although all of the projects must meet strict criteria set by the WCI. 98 Basic guidelines for WCI offset project eligibility are included in Table III-8. These criteria include both the
94 Chicago Climate Exchange. 2008. Soil Carbon Management Offsets. September.
95 Matthews, L. 2009. Regional Cap-and-Trade Programs to Cut Global Warming Emissions. Environmental Council of the States. March.
96Hamilton, K., M. Sjardin, A. Shapiro, and T. Marcello. 2009. Fortifying the Foundation: State of Voluntary Carbon Markets 2009. Ecosystem Marketplace and New Carbon Finance. 20 May.
97 Matthews, L. 2009. Regional Cap-and-Trade Programs to Cut Global Warming Emissions. Environmental Council of the States. March.
98 Matthews, L. 2009. Regional Cap-and-Trade Programs to Cut Global Warming Emissions. Environmental Council of the States. March.

ECONorthwest Economic Indicators: Appendix III III-21
approved project offsets and the projects that the WCI plans to review for future consideration.
Table III-8: WCI Offset Project Eligibility
Eligible project offsets Projects that will be reviewed for future
consideration in the offset program
Afforestation or reforestation on acreage not forested after January 1, 2008
Controlled wastewater treatment
Landfill methane Conversion of cropland to rangeland or grassland
Manure management Forest management resulting in an
additional increase in forest stand volume
Methane collection at coal mines Practices that increase agricultural soil
carbon sequestration
Recycling and waste minimization
Reduced deforestation
Reduction of nitrogen fertilizer or increase
in nitrogen use efficiency.
Source: Adapted by ECONorthwest from Western Climate Initiative, 2009, Offset Limit Recommendation Paper,
October 6.
Greenhouse Gas Cap and Trade in Washington. Several recent legislative developments in Washington State may impact future greenhouse gas emission regulations. In turn, these potential regulations may have an impact on the development of future state-wide carbon offset markets and trading. Significant legislative efforts aimed toward achieving emission reductions began in 2007 with SB 6001, which outlined the Governor’s office policy recommendations for how the state could achieve GHG reduction goals. The bill included several measures that may impact agriculture and the carbon offset market, including the possible implementation of cap-and-trade systems, carbon sequestration projects, and the improvement of regulatory and tax policies.99
Most notably, Washington Governor Christine Gregoire signed the Climate Action and Green Jobs bill into law on March 13, 2008 (House Bill 2815). This bill authorizes Washington state officials to work with the Western Climate Initiative and commits Washington to a series of statewide emissions reductions. The bill aims to reduce emissions to 1990 levels by 2020, 25 percent below 1990 levels by 2035, and 50 percent below 1990 levels by 2050. Following this bill, the Washington Department of Ecology established the Agricultural Sector Workgroup on Climate Change Mitigation. In its final recommendations this
99 United States Environmental Protection Agency. State and Local Climate Energy Program: Washington. Retrieved on May 5, 2010, from http://www.epa.gov/slclimat/state/tracking/individual/wa.html

ECONorthwest Economic Indicators: Appendix III III-22
group suggested that agriculture should be “allowed to provide greenhouse gas emission reduction offsets into a regional cap and trade program.”100
Most recently, in March 2009, Governor Gregoire expanded on these earlier declarations by ordering state actions toward reducing climate-changing greenhouse gas emissions.101 Among other requirements, the Executive Order directs state agencies to work with the WCI to develop regional emissions reduction program designs and to work with the Department of Natural Resources to develop a forestry and agricultural offset program.102
100 Agricultural Sector Workgroup on Climate Change Mitigation. 2008. Recommendations for the Development of Agricultural Sector Carbon Offsets in Washington State. October.
101 Department of Ecology, State of Washington. 2009. Washington’s Leadership on Climate Change: 2009 Executive Order. Retrieved on May 7, 2010, from http://www.ecy.wa.gov/climatechange/2009EO.htm. May 21.
102 Department of Ecology, State of Washington. No date. Forestry and Agriculture: Agricultural Sector Working Group. Retrieved on May 7, 2010, from http://www.ecy.wa.gov/climatechange/2008FA_agr.htm.