Economic Impacts of Visitor Spending in Protected Areas in ...
37
Economic Impacts of Visitor Spending in Protected Areas in Developing Countries Tourism Economic Model for Protected Areas (TEMPA) Thiago Souza, Instituto Chico Mendes de Conservação da Biodiversidade (ICMBio) Alex Chidakel, University of Florida Brian Child, University of Florida and STAP Panel Member Wen H. Chang, US Army Corps of Engineers Virginia Gorsevski, STAP Secretariat Version July 2018 1
Transcript of Economic Impacts of Visitor Spending in Protected Areas in ...
Economic Impacts of Visitor Spending in Protected Areas in Developing Countries
Tourism Economic Model for Protected Areas (TEMPA)
Thiago Souza, Instituto Chico Mendes de Conservação da Biodiversidade (ICMBio) Alex Chidakel, University of Florida Brian Child, University of Florida and STAP Panel Member Wen H. Chang, US Army Corps of Engineers Virginia Gorsevski, STAP Secretariat
Version July 2018
1
Table of Contents
Tables Table 1: Decision box for selecting the appropriate level of information and rigor (adapted from Stynes et al., 2000). 9 ..................................................................................Table 2: Attributes of the generic regions (Stynes et al., 2000). 12 ...................................Table 3: Basic data 15 .........................................................................................Table 4: Visitor segments 16 ..................................................................................Table 5: Visitor spending 16 ..................................................................................Table 6: Direct effects of visitor spending 17 ..............................................................Table 7: Total effects of visitor spending (at a national level) 18 ......................................Table 8: Total effects of visitor spending (at a park and local level) 19 ...............................Table 9: Taxes from visitor spending 20 .....................................................................Table 10: Summary of tourism in South Luangwa 23 ......................................................Table 11: Direct effects of visitor spending in South Luangwa across all expenditure categories 24 Table 12: Direct effects of visitor spending in the Brazilian park system across all expenditure categories 24 ....................................................................................................Table 13: Direct and total effects of visitor spending in South Luangwa on Zambian economy 25 Table 14: Direct and Total Economic Impacts of Visitor Spending in Brazilian Protected Areas Analysis (US$) 26 ...............................................................................................Table 15: Example of national level marginal effects per dollar of spending and per 1,000 bed-nights at South Luangwa National Park, Zambia. 27 ......................................................Table 16: Example of Tax Impacts of Direct Sales and Income at South Luangwa National Park, Zambia. 28 ......................................................................................................Table 17: Total Economic Value of South Luangwa National Park to the Local and Zambian Economy (excluding international value added). 32 ......................................................Table 18: Economic contributions of visitor spending to Brazil’s national economy 36 .............
Summary 4 .......................................................................................................Introduction 5 ...................................................................................................Economic multipliers 7 ........................................................................................Estimating the economic effects of visitor expenditure 8 ...............................................
Variable 1: Number of Visitors 9 ..........................................................................
Variable 2: Visitor Spending 10 ...........................................................................
Variable 3: Economic Multipliers 11 ......................................................................
3. Survey-based approach to calculate indirect and induced effects: 12 ..........................
The spreadsheet model 15 .................................................................................
Entering the data 15 .......................................................................................
In order to facilitated learning the tables in this section present real data from South Luangwa National Parks - Zambia. 15 ....................................................................
Data interpretation 20 ......................................................................................
Presenting results 25 .......................................................................................
Basic tourism data 25 .......................................................................................
Making the economic case for protected areas using this data 25 ..................................
Errors and Assumptions 28 ...............................................................................
Conclusion 28 ...................................................................................................Appendix A: Socio - Economic Impacts of South Luangwa National Park in Zambia 29 .............Appendix B: National Case Study - Economic Impacts of Tourism in Protected Areas of Brazil 31 REFERENCES 35.................................................................................................
2
Figures Figure 1: Expenditure by visitor category in South Luangwa National Park (SLNP) 28 ..............Figure 2: The economy of the protected area system in Brazil. 29 ...................................Figure 3: Total value added from tourism in South Luangwa National Park. 33 ......................Figure 4: Financial and economic assessment of Brazil's Parks Estate. 36 ............................Figure 5: Analysis of the economic return on investment in improving tourism facilities in Brazil's Parks Estate. 37 .......................................................................................
Boxes Box 1: Common measures of economic impact and their relevancy for reporting (adapted and modified from Driml and McLennan, 2010). 21 ............................................................Box 2. Using an inverted pyramid to describe a park economy, and its vulnerabilities 30 .........Box 3: Survey used to assess tourism expenditure in Brazil. 35 ........................................
3
Estimating the Economic Impacts of Visitor Spending
In Terrestrial Protected Areas in Developing Countries
Summary
Well governed and effectively managed protected areas, including national parks, are a proven method for safeguarding both habitats and populations of species and for delivering important ecosystem services . Researchers estimate that global gross direct expenditure 1
associated with visits to protected areas is approximately $600 billion/year worldwide. If 2
managed well, parks that attract tourists can direct benefit local communities through visitor spending on accommodation, transportation, goods and services during their visit, indirect supply-chain spending, and other economic activities induced by the presence of the park and park operations themselves. However, in the absence of tools or metrics for quantifying tourism-related economic benefits, the true value of nature-based tourism and its relative importance can be overlooked. Conversely, careful measurement and clear display of information regarding the benefits of tourism expenditure for the local and national economy can help build the case for improvements in infrastructure for the park and surrounding area.
As part of a larger effort to assess the socio-economic impacts of GEF-funded Protected Areas, the Tourism Economic Model for Protected Areas (TEMPA) was developed to help guide project managers and others in the collection, analysis and display of tourism spending data using an easy to use spreadsheet-based tool, which is also provided. Despite the fact that economic impact analysis has been applied in many countries, such as, USA, Canada, Australia, Finland, Namibia, and South Africa, this preliminary version of the tool and accompanying spreadsheet represents an initial step in a longer process of testing and refining TEMPA in a wide range of protected area categories globally. At present, TEMPA has been tested only in one selected park in Southern Africa, and nationally for Brazil. Results show significant direct and indirect economic gains from parks at the local and national level. It is hoped that the widespread use of tools such as TEMPA can continue to build from this effort to highlight the important multi-faceted role that protected areas play in supporting nature and livelihoods.
A note on definitions
In this report, we use the terms “protected area,” “national park,” and “park” interchangeably. Officially, however, protected areas – defined as “A clearly defined geographical space, recognized, dedicated and managed, through legal or other effective means, to achieve the long-term conservation of nature with associated ecosystem services and cultural values” include several management categories including national park. national park is defined as “Large natural or near-natural areas protecting large-scale ecological processes with characteristic species and ecosystems, which also have environmentally and culturally compatible spiritual, scientific, educational, recreational and visitor opportunities.” 3
4
Introduction
In the early 21st century, protected areas, including national parks, are the main way by which an increasingly urban human population (3.7 billion) can connect with the nature . Protected 4
areas receive more than 8 billion visits globally every year, with an overall economic value of US$ 600 billion . In order to arrest the 6th extinction , it will be necessary to protect up to 5 6
half the Earth’s terrestrial surface area . By the end of this century human population is 7
projected to reach 11.2 billion , with the greatest increases taking place in tropical 8
developing countries, especially in Africa . This will place extreme pressures on parks, many 9
of which are located on marginal lands.
Well established parks, including those located in the United States, are often based on socio-economic gain and public accountability . Parks that integrate local people as stakeholders 10
have been shown to be more effective at achieving both biological conservation and socioeconomic development outcomes .Consequently, precisely measuring the economic 11 12
value and other values of parks (nationally, and in their local gateway communities), strengthens the case for nature conservation.
Agencies that manage national parks are accustomed to producing financial reports which deal with direct income and costs (including gate fees, concessions, resource royalties, etc.). However, this perspective fails to consider the wider economic effects of parks, including their monetary value and the employment they generate for regional economies, which 13
often amounts to many times the direct costs of running the park.
Parks provide value in many forms, including ecosystem services, biodiversity conservation, human enjoyment, and conventional activity. This manual and associated tools measures only the latter; the contribution of parks to national and local economies through visitor spending on accommodation, transport, goods and services during their visit, indirect supply-chain spending, economic activity induced by the presence of the park, and park operations themselves. Narrow financial analyses significantly under-value parks in the eyes of 14
decision-makers, businesses, the media and the general public, compared to the larger economy stimulated by tourism expenditure. To estimate the full value of parks and to raise greater public support, several countries have begun conducting economic analyses of wider park-related spending. These include Brazil, the USA, , Canada, Australia, , Finland, 15 16 17 18 19
Namibia, and South Africa. 20 21
The STAP project “Guidance on the Socio-Economic Impacts of Protected Areas”, presents two sets of tools for estimating the economic efect of park-based tourism and highlights the wider value of parks.
• Tool 1: A “Tourism Economic Model for Protected Areas (TEMPA)” uses a spreadsheet model to combine basic information on tourism numbers, expenditure and economic multipliers to estimate economic impact. The spreadsheet model is based on the Money Generation Model (MGM2), a system used by the US National Parks Service (NPS) . It is modified to address the particular issues of developing countries and also 22
to include country-specific multipliers, where available.
• Tool 2: A set of tourism and park business surveys provides bottom-up methods for assessing much the same information as TEMPA so are useful for cross-checking data. This tool takes longer to use but provides much more detailed information on visitor lodges, employment, the size and nature of local businesses, etc.
5

This manual describes the first tool - Tourism Economic Model for Protected Areas (TEMPA). It will help managers and consultants design a study for a specific park, gather the right information, and present the results. It:
• describes how to collect data to use the model; • provides several sample survey instruments; • explains how to use the spreadsheet and analyze the results; and • outlines how to present and explain the results effectively.
The manual was designed to be used with different levels of information, depending on the budget, time, and capacity constraints that a park manager may face. Two case studies, one of a single park (South Luangwa National Park, Zambia, Appendix A), and another of a park network (Federal System of Protected Areas of Brazil, Appendix B) are presented to illustrate how the methodology can be applied.
TEMPA is limited to market values that can be easily measured and understood. It does not account for the value of ecosystem services, or for non-market benefits including option values and existence values or for consumer surplus. 23
6
Economic multipliers
Visitors spend money in parks and gateway communities. This money cycles through the economy ‘multiplying’ the effects of the initial expenditure. Visitor spending includes both 24
direct “effects” (i.e. income, jobs, value added, taxes, etc.) as well as indirect and induced effects (i.e. multiplier effects):
• Direct effects are from the first level of visitor spending on businesses that sell directly to visitors (e.g., lodges, campgrounds, restaurants, grocery stores, etc.), plus sales to visitors by other businesses such as vegetables or crafts that are produced in the vicinity of the park. 25
• Indirect effects are from various additional rounds of spending where direct businesses such as lodging and restaurants buy goods and services from other businesses within the local region to support their goods and services. 26
• Induced effects are from various additional rounds of spending which occurs when the staff employed either directly or indirectly from the visitor spending stated above spend their wages and salaries locally. For example, when a lodge manager spends his or her salary on meals, gas, hardware, etc., this supports additional jobs in non-tourism businesses, and creates additional rounds of local spending across a broad range of economic sectors . 27
The total effect of visitor spending equals the sum of direct, indirect, and induced effects. 28
The secondary effect is the sum of the indirect plus the induced effects. Measuring and adding up these values can be complicated. Fortunately, these effects can be captured by economic input-output (I-O) models, where the effects of spending by consumers and producers can be estimated using regional economic multipliers. 29
Multipliers are ratios by which direct effects are multiplied to give secondary or total effects. The size of a multiplier is affected by the amount of leakage from the economy, which is the rate at which money brought into a region is lost through the purchase of imports. Multipliers are higher when there is little leakage, and most of the money circulates repeatedly through the economy. Conversely, multipliers are lower if the money immediately leaves the local economy to buy inputs from elsewhere. Small variations in multiplier values therefore lead to large variations in total effects estimates. Multiplier ratios are relatively imprecise so estimates of total or secondary effects should not be interpreted with the same level of precision as direct effects.
This manual offers two general practices which can be used to analyze the economic contribution and economic impact of parks. The ‘economic contribution’ captures the gross economic activity generated in the regional economy by all visitors to the protected area, including local visitors. ‘Economic Impact’ analysis estimates the net changes on the regional economy generated by new money brought into the local economy by non-local visitors. Economic impacts exclude spending by local visitors based on the assumption that if they decide not to visit the park, they would spend the money on another recreational activity within the local region (Cullinane et al., 2014).
7

Estimating the economic effects of visitor expenditure
The basic calculations for calculating the economic effects of visitor expenditure are presented in this simple equation: 30 31
Economic Effects = Number of Visitors * Average spending per visitor * Economic multipliers
To complete the analysis, the researcher undertaking a park study needs to collect or estimate the following:
1. the number of visitors who visit the parks and surrounding area; 2. the average spending per visitor in the region, and; 3. apply economic multipliers to measure the ripple effects of expenditure within the
region.
The TEMPA tool is a spreadsheet into which this data can be entered. This will be described in detail below.
Depending on available resources and the degree of accuracy desired, the study can obtain this data at three levels of rigor:
1. Subjective estimates of the variables made by expert judgment. 2. Secondary, or existing data, or economic models. 3. Primary, or original data, can be collected, and in such a way that each of the variables
will be represented by actual measurements.
A decision box (Table 1) illustrates how the three levels of rigor apply to each of the three input variables. The number of visitors is the most important piece of information, followed by visitor spending, and finally, economic multipliers . If resource constraints apply, 32 33
managers should focus on reliable visitor numbers first and have confidence in expenditure estimates. Sector-specific generic multipliers may then be found on the accompanying spreadsheet.
8
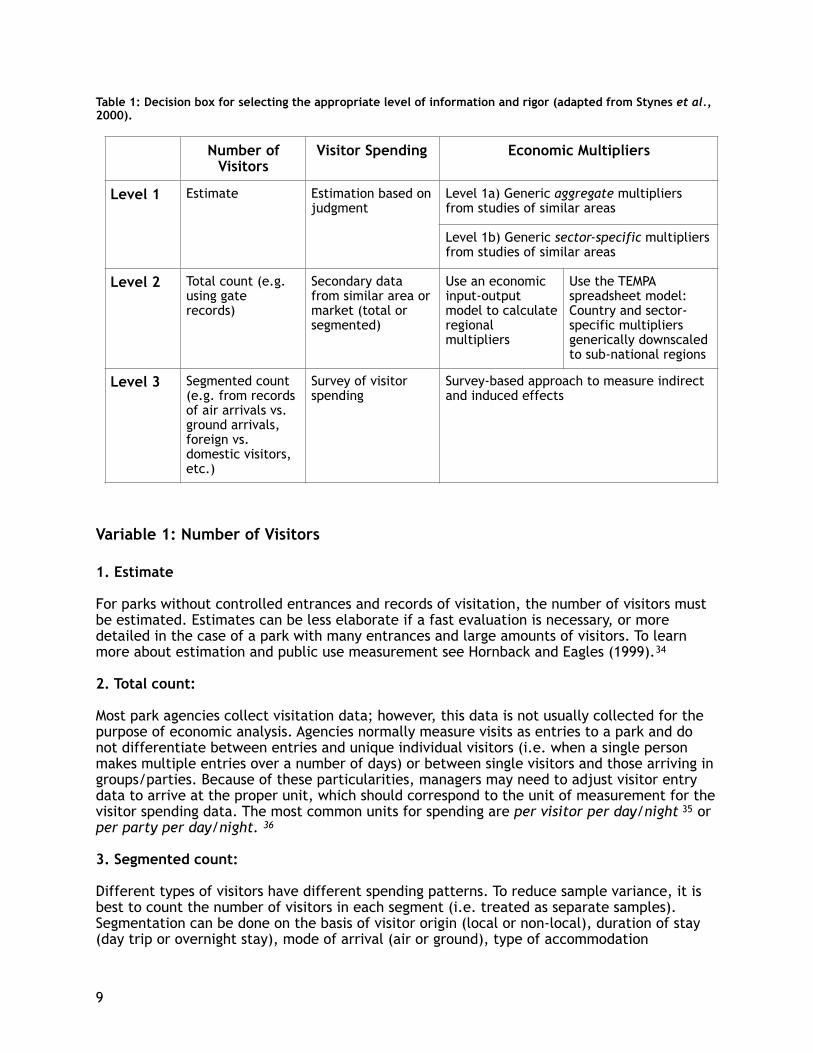
Table 1: Decision box for selecting the appropriate level of information and rigor (adapted from Stynes et al., 2000).
Variable 1: Number of Visitors
1. Estimate
For parks without controlled entrances and records of visitation, the number of visitors must be estimated. Estimates can be less elaborate if a fast evaluation is necessary, or more detailed in the case of a park with many entrances and large amounts of visitors. To learn more about estimation and public use measurement see Hornback and Eagles (1999). 34
2. Total count:
Most park agencies collect visitation data; however, this data is not usually collected for the purpose of economic analysis. Agencies normally measure visits as entries to a park and do not differentiate between entries and unique individual visitors (i.e. when a single person makes multiple entries over a number of days) or between single visitors and those arriving in groups/parties. Because of these particularities, managers may need to adjust visitor entry data to arrive at the proper unit, which should correspond to the unit of measurement for the visitor spending data. The most common units for spending are per visitor per day/night or 35
per party per day/night. 36
3. Segmented count:
Different types of visitors have different spending patterns. To reduce sample variance, it is best to count the number of visitors in each segment (i.e. treated as separate samples). Segmentation can be done on the basis of visitor origin (local or non-local), duration of stay (day trip or overnight stay), mode of arrival (air or ground), type of accommodation
Number of Visitors
Visitor Spending Economic Multipliers
Level 1 Estimate Estimation based on judgment
Level 1a) Generic aggregate multipliers from studies of similar areas
Level 1b) Generic sector-specific multipliers from studies of similar areas
Level 2 Total count (e.g. using gate records)
Secondary data from similar area or market (total or segmented)
Use an economic input-output model to calculate regional multipliers
Use the TEMPA spreadsheet model: Country and sector-specific multipliers generically downscaled to sub-national regions
Level 3 Segmented count (e.g. from records of air arrivals vs. ground arrivals, foreign vs. domestic visitors, etc.)
Survey of visitor spending
Survey-based approach to measure indirect and induced effects
9

(camping, staying family/friends, budget accommodation, luxury accommodation, etc.), or any other basis that is likely to affect spending patterns, and for which the annual numbers of visitors in each category can be determined. 37
Variable 2: Visitor Spending
Visitor expenditures are the primary link between tourism activity and local economies. The quality of the study therefore is directly related to the reliability of the visitor spending data. Collection of this information should be guided by the accuracy desired and the resources available. 38
1. Estimate spending profiles based on judgment:
Estimating visitor spending usually requires listing the services and goods that visitors typically purchase and pricing these components. One may assume a certain average nightly 39
rate for accommodation, and the average cost of a day’s worth of meals, shopping, transportation, etc. It is also possible to use estimates of visitor spending to calculate what a theoretical future park could earn, to assess whether it is a good investment.
2. Secondary data from a similar area or market:
The second option is to use visitor spending profiles found in reports or literature for similar parks in similar regions and to assume that your visitor expenditures are comparable.
3. Survey of visitor spending:
The most reliable method of estimating expenditures is to directly survey visitors. Surveys 40 41
can be conducted through in-person interviews at sites within or near to the park (e.g. local transportation hubs), or by distributing questionnaires that can be dropped off or returned by using pre-paid mail. It may also be possible to collect data remotely if e-mail addresses or phone numbers are obtained from visitors.
However, because visitors in certain markets are more likely to have purchased their trip as a package in which other destinations are bundled together into a single price by a travel agent, they may not be aware of the costs of the park portion of their trip. If this is the case, it may be necessary to conduct a survey of tourism businesses (see the section on the survey-based approach to improving the accuracy of multiplier estimates, below). Whatever the approach, it is important to test the survey strategy before investing in it fully. 42
For additional information on visitor surveys, including short samples, refer to Crompton (2010). For more information on sampling and respondent approach techniques, safety issues, ethics, etc., refer to Driml & McLennan (2010).
See Appendix A for a questionnaire based on Crompton (2010) that was used to collect data for a national study on parks in Brazil.
See Appendix B for a more comprehensive questionnaire for visitors to South Luangwa National Park (SLNP), Zambia.
10
Variable 3: Economic Multipliers
Input-Output (I-O) tables are used to calculate multipliers. I-O matrices (and extended forms called “social accounting matrices”) are models usually produced by government agencies that describe in a quantitative way the interactions between producers and consumers in a specific region and therefore provide more accurate estimates of secondary economic effects than the use of generic multipliers. For references on I-O methodology see Miller and Blair. 43
To find I-O tables for a specific country or region, the International Input-Output Association (https://www.iioa.org/io-data/io-data.html) and the Eora MRIO database from Australia (http://www.worldmrio.com) provides a list of database resources. This section describes different options for obtaining the appropriate multipliers depending on available resources for the study.
1. Generic multipliers from similar studies or areas:
The use of generic multipliers was one of the first approaches used by the US National Parks Service (NPS) and is still used in other countries, such as Finland. “Generic” refers to the 44 45
use of multipliers developed from a specific area, and then applied to a different area possessing similar attributes, or the averaging of multipliers from different areas. As such, they are less reliable than multipliers developed from a specific area, though may be more available.
There are two options for park managers in using generic multipliers.
1. Generic Multipliers
The first option, if other sources of economic data are lacking, is to use a set of aggregate multipliers as Stynes describes for parks in the United States. Parks that are located in rural 46
areas tend to have higher job multipliers and lower economic multipliers than parks in more densely settled economic areas. This is mainly because goods will need to be imported into the area so the multipliers will occur where these goods are produced, rather than locally. After undertaking a large number of studies, Stynes et al., (2010) provided some generic 47
guidance for calculating multipliers for direct economic effects of developed economies:
"To derive direct effect, multiply total visitor spending by .8. For [output] multipliers, use 1.2 for small rural areas, 1.4 for larger rural areas, 1.5 for moderate size communities, and 1.7 for state or metro area analyses. To convert to full-time equivalent jobs and to income, national tourism average ratios for direct effects could be used (i.e., 20 jobs per $1 million in [output] or 16 jobs per $1 million of visitor spending). The income ratio is approximately 35% relative to [output] and 28% relative to spending. These ratios are averages. They will vary by sector, and job ratios are higher in rural areas and smaller in large metro regions." (in Crompton, 2010) . 48
The second option is to use sector-specific generic multipliers retrieved from economic studies in different regions.
2. Use an economic input-output model to calculate regional multipliers
Due to the complexities associated with computing multipliers, this requires some background in the methods of input-output matrices. Park and recreation professionals are not expected
11
to possess this technical background, so TEMPA was developed with a spreadsheet interface to enable users to do use it. The spreadsheet includes sector-specific multipliers.
So far, the model provides five set of multipliers that the user can select between the size of the park region (So far, the spreadsheet has sets from Brazil, Zambia and South Africa, over time, more countries will be added to). To set the correct multipliers in the spreadsheet, the user needs to select the country and the size of the study area based on Table 2.
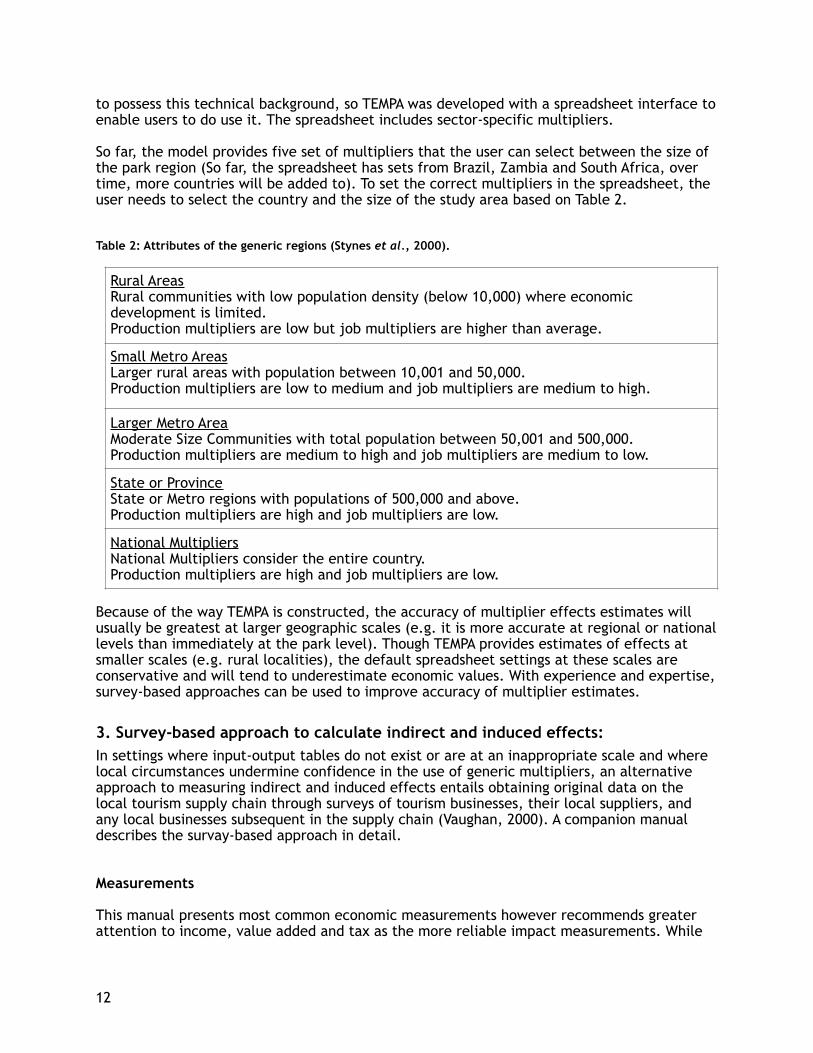
Table 2: Attributes of the generic regions (Stynes et al., 2000).
Because of the way TEMPA is constructed, the accuracy of multiplier effects estimates will usually be greatest at larger geographic scales (e.g. it is more accurate at regional or national levels than immediately at the park level). Though TEMPA provides estimates of effects at smaller scales (e.g. rural localities), the default spreadsheet settings at these scales are conservative and will tend to underestimate economic values. With experience and expertise, survey-based approaches can be used to improve accuracy of multiplier estimates.
3. Survey-based approach to calculate indirect and induced effects: In settings where input-output tables do not exist or are at an inappropriate scale and where local circumstances undermine confidence in the use of generic multipliers, an alternative approach to measuring indirect and induced effects entails obtaining original data on the local tourism supply chain through surveys of tourism businesses, their local suppliers, and any local businesses subsequent in the supply chain (Vaughan, 2000). A companion manual describes the survay-based approach in detail.
Measurements
This manual presents most common economic measurements however recommends greater attention to income, value added and tax as the more reliable impact measurements. While
Rural Areas Rural communities with low population density (below 10,000) where economic development is limited. Production multipliers are low but job multipliers are higher than average.
Small Metro Areas Larger rural areas with population between 10,001 and 50,000. Production multipliers are low to medium and job multipliers are medium to high.
Larger Metro Area Moderate Size Communities with total population between 50,001 and 500,000. Production multipliers are medium to high and job multipliers are medium to low.
State or Province State or Metro regions with populations of 500,000 and above. Production multipliers are high and job multipliers are low.
National Multipliers National Multipliers consider the entire country. Production multipliers are high and job multipliers are low.
12
effects can be presented aggregate or by spending categories, impacts are presented in terms of sales, value added, personal income, jobs and tax (Stynes et al., 2000, Souza et al., 2018): • 1. Sales are the sales of business within the region to visitors after considering the capture
rate. • 2. Jobs corresponds to the number of jobs supported by tourist spending. Jobs effects
consider full-time, part-time and seasonal jobs. • 3. Personal income refers to proprietor’s income, salary income and wages. • 4. Value added is a contribution measurement of a region or industry to the gross product,
national or state. Rents and profits, personal income and indirect business taxes summed are included in Value Added. It corresponds to the final price of the product or service after removal of the costs of production minus non-labor.
• 5. Tax is the amount of taxes generated by total economic impacts
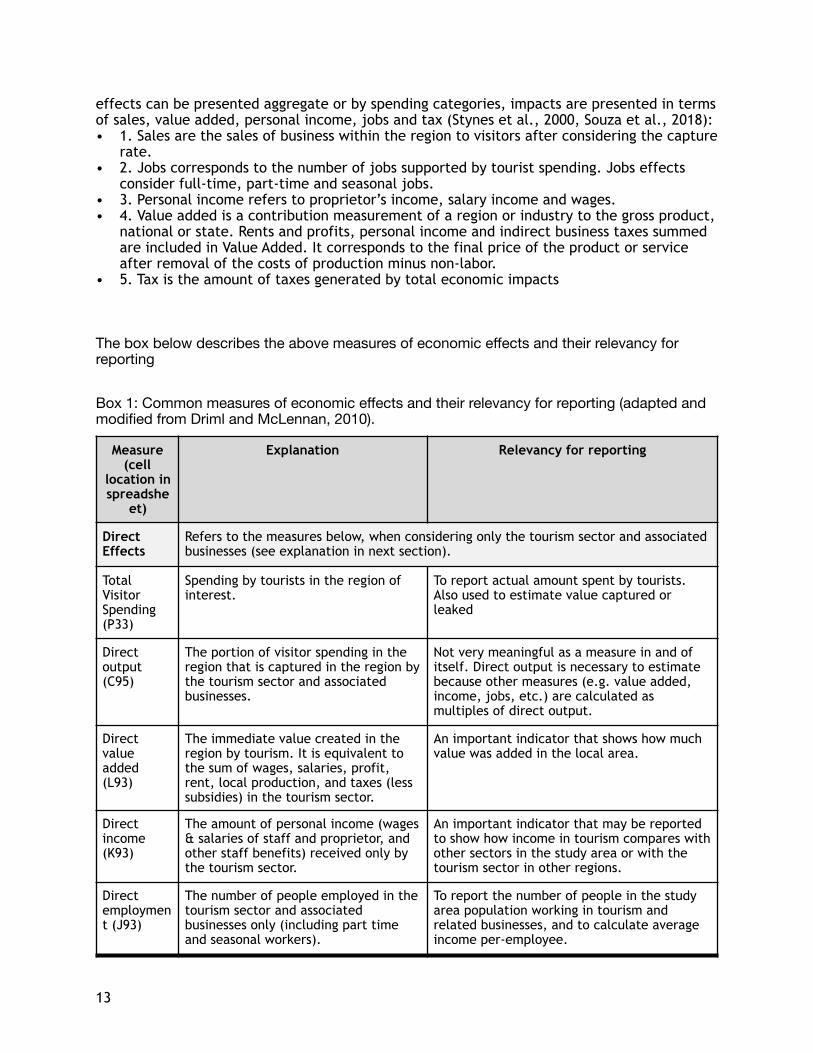
The box below describes the above measures of economic effects and their relevancy for reporting
Box 1: Common measures of economic effects and their relevancy for reporting (adapted and modified from Driml and McLennan, 2010).
Measure (cell
location in spreadshe
et)
Explanation Relevancy for reporting
Direct Effects
Refers to the measures below, when considering only the tourism sector and associated businesses (see explanation in next section).
Total Visitor Spending (P33)
Spending by tourists in the region of interest.
To report actual amount spent by tourists. Also used to estimate value captured or leaked
Direct output (C95)
The portion of visitor spending in the region that is captured in the region by the tourism sector and associated businesses.
Not very meaningful as a measure in and of itself. Direct output is necessary to estimate because other measures (e.g. value added, income, jobs, etc.) are calculated as multiples of direct output.
Direct value added (L93)
The immediate value created in the region by tourism. It is equivalent to the sum of wages, salaries, profit, rent, local production, and taxes (less subsidies) in the tourism sector.
An important indicator that shows how much value was added in the local area.
Direct income (K93)
The amount of personal income (wages & salaries of staff and proprietor, and other staff benefits) received only by the tourism sector.
An important indicator that may be reported to show how income in tourism compares with other sectors in the study area or with the tourism sector in other regions.
Direct employment (J93)
The number of people employed in the tourism sector and associated businesses only (including part time and seasonal workers).
To report the number of people in the study area population working in tourism and related businesses, and to calculate average income per-employee.
13
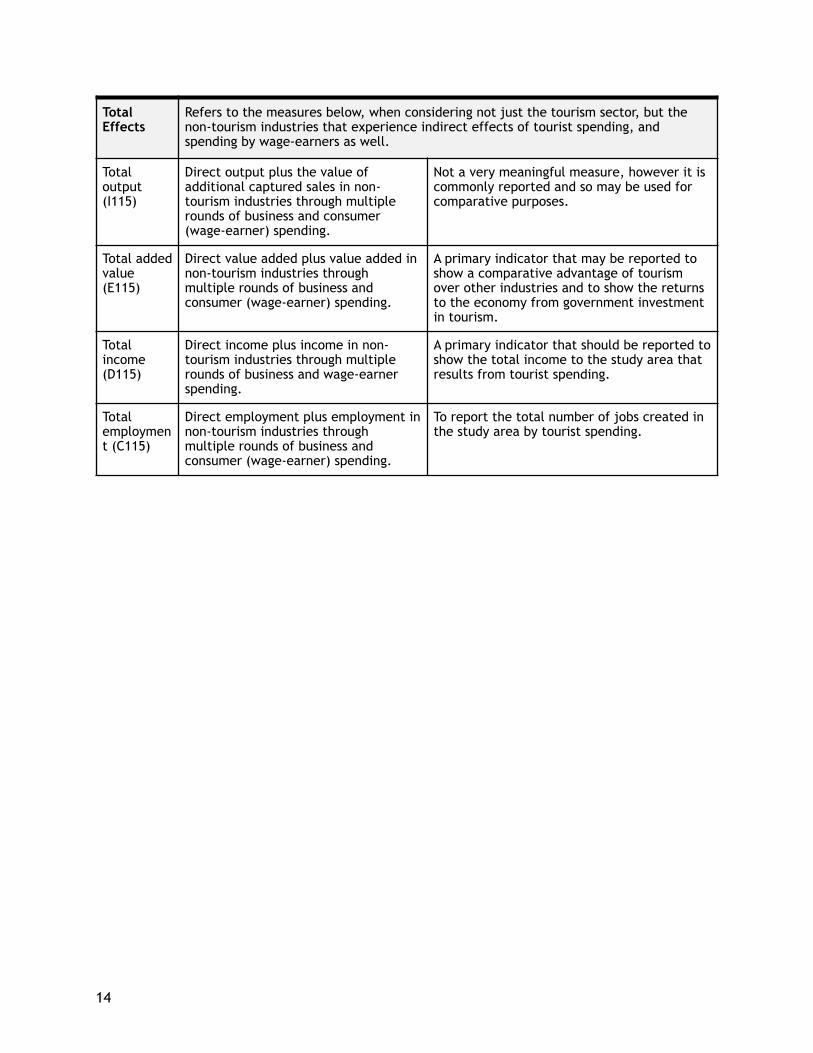
Total Effects
Refers to the measures below, when considering not just the tourism sector, but the non-tourism industries that experience indirect effects of tourist spending, and spending by wage-earners as well.
Total output (I115)
Direct output plus the value of additional captured sales in non-tourism industries through multiple rounds of business and consumer (wage-earner) spending.
Not a very meaningful measure, however it is commonly reported and so may be used for comparative purposes.
Total added value (E115)
Direct value added plus value added in non-tourism industries through multiple rounds of business and consumer (wage-earner) spending.
A primary indicator that may be reported to show a comparative advantage of tourism over other industries and to show the returns to the economy from government investment in tourism.
Total income (D115)
Direct income plus income in non-tourism industries through multiple rounds of business and wage-earner spending.
A primary indicator that should be reported to show the total income to the study area that results from tourist spending.
Total employment (C115)
Direct employment plus employment in non-tourism industries through multiple rounds of business and consumer (wage-earner) spending.
To report the total number of jobs created in the study area by tourist spending.
14
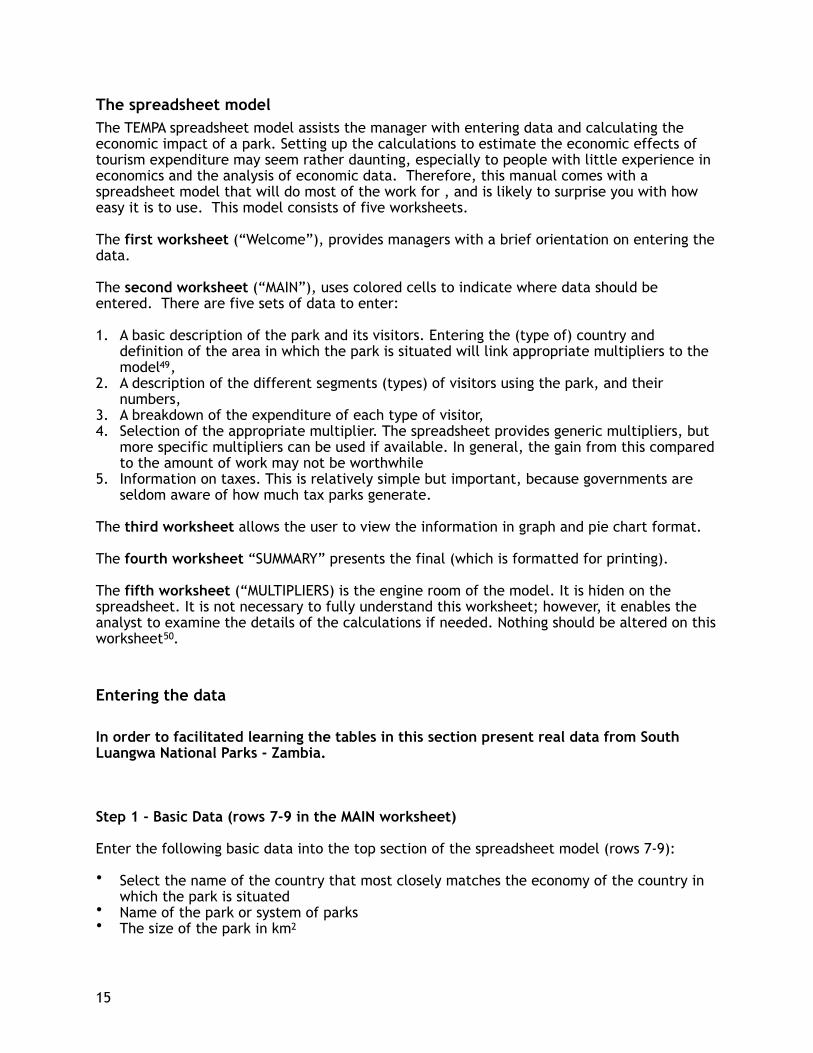
The spreadsheet model The TEMPA spreadsheet model assists the manager with entering data and calculating the economic impact of a park. Setting up the calculations to estimate the economic effects of tourism expenditure may seem rather daunting, especially to people with little experience in economics and the analysis of economic data. Therefore, this manual comes with a spreadsheet model that will do most of the work for , and is likely to surprise you with how easy it is to use. This model consists of five worksheets.
The first worksheet (“Welcome”), provides managers with a brief orientation on entering the data.
The second worksheet (“MAIN”), uses colored cells to indicate where data should be entered. There are five sets of data to enter:
1. A basic description of the park and its visitors. Entering the (type of) country and definition of the area in which the park is situated will link appropriate multipliers to the model , 49
2. A description of the different segments (types) of visitors using the park, and their numbers,
3. A breakdown of the expenditure of each type of visitor, 4. Selection of the appropriate multiplier. The spreadsheet provides generic multipliers, but
more specific multipliers can be used if available. In general, the gain from this compared to the amount of work may not be worthwhile
5. Information on taxes. This is relatively simple but important, because governments are seldom aware of how much tax parks generate.
The third worksheet allows the user to view the information in graph and pie chart format.
The fourth worksheet “SUMMARY” presents the final (which is formatted for printing).
The fifth worksheet (“MULTIPLIERS) is the engine room of the model. It is hiden on the spreadsheet. It is not necessary to fully understand this worksheet; however, it enables the analyst to examine the details of the calculations if needed. Nothing should be altered on this worksheet . 50
Entering the data
In order to facilitated learning the tables in this section present real data from South Luangwa National Parks - Zambia.
Step 1 - Basic Data (rows 7-9 in the MAIN worksheet)
Enter the following basic data into the top section of the spreadsheet model (rows 7-9):
• Select the name of the country that most closely matches the economy of the country in which the park is situated
• Name of the park or system of parks • The size of the park in km2
15
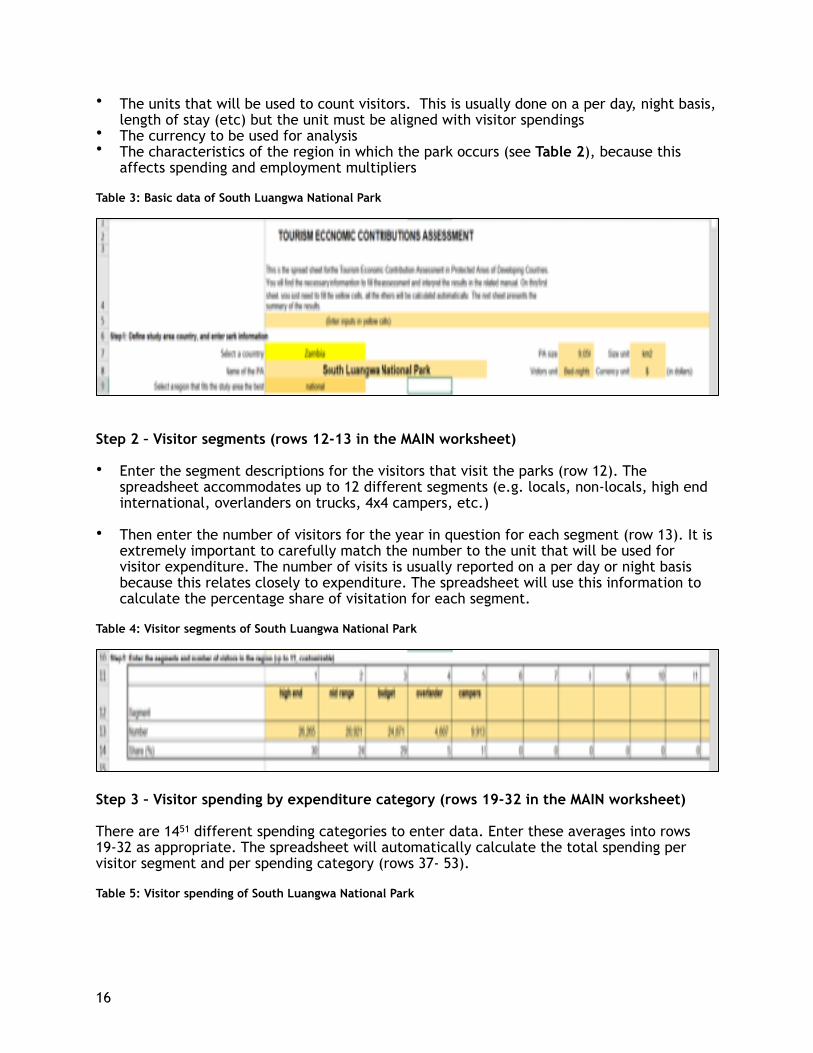
• The units that will be used to count visitors. This is usually done on a per day, night basis, length of stay (etc) but the unit must be aligned with visitor spendings
• The currency to be used for analysis • The characteristics of the region in which the park occurs (see Table 2), because this
affects spending and employment multipliers
Table 3: Basic data of South Luangwa National Park
Step 2 – Visitor segments (rows 12-13 in the MAIN worksheet)
• Enter the segment descriptions for the visitors that visit the parks (row 12). The spreadsheet accommodates up to 12 different segments (e.g. locals, non-locals, high end international, overlanders on trucks, 4x4 campers, etc.)
• Then enter the number of visitors for the year in question for each segment (row 13). It is extremely important to carefully match the number to the unit that will be used for visitor expenditure. The number of visits is usually reported on a per day or night basis because this relates closely to expenditure. The spreadsheet will use this information to calculate the percentage share of visitation for each segment.
Table 4: Visitor segments of South Luangwa National Park
Step 3 – Visitor spending by expenditure category (rows 19-32 in the MAIN worksheet)
There are 14 different spending categories to enter data. Enter these averages into rows 51
19-32 as appropriate. The spreadsheet will automatically calculate the total spending per visitor segment and per spending category (rows 37- 53).
Table 5: Visitor spending of South Luangwa National Park
16

Step 4 – Automatic calculation of effects of visitor spending The fourth step is pre-configured to automatically calculate the effects of tourism expenditure including:
Direct effects (row 75-93 in the MAIN worksheet) include:
• Total visitor spending (calculated in row 93 column C), in this case $ 28,496 million. • Capture Rate (row 94, column C) = the percentage of total tourism spending that is
captured by the national economy (in this case 99.7%). • Total value of sales captured locally (C95).
Once the capture rate is known (automatically calculated and presented in C94), the total value of sales captured locally can be calculated (C95).
The only cells that can be modified are Retail and Wholesale Margin (in yellow) if the user has comfortable of local economy to adjusted them
Table 6: Direct effects of visitor spending of South Luangwa National Park
17

The total effects of tourism expenditure are calculated automatically (row 99-115) in terms of jobs, personal income and value added (for each category of spending). South Luangwa National Park is a high-end destination and visitor spending will support 2,100 jobs in and around the park (C115), $7.9 million in personal income, and $17.2 million in Total Value Added.
Table 7: Total effects of visitor spending (at a park and local level) of South Luangwa National Park
18

Step 5 – Tax
Tax Computations, is optional, since will not influence other results. Taxes are inserted at step 5 in the data entry process. Spreadsheet users need to insert the respective sales/VAT and income tax rates in rows 122-137, columns D, E, and F for the appropriate region for the tax amounts to be calculated. In some cases, judgment should be used to arrive at a first order approximation of the average tax rate for that category.
Normally, provincial/state and national governments are responsible for taxes, so this table is less relevant in estimating local effects. However, it provides valuable perspective on the importance of the park to the government’s tax incomes. The spreadsheet calculates only taxes on the direct effects. Total tax income from direct sending is then automatically calculated and reported in cell J138.
Table 9: Taxes from visitor spending of South Luangwa National Park
19

Data interpretation
The "SUMMARY" worksheet presents the results of the economic effects analysis in a table series that can be copied into a report, a presentation, or printed. These results are illustrated for a single park (South Luangwa) but also for the Brazilian Protected Area system. 52
Basic tourism and expenditure statistics are summarized in rows 4-14 in the worksheet, showing that the average spending of 86,577 bed nights in South Luangwa NP is $329 per night.
Table 10: Summary of tourism in South Luangwa National Park
Direct Effects
Direct Effects summarizes the effects of park tourism expenditure only after the first round of spending. It usually represents only about half (or less) of the overall impact of tourism expenditure. The Direct Effects are extracted from the SUMMARY worksheet, rows 17-36.
For South Luangwa National Park:
• The Output of $28.419 million indicates that of the total amount spent (not shown), this is what was captured by the Zambian economy after the first round of spending.
• Jobs. Visitor spending results directly in the employment of 1,479 people.
• Personal Income of $7.688 million implies that of the $28 million in output, $7.688 million was earned as wages and salaries in businesses where visitors spent money.
• Valued added of $13.287 million means that of the $28 million in output, the amount that was earned as wages and salaries, plus the amount of profit, plus taxes, totals $13.287 million.
Table 11: Direct effects of visitor spending in South Luangwa across all expenditure categories
20

For Brazil, these data are provided for visitor spending in nearly 320 Parks in the Brazilian Protected Area System in 2015. (Table 12) 53
• The Output of $347 million means that of the total amount spent (not shown), this is what
was captured by the Brazilian Economy after the first round of spending.
• Jobs. Visitor spending results directly in the employment of 23,813 people.
• Personal Income of $153 million means that of the $347 million in output, $153 million was earned as wages and salaries in businesses where visitors spent money.
• Valued added of $195 million means that of the $347 million in output, the amount that was earned as wages and salaries, plus the amount of profit, plus taxes, totals $195 million.
Table 12: Direct effects of visitor spending in the Brazilian park system across all expenditure categories
Economic Impacts of Visitor Spending: Direct Effects in Brazilian Protected Areas Analysis (US$)
Direct Effects
Sector/Spending category Output Jobs Personal Income Value Added
Accommodation $84,310,383 5,193 $37,939,672 $48,900,022
Meals $76,042,342 5,838 $31,177,360 $38,021,170
Gas & oil $64,984,842 3,947 $29,893,027 $41,590,299
Local transportation $36,875,676 1,481 $12,906,486 $16,594,054
Activities and Guided Tours $64,745,257 6,106 $32,372,628 $36,904,796
21
Total Effects
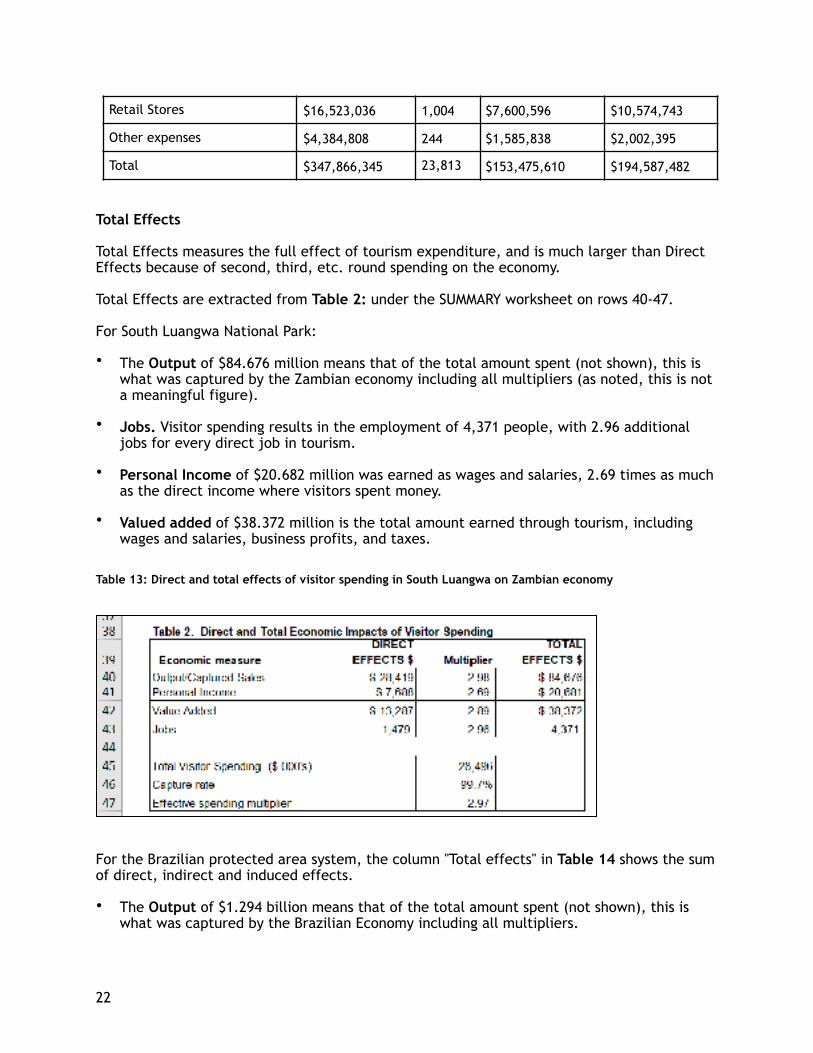
Total Effects measures the full effect of tourism expenditure, and is much larger than Direct Effects because of second, third, etc. round spending on the economy.
Total Effects are extracted from Table 2: under the SUMMARY worksheet on rows 40-47.
For South Luangwa National Park:
• The Output of $84.676 million means that of the total amount spent (not shown), this is what was captured by the Zambian economy including all multipliers (as noted, this is not a meaningful figure).
• Jobs. Visitor spending results in the employment of 4,371 people, with 2.96 additional jobs for every direct job in tourism.
• Personal Income of $20.682 million was earned as wages and salaries, 2.69 times as much as the direct income where visitors spent money.
• Valued added of $38.372 million is the total amount earned through tourism, including wages and salaries, business profits, and taxes.
Table 13: Direct and total effects of visitor spending in South Luangwa on Zambian economy
For the Brazilian protected area system, the column "Total effects" in Table 14 shows the sum of direct, indirect and induced effects.
• The Output of $1.294 billion means that of the total amount spent (not shown), this is what was captured by the Brazilian Economy including all multipliers.
Retail Stores $16,523,036 1,004 $7,600,596 $10,574,743
Other expenses $4,384,808 244 $1,585,838 $2,002,395
Total $347,866,345 23,813 $153,475,610 $194,587,482
22
• Jobs. Visitor spending results in the employment of 43,602 people, with 0.83 additional jobs for every direct job in tourism.
• Personal Income of $343 million was earned as wages and salaries, 2.23 times as much as the direct income where visitors spent money.
• Valued added of $474 million is the total amount earned through tourism, including wages and salaries, business profits, and taxes.
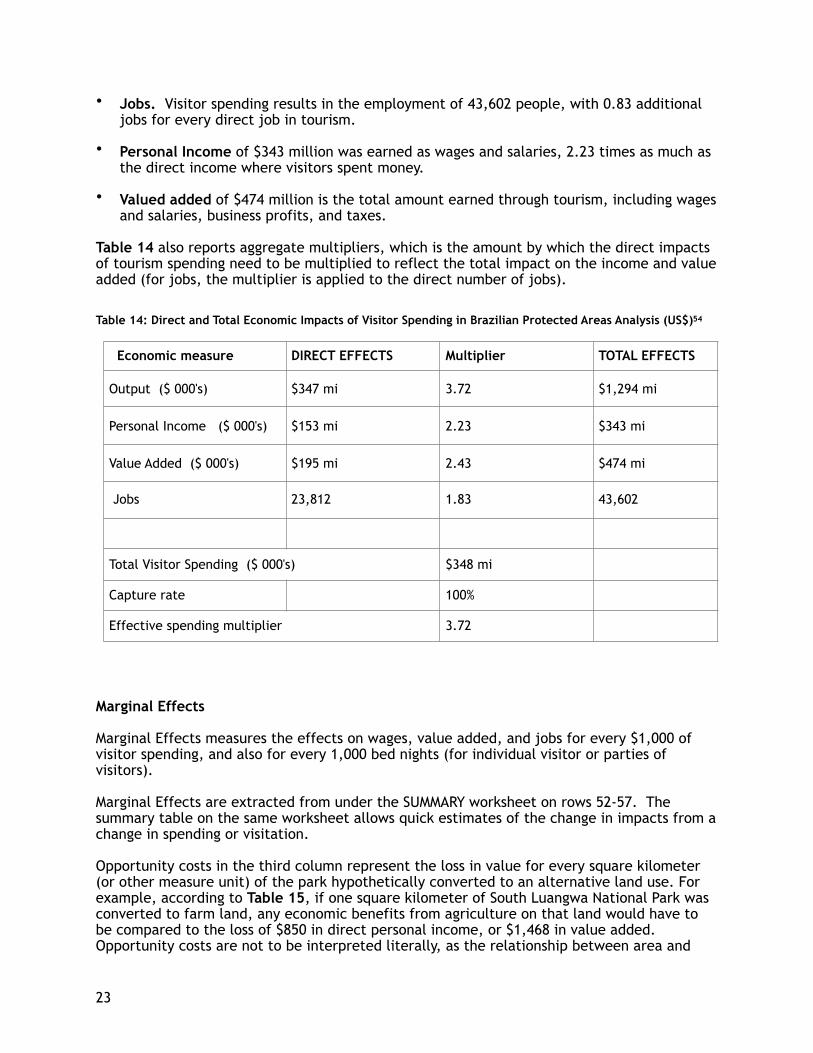
Table 14 also reports aggregate multipliers, which is the amount by which the direct impacts of tourism spending need to be multiplied to reflect the total impact on the income and value added (for jobs, the multiplier is applied to the direct number of jobs).
Table 14: Direct and Total Economic Impacts of Visitor Spending in Brazilian Protected Areas Analysis (US$) 54
Marginal Effects
Marginal Effects measures the effects on wages, value added, and jobs for every $1,000 of visitor spending, and also for every 1,000 bed nights (for individual visitor or parties of visitors).
Marginal Effects are extracted from under the SUMMARY worksheet on rows 52-57. The summary table on the same worksheet allows quick estimates of the change in impacts from a change in spending or visitation.
Opportunity costs in the third column represent the loss in value for every square kilometer (or other measure unit) of the park hypothetically converted to an alternative land use. For example, according to Table 15, if one square kilometer of South Luangwa National Park was converted to farm land, any economic benefits from agriculture on that land would have to be compared to the loss of $850 in direct personal income, or $1,468 in value added. Opportunity costs are not to be interpreted literally, as the relationship between area and
Economic measure DIRECT EFFECTS Multiplier TOTAL EFFECTS
Output ($ 000's) $347 mi 3.72 $1,294 mi
Personal Income ($ 000's) $153 mi 2.23 $343 mi
Value Added ($ 000's) $195 mi 2.43 $474 mi
Jobs 23,812 1.83 43,602
Total Visitor Spending ($ 000's) $348 mi
Capture rate 100%
Effective spending multiplier 3.72
23
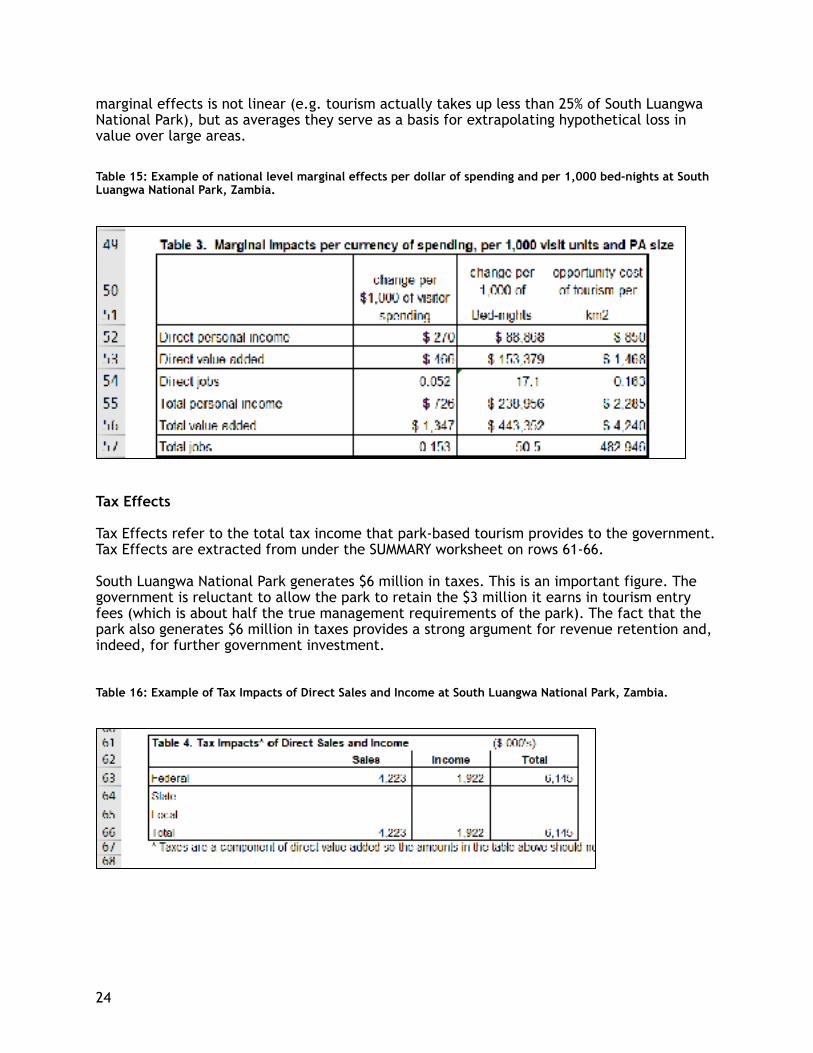
marginal effects is not linear (e.g. tourism actually takes up less than 25% of South Luangwa National Park), but as averages they serve as a basis for extrapolating hypothetical loss in value over large areas.
Table 15: Example of national level marginal effects per dollar of spending and per 1,000 bed-nights at South Luangwa National Park, Zambia.
Tax Effects
Tax Effects refer to the total tax income that park-based tourism provides to the government. Tax Effects are extracted from under the SUMMARY worksheet on rows 61-66.
South Luangwa National Park generates $6 million in taxes. This is an important figure. The government is reluctant to allow the park to retain the $3 million it earns in tourism entry fees (which is about half the true management requirements of the park). The fact that the park also generates $6 million in taxes provides a strong argument for revenue retention and, indeed, for further government investment.
Table 16: Example of Tax Impacts of Direct Sales and Income at South Luangwa National Park, Zambia.
24
Presenting results
Basic tourism data
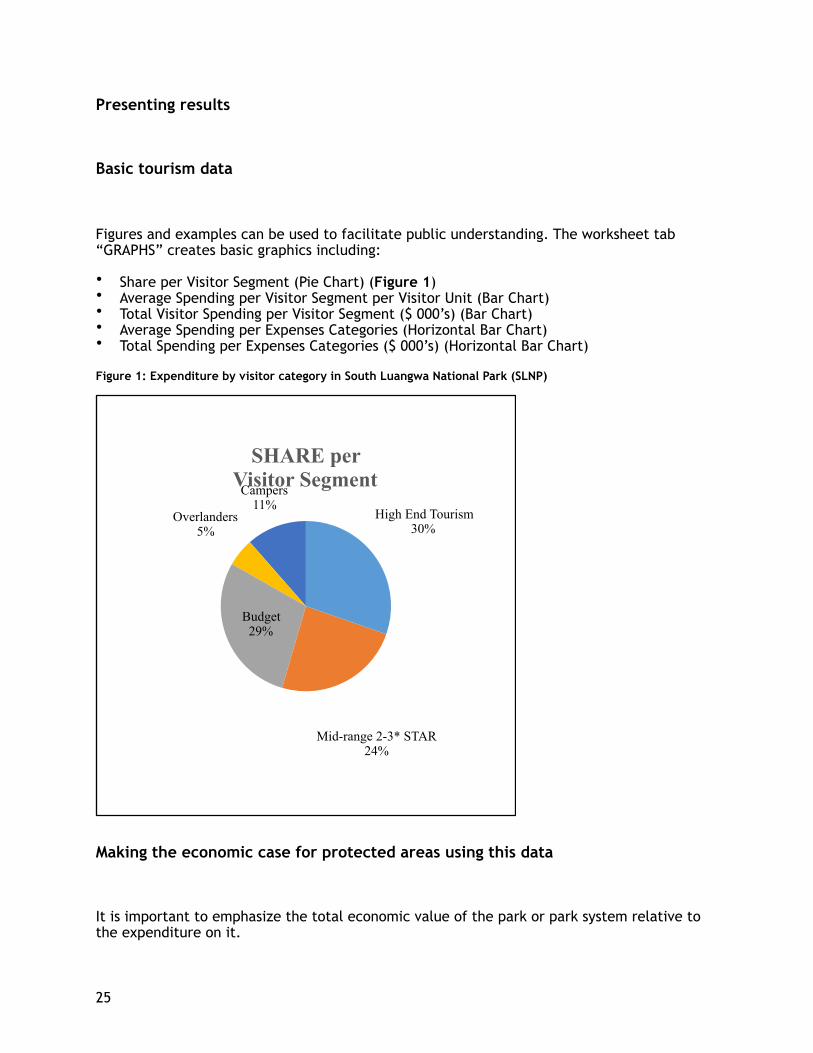
Figures and examples can be used to facilitate public understanding. The worksheet tab “GRAPHS” creates basic graphics including:
• Share per Visitor Segment (Pie Chart) (Figure 1) • Average Spending per Visitor Segment per Visitor Unit (Bar Chart) • Total Visitor Spending per Visitor Segment ($ 000’s) (Bar Chart) • Average Spending per Expenses Categories (Horizontal Bar Chart) • Total Spending per Expenses Categories ($ 000’s) (Horizontal Bar Chart)
Figure 1: Expenditure by visitor category in South Luangwa National Park (SLNP)
Making the economic case for protected areas using this data
It is important to emphasize the total economic value of the park or park system relative to the expenditure on it.
SHARE per Visitor SegmentCampers
11%Overlanders
5%
Budget29%
Mid-range 2-3* STAR 24%
High End Tourism30%
25
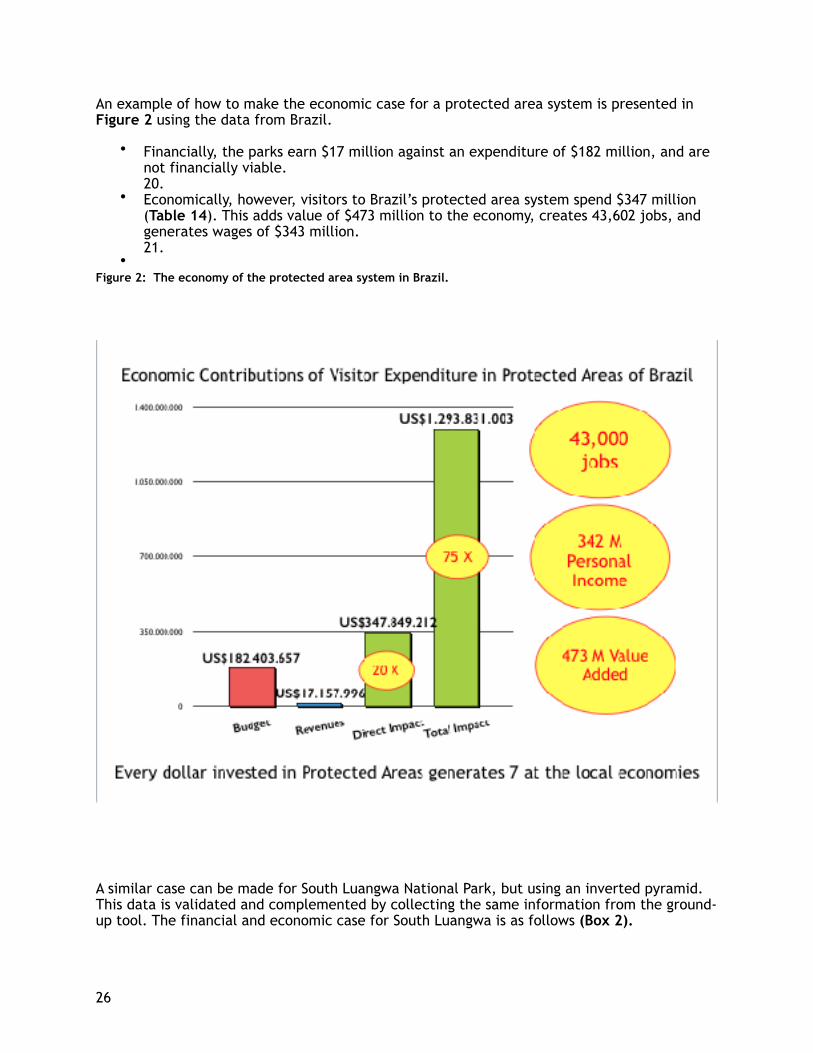
An example of how to make the economic case for a protected area system is presented in Figure 2 using the data from Brazil.
• Financially, the parks earn $17 million against an expenditure of $182 million, and are not financially viable. 20.
• Economically, however, visitors to Brazil’s protected area system spend $347 million (Table 14). This adds value of $473 million to the economy, creates 43,602 jobs, and generates wages of $343 million. 21.
•Figure 2: The economy of the protected area system in Brazil.
A similar case can be made for South Luangwa National Park, but using an inverted pyramid. This data is validated and complemented by collecting the same information from the ground-up tool. The financial and economic case for South Luangwa is as follows (Box 2).
26
• Financially, South Luangwa covers its costs, earning $ 2.9 million in park fees, against an expenditure of $2.91 million. (However, this expenditure is heavily skewed towards salaries, leaving too little for operations, and also falls well short of the requirements for a 9,050 km2 savanna park).
• Economically, tourism in South Luangwa adds value of $14.8 million in the immediate area of the park and nearby communities. This provides 1,583 direct jobs.
• At a national level, South Luangwa adds value of $38.2 million ($14.8+$23.4), and some 3,500 jobs in total.
• The government earns $6.2 million in tax revenues ($2.6m + $3.6m). This does not include the company taxes on a total private sector profit of $8.3 million ($2.5m + $ 5.7m).
However, the inverted pyramid shows that the $38 million tourism economy can quickly fall over if there is insufficient investment in the park. As it is, tourism operators are providing $835,000 annually for anti-poaching and community development. Furthermore, we know that this economy is based on 550 tourism beds. Therefore, an investment of $50m in road expansion to provide access for a further 200 beds will quickly pay for itself. The return on investment can be calculated by multiplying added value, jobs, taxes and park income by 200/550. The annual returns on a $50 m investment is therefore $13.8 value added, $2.25 m in taxes, 575 local jobs and 1,275 jobs in total, and $1m in park fees. Box 2. Using an inverted pyramid to describe a park economy, and its vulnerabilities
27

Errors and Assumptions
Numerous assumptions are relied upon in any study of economic effects. Some assumptions are inherent in the model, while other assumptions are necessary in sampling. Each assumption unavoidably introduces a certain amount of error to the ultimate results. It is impractical to quantify this error, but it will be less with estimates of direct effects and greater with total effects. What matters, however, are not the exact values, but their relative magnitudes.
Conclusion
Protected areas are a critical strategy for conserving biodiversity and for connecting people with nature. Many protected areas – especially national parks – attract tourists who spend money to experience nature and wildlife at close range. Some countries such as the United States regularly quantify the benefits of these parks on the local and national economy, highlighting the important role that they play in sustaining incomes and providing jobs. This type of analysis is less common in developing countries, causing many to overlook or to underestimate the vital contribution that parks with tourism potential have on the economy. This report introduces a tool – the Tourism Economic Model for Protected Areas (TEMPA) that can be used by park managers, consultants and others to address this lack of information in developing countries. Conducting this relatively simple spreadsheet - based analysis can produce new information that will help to garner support for some protected areas, as a way to simultaneously promote conservation and support economic development.
28
Appendix A: Socio - Economic Impacts of South Luangwa National Park in Zambia
Alex Chidakel and Brian Child
South Luangwa National Park (SLNP) in Zambia has 550 tourism beds clustered around the park gate where significant investments in roads and an airport (by FAO/UNDP and Norway) allow all-weather access to a small but prime wildlife area. In 2015, there were 21,214 visitors to the park including overlanders (9%), campers (12%) and people staying in low-end (37%) mid-range (23%) and high-end lodges (19%).
Tourism expenditure: Combined, these visitors spent $25,691,340 which supported 1,450 direct jobs (lodges, park managers) and 375 indirect jobs with total wages of $6.3 m within the immediate area of the park.
Local added value: This reflects an added value (sales price – cost of sales) of $14.8m locally.
National added value: Although tourism has increased the number of businesses from 1 in 1983 to over 180 now, the majority of goods and services (to the value of $23.4m, of which $17.2m is salaries) are still obtained from distant manufacturing and farming areas in Zambia. This adds $23.4m in value, of which $17.2m is salaries.
Global impact: A conservative estimate (not provided by the TEMPA model) is that visitors to South Luangwa spent at least $10m or more on air-travel, booking fees and other purchases outside Zambia. The model also does not calculate global added value in the form of vehicles, fuel, durable goods and food that are purchased from abroad.
Total economic value: The TEMPA model demonstrates that South Luangwa National Park generates $38m of added value in Zambia annually, of which $23m accrued in wages, salaries and fees including 1,825 local jobs
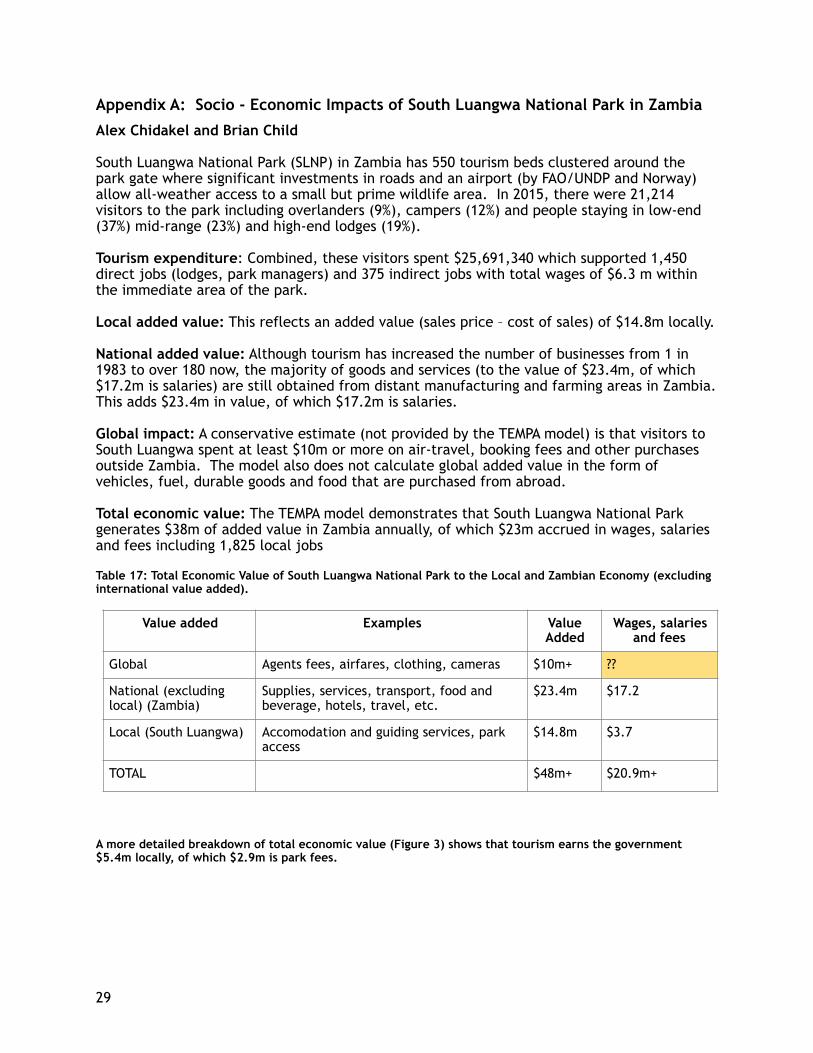
Table 17: Total Economic Value of South Luangwa National Park to the Local and Zambian Economy (excluding international value added).
A more detailed breakdown of total economic value (Figure 3) shows that tourism earns the government $5.4m locally, of which $2.9m is park fees.
Value added Examples Value Added
Wages, salaries and fees
Global Agents fees, airfares, clothing, cameras $10m+ ??
National (excluding local) (Zambia)
Supplies, services, transport, food and beverage, hotels, travel, etc.
$23.4m $17.2
Local (South Luangwa) Accomodation and guiding services, park access
$14.8m $3.7
TOTAL $48m+ $20.9m+
29

Figure 3: Total value added from tourism in South Luangwa National Park.
This information is summarized as a “Protected Area Value and Vulnerability Pyramid.” (Box 2) The total national ($23.4) and local ($14.8m) economic value of South Luangwa National Park depends on re-investment in park management of $2.91m, propped up by a further $835,000 spent on road maintenance and anti-poaching by lodges and NGOs. If this re-investment is inadequate, or mismanaged, the entire economic pyramid is vulnerable. Note that government earned $9.1m from South Luangwa ($2.9 park fees + $2.5m in direct taxes + $3.6m in induced taxes), of which it reinvested $2.91 directly in park management. This was a return on public investment of better than 3 to 1.
30
Appendix B: National Case Study - Economic Impacts of Tourism in Protected Areas of Brazil
Thiago do Val Simardi Beraldo Souza
The Chico Mendes Institute for Biodiversity Conservation (ICMBio) is the federal agency responsible for the management of the Federal Protected Areas in Brazil. ICMBio manages a system of 325 federal protected areas comprising 79 million hectares (ICMBio, 2016). Federal protected areas of Brazil were assessed using the Tourism Economic Model for Protected Areas (TEMPA), which is an updated version of the Money Generation Model (MGM2) methodology 55
along with modifications to address issues particular to a developing country context.
Methods
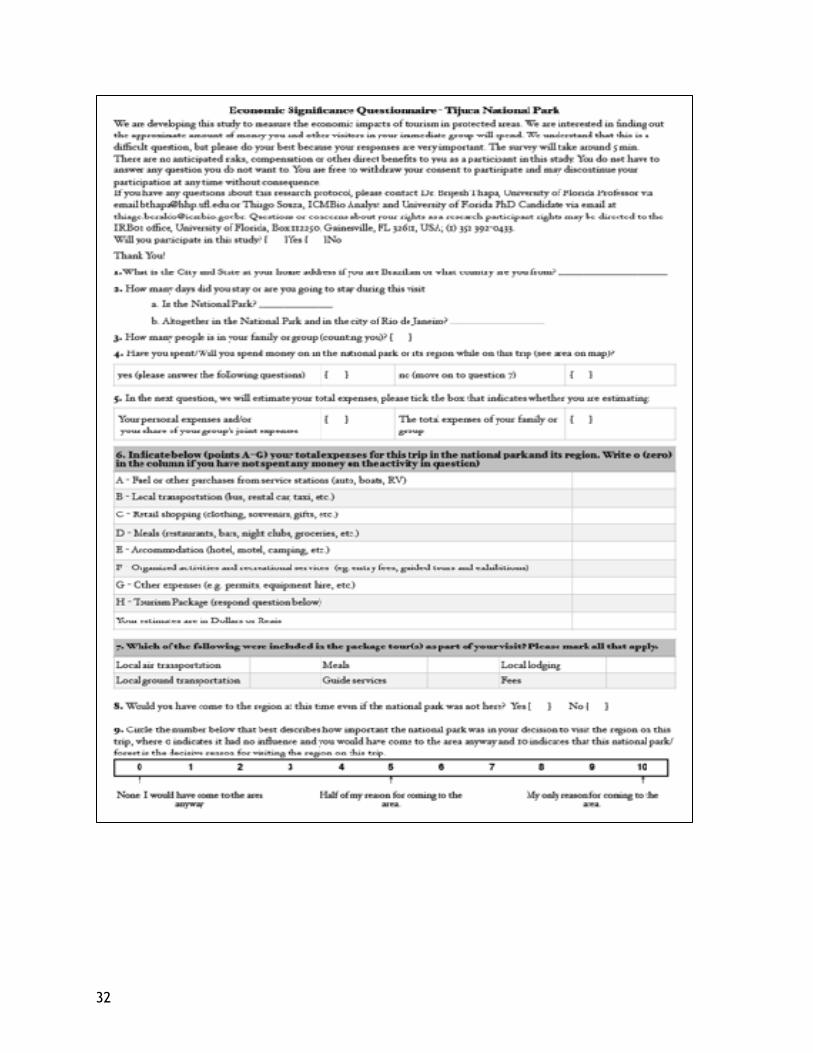
TEMPA requires three inputs: number of visitors, visitor expenditures, and multipliers, all of which were collected from different sources. Box 3 highlights the survey that was used to assess tourism expenditure.
A - Number of visitors
From the 8 million visitors in 2015, national parks and forests received 93% of the total. We collected data from 58 national parks (NP) and 36 national forests (NF) managed by the federal agency Chico Mendes Institute for Biodiversity Conservation (ICMBio) . The Protected 56
Areas (PAs) were divided into three categories by recreation use: Extensive, Intensive and Highly Intensive.
B - Visitor Expenditures
Visitor spending data was collected via two different techniques: on-site interviews and e-mail during January-February of 2016. The study collected data in three PAs, one of each 57
recreation class, to develop average visitor spending profiles. The three selected PAs 58 59
were: São Franciso de Paula National Forest, Chapada dos Guimarães National Park and Tijuca National Park.
C – Multipliers
Multipliers and ratios were developed for the Brazilian economy from the Input-Output (I-O) Table of 2013 - 68 sectors . The data were formulated from National Accounts based on the 60
methodologies described in Guilhoto et al. (2005) and Guilhoto et al. (2010) . 61 62
Results Tourism Economic Contributions and Impacts - National Effects
Table 18 summarizes the result of this study. Visitor expenditure generated total direct sales of $348 million, but this expanded to $1.3 billion as this money cycled through the economy. Likewise, 23,813 people employed directly in park-based tourism earned $153m, but this almost doubled once multiplier effects were considered, to 43,602 jobs and $342 million in income. Park tourism added $195 in direct value, and $473 million in value added to the GDP.
Box 3: Survey used to assess tourism expenditure in Brazil.
31
32

Table 18: Economic contributions of visitor spending to Brazil’s national economy
Figure 4: Financial and economic assessment of Brazil's Parks Estate.
!
Conclusion
Figure 4 confirms that Brazil’s Protected Areas operate at a financial loss, with direct income of $17 million (mainly in park fees) compared to a budget of $ 182 million. However, from an economic perspective, the direct economic impact of Brazil’s parks is $ 348 million and this increases to $ 1,294 billion once this money cycles through the economy. Thus, each dollar invested in park management generates $7 for the economy, even before the value of biodiversity conservation and ecosystem services are considered. Moreover, many parks are
Spending Category Sales Captured Jobs Personal Income Value Added
Accommodation $84 mi 5,193 $38 mi $49 mi
Meals $76 mi 5,838 $31 mi $38 mi
Gas & oil $65 mi 3,947 $30 mi $42 mi
Local transportation $37 mi 1,481 $13 mi $!7 mi
Activities and Guided Tours $65 mi 6,106 $32 mi $37 mi
Retail Stores $17 mi 1,004 $7,6 mi $11 mi
Other expenses $4,3 mi 244 $1,6 mi $2 mi
Total Direct Effects $348 mi 23,813 $153 mi $194 mi
Secondary Effects $946 mi 19,789 $189 mi $279 mi
Total Effects $1.293 mi 43,602 $343 mi $474 mi
Financial and Economic Assessment Brazils Parks Estate
Mill
ions
'-
350.000.000
700.000.000
1.050.000.000
1.400.000.000
Park agency budget Direct impact of visitor spending
R$1.293.975.644,00
R$347.866.344,00
R$17.157.996,00
R$182.403.657,00
33

located in remote areas, generating economic benefits for local communities that have a higher household dependency on the surrounding natural resources.
Figure 5: Analysis of the economic return on investment in improving tourism facilities in Brazil's Parks Estate.
We also calculated that an investment of $220 million in judiciously improving park management and facilities (using models to assess where they were the factors limiting park tourism growth) would have increased visitation from 8 mi to 13 mi in 2015 and would pay for itself several times over in terms of job creation and its economic impacts. Investments in PAs are necessary to ensure the conservation of the ecosystem services and quality of visitors’ experiences. (Figure 5).
Overall these results highlighted the importance of tourism in PAs and the adjacent regions for the Brazilian economy, and provide a persuasive argument to increase the budget allocation for parks to stimulate the local and national economy.
Spending category Sales Captured Jobs Personal Income Value Added
Current scenario
Total Direct Effects $347 mi 23,813 $153 mi $195 mi
Total Effects $1.293 mi 43,602 $343 mi $474 mi
With $220m investment in park management and facilities
Direct Effects $622 mi 42,725 $275 mi $348 mi
Total Effects $2.821 mi 94,180 $753 mi $1.046 mi
34
REFERENCES Ervin, J, et al. (2010). Making Protected Areas Relevant: A guide to integrating protected areas into wider 1
landscapes, seascapes and sectoral plans and strategies. CBD Technical Series No. 44.
Balmford A, Green JMH, Anderson M, Beresford J, Huang C, Naidoo R, et al. (2015) Walk on the Wild Side: 2
Estimating the Global Magnitude of Visits to Protected Areas. PLoS Biol 13(2): e1002074.
Dudley, N. (Editor) (2008). Guidelines for Applying Protected Area Management Categories. Gland, Switzerland: 3
IUCN. x + 86pp. WITH Stolton, S., P. Shadie and N. Dudley (2013). IUCN WCPA Best Practice Guidance on Recognising Protected Areas and Assigning Management Categories and Governance Types, Best Practice Protected Area Guidelines Series No. 21, Gland, Switzerland: IUCN.
Borrini-Feyerabend, G. et al. (2013). Governance of Protected Areas. From understanding to action. Gland, 4
Switzerland, IUCN.
Balmford, A. et al. (2015). Walk on the Wild Side: Estimating the Global Magnitude of Visits to Protected Areas. 5
PLoS Biology 13(2): 1 – 6.
Also known as the “Anthropocene extinction”, this is the ongoing present extinction of plant and animal species 6
mainly as a result of human activity.
Wilson, E. O. (2016). Half-earth: Our planet's fight for life (First Edition). Liveright Publishing Corporation. New 7
York.
United Nations, Department of Economic and Social Affairs, Population Division (2015). World Population 8
Prospects: The 2015 Revision, Key Findings and Advance Tables. Working Paper No. ESA/P/WP.241.
Laurance, W.F. et al. (2012). Agricultural expansion and its impacts on tropical nature. Trends in Ecology & 9
Evolution 29(2). 107 – 116.
Shelhas, J. (2001). The USA national parks in international perspective: have we learned the wrong lesson? 10
Environmental Conservation 28(4): 200-304.
Oldekop, J.A., et al. (2015). A global assessment of the social and conservation outcomes of protected areas. 11
Conservation Biology 30(1): 133 – 141.
Andrade, G.S.M. and J. R. Rhodes (2012). Protected Areas and Local Communities: an Inevitable Partnership 12
toward Successful Conservation Strategies? Ecology and Society 17(4): p. 14.
Crompton, J. (2010). Measuring the Economic Impact of Park and Recreation Services. National Recreation and 13
Park Association, Research Series. Ashburn, VA.
Stynes, D. et al. (2000). Estimating National Park Visitor Spending and Economic Impacts; The MGM2 Model. 14
Michigan State University
Souza, T.V.S.B. (2016). Recreation Classification, Tourism Demand and Economic Impact Analyses of the Federal 15
Protected Areas of Brazil. Doctoral dissertation, University of Florida, Gainesville, FL.
Cullinane, T.C. et al. (2014). 2012 National park visitor spending effects: Economic contributions to local 16
communities, states, and the nation. Natural Resource Report NPS/NRSS/EQD/NRR—2014/765. National Park Service, Fort Collins, Colorado.
The Outspan Group. (2011). The Economic Impact of Parks Canada. Amherst Island, Canada.17
Driml, S. (2010). The economic value of tourism to national PAs and protected areas in Australia. PAwood, Gold 18
Coast, Qld: CRC for Sustainable Tourism.
Huhtala, M. et al. (2010). Local economic impacts of national park visitors’ spending: The development process 19
of an estimation method. 978-951-40-2224-1. http://www.metla. /julkaisut/workingpapers/2010/mwp149.htm.
Turpie, J. et al. (2010). The Economic Value of Namibia’s Protected Areas System: A case for increased 20
Investment. Ministry of Environment and Tourism, UNDP & GEF.
35
Saayman, M. and Saayman, A. (2010). Regional development and national parks in South Africa: lessons learned. 21
Tourism Economics 16(4): 1037 – 1064.
Ibid – Stynes, D. et al., 2010.22
Krutilla, J.V. (1967) Conservation reconsidered. The American Economic Review 57(4): 777-786.23
Ibid - Cullinane, T.C. et al., 2014.24
Stynes, D.J. (2001). Economic impact concepts. Retrieved from http://www.msu.edu/course/prr/840/25
econimpact/ concepts.htm.
Ibid - Crompton, J., 2010.26
Ibid - Cullinane, T.C. et al., 2014.27
Ibid - Crompton, J., 2010.28
Camargo et al., 2018. 29
Economic analysis, however, can become more complex. This manual offers two general practices which can be 30
used to analyze the economic contribution and economic impact of parks. The ‘economic contribution’ captures the gross economic activity generated in the regional economy by all visitors to the protected area, including local visitors. ‘Economic Impact’ analysis estimates the net changes on the regional economy generated by new money brought into the local economy by non-local visitors. Economic impacts exclude spending by local visitors based on the assumption that if they decide not to visit the park, they would spend the money on another recreational activity within the local region (Cullinane et al., 2014).
Ibid – Stynes, 2001. 31
Multipliers are coefficients that convert spending into associated income and jobs to reflect the direct and 32
secondary effects of visitor expenditures as spending circulates within a regional economy.
Ibid – Stynes, 2001.33
Hornback, K., and Eagles, P. 1999. Guidelines for Public Use Measurement and Reporting at parks and Protected 34
Areas. IUCN, Gland, Switzerland and Cambridge, UK. iv + 90 pp.
Ibid - Saayman et al. 2010.35
Ibid - Cullinane, T.C. et al., 2014.36
Ibid – Stynes, D. et al., 2010.37
Stynes, D.J. (2005). Economic Significance of Recreational Uses of National Parks and Other Public Lands. NPS 38
Social Science Research Review 5(1): Winter 2005.
Ibid – Stynes et al., 2000.39
Ibid - Cullinane, T.C. et al., 2014.40
Ibid - Huhtala, M. et al., 2010.41
For additional information on visitor surveys, including short samples, refer to Crompton (2010). 42
For more information on sampling and respondent approach techniques, safety issues, ethics, etc., refer to Driml and McLennan (2010).
See Appendix A for a more comprehensive questionnaire for visitors to South Luangwa National Park (SLNP), Zambia. See Appendix B for a questionnaire based on Crompton (2010) that was used to collect data for a national study on parks in Brazil.
36

Miller, R.E. and Blair, P.D. 2009. Input-output analysis: foundations and extensions. Cambridge University Press. 43
Cambridge.
Ibid – Stynes et al., 2000.44
Ibid - Huhtala, M. et al., 2010.45
Ibid – Stynes, D. et al., 2010.46
Ibid – Stynes, D. et al., 2010.47
Ibid - Crompton, J., 2010.48
The spreadsheet will provide a reasonably accurate set of multipliers once you have: 49
(1) selected the country of analysis that most closely matches your situation and (2) defined the area in which your Park is situated according to whether it is rural, or urban using population size as a rough proxy for the complexity and connectedness of the economy as described in Table 2. All calculations are automatically performed.
At this stage “Brazil” has been used to approximate for a middle income and/or Latin American country, and 50
Zambia to approximate for a lower income and/or African country. Multipliers have also been included for South Africa.
Two categories are specifically for consumptive tourism (i.e. resource/trophy fees and dip, pack and taxidermy) 51
because trophy or sport hunting is a primary source of tourism in many community-conserved areas and private conservation areas, especially in Africa.
Ibid - Souza, T.V.S.B., 2016.52
Ibid - Souza, T.V.S.B., 2016.53
Ibid - Souza, T.V.S.B., 2016.54
Ibid – Stynes et al., 2000.55
Ibid - Souza, T.V.S.B., 2016.56
Ibid - Crompton, J., 2010.57
Driml, S. and McLennan, C. (2010). Handbook on measuring the economic value of tourism to national parks. 58
Parkwood, Gold Coast, Qld: CRC for Sustainable Tourism
Ibid - Huhtala, M. et al., 2010.59
Guilhoto, J.J.M. (2015). Input-Output Table of Brazil 2013 - 68 Sectors. NEREUS - Núcleo de Economia Regional e 60
Urbana da Universidade de São Paulo.
Guilhoto, J.J.M., U.A. Sesso Filho (2005). Estimação da Matriz Insumo-Produto a Partir de Dados Preliminares das 61
Contas Nacionais. Economia Aplicada 9(2): 277-299. Abril-Junho.
Guilhoto, J.J.M. and Sesso Filho U.A. (2010). Estimação da Matriz Insumo-Produto Utilizando Dados Preliminares 62
das Contas Nacionais: Aplicação e Análise de Indicadores Econômicos para o Brasil em 2005. Economia & Tecnologia. UFPR/TECPAR 6(23), Outubro.
37