Economic impacts of GM crops on smallholders in the ... · PDF fileon smallholders in the...
27
Economic impacts of GM crops on smallholders in the Philippines, Honduras, Colombia and Bolivia Melinda Smale, Patricia Zambrano, Jose Yorobe and José Falck-Zepeda
Transcript of Economic impacts of GM crops on smallholders in the ... · PDF fileon smallholders in the...

Economic impacts of GM crops
on smallholders in the Philippines,
Honduras, Colombia and Bolivia
Melinda Smale, Patricia Zambrano,
Jose Yorobe and José Falck-Zepeda

Page 2
Outline
I. Project goals
II. Highlights of systematic review
III. Selection of case studies/methods
IV. Preliminary findings
V. Conclusions
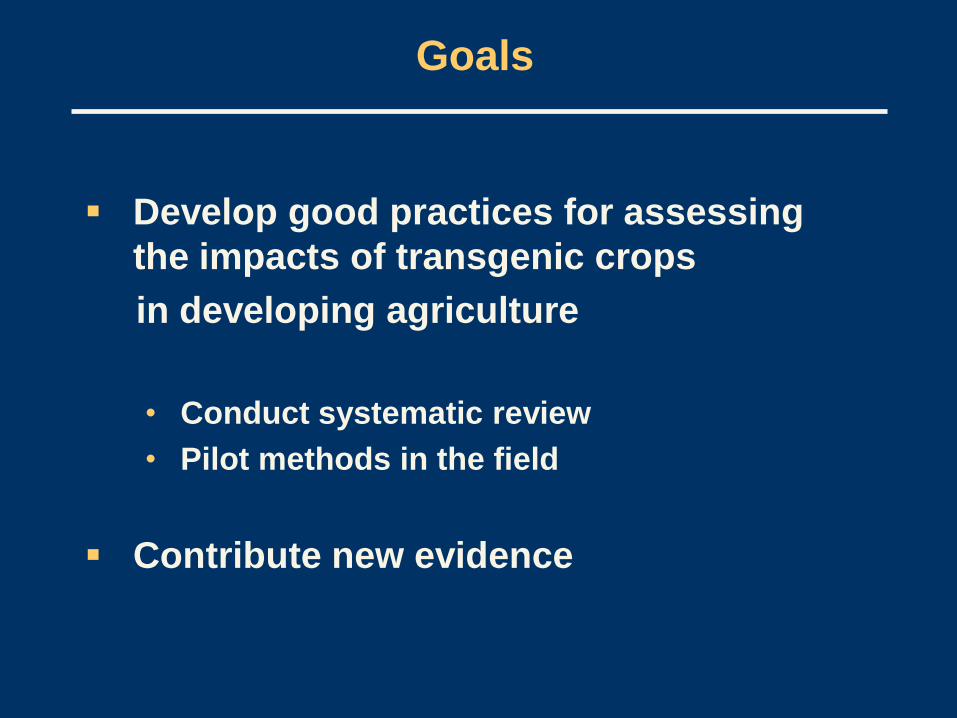
Goals
Develop good practices for assessing
the impacts of transgenic crops
in developing agriculture
• Conduct systematic review
• Pilot methods in the field
Contribute new evidence

Page 4
Systematic Review
In the first decade,
Impact on farmers foremost
concern
Bt cotton the most studied
crop-trait combination
China, India and South Africa
most represented countries
Impact Question No.
Farmer 67
Consumer 27
Sector 27
Trade 26
Total 1996-2007 137
1 article may treat more than on question
Crop-trait No.
Cotton (Bt) 63
Maize (Bt) 14
Rice (RR,Bt) 16
Soybeans (RR) 16
Other Crops 22
GE-General 20
Other crops: bananas, potatoes, sweet
potatoes, cassava, wheat, oilseeds,
eggplant, mustard, coarse grains

Page 5
Farm Impacts—Methods
Generally addressed ex post
Data sources:• farmer survey, trial data, farm records
Farm budget analysis • Stochastic simulation
Econometric models • Production models/input use functions
• Stated /revealed preference models
Page 6
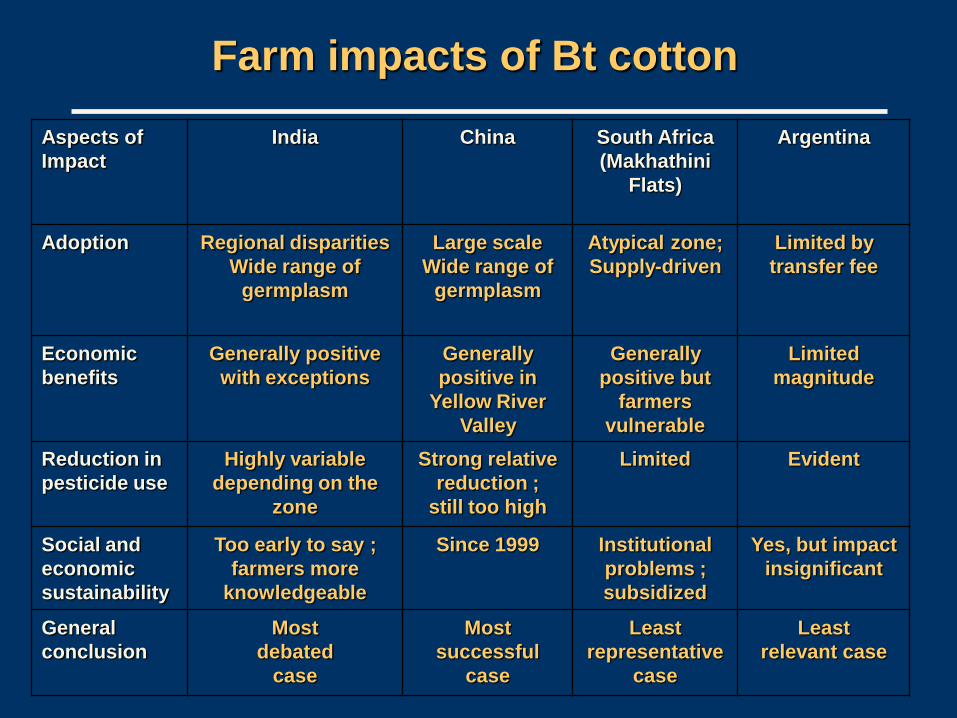
Farm impacts of Bt cotton
Aspects of
Impact
India China South Africa
(Makhathini
Flats)
Argentina
Adoption Regional disparities
Wide range of
germplasm
Large scale
Wide range of
germplasm
Atypical zone;
Supply-driven
Limited by
transfer fee
Economic
benefits
Generally positive
with exceptions
Generally
positive in
Yellow River
Valley
Generally
positive but
farmers
vulnerable
Limited
magnitude
Reduction in
pesticide use
Highly variable
depending on the
zone
Strong relative
reduction ;
still too high
Limited Evident
Social and
economic
sustainability
Too early to say ;
farmers more
knowledgeable
Since 1999 Institutional
problems ;
subsidized
Yes, but impact
insignificant
General
conclusion
Most
debated
case
Most
successful
case
Least
representative
case
Least
relevant case

Methods challenges
Selection
bias
placement
self-selection
host germplasm
Measurement
bias
farmer recall vs. monitoring of
input use
toxin expression varies by season
and plant part
Estimation
bias
budgets partial
household farm models missing
rare treatment of risk & uncertainty
endogeneity (adoption, input use)

Case Studies
Selection criteria:
Broader geographical representation
Traits not heavily studied
Early phases of adoption
Approaches:
Damage abatement models
Treatment model (IV)
Choice experiments
Stochastic budgeting
Social network analysis

Bt maize in the Philippines
Antonio La Vina, Jose Yorobe Jr., Jessica Dator-
Bercilla, Mary Jean Caleda, Hazel Alfon, and
Loraine Gatlabayan
466 farmers in 16 villages
Isabela Province, Luzon
So. Cotabato Province, Mindanao
Yellow maize for feed
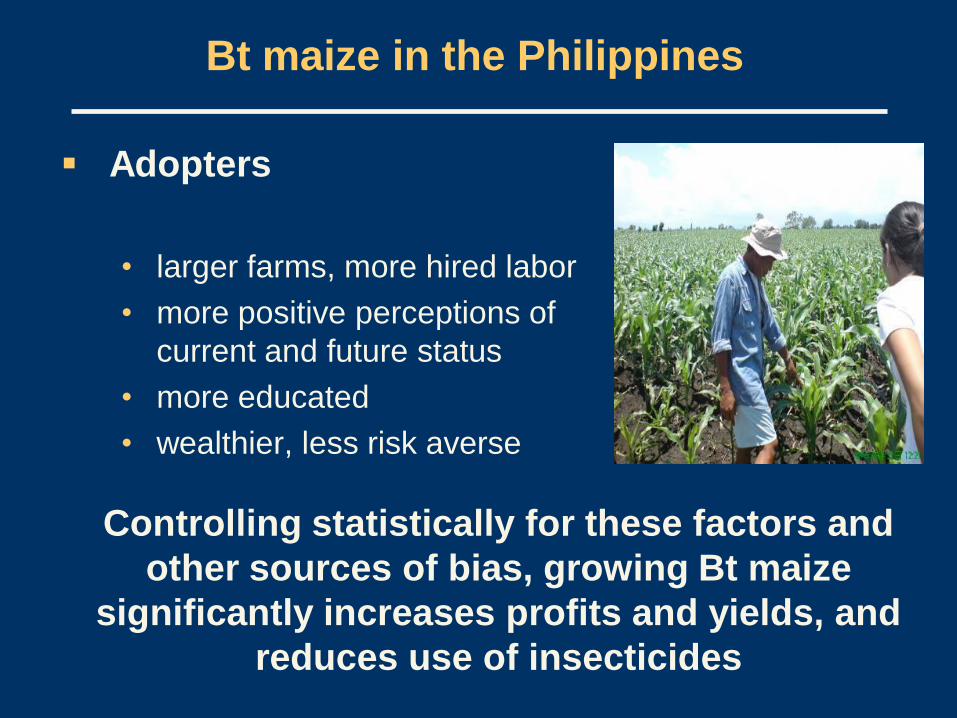
Bt maize in the Philippines
Adopters
• larger farms, more hired labor
• more positive perceptions of
current and future status
• more educated
• wealthier, less risk averse
Controlling statistically for these factors and
other sources of bias, growing Bt maize
significantly increases profits and yields, and
reduces use of insecticides

Bt maize in the Philippines
Seed Attribute Isabela So. Cotabato
Bt
farmers
Non-Bt
farmers
All farmers
Yield loss from
borer
-266 -211 -185
Bt maize 2303 -- -786
Farmer
informant vs.
input agent
-1800 -- -764
Credit or cash
vs. cash
1480 -- 1233
with Ekin Birol

Bt maize in the Philippines
Page 12
0
.00002
.00004
.00006
.00008
0 10000 20000 30000 40000 50000
Predicted Net Income (P/ha)
Bt Non - Bt
Density
Kernel density of predicted net farm
income for Bt and non-Bt maize growers
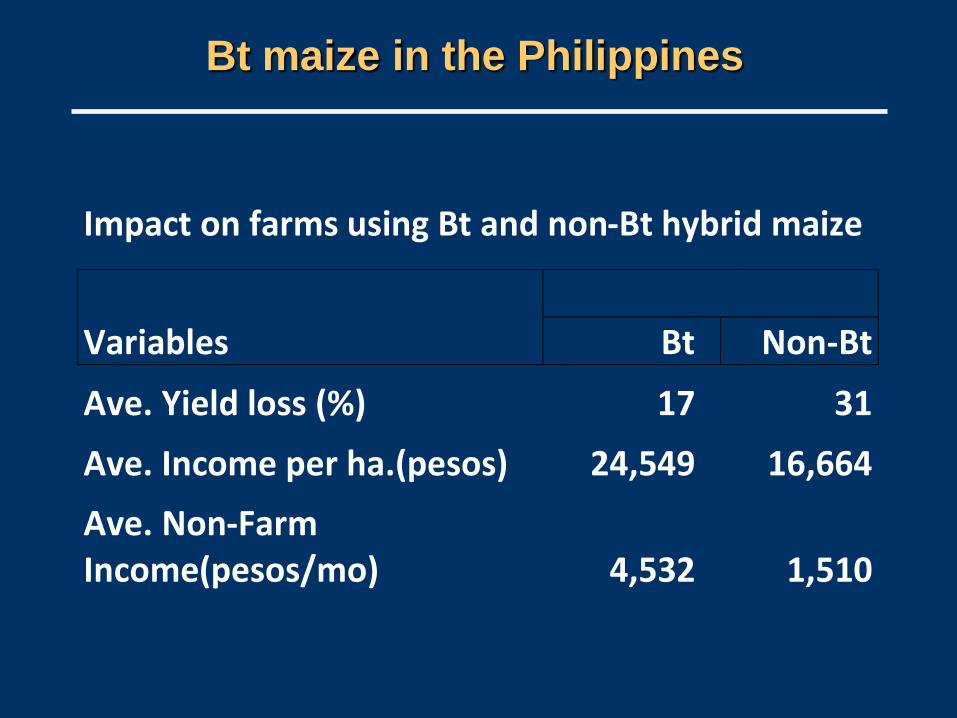
Bt maize in the Philippines
Page 13
Impact on farms using Bt and non-Bt hybrid maize
Variables Bt Non-Bt
Ave. Yield loss (%)
17
31
Ave. Income per ha.(pesos)
24,549
16,664
Ave. Non-Farm Income(pesos/mo)
4,532
1,510

Bt maize in Honduras
Bt maize, Honduras
Arie Sanders, Rogelio Trabanino, Jose Falck-Zepeda
Maize is a subsistence crop
Sample of 114 growers (21% of estimated total)
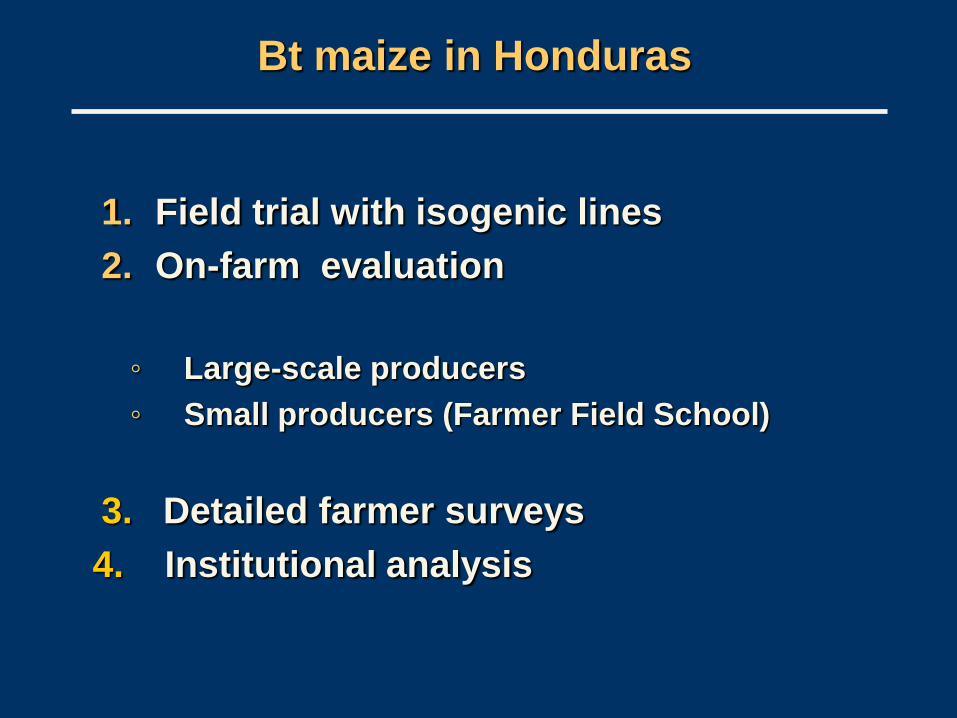
1. Field trial with isogenic lines
2. On-farm evaluation
◦ Large-scale producers
◦ Small producers (Farmer Field School)
3. Detailed farmer surveys
4. Institutional analysis
Bt maize in Honduras

Non-Bt hybrid (isogenic) had 2 insecticide
applications and Bt hybrid none
Yield of non-Bt and Bt hybrids the same
HybridsInsecticide
Applications (#)
Productivity
(Kg / Ha)
Pest Control
(US$/ Ha)
DK234 RRYG 0 6,513 156*
DK 234 1.8 6,510 152
In situ, large farmers
Bt maize in Honduras

Bt maize produced 1,136 kg more per hectare
Bt maize in Honduras
In situ, smallholders
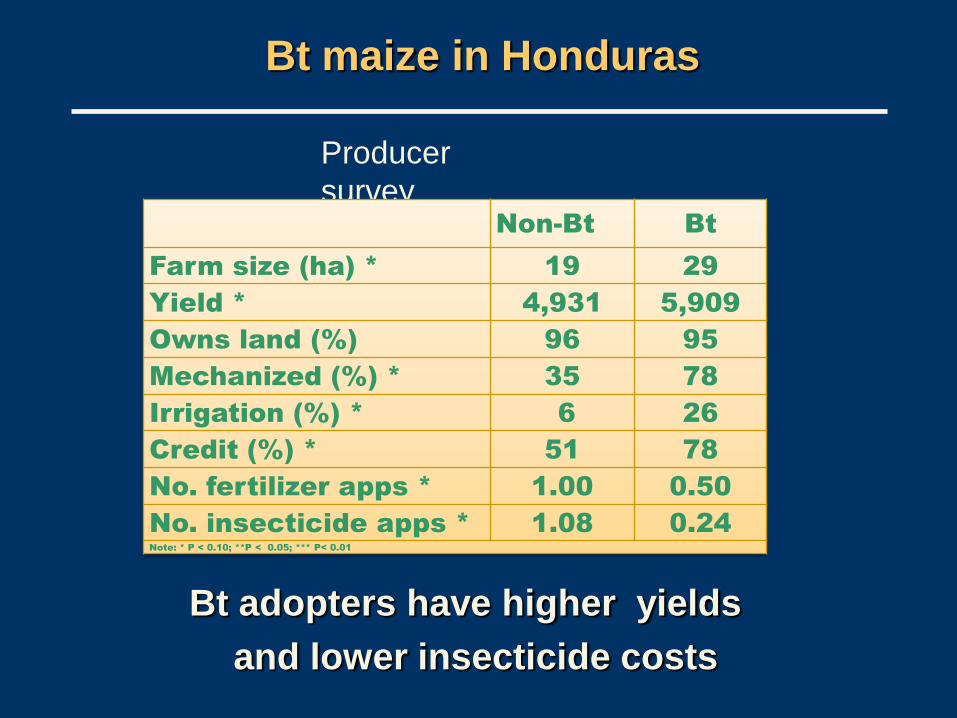
Bt adopters have higher yields
and lower insecticide costs
Producer
surveyNon-Bt Bt
Farm size (ha) * 19 29
Yield * 4,931 5,909
Owns land (%) 96 95
Mechanized (%) * 35 78
Irrigation (%) * 6 26
Credit (%) * 51 78
No. fertilizer apps * 1.00 0.50
No. insecticide apps * 1.08 0.24
Note: * P < 0.10; **P < 0.05; *** P< 0.01
Bt maize in Honduras
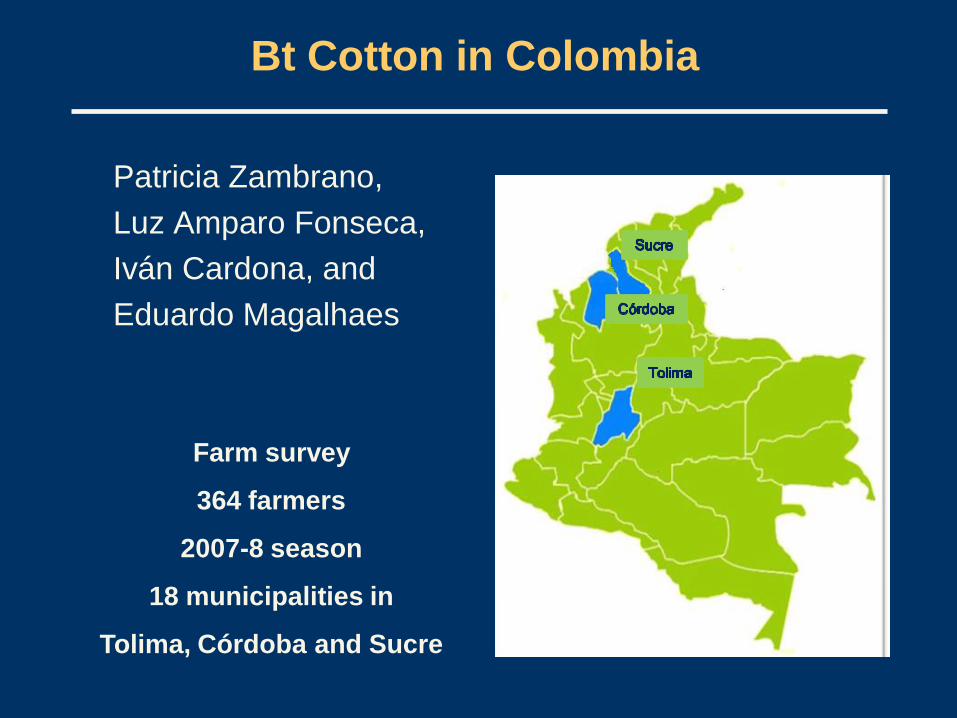
Bt Cotton in Colombia
Patricia Zambrano,
Luz Amparo Fonseca,
Iván Cardona, and
Eduardo Magalhaes
Farm survey
364 farmers
2007-8 season
18 municipalities in
Tolima, Córdoba and Sucre

Bt Cotton in Colombia
Variable Tolima Cordoba Sucre
Non-
Bt
Bt Non-Bt Bt Non-Bt Bt
Farm size ha* 4 8 4 9 3 3
Rent land % 71 76 50 64 3 65
Irrigated area % 37 87 3 6 2 0
Education hh head 4 8 7 9 3 4
Adequate housing % 16 26 4 38 7 12
Cotton % of income 63 41 42 8 52 47

Bt Cotton in Colombia
Variable Tolima Coast
Whether farmer adopts Bt + --
Owns harvester +Rents land + --No. applications to control
boll weevil +
Cordoba +Labor cost +
IV estimation – yield

Bt cotton in Colombia
High levels of insecticide use continue
Use of Bt seed largely determined by access of
local associations to services and credit
Lack of information
about Bt seed and
crop management
Poor biosafety
practices in field
trials and refugia
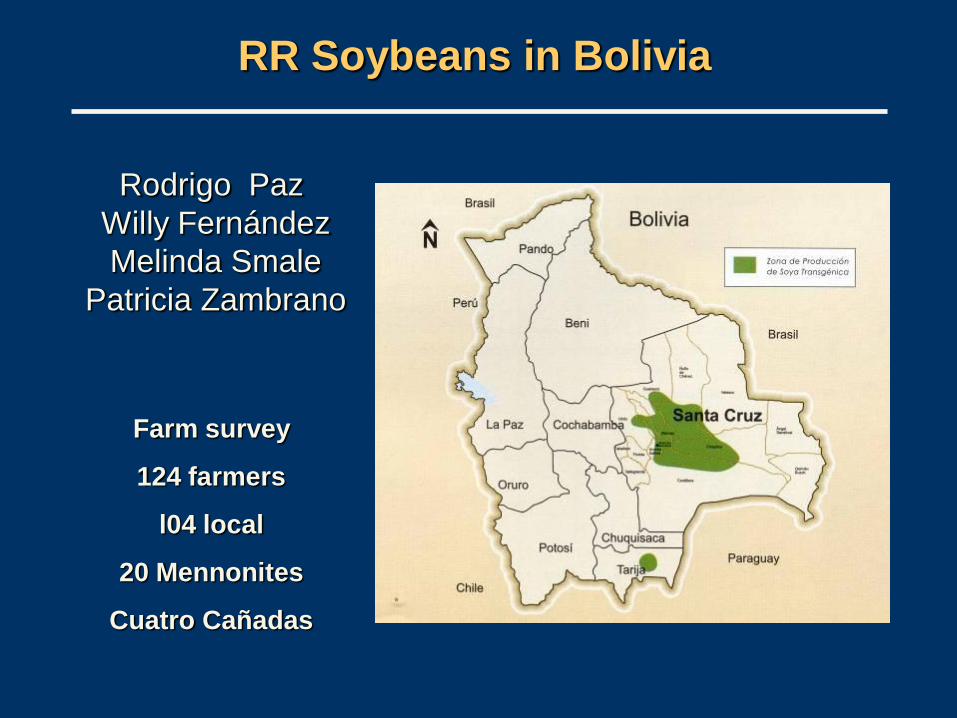
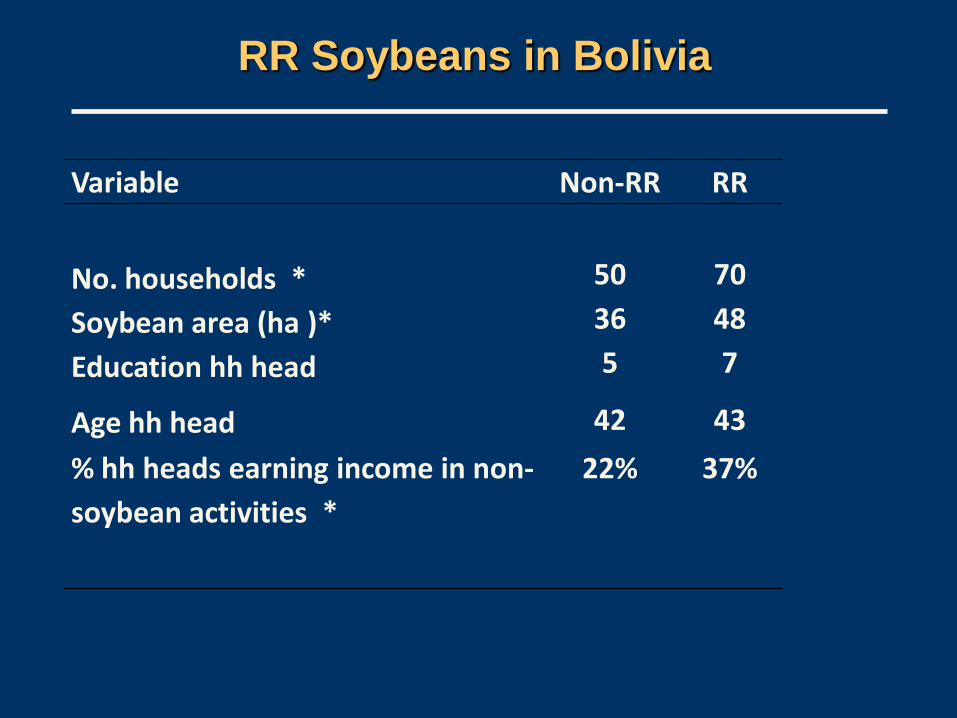
RR Soybeans in Bolivia
Farm survey
124 farmers
l04 local
20 Mennonites
Cuatro Cañadas
Rodrigo Paz
Willy Fernández
Melinda Smale
Patricia Zambrano
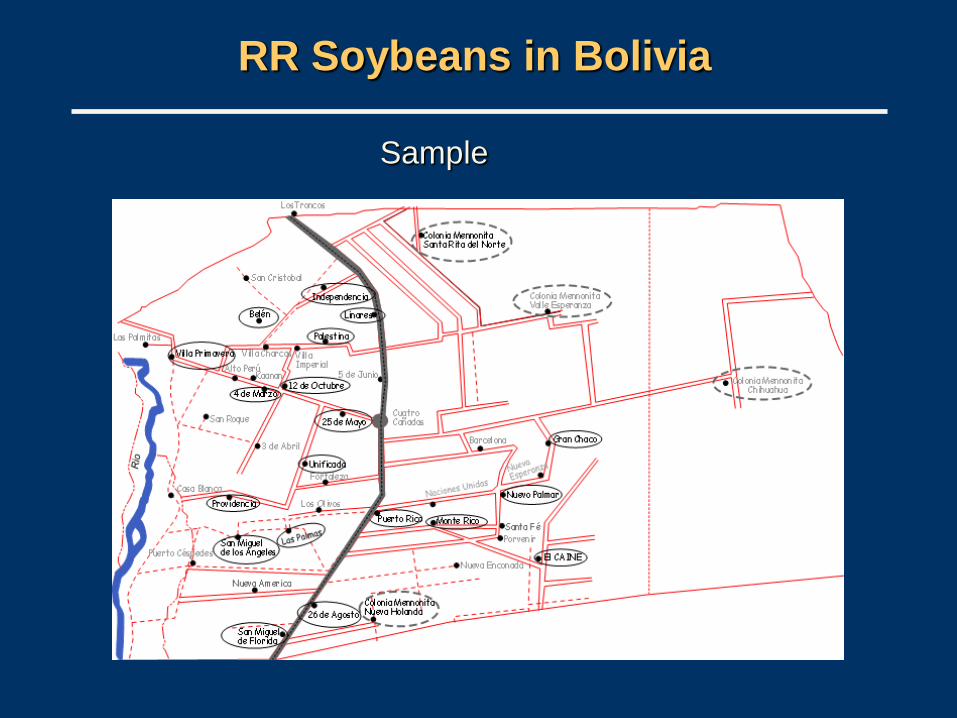
RR Soybeans in Bolivia
Sample
RR Soybeans in Bolivia
Page 25
Variable Non-RR RR
No. households * 50 70
Soybean area (ha )* 36 48
Education hh head 5 7
Age hh head 42 43
% hh heads earning income in non-
soybean activities *
22% 37%

RR Soybean in Bolivia
Chemicals Non-RR RR
Fungicide 37.9 37.9
Herbicides 41.5 33.7
Glyphosate 23.4 28.3
Insecticide 21.3 30.5Fertilizer 0.0 4.0
($USD/ha)

Conclusions
Methods
Agronomic/biophysical protocols needed
Random sampling difficult
Weather, conflicts; need panel data
Improve analytical methods
Broaden impact themes
Findings
More endowed farmers adopt first
Institutional context crucial
Strengthen farmer knowledge