Economic Impacts of...
103
1 Economic Impacts of All-Inclusives: All-Inclusive Expenditure, Motivation & Linkages In the Balearic Islands MEMORIA D’ INVESTIGACIO Author: Wineaster Anderson Director: Dr. Francesco Sastre Department of Applied Economics University of Balearic Islands March 2007
-
Upload
vuongtuong -
Category
Documents
-
view
218 -
download
0
Transcript of Economic Impacts of...

1
Economic Impacts of All-Inclusives: All-Inclusive Expenditure, Motivation & Linkages
In the Balearic Islands
MEMORIA D’ INVESTIGACIO
Author: Wineaster Anderson Director: Dr. Francesco Sastre
Department of Applied Economics University of Balearic Islands
March 2007

2
TABLE OF CONTENTS UCHAPTER ONEU ........................................................................................................................ 4 UINTRODUCTION U..................................................................................................................... 4
U1.1U UThe Background U .......................................................................................................... 4 U1.2U UThe Study ObjectivesU .................................................................................................. 7 U1.3U USignificance of the StudyU ............................................................................................. 8
UCHAPTER TWOU...................................................................................................................... 10 UTHE ALL-INCLUSIVE MODAL U ............................................................................................ 10
U2.1U UEvolution of the All-InclusivesU .................................................................................. 10 U2.2U UThe Concept of All-InclusivesU ................................................................................... 11 U2.3U UAll-inclusive Global OperationsU................................................................................. 14 U2.4U UCritical Analysis of All-InclusivesU .............................................................................. 17
UCHAPTER THREEU.................................................................................................................. 20 UALL-INCLUSIVE EXPENDITURE U ....................................................................................... 20
U3.1U UConceptualization of ExpenditureU ............................................................................. 20 U3.2U UCategorization of Tourism ExpenditureU .................................................................... 21 U3.3U UEstimating Tourism ExpenditureU............................................................................... 22
U3.3.1U UTotal All-Inclusive Expenditure (in the Country of Residence & Destination)U ....... 22 U3.3.2U UAverage Expenditure per All-Inclusive Tourist at the DestinationU ......................... 23 U3.3.3U UAverage Daily Expenditure per All-Inclusive Tourist at DestinationU...................... 23 U3.3.4U UExpenditure Affected by the Availability of All-Inclusive Product per Se.U ............. 23
U3.4U UMethods of Collecting and Estimating Tourism ExpenditureU .................................... 24 U3.4.1U UExisting Data U......................................................................................................... 25 U3.4.2U UDirect ObservationU................................................................................................ 25 U3.4.3U UHousehold Surveys U ................................................................................................ 26 U3.4.4U UTourism Establishment Surveys U............................................................................. 26 U3.4.5U UVisitor SurveysU ...................................................................................................... 27
U3.5U USummary of the Chapter U............................................................................................ 28 UCHAPTER FOURU .................................................................................................................... 29 UALL-INCLUSIVE MOTIVATION U.......................................................................................... 29
U4.1.U UTourist Motivation U .................................................................................................... 29 U4.2.U UTheories of Tourist Motivation U ................................................................................. 30 U4.3.U UChoice Models U........................................................................................................... 32
U4.3.1U UVisitor AttributesU................................................................................................... 32 U4.3.2U UThe traveling attributesU .......................................................................................... 33 U4.3.3U UModal attributes U .................................................................................................... 34
U4.4.U USummary of the Chapter U............................................................................................ 35 UCHAPTER FIVE U...................................................................................................................... 37 UALL-INCLUSIVES LINKAGES U ............................................................................................. 37
U5.1U UIntroduction U .............................................................................................................. 37 U5.2U UThe Concept of Local LinkageU .................................................................................. 37 U5.3U UEmpirical studies on Linkages in TourismU ................................................................. 39 U5.4U UAll-Inclusive Supply in the Balearic Islands U................................................................ 43 U5.5U UExclusive All-inclusive Suppliers in MallorcaU ............................................................. 48 U5.6U UProportion of the All-inclusive supply within the Accommodation Capacity U ............. 50
UCHAPTER SEVENU .................................................................................................................. 53 UMETHODOLOGY OF THE STUDY U..................................................................................... 53
U6.1U UResearch DesignU ........................................................................................................ 53

3
U6.2U UStudy Area and Sampling ProcedureU .......................................................................... 53 U6.3U UData Collection Methods and Procedures U.................................................................. 55
U6.3.1U USecondary Data U ..................................................................................................... 55 U6.3.2U UPrimary Data U ......................................................................................................... 55
UCHAPTER SEVENU .................................................................................................................. 59 UESTIMATION OF ALL-INCLUSIVE EXPENDITUREU ....................................................... 59
U7.1U UIntroduction U .............................................................................................................. 59 U7.2U UDemographic and Travelling Characteristics of the RespondentsU............................... 59 U7.3U ULength of Stay and Type of Accommodation Stayed U ................................................. 64 U7.4U UEstimating the All-Inclusive ExpenditureU .................................................................. 65
U7.4.1U UExpenditure CategoriesU ......................................................................................... 65 U7.5U UEstimating the Expenditure Regression Model U .......................................................... 69
U7.5.1U UThe Impact of the All-inclusive presence at the destination U ................................... 72 UCHAPTER EIGHT U .................................................................................................................. 77 UDISCUSSION AND CONCLUSION U...................................................................................... 77
U8.1U UIntroduction U .............................................................................................................. 77 U8.2U UDiscussions for the Demand-Side FindingsU ............................................................... 77
U8.2.1U UExpenditureU........................................................................................................... 77 U8.2.2U UAll-inclusives LoyaltyU ............................................................................................. 78 U8.2.3U UDiscussions for the Supply-Side FindingsU .............................................................. 79 U8.2.4U UWorks-in-ProgressU ................................................................................................. 79
UREFERENCEU........................................................................................................................... 80
4
0BCHAPTER ONE 1BINTRODUCTION
1.1 15BThe Background
With tourism preferences continuously being shifting, all-inclusive (AI) holidays maintain their
dominancy in many sun and sand destinations (Corcoran et al., 1996; Falzon, 2003).
Mediterranean and Caribbean represent the major inclusive destinations worldwide, with
European countries (Britain and Germany) and the US leading the markets for such holidays
(Tourism Intelligence International: TII, 2000a, b). AIs are the vacations where practically
everything is included in a single pre-paid price including meals, snacks, beverages, sport
equipment and instructions, government taxes and gratuities; and the use of cash is eliminated
from the holiday experience (TII, 2000a). AI travellers prefer the entire tour experience to be
arranged for them (Heung and Chu, 2000) by the series of what Enoch (1996) refers as ‘surrogate
parents’ in the shape of tour agents or operators (packagers) for paying them in advance (Philips
and Webster, 1983). Usually such packagers are based in the tourist-generating countries, which
makes a major portion of the all-inclusive economic benefits to remain in their countries
(Hemmati and Koehler, 2000; Alegre and Pou, 2006).
Since everything has been prepaid for in the tourist-generating country, the AI tourists are less
motivated to spend extra money at the destinations. At the destinations, they stay in enclaves that
are often located in the isolated environments, thus reducing their chances to interact with the
locals and spend in the local economy (Freitag, 1994; Abdool & Carey, 2004). According to
Enoch (1996), package tourists in effect, never visit the places they travel to, because they spend
their days in the isolation of the tour bus and their nights in the sterilize environment of the
hotel. Reid (1992:75) has named the all-inclusive resorts as the “concentration camps of leisure”,
while Issa and Jayawardena (2003:167) describing the all-inclusive modal as a “necessary evil”.
Mbaiwa (2005: 159) portrayed the enclave tourism as an “internal colonialism”, because the
goods and services available in the enclave facilities are usually beyond the financial means of the
local communities and the natural resources in a host region mostly benefit outsiders while the
majority of locals derive little or no benefits.
Moreover, Ceballos-Lascurain (1996) describes the AI mode as a tourism that is concentrated in
remote areas in which the types of facilities and their physical location fail to consider the needs
and wishes of the surrounding communities. However, the AI product is not standardized
globally but, more adapted in terms of the intensity of the bundles, the location and the
5
operations of the resorts offering the product, depending on the destination visited. In the
Caribbean, the AIs are treated as unified product, with the AI resorts located in the typical
holiday areas, within which guests become permanently isolated from the hosts. Above all,
resorts offering AI are more specialized; offering exclusively AI bundles which carry a
considerable number of services. Unlike Caribbean, in the Mediterranean destinations and when
referring to the Balearic Archipelago, the AI package tour is normally offered as one of the
product lines offered in the hotel; as most hotels offering AIs, offer simultaneously other
boarding basis such as half board and or full board. The contents of the AI package are lighter
than in the Caribbean and because of the developmental aspect of the destination, the isolation
factor has proved impossible. Therefore, most of them are located in the cities and in the
residential areas of the local community.
In the Balearics, the AI modal was first introduced in 1950 when Blitz opened an inclusive
vacation club, Club Mediteranee or Med Club in Mallorca as a response for what Issa and
Jayawardena (2003) describe as a demand for a unique escape from the hardships of post-war in
Europe. Since then, the AI demand in the islands has been growing, with the British and German
packagers, very keen to develop the product. Alegre and Pou (2006) estimate the AI demand
growth rate of 70.35% in the Balearics from 2002 to 2004 alone, moving from respectively 9.58%
to 16.32% of the total arrivals. Tourism represents about 85% of the GDP in the Balearics (Hoti,
et.al, undated; Parrilla, et. al, 2006), which is made up of the islands of Mallorca, Minorca, Ibiza
and Formentera. With the total area of 5,014 km2, the Balearic Archipelago is a home to
1,008,938 people (GIBF
1F, undated). On average, 10 million tourists visit the Archipelago every
year; with at least 60% of them to Mallorca.
In 2005 and 2006 for instance, total arrivals, were respectively 11,626,188 and 12,577,829 tourists;
of which 62.7% and 61.5% respectively went to Mallorca. Britain and Germany are the main
tourist-generating countries to the Balearics, accounting for at least 60% of the arrivals (Juaneda
and Sastre, 1999; Falzon, 2003; Hoti, et al., 2005). In 2005 and 2006, the two nationalities
together represented respectively 63.4% and 60.9% of the arrivals (IB-Dades Informatives, 2006).
The fact that tourism is a lifeline in the Balearics, everything remains constant including capacity,
the growth of AI demand implies the decline of the conventional tourism, in which all other
expenditure apart from transport and bed is incurred at the destination. This would have severe
impact on the local economy.
1 Govern de les Illes Balears

6
Nevertheless, because the AI demand is still mounting, while the consumption at destination is
still doubtful (Issa and Jayawardena, 2003; Alegre and Pou, 2006), studying the factors explaining
its demand is important in order to come up with the strategies and policies to create a situation
which would make the all-inclusive demanders better-off without making the tourism suppliers
and the destination stakeholders worse-off. Because destinations that offer all-inclusive holidays
compete between each other, for any destination to impose or simply rule out the AI experience
is not feasible, unless there is knowledge of why does the tourist prefer AI holidays to other tour
modes. To understand the factors explaining the demand for all-inclusives is to contemplate on
the motivation of tourist to choose that kind of holiday experience. Knowledge of tourist
motivation according to Crompton and McKay (1997), paves the way for creating better products
and services. Tourist motivation according to Pearce et al., (1998) is the global integrating
network of biological and cultural forces which gives value and direction to travel choices,
behaviour and experience. Economic theory believes that consumers have special preferences
consistent with their choice among alternatives (Wong and Kwong, 2004). Hence, knowing
factors motivating the choice of the AI tours among tour options is essential in order to
understand the AI tourist preferences.
Concerning the supply, most AI enclaves are alleged to be operated by multinational companies
whose head quarters are usually based in the foreign countries, away from destinations; which
allow narrow economic benefits go to the local economies. According to Freitag (1994), AI
enclaves create an economic situation whereby the lower-classes are exploited as a source of
cheap labour with the foreign companies reaping most of the economic benefits. Abdool and
Carey (2004) have shown that most AI resorts in Tobago were owned by the outsiders and most
of the all-inclusive expenditure were not reaching or remain in the economy of Tobago because it
was pre-paid in the tourist generating countries. Godwin (2006) adds something else that,
because AI resorts deal with foreign guests, they always prefer to source their inputs
internationally, which multiplies leakages.
However, even with such economic criticisms, AIs have already gained a place within the whole
tourism landscape; so it is not easy to rule out their operations. The way forward is the creation
and promotion of integrations or linkages between tourism providers, local businesses and
residents in order to share the tourism benefits. Linkages in the destination are encouraged to
achieve economic development (Dieke, 1993; Godwin, 2006; Meyer, 2006). Expansion of
linkages connotes the increase of usage of other economic sectors, which stimulates the economy
7
as a whole and creates synergy effects between different sectors of the economy. According to
Godwin (2006), through linkages, hoteliers can work with local supply chains to buy locally-
produced products, employs local staff, and creates opportunities for local producers to sell arts
and craft or tourism services to guests.
In many tourism-specialized economies, especially in the sun and sand destinations where the AIs
continue maintaining their dominance, local linkages are necessary. It is not reasonable, for
instance, to extend public tax money towards tourism infrastructures only to provide a few
enclaves with captive guests while the hosts can not sell them anything. The problem now is the
mechanisms through which the adjustment to the new demands can be achieved without denying
the demands of the hosts; therefore makes the AI modal a topical issue in many destinations.
The concern is that, the enclosure of the AI tourists leads to their under-spending at the
destination economy (Issa and Jayawardena, 2003; Alegre & Pou, 2006). In the Balearics, hosts
have witnessed a massive transformation in the hotel sector, shifting from conventional bed-
breakfast to offer the AI holidays. In Mallorca alone, the AI supply grows at a growth rate of
about 64% moving from 153 AI enterprises in 2004 to 195 in 2006. Every agent in the
economy depends on tourism for his survival. Thus, given that AI supply and demand trends
continue mounting, what would be their impacts on the economy? It was that background,
that this study was triggered.
The study therefore, intends to respond to the three broad questions, with special attention
given to the Balearics, which is one of the typical sun and sand destinations. (a) What is the
contribution of all-inclusive tourists to the destination economy? (b) What motivate visitors
to choose all-inclusive package tours when travelling? (c) How do AI hotels contribute to the
local economy through local linkages?
1.2 16BThe Study Objectives
Generally the study examines the economic impacts of all-inclusive package tours with special
reference to the economy of the Balearic Islands. More, specifically the study:
1. Estimates the contribution of AI tourists to the destination economy by:
- exploring AI tourist expenditure for their holidays to the Balearics
- estimating the on-trip all-inclusive expenditure by consumption categories
- measure the effect of all-inclusive existence at the destination on the number of visits,
length of stay and tourism expenditure
8
2. Identifies factors motivating guests to choose all-inclusive tours when visiting Balearics.
3. Investigates the all-inclusive local linkages involving the all-inclusive hotel sector and the
local suppliers in the Balearic Archipelago by:
- Establishing the level of supply for the AI hotel sector at the destination.
- Identifying the products that all-inclusive hotels purchase locally
- Exploring the actors involved in the linkages between all-inclusive hotels as
demanders and actors in the local economy as suppliers
- Investigating on the nature of the contracts involved (if any) between AI hoteliers
and their suppliers
1.3 17BSignificance of the Study
The findings of the study would be relevant not only to the Balearic Archiplago but also globally
since previous studies have demonstrated certain uniformity in economic models applied from
country to country. More concretely:
1. Since, tourism is a lifeline to many sun and sand islands like the Balearics, critical policies to
match industry priorities while meeting community needs with feasible tourism modals are
indispensable. Measuring the economic impact of all-inclusives would assist destination
stakeholders when making rational decisions concerning the future of the community. It is
important to recognize that, as Britton (1991) has verified, tourism enterprises are not in the
business of community development, but in the business of accumulating resources for
themselves. Therefore rational policies are vital.
2. Tourisiers can make use of the all-inclusive motivating factors to strategically meet the needs
of the AI market, with the aim of capturing the consumer surplus which is central element of
the economy. As Murphy (1985) said, motivation is important for the development of
tourism; because without the interest to travel, the tourism industry would not exist.
Motivation is the main influencer of tourism demand patterns (Bogari et al., 2004). Policy-
makers can still rely on the same identified motivating factors, but create conditions that
would enable the AI tourists to interact with the hosts and spend more at the destination.
3. Since co-operation is one of the key components in creating a pleasant package tour,
destination agents can capitalize on the potentials revealed in this study to effectively utilize
local resources in order to jointly create an appealing holiday experience as part of economic
development strategies. The study exposes the direction of the local resources employments,
and the economic value of the hotel sector to the local economy; results which policy makers

9
can use to reliably and practically make policies and strategies that ensure that tourism
operations have strong linkages with the rest of the local economy.
4. Still, very little body of literature about the subject under the study is available. Therefore any
person who would be interested to research the same area of all-inclusive in the future, this
study would serve as a base.
10
2BCHAPTER TWO 3BTHE ALL-INCLUSIVE MODAL
2.1 18BEvolution of the All-Inclusives
The history of all-inclusives goes back to the 1930s when first applied by the Butlin’s holiday
camps in the Barry Island (Poon, 1998; Issa and Jayawardena, 2003). The Butlin’s camps were
built as means to provide cheap holiday experience to majority of the working-class families in
Britain (Issa and Jayawardena, 2003). Later in the 1950s, the French origin Club Mediterranee or
‘Med Club’ developed the concept further through launching a holiday camp in the Island of
Mallorca (George Washington University, 1997; Encyclopedia Club Med). According to Clark
(2000), Club Med intended to eliminate extra charges that can sour the sweetest of vacations.
However, by today’s definition of all-inclusive, neither the Butlins’ nor Club Med could fit in,
because the ‘AI provided in the Butlin’s Camp services were still paid for in some form of
currency at the destination. It was the same in the Club Med, where still one had to use plastic
beads as currency to pay for services (Issa and Jayawardena, 2003). Two decades later in the
1970s, the product developed extensively, gained more market acceptance and spread from
Europe to operate worldwide (Inskeep, 1991); and AI was considered as the main influence of
the expansion of mass international tourist markets (Shaw and Williams, 1994). When tourism
became popular in the Caribbean during the 1970s and early 1980s, a new brand of package tour
resorts was established (Jayawardena, 2002; Abdool and Carey, 2004).
During that period, the original concept of Club Med was borrowed, modified and introduced to
the Caribbean destinations; in which, the world-renowned, AI hotel companies like Sandals, were
launched. By today’s definition of AI, the Caribbean AI product lines were “more inclusive”
because with cashless at a destination, a tourist was provided with almost everything he needed
during his holiday (Jayawardena, 2002; Issa and Jayawardena, 2003). However, as time continues,
more alterations are taking place, with the trends still showing Britain and Germany as the leading
markets for such tours (TII, 2000a,b; Alegre & Pou, 2006). Since 1995 at least 50% of the British
outbound tourists, been traveling through all-inclusives (Meyer, 2003). Also see the Appendices
3. Therefore, tour operators in Europe continuously being the world giant packagers. World of
TUI, for instance, since 1998, has being including a credit note for the hotel boutique in the price
of AI holidays. Thomas Cook, First Choice and Thomson have as well dedicated AI brochures.
Year 2006, for instance, saw Thomas Cook introducing All-inclusive Plus (Tomas Cook, 2006)
which adds à la carte dining, premium branded alcohol, spa facilities and a wide range of sporting
11
activities for its AI clients. Thomson has at least 50 types of all-inclusives available in 25
destinations, targeting markets like families, wedding and couples (TII, 2000a:93).The modal is
evolving in many areas and aspects. The more the time goes, the cheaper the AI modal becomes.
Its average price in the UK, for example, was £959 in 1995, but in 1998 this had fallen to £780
and in 2000 to £450 (TII, 2000a: 96). From the marketing field, slogans such as Club Med
“everything’s included, including the fun” or Sandals “is for lovers”; or at Hedonism-“if it feels
good it’s included” are all accompanying the all-inclusives marketing strategies (Henthorne &
Miller, 2003). It is undeniable fact from the described evolution that, as tourism product, the AI
modal has remained a continual phenomenon in every sense.
2.2 19BThe Concept of All-Inclusives
To comprehend the all-inclusive concept, we need to first conceptualize the package tours.
Sheldon and Mak (1987) define a package tour in general as a combination of many components
of a vacation such as transportation, accommodation, sightseeing, and meals which are sold to
customers at a single price. According to Middleton (1991), the package tour comprises of any
two or more elements of transport, accommodation, food, destination attractions, and other
facilities and services. Middleton (1994) later described it as a prearranged combination of at least
two items, such as transportation and accommodation, offered for sale for a period of more than
twenty-four hours. Holloway (2000) describes the concept as the itineraries put together by a tour
operator or other supplier, usually incorporating at least three elements, transportation,
accommodation and transfers, and some packages may also include additional services like
excursions. WTO (2004) define a package tour in detain as a ‘tourism product’ provided by a
tour-operator which elaborates it and sells it directly or through travel agencies, in which travelers
receive a combination of products associated to a trip, which are made of more than one of the
following tourism services: transport, accommodation, food, sight seeing, entertainment and
others (ibid: 153).
Due to variability of contents included in various packages, a number of modals have been
introduced to the market, ranging from very ‘basic package’ to ‘all-Inclusive’ packages (Sheldon
and Mak, 1987; Yamamoto and Gill, 1999; Wong and Kwong, 2004). The classification of the
types of package tours depends on the level of the prearranged travel services. The basic package
includes only transport and accommodation (Wong and Kwong, 2004); while the all-inclusives
add almost everything that tourist may need at a destination. Alegre and Pou (2006) and Alegre
and Juaneda, (2006) have categorized the package tour into five modals: transport and bed;

12
transportation, bed plus breakfast; transportation plus half board; transportation plus full board;
and all-inclusives.
The AI, which is the focus of the study, has been defined by Sheldon and Mak (1987), Morrison
(1989), and Heung and Chu (2000), as a trip planned and paid for a single price in advance, which
covers a broad range of items from commercial transportation and accommodation to meals and
sightseeing, sometimes accompanied by an escort or guide. Middleton (1994) defines it as an
inclusive form of travel, organized by intermediaries; in which the tour represents a bundle of
tourism goods and services, marketed as one particular product or brand and sold at an inclusive
price. Holloway (1998) prefers to define the AI modal as integrated travel services, which are
bought in bulk by the tour operator, assembled, and resold to customers as a package including
different services.
TII (2000a) refers AI as vacations where virtually everything is included in a pre-paid price-from
airport transfers, baggage handling, government taxes, room, all meals, snacks, drinks and
cigarettes, the use of facilities, equipment and certified instructors; also includes gratuities (tips
and service charges) and nightly entertainment. And that the use of cash is eliminated from the
holiday experience and visitors know in advance the exact cost of their holiday (ibid). Quoting
Paris and Zona-Paris (1999), Issa and Jayawardena (2003) pointed out special attributes of all-
inclusives as: promises consistency and quality-good beverages and fare, safe and comfortable
accommodation, caring staff, and plenty of accessible activities. What is more according to the
authors is that all-inclusives do not bear any kind of surprises (unless surprise is part of the
package), especially on unexpected costs during vacations.
In the AI operations, the producer of the packages is the packager; be it a travel agent or tour
operator, while its elements are fabricated by several tourism providers. The packager buys
several parts or elements of tourism, including transport, accommodation, meals, entertainments
and others; assembles them into a finished product, known as the ‘all-inclusives’, which finally
sells it in a single price to a tourist. Once purchased, the tourist starts disassembling the final
product back to its original state through consumption, normally starting and ending with the
element of transport. The product diminishes stage by stage based on consumption until it
finishes with the transport. The consumer of it senses the end of the product when he is no
longer a tourist but, a citizen of his original country. Many studies have tried to describe the basic
features of this tourist, while focusing more on when he is already at the destination. Britton

13
(1982) for example writes that, the AI tourists are transported from international transport
terminals to hotels and resort enclaves, again travel between resort clusters and finally return to
the primary urban areas for departure.
Using observed features, Smith (1989) portrays them as visitors, who arrive en masse, wear name
tags, assigned to numbered buses, counted aboard, and are continually reminded to get on the
right bus. Focusing on behavioral perspective, Basala and Klenosky (2001) describe this tourist as
a visitor that preferring to experience the host community through the protection of
“environmental bubble” that allows him to interact and function at a familiar level of comfort
and security. On the other hand, this tourist has been described using psychocentric and
allocentric personality types (Plog, 1973). In the latter, traveler is an adventurer who prefers
exotic, while in the former; traveler is safety seeking who prefers the familiar. The package
traveler suits with the psychocentric due to his safety seeking behavior (Schuchat, 1983; Quiroga,
1990 and Wong and Kwong, 2004) and because everything has been pre-planned, he does not
expect any exotic. Lee and Crompton (1992) share the opinion that, pre-planned vacationers as
novelty avoiding tourists who prefer familiars. AIs in this study refer to a trip pre-paid in advance
in a single price, that includes bundle of services a tourist may need for his trip and vacation in
the Balearics, including return ticket, ground transfers, accommodation, meals and drinks,
sporting activities, entertainments and other services; and that the prepayments are done at the
visitor’s country of residence. Figure 3 summarizes the contents of each package, in which, shaded
ovals present the bundle of services referred to as package tours.
Source: Developed in this Study, 2006
Fig. 3 Types of Package Tours
Transport Accommodation
All Meals
Unlimited locally produced alcohol Unlimited soft drinks
Anytime snacks Child Care Transfers
Entertainments Sporting Activities
Excursions & Sightseeing Extra Services
Breakfast
One Meal
Basic Package Bed &
Breakfast
Half Board Full Board
All-Inclusive Tour

14
2.3 20BAll-inclusive Global Operations
All-inclusive package holidays are most popular in the Caribbean (Issa & Jayawardena, 2003;
Abdool & Carey, 2004; Clark, 2000), Mediterranean (TII, 2000a, b; Alegre & Pou, 2006a) and
American (Sheldon and Mak, 1987; Jorgensen & Solvoll, 1996; Davis & Morais, 2004)
destinations. In a very recent the modal has gained market acceptance in other parts of the world
like the Asian (Wong and Kwong, 2004; Wang et al. 2004; Bowen, 2001), African (Mbaiwa, 2002,
2005) markets and other parts of Europe (Corcoran et al., 1996; Jorgensen & Solvoll, 1996). As
have already been said, the all-inclusive modal is not a worldwide standardized product, although
to a large extent itineraries offered by travel agencies are similar with reference to entertainment
and meals (Wong and Kwong, 2004). Box 1 presents one of the typical all-inclusive resorts in the
Caribbean destinations as an example.
Wong and Kwong (2004) mention one of the main distinguishing characteristics of the all-
inclusive tourists that, they usually prefer geographically nearer countries. Their findings are well
supported in the past studies as well as what actually prevails in the all-inclusive operations
worldwide. Sheldon and Mak (1987) have for example cited Hawaii as the main AI destination
for American and Canadian markets. Likewise Wong and Kwong (2004) found that, all-inclusive
package tours are the most popular travelling mode for Hong Kong people and that Southeast
Asia and China represent the destinations for that market. Alegre and Pou (2006) and TII (2000a,
b) have shown that the German and British AI tourist prefer the Mediterranean destinations,
with the former citing Balearics as the main destination. Moreover, Jorgensen and Solvoll (1996)
have shown that the main destinations for the Norwegian AI tourists include Spain, Turkey,
Greece and Cyprus or Bulgaria; which together receive 84% of the Norwegian outbound AI
tourists. Mbaiwa (2005) on the other hand has shown South Africans as among the main AI
tourists to the Okavango Delta in Botswana.
BOX 1: A typical All-inclusive Resorts in the Caribbean
Offers a wide range of activities including:
- Round trip airport transfers and baggage handling - Government hotel tax - Tips, gratuities, service charges - All meals - Unlimited drinks

15
- Anytime snacks - 2 gourmet specialty dining restaurant - Air-conditioned rooms (and suites) with king-sized beds, hair dryers, clock/radios,
telephone, safe, satellite TV with movie channel - Exercise/weight rooms/fitness centre - Nightly entertainment - Indoor games room, movies - Pool tables - White sand beaches - Scuba diving, snorkelling, sailing, windsurfing, Hobie Cats (including certified instruction) - Canoes, kayaks, paddle boats, glass-bottom boats, water-skiing - Sauna, whirlpool, steam baths - 2 freshwater pools - Swim-up pool bars - 3 tennis courts (day & night) - Racquet ball, squash, table tennis, volleyball, basketball - Lawn chess - Shuffleboard, horseshoes, croquet - Playmakers (hosts & hostesses) - Discotheque - Piano bar - Group and meeting facilities - Golf (18) holes, including green fees - Offshore island - Stay at one, vacation at all six, and - Stay at one, dine at all six
Source: Tourism Intelligence International, 2000a: pp.95
Going back to our research area, Balearic Archipelago is among typical all-inclusive destinations
in the Mediterranean basin. Among its noticeable features, is its leading role in Spain in terms of
receiving many package tourists per annum (Instituto de Estudios Turísticos: IET, 2004).
Package tourists, in this context, consist of visitors who buy at their countries of origin, transport
plus any other service they consume during their vacation at the Islands including
accommodation, breakfast, half board, full board, and above all all-inclusive package tours. It has
been estimated that at least 85% of the tourist arrivals during high seasons travel on package
tours (Juaneda and Aguiló, 2000; IET, 2004; Alegre and Pou, 2006b). According to Alegre and
Pou (2006b), of the arrivals from 2002 to 2004 consecutively, 88.34%, 90.22% and 88.32%
respectively traveled on package tours. Nationality-wise, German, British and Spanish tourists
were leading. In 2005 for example, of the German, British and Spanish tourist arrivals, 61.6%,
58.0% 36.8% respectively, traveled on package tours. Likewise in 2006, of the same nationalities
57.2%, 59.4% and 33.7% respectively traveled on package tours (IB-Dades Informatives, 2005,
2006).

16
The growth rate of the all-inclusive demand in the Balearic Archipelago is also an emergent
phenomenon. All-inclusive demand in this context can be described as a desire to travel through
all-inclusive package tour, combined with the ability to purchase it. As also shown in Table I
between 2002 and 2004 alone, the all-inclusive demand in the Archipelago has increased by
70.35%, rising from respectively 9.58% to 16.32% of the total arrivals (Alegre and Pou, 2006b).
Germany and British tourists were also leading in this mode of travel; representing respectively
17% and 9% of the respective nationality arrivals in 2003; as well 21.5% and 15% of the
respective nationality arrivals in 2004 (ibid). Moreover, most of AI tourists to the Islands are
repeaters, with the authors (ibid) showing that in 2002 and 2004 at least half of them had been at
the destination in the past.
Tabla I Services Bought at the Country of Origin (%) 2002-2004
Tour Mode 2002
2003
%
change2004
%
change Transport Only 11.66 9.78 -16.12 11.68 19.42 Transport & Bed 29.28 23.13 -21.00 21.13 -8.65 Transport, Bed & Breakfast 6.01 5.66 -5.82 6.01 6.18 Transport & Half Board 38.29 44.50 16.22 39.33 -11.62 Transport & Full Board 5.17 3.69 -28.63 5.52 49.60 All-Inclusive 9.58 13.25 38.31 16.32 23.17 TOTAL 100.00 100.00 100.00
(Source: Modified from Alegre and Pou, 2006b)
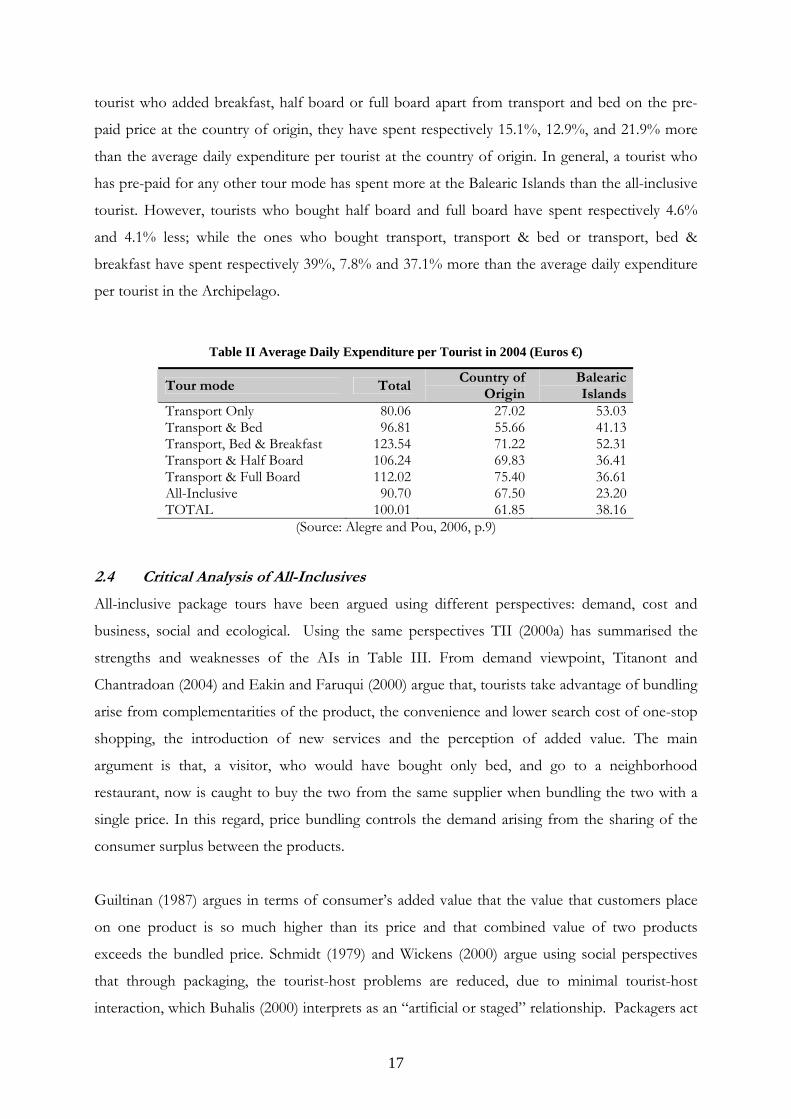
In addition, when estimating the tourism expenditure in the Balearics, Alegre and Pou have
shown that, this type of segment tends to spend lesser at the destination than the overall
expenditure per tourist. Their estimates show that, in 2004 the average daily expenditure per
tourist in the islands was € 100.1; but an AI tourist had spent 9.3% less. At the country of origin,
that tourist had spent 9.13% more; while at the Balearics had spent 39.2% less. Table II presents
the estimates. In relation to the expenditure by alternative kinds of tour modes, their estimates
have revealed that in totally, the tourists who bought only transport and transport & bed at their
country of origin, have spent respectively 19.9% and 3.2% less than the overall average daily
expenditure per tourist.
In contrast, the ones who included breakfast, half board or full board in the pre-paid price, have
spent respectively 23.5%, 6.2% or 12% more. Likewise in their country of origin, the tourists
who bought only transport or transport plus accommodation, have spent respectively 56.3% and
10% less than the overall average daily expenditure per tourist in the country of origin. But the
17
tourist who added breakfast, half board or full board apart from transport and bed on the pre-
paid price at the country of origin, they have spent respectively 15.1%, 12.9%, and 21.9% more
than the average daily expenditure per tourist at the country of origin. In general, a tourist who
has pre-paid for any other tour mode has spent more at the Balearic Islands than the all-inclusive
tourist. However, tourists who bought half board and full board have spent respectively 4.6%
and 4.1% less; while the ones who bought transport, transport & bed or transport, bed &
breakfast have spent respectively 39%, 7.8% and 37.1% more than the average daily expenditure
per tourist in the Archipelago.
Table II Average Daily Expenditure per Tourist in 2004 (Euros €)
Tour mode TotalCountry of
Origin Balearic Islands
Transport Only 80.06 27.02 53.03 Transport & Bed 96.81 55.66 41.13 Transport, Bed & Breakfast 123.54 71.22 52.31 Transport & Half Board 106.24 69.83 36.41 Transport & Full Board 112.02 75.40 36.61 All-Inclusive 90.70 67.50 23.20 TOTAL 100.01 61.85 38.16
(Source: Alegre and Pou, 2006, p.9)
2.4 21BCritical Analysis of All-Inclusives
All-inclusive package tours have been argued using different perspectives: demand, cost and
business, social and ecological. Using the same perspectives TII (2000a) has summarised the
strengths and weaknesses of the AIs in Table III. From demand viewpoint, Titanont and
Chantradoan (2004) and Eakin and Faruqui (2000) argue that, tourists take advantage of bundling
arise from complementarities of the product, the convenience and lower search cost of one-stop
shopping, the introduction of new services and the perception of added value. The main
argument is that, a visitor, who would have bought only bed, and go to a neighborhood
restaurant, now is caught to buy the two from the same supplier when bundling the two with a
single price. In this regard, price bundling controls the demand arising from the sharing of the
consumer surplus between the products.
Guiltinan (1987) argues in terms of consumer’s added value that the value that customers place
on one product is so much higher than its price and that combined value of two products
exceeds the bundled price. Schmidt (1979) and Wickens (2000) argue using social perspectives
that through packaging, the tourist-host problems are reduced, due to minimal tourist-host
interaction, which Buhalis (2000) interprets as an “artificial or staged” relationship. Packagers act

18
as buffers between tourists and the unknown, arranging the trip, interpreting, and handling
problems which might arise (Schmidt, 1979). Because of this interrelation gap, Wickens (2000)
concludes that, the tourists stay enjoyable, free from any problems or unpleasant experiences.
Focusing on the travel-party sentiments, TII (2000) argues that, with AIs, the potential for
embarrassment, stress or conflict that the spending of money could create is avoided because
financial decision-making have been pre-made.
Cost and business perspectives have been argued using economies of scale potentials. According
to Enoch (1996) and Buhalis (2000), tour organizer, who buys in bulk, is able to offer
accommodation, meals, and transport at a lower price than that which is available to the
independent tourist. From business stance, the all-inclusives bring certainty in planning and
inventory controls. According to TII (2000), the resorts know in advance how many meals will be
needed on a particular day, and therefore adjust purchases and inventory of food and beverages
with greater certainty than other types of resorts. Also in hotels, the expenditure for computer
facilities to track guest expenditure is virtually eliminated; which saves resources in terms of time,
training, maintenance, and equipment and energy costs (ibid.). Considering the sustainability of
resources at the destination, Buhalis (2000) argues that, the modal entertains mass tourism which
call for massive developments of tourism facilities; if surpass the carrying capacity, it endangers
the sustainability of resources of the destination. Similarly, Pattullo (2000) argues that, because
all-inclusive resorts tend to be bigger and also built in ecologically vulnerable and remote areas,
they impact more forceably at construction stage. In contrast, Schmidt (1979), argues that, as the
hotels enclave the tourists, it limits the inflows of the tourists to the particular places, and
therefore control the movements of the masses, which in this case defends and protects the
destination’s natural resources.
Table III Strengths and Weaknesses of All-Inclusives
Strengths Weaknesses
Value for money Excessive animation, buffet line
Tourists can plan holidays better, knowing up front what the cost will be
Low inclination to spend outside the budget
Easier for travel agents to sell and they get commissions on the whole package
All-inclusives resorts pay out higher commissions package
Simplifies relationships between hotels and guests, and minimizes capital expenditure on computer equipment to track guests bills
High expenditure/investment in skilled labor
Simplifies inventory and stock procedures as all meals are pre-paid
Theft difficult to control
Eliminates the money relationship between hosts and Eliminates money incentives for workers

19
guests (no tipping allowed)
Guests do not have to leave hotel so value-added from spin-off activities is captured by the hotel
Potential for linkages outside of the hotel (e.g. taxi drivers, restaurants) can be limited
Tourists can feel secure in a well-planned and orchestrated environment
Leads to enclave type tourism: limits local participation and interaction of tourists in local community
Creation of skilled, flexible and empowered staff Staff can be easily exploited and overworked
Minimum size of 150 rooms seems to be necessary Not as well suited for smaller properties
Introduces another category of vacation and possibly new markets. Adds diversity to destination
Unable to take advantage of walk-ins, cruise passengers and business lunches as would conventional hotels
Source: Tourism Intelligence International, TII (2000a)

20
CHAPTER THREE ALL-INCLUSIVE EXPENDITURE
3.1 22BConceptualization of Expenditure
All-inclusives modal has lots of implications, but the main rests on the distribution of the tourism
expenditure between the main three stakeholders: tourist-generating country or region, tourist-
receiving country/region and the tourist herself. According to Aguiló, et. al (undated) and Sard,
et al. (2002), packagers, who are usually based in the visitors’ home economies, use package tour
as a pricing-strategy to win more customers through economies of scale on tours sold. Likewise,
tourist-receiving countries promote tourism not just for the sake of head and bed, but for
tourism earnings; and a lucid tourist wants to maximize utility from possible inexpensive tours.
Studies claim that in most cases, the tourist and the origin economy gain more from all-inclusives
deal than the destination economies (Wong and Lau, 2001; Issa and Jayawardena, 2003; Alegre
and Pou, 2006).
By definition, tourism expenditure refers to the total consumption expenditure made by a visitor
or on behalf of a visitor for and during her trip and stay at the ‘destination’ (United
Nations/World Tourism Organization, 1994). The word ‘destination’ refers to any significant
place visited on a trip (WTO, 2005b); and to be called ‘tourism expenditure’, Sheldon (1990)
argues that must comprise consumption at the site or within the study area that would not have
occurred without tourism. Mules (1998) described expenditure as a predictor and input to
portray the functioning of the national economy, and to estimate the impacts on such variables as
GDP, employment, and wage income. Consumption referred has been defined in WTO (1995),
as the value of goods and services used by or for tourism units (visitors). Normally, tourist
consumption conforms to the “final consumption” in the Systems of National Accounts (SNAs)F
2F
(WTO, 1995; 2004; OECD, 1996). However, that is not the case for package tours, as WTO
(2004) admits the difficulties involving the classification and treatment of the consumption in
package tour within SNAs and Balance of Payment. The package tour in WTO (2004) is not
considered as a ‘product’ on its own, but rather as a collection of different tourism services;
because otherwise, the demanders of the ‘product’ would then no longer be purchasing the
embodied tourism services.
2 the business visitors’ consumption is treated as intermediate consumption in the SNA (WTO, 2004)
21
Arguing on the significance of tourism expenditures, Mihalic (2002) emphasises that, tourism is
an expenditure-driven economic activity and that, consumption of tourism is at the centre of the
economic measurement of tourism and the foundation of economic impacts of tourism.
According to Britton (1983) and Wells (1997), tourism expenditure determines the economic
direction of a region. Frechtling 2006), Vanhove (2005), Mihalic (2002), Tyrrell and Johnston
(2001), Vaughan et al. (2000) and Frechtling (1994) share the opinion that, tourism expenditure is
the center for analysis of the economic impact of tourism at a destination. Economic impact
begins when a visitor to a destination spends any amount of money on any product in that area.
The direct recipients of that expenditures use the money to earn income, pay wages, and pay
taxes thus creating a direct impact on the local economy. When businesses and their employees
spend their income in the local economy, they create an indirect impact by supporting additional
jobs, wages, salaries, proprietary income and tax revenues. The sum of the direct and indirect
impact equals the total economic impact of traveller expenditures (Stynes, 1997, 2002). For the
same reason, all-inclusive expenditure in this study has been defined as total expenses of all
individuals in travel party that may be incurred during the trip from transportation (return ticket),
accommodation, meals, entertainment, shopping (including souvenir), ground transport,
communication (telephone calls, internet, etc), vehicle and equipment rentals and total
expenditures.
3.2 23BCategorization of Tourism Expenditure
Tourism expenditure varies according to travel mode or the services sought. For instance Tasci
et. al. (2003) found that, package travellers spend almost double on lodging than other travellers.
Chhabra (2003) reveals that, tourists in general spend more on lodging, followed by shopping,
food and beverage, and finally gasoline. WTO (1995, 2000) categorizes tourism expenditure into
three, depending on the time incurred. The first category is the pre-trip expenditure, in which the
preparation and undertaking of the trip are funded. In this category, services which will be used
entirely on the trip such as transport, package tours, accommodation and travel insurance are
included (WTO, 1995:8) and WTO (2000) emphasizes that the purchase of a package tour or
international transportation to another country, should be treated in the visitor's residence
(origin) country.
The second category is on-trip expenditure, which includes expenses incurred when travelling and at
the destination like the purchase of small durable goods for personal use, ground transport,

22
souvenirs and gifts for family/friends (Manente and Minghetti, 1998; WTO, 2000). Post-trip
expenditure is the third category, which includes other travel-related expenses incurred in the
country of origin after returning from the trip. It has been noted however that, tourism
expenditure, according to WTO (1995, 2000) and European Commission (1998), does not
include cash or donations made to private persons or institutions which do not represent
payment for tourism products, also does not include purchases for commercial purposes, capital-
type investments or transactions (e.g. real estate, cars, boats, etc.), even if they may in the future
be used for tourism purposes. If it happens that the capital good, like a car, is purchased during
the trip specifically for use on the trip and is sold during the trip, WTO (1995) proposes that, it is
the net cost, i.e. purchase cost plus the running cost minus sales price that should be included in
the tourism expenditure.
3.3 24BEstimating Tourism Expenditure
To estimate the actual expenditure, the study deals with the pre- and on-trip expenditures.
Therefore the study estimates the (i) Total expenditure (in the country of origin and on
destination), (ii) Average expenditure per tourist at the destination, (iii) Average daily expenditure
per tourist at the destination. However, because we focus on all-inclusive expenditure, which is just a
single segment in tourism; we have also introduced a new variable, which is missing in tourism
literature: (iv) The total expenditure influenced by the availability of AI product per se. The
following section expresses the equations that have been developed in this study to estimate the
tourism expenditure of any tour mode, in our case, all-inclusive expenditure.
3.3.1 47BTotal All-Inclusive Expenditure (in the Country of Residence & Destination)
In aggregate, total all-inclusive expenditure includes pre-payments at the visitor’s country of
origin, which usually cover at least return ticket and tourist accommodation; and the total on-trip
expenditure, which covers expenses like shopping, communication, entertainments, etc.
Equation 1 expresses the computation of total all-inclusive expenditure. However, the equation is
not limited to the AI segment only; it can be used to computes total tourism expenditure of any
tour mode.
[ ]∑=
+=n
iiit mcE
1 (1)
Where Et denotes total all-inclusive tourist expenditure in time t; ci is the expenditure incurred in
the country of origin by travel party i; mi denotes the expenditure incurred at the destination by
travel party i; and n is the number of all-inclusive tourists in the sample.
23
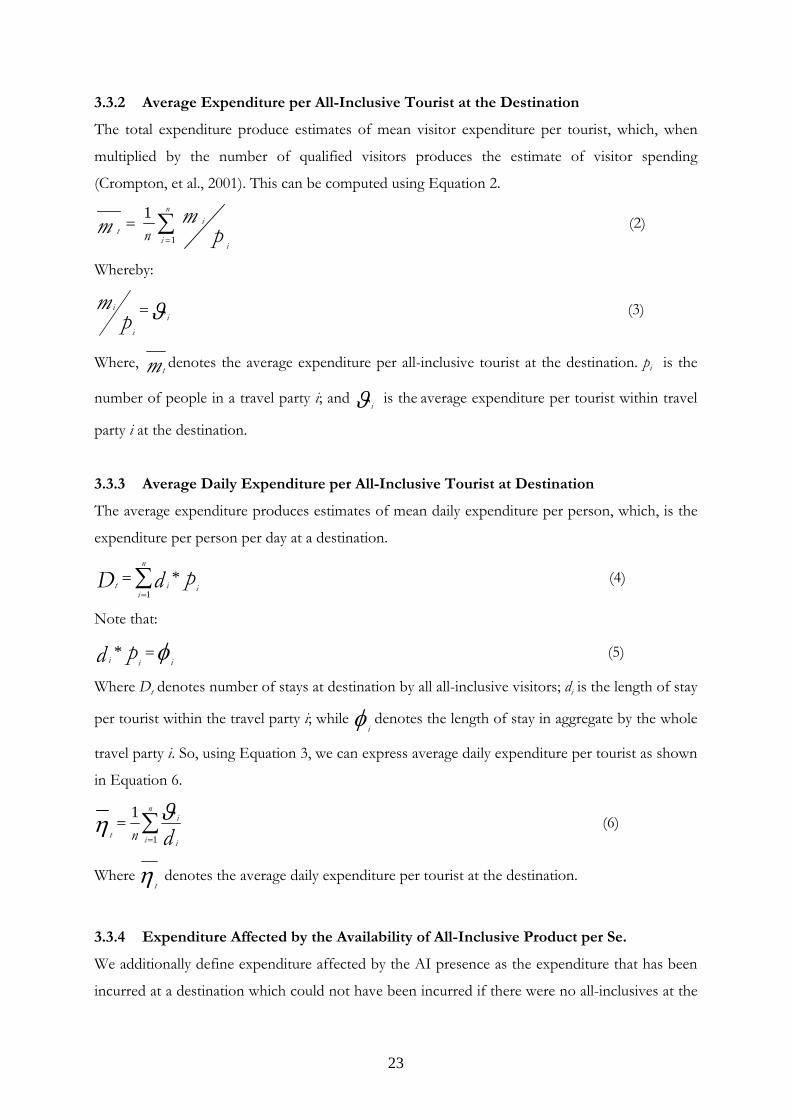
3.3.2 48BAverage Expenditure per All-Inclusive Tourist at the Destination
The total expenditure produce estimates of mean visitor expenditure per tourist, which, when
multiplied by the number of qualified visitors produces the estimate of visitor spending
(Crompton, et al., 2001). This can be computed using Equation 2.
∑=
=n
i i
it p
mm n 1
1 (2)
Whereby:
ϑ ii
i
pm = (3)
Where, mtdenotes the average expenditure per all-inclusive tourist at the destination. pi is the
number of people in a travel party i; and ϑ i is the average expenditure per tourist within travel
party i at the destination.
3.3.3 49BAverage Daily Expenditure per All-Inclusive Tourist at Destination
The average expenditure produces estimates of mean daily expenditure per person, which, is the
expenditure per person per day at a destination.
pdD i
n
iit *
1∑=
= (4)
Note that:
φ iii pd =* (5)
Where Dt denotes number of stays at destination by all all-inclusive visitors; di is the length of stay
per tourist within the travel party i; while φ idenotes the length of stay in aggregate by the whole
travel party i. So, using Equation 3, we can express average daily expenditure per tourist as shown
in Equation 6.
∑=
=n
i i
i
t dn 1
1 ϑη (6)
Where η t denotes the average daily expenditure per tourist at the destination.
3.3.4 50BExpenditure Affected by the Availability of All-Inclusive Product per Se.
We additionally define expenditure affected by the AI presence as the expenditure that has been
incurred at a destination which could not have been incurred if there were no all-inclusives at the
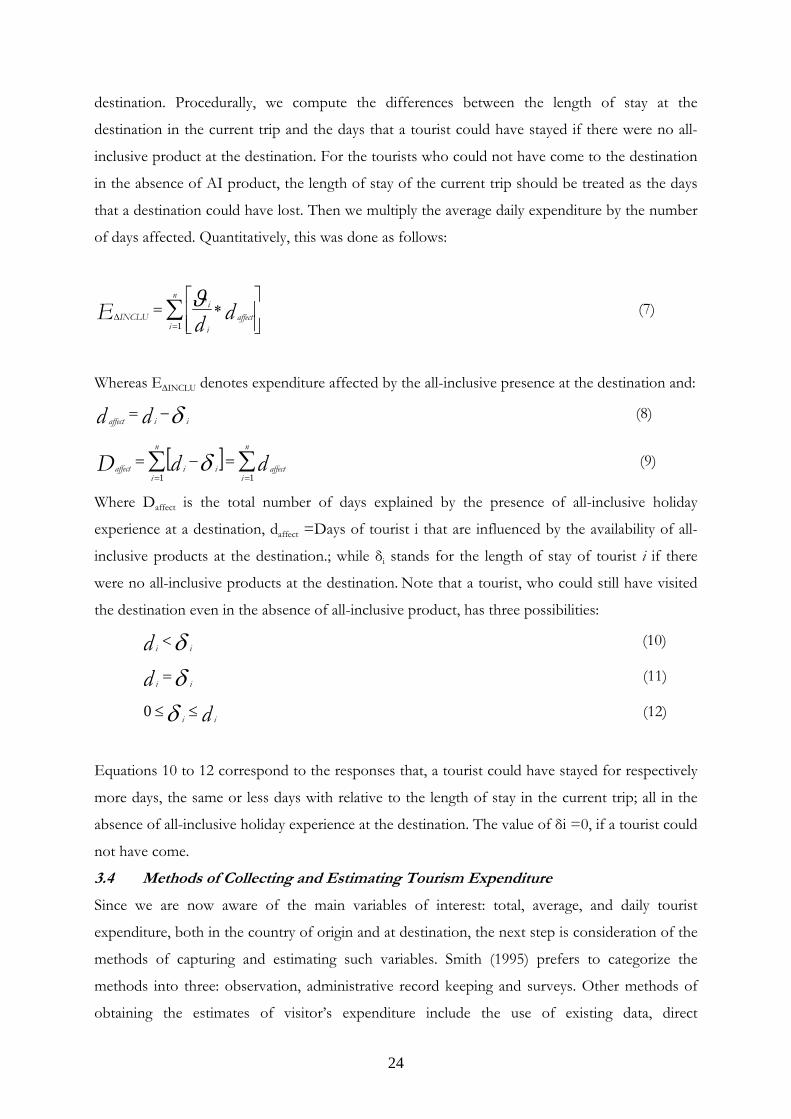
24
destination. Procedurally, we compute the differences between the length of stay at the
destination in the current trip and the days that a tourist could have stayed if there were no all-
inclusive product at the destination. For the tourists who could not have come to the destination
in the absence of AI product, the length of stay of the current trip should be treated as the days
that a destination could have lost. Then we multiply the average daily expenditure by the number
of days affected. Quantitatively, this was done as follows:
∑=
Δ⎥⎥⎦
⎤
⎢⎢⎣
⎡∗=
n
iaffect
i
iINCLU ddE
1
ϑ (7)
Whereas E∆INCLU denotes expenditure affected by the all-inclusive presence at the destination and:
δ iiaffect dd −= (8)
[ ] ∑∑==
=−=n
iaffect
n
iiiaffect ddD
11δ (9)
Where Daffect is the total number of days explained by the presence of all-inclusive holiday
experience at a destination, daffect =Days of tourist i that are influenced by the availability of all-
inclusive products at the destination.; while δi stands for the length of stay of tourist i if there
were no all-inclusive products at the destination. Note that a tourist, who could still have visited
the destination even in the absence of all-inclusive product, has three possibilities:
δ iid < (10)
δ iid = (11)
d ii ≤≤δ0 (12)
Equations 10 to 12 correspond to the responses that, a tourist could have stayed for respectively
more days, the same or less days with relative to the length of stay in the current trip; all in the
absence of all-inclusive holiday experience at the destination. The value of δi =0, if a tourist could
not have come.
3.4 25BMethods of Collecting and Estimating Tourism Expenditure
Since we are now aware of the main variables of interest: total, average, and daily tourist
expenditure, both in the country of origin and at destination, the next step is consideration of the
methods of capturing and estimating such variables. Smith (1995) prefers to categorize the
methods into three: observation, administrative record keeping and surveys. Other methods of
obtaining the estimates of visitor’s expenditure include the use of existing data, direct

25
observation, house hold surveys, visitor’s surveys and tourism establishment surveys (Davidson-
Peterson Associates, 2006; Frechtling, 2006; WTO, 2005c; Dattilo, et. al, 2004; Lian and
Denstadli, 2003; Pou and Alegre, 2002; Madre and Maffre, 2001; WTO, 2000; Rylander et.al,
1995; Smith, 1995; Burd, 1991; Church, 1969).
3.4.1 51BExisting Data
As the name suggests, this method involves the use of already collected data (WTO, 2000). These
data are often available at the city, region, state level and so forth. Pou and Alegre (2002) for
example, used the data from state level, the Spanish Family Expenditure Survey (SFES) for the
period 1985-1996 to analyse the household demand for tourism services. Smith (1995) gives the
main advantage of such method, as to provide a researcher with more time to focus on analysis
because less or no time need be spent on data collection, coding, inputting and editing. And
according to WTO and Frechtling (2006), it is important to check whether the required data are
available, before undertaking any new collection of visitor expenditure data. However, of its main
weaknesses, according to Smith is that, researcher becomes constrained by the contents of the
original survey and any peculiarities of the original sample.
Existing data from the financial institutions can also be the main sources of tourist expenditure
data. Sheldon (1993) for instance, found that bank records of foreign exchange transactions are
most commonly used methods of tourist expenditure data collection. Countries measure foreign
expenditures within their borders through accounting for foreign-exchange purchases by these
visitors. The central banks compute the amount of national currency sold to visitors each period
through reports from agencies making such currency sales. The validity of this method depends
on the system’s ability to (i) distinguish foreign transactions generated by international visitors
from all other transactions (relevance principle), (ii)include all transactions undertaken by
international visitors (coverage principle); (iii) Ensure that the transactions are recorded,
identified, and transmitted accurately to the central bank (accuracy principle) (WTO 2000).
However, this method has been abandoned in Europe since 2001 when European nations took
part in the European Monetary Union (EMU) and introduced a common currency policy of
Euro.
3.4.2 52BDirect Observation
Observation refers to the structured collection of information through systematic observation
and measurement of empirical phenomena (Smith, 1995). For example, Bowen (2002) served as a
26
single-participant observer on a soft adventure inclusive tour to record and analyzes satisfaction
with the experience among fellow travellers. Also Davis and Morais (2004) used participant
observation to map tourist flows around the destination. Frechtling (2006) has also proposed
actual observation on the visitors’ purchases, where an analyser can observe visitors’ purchasing
food, gasoline, lodging, and other items by following him around and recording purchases.
However, Frechtling (2006) gives a caution that, observation may change visitor patterns of
expenditure.
3.4.3 53BHousehold Surveys
House hold surveys method involve interviewing family units about the expenditure they have
incurred in different expenditure categories (Dattilo, et. al, 2004; WTO, 2005c; Davidson-
Peterson Associates, 2006). Examples include the Spanish Family Expenditure Survey (Encuesta
Continua de Presupuestos Familiares), which is quarterly household survey, that monitors
households consumption on tourism activities in the country. For methodological intention, this
survey replaces 12.5% of the households in every quarter (Pou and Alegre, 2002: 7). Tourism
expenditure is captured during continually household surveys on consumption expenditures,
personal income, or consumer preferences. To capture tourism expenditure includes asking
respondents to distinguish local purchases from those made on qualified trips out of the usual
environment (WTO, 2005c; Vanhove, 2005; Kim, et. al., 1998). However, this method has
received strong criticism concerning its recall bias, or memory effects due to the lapse of time
between trip and surveys (Lian and Denstadli, 2003; Madre and Maffre, 2001; Rylander et.al,
1995; Burd, 1991).
3.4.4 54BTourism Establishment Surveys
The tourism expenditures go direct to hotels, transport, restaurants and sports or entertainment
facilities. These are the appropriate respondents for data on tourist expenditure (Davidson-
Peterson Associates, 2006). However, it is difficult for them to distinguish receipts from visitors
and residents (Mules 1999; Fleming and Toepper, 1990). According to Sheldon (1990), this
method is complicated because establishment receipts may include local spending; also analysers
may overlook establishments where visitors spend money; and infact, cannot provide any depth
on the number of visitors, length of stay, or origin. In addition, due to fear of competition,
respective managers may be reluctant to share data on their business operations (Carlsen, 1995;
Vaughan, et. al, 2000).
27
Establishment survey is also useful when estimating the extent local linkages: which sectors
within the local area purchase goods and services from each others (Vaughan, et. al, 2000). If the
local restaurant purchases food from wholesalers locally, more of the tourist expenditure will
accrue as local revenue. For sectors important to tourist trade, it can be useful to estimate the
percent of each purchase that is produced locally. Therefore, interviews with knowledgeable
people in each sector can provide this information.
3.4.5 55BVisitor Surveys
Most studies on tourism expenditure commend visitor surveys. Lovejoy (2003:7) for example,
points out that, the best way to measure the impact of visitor spending is to use surveys to
determine the amount and type of goods that travellers tend to purchase, and then to estimate
the portion of output visitors support in key industries. Also according to Frechtling (2006)
visitor surveys provide an accurate basis for subsequent economic impact analysis as well as
comparisons to other industries. Visitors’ survey involves interviewing a visitor about his or her
trip expenditure.
There are five options of when to conduct visitor surveys: during visitors’ entry (entry-surveys);
while in the area under study (on-site-surveys); during exit (exit-surveys) (Chhabra, et al., 2003;
Daniels, et al., 2004; Crompton, et. al, 2001); en-route-surveys, which conducted while passengers
are travelling on an airplane, train, bus, or ship to or from the destination (Armoogum and
Madre, 2003; Office of Travel and Tourism Industries, 2004), and after visitors return home
(post-trip-surveys) (Daniels, et al., 2004). Studies show that entry-surveys, on-site-surveys and en-
route-surveys of arriving passengers are the least preferable because; the information on actual
expenditure can not be captured. The post-trip survey neither, due to the difficulty of recalling
rate or non-response bias and impossibility of getting in-contact with the foreign tourists.
However, Lovejoy (2003), Tasci et. al. (2003), Vaughan, et al. (2000), Frechtling (1994a) and
Haynes (1975) recommend exit-survey method as it provides the most accurate and actual visitor-
expenditure information.
Visitor surveys have been used for many purposes. For instance, the Spanish Institute of Tourism
Studies (IET) every year conducts entry- and exit- surveys national wide on all tourism related
statistics, including expenditure (Instituto de Estudios Turísticos, 2004; Illes Balears-Dades
Informatives, 2005). Likewise, in collaboration with the University of Balearic Islands, the
government of Balearic has used exit-surveys at the airports in 2003 in order to estimate the

28
tourism expenditure from British and German tourists who have stayed in hotels or apartment-
hotels and whose length of stay was at least four days (Alegre and Juaneda, 2006). Finally, Stynes
(1997) elaborates on the specific technical aspects of measuring tourism expenditure: reliable
visitation data, an accurately defined study region, clearly defined spending categories, a definitive
unit of analysis (e.g., visitor party per day), and a separation of residents from non-residents.
3.5 26BSummary of the Chapter
All-inclusives modal has a lot of implications, but the main rests on the distribution of the
tourism expenditure between the main three stakeholders: home economy, host economy and the
tourist. Tourism expenditure is the total consumption expenditure made by a visitor or on behalf
of a visitor for and during her trip and stay at the destination. All-inclusive expenditure is total
expenses of all individuals in travel party that may be incurred during the trip from transportation
(return ticket), accommodation, meals, entertainment, shopping (including souvenir), ground
transport, communication (telephone calls, internet, etc), vehicle and equipment rentals and total
expenditures.
Tourism expenditure can be categorized into pre-, on-, and post- trip expenditure. Pre-trip
expenditure covers the preparation and undertaking of the trip. On-trip expenditure includes
expenses incurred when travelling and at the destination. Post-trip expenditure includes other
travel-related expenses incurred in the country of origin after returning from the trip. However,
tourism expenditure does not include cash or donations made to private persons or institutions
which do not represent payment for tourism products, also does not include purchases for
commercial purposes, capital-type investments or transactions, even if they may in the future be
used for tourism purposes. If it happens that the capital good, like a car, is purchased during the
trip specifically for use on the trip and is sold during the trip, it is the net cost, i.e. purchase cost
plus the running cost minus sales price that should be included in the tourism expenditure.
To estimate the actual expenditure from all-inclusive segment, main four variables should be
considered: (i) Total expenditure (in the country of origin and on destination), (ii) Average
expenditure per tourist at the destination, (iii) Average daily expenditure per tourist at the
destination. (iv) The total expenditure influenced by the availability of AI product per se.
Methods of capturing the estimates of visitor’s expenditure include: existing data, house hold
surveys, central bank data, direct observation, visitors surveys and tourism establishment surveys.

29
4BCHAPTER FOUR 5BALL-INCLUSIVE MOTIVATION
4.1. 27BTourist Motivation
What motivate a person to choose one travel style against many alternatives has received a scant
attention in literature. However, it is worthwhile to mention that there are numerous literatures
about tourism motivation in general, and various are useful in this chapter. Previous studies on
tourist motivation include Maslow (1970), Wahab (1975), Dann (1977), Crompton (1979), Pearce.
& Caltabiano (1983), Moscardo and Pearce (1986), Pearce (1991, 1993), Mansfeld (1992),
Fodness (1994), Cha, et.al (1995), Galloway (1998), Gnoth (1997), Pearce, et. al (1998), Bieger
and Laesser (2002), Sirakaya et. al (2003).
Tourist motivation according to Pearce et al., (1998) is the global integrating network of
biological and cultural forces which gives value and direction to travel choices, behavior and
experience. Gnoth (1997) describes it as the driving force that is cognitive in nature; observable
and objectively measurable; that indicates object-specific preference. Also, Crompton (1979),
Pearce (1991, 1993), Cha et.al (1995), Sirakaya et al. (2003) and Pearce and Lee (2005) describe
motivation as the driving force behind all actions, and a starting point for understanding tourist
behavior and traveling decisions. Wahab (1975) emphasized the importance of the whole area of
tourist motivation and its role in tourism development. Later it was argued by Mansfeld (1992)
that travel choice and tourist behavior could be understood better if travel motivation theory and
measurement are improved. Also Fodness (1994) endorsed that, effective marketing would be
impossible without an understanding of consumers’ motivation.
Crompton and McKay (1997) justify the reasons for understanding motivation: One, knowledge
of tourist motivations would pave the way for creating better products and services; two,
satisfaction with tourism with experiences is intrinsically related to initial motives of tourists, and
three, motives must be identified and prioritized first, before one can understand tourist decision-
making processes. Gnoth (1997) indicates that knowledge of the tourist motivation can be used
by managers and planners to determine trends and usage level of particular resources at the
destination. Accordingly, to supplement the motivation area, this section reviews theories of
tourist motivation and focuses more on motivation for choosing all-inclusive mode.
30
4.2. 28BTheories of Tourist Motivation
There are scores of motivation theories in tourism literature, but the frequent cited ones include
the “push & pull factors” compendium theory (Tolman, 1959; Dann, 1977; Crompton, 1979; Mill
& Morrison 1985; Cha, et.al, 1995;Gnoth, 1997; Alegre & Juaneda, 2006); wanderlust and sunlust
motives (Mansfeld, 1992; Corcoran, et. al., 1996); hierarchy-of-needs theory (Maslow, 1954,
1970); travel career ladder (Moscardo & Pearce, 1986; Pearce, 1990; 1993; Peace et.al, 1998);
dichotomies (Mayo and Jarvis, 1981; Hyde and Lawson, 2003); trichotomy-of-needs theory
(McClelland, 1965). However, some have been considered more relevant to clearly explain our
subject matter.
We begin with the 1970s Gray’s theory of wanderlust and sunlust (Mansfeld, 1992; Corcoran,
et.al., 1996) which tells why people travel. Wanderlust represents the desire to move from
‘known’ to an ‘unknown’ place, while the sunlust is the desire to get specific facilities that do not
exist in the tourist’s home place (ibid.). Corcoran et. al (1996) identified the ‘sunlust’ with the
package tourism to sun and sand destinations when they were analyzing the summer outbound
package tourists from Dublin. Sunlust motive helps us understand why many sun and sands
destinations are flooded during summers: tourists flow to enjoy the climate and activities which
are missing at their homes. However, Gray’s theory only partially helps us understand why people
travel to certain destinations, but it does not tell us why they choose certain styles of traveling,
like all-inclusives.
The reason why people travel has also been linked to the ‘Push & Pull factors’ dimensions
(Tolman, 1959; Dann, 1977; Crompton, 1979; Mill & Morrison 1985; Cha, et.al, 1995; and
Gnoth, 1997; Alegre & Juaneda, 2006). The push and pull theory argues that people travel
because they are pushed by their own internal forces and pulled by external forces of the
destination attributes (ibid). Push factors include individual’s attitudes, interests, opinions,
knowledge, and needs for a holiday; while pull factors include destination attributes like climate,
facilities, benefit expectations, and images promoted by the destination (Crompton, 1979; Gnoth,
1997). The push and pull factors are modified by social economic, trip attributes and
demographic factors of an individual such as age, gender, income and family life cycle stage
(Uysal & Hagan, 1993). This theory, however, focuses only on the intrinsic motivation to travel,
and the characteristics of the destinations to satisfy a need. It does not focus entirely on the
motivation of tourists to choose a certain travel style; therefore can not be considered in
understanding the motivation for all-inclusive tourists.

31
The travel career ladder (TCL: Moscardo and Pearce, 1986; Pearce, 1990; 1993; Peace et.al, 1998),
takes us a step further. TCL, which was borrowed from Maslow’s (1970) needs hierarchy theory
of motivation, emphasizes that people have a range of motives for seeking out holiday
experiences and that the tourist motivation comprises of five levels of needs: relaxation, safety,
relationship, self esteem and development and self actualization/fulfillment needs (Pearce and
Lee, 2005). Taking one of the levels, like the ‘need for safety’, for instance, and consider reasons
for tourists choosing the all-inclusives include “personal safety” (Anderson and Langmeyer, 1982;
Schuchat, 1983; Quiroga, 1990; Wickens, 2000), then we can consider TCL as one of useful
theories in understanding motivation for all-inclusive tours.
A tourist’s choice of travel styles has also been explained using dichotomous perspective. In
dichotomous, an individual choice might be a result of the balancing between two opposing
motivational forces. Mayo and Jarvis (1981) describe the two forces as traveler’s need for
complexity and need for consistency or according to them, “a desire for novelty and a desire for
routine” (ibid). The two desires have also been explained in Cohen (1972), Poon (1998) and
Keng and Cheng (1999). Cohen (1972) and Keng and Cheng (1999) give four alternative tourist
roles, based on the desire for novelty or familiarity: organized mass tourists, individual mass
tourist, explorer and drifter. The organized mass tourists purchase a package tour, to minimize
exposure to the unfamiliar. The individual mass tourist takes short sightseeing trips to provide a
blend of familiarity and novelty. The explorer travels on self-guided tour and tries to get off the
beaten path while maintaining comfortable accommodation and reliable transportation. The
drifter forgoes tourist establishments and seeks to envelop himself in the host’s culture.
Lastly, using the ‘old and new tourist’ perspective, Poon (in Corcoran et al., 1996) explains the old
tourists as the searchers for the sun, are cautious, and follow the masses; it does not matter where
they travel because the vacation is treated as an escape from the stress of urban life. In contrast,
new tourists are more unstructured, adventurous, with a lower level of vacation planning and a
desire to do what comes on the spur of the moment. The old tourist perspective has been
associated with package tourist as the desire for this segment has always being the sun and sand,
regardless of destinations they visit.
32
4.3. 29BChoice Models
The choice of the travel mode has been associated with many factors, including, consumer
characteristics (age, gender, education, and occupation of the traveler, etc); traveling
characteristics (length of stay, size of travel party, and previous travel experience, etc) and modal
characteristics (Sheldon and Mak, 1987; Morrison et. al, 1993; Hsieh et.al, 1994, Ryan, 1995;
Enoch, 1996). However Ryan (1995) gives an interesting hint that, for many people, package
holiday is a ‘habitual action’ and such; people rarely consider the reasons behind the preference.
We make two assumptions. First, a visitor party decides to visit a particular destination if, and
only if, the all-inclusive package tours are available. Second, a visitor has decided to visit a
particular destination; so the remaining decision is the model of travel; whether through all-
inclusive or independent tour. Then, we borrow from Sheldon and Mak (987:13) the model
which explains the factors affecting the vacation mode choice, which can be expressed as:
Pij= fi(Xi, Tj, Mj) (13)
Whereby, visitor i will choose to travel on a certain vacation mode j with some probability Pij.
Probability, Pij is determined by certain visitor attributes, traveling attributes and modal attributes.
Xi denotes a vector of visitor attributes for visitor i; Tj is a vector of traveling attributes; while Mj
denotes a vector of modal attributes for mode j.
4.3.1 56BVisitor Attributes
All-inclusives holidays may be more attractive to certain types of consumer than to others.
Focusing on age factor for instance, Horneman et al. (2002) mention that senior travelers place a
higher preference on a ‘reliable package’ than the general traveling population, because “above
all, they want security, safety, and confidence that they will be satisfied with the tourist
experience”. According to Quiroga (1990), tourists older than 45 are most likely to choose a
package holiday and Anderson and Langmeyer (1982) show that, people over 50 are the most
likely to buy package tours because they need security. Foster (1986) and Quiroga (1990) show
that mature travelers prefer package tours to relieve themselves of the worry of planning the
details of a trip, making arrangements, and coping with emergencies. This had also been said by
Sheldon and Mak (1987), that mature travelers prefer package tours to avoid physical
requirements of independent travel mode (e.g. baggage handling).
Another group which has shown special interests on package tours is single ladies. According to
Sheldon and Mak (1987) single women prefer to travel on a package tour for safety and security

33
reasons. Also Enoch (1996) states that many of the participants on package tours are first-time
travellers, and people who, because of lack of foreign language skills (inbound-foreign-visitors),
are hesitant to travel on their own. Enoch adds that social class and or status are factors
influencing the choice of package tours. The package tours appeal to upper middle-class people
who are too busy to spend time on arranging a trip themselves. Likewise, for the wealthy
travellers, Schuchat (1983) argues that, it is because of their lack of time; although Sheldon and
Mak (1987) argue that wealthy people demand luxurious services that are missing in package
tours, so they are more likely to avoid all-inclusives. Thus, the visitor attributes affecting vacation
choice can be expressed as:
Ci = fi (NATIONALITY, AGE, GENDER, INCOME) (14)
Where NATIONALITY: the nationality of an individual; AGE = age of the visitor; GENDER
=sex of a visitor; INCOME = the wealthy of a visitor.
4.3.2 57BThe traveling attributes
Sheldon and Mak (1987) suggest three traveling attributes that may affect the choice of the
vacation mode as, length of stay, the number of destinations visited on the trip, and whether the
trip is to a foreign destination. They then found that, first-time visitors to a destination generally
have higher information needs than repeat visitors; therefore the former prefer package tours.
Also according to the authors, visitors with less time to arrange a trip, also with limited length of
stay at a destination may prefer package tours than otherwise. Also Wickens (2002) found a first-
time tourists were keen to package tour holidays. Package tours are priced per person basis; as
such each person pays the same price, regardless of age (Sheldon and Mak, 1987). With
independent tour, often hotels may permit children to stay free with adults, which is sometimes
not with package tours. The authors (ibid: 14) claim that sometimes the package tour are less
attractive to larger party sizes and especially to parties traveling with children.
Moreover, although not frequently cited in the literature, accommodation has been an important
factor to explaining the travel style to be used. For example, a tourist who plans to stay in the
family, friend or second homes, is more likely to choose ‘only transport’. Likewise, the one who
plans to stay in the apartments may choose ‘self catering’ boarding basis. But the guest who
wishes to stay in hotels or resorts, is more likely to prefer ‘transport and bed’, ‘bed and breakfast’,
‘half board’, ‘full board’ or ‘all-inclusive’ The model that presents the travel attributes can be
expressed as follows:

34
Tj = tj (PARTYSIZE, REPEAT, DAYS, ACCOM) (15)
Where PARTYSIZE denotes the number of people in a travel party; REPEAT denotes the
previous visits to the same destination; DAYS denote the length of stay during the current visit;
ACCOM stands for the type of accommodation stayed during the vacation.
4.3.3 58BModal attributes
Using results from the Touche Ross survey (1975), Sheldon and Mak (1987) conclude that
package tours are bought due to convenience (26%), cheaper price (22%), and unfamiliarity with
destination (13%) and see more, do more (12%). Also TII (2000a) gives reasons cited by the UK
market for all-inclusives, including, value for money (57%), knowing how much they are going to
spend in advance (42%), good for families (39%), and the wide range of facilities and
entertainments offered in all-inclusives (37%). Regarding uncertainties and the risks that may
arise during the holidays, Enoch (1996) argues that package tour is a rational and an effective way
of traveling to countries with strange cultures, unreliable transportation, and doubtful standards
of hygiene. Also according to Schuchat (1983), Quiroga (1990) and Wong and Kwong (2004), a
tourist choose package tours because of not having to worry about things. Buhalis (2000), Rojek
(1993) and Wickens (1997, 2002) hold that because many holidays are characterized by minor
negative side-effects such as health problems, package holiday offers guidance to visitors; and
makes a tourist feel safe if anything goes wrong. In concluding, Wickens (2002) states that, with
package tour, everything during the trip happen within the margins of safety while enjoying the
‘strangeness’ of the travel experience.
Concerning the relationships and interactions, Quiroga (1990) and Wong and Kwong (2004) state
that package tourists take advantages of the ease of getting to know each other. Because children
get the inbuilt-facilities to play with, in the absence of close supervision from their parents, this
gives parents more chance for socialization and building relationships. Likewise, Schmidt (1979)
argues that tourists may find social support from the group, which provides “opportunities for
sharing experiences in confronting the unfamiliar in a collective way”. Crompton (1979) and
Quiroga (1990) admit that, package tour acts as an effective substitute for the group of family or
friends on holiday, so as to avoid conflicts within the family or problems of compatibility.
Economies of monetary and time resources also been mentioned as contributing factors.
According to Wong and Kwong (2004) with package tours, visitors get more for their lesser

35
money. Ryan (1995) and Buhalis (2000) mention that AI tours facilitate the information seeking
and reservation processes for the tourists hence little planning is needed. Sheldon and Mak (1987)
said that many travelers perceive package tour to be cheaper than independent travel. According
to the authors, 56% of the respondents involved in the Touché Ross survey believe that package
tours were cheaper than similar travel arrangements booked separately, while 11% perceived
them to be more expensive (ibid:14). Enoch (1996) argues the same, that a package tour is usually
cheaper than an independent trip to the same places. The modal attributes can be expressed as
follows:
Mj =mj(SAVETIME, NONEED-ARRANGE, RELAXATION, MONEY, BUDGET, CHILDCARE,
QUALITYOFMEAL, SAFETY, LANGUAGE, CONTACTS, CULTURE, TRANSPORT, HYGIENE, MORESPORTS, SCHEDULE, SPORTRANGE, MY FAMILY, CHEAPER) (16)
Where SAVETIME denotes Saving time for organizing the tour; NONEED-ARRANGE is no
need to arrange trip; RELAXATION denotes get more time for relaxation; MONEY denotes
high value for money; BUDGET denotes avoid running out of budget at the destination;
CHILDCARE is the child care services; QUALITYOFMEAL is the quality of meal; SAFETY is
to feel safe; LANGUAGE is no worrying about the language differences; CONTACTS is
establish social contacts; CULTURE is no fear of strange cultures; TRANSPORT is reliability
of transportation at the destination; HYGIENE is No doubting about the standards of hygiene;
MORESPORTS is do more sports within a limited amount of time; SCHEDULE is enjoy the
flexibility of the schedule of the hotels; SPORTRANGE is wide range of sports and
entertainments; MY FAMILY is more appropriate for family; and CHEAPER denotes get more
services for lesser money.
4.4. 30BSummary of the Chapter
Tourist motivation refers to the global integrating network of biological and cultural forces which
gives value and direction to travel choices, behavior and experience. Theories have explained
why traveling and why with a certain travel style, including the push & pull factors compendium
theory, the expectancy theory, the hierarchy-of-needs theory, the travel career ladder the
dichotomies and trichotomy-of-needs theory. These theories are modified by visitor attributes,
traveling characteristics and modal attributes to explain the motive for the choice of specific style
of travel.
Visitor attributes include age, status, nationality, and gender; traveling attributes include length of
stay, party size, and number of previous visits; while modal attributes include saving of resources

36
in terms of money and time, social interaction, sport and entertainments range and family
preference. An all-inclusive tourist wants to get most out of the journey and get most for their
money, while not having to worry about things and with little planning in advance. We also saw
that, important function of the package tour is to make sure that the tourists stay enjoyable, free
from any (social) problems, or any unpleasant experiences. Finally the interesting precaution we
have come across is that, tourists do not always have to know why they choose a certain mode of
tour or holiday.
37
6BCHAPTER FIVE 7BALL-INCLUSIVES LINKAGES
5.1 31BIntroduction
Generally, hotels prefer AI deals because above all, packagers, who are usually based in the
tourist-generating countries, make all the necessary negotiations and financial arrangements with
the guests on their behalf. Since everything has been prepaid for, hotels are relieved from keeping
track of the tourist movements and bills; which minimizes expenditure on capital equipment like
computer as well as human and time resources. And most of the hotel requirements are
procured in advance with more assurance since hotels know in advance the exact number of their
guests, and the lengths of their stays. The fact that prepayments have been done at the origin and
the guests are kept in enclaves at the destination, then the study intends to find out who is
collaborating with the enclaves at the destination. The rest of the chapter is organised as follows.
The chapter begins with the literature review about the subject of local linkages. Next with
reference to the Balearics, it presents the AI supply at the destination; the products that the AI
hotels purchase; the actors involved in the linkages between AI sector as the demander and the
rest of actors as suppliers; and finally the chapter presents the nature of the contracts involved
between AI hoteliers and their suppliers.
5.2 32BThe Concept of Local Linkage
The concept of linkages was first introduced in the 1950s by Hirschman as the activities-induced-
activities; meaning that, the ongoing activities induce agents to take up new activities (Drejer,
2002; 2003). According to Drejer (2003), its inception aimed to identify the key sectors that are
central for economic development through demand-supply maximal effects. The maximal effects
were measured in terms of the extent of supply-demand interrelationships between the key sector
and the rest of the economy. Linkages have been categorized into backward linkage and forward
linkage (Zuo, 2006). The former are demand oriented, while forward linkages are associated with
output utilization. In tourism settings, according to Cai et al. (undated), forward linkages measure
the relative importance of the tourism sector as supplier to other industries in the economy,
whereas backward linkages measure its relative importance as demander from other industries.
In economic terms, mechanism through which economic activities involve the locals without the
meddling of foreign transactions is known as the local linkages. Tourism industry does backward
linkages with the local economy as means to get their operational input including manpower,
materials and information (Culpan 1987; Poon, 1993; Pattullo, 1996; Goodwin and Bah, 2003;

38
Mitchell and Page, 2005). Pattullo (1996) describes local linkages econometrically as the
proportion of domestic food to imported food utilized by the tourism industry. Also Overseas
Development Institute (ODI, 2006) defines local linkages as the mechanisms through which, well
established businesses build economic links with micro-entrepreneurs, small enterprise, and
residents in their local economy.
Linkages in tourism are effective mechanisms through which economic development can be
achieved through local participation (Lundgren, 1975; Belisle, 1984; Culpan, 1987; Bowen et al,
1991; Dieke, 1993; Poon, 1993; Goodwin and Bah, 2003; Meyer, 2006). Expansion of local
linkages connotes the increase of usage of other economic sectors in the destination which
stimulates the economy as a whole and creates synergy effects between different sectors of the
economy (Meyer, 2006). Main three areas of local linkages have been identified as procurement
from local suppliers; employment of human resources from local labor market; and partnerships
(ODI, 2005, 2006; PPT, 2006 a, b). Figure 4 depicts an example of local linkage in a tourism
destination. Hotel sector may link with local economy through recruitment and training of locals;
supporting the development of local arts, crafts, cultural products and tourism services; also
working with tourism businesses and encouraging tourists to spend in the local economy.
However, the usage of linkages has failed in many destinations due to various factors, others
beyond the capacity of locals.
Most of the tourism providers usually prefer to source their input wherever they can take
advantage of already-known suppliers, take advantage of bulk purchasing discounts, reliability of
supply, the quantity and quality of supplies or to cater for tourists’ tastes (Belisle, 1984; Bowen et
al, 1991; Dieke, 1993; Goodwin and Bah, 2003; Meyer, 2006). Torres (2002, 2004) and Momsen
(1986) have shown that, massive importation of meat by Caribbean resorts is done to cater for
the demand of tourists who prefer the grain-fed flavour of US beef. In generic terms, the final
product from the AI resorts is made up of many suppliers as exemplified in Table IV. Should all
the requirements sourced locally (if at all available), the economic benefits of AIs to local
economy could have been immense. Due to natural characteristics of services of intangibility and
inseparability, the human resource has often been the most important linkage between tourisiers
and the local economy. The linkage to local economy is induced through the payment of salaries
and wages.
Table IV Main Requirements in All-Inclusive Establishment

39
Requirements Supplies
Overall requirements & utilities
Service of Gas, Electricity, Water, Garbage disposal, Sewerage treatment; Government Tax; human resources; Expatriates/ Consultancies; R&D; Promotion; Health Experts; Construction, Transport, Fuel, Telecommunication, Laundry, etc
Restaurant & Bar Food supplies, fruits, vegetables, beverages, etc
Sports facilities Children facilities, old people facilities, disable, etc
Guest amenities Recycled paper, Handmade soaps, etc
Soft Furnishing Table mats, Arts, Crafts, Candles, etc
Accommodation Furniture, Mattresses, Bed linens, etc
Operational supplies Uniforms, etc
Outsourcing Laundries, Floristry, Entertainments, Retail, etc
According to Palmer (1979), tourism is a labor intensive activity which leads to greater
employment; thus stimulating economic development. Employment opportunities created by the
tourism industry can be direct, indirect or induced (Mamoozadeh and McKEE, 1990; Archer,
1977). Those employed direct in the tourism business, like hotel proprietors, and employees form
the direct employment group. Employees from industries that are supplying inputs to hotels, like
fishing, agricultural and construction create another group, indirect employment. Finally, as the
households spend their salaries, they induce more employment in other sectors (ibid.). However,
the amount of employment generated at the local economies depends on the strength of local
linkages. As labour intensive in nature, hotel industry, for instance, requires a large number of
employees. And when thinking of AI resorts with massive facilities and activities; they even
require more people than the rest (Abdool & Carey, 2004) in the areas of rooms, sport activities,
restaurants and bar, etc.
5.3 33BEmpirical studies on Linkages in Tourism
Most recent empirical studies about the local linkages in tourism include Meyer’s (2006)
background paper to stimulating pro-poor linkages between the tourism industry and local
people in the Caribbean destinations. Her paper focused on the potentials of linkages to the local
economy while looking more on the tourism-agricultural linkages. She found that there were
negative trends in the local linkages due to the growing presence of all inclusive packages and
increasing competition. Similarly, Ashley (2006) explores the participation of locals in the Luang
Prabang economy by assessing four sub-chains of the tourism value chain: accommodation, food
and drink, handicrafts, and excursions. The findings show that, the food and drink sub-chain

40
were the main sources of earnings for the locals, followed by hand crafts. She finally identified
linkages that involve handcrafts, agricultural and fisheries.
When analysing on the linkages and leakages on local supply and imports, Mitchell (2006)
suggests the ways in which governments and tourisiers at the destination can support initiatives
to reduce leakages. Leakage is the process whereby part of the foreign exchange earnings from
tourism, rather than being retained by tourist-receiving countries, is either retained by tourist-
generating countries or repatriated to them in the form of profits, income and royalty
remittances, repayment of foreign loans, and imports of equipment, materials, capital and
consumer goods to cater for the needs of international tourist and overseas promotional
expenditures (Benavides, 2001). Mitchell and Page (2005) and Meyer (2006) define then as the
part of the price of the holiday paid by the tourists that leaves a destination or never reaches the
destination due to the involvement of foreign based transactions.
Leakages in tourism have been categorized into three: internal (import-coefficient leakages),
external (pre-leakages), and invisible (foreign exchange costs associated with resource damage or
deterioration) (Benavides, 2001; Kaosa-ard, 2005; Meyer, 2006). Internal leakages occur when
Tour operators Ground handlers The channel
The Business Operation Local Linkages
Tourist shopping & Eating € $
Excursions and activities
Local restaurants, bars, crafts, retail outlets
Local cultural and heritage products, tourism SMEs
Local partnerships + operational agreements
- Equity partner - Residents - SMEs
Local entrepreneurs Supply of goods & services
Training, recruitment and promotion of local staffStaff
Supply Chain
Accommodation
Tourists
(Source: Overseas Development Institute (ODI, 2006), ODI Briefing Paper, pp. 2)
Fig. 4 Local Linkages in Tourism Industry
41
tourists pay locally, but that payment or a part of it is used to import some of the inputs used in
tourism industry. This occurs where the local economies are weakest owing to sparse factor
endowment or inadequate quality of goods and services (Benavides, 2001). In the islands for
instance, internal leakages are significantly high, due to narrow resource base for producing
required goods and services (Spinrad, 1982; Meyer, 2006) needed in tourism industry. Kaosa-ard
(2005) argues that, financial leakage is likely to be high in countries where there is little
manufacturing and service capacity.
External leakages are the total value added captured in tourist generating countries due to the
involvement of intermediaries. That is the difference between amounts paid for in tourist
generating countries and received in host countries (Meyer, 2006; Benavides, 2001). External
leakages are considerable high in the AIs; where packagers (usually) based in the origin countries
buy several services, assemble and resell them to visitors as a package (Holloway, 1998).
Sometimes the cash that reaches the destination is just enough to cover the local expenses
incurred by the host resorts only (Hemmati and Koehler, 2000; Wong and Lau, 2001; Abdool
and Carey, 2004) while the rest of tourism spending leaks away. Invisible leakages conversely,
involve the real losses or opportunity costs related to resource damage or deterioration, like, tax
avoidance, informal currency exchange transactions, and off-shore savings and investment
(Meyer, 2006).
Karammel and Lengefeld (2005) report the German Technical Cooperation (GTZ)’s study on
socio-economic impact of inclusive resorts and large hotels in Jamaica, Nicaragua and the
Dominican. The study involved two resorts owned by Sandals; in which, first, local employment
was up to 99% of permanent employees. Second, about 50% of respondents were having high
job security job security and employees report that, working at Sandals enabled them to support
their immediate and members of their extended family; also were comfortable with the salary
scheme that includes health insurance, a pension scheme and life insurance. Sandals Small
Farmers' Programme Co-operatives buy at least 50% of fruit and vegetables produced locally.
Mbaiwa (2005) has analysed the socio-economic impacts of enclave tourism in the Okavango
Delta in Botswana. His findings have revealed that the foreign domination and ownership of
tourism facilities, which occupied more than half (53.7%) of the tourism facilities in the area, has
lead to the repatriation of tourism revenue, domination of management positions by expatriates
and lower salaries for citizen workers. He then concludes that enclave tourism has minimal
impact on local economy in the Okavango Delta due to weak linkages with the domestic

42
economy with high leakages. The same was found by Abdool and Carey (2004) when exploring
the economic impact of the AI hotel sector on the economy of Tobago. Their study reveals that,
of the cases studied, nine AI hotels which were accounting for 33% of the total room capacity
were directly supporting 9.1% of employment on the island. However, according to the authors,
significant proportions of the tourism expenditure do not reach or remain in the economy of
Tobago because it was pre-paid in the tourist generating countries and most AI resorts in Tobago
were owned by the outsiders.
However, not all the AI operations connote negative images; others have succeeded to have good
image to the community surrounding them. For example, Issa and Jayawardena (2003) explain
the way SuperClubs and Sandals, which are the leading AI hotel companies in the Caribbean
support indigenous businesses by buying food provisions from local farmers and markets and
hard goods from local manufacturers. In addition these hotel companies include in their tourist
schedules the tourist excursions, and visits to crafts markets and local shops and promote contact
between guests and inhabitants. In addition, local vendors and artists are invited to the properties
and given spaces on the hotel area beach to set up stalls and sell their wares. Likewise, Goodwin
and Bah (2003) show how linkages in Gambia, which involve hotels and local juice-sellers, beach
vendors, craft sellers, taxis, local authorities, and a local NGO have improved sales opportunities
and services for locals and tourists.
But still, according to UNEP (2002), about 80% of the general AI expenditures go to the airlines,
hotels and other international companies who often, their headquarters are based in the foreign
countries. Pattullo (1996) found that, at least 70 cents on every dollar in the foreign exchange
earned in Caribbean from AI has been converted to imports. Freitag (1994) studied the effects of
enclave tourism in a small coastal town near Puerto Plata. A 160-room international class hotel
was built by members of the national elite on land sold to it by a local elite family. Restaurants in
town bought their produce and fish locally, while hotel usually shopped in the cities of Puerto
Plata and Santiago. Some 116 local people were employed during peak season, all in low-status
positions. Wages were high by local standards, and many residents considered jobs there more
desirable. He concludes that most enclaves are operated by global capital and trans-national
organizations through a series of spatial networks that allow only limited economic benefits to
accrue to the local communities.
43
Oppermann (1993) found that formal sector in tourism operation entails high leakages in the
form of profit transfers, repatriation of funds to the foreigners in managerial positions, and large
imports of food and other items. Oppermann (1993) also found that, hotel operations entail high
leakages in the form of repatriation of funds to the foreigners in managerial positions.
Interestingly, Poon (1993) found that, the superior performance in the all-inclusive industry in
Caribbean was related to the quality and innovativeness of managerial personnel, rather than
ownership or foreign presence. She therefore recommends among other things, the use of local
human resources. Singh (1989) likewise has studied the leakages from hotel spending in Kullu-
Manali area of Himachal Pradesh. He concludes that input importation slices off the possible
gains from tourism. Lundgren (1975) found that hotel-generated importations in Caribbean
resorts were induced by the lack of ability of the local economy to meet the hotel demands. In
such situations, areas of local linkages were more limited and weak; hence high imports and
subsequently leakages.
5.4 34BAll-Inclusive Supply in the Balearic Islands
All-inclusive supply in this context refers to the all-inclusive facilities and or services available for
sale to the tourists. As have been said in the introduction chapter, usually AI package tours are
distributed by the packagers who are based in the tourist-generating countries; and therefore the
AI tourists start enjoying the AI product, via transport, before reaching the destinations. At the
destinations, all-inclusive supplier is mainly the accommodation sector, which in the Balearic
Islands consists of hotels, hotel apartments, apartments, holiday villages and hostels. The
definitions of these establishments in the context of Balearic Islands are given in the IB-Dades
Informatives (2005, 2006:70-71) as follows. Hotels are establishments providing tourist
accommodation and dining room services, with or without complementary services that, due to
configuration, does not have the appropriate installations for the preparation and the
consumption of foodstuffs within accommodation unit.
Hotel apartment, in addition to provide tourist accommodation and dining room services with or
without complementary services, offers, due to configuration and services, the appropriate
installations for the conservation, preparation and the consumption of foodstuffs within all or
some of the accommodation unit. Apartments provide bed without dining room services, and
that has, due to configuration and services, the appropriate installations for the conservation,
preparation and the consumption of foodstuffs within all or some of the accommodation unit.
Holiday villages are establishments whose location, installations and services allow clients, under
44
predetermined schemes, to enjoy their holidays in direct contact with nature, providing them, for
a fixed price, bed with full-board, with the possibility of practicing sport and participation in
group leisure activities. However, holidays villages built with a social aid orientation and on a
non-profit making basis by public corporation or bodies are not included in the given definition.
Hostels offer both bed and meals, conforming or not to full board at the choice of the client and
excluding hostel residencies.
Mallorca is the main destination for the AI holidays in the Balearics, and therefore the main part
of the Archipelago’s AI supply is hosted in Mallorca. For that reason, presented in the next step
are the facts about the all-inclusive supply in Mallorca, including their typology, categories, trends
and proportions in relation to the existing capacity. The analysis has been divided into two parts,
with the first part covering the overall AI establishments, while the second covers the exclusive
AI establishments. Exclusive AI establishments specialize in offering all-inclusive only; while in
the former, the establishments offer also other types of boards like half board or full boards in
addition to the all-inclusive package. Table V presents the Overall AI supply in Mallorca during
the three years 2004/06 consecutively.
Overall AI establishments in Mallorca in 2004, 2005 and 2006 were 153, 168 and 195
respectively. This means that the AI supply sector grows extensively at a growth rate of at least
64%, growing by 9.8% (2004-05), 16.07% (2005-06) and 27.5% (2004-06). Zonal wise, Llevant is
leading, hosting 26.8%, 30% and 27.1% of the total AI supply in the respective years. In this
zone the growth rates from 2004-05, 2005-06 and 2004-06 were respectively 22%, 8%, and
31.7%. Following Llevant (41 establishments) in 2004 were Calvia (30 establishments), Nord (22
establishments) and Badia Palma (21 establishments). Likewise following Llevant in 2005, were
Nord (28 establishments), Badia Palma (27) and Calvia (24); and in 2006, were Nord (38), Calvia-
Andratx (28), and Badia Palma (27).
Table VI summarizes the typology of AI supply in Mallorca. During the period 2004/2006
consecutively, hotel sector occupied more than half of the AI supply in Mallorca, representing
respectively 60.7%, 55.9% and 53.3% of the total. Following hotels, in quantity, were hotel
apartments then apartments, which together accounted for 36.0%, 40.5% and 42.5% in 2004 to
2006 consecutively respectively. Holiday villages and hostels represent minority, together
accounting for less than 5%, although the latter shows a sharp growth rate than the rest of
supply. Overall sector growth rates were 9.8% and 16.1% during 2004/05 and 2005/06

45
respectively. Of the general AI establishments, a total of 62,555 places, 72,556 places and 86,770
places were available during 2004, 2005 and 2006 respectively; the growth rate of 16.0% and
19.6% for the 2004/05 and 2005/06 periods respectively. Apartment places have shown the
highest growth rate of 78.1%, followed by hotel apartments (35.3%) within 2004/05 time period.
Likewise during 2005/06 the two types of accommodation were leading in terms of growth,
representing 26.2% and 26.5% respectively. However, most of places were found in the hotels
throughout the three years, accountable for more than half of all AI places found at the
destination. Following were hotel apartments then apartments. Holiday villages have remained
static throughout, both in number of establishment and places in the period 2005/06, where in
the prior period they were declining in quantity.
Table V Overall AI Establishments in Mallorca
AI ESTABLISHMENTS ZONE TOWN 2004 % 2005 % 2006
%
NORD
Alcúdia Platja Muro Can Picafort
15 2 5
14.4 17 5 6
16.7 21 7
10
19.5
BADIA DE PALMA
Arenal Platja de Palma Can Pastilla Cala Blava Cala Major Sant Agust Maioris
9 7 2 2 1 - -
13.7 13 11
- 2 1 - -
16.1 11 12
- 2 - 1 1
13.8
CALA d’Or Cala d’Or Cala Ferrera
13 1
9.2 9 -
5.4 15 1
8.2
LLEVANT Portocristo Cala Millor Sa Coma S'Illot Cala Bona Cala Mandia Calas de Mallorca Cala Estany Cala Domingos Costa dels Pins
1 16 7 2 2 2
10 1 2 -
26.8 1 22 4 4 1 3
10 1 - -
30.0 - 20 13 8 1 3 6 - 2 1
27.7
CAPDEPERA Cala Ratjada Cala Mesquida Canyamel Font de sa Cala
11 2 2 -
9.8 16 2 1 3
13.1 11 3 1 3
11.3
CALVIÀ-ANDRATX
Portals Nous Palmanova Magaluf Santa Ponsa Peguera Camp de Mar Cala Vinyes
1 7 3
10 8 - -
19.6 - 7 2 5 8 1 1
14.3 - 8 4 5 8 1 2
14.6
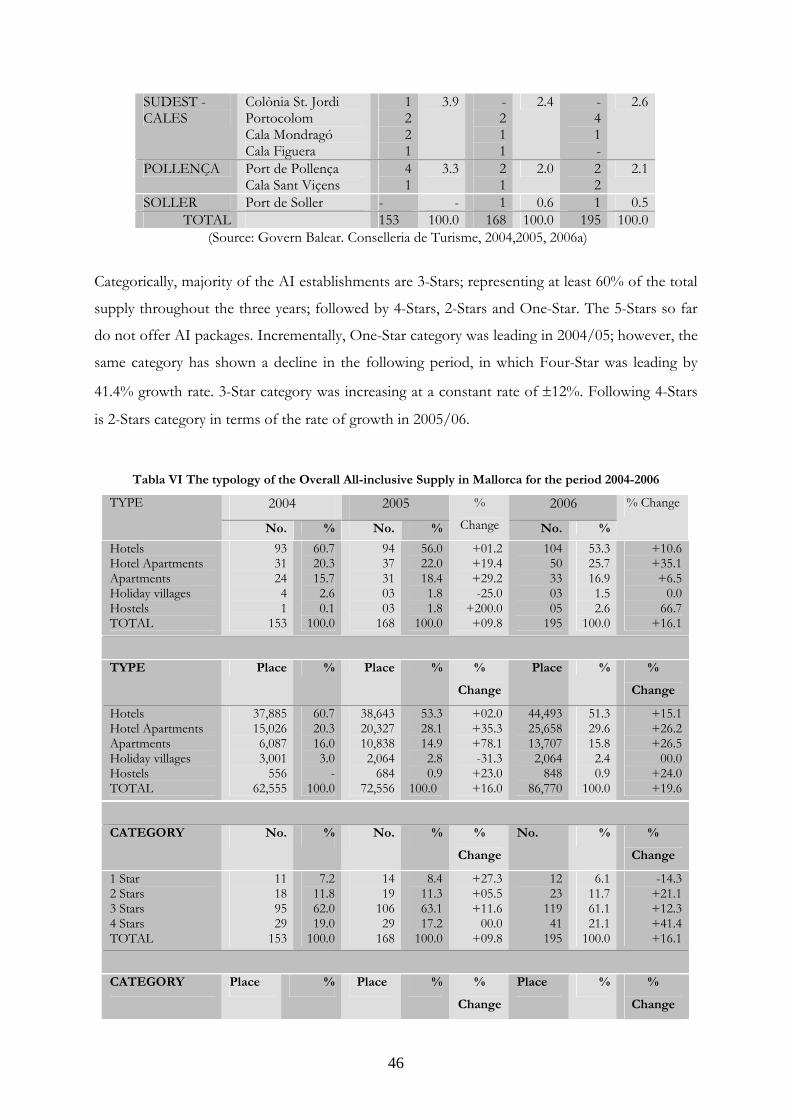
46
SUDEST - CALES
Colònia St. Jordi Portocolom Cala Mondragó Cala Figuera
1 2 2 1
3.9 - 2 1 1
2.4 - 4 1 -
2.6
POLLENÇA Port de Pollença Cala Sant Viçens
4 1
3.3 2 1
2.0 2 2
2.1
SOLLER Port de Soller - - 1 0.6 1 0.5 TOTAL 153 100.0 168 100.0 195 100.0
(Source: Govern Balear. Conselleria de Turisme, 2004,2005, 2006a)
Categorically, majority of the AI establishments are 3-Stars; representing at least 60% of the total
supply throughout the three years; followed by 4-Stars, 2-Stars and One-Star. The 5-Stars so far
do not offer AI packages. Incrementally, One-Star category was leading in 2004/05; however, the
same category has shown a decline in the following period, in which Four-Star was leading by
41.4% growth rate. 3-Star category was increasing at a constant rate of ±12%. Following 4-Stars
is 2-Stars category in terms of the rate of growth in 2005/06.
Tabla VI The typology of the Overall All-inclusive Supply in Mallorca for the period 2004-2006
2004 2005 2006 TYPE
No. % No. %
%
Change No. %
% Change
Hotels Hotel Apartments Apartments Holiday villages Hostels TOTAL
93 31 24 4 1
153
60.7 20.3 15.7 2.6 0.1
100.0
94 37 31 03 03
168
56.0 22.0 18.4 1.8 1.8
100.0
+01.2 +19.4 +29.2 -25.0
+200.0 +09.8
104 50 33 03 05
195
53.3 25.7 16.9 1.5 2.6
100.0
+10.6 +35.1 +6.5
0.0 66.7
+16.1
TYPE Place % Place % %
Change
Place % %
Change
Hotels Hotel Apartments Apartments Holiday villages Hostels TOTAL
37,885 15,026 6,087 3,001
556 62,555
60.7 20.3 16.0 3.0
- 100.0
38,643 20,327 10,838 2,064
684 72,556
53.3 28.1 14.9 2.8 0.9
100.0
+02.0 +35.3 +78.1 -31.3
+23.0 +16.0
44,493 25,658 13,707 2,064
848 86,770
51.3 29.6 15.8 2.4 0.9
100.0
+15.1 +26.2 +26.5
00.0 +24.0 +19.6
CATEGORY No. % No. % %
Change
No. % %
Change
1 Star 2 Stars 3 Stars 4 Stars TOTAL
11 18 95 29
153
7.2 11.8 62.0 19.0
100.0
14 19
106 29
168
8.4 11.3 63.1 17.2
100.0
+27.3 +05.5 +11.6
00.0 +09.8
12 23
119 41
195
6.1 11.7 61.1 21.1
100.0
-14.3 +21.1 +12.3 +41.4 +16.1
CATEGORY Place % Place % %
Change
Place % %
Change

47
1 Star 2 Stars 3 Stars 4 Stars TOTAL
2,580 5,773
40,315 13,887 62,555
7.20 11.80 62.00 19.00
100.00
2,751 4,847
49,472 15,486 72,556
3.9 6.7
68.2 21.2
100.0
+06.6 -16.0
+22.7 +11.5 +16.0
3,191 7,040
54,345 22,194 86,770
3.6 8.2
62.6 25.6
100.0
+16.0 +45.2 +9.9
+43.3 +19.6
CAPACITY No. % No. % %
ChangeNo. % % Change
≤100 places 101-200 places 201-300 places 301-500 places 501-1000 places > 1000 places TOTAL
11 22 26 45 44 05
153
7.20 14.40 17.00 29.00 28.20 3.30 100
11 30 48 28 45 06
168
06.5 17.8 28.6 16.8 26.8 03.5
100.0
0.0 +36.4 +84.6 -37.8
+02.3 +20.0 +09.8
14 32 59 34 46 10
195
7.2 16.4 30.2 17.5 23.6 5.1
100.0
+27.3 +06.7 +23.0 +21.4 +02.2 +66.7 +16.1
Like in the categorical distribution, most of accommodation places are found in 3-Star category,
where at least 62% of places are offered. This category was also leading in terms of growth rate in
the period between 2004 and 2005, although the pace of its growth has slowed down in the
subsequent period. In the contrast, a number of places offered in 2-Star category was declining in
the prior period, but has sharply risen by 45.2% within the 2005/06 period. However, a notable
increment is in the 4-Star category, in which just within two years the sector has grown at 60%,
moving from offering 13,887 places to 22,194 places. This may imply the change of taste and
preferences of the market, moving from 3-Star, which was used to be the main accommodation
for all-inclusive market (i.e. demand follows the supply), or the supply has decided to follow the
demand.
With respect to capacity, in 2004, at least half of the AI unit were each equipped with places
between 301-1000. The establishments with 301-500 places were dominating; followed by the
ones with places between 501 and 1000. Only 7.2% of the establishments were having at most
100 places. Those with places between 201- 300 and 101-200 together accounted for 31.4% of
the total. However, in 2005 and 2006, the category which was offering 201-300 was dominating,
showing a notable growth rate of 84.6% in the first period; with the one with 301-500 places
declining by 37.8%, and the same category rise by 21.4% in the following period. The period
between 2005 and 2006 saw a massive increment in the category which offers at least 1000
places, which may signal the beginning of ‘Carribeanizing’ the Mediterranean destinations, in terms
of composing massive-type of AI facilities.
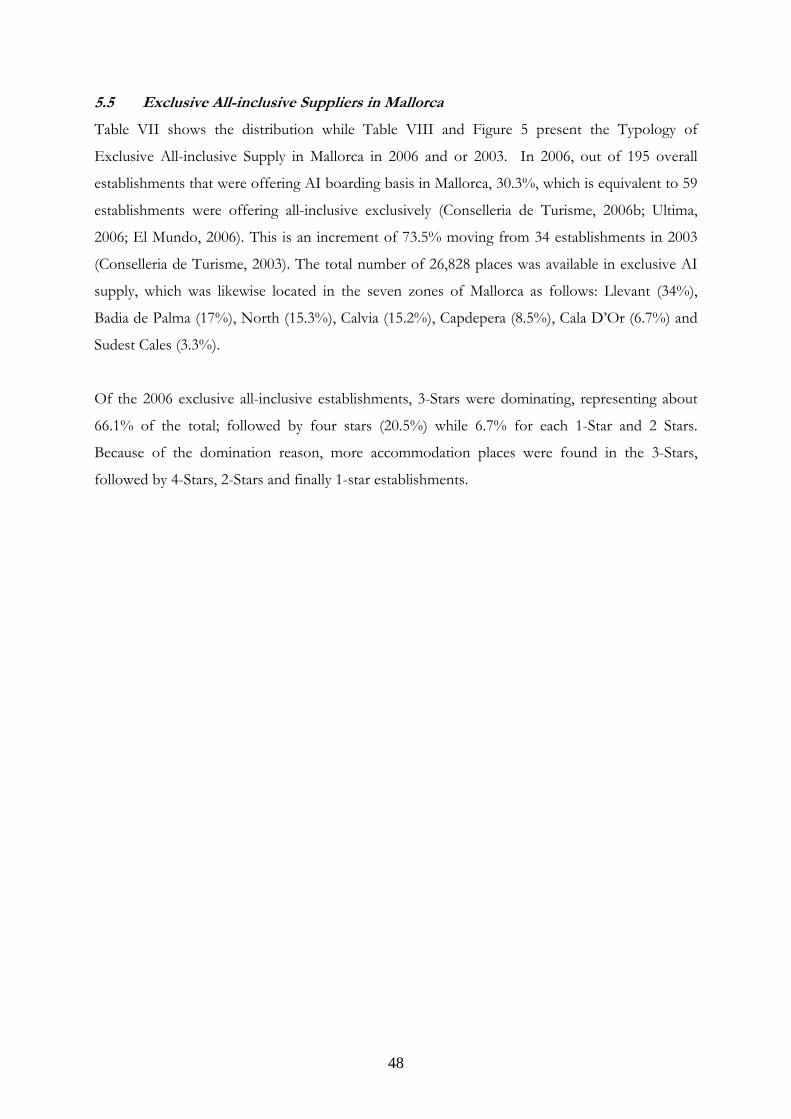
48
5.5 35BExclusive All-inclusive Suppliers in Mallorca
Table VII shows the distribution while Table VIII and Figure 5 present the Typology of
Exclusive All-inclusive Supply in Mallorca in 2006 and or 2003. In 2006, out of 195 overall
establishments that were offering AI boarding basis in Mallorca, 30.3%, which is equivalent to 59
establishments were offering all-inclusive exclusively (Conselleria de Turisme, 2006b; Ultima,
2006; El Mundo, 2006). This is an increment of 73.5% moving from 34 establishments in 2003
(Conselleria de Turisme, 2003). The total number of 26,828 places was available in exclusive AI
supply, which was likewise located in the seven zones of Mallorca as follows: Llevant (34%),
Badia de Palma (17%), North (15.3%), Calvia (15.2%), Capdepera (8.5%), Cala D’Or (6.7%) and
Sudest Cales (3.3%).
Of the 2006 exclusive all-inclusive establishments, 3-Stars were dominating, representing about
66.1% of the total; followed by four stars (20.5%) while 6.7% for each 1-Star and 2 Stars.
Because of the domination reason, more accommodation places were found in the 3-Stars,
followed by 4-Stars, 2-Stars and finally 1-star establishments.
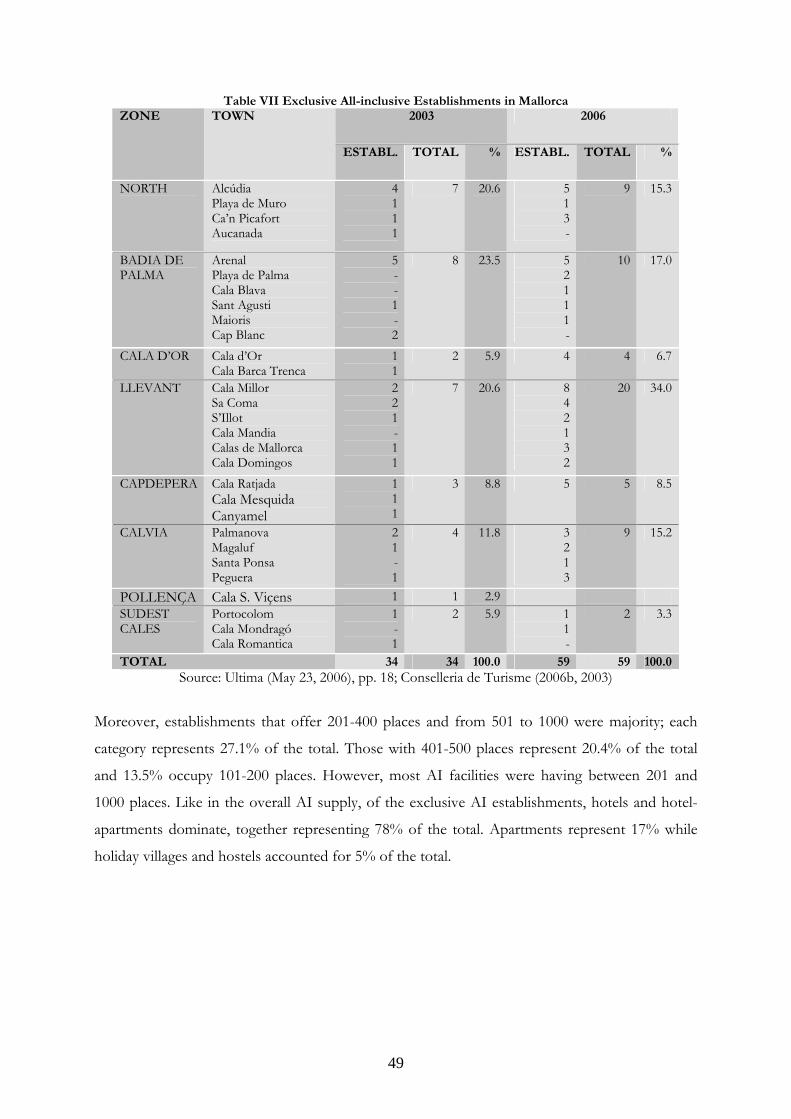
49
Table VII Exclusive All-inclusive Establishments in Mallorca 2003 2006 ZONE TOWN
ESTABL. TOTAL % ESTABL. TOTAL %
NORTH Alcúdia Playa de Muro Ca’n Picafort Aucanada
4 1 1 1
7 20.6 5 1 3 -
9 15.3
BADIA DE PALMA
Arenal Playa de Palma Cala Blava Sant Agusti Maioris Cap Blanc
5 - - 1 - 2
8 23.5 5 2 1 1 1 -
10 17.0
CALA D’OR Cala d’Or Cala Barca Trenca
1 1
2 5.9 4 4 6.7
LLEVANT Cala Millor Sa Coma S’Illot Cala Mandia Calas de Mallorca Cala Domingos
2 2 1 - 1 1
7 20.6 8 4 2 1 3 2
20 34.0
CAPDEPERA Cala Ratjada Cala Mesquida Canyamel
1 1 1
3 8.8 5 5 8.5
CALVIA Palmanova Magaluf Santa Ponsa Peguera
2 1 - 1
4 11.8 3 2 1 3
9 15.2
POLLENÇA Cala S. Viçens 1 1 2.9 SUDEST CALES
Portocolom Cala Mondragó Cala Romantica
1 - 1
2 5.9 1 1 -
2 3.3
TOTAL 34 34 100.0 59 59 100.0Source: Ultima (May 23, 2006), pp. 18; Conselleria de Turisme (2006b, 2003)
Moreover, establishments that offer 201-400 places and from 501 to 1000 were majority; each
category represents 27.1% of the total. Those with 401-500 places represent 20.4% of the total
and 13.5% occupy 101-200 places. However, most AI facilities were having between 201 and
1000 places. Like in the overall AI supply, of the exclusive AI establishments, hotels and hotel-
apartments dominate, together representing 78% of the total. Apartments represent 17% while
holiday villages and hostels accounted for 5% of the total.

50
Tabla VIII The Typology of Exclusive All-inclusive Supply in Mallorca in 2006
TYPE No. of Establishments
%of the establishments
Places available
% of places
Hotels Hotel-Apartments Apartments Holiday villages Hostels TOTAL
29 17 10 1 2
59
49.1 28.9 17.0 1.7 3.3
100.0
13,431 9,850 2,236
660 561
26,828
50.1 36.7 8.4 2.5 2.1
100.0
CATEGORY
1 Star 2 Stars 3 Stars 4 Stars TOTAL
4 4
39 12 59
6.7 6.7
66.1 20.5
100.0
1,065 1,487
18,277 5,999
26,828
4.0 5.5
68.1 22.4
100.0
CAPACITY ≤100 places 101-200 places 201-400 places 401-500 places 501-1000 places > 1000 places TOTAL
4 8
16 12 16 3
59
6.8 13.5 27.1 20.4 27.1 5.1
100.0
5.6 36BProportion of the All-inclusive supply within the Accommodation Capacity
In the next step, the all-inclusive supply share in relation to the available accommodation capacity
at the destination has been examined. The data used include the establishments based in Mallorca
that offer AIs in addition to other boarding-basis, which in the tabulations are referred as ‘overall
AI supply (OAS)’, thereafter incorporated in the analysis is the exclusive all-inclusive supply
(EAS). We have in addition, imported the Existing Capacity (EC) data from the IB-Dades
Informatives (2004; 2005; 2006). Table IX presents the proportion of AI supply within the
accommodation establishments. From the analysis we can conclude that, almost all the holiday
villages in Mallorca offer all-inclusive boarding basis.
In the 2006 overall establishments, 15.6% of the selected establishments were offering all-
inclusives, with only 4.7% exclusively. Moreover, of the available hotel apartments and hotels,
respectively 29.1% and 18.7% were offering AI, with accordingly 9.9% and 5.2% exclusively.
Only 5.7%, 7.4% and 8.0% of the apartments were offering all-inclusives; while hostels have
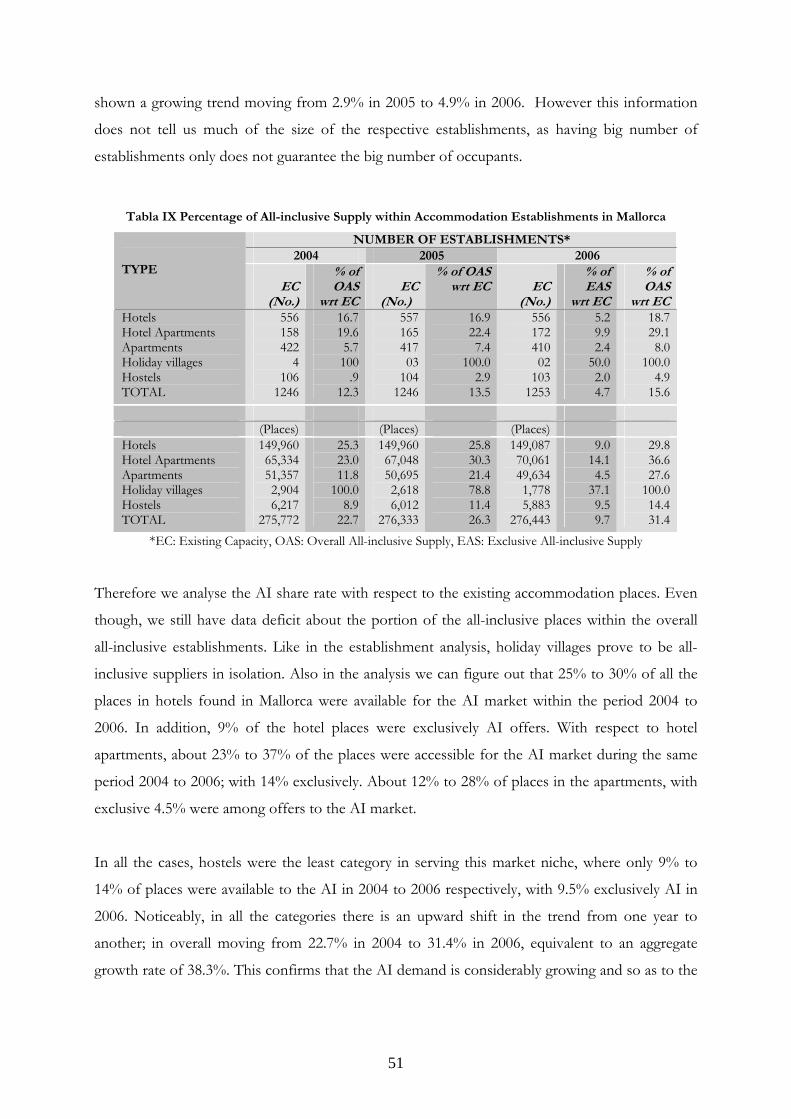
51
shown a growing trend moving from 2.9% in 2005 to 4.9% in 2006. However this information
does not tell us much of the size of the respective establishments, as having big number of
establishments only does not guarantee the big number of occupants.
Tabla IX Percentage of All-inclusive Supply within Accommodation Establishments in Mallorca
NUMBER OF ESTABLISHMENTS* 2004 2005 2006
TYPE
EC (No.)
% of OAS
wrt ECEC
(No.)
% of OAS wrt EC EC
(No.)
% of EAS
wrt EC
% of OAS
wrt ECHotels Hotel Apartments Apartments Holiday villages Hostels TOTAL
556 158 422
4 106
1246
16.7 19.6 5.7 100
.9 12.3
557 165 417 03
104 1246
16.9 22.4 7.4
100.0 2.9
13.5
556 172 410 02
103 1253
5.2 9.9 2.4
50.0 2.0 4.7
18.7 29.1 8.0
100.0 4.9
15.6 (Places) (Places) (Places) Hotels Hotel Apartments Apartments Holiday villages Hostels TOTAL
149,960 65,334 51,357 2,904 6,217
275,772
25.3 23.0 11.8
100.0 8.9
22.7
149,960 67,048 50,695 2,618 6,012
276,333
25.8 30.3 21.4 78.8 11.4 26.3
149,087 70,061 49,634 1,778 5,883
276,443
9.0 14.1 4.5
37.1 9.5 9.7
29.8 36.6 27.6
100.0 14.4 31.4
*EC: Existing Capacity, OAS: Overall All-inclusive Supply, EAS: Exclusive All-inclusive Supply
Therefore we analyse the AI share rate with respect to the existing accommodation places. Even
though, we still have data deficit about the portion of the all-inclusive places within the overall
all-inclusive establishments. Like in the establishment analysis, holiday villages prove to be all-
inclusive suppliers in isolation. Also in the analysis we can figure out that 25% to 30% of all the
places in hotels found in Mallorca were available for the AI market within the period 2004 to
2006. In addition, 9% of the hotel places were exclusively AI offers. With respect to hotel
apartments, about 23% to 37% of the places were accessible for the AI market during the same
period 2004 to 2006; with 14% exclusively. About 12% to 28% of places in the apartments, with
exclusive 4.5% were among offers to the AI market.
In all the cases, hostels were the least category in serving this market niche, where only 9% to
14% of places were available to the AI in 2004 to 2006 respectively, with 9.5% exclusively AI in
2006. Noticeably, in all the categories there is an upward shift in the trend from one year to
another; in overall moving from 22.7% in 2004 to 31.4% in 2006, equivalent to an aggregate
growth rate of 38.3%. This confirms that the AI demand is considerably growing and so as to the

52
all-inclusive supply. The basic challenge to the destination holders, therefore, is the implication of
the observed trends to the destination economy.

53
8BCHAPTER SEVEN 9BMETHODOLOGY OF THE STUDY
6.1 37BResearch Design
We consider the significance of choosing appropriate research designs in order to achieve a good
‘fit’ between the research objectives, data requirements and analytical techniques. To achieve the
study objectives, both quantitative and qualitative data are required, which have triggered the
necessity of both exploratory and descriptive research designs. The qualitative approach involves
gathering a great deal of information about a small number of people, while, quantitative
approach involves statistical analysis and relies on numerical evidence to draw conclusions or to
test hypotheses (Veal, 1979). It is worth to mention that, analysis of the results will rely more on
quantitative approach.
6.2 38BStudy Area and Sampling Procedure
This study has involved Mallorca, which is the largest Island in the Balearic Archipelago
(Conselleria d’Economia et. al., undated). Mallorca is where the AI by Cub Med, was born more
than five decades ago (George Washington University, 1997); and was the first island to develop
its tourism in the archipelago (Meaurio and Murray, 2001) where today, majority of package
resorts are hosted (Aguilo, et al., 2003). Two groups of population formed our statistical units.
Inbound guests to Mallorca form the first group. Since some come with companion(s), we use
the term ‘travel party’ to denote the group of people travelling together and sharing the same
travelling characteristics.
The second statistical unit is composed of establishments that offer AI in Mallorca. Using the
internet, tour operators’ brochures, published and unpublished reports, AI hotels were identified
according to their boarding basis. Paris and Zona-Paris (1999) describe any hotel or resort that
may have all-inclusive package for all the guests or only a segment of the guests as an ‘all-
inclusive resort’. Until May 2006, out of 162 establishments that were offering AI package in
Mallorca, 59 offer ‘exclusively all-inclusive’; which is equivalent to 38.6% of the total (Ultima,
2006; El Mundo, 2006, Conselleria de Turisme, 2006b). The full list of AI hotels in Mallorca has
been established, as shown in the appendices.
The population of AI tourists to the Balearics is infinite, so we take the number of AI tourist
arrivals in 2004 as a baseline. In 2004, the AI segment represented 16.32% of all tourists to
Balearics (Alegre and Pou, 2006). For precision, tourists from the rest of Spain (outside Mallorca)

54
were equally treated as inbound tourists. Two parameters were estimated (1) the average
expenditure of AI tourist (2) the tourist’s motivation for choosing AI tours. To capture the first
parameter, every individual/group had equal chances of being selected, in which, one individual
from every travel party was involved. That individual must be in-charge of the cash of the
respective group, and that, sampling without replacement was observed. Sampling without
replacement involves removing previously-selected party from the population before subsequent
selections to avoid the possibility of the same individual appearing in the sample more than once.
Therefore, formula 17 by Cochran (1977) was used to calculate the sample size.
pqe
zn
⎥⎥⎦
⎤
⎢⎢⎣
⎡= 2
2
0
α (17)
Where n0 denotes the sample size, z is the standardized normal variable, given a specified
confidence level (in this case, 1.96 for 95% confidence level), α denotes the level of significance, s
is the standard deviation of the variable in population and e is the sampling error that shows the
desired level of precision. p is the estimated value for the proportion of a sample that will
respond a given way to a survey question. Due to lack of prior information, p=0.5 and q is 1-p.
Also with the previous information to calculate the sample variance, s2, Equation 18 could as well
be used to compute n0. 2
2/0 ⎟
⎟⎠
⎞⎜⎜⎝
⎛=
eszn α (18)
Whereas:
( )22
1−−
= ∑n
Xxs i (19)
Where, S2 denotes the sample variance, xi denotes observation i, n represents number of
observations and X denotes the sample mean. Again, in estimating the second variable, visitor
motivation, formula 20 which was suggested by Cochran (1977) for sampling without replacement,
was used to compute a sample size.
pqe
zn
⎥⎥⎦
⎤
⎢⎢⎣
⎡= 2
2
0
α (20)

55
Where p is the estimated value for the proportion of a sample that will respond a given way to a
survey question. Due to lack of prior information, p=0.5 and q is 1-p. Hence, using either of the
equations, with the sampling error reduced to ±3 percent, at the 95% confidence level, n0 = 1067
respondents. Our sample size is consistent with the suggestion of Stynes (1997) of having a
sample of at least 50 to 100 when analyzing the economic impact of a specific tourist segment.
Finally, the sample selection in AI establishments will be based on convenience sampling.
Respondents will be obtained on the basis of interview-acceptance; in which prior contact to the
AI hotels will be done, to ask for interviewing possibilities and appointments.
6.3 39BData Collection Methods and Procedures
There are two types of data: secondary and primary data (Veal, 1997); both of which were used in
this study.
6.3.1 59BSecondary Data
Secondary data involves previous collected data or information by individuals, institutions or
agencies for purposes other than those of the current research study, which include official
statistics, technical reports, trade journals and so forth. This study has utilized various secondary
sources, including IB- Dades Informative (2005), Comissió Experts “tot inclos” (2005), Alegre
and Pou (2006), Cladera (2006), INE (2006), Ultima (2006), El Mundo (2006) and Conselleria de
Turisme (2006a, b), to mention just a few.
6.3.2 60BPrimary Data
The primary data has been described by Veal (1979) as, the new data to be collected for the
research at hand. Two methods were used to gather primary data: visitors’ surveys and tourism
establishment surveys.
6.3.2.1 67BVisitors Surveys
Visitor-survey was employed for data collection. It is estimated that, at least 50% of tourism in
the Balearics concentrates in summer (IB-Dades Informatives, 2005). The exit-survey at the
Airport of Mallorca was done during the summer of 2006, in August and September by
researcher and other three research assistants; of them, two were students of Master in Tourism
Administration at the University of Balearic Islands. The reason for choosing exit-survey is to
capture the actual expenditure. Palma Airport is the biggest airport in the Balearics, in terms of
tourist traffics (IB-Dades Informatives, 2005). Semi-structured questionnaire which was designed
in consultation with academics and practitioners with professional experience in data collection
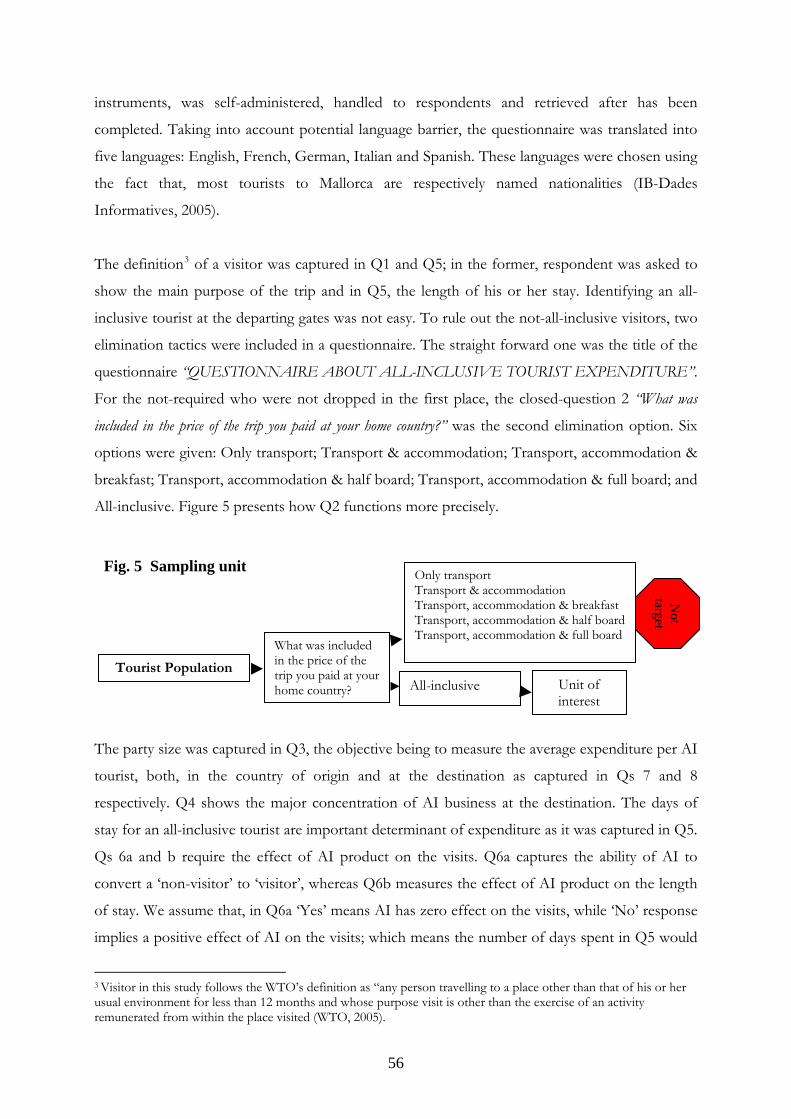
56
instruments, was self-administered, handled to respondents and retrieved after has been
completed. Taking into account potential language barrier, the questionnaire was translated into
five languages: English, French, German, Italian and Spanish. These languages were chosen using
the fact that, most tourists to Mallorca are respectively named nationalities (IB-Dades
Informatives, 2005).
The definitionF
3F of a visitor was captured in Q1 and Q5; in the former, respondent was asked to
show the main purpose of the trip and in Q5, the length of his or her stay. Identifying an all-
inclusive tourist at the departing gates was not easy. To rule out the not-all-inclusive visitors, two
elimination tactics were included in a questionnaire. The straight forward one was the title of the
questionnaire “QUESTIONNAIRE ABOUT ALL-INCLUSIVE TOURIST EXPENDITURE”.
For the not-required who were not dropped in the first place, the closed-question 2 “What was
included in the price of the trip you paid at your home country?” was the second elimination option. Six
options were given: Only transport; Transport & accommodation; Transport, accommodation &
breakfast; Transport, accommodation & half board; Transport, accommodation & full board; and
All-inclusive. Figure 5 presents how Q2 functions more precisely.
The party size was captured in Q3, the objective being to measure the average expenditure per AI
tourist, both, in the country of origin and at the destination as captured in Qs 7 and 8
respectively. Q4 shows the major concentration of AI business at the destination. The days of
stay for an all-inclusive tourist are important determinant of expenditure as it was captured in Q5.
Qs 6a and b require the effect of AI product on the visits. Q6a captures the ability of AI to
convert a ‘non-visitor’ to ‘visitor’, whereas Q6b measures the effect of AI product on the length
of stay. We assume that, in Q6a ‘Yes’ means AI has zero effect on the visits, while ‘No’ response
implies a positive effect of AI on the visits; which means the number of days spent in Q5 would
3 Visitor in this study follows the WTO’s definition as “any person travelling to a place other than that of his or her usual environment for less than 12 months and whose purpose visit is other than the exercise of an activity remunerated from within the place visited (WTO, 2005).
Fig. 5 Sampling unit
Tourist Population
Only transportTransport & accommodation Transport, accommodation & breakfast Transport, accommodation & half board Transport, accommodation & full board
All-inclusive
What was included in the price of the trip you paid at your home country? Unit of
interest
Not
target

57
have been lost as well as the expenditure at destination, perhaps expenditure at the country of
origin could have been incurred to go somewhere else where the AI products are available,
therefore we can not guarantee that Q7 expenditure will be lost. Q6b, ‘the same number of days’
can have effect on the expenditure if at all, conventional tourist, with the same number of days,
has an expenditure which is different from that of all-inclusive tourist.
However, we were aware of the comments of Sheldon and Mak (1987:13) that visitors may not
know the prices of the individual components [especially accommodation & transport]; because
they purchase the entire package either from a travel agent, who is a retailer of vacation products
and not usually responsible for creating tour packages, or from a tour operator, who creates the
package and publishes, and then distributes the brochures. Therefore, aggregate payments both in
the country of origin (Q7a) and at the destination (Q8a) were considered important, even if
categorical expenditure could not be obtained.
Q9 is a likert-type profile scale to capture factors motivating tourists to choose all-inclusive tours
when visiting Mallorca. Eighteen factors have been identified, with five scales from 1: ‘totally
agree’ to 5: ‘totally disagree’. Furthermore Qs. 10 and 11 measure the loyalty of tourists towards
all-inclusives. First they ask for the number of previous visits to Mallorca, and the number of
travels through all-inclusive arrangements. For accuracy, specific years of visits and AI purchases
were captured. The post-purchase decision is captured in Q11 ‘a’ and ‘b’, which show the general
trend of AI tours in Mallorca, which can as well explain the tourists’ contentment with the
destination and AI product. Finally the respondent’s characteristics were captured in Qs. 12 to
16, including respectively nationality, age, gender, occupation, and household gross annual
income.
6.3.2.2 68BTourism Establishment Survey
Hotel survey provides us with important information about the boarding characteristics as well as
establishments’ purchasing pattern, employment profile, and occupancy rate, bed tax and hotel
tax. As have been said, until May 2006, out of 162 establishments that were offering AI package
in Mallorca, 59 were ‘exclusively all-inclusive’ establishments. The exclusive AI enterprises are
situated in the seven zones of Mallorca. For representative purpose, the sample has been
distributed amongst seven zones, where in each zone, AI establishments were selected. The
semi-structured questionnaire was used to interview the general managers of the selected hotels.
The bed tax should be collected at autonomous levels where rates are readily available. The hotel

58
tax is one of the most objective methods to measure tourism-related economic activities. In this
method, one needs to know average room rates, tax rates and total tax revenues. From these
variables, one can calculate total paid hotel nights in the Balearics.

59
10BCHAPTER SEVEN 11BESTIMATION OF ALL-INCLUSIVE EXPENDITURE
7.1 40BIntroduction
The next Chapter deals with the applications of the theoretical component into a real setting
through the analysis of the AI expenditure from the AI tourists who visited the Balearics in a
summer of 2006. The rest of the section is organised as follows. The demographic and travelling
characteristics of the respondents have been presented first, which also include the analysis of the
travelling characteristics on the basis of the nationalities of the respondents. Then the
presentation of the length of stay and the types of accommodation stayed during their vacation
followed, before the exercise of estimating the AI expenditure in general. Also estimated are
regression models to explain the determinants of the tourist expenditure. The section is closed by
the estimation of the effects of the AI presence at the destination on the visits, length of stay and
on expenditure; which also involve the estimation of the maximum impact of the AI presence at
the destination.
7.2 41BDemographic and Travelling Characteristics of the Respondents
Of the computed sample size of 1067 in the methodology section, a response rate was 79%,
which is equivalent to 843 respondents. Table XIV gives the summary of their demographic
characteristics. German and British respondents dominate; together accounted for 72.6% of the
total. Majority were aged at least 45 years. Female tourists occupy more than half of the
respondents. The employed and retired respondents were dictating. Majority of the households
earn gross incomes of between 20,000 and 30,000 Euros per annum; with more than half of the
households getting at most €30,000. With respect to their traveling characteristics, the results
which are also presented in Table XV have revealed that, the AI tourists come to Mallorca
specific for vacation purposes.
Majority were accompanied by up to three people in a group; with the group of fours
dominating. Three-Star hotels were their main accommodation, where majority stayed for 6-8
days, followed by those who stayed for 13-16 days. Fascinatingly, at least 60% of the respondents
have said that they would have come to Mallorca even if there were no all-inclusive holiday
experience at the destination; with significant proportion of them (85%) showing that they would
have even stayed for the same number of days, they have stayed in the current trip. More than
half of the respondents had previously been to Mallorca at least once; of them 56.2% came

60
through all-inclusives; majority once. Almost all respondents were planning to revisit Mallorca in
the future with 71% of them through AIs.
Table XIV. Selected Demographic Characteristics of Respondents (n=843)
Respondent characteristics Percentage (%) Cum. % Nationality:
German 42.5 42.2 British 30.1 72.6 Spanish 8.7 81.3 French 4.0 85.3 Italian 4.7 90.0 Others 10.0 100.0
Age: Below 25 years 8.7 8.7 26-44 25.9 34.5 45-64 24.1 58.6 Above 64 41.4 100.0
Gender: Female 53.7 53.7 Male 46.3 100.0
Occupation: Unemployed 5.1 5.1 Employed 49.6 54.7 Retired 42.3 97.0 Student 3.0 100.0
Annual gross household income: Below €20,000 18.0 18.0 €20,000-30,000 36.2 54.2 €30,001-40,000 17.5 71.8 €40,001-50,000 8.6 80.3 €50,001-60,000 8.8 89.2 Above €60,000 10.8 100.0
Furthermore using the same traveling characteristics of the respondents we have analyzed if there
are differences across nationalities. Table XVI presents the summary of the findings. It was
found that, there is no significant difference with regard to the party size as most of respondents
regardless of their nationalities were accompanied by up to three people in a group. While
majority of the rest of respondents have shown that they were two in a group, majority of British
respondents were accompanied by three people and the majority of Spanish respondents were
three people in a group. With respect to the type of accommodation they have stayed during the
vacation, with the exception of Italian tourists whose main accommodation were in the 4-Star
hotels, the rest had preference on the 3-Star hotels over other alternatives. Regarding their length
of stay at the destination, there were two peaks, 6-8 days and 13-16 days; although the former

61
was the length of stay for the majority. These two peaks were clearer to all nationalities except for
the Spanish category.
Table XV Selected Travelling Characteristics of Respondents (n=843)
Respondent characteristics Percentage
(%) Cum. %
Party Size: Alone 8.4 8.4 You & other 1person 24.3 32.7 You & other 2persons 21.6 54.3 You & other 3persons 25.1 79.5 You & other 4persons 10.6 90.0 You & other 5persons 4.4 94.4 You & other 6persons 1.8 96.2 You & other 7persons 1.5 97.7 You & other 8persons 2.3 100.0
Type of Accommodation: 1-star hotel .2 .2 2-star hotel 6.9 7.1 3-star hotel 64.7 71.8 4-star hotel 25.0 96.8 Other 3.2 100.0
Length of Stay in Mallorca: Less than 6 days 4.4 4.4 6-8 52.0 56.3 9-12 14.9 71.3 13-16 28.0 99.3 More than 16 .7 100.0
Would still have come in the absence of AI at destination:
Yes 64.1 64.1 No 22.3 86.5 Not sure 13.5 100.0
Length of stay in the absence of AI at destination: More days 4.8 4.8 Same number of days 85.0 89.8 Less days 4.6 94.4 Not sure 5.6 100.0
Number of Previous Visits to Mallorca: None 42.0 42.0 One Trip 21.0 63.0 Two Trips 13.9 76.9 Three Trips 7.5 84.3 Four Trips 4.0 88.4 More Than 4 Trips 11.6 100.0
Previous All-inclusive tours to Mallorca: None 43.8 43.8 One Trip 33.3 77.1 Two Trips 15.3 92.4 Three Trips 4.3 96.7 Four Trips 1.2 98.0 More Than 4 Trips 2.0 100.0
Planning to re-visit Mallorca:
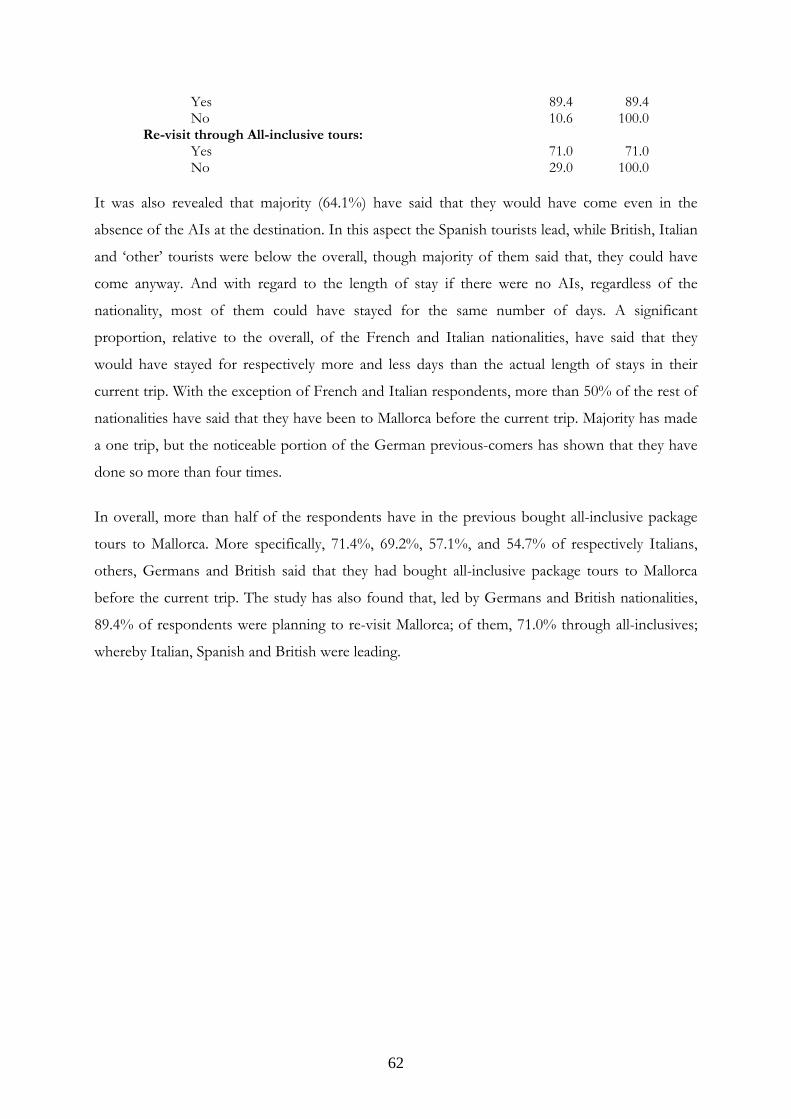
62
Yes 89.4 89.4 No 10.6 100.0
Re-visit through All-inclusive tours: Yes 71.0 71.0 No 29.0 100.0
It was also revealed that majority (64.1%) have said that they would have come even in the
absence of the AIs at the destination. In this aspect the Spanish tourists lead, while British, Italian
and ‘other’ tourists were below the overall, though majority of them said that, they could have
come anyway. And with regard to the length of stay if there were no AIs, regardless of the
nationality, most of them could have stayed for the same number of days. A significant
proportion, relative to the overall, of the French and Italian nationalities, have said that they
would have stayed for respectively more and less days than the actual length of stays in their
current trip. With the exception of French and Italian respondents, more than 50% of the rest of
nationalities have said that they have been to Mallorca before the current trip. Majority has made
a one trip, but the noticeable portion of the German previous-comers has shown that they have
done so more than four times.
In overall, more than half of the respondents have in the previous bought all-inclusive package
tours to Mallorca. More specifically, 71.4%, 69.2%, 57.1%, and 54.7% of respectively Italians,
others, Germans and British said that they had bought all-inclusive package tours to Mallorca
before the current trip. The study has also found that, led by Germans and British nationalities,
89.4% of respondents were planning to re-visit Mallorca; of them, 71.0% through all-inclusives;
whereby Italian, Spanish and British were leading.
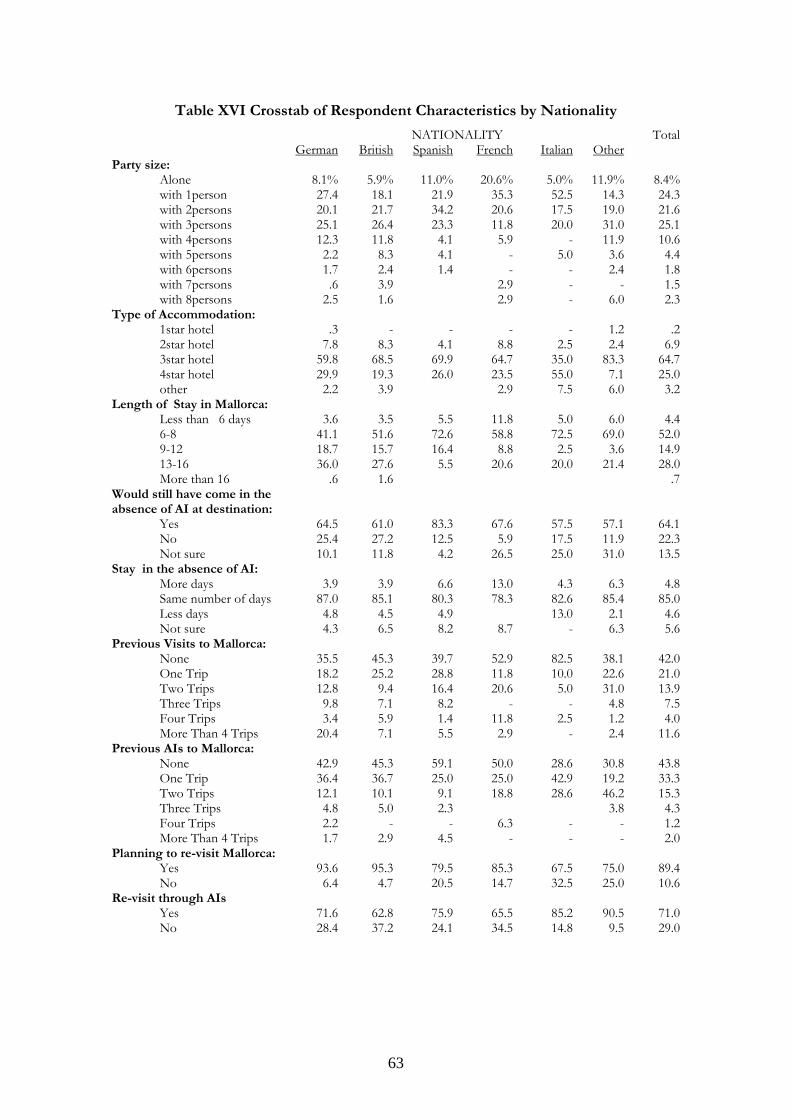
63
Table XVI Crosstab of Respondent Characteristics by Nationality
NATIONALITY Total UGermanU UBritishU USpanishU UFrenchU UItalianU UOtherU
Party size: Alone 8.1% 5.9% 11.0% 20.6% 5.0% 11.9% 8.4%with 1person 27.4 18.1 21.9 35.3 52.5 14.3 24.3with 2persons 20.1 21.7 34.2 20.6 17.5 19.0 21.6with 3persons 25.1 26.4 23.3 11.8 20.0 31.0 25.1with 4persons 12.3 11.8 4.1 5.9 - 11.9 10.6with 5persons 2.2 8.3 4.1 - 5.0 3.6 4.4with 6persons 1.7 2.4 1.4 - - 2.4 1.8with 7persons .6 3.9 2.9 - - 1.5with 8persons 2.5 1.6 2.9 - 6.0 2.3
Type of Accommodation: 1star hotel .3 - - - - 1.2 .22star hotel 7.8 8.3 4.1 8.8 2.5 2.4 6.93star hotel 59.8 68.5 69.9 64.7 35.0 83.3 64.74star hotel 29.9 19.3 26.0 23.5 55.0 7.1 25.0other 2.2 3.9 2.9 7.5 6.0 3.2
Length of Stay in Mallorca: Less than 6 days 3.6 3.5 5.5 11.8 5.0 6.0 4.46-8 41.1 51.6 72.6 58.8 72.5 69.0 52.09-12 18.7 15.7 16.4 8.8 2.5 3.6 14.913-16 36.0 27.6 5.5 20.6 20.0 21.4 28.0More than 16 .6 1.6 .7
Would still have come in the absence of AI at destination:
Yes 64.5 61.0 83.3 67.6 57.5 57.1 64.1No 25.4 27.2 12.5 5.9 17.5 11.9 22.3Not sure 10.1 11.8 4.2 26.5 25.0 31.0 13.5
Stay in the absence of AI: More days 3.9 3.9 6.6 13.0 4.3 6.3 4.8Same number of days 87.0 85.1 80.3 78.3 82.6 85.4 85.0Less days 4.8 4.5 4.9 13.0 2.1 4.6Not sure 4.3 6.5 8.2 8.7 - 6.3 5.6
Previous Visits to Mallorca: None 35.5 45.3 39.7 52.9 82.5 38.1 42.0One Trip 18.2 25.2 28.8 11.8 10.0 22.6 21.0Two Trips 12.8 9.4 16.4 20.6 5.0 31.0 13.9Three Trips 9.8 7.1 8.2 - - 4.8 7.5Four Trips 3.4 5.9 1.4 11.8 2.5 1.2 4.0More Than 4 Trips 20.4 7.1 5.5 2.9 - 2.4 11.6
Previous AIs to Mallorca: None 42.9 45.3 59.1 50.0 28.6 30.8 43.8One Trip 36.4 36.7 25.0 25.0 42.9 19.2 33.3Two Trips 12.1 10.1 9.1 18.8 28.6 46.2 15.3Three Trips 4.8 5.0 2.3 3.8 4.3Four Trips 2.2 - - 6.3 - - 1.2More Than 4 Trips 1.7 2.9 4.5 - - - 2.0
Planning to re-visit Mallorca: Yes 93.6 95.3 79.5 85.3 67.5 75.0 89.4No 6.4 4.7 20.5 14.7 32.5 25.0 10.6
Re-visit through AIs Yes 71.6 62.8 75.9 65.5 85.2 90.5 71.0No 28.4 37.2 24.1 34.5 14.8 9.5 29.0
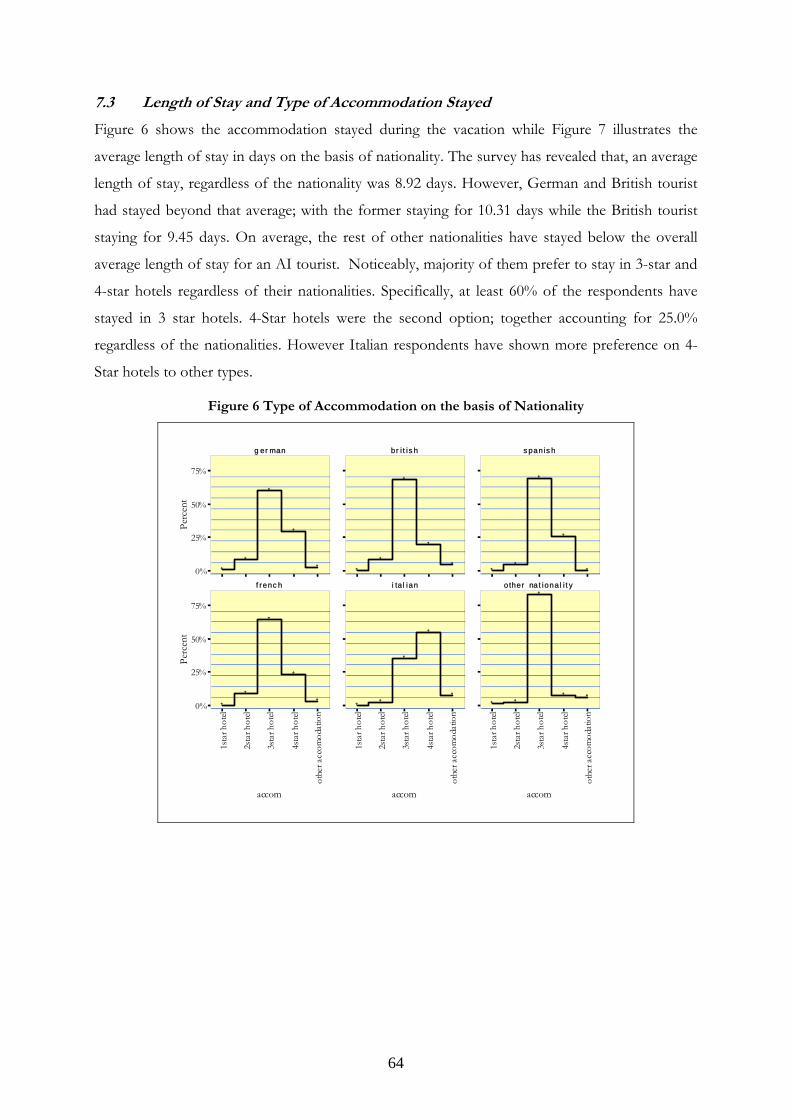
64
7.3 42BLength of Stay and Type of Accommodation Stayed
Figure 6 shows the accommodation stayed during the vacation while Figure 7 illustrates the
average length of stay in days on the basis of nationality. The survey has revealed that, an average
length of stay, regardless of the nationality was 8.92 days. However, German and British tourist
had stayed beyond that average; with the former staying for 10.31 days while the British tourist
staying for 9.45 days. On average, the rest of other nationalities have stayed below the overall
average length of stay for an AI tourist. Noticeably, majority of them prefer to stay in 3-star and
4-star hotels regardless of their nationalities. Specifically, at least 60% of the respondents have
stayed in 3 star hotels. 4-Star hotels were the second option; together accounting for 25.0%
regardless of the nationalities. However Italian respondents have shown more preference on 4-
Star hotels to other types.
Figure 6 Type of Accommodation on the basis of Nationality
0%
25%
50%
75%
Perc
ent
g er man br i t is h s panis h
f renc h i ta l ian other na t ional i t y
1sta
r hot
el
2sta
r hot
el
3sta
r hot
el
4sta
r hot
el
othe
r acc
omod
atio
n
accom
0%
25%
50%
75%
Perc
ent
1sta
r hot
el
2sta
r hot
el
3sta
r hot
el
4sta
r hot
el
othe
r acc
omod
atio
n
accom
1sta
r hot
el
2sta
r hot
el
3sta
r hot
el
4sta
r hot
el
othe
r acc
omod
atio
n
accom
65
Figure 7 Average Length of Stay per Tourist in days
german british spanish french italian other nationality Total
NATIONALITY
2.00
4.00
6.00
8.00
10.00
LE
NG
TH
OF
ST
AY
(IN
DA
YS)
10.31
9.45
7.79
8.56 8.63 8.78 8.92
7.4 43BEstimating the All-Inclusive Expenditure
This section has employed Equations 5 to 10 in subsection 4.4 to estimate total and average
expenditure per tourist and per day based on respondent’s characteristics. To begin with, the
expenditure at the countries of origin was reported in various currencies, of which had to firstly
be converted into Euro. The exchange rate for a British pound (£) in August and September,
2006, the period of data collection, was respectively 1.47854 EURO and 1.48097 EURO; while
a Germany Deutschmark was equivalent to €0.51 (Hhttp://www.oanda.com/convert/classicH).
Interestingly, the main tourist market for the Balearics is Europe, therefore EURO (€) was the
currency used by majority of respondents.
7.4.1 61BExpenditure Categories
Expenditure was divided into two broad categories according to the place of incurrence: in the
country of origin (COR) and at Mallorca (MAL). The first category includes the price of the
package tour which includes transport (return ticket), accommodation and other items. However,
most respondents could give the lump sum price of the package they bought at the country of
origin but hardly give the breakdown of the expenditure incurred that covers, for example,
accommodation and transport, as they basically bought the ready made packages. For that reason
Table XVII reports the average expenditure per tourist per day in totally, at the country of origin
and in Mallorca without the expense breakdowns, but on the basis of accommodation stayed. It
was revealed that whoever stays in other types of accommodation apart from the hotels has spent
more at the destination than the rest. For example a German tourist who stayed in other kind of

66
accommodation, had spent 121.6% more at Mallorca than overall average daily expenditure per
German tourist in the area.
It was the same for the British, French, Italian and others, who spent respectively 34.8%, 39.4%,
37.1%, and 19.3% more than the average daily expenditure per tourist corresponding to the
named nationalities. In overall, apart from the 1-Star hotel occupant whose expenditure in
totally, country of origin and in Mallorca were respectively € 87.41, €66.25 and €21.16, (which
was below the overall average), any tourist who stayed in 3-star hotel had spent less in totally, in
the country of origin and in Mallorca, compared to the ones who stayed in any other types of
accommodation. This might explain the reasons for the tourist preference of 3-star hotel over
other categories. It was not surprising to find higher consumption for the tourists who stayed in
the 2-Star hotels relative to 3-Star or others because this can be explained by many factors
including the cost of return ticket.
When distributing expenditure according to the accommodation stayed, it was found that, the
overall average were € 129.77, 103.74 and €27.43 in totally, country of origin and in Mallorca. The
German tourist has spent €102.60, €74.78 and €27.52 in totally, country of origin and in Mallorca
respectively, which was 20.9% less in totally, 27.9% less in the country of origin and .3% more in
Mallorca. On the other hand, the British tourist has spent 7.4% less in totally, 5.9% less in the
country of origin and 14.9% less in Mallorca. The Spanish tourist has spent 21.4% less in totally,
23.7% less in the origin and 9% less in Mallorca. It was different for the French tourist who
spent more than average daily expenditure per tourist in every category; spending 14% more in
totally, 12.9% more in the country of origin and 12.1% more in Mallorca. The Italian tourist has
spent 10.5% more in totally, 13% more in the origin, but has spent 12.1% less in Mallorca.
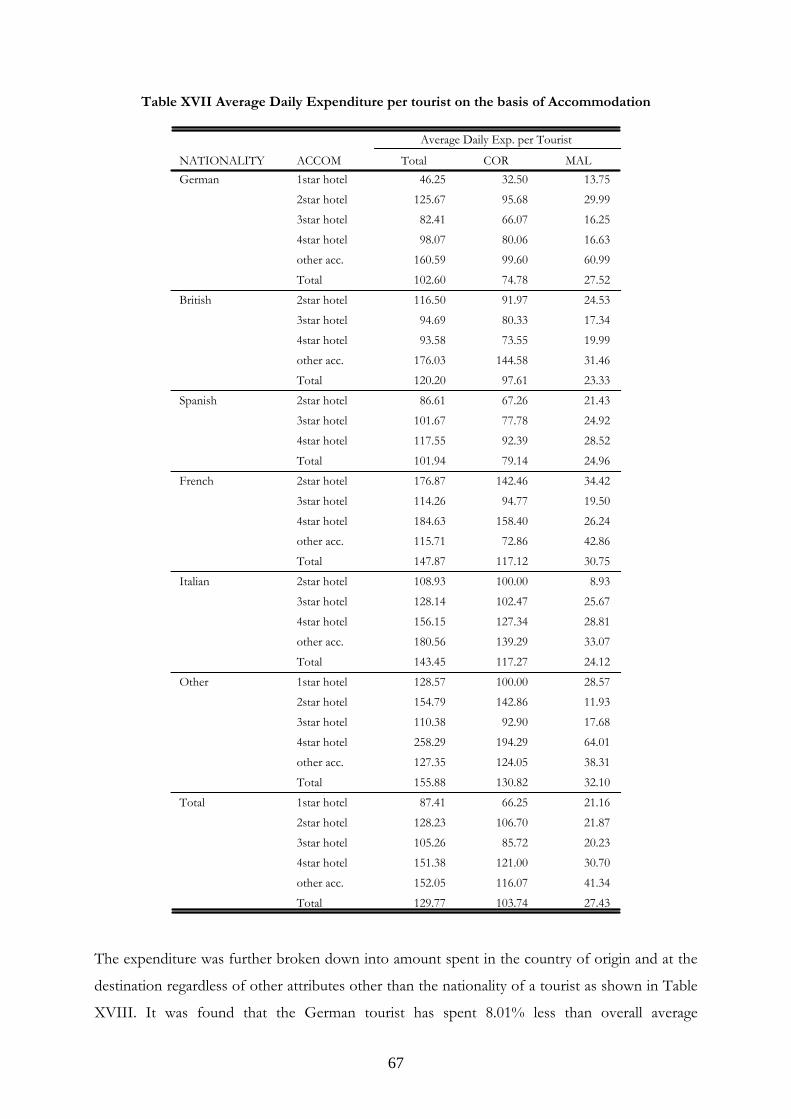
67
Table XVII Average Daily Expenditure per tourist on the basis of Accommodation
46.25 32.50 13.75125.67 95.68 29.9982.41 66.07 16.2598.07 80.06 16.63
160.59 99.60 60.99102.60 74.78 27.52116.50 91.97 24.5394.69 80.33 17.3493.58 73.55 19.99
176.03 144.58 31.46120.20 97.61 23.3386.61 67.26 21.43
101.67 77.78 24.92117.55 92.39 28.52101.94 79.14 24.96176.87 142.46 34.42114.26 94.77 19.50184.63 158.40 26.24115.71 72.86 42.86147.87 117.12 30.75108.93 100.00 8.93128.14 102.47 25.67156.15 127.34 28.81180.56 139.29 33.07143.45 117.27 24.12128.57 100.00 28.57154.79 142.86 11.93110.38 92.90 17.68258.29 194.29 64.01127.35 124.05 38.31155.88 130.82 32.1087.41 66.25 21.16
128.23 106.70 21.87105.26 85.72 20.23151.38 121.00 30.70152.05 116.07 41.34129.77 103.74 27.43
ACCOM1star hotel2star hotel3star hotel4star hotelother acc.Total2star hotel3star hotel4star hotelother acc.Total2star hotel3star hotel4star hotelTotal2star hotel3star hotel4star hotelother acc.Total2star hotel3star hotel4star hotelother acc.Total1star hotel2star hotel3star hotel4star hotelother acc.Total1star hotel2star hotel3star hotel4star hotelother acc.Total
NATIONALITYGerman
British
Spanish
French
Italian
Other
Total
Total COR MAL
Average Daily Exp. per Tourist
The expenditure was further broken down into amount spent in the country of origin and at the
destination regardless of other attributes other than the nationality of a tourist as shown in Table
XVIII. It was found that the German tourist has spent 8.01% less than overall average
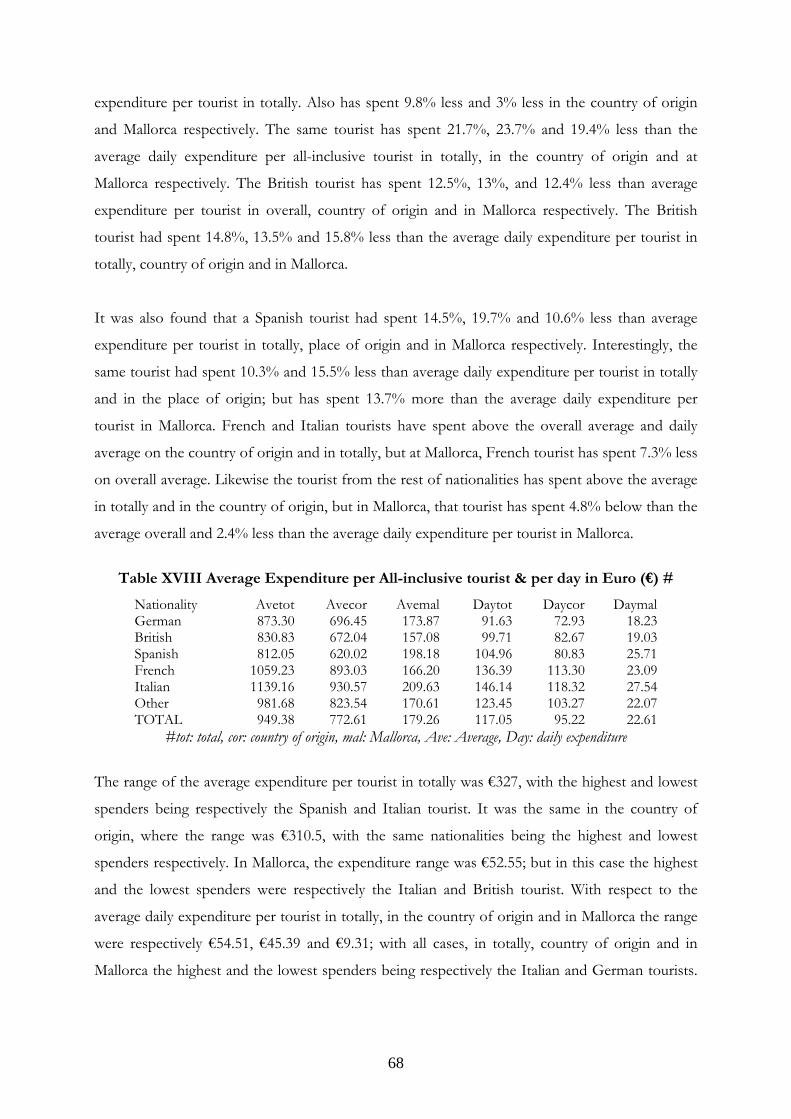
68
expenditure per tourist in totally. Also has spent 9.8% less and 3% less in the country of origin
and Mallorca respectively. The same tourist has spent 21.7%, 23.7% and 19.4% less than the
average daily expenditure per all-inclusive tourist in totally, in the country of origin and at
Mallorca respectively. The British tourist has spent 12.5%, 13%, and 12.4% less than average
expenditure per tourist in overall, country of origin and in Mallorca respectively. The British
tourist had spent 14.8%, 13.5% and 15.8% less than the average daily expenditure per tourist in
totally, country of origin and in Mallorca.
It was also found that a Spanish tourist had spent 14.5%, 19.7% and 10.6% less than average
expenditure per tourist in totally, place of origin and in Mallorca respectively. Interestingly, the
same tourist had spent 10.3% and 15.5% less than average daily expenditure per tourist in totally
and in the place of origin; but has spent 13.7% more than the average daily expenditure per
tourist in Mallorca. French and Italian tourists have spent above the overall average and daily
average on the country of origin and in totally, but at Mallorca, French tourist has spent 7.3% less
on overall average. Likewise the tourist from the rest of nationalities has spent above the average
in totally and in the country of origin, but in Mallorca, that tourist has spent 4.8% below than the
average overall and 2.4% less than the average daily expenditure per tourist in Mallorca.
Table XVIII Average Expenditure per All-inclusive tourist & per day in Euro (€) #
Nationality Avetot Avecor Avemal Daytot Daycor DaymalGerman 873.30 696.45 173.87 91.63 72.93 18.23British 830.83 672.04 157.08 99.71 82.67 19.03Spanish 812.05 620.02 198.18 104.96 80.83 25.71French 1059.23 893.03 166.20 136.39 113.30 23.09Italian 1139.16 930.57 209.63 146.14 118.32 27.54Other 981.68 823.54 170.61 123.45 103.27 22.07TOTAL 949.38 772.61 179.26 117.05 95.22 22.61
#tot: total, cor: country of origin, mal: Mallorca, Ave: Average, Day: daily expenditure
The range of the average expenditure per tourist in totally was €327, with the highest and lowest
spenders being respectively the Spanish and Italian tourist. It was the same in the country of
origin, where the range was €310.5, with the same nationalities being the highest and lowest
spenders respectively. In Mallorca, the expenditure range was €52.55; but in this case the highest
and the lowest spenders were respectively the Italian and British tourist. With respect to the
average daily expenditure per tourist in totally, in the country of origin and in Mallorca the range
were respectively €54.51, €45.39 and €9.31; with all cases, in totally, country of origin and in
Mallorca the highest and the lowest spenders being respectively the Italian and German tourists.
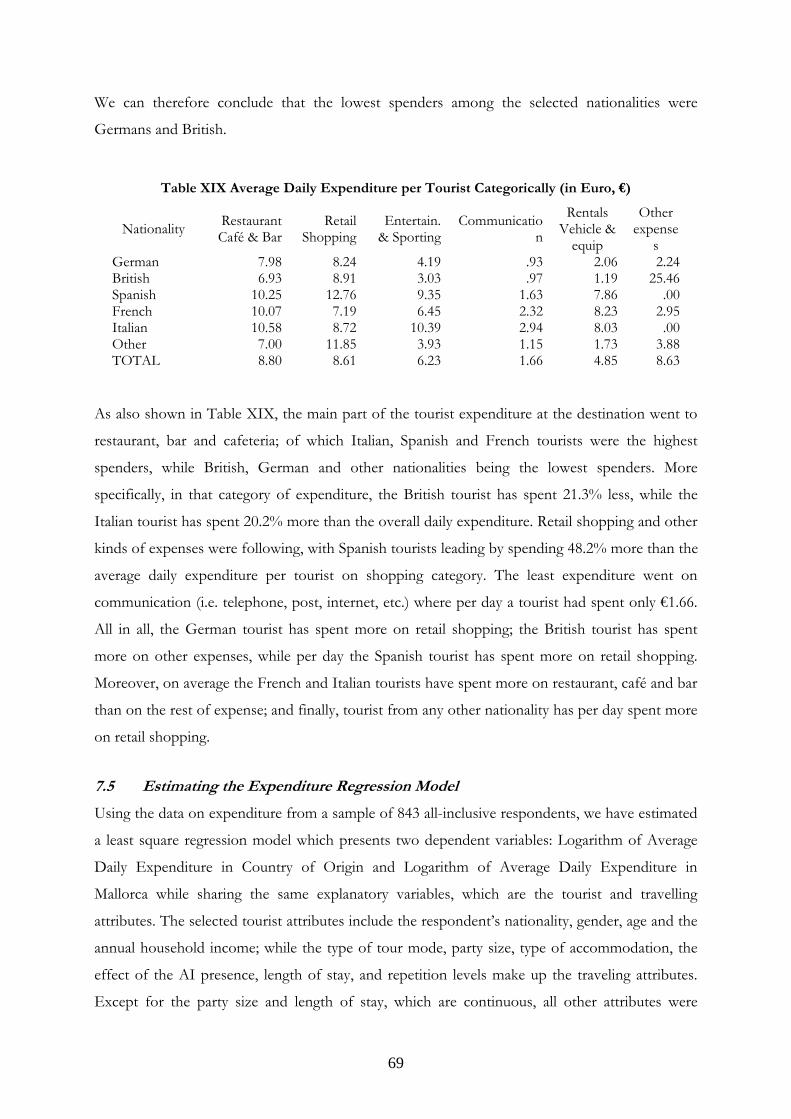
69
We can therefore conclude that the lowest spenders among the selected nationalities were
Germans and British.
Table XIX Average Daily Expenditure per Tourist Categorically (in Euro, €)
Nationality Restaurant Café & Bar
Retail Shopping
Entertain. & Sporting
Communication
Rentals Vehicle &
equip
Other expense
s German 7.98 8.24 4.19 .93 2.06 2.24British 6.93 8.91 3.03 .97 1.19 25.46Spanish 10.25 12.76 9.35 1.63 7.86 .00French 10.07 7.19 6.45 2.32 8.23 2.95Italian 10.58 8.72 10.39 2.94 8.03 .00Other 7.00 11.85 3.93 1.15 1.73 3.88TOTAL 8.80 8.61 6.23 1.66 4.85 8.63
As also shown in Table XIX, the main part of the tourist expenditure at the destination went to
restaurant, bar and cafeteria; of which Italian, Spanish and French tourists were the highest
spenders, while British, German and other nationalities being the lowest spenders. More
specifically, in that category of expenditure, the British tourist has spent 21.3% less, while the
Italian tourist has spent 20.2% more than the overall daily expenditure. Retail shopping and other
kinds of expenses were following, with Spanish tourists leading by spending 48.2% more than the
average daily expenditure per tourist on shopping category. The least expenditure went on
communication (i.e. telephone, post, internet, etc.) where per day a tourist had spent only €1.66.
All in all, the German tourist has spent more on retail shopping; the British tourist has spent
more on other expenses, while per day the Spanish tourist has spent more on retail shopping.
Moreover, on average the French and Italian tourists have spent more on restaurant, café and bar
than on the rest of expense; and finally, tourist from any other nationality has per day spent more
on retail shopping.
7.5 44BEstimating the Expenditure Regression Model
Using the data on expenditure from a sample of 843 all-inclusive respondents, we have estimated
a least square regression model which presents two dependent variables: Logarithm of Average
Daily Expenditure in Country of Origin and Logarithm of Average Daily Expenditure in
Mallorca while sharing the same explanatory variables, which are the tourist and travelling
attributes. The selected tourist attributes include the respondent’s nationality, gender, age and the
annual household income; while the type of tour mode, party size, type of accommodation, the
effect of the AI presence, length of stay, and repetition levels make up the traveling attributes.
Except for the party size and length of stay, which are continuous, all other attributes were

70
specified in the models by a certain number of explanatory dummy variables corresponding to
each category. To avoid the dummy variable trap, one category in each factor was omitted from
the model; and when combined, they form a reference group for interpreting the estimated
results. The estimated equations are the following:
iiiiij
ijji daysdayspeoplepeopleXLOGDEXPCOR εββββββ ++++++= ∑=
23534
23332
31
10
And:
iiiiij
ijji daysdayspeoplepeopleXLOGDEXPMAL ωδδδδδδ ++++++= ∑=
23534
23332
31
10
Whereby:
LOGDEXPCOR and LOGDEXPMAL denote respectively the Logarithm of Average Daily
Expenditure in the Country of Origin and Logarithm of Average Daily Expenditure in Mallorca.
Xij denotes the dummy variable which equals 1 for individuals belonging to category j and 0
otherwise. People and day represent respectively the part size and the length of stay. The reference
group in the model is characterized by the British male, aged 45-64 years, with annual household
income of below €20,000, has stayed in a 3-stars hotel, he would have visited Mallorca even in
the absence of the AIs at the destination, and stay the same number of days. He had visited
Mallorca once before the current trip, through AI; and that tourist plans to re-visit Mallorca in
the future, through the AI package tours.
Since the dependent variable has been transformed into logarithm, the coefficients of the two
quantitative variables measure the percent change in the expenditure caused by a change in the
respective explanatory variable. On the other hand, the coefficients of qualitative variables in the
regression measure the difference in the mean daily expenditure for the tourist that has different
characteristics from those of the reference group; while the mean for the reference group is the
intercept. Because we can not assume a constant association between expenditure variations and
the length of stay or the party size, we have introduced the quadratic functions for the two
quantitative factors, i.e. days square and people square. Such introduction takes into account the
inconsistencies which may arise when estimating daily expenditure that incorporates fixed
expenses like transport. The estimated results can therefore be interpreted as follows. First the nationality of a tourist
influences the tourist expenditure either at the country of the origin, at destination or on both.
For example, with respect to the British tourist, our reference group, a German tourist has spent
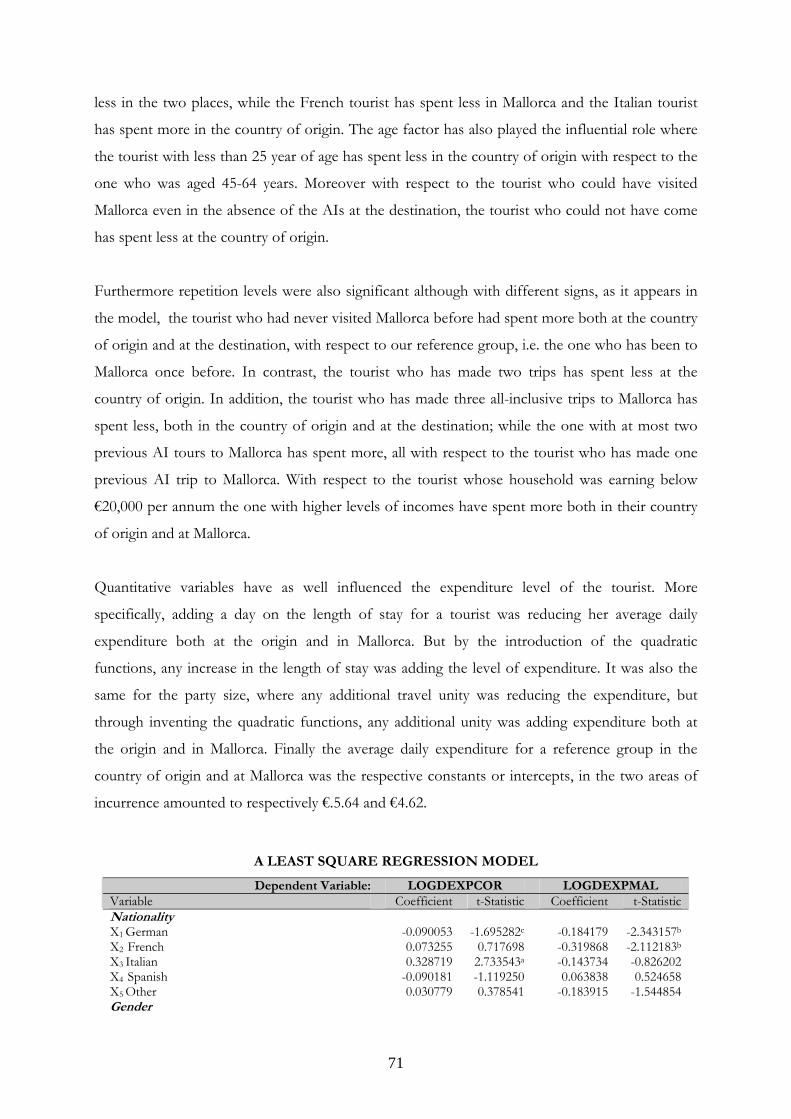
71
less in the two places, while the French tourist has spent less in Mallorca and the Italian tourist
has spent more in the country of origin. The age factor has also played the influential role where
the tourist with less than 25 year of age has spent less in the country of origin with respect to the
one who was aged 45-64 years. Moreover with respect to the tourist who could have visited
Mallorca even in the absence of the AIs at the destination, the tourist who could not have come
has spent less at the country of origin.
Furthermore repetition levels were also significant although with different signs, as it appears in
the model, the tourist who had never visited Mallorca before had spent more both at the country
of origin and at the destination, with respect to our reference group, i.e. the one who has been to
Mallorca once before. In contrast, the tourist who has made two trips has spent less at the
country of origin. In addition, the tourist who has made three all-inclusive trips to Mallorca has
spent less, both in the country of origin and at the destination; while the one with at most two
previous AI tours to Mallorca has spent more, all with respect to the tourist who has made one
previous AI trip to Mallorca. With respect to the tourist whose household was earning below
€20,000 per annum the one with higher levels of incomes have spent more both in their country
of origin and at Mallorca.
Quantitative variables have as well influenced the expenditure level of the tourist. More
specifically, adding a day on the length of stay for a tourist was reducing her average daily
expenditure both at the origin and in Mallorca. But by the introduction of the quadratic
functions, any increase in the length of stay was adding the level of expenditure. It was also the
same for the party size, where any additional travel unity was reducing the expenditure, but
through inventing the quadratic functions, any additional unity was adding expenditure both at
the origin and in Mallorca. Finally the average daily expenditure for a reference group in the
country of origin and at Mallorca was the respective constants or intercepts, in the two areas of
incurrence amounted to respectively €.5.64 and €4.62.
A LEAST SQUARE REGRESSION MODEL
Dependent Variable: LOGDEXPCOR LOGDEXPMAL Variable Coefficient t-Statistic Coefficient t-StatisticNationality X1 German -0.090053 -1.695282c -0.184179 -2.343157b
X2 French 0.073255 0.717698 -0.319868 -2.112183b
X3 Italian 0.328719 2.733543a -0.143734 -0.826202X4 Spanish -0.090181 -1.119250 0.063838 0.524658X5 Other 0.030779 0.378541 -0.183915 -1.544854Gender

72
X6 Female -0.081251 -1.846944c -0.075997 -1.162309Age X7 < 25 years -0.145713 -1.783208c 0.088022 0.726268X8 26-44 years 0.022548 0.384283 0.015408 0.176938X9 > 64 years -0.024723 -0.478334 -0.006733 -0.087368Accommodation X10 2-Stars Hotel 0.075464 0.846673 0.140619 1.072669X11 4-Stars Hotel -0.013732 -0.293298 -0.045734 -0.664660X12 Other -0.197121 -1.747142c -0.017074 -0.104446Effect of the AI presence X13 No visits in the absence of AI -1.328202 -2.864957a -0.821688 -1.195391X14 > days in the absence of AI -0.123704 -1.310717 0.020035 0.137922X15 Not sure of days 0.000573 0.006553 0.149336 1.165235Repetitions to Mallorca X16 None previous trip 0.204889 2.336749b 0.286602 2.214859b
X17 Two previous trips -0.153571 -2.050339b -0.058465 -0.524123X18 Three previous trips -0.071034 -0.813571 -0.096975 -0.747403X19 Four previous trips -0.041406 -0.358234 -0.147041 -0.821303X20 Above Four previous trips 0.033545 0.423768 0.016291 0.139218X21 None previous AI trip 0.196534 2.260792b 0.375843 2.942769a
X22 Two previous AI trip 0.198892 2.237519b 0.289888 2.209446b
X23 Three previous AI trips -0.351487 3.331147a -0.419348 2.642379a
X24 Four previous AI trips -0.009811 -0.058199 -0.135214 -0.520663X25 No plan to re-visit Mallorca 0.095907 1.227622 0.063838 0.524658X26 No plan for the AI re-visit in Mallorca 0.030779 0.378541 0.123575 1.034305Annual Household Incomes X27 €20000-30000 0.034840 0.623257 0.098259 1.168338X28 €30001-40000 0.125543 1.814164c 0.305991 2.945474a
X29 €40001-50000 0.160336 1.942283b 0.387862 3.157026a
X30 €50001-60000 -0.000175 -0.002009 0.131031 1.019462X31 Above €60000 0.106382 1.331809 0.461377 3.884773a
Quantitative Variables: X32 Days -0.144757 -4.550381a -0.159406 -3.283937a
X33 Days square 0.003927 2.579535a 0.005084 2.198390b
X34 People -0.217694 -5.056432a -0.488175 -7.574145a
X35 People square 0.016097 3.427958a 0.030504 4.298636a
Average Daily Expend. for Reference Group: Constant 5.635086 29.59179 4.618738 15.91678
R-squared 0.392355 0.396785 Mean dependent var 4.310069 2.732104 F-statistic 9.172700 9.344383 Prob(F-statistic) 0.000000 0.000000
aP≤ 0.01 bP ≤ 0.05 cP ≤ 0.1
7.5.1 62BThe Impact of the All-inclusive presence at the destination
The economic impact of all-inclusives can be estimated in many ways. In this study, the impact of
all-inclusives on the Balearic economy has been estimated in terms of the tourism expenditure
that could have been missed in the absence of all-inclusive holiday experience at the destination.
The impact of all-inclusive holidays measured in terms of days, was corresponding to stays that
could have been lost in the absence of AI holiday experience at the destination. In other words,
the stays that have been gained due to the presence of all-inclusive holiday experience at the
destination. There were two questions for the respondents to estimate both, the impact of the
mode presence on the decision to visit and on the length of stay. Figure 8 presents the way in

73
which the two effects were captured in which the obtained results are also summarized. Of the
respondents, 22.3% said that they would not have come, while 15% would have decided
otherwise about the length of stay if there were no all-inclusive holiday experience in Mallorca.
As expressed in Equations 8 to 10 in section 4.4, the length of stay that has been affected
corresponds to summation of days of those, who could not have come (i.e. with ‘no’ response,
considered as a positive effect of AI) and days that could have been reduced (i.e. with ‘less days’
response, a positive effect); while deducting the days that could have been gained, (i.e. with ‘more
days’ response, a negative effect) in the absence of all-inclusive products in Mallorca for each
subsequent visitor unity. After aggregating the expenditure data according to the influence of the
AI presence at Mallorca, the following was revealed, as shown in Table XX. The tourist who
could have come even in the absence of the AI, has in the current trip spent 4.6% more in totally;
has spent 4.3% more in the country of origin, and has also spent 1.7% more in Mallorca. In
contrast, the tourist who could not have come has spent less 6.2% less in totally, 2.7% less in the
country of origin and also 11.8% less in Mallorca. The tourist who was not sure of the decision
he or she would have made in case there were no all-inclusives in Mallorca, has spent 1.6% more
in totally, 1.5% less in the country of origin and 10.2% more in Mallorca. Therefore we can
conclude that, the tourist who could not have come if there were no all-inclusives in Mallorca
was the lowest spender in totally, in the origin as well as in Mallorca. This means that the kind of
Source: Developed in this study
Would you still have come if there were NO all-inclusive products
at a destination? (n=843)
64.1%
Yes
22.3% No
13.6% Not Sure
How long would you have stayed? (m=540)
Not Sure
Same days
More days
Fewer days
All-inclusive
effects 5.6%
85%
4.8%
4.6%
Source: Developed in this study
Fig. 8 Effects of AI presence on the visits and length of stay
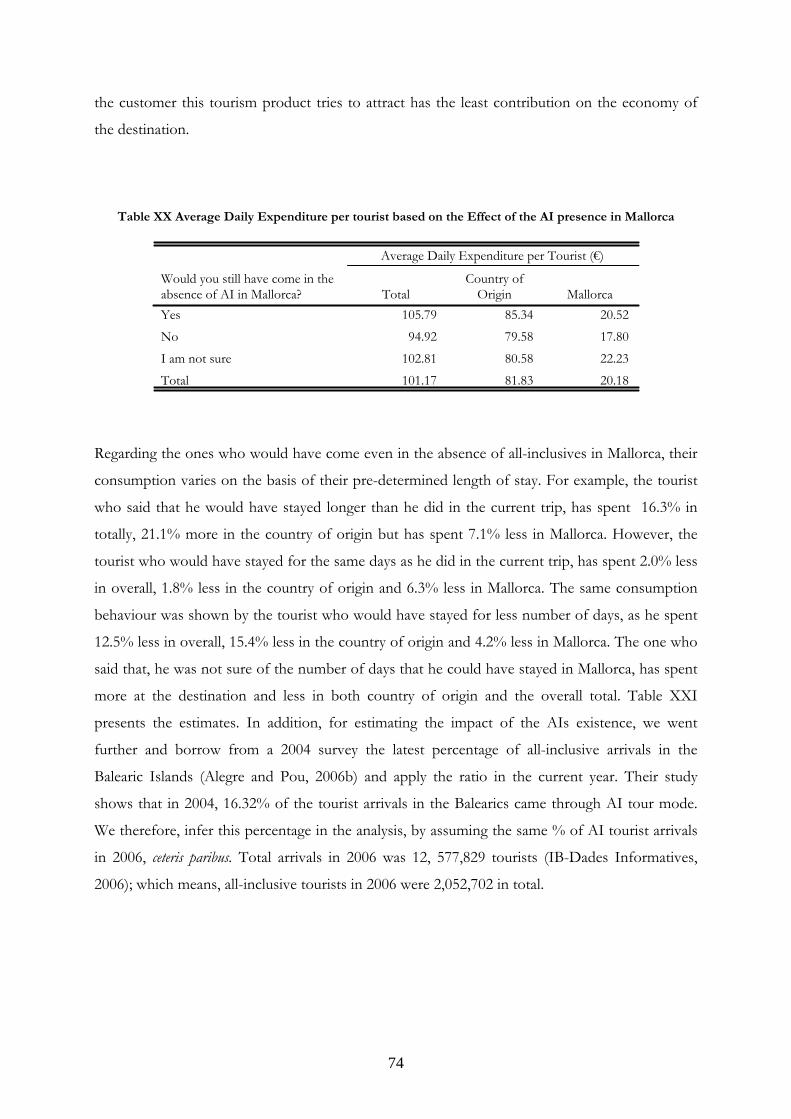
74
the customer this tourism product tries to attract has the least contribution on the economy of
the destination.
Table XX Average Daily Expenditure per tourist based on the Effect of the AI presence in Mallorca
105.79 85.34 20.5294.92 79.58 17.80
102.81 80.58 22.23101.17 81.83 20.18
Would you still have come in theabsence of AI in Mallorca?YesNo
I am not sureTotal
TotalCountry of
Origin Mallorca
Average Daily Expenditure per Tourist (€)
Regarding the ones who would have come even in the absence of all-inclusives in Mallorca, their
consumption varies on the basis of their pre-determined length of stay. For example, the tourist
who said that he would have stayed longer than he did in the current trip, has spent 16.3% in
totally, 21.1% more in the country of origin but has spent 7.1% less in Mallorca. However, the
tourist who would have stayed for the same days as he did in the current trip, has spent 2.0% less
in overall, 1.8% less in the country of origin and 6.3% less in Mallorca. The same consumption
behaviour was shown by the tourist who would have stayed for less number of days, as he spent
12.5% less in overall, 15.4% less in the country of origin and 4.2% less in Mallorca. The one who
said that, he was not sure of the number of days that he could have stayed in Mallorca, has spent
more at the destination and less in both country of origin and the overall total. Table XXI
presents the estimates. In addition, for estimating the impact of the AIs existence, we went
further and borrow from a 2004 survey the latest percentage of all-inclusive arrivals in the
Balearic Islands (Alegre and Pou, 2006b) and apply the ratio in the current year. Their study
shows that in 2004, 16.32% of the tourist arrivals in the Balearics came through AI tour mode.
We therefore, infer this percentage in the analysis, by assuming the same % of AI tourist arrivals
in 2006, ceteris paribus. Total arrivals in 2006 was 12, 577,829 tourists (IB-Dades Informatives,
2006); which means, all-inclusive tourists in 2006 were 2,052,702 in total.
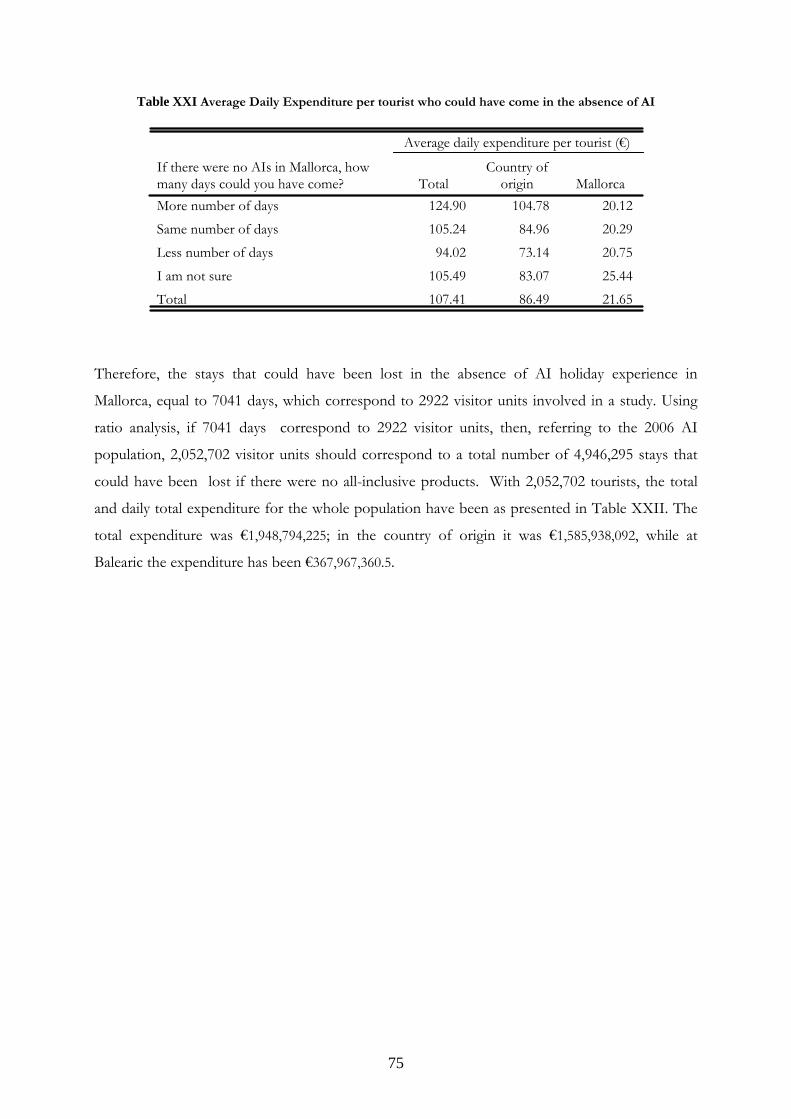
75
Table XXI Average Daily Expenditure per tourist who could have come in the absence of AI
124.90 104.78 20.12105.24 84.96 20.2994.02 73.14 20.75
105.49 83.07 25.44107.41 86.49 21.65
If there were no AIs in Mallorca, howmany days could you have come?More number of daysSame number of daysLess number of days
I am not sureTotal
TotalCountry of
origin Mallorca
Average daily expenditure per tourist (€)
Therefore, the stays that could have been lost in the absence of AI holiday experience in
Mallorca, equal to 7041 days, which correspond to 2922 visitor units involved in a study. Using
ratio analysis, if 7041 days correspond to 2922 visitor units, then, referring to the 2006 AI
population, 2,052,702 visitor units should correspond to a total number of 4,946,295 stays that
could have been lost if there were no all-inclusive products. With 2,052,702 tourists, the total
and daily total expenditure for the whole population have been as presented in Table XXII. The
total expenditure was €1,948,794,225; in the country of origin it was €1,585,938,092, while at
Balearic the expenditure has been €367,967,360.5.
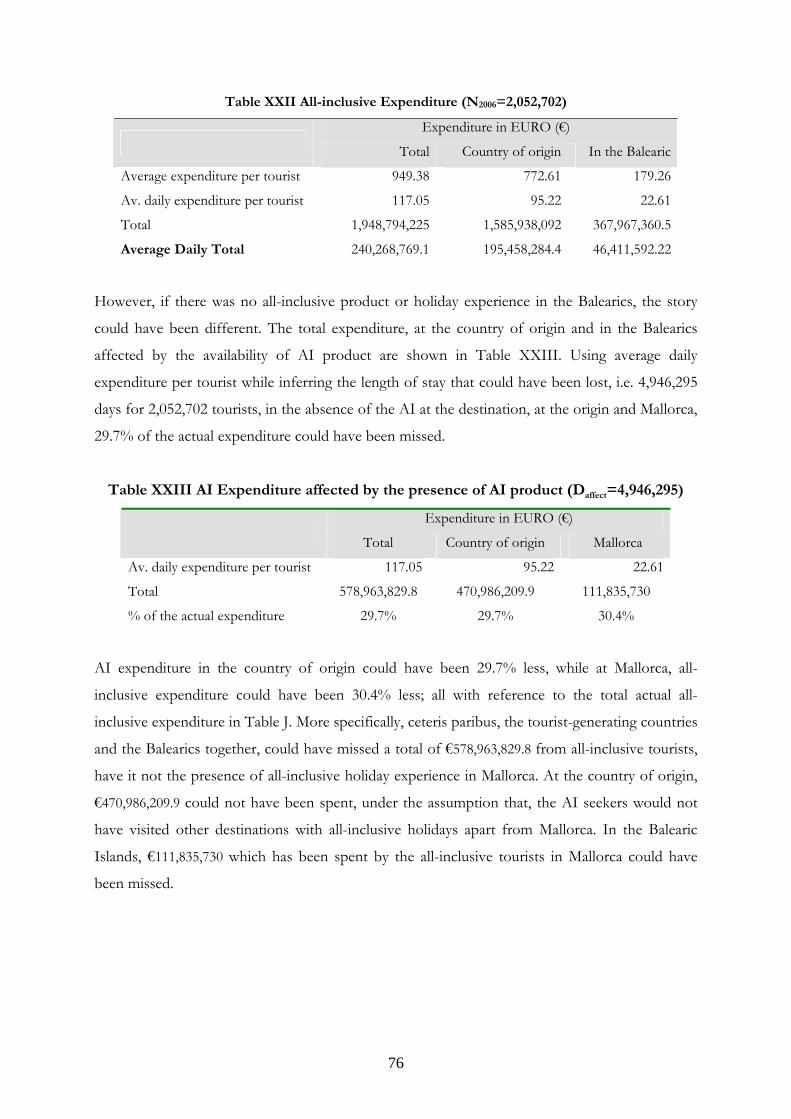
76
Table XXII All-inclusive Expenditure (N2006=2,052,702)
Expenditure in EURO (€)
Total Country of origin In the Balearic
Average expenditure per tourist 949.38 772.61 179.26
Av. daily expenditure per tourist 117.05 95.22 22.61
Total 1,948,794,225 1,585,938,092 367,967,360.5
Average Daily Total 240,268,769.1 195,458,284.4 46,411,592.22
However, if there was no all-inclusive product or holiday experience in the Balearics, the story
could have been different. The total expenditure, at the country of origin and in the Balearics
affected by the availability of AI product are shown in Table XXIII. Using average daily
expenditure per tourist while inferring the length of stay that could have been lost, i.e. 4,946,295
days for 2,052,702 tourists, in the absence of the AI at the destination, at the origin and Mallorca,
29.7% of the actual expenditure could have been missed.
Table XXIII AI Expenditure affected by the presence of AI product (Daffect=4,946,295)
Expenditure in EURO (€)
Total Country of origin Mallorca
Av. daily expenditure per tourist 117.05 95.22 22.61
Total 578,963,829.8 470,986,209.9 111,835,730
% of the actual expenditure 29.7% 29.7% 30.4%
AI expenditure in the country of origin could have been 29.7% less, while at Mallorca, all-
inclusive expenditure could have been 30.4% less; all with reference to the total actual all-
inclusive expenditure in Table J. More specifically, ceteris paribus, the tourist-generating countries
and the Balearics together, could have missed a total of €578,963,829.8 from all-inclusive tourists,
have it not the presence of all-inclusive holiday experience in Mallorca. At the country of origin,
€470,986,209.9 could not have been spent, under the assumption that, the AI seekers would not
have visited other destinations with all-inclusive holidays apart from Mallorca. In the Balearic
Islands, €111,835,730 which has been spent by the all-inclusive tourists in Mallorca could have
been missed.

77
12BCHAPTER EIGHT 13BDISCUSSION AND CONCLUSION
8.1 45BIntroduction This study was triggered by the fact that, all-inclusive holidays have continuously been
maintaining their dominance in many sun and sand destinations. Because AIs rely heavily on
foreign packagers, much of their expenditures remain in the tourist generating countries;
therefore a major threat to tourism-specialized economies. Due to the AI demand growth, the
author was interested to discover factors motivating AIs. Also to reveal the actors who
collaborate or share the AI benefits with the AI hotels at the destination. In that line of thoughts,
the study seeks to analyze the economic impacts of AIs by applying the theoretical part of the
subject into real settings, with special attention given to the economy of the Balearic Islands.
Explicitly the study (a) estimates the contribution of AI tourists to the destination economy; (b)
identifies factors motivating guests to choose AIs and (c) estimate the contribution of AI hotel
sector to the destination economy. The study involves demand and supply sides of the AI
market, which lead to two research phases. The first two objectives (a) and (b) entail Phase One,
through visitor survey; while (c) has involved AI hotels through establishment surveys at the
destination as Phase Two.
8.2 46B Discussions for the Demand-Side Findings
8.2.1 63BExpenditure
Using the data from visitor exit-survey that was conducted in August and September 2006 in
Palma Airport, the results present the interrelationships between, in one part, availability of the
AI product at a destination and the holiday characteristics, decision to visit a destination and
tourism expenditure; in the second part, between holiday characteristics and expenditure; and
between decision to visit a destination and tourism expenditure on the third part. It also
considers the subjective elements of a trip like demographic characteristics of a tourist; as they
together explain the expenditure at the destination but, AI presence at the destination as a
conditional factor. Regarding their travelling characteristics, AI respondents came to Mallorca
specific for vacation purposes. Most of them were accompanied by 2 to 5 people in a group; with
the group of fours dominating. Three-Star hotels were their main accommodation, where
majority could stay for up to 8 days. More than half have visited Mallorca before, mainly once;
whereby more than half had also came through AI arrangements, majority once. Majority were
planning to revisit Mallorca in the future through AI mode.

78
Expenditure was divided into two broad categories: in the country of origin and at Mallorca. The
first category includes transport (return ticket) and accommodation (depending on the tour).
With exception of British, expenditure in 3-star hotel by other nationalities was below the average
totals, which might explain the reasons for the tourist preference of 3-star hotel over other
establishments. However, balancing between expenditure on return ticket and room rate was
noticed. For example German AI tourist who stayed in 3-star hotel spent less in accommodation
than the overall average room rate per German AI tourist; but has paid more on return ticket,
than the overall average air fare for the German AI tourist. Likewise, Italian and Spanish who
stayed in 3-star hotel spent less than overall in accommodation, but spent respectively more than
overall for return tickets. That was not the case for a British tourist who stayed in a 3-Star hotel,
where he spent more than the overall average room rate per British tourist; also on return ticket
spending more than overall average expenditure per return ticket per British AI tourist.
Pertaining to the expenditure in Mallorca, the main part of it went to meals and drinks
(restaurant, cafeteria & bar); retail shopping (souvenirs, gifts, films); entertainment (other
sports and recreational services); communication (telephone, internet, and postal services);
rental vehicle and equipment hire; and others. With regard to the impact of AI holidays,
22.3% of AI respondents said that they would not have come, while 15% would have decided
otherwise about the length of stay if there were no AI holiday experience in Mallorca.
Referring to the inferential population, and assume that in 2006, AI arrivals were the same as
in 2004, then with 1, 874,672 visitor units, a total number of 4,946,295 stays could have been
lost if there were no AI products. Using average daily expenditure per tourist while inferring the
length of stay that could have been lost, i.e. 4,946,295 days for 2,052,702 tourists, in the absence
of the all-inclusive package tours at the destination, at the origin and Mallorca, 29.7% of the
actual expenditure could have been missed.
8.2.2 64BAll-inclusives Loyalty
Moreover, the AIs loyalty was analyzed, bearing in mind that, more repeats signify the consumer
loyalty over the product. It was found that, at least half of respondents have been to Mallorca
before the current trip. The significant intention of re-visits to Mallorca from all respondents was
shown, which communicates the consumer loyalty over the destination; that can be associated
with customer satisfaction of the product which induces the post-purchase decision. We then
examine whether the AI respondents were planning to repeat the AI purchases; also whether the
79
actual not-AI respondents were planning to buy AI tours in the future. Respondent’s nationality,
income, age and gender were then selected to explain repetition for visits and visits through AIs
to Mallorca. The German, British or Spanish respondent was more likely to say that he has
visited Mallorca before the current trip, than the rest of other nationalities. Also Italian
respondent was more likely to say that he has previously bought AI to Mallorca than the
German, British or Spanish respondent. However, the Spanish or German respondent was more
likely to say that he plans to buy AI to Mallorca than British respondent.
Any respondent from a household with the gross annual income of at least €40 000 was more
likely to say that he has previously visited Mallorca; and even with higher frequency than the one
with below €40 000. Also, any respondent with income above €60 000 was more likely to say
that, he does not plan to re-visit Mallorca in the future, than the one with income below €60 000;
and respondent with household income at most €60,000 was more likely to say that he plans to
re-visit Mallorca through AIs than the one with income above €60,000. Respondent with age
above 64 years was more likely to say that he has bought AI to Mallorca, than the one with less
than 64 years; also the respondent with such age was more likely to say that he plans to buy AIs
than the one with fewer than 64 years. Male respondent was likely to say that he has been to
Mallorca before; he has previously bought AIs and even with more frequency than his female
counterpart. Female respondent was more likely to say that she plans to revisit Mallorca than the
male; while male respondent was more likely to say that he plans to buy AIs in the future than the
female respondent.
8.2.3 65BDiscussions for the Supply-Side Findings
8.2.4 66BWorks-in-Progress
Following our research objectives, we still have work-in-progress, including: • The Chapter on Analysis of All-inclusive Motivation, hypothesis testing and development of
modals for the previous analysis.
• The second phase of the research on the local linkages; which will involve the AI hotel sector as
currently operating in the Balearic Islands. The phase comes, while there is distress that many
AI enclaves are operated by global capital through a series of spatial networks; that allow only
limited economic benefits to accrue to the local economies. Undoubtedly, existence of local
linkages will connote the increase of usage of other economic sectors at the destination which
stimulates the economy as a whole and creates synergy effects between different sectors of
80
the economy. Areas of investigation will include procurement from local suppliers;
employment of human and material resources; use of tourism services offered locally;
government revenues; local partnerships and others. However, the author is aware that, in
many tourism-specialized islands, not all supplies are sourced locally due to their inherently
narrow resource base and scarcity related to high population plus multitude of tourist. The
study will disclose the reality. So far 162 AI hotels are in Mallorca, which are our target.
14BREFERENCE
Abdool, A. &Carey, B. (2004). Making All-Inclusive More Inclusive: A Research Project on the
Economic Impact of the All-Inclusive Hotel Sector in Tobago for the Travel Foundation
Aguiló, E., Alegre, J. & Sard, M. (undated). Market structure of the German and British tour
operators’ industry through the analysis of the package tour prices in the Balearic Islands.
Aguiló, E., Alegre, J. & Sard, M. (2002). The Analysis of Tourist Demand as a criteria in
destination positioning. The Persistence of the Sun& Beach tourist modal in the Balearic
Islands. Document de Treball 36
Aguilo, E., Alegre, J. & Sard, M. (2003). The Persistence of the Sun and Sand Tourism Modal,
Tourism Management, pp. 1-13
Aguiló, P., Alegre, J., & Riera, A. (2001). Determinants Of The Price Of German Tourist
Packages On The Island Of Mallorca. Tourism Economics, 7(1), 59-74.
Alegre, J. & Juaneda, N. (2006). Destination Loyalty: Consumers’ Economic Behaviour. Annals of
Tourism Research, 33(3): 684-706
Alegre, J. & Pou, L. (2006). El Paquete Turístico de Todo Incluido: Un análisis de sus
implicaciones económicas para el caso de las Islas Baleares
Anderson, B. & Langmeyer, L. (1982). The Under-50 and Over-50 Travellers: A Profile of
Similarities and Differences. Annals of Tourism Research, 22: 338-348.
Armoogum, J., & Madre, J. (2003). Weighting and Correcting Long- Distance Travel Surveys.
Capturing Long-Distance Travel, edited by K. Axhausen, J. Madre, J. Polak, and P. Toint. Baldock,
Great Britain: Research Studies Press Ltd, pp. 151–69.
Balearic Institute of Statistics, Hhttp://www.caib.es/ibae/dades/ingles/turisme.htmH. accessed on
November, 2006
Basala, S. & Klenosky, D. (2001). Travel Style Preferences for Visiting a Novel Destination: A
Conjoint Investigation Across the Novelty-Familiarity Continuum, Journal of Travel Research, 40
(2), 172-182.
81
Belisle, F. (1984). Tourism and food imports: the case of Jamaica, Economic Development and
Cultural Change, Vol. 32 No.4, .
Benavides, D. (2001). The Sustainability of International Tourism in Developing Countries.
Paper presented at the seminar on Tourism Policy and Economic Growth, Berlin, 6-7 March
2001.
Beyers, W. (1976). Empirical Identification of Key Sectors: Some Further Evidence.
Environment and Planning, 8 (2): 231-236.
Bieger, T., & Laesser, C. (2002). Market Segmentation by Motivation: The Case of Switzerland,
Journal of Travel Research, 41, August: 68-76
Bogari, N.B, Crowther, G., and Marr, N., (2004). Motivation for Domestic Tourism: a Case Study
of the Kingdom of Saudi Arabia. In Crouch, G.I., Perdue, R.R., Timmermans, H. & Uysal, M.,
(ed), Consumer Psychology of Tourism, Hospitality and Leisure , (3):51-63, Wallingford, CABI.
Bowen, D. (2002). Research through Participant Observation in Tourism: A Creative Solution to
the Measurement of Consumer Satisfaction/Dissatisfaction (CS/D) among Tourists. Journal of
Travel Research, 41 (1): 4–14.
Bowen, R.., Cox, L., Fox, M. (1991). The interface between tourism and agriculture, Journal of
Tourism Studies, 2 (2):43-54.
Brackenbury, M. (2004). Has Innovation Become A Routine Practice That Enables Companies
To Stay Ahead Of The Competition In The Travel Industry?
Britton, S. (1983). Tourism and Underdevelopment in Fiji in Development studies centre
Monograph no. 31, Canberra: The Australian National University.
Buhalis, D. (2000). Relationships in the Distribution Channel of Tourism: Conflicts between
Hoteliers and Tour Operators in the Mediterranean Region. International Journal of Hospitality and
Tourism Administration, 1 (1): 113-39.
Bull, P. (1997). Mass tourism in the Balearics islands: An example of concentrated dependence’ in
Island tourism: trends and prospects, London
Burd, M. (1991). “The Economic Impact of Tourism Industries in B.C.” Draft, unpublished
manuscript, British Columbia Ministry of Development, Trade and Tourism, Canada,
September 27. AUGUST 2006
Buswell, R. (1996). Tourism in the Balearics islands in Towner, M. and Newton, M. eds. Tourism
in Spain: Critical Issues. Wallingford: CAB International pp.309-339
Cai, J., Leung, P. & Mak, J. (undated). Tourism’s Forward and Backward Linkages. University of
Hawaii at Manoa
82
Carlsen, J. (1995). Gathering Information: Meetings and Conventions Sector Research in
Australia Journal of Tourism Studies, 6 (2): 21–29.
Cavanagh, C., McDougall, R. & Burd, M. (1992). British Columbia Tourism GDP, 1981-1991:
Methodology Victoria, BC: British Columbia Ministry of Finance and Corporate Relations
Central Companies Directory (1999). INE National Statistical Institute (Spain)
Cha, S., McCleary, K. & Uysal, M. (1995). Travel Motivations of Japanese Overseas Travellers: A
Factor-Cluster Segmentation Approach Journal of Travel Research, 33 (1): 33-39.
Cheung, C. & Law, R. (2001). Determinants of tourism hotel expenditure in Hong Kong
International Journal of Contemporary Hospitality Management, 13(3): 151-158
Chhabra, D., Sills, E. & Cubbage, F. (2003). The Significance of Festivals to Rural Economies:
Estimating the Economic Effects of Scottish Highland Games in North Carolina. Journal of
Travel Research, 41: 421–27.
Church, D. (1969). A Proposed Modal for Estimating and Analyzing Travel Expenditures Journal
of Travel Research, 8 (1): 1–6.
Cladera, M. (2006). ¿Un Nuevo modalo turistico con soluciones fordista? El caso de las Islas
Baleares
Clark, J. (1988). Spain and the Balearics Islands: National Report no.146’ International Tourism
reports, 1. London: Economist Intelligent Unit, pp.5-28
Clark, J. (2000). The art of all-inclusive vacation deals: a Caribbean comparison of resorts vs.
cruises, USA Today,
Cochran, W. (1977). Sampling Techniques. New York: John Wiley & Sons.
Cohen, E. (1972). Toward a Sociology of International Tourism. Social Research, 39 (1): 164-82.
Comissió Experts “tot inclos” (Desembre 2005). “Conclusions de l’informe elaborat per la
comissio d’experts per a l’estud i el seguiment del TOT” Informe final
Commission of the European Communities, International Monetary Fund, Organisation for
Economic Co-operation and Development, United Nations, and World Bank (1993). System of
National Accounts 1993, New York: United Nations.
Conselleria d’Economia, Hisenda i Innovació, Direcció General de Recerca, Desenvolupament
Tecnològic i Innovació: GOVERN DE LES ILLES BALEARS (undated). RepartiЯ,
Andalucía, Aquitaine, Catalunya, Galicia, Illes Balears, Região Lisboa e Vale do Tejo, Midi-
Pyrénées, Região Norte do Portugal et País Vasco.
Conselleria de Turisme, Govern de les Illes Balears (2003). Resumen campaña todo incluido,
Octubre.

83
Conselleria de Turisme, Govern de les Illes Balears (2004-2006). Establiments Detectats de TOT
INCLOS 2004, 2005, 2006 (October, 2004 ; September, 2005; May, 2006)
Conselleria de Turisme, Govern de les Illes Balears (2006a). Anàlisis del tot inclòs, # 10.4
Conselleria de Turisme, Govern de les Illes Balears (2006b). Establiments Exclusius de TOT
INCLOS 2006
Conselleria de Turisme, UIB (2006). Despesa turística (preus corrents)
Corcoran, M., Gillmor, D. & Killen, J. (1996). An analysis of summer sun tourists - outbound
package holidays from Dublin Airport, Irish Geography, 29(2), 1996, 106-115.
Crompton, J. (1979). Motivations of Pleasure Vacation, Annals of Tourism Research, 6 (4): 73-86.
Crompton, J., & McKay, S. (1997). Motives of Visitors Attending Festival Events, Annals of
Tourism Research, 24 (2): 425-39.
Crompton, J., Lee, S. & Shuster, T. (2001). A Guide for Undertaking Economic Impact Studies:
The Springfest Example, Journal of Travel Research, 40 (August): 79–87.
Culpan, R. (1987). International Tourism Modal for Developing Economies Annals of Tourism
Research, (14) 541-552.
Cuthbertson, K., Hall, S., & Taylor, M. (1992). Applied Econometric Techniques. Philip Allan
Daniels, M.., Norman, W. & Henry, M. (2004). Estimating Income Effects of a Sport Tourism
Event, Annals of Tourism Research, 31 (1): 180–99.
Dann, G. (1977). Anomie, Ego-Enhancement, and Tourism, Annals of Tourism Research, 4 (4):
184-94.
Dattilo, B., Perez, M. & Simeoni, G. (2004). An integrated information system on survey quality:
the experience of the Italian survey ‘Holidays and trips’, Italian National Statistical Institute.
7TH INTERNATIONAL FORUM ON TOURISM STATISTICS, “For Usability,
Comparability and Sustainability” Stockholm 9-11 June, 2004
Davidson-Peterson Associates (2006). The Economic Impact Of Expenditures By Travellers On
Wisconsin Calendar Year 2005, Highlight Summary. A Division Of Digital Research, Inc.
March, 2006.
Davis, J. & Morais, D. (2004). Factions and Enclaves: Small Towns and Socially Unsustainable
Tourism Development. Journal of Travel Research, 43 (1): 3–10.
Demaris, A. (1992). Logit Modelling: Practical Application. Series: Quantitative Applications in the Social
Sciences, Sage University Paper
Diari de Balears (Dimarts, 23 de Maig del 2006). Les arribades de turistes alemanys i britanics
caucen el primer cuadrimestre, pp. 3
84
Dieke, P.(1993). Tourism and development policy in the Gambia, Annals of Tourism Research, (20):
423-49.
Drejer, I. (2002, 2003). Input-Output Based Measures of Inter-industry Linkages Revisited.
Centre for Economic and Business Research, Denmark
Eakin, K. & Faruqui, A., (2000). Bundling Value-Added and Commodity Service in Retail
Electricity Markets, The Electricity Journal, pp.60-68
El Mundo/El día de Baleares (23 de Mayo de 2006). 162 hoteles de Baleares ofertaran ‘todo
incluido’, 19 menos que en 2005, pp.17
Enoch, Y. (1996). Contents of tour packages: A cross-cultural comparison. Annals of Tourism
Research, 23: 599-616.
Essex, S., Kent, M., and Newnham, R., (2004). Tourism Development in Mallorca: Is Water
Supply a Constraint? Journal of Sustainable Tourism, 12(1), 4-28
Eurostat and Directorate-General XXIII of the European Commission, (1998). Community
methodology on tourism statistics, Office for Official Publications of the European Communities
Falzon, J. (2003). The Competitive Position Of Mediterranean Counties In Tourism: Evidence
From The Thomson Brochure
Fodness, D. (1994). Measuring Tourist Motivation, Annals of Tourism Research, 21 (3): 555-81.
Foster, G. M. (1986). South Seas Cruise: A Case Study of a Short-lived Society, Annals of Tourism
Research 13: 215–38.
Frechtling, D. (1994a). Assessing the Impacts of Travel and Tourism— Measuring Economic
Benefits. Travel, Tourism, and Hospitality Research: A Handbook for Managers and Researchers, 2nd ed.,
edited by J. R. Brent Ritchie and Charles R. Goeldner. New York: John Wiley & Sons, pp. 367–
91.
Frechtling, D. (1994b). Tourism Economic Impact Modals. Tourism Marketing and Management
Handbook, 2nd ed., edited by Stephen F. Witt and Luiz Moutinho. Englewood Cliffs, NJ:
Prentice-Hall, pp. 488–96.
Frechtling, D. (2006). An Assessment of Visitor Expenditure Methods and Modals. Journal of
Travel Research, 45: 26-35
Freitag, T. (1994). Enclave Tourism Development: For Whom the Benefits Roll? Annals of
Tourism Research, 21(2): 538-554
Freyer, W. (1997). Tourism Marketing. Munich: Oldenbourg.
Fuller, A. (1999). Tourism Development in the Dominican Republic: Growth, Costs, Benefits
and Choices. Rutgers Universit. HUhttp://kiskeya-alternative.org/publica/afuller/rd-tourism.htmlUH.
Accessed in November, 2006
85
Galloway, G. (1998). Motivations for Leisure Travel: A Critical Examination. In Progress in Tourism
and Hospitality Research, proceedings of the 8th Australian Tourism and Hospitality Research
Conference, edited by B. Faulkner, C. Tideswell, and D. Weaver. Canberra, Australia: Bureau of
Tourism Research: 99-108
Garcia, C., Servera, J., (2003). Impacts of tourism development on water demand and beach
degradation at the island of Mallorca (Spain). Geografiska Annaler 85A (3-4), 287-300.
George Washington University (1997). BADM-197 - Strategy Formulation and Implementation:
A Strategic Audit on Club Med: Available in
Hhttp://www.gwu.edu/~crn40013/strataud/ClubMed.htmH. Accessed March, 2006
Getz, Donald (1994). Event Tourism: Evaluating the Impacts. Travel, Tourism, and Hospitality
Research: A Handbook for Managers and Researchers, 2nd ed., edited by J. R. Brent Ritchie and
Charles R. Goeldner. New York: John Wiley & Sons, pp. 437–50.
Gitelson, R. & Kerstetter, D. (1990). The Relationship between Socio-demographic Variables,
Benefit Sought and Subsequent Vacation Behaviour: A Case Study. Journal of Travel Research,
28 (2): 24-29.
Gnoth, J. (1997). Tourism Motivation and Expectation Formation, Annals of Tourism Research,
24(2): 283-304
Godwin, H. (2004). The Poverty Angle of Sun, Sea and Sand – Maximising Tourism’s
Contribution, Background Paper, Only connect!, E.M. Forster
Goodwin, H. and Bah, A (2003). Improving Access for the Informal Sector to Tourism in The
Gambia, PPT Partnership Working No. 15 www.propoortourism.org.uk/15_Gambia.pdf .
Accessed July, 2006
Govern de les Illes Balears (2002). ‘Incoming tourists by plane’ In: G. des Illes Balears, Dades
informative. p.20
Govern de les Illes Balears (GIB, undated). Practical Guide for Business and Investment in the
Balearics HUwww.investinbalearics.comUH, downloaded at:
HUhttp://investinbalearics.caib.es/en/manual/manual_en.pdf UH in May 12th, 2006.
Guiltinan J. (1987). The Price Bundling of Service, Journal of Marketing, 51:74-85
Haynes, L. (1975). A Known and Equal Chance. Sixth Annual Conference Proceedings. Salt Lake City,
UT: The Travel Research Association, pp. 95–97.
Hebden, J. (1983). Applications of Econometrics. Philip Allan
Hemmati, M. & Koehler, N. (2000). Financial Leakages in Tourism, Sustainable Travel & Tourism.
pp25-29
86
Henthorne, T. & Miller, M (2003). Cuban Tourism in the Caribbean Context: A Regional Impact
Assessment. Journal of Travel Research, (42)84-93
Heung, V. & Chu, R. (2000). Important Factors Affecting Hong Kong Consumers’ Choice of a
Travel Agency for All-Inclusive Package Tours. Journal of Travel Research, Vol. 39, August 2000,
52-59
Holloway, C. (1998). The Business of Tourism, 5th edition, Addison Wesley Longman Ltd.,
Singapore.
Holloway, J. (2000). Tour. In: J. Jafari, Ed. The Encyclopedia of Tourism. London: Routledge,
582-583.
Horneman, L., Carter, R.., Wei, S. & Ruys, H. (2002). Profiling the senior traveller: An Australian
perspective’, Journal of Travel Research, (41): 23–27.
Hoti, S., Mcaleer, M., Sansó, A. (2005). Specialization, Diversification and Segmentation of
British and German Tourists to the Balearic Islands, Proceedings of the 2005 International
Conference on Simulation and Modaling V. Kachitvichyanakul, U. Purintrapiban, and P.
Uthayopas, Eds.
Hoti, S., McAleer, M. & Sanso, A. (undated). Modalling the Predictable Uncertainty in British and
German Tourist Arrivals to the Balearic Islands
Hsieh, S., J. T. O’Leary, J & Morrison, A. (1994). A Comparison of Package and Non-Package
Travellers from the United Kingdom, Journal of International Consumer Marketing, 6 (3-4): 79-100.
Hyde, K. & Lawson, R, (2003). The Nature of Independent Travel. Journal of Travel Research, 42
(1): 13-23.
Illes Balears-Dades Informatives (1999-2006). El Turisme a les Illes Balears
Inskeep, E. (1991). Tourism Planning: An Integrated and Sustainable Development Approach.
New York: John Wiley.
Instituto de Estudios Turísticos (2004). Movimientos Turísticos en Fronteras (Frontur)
Instituto Nacional de Estadística (2006). Encuesta de Ocupación hotelera 2004, Servicio-Hostelera y
Turismo,
Ioannides, D. & Debbage, K. (1998). Neo-Fordism and Flexible Specialization in the Travel
Industry: Dissecting the Polyglot. The Economic Geography of the Tourist Industry: A Supply-Side
Analysis. London pp. 99–122
Issa, J. & Jayawardena, C. (2003). The “all-inclusive” concept in the Caribbean, International Journal
of Contemporary Hospitality Management, 15(3), 167-171
Jacob, M., Tintoré, J., Aguiló, E., Bravo, A. and Ulet, J.M. (2003). ‘Innovation in the tourism
sector: results from a pilot study in the Balearic Islands’, Tourism Economics, 9(3): 279-295.
87
Jayawardena, C. (2002). Mastering Caribbean tourism, International Journal of Contemporary
Hospitality Management, 14 (2), 88-93
Juaneda, C. & Sastre, F. (1999). Balearic islands tourism: a case study in demographic
segmentation, Tourism Management 20, 549-552
Juaneda, C. (1996). Estimating the probability of return visits using a survey of tourist
expenditure in the Balearic Islands. Tourism Economics, 2(4)339-352
Juaneda, C. and Aguiló, E., (2000) Tourist Expenditure Determinants in a Cross-Section Data
Modal, University of Balearic Islands, Spain
Judge, G., Hill, R., Griffiths, W., Lutkepohl, H., & Lee, T. (1982). Introduction to the Theory and
Practice of Econometrics. Wiley Series in Probability & Mathematical Statistical
Kaosa-ard, M. (2005). Tourism: Blessings for All? The Workshop on “Mekong Tourism:
Learning Across Borders” Social Research Institute, Chiang Mai University
Karammel, S. and Lengefeld, K. (2005). Can all-inclusive tourism be pro-poor? HUhttp://www.id21.org/insights/insights62/art05.htmlUH
Keng, K. & Cheng, J. (1999). Determining Tourist Role Typologies: An Exploratory Study of
Singapore Vacationers. Journal of Travel Research, 37 (May): 382-90.
Kim, D., Spots, D. & Holecek, D. (1998). A Comparison of Estimates of Statewide Pleasure Trip
Volume and Expenditures Derived from Three Household Surveys. Travel Research Roundup: Branding
the Travel Market, 29th Annual Conference Proceedings. Lexington, KY: Travel and Tourism
Research Association, pp. 109–19.
Kubas, A., Yilmaz, F., Aktas, Y. & Metin, N. (2005). Analysis of Visitor Decision Making System
when visiting Natural Recreation Sites by Multinomial Logit Model. Quality & Quantity, 39: 615-
623
Laing, A.(1987). The package holiday: Participant, choice and behaviour. Ph.D. Thesis. Hull
University.
Lee, T., & Crompton, J. (1992). Conceptualizing and Measuring Novelty seeking in tourism.
Annals of Tourism Research, 19, 732-751.
Lian, J., & Denstadli, J. (2003). “How Reliable Are Household Surveys for the Description of Air
Travel?” In Capturing Long-Distance Travel, edited by K. W. Axhausen, J., Madre, J., Polak, W.
& Toint B., Great Britain: Research Studies Press Ltd., pp. 110–19.
Lovejoy, K. (2003). Putting out the Welcome Mat. Regional Review, 13 (2): 6–8.
Lundgren, J. (1975) Tourist penetration/ the tourist product/entrepreneurial response. Tourism as
a Factor in National and Regional Development. Occasional Paper No. 4, Department of Geography,
Trent University, Peterborough.

88
Madden, J. (2002). The Economic Consequences of the Sydney Olympics: The CREA/Arthur
Andersen Study. Current Issues in Tourism, 5 (1): 7–21.
Madre, J. & Maffre, J. (2001). Is it Necessary to Collect Data on Daily Mobility and Long-
Distance Travel in the Same Survey? Personal Travel: The Long and the Short of It, Conference
Proceedings June 28–July 1, 1999. Washington, DC: Transportation Research Board, pp. 343–
64.
Mak, J., Moncur, J. & Yonamine, D. (1977). How or How Not to Measure Visitor Expenditure.
Journal of Travel Research, 16 (1): 1–4.
Mamoozadeh, A. & McKEE, D. (1990) Development Through Tourism, Tijdschrift voor Economie
en Management, XXXV, 2, 1990
Manente, M. & Minghetti, V.(1998). The Collection of International Tourism Expenditure
Statistics on Open Area: Methodology and Applications. The Case of the Veneto Region.
Tourism and Hospitality Management, 4 (1): 93–106.
Mankila M., (2001). Essay on Strategic Price Bundling in Retail Banking, DocuSys the authors
Goteborg AB, pp. 13-40
Mansfield, Y. (1992). From Motivation to Actual Travel. Annals of Tourism Research, 19(3): 339-419
Maslow, A. (1954). Motivation and Personality. New York: Harper.
Maslow, A. (1970). Motivation and Personality. New York: Harper and Row
Mayo, E., & Jarvis, P. (1981). The Psychology of Leisure Travel. Boston: CBI.
Mbaiwa, J. (2000). The Impacts of Tourism in the Okavango Delta in North-west Botswana. A
Paper Presented at a Workshop on Climate Change, Biodiversity, Multi-Species Production
Systems and Sustainable Livelihoods in the Kalahari Region, Maun Lodge, Botswana, 1-13
October 2000.
Mbaiwa, J. (2005). Enclave tourism and its socio-economic impacts in the Okavango Delta,
Botswana. Tourism Management, 26: 157-172
McClelland, D. (1965). Achievement Motivation Can Be Developed. Harvard Business Review, 43
(6): 6-24.
Meaurio, A. and Murray, I. (2001). Indicators of Sustainable Development in tourism: The case
of the Balearic Islands, Conference on Sustainable Development and Management of
Ecotourism in Small Island Developing States (SIDS) and Other Small Islands, Preparatory
Conference for the International Year of Ecotourism, 2002, Mahé, Seychelles, 8-10 December
2001
Meyer, D. (2003). The UK Outbound Tour Operating Industry and Implications for Pro-Poor
Tourism, PPT Working Paper No. 17

89
Meyer, D. (2006). Caribbean tourism, local sourcing and enterprise development: Review of the
literature. PPT Working Paper No. 18 HUhttp://www.propoortourism.org.uk/18_domrep.pdfUH. Accessed
October, 2006
Middleton, V. (1991). Whither the Package Tour? Tourism Management, 12: 185-92.
Middleton, V. (1994). Marketing in travel and tourism (2nd ed.). Oxford: Butterworth Heinemann.
Mihalic, T.(2002). Tourism and Economic Development Issues. Tourism and Development:
Concepts and Issues, edited by Richard Sharpley and David J. Telfer. Clevedon. UK: Channel
View Publications, pp. 81–111.
Mill, R., &. Morrison, A. (1985). The Tourism System: An Introductory Text. Englewood Cliffs, NJ:
Prentice-Hall.
Mitchell, J. & Page, S. (2005). Linkages and leakages: Local supply and imports, Overseas
Development Institute, 111 Westminster Bridge Road, London SE1 7JD
Mitchell, J. and Page, S. (2005) Linkages and leakages Local supply and imports HUhttp://www.id21.org/insights/insights62/art04.htmlU
Mitchell, J. (2006). Linkages and leakages: local supply and imports, HUOverseas Development
Institute, UKUH. HUhttp://www.id21.org/society/insights62art4.htmlUH. Accessed in
Momsen, J. (1986). Linkages between Tourism and Agriculture: Problems for the Smaller
Caribbean Economies. Department of Geography Seminar Paper 45, University of Newcastle.
Morrison, A. (1989). Hospitality & Tourism Marketing. New York: Delmar Publishers.
Morrison, A., Hsieh, S. & O’Leary, J. (1993). Travel Arrangement Classifications for European
International Travellers. Spoilt for Choice: Decision Making Processes and Preference Changes of Tourists:
Proceedings of the Institute of Tourism and Service Economics International Conference,
November, University of Innsbruck, edited by R. V. Gasser and K. Weiermair. Thaur,
Germany: Kulturvel, pp. 221-35.
Moscardo, G. & Pearce, P (1986). Historical Theme Parks: An Australian Experience in
Authenticity. Annals of Tourism Research, 13(3), 467-479
Mules, R. (1999). Estimating the Economic Impact of an Event on a Local Government Area,
Region, State or Territory. Occasional Paper No. 28: Valuing Tourism Methods and
Techniques, edited by Kristine Corcoran. Canberra, Australia: Bureau of Tourism Research.
Mules, R.(1998). Decomposity of Australian Tourist Expenditure. Tourism Management, 19(3), 267
– 271.
Murphy, P.E. (1985). Tourism: A Community Approach. London: Routledge.
Office of Travel and Tourism Industries (2004). In-Flight Survey of International Air Travellers.
Washington, DC: U.S. Department of Commerce.

90
Oppermann, M (1993). Tourism Space in Developing Countries, Annals of Tourism Research, (20):
535-556.
Organization for Economic Co-operation and Development (1996). OECD Tourism Statistics,
OECD January, 1996
Ortolani, G. (2000). Revision of the Collection Systems for the Travel Item in the Balance of
Payments of the European Member States following Stage Three of the European Monetary
Union. Tourism Satellite Account (TSA) Implementation Project: Enzo Paci Papers on
Measuring the Economic Significance of Tourism, vol. 1. Madrid, Spain: World Tourism
Organization.
Overseas Development Institute (ODI, 2005). Doing Business Differently in Tourism: How
tourism companies can stimulate local enterprise? ODI Research Groups and Programs.
HUhttp://www.odi.org.uk/speeches/tourism_sept05/index.html. Accessed in July 2006U
Overseas Development Institute (ODI, 2006). Tourism business and the local economy:
increasing impact through a linkages approach. ODI Briefing Paper, March HUwww.odi.org.ukUH Accessed on
October, 2006
Palmer, R. (1979). Caribbean Dependence on the United States Economy, Praeger Publishers, New York.
Palomino, L. (2003). Impacts of Mass Tourism on Local Communities and the New
Phenomenon Of Colonization, Case Study: Majorca, Master Of Arts European Tourism
Management Bournemouth University
Parrilla, J., Riera, A., and Nada, J. (2006). Specializing in Tourism and Long-term Growth:
Evidence from the Balearic and the Canary Islands, Documents de Treball 2006/3
Pattullo, P. (1996). Last Resorts: The Costs of Tourism in the Caribbean. Cassell.
Pattullo, P. (2000). The Problems of Two aspects of Intensive Tourism (Cruise and all-inclusives)
in the Caribbean. Calpe 2000: Linking the Fragments of Paradise
Pearce, P. (1993). Fundamentals of Tourist Motivation. Tourism Research: Critiques and Challenges,
ed. by D. Pearce and R. Butler. London: Routledge and Kegan Paul: 85-105.
Pearce, P. & Caltabiano, M. (1983). Inferring Travel Motivation from Travellers’ Experiences.
Journal of Travel Research, 22 (2): 16- 20.
Pearce, P. (1991). Dreamworld: A Report on Public Reactions to Dreamworld and Proposed
Developments at Dreamworld. A Report to Ernst and Young on Behalf of the IOOF in Conjunction with
Brian Dermott and Associates. Townsville, Australia: Department of Tourism, James Cook
University.
Pearce, P., & Lee, U., (2005). Developing the Travel Career Approach to Tourist Motivation.
Journal of Travel Research, 40, February: 226-237
91
Pearce, P., Morrison, A. & Rutledge, J. (1998). Tourism: Bridges across Continents. Sydney: McGraw-
Hill, Chapter 2, Motivational influences in tourism demand
Philips, R. & Webster, S. (1983). Group Travel. New York: Van Nostrand Reinhold.
Plog, S. (1973). Why Destination Areas Rise and Fall in Popularity. Cornell Hotel & Restaurant
Administration Quarterly, (November): 13-16.
Poon, A. (1993) Innovation and the future of Caribbean Tourism: The new versus the old.
Tourism and Marketing in the Caribbean. D. J. Gayle and J. N. Goodrich (eds.). London: Routledge.
129-142.
Poon, A. (1998). All-inclusive Resorts, Economic Intelligence Unit, Travel and Tourism Analyst
Pou, L. & Alegre, J. (2002). The Determinants of the Probability of Tourism Consumption: An
Analysis with a Family Expenditure Survey. Document de Treball 39
PPT (2006b). Making Tourism Count for the Local Economy in the Caribbean. Guidelines for Good
Practice. PPT, April
Pro-Poor Tourism Partnership and the Caribbean Tourism Organisation (PPT, 2006a). Boosting
local inputs into the supply chain. Business Implementation of Pro Poor Tourism: Case Study Brief, No.
2. HUhttp://www.pptpilot.org.za/Briefing%20papers/paper2.pdf . Accessed in July 2006U
Quiroga, I. (1990). Characteristics of package tours in Europe. Annals of Tourism Research, 17(2),
185-207
Reid, A. (1992). Reflections. Waiting for Colombus. The New Yorker, 24 February, 57–75
Ritchie, J. & Brent, R. (1975). Some Critical Aspects of Measurement Theory and Practice in
Travel Research. Journal of Travel Research, 14 (1): pp. 1–10.
Rovelstad, J. (1994). Modal Building and Simulation. Travel, Tourism, and Hospitality Research: A
Handbook for Managers and Researchers, edited by J. R. Brent Ritchie and Charles R. Goeldner. New
York: John Wiley & Sons, pp. 503–12.
Ryan, C. (1995). Researching Tourist Satisfaction – Issues, Concepts, Problems. London
Rylander, R., Propst,D. & McMurtry, T. (1995). Nonresponse and Recall Biases in a Survey of
Traveller Spending. Journal of Travel Research, 33 (4): pp. 39–45.
Sanders, T., Beard, S. Levesque, D. & Smith III, G. (1993). A New Index for Tourism: The Case
of Maine and the Canadian Provinces. Journal of Travel Research, 32 (2): 49–53.
Sard, M., Aguilo, E., & Alegre, J. (2002). Analysis Of Package Holiday Prices in the Balearic
Islands, Document de Treball, 40.
Schmidt, C. (1979). The guided tour: Insulated adventure. Urban Life, 7(4), 441-467
Schuchat, M. (1983). Comforts of group tours. Annals of Tourism Research, 10(4):465-477.

92
Shareef, R. and McAleer, M. (2005). “Modaling the uncertainty in monthly international tourist
arrivals to the Maldives” Tourism Management, July, pp. 1-23
Shaw, G., & Williams, A. (1994). Critical Issues in Tourism: A Geographical Perspective. Oxford, UK:
Blackwell.
Sheldon, P. & Mak, J. (1987). The demand for package tours: A mode choice modal. Journal of
Travel Research, 25(3), 13-17.
Sheldon, P. (1990). A Review of Tourism Expenditure Research. Progress in Tourism, Recreation and
Hospitality Management, vol. 2, edited by C. Cooper. London: Belhaven Press, pp. 28–49.
Sheldon, P. (1993). Forecasting Tourism: Expenditures versus Arrivals. Journal of Travel Research,
32 (1): 13–20.
Singh, T. (1989). The Kullu Valley - Impact of Tourism Development in Mountain Areas, New
Delhi: Himalyan Publication.
Sirakaya, E., Uysal, M. & Yoshioka, C., (2003). Segmenting the Japanese Tour Market to Turkey.
Journal of Travel Research, 41, February: 293-304
Smith, S. (1995) Tourism Analysis: A handbook, 2nd Ed, Longman Group Limited
Smith, S. (2000). New Developments in Measuring Tourism as an Area of Economic Activity,
Trends in Outdoor Recreation, Leisure and Tourism, edited by W. C. Gartner and D. W. Lime.
New York: CAB International, pp. 225–34.
Smith, V., ed. (1989). Host and guests: The anthropology of tourism (2nd edition). Philadelphia:
University of Pennsylvania Press.
Spinrad, B. (1982). ‘St Lucia’ in S. Seward and B. Spinrad, Tourism in the Caribbean: The Economic
Impact, Ottawa: International Development Research Centre.
Steves, R. (2000). Bus Tour Self-Defence All-Inclusive Tours Can Be Great Bargains Hhttp://www.transitionsabroad.com/publications/magazine/0009/rick_steves_bus_tour_self-defense.shtml
Stewart, D., (1984). Secondary Research: Information Sources and Methods, Sage Publications, Beverly
Hills, CA.
Stynes, D. (1997). Economic Impacts of Tourism: A Handbook for Tourism Professionals: Tourism
Research Laboratory at the University of Illinois at Urbana-Champaign
Stynes, D. (2002). Michigan Statewide Tourism Spending and Economic Impact Estimates 1998-
2000, Working Draft
Tasci, A., Aziz, A., & Holecek, D. (2003). Characteristics and Potential of Midwestern Package
Travellers, Proceedings of the Travel and Tourism Research Association 34th Annual Conference. Boise, ID:
Travel and Tourism Research Association.
Titanont, A., and Chantradoan, N.(2004). Packaging Phuket: Focusing on Price bundling,
Travelling trends of the Swedish target market, Master Thesi, Göteborg University

93
Tolman, E. (1959). “Principles of Purposive Behaviour.” In Psychology: A Study of a Science, vol. 2,
edited by S. Koch. New York: McGraw-Hill: 92-157
Tomas Cook, Summer Brochure, 2006
Torres, R. (2002). Cancun’s Tourism Development From A Fordist Spectrum Of Analysis.
Tourism Studies, 2(1) 87-116
Torres, R. (2004). Challenges and Potential for Linking Tourism and Agriculture to Achieve Pro-
Poor Tourism Objectives. Progress in Development Studies, 4(4): 294-318.
Tourism Intelligence International (2000a). How the British Will Travel 2005, Tourism Intelligence
International, Bielefeld
Tourism Intelligence International (2000b). How German Will Travel 2005, Tourism Intelligence
International, Bielefeld
Tourism New Zealand (2002). New Zealand International Visitor Survey: Results for the 12 months to
June 2002. Wellington: Tourism New Zealand
Travel Industry Association of America (2004). Impact of Travel on State Economies, 2004
Edition. Washington, DC: Travel Industry Association of America.
Tribe, J. (2005). The Economics of Recreation, Leisure & Tourism. 3rd ed. Oxford, UK
Tyrrell, T., & Johnston, R. (2001). A Framework for Assessing Direct Economic Impacts of
Tourist Events: Distinguishing Origins, Destinations, and Causes of Expenditures. Journal Of.
Travel Research, 40 (August): 94–100.
Ultima Newspaper (23 de Mayo de 2006). Flaquer afirma que este verano hay 19 hoteles menos
con ‘todo incluido’ en Mallorca: Turismo y sanitas inician una campaña de inspección sobre esta
oferta de alojamiento, pp. 18
UNEP (2002). Economic Impacts Of Tourism. Accessed in November, 2006 at: HUhttp://www.uneptie.org/pc/tourism/sust-tourism/economic.htmU
United Nations (UN) Department for Economic and Social Information and Policy Analysis and
World Tourism Organization (WTO) (1994). Recommendations on Tourism Statistics. New
York: United Nations.
US Department of Agriculture (2003). Measuring the Economic Impact of Cooperatives: Results
From Wisconsin
US Department of Transportation (2005). Transportation Expressions. Retrieved August 17
from HUhttp://www.bts.gov/cgibin/btsprod/expr/expr.plUH.
USAID and Caribbean Development Bank (1984). The Study of Linkages between Tourism and
local Agriculture in Grenada St. Vincent, St. Lucia and the Bahamas. Study Report. Washington
DC: USAID

94
Uysal, M. & Hagan, L (1993). Motivation of pleasure travel and tourism, in Khan, M, Olsen, M,
Var, T (Eds),Encyclopaedia of Hospitality and Tourism, Van Nostrand Reinhold, New York, NY,
pp.798-810.
Vanhove, N.(2005). The Economics of Tourism Destinations. Oxford, UK: Elsevier Butterworth-
Heinemann.
Vaughan, D., Farr, H. & Slee, R. (2000). Estimating and Interpreting the Local Economic
Benefits of Visitor Spending: An Explanation. Leisure Studies, 19: 95–118.
Veal, A (1997). Research Methods for Leisure and Tourism. 2nd ed. London: Financial Times, Prentice
Hall.
Wahab, S. (1975). Tourism Management. London: Tourism International
Wells, M. (1997). Economic Perspectives on Nature Tourism Conservation and Development,
Environmental Economics Series, WWW. World Bank.org.
Wickens, E. (1997). Licensed for Thrill: Risk-Taking and Tourism. Tourism and Health, edited by S.
Clift and P. Gabowski. London: Printer, pp. 151-64.
Wickens, E. (2000). Authenticity in Promotional Information. Do Package Holidaymakers set it-
Should Tour Operators Convey it? Management, Marketing and the Political Economy of
Travel and Tourism: Reflections on Internacional Tourism, Business Education Publishers Ltd,
ed. M Robinson et al.
Wickens, E. (2002). The Sacred and the Profane. Annals of Tourism Research, 29(3):834–51.
Wilton, J. & Nickerson, N. (2006). Collecting and Using Visitor Spending Data, Journal of Travel
Research, (45): 17-25
Wong, C. & Kwong, W. (2004). Outbound Tourists’ Selection Criteria for Choosing All-inclusive
Package Tours, Tourism Management, 25(5): 581-592.
Wong, S. & Lau, E. (2001). Understanding the Behaviour of Hong Kong Chinese Tourists on
Group Tour Packages. Journal of Travel Research, Vol. 40, August 2001, 57-67
World Atlas (2005). Hhttp://www.worldatlas.com/webimage/countrys/europe/balearic.htm
WTO (1995). Collection of Tourism Expenditure statistics. World Tourism Organisation Technical
Manuals.
WTO (2000). Measuring Total Tourism Demand. Madrid, Spain: WTO
WTO (2003). Proposal of Survey in order to Estimate Visitor Expenditure associated to Inbound
Tourism. Measuring Visitor Expenditure for Inbound Tourism, Annex 3
WTO (2004). Clarifying the treatment of Travel Agency, Tour Operator, Travel Agency Services
and Package Tours in SNA, Balance of Payments and TSA and their Mutual Relationship
95
WTO (2005a). System of Tourism Statistics (STS) and its Links with the General Statistical
System Accessed May, 2006 at: HUhttp://www.world-tourism.org/frameset/frame_statistics.htmlUH.
WTO (2005b). Basic References on Tourism Statistics. World Tourism Organization. Accessed August,
2005 at HUhttp://www.worldtourism.org/statistics/tsa_project/basic_references/index-en.htmUH.
WTO (2005c). Measuring Domestic Tourism and the Use of Household Surveys: A Working
Paper, (v. 1), May 2005. Madrid, Spain: WTO Department of Statistics and Economic
Measurement of Tourism.
Yamamoto, D. & Gill, A. (1999). Emerging Trends in Japanese Package Tourism. Journal of Travel
Research 38: 134-52
Yuan, S., &. McDonald, C. (1990). Motivational Determinants of International Pleasure Time,
Journal of Travel Research, 28 (2): 7-13.
Zuo, A. (2006). Did Foreign Direct Investment (FDI) Augment the Backward Linkages?: An
Empirical Study of Fourteen Chinese Industrial Sectors

96

97
1. What was the main purpose of your trip to Mallorca? [ ] holiday [ ] business [ ] conference [ ]visit family/ friend [ ] study [ ]other:_________________________________
2. What was included in the price of the trip you paid at your home country? [ ] only transport [ ] transport, accommodation & breakfast [ ] transport, accommodation & half board [ ] transport, accommodation & full board [ ] all-inclusive tour
3. Of the amount you have paid, how many people were covered? [ ] alone [ ] you & other 1person [ ] you & other 2people [ ] you & other 3people [ ] you & other 4people [ ] you & other 5people [ ] you & other 6people [ ] you & other 7people [ ] you & other 8people other__________________________________
4. Where did you stay during your trip? [ ] 1-star hotel [ ]3-star hotels [ ] 2- star hotels [ ]4-star hotels [ ]other: ___________________
5. How many days did you stay in Mallorca? __________________Days
6.(a) Would you still have come if there were no all-inclusive products in Mallorca? [ ] Yes [ ] No [ ] I am not sure (b) If your answer in 6(a) is “Yes”, how many days you could have stayed? [ ] More days. No. of ________________ [ ] The same number of days [ ] Less days. No. of days_____________ [ ] I am not sure
7(a) How much did you pay at your country of residence for this particular trip?
Amount Currency
7(b) of that amount paid in 7(a), what part of it (in currency or %) covers:
Amount %
Accommodation
Return ticket
8(a) How much did you spend in Mallorca?
€
8(b) Of the amount spent in 8(a), what part of it (in € or %) covers: Restaurant, cafeteria & bar?
€ %
Retail shopping (souvenirs, gifts, films, etc)?
€ %
Entertainments (other sports and recreational services)?
€ %
Communication (telephone, internet, postal service etc.) ?
€ %
Rental vehicles (vehicle and equipment hire)?
€ %
Other Expenses incurred in Mallorca Expense € or %
9. How do you agree or disagree with the factors which motivate you to choose all-inclusive tour to Mallorca? 1: Totally Agree 3: Neither Agree Nor Disagree 2: Agree 4: Disagree 5:Totally Disagree 1 2 3 4 5a. Saving time for organizing
the tour myself
A SAMPLE OF AVISITOR QUESTIONNAIRE
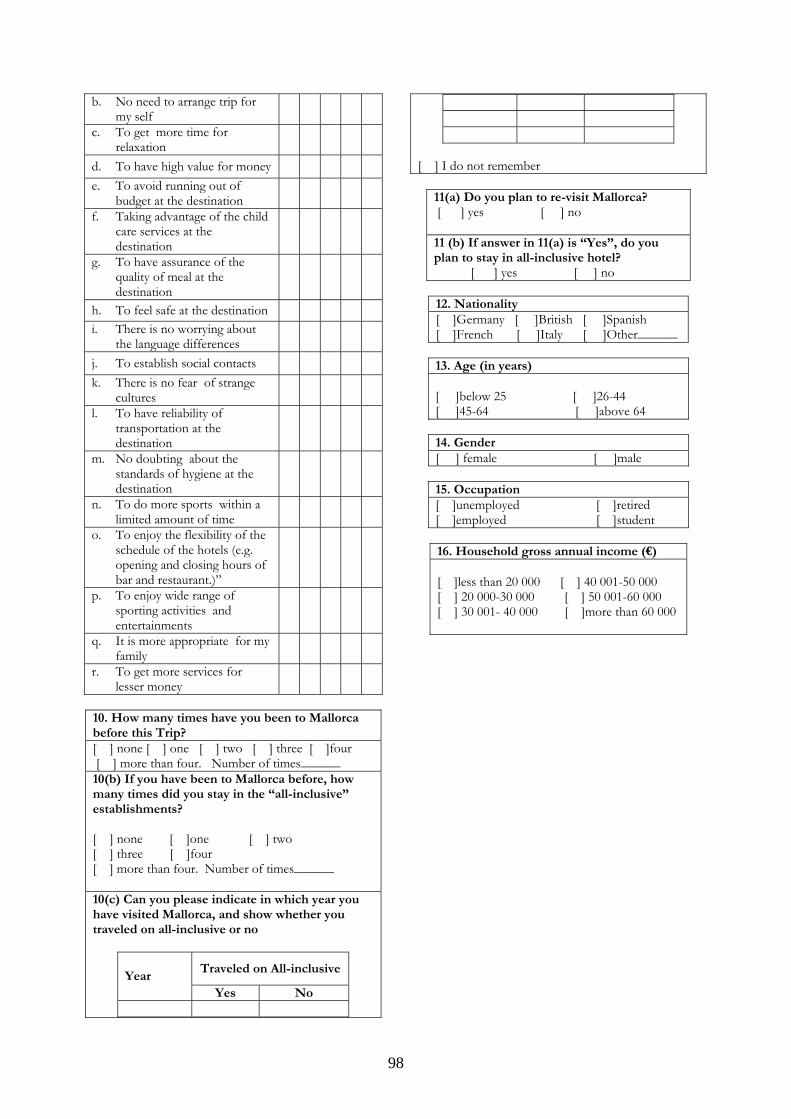
98
b. No need to arrange trip for my self
c. To get more time for relaxation
d. To have high value for money e. To avoid running out of
budget at the destination
f. Taking advantage of the child care services at the destination
g. To have assurance of the quality of meal at the destination
h. To feel safe at the destination i. There is no worrying about
the language differences
j. To establish social contacts k. There is no fear of strange
cultures
l. To have reliability of transportation at the destination
m. No doubting about the standards of hygiene at the destination
n. To do more sports within a limited amount of time
o. To enjoy the flexibility of the schedule of the hotels (e.g. opening and closing hours of bar and restaurant.)”
p. To enjoy wide range of sporting activities and entertainments
q. It is more appropriate for my family
r. To get more services for lesser money
10. How many times have you been to Mallorca before this Trip? [ ] none [ ] one [ ] two [ ] three [ ]four [ ] more than four. Number of times______ 10(b) If you have been to Mallorca before, how many times did you stay in the “all-inclusive” establishments? [ ] none [ ]one [ ] two [ ] three [ ]four [ ] more than four. Number of times______ 10(c) Can you please indicate in which year you have visited Mallorca, and show whether you traveled on all-inclusive or no
Traveled on All-inclusiveYear
Yes No
[ ] I do not remember
11(a) Do you plan to re-visit Mallorca? [ ] yes [ ] no 11 (b) If answer in 11(a) is “Yes”, do you plan to stay in all-inclusive hotel? [ ] yes [ ] no
12. Nationality [ ]Germany [ ]British [ ]Spanish [ ]French [ ]Italy [ ]Other______
13. Age (in years) [ ]below 25 [ ]26-44 [ ]45-64 [ ]above 64
14. Gender [ ] female [ ]male
15. Occupation [ ]unemployed [ ]retired [ ]employed [ ]student
16. Household gross annual income (€) [ ]less than 20 000 [ ] 40 001-50 000 [ ] 20 000-30 000 [ ] 50 001-60 000 [ ] 30 001- 40 000 [ ]more than 60 000
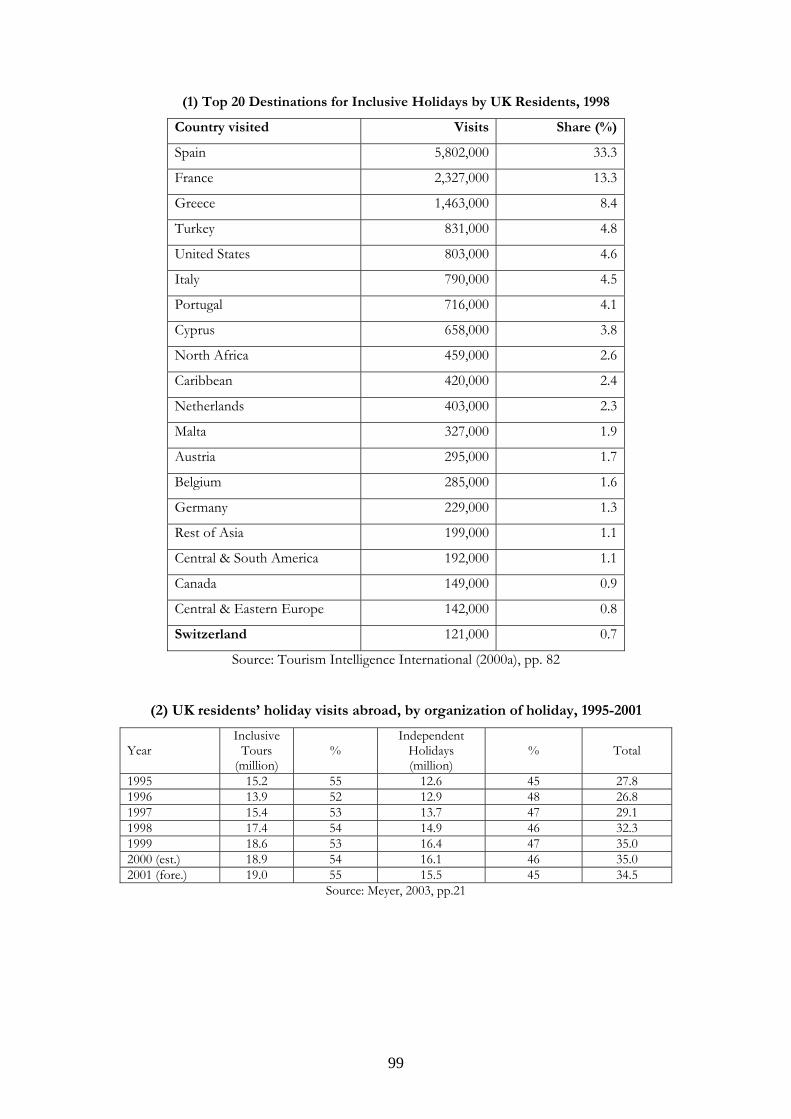
99
(1) Top 20 Destinations for Inclusive Holidays by UK Residents, 1998
Country visited Visits Share (%)
Spain 5,802,000 33.3
France 2,327,000 13.3
Greece 1,463,000 8.4
Turkey 831,000 4.8
United States 803,000 4.6
Italy 790,000 4.5
Portugal 716,000 4.1
Cyprus 658,000 3.8
North Africa 459,000 2.6
Caribbean 420,000 2.4
Netherlands 403,000 2.3
Malta 327,000 1.9
Austria 295,000 1.7
Belgium 285,000 1.6
Germany 229,000 1.3
Rest of Asia 199,000 1.1
Central & South America 192,000 1.1
Canada 149,000 0.9
Central & Eastern Europe 142,000 0.8
Switzerland 121,000 0.7
Source: Tourism Intelligence International (2000a), pp. 82
(2) UK residents’ holiday visits abroad, by organization of holiday, 1995-2001
Year Inclusive
Tours (million)
% Independent
Holidays (million)
% Total
1995 15.2 55 12.6 45 27.8 1996 13.9 52 12.9 48 26.8 1997 15.4 53 13.7 47 29.1 1998 17.4 54 14.9 46 32.3 1999 18.6 53 16.4 47 35.0 2000 (est.) 18.9 54 16.1 46 35.0 2001 (fore.) 19.0 55 15.5 45 34.5
Source: Meyer, 2003, pp.21
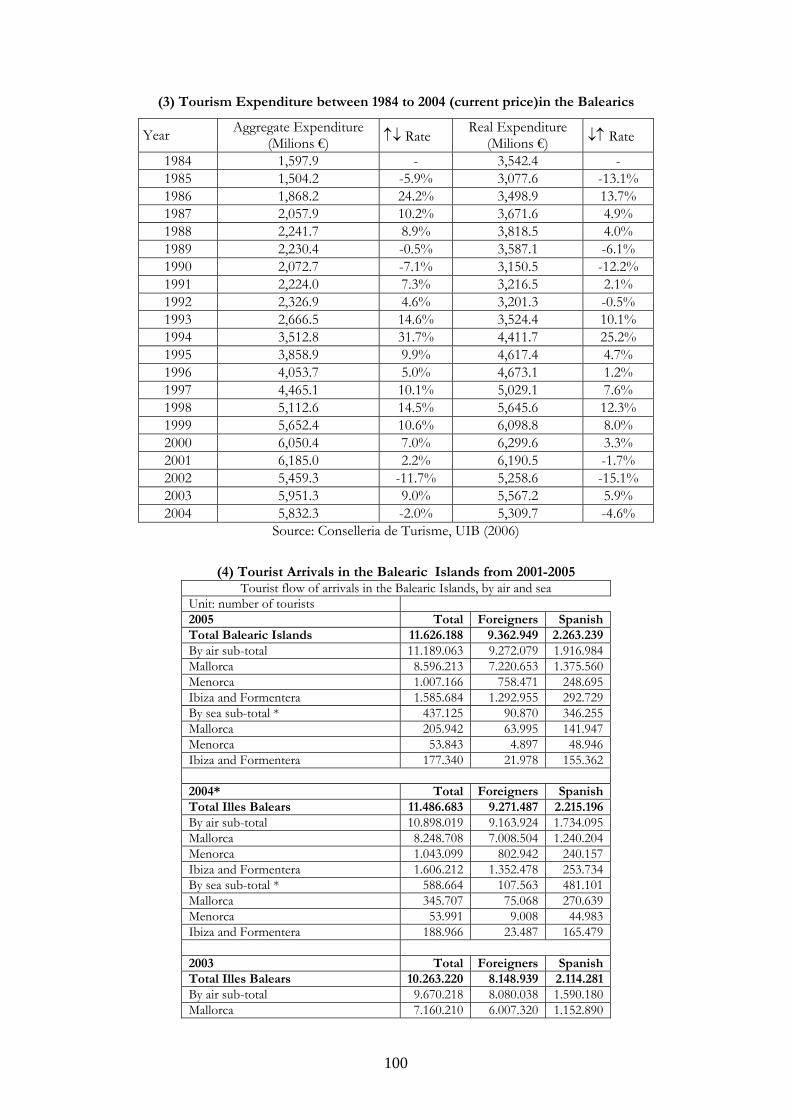
100
(3) Tourism Expenditure between 1984 to 2004 (current price)in the Balearics
Year Aggregate Expenditure (Milions €) ↑↓ Rate Real Expenditure
(Milions €) ↓↑ Rate
1984 1,597.9 - 3,542.4 - 1985 1,504.2 -5.9% 3,077.6 -13.1% 1986 1,868.2 24.2% 3,498.9 13.7% 1987 2,057.9 10.2% 3,671.6 4.9% 1988 2,241.7 8.9% 3,818.5 4.0% 1989 2,230.4 -0.5% 3,587.1 -6.1% 1990 2,072.7 -7.1% 3,150.5 -12.2% 1991 2,224.0 7.3% 3,216.5 2.1% 1992 2,326.9 4.6% 3,201.3 -0.5% 1993 2,666.5 14.6% 3,524.4 10.1% 1994 3,512.8 31.7% 4,411.7 25.2% 1995 3,858.9 9.9% 4,617.4 4.7% 1996 4,053.7 5.0% 4,673.1 1.2% 1997 4,465.1 10.1% 5,029.1 7.6% 1998 5,112.6 14.5% 5,645.6 12.3% 1999 5,652.4 10.6% 6,098.8 8.0% 2000 6,050.4 7.0% 6,299.6 3.3% 2001 6,185.0 2.2% 6,190.5 -1.7% 2002 5,459.3 -11.7% 5,258.6 -15.1% 2003 5,951.3 9.0% 5,567.2 5.9% 2004 5,832.3 -2.0% 5,309.7 -4.6%
Source: Conselleria de Turisme, UIB (2006)
(4) Tourist Arrivals in the Balearic Islands from 2001-2005
Tourist flow of arrivals in the Balearic Islands, by air and sea Unit: number of tourists 2005 Total Foreigners Spanish Total Balearic Islands 11.626.188 9.362.949 2.263.239 By air sub-total 11.189.063 9.272.079 1.916.984 Mallorca 8.596.213 7.220.653 1.375.560 Menorca 1.007.166 758.471 248.695 Ibiza and Formentera 1.585.684 1.292.955 292.729 By sea sub-total * 437.125 90.870 346.255 Mallorca 205.942 63.995 141.947 Menorca 53.843 4.897 48.946 Ibiza and Formentera 177.340 21.978 155.362
2004* Total Foreigners Spanish Total Illes Balears 11.486.683 9.271.487 2.215.196 By air sub-total 10.898.019 9.163.924 1.734.095 Mallorca 8.248.708 7.008.504 1.240.204 Menorca 1.043.099 802.942 240.157 Ibiza and Formentera 1.606.212 1.352.478 253.734 By sea sub-total * 588.664 107.563 481.101 Mallorca 345.707 75.068 270.639 Menorca 53.991 9.008 44.983 Ibiza and Formentera 188.966 23.487 165.479
2003 Total Foreigners Spanish Total Illes Balears 10.263.220 8.148.939 2.114.281 By air sub-total 9.670.218 8.080.038 1.590.180 Mallorca 7.160.210 6.007.320 1.152.890
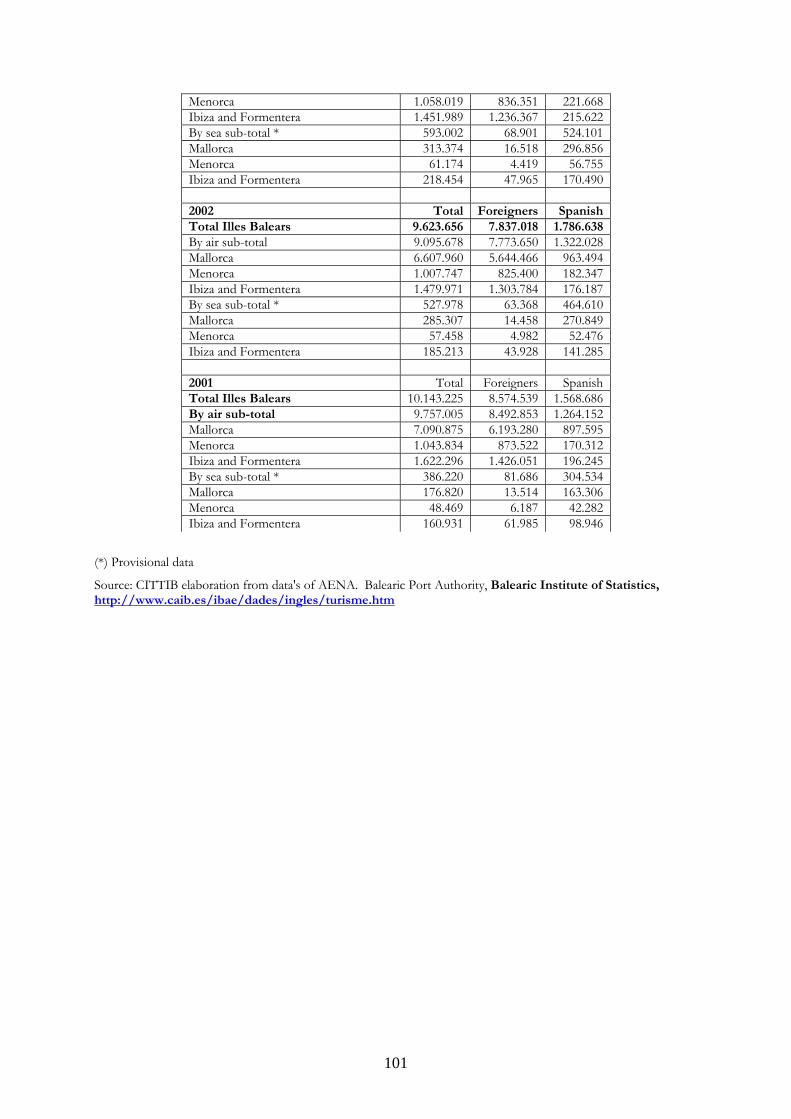
101
Menorca 1.058.019 836.351 221.668 Ibiza and Formentera 1.451.989 1.236.367 215.622 By sea sub-total * 593.002 68.901 524.101 Mallorca 313.374 16.518 296.856 Menorca 61.174 4.419 56.755 Ibiza and Formentera 218.454 47.965 170.490
2002 Total Foreigners Spanish Total Illes Balears 9.623.656 7.837.018 1.786.638 By air sub-total 9.095.678 7.773.650 1.322.028 Mallorca 6.607.960 5.644.466 963.494 Menorca 1.007.747 825.400 182.347 Ibiza and Formentera 1.479.971 1.303.784 176.187 By sea sub-total * 527.978 63.368 464.610 Mallorca 285.307 14.458 270.849 Menorca 57.458 4.982 52.476 Ibiza and Formentera 185.213 43.928 141.285
2001 Total Foreigners Spanish Total Illes Balears 10.143.225 8.574.539 1.568.686 By air sub-total 9.757.005 8.492.853 1.264.152 Mallorca 7.090.875 6.193.280 897.595 Menorca 1.043.834 873.522 170.312 Ibiza and Formentera 1.622.296 1.426.051 196.245 By sea sub-total * 386.220 81.686 304.534 Mallorca 176.820 13.514 163.306 Menorca 48.469 6.187 42.282 Ibiza and Formentera 160.931 61.985 98.946
(*) Provisional data
Source: CITTIB elaboration from data's of AENA. Balearic Port Authority, Balearic Institute of Statistics, HUhttp://www.caib.es/ibae/dades/ingles/turisme.htmU

102
SOME OF ALL INCLUSIVE ESTABLISHMENTS IN MALLORCA
Hotel Board basis options Acorn Pionero/Santa Ponsa Park Bed & Breakfast / Half Board / Full Board / All Inclusive Acorn Playa Santa Ponça Half Board / All Inclusive Acorn Sumba/Borneo Half Board / Full Board / All Inclusive Anba Romani Aparthotel Half Board / All Inclusive Amazonas Exclusive All-Inclusive Apolo Exclusive All-Inclusive Barcelo Ponent Playa Half Board / Full Board / All Inclusive Barcelo Cala Vinas Self Catering / Bed & Breakfast / Half Board / All Inclusive Barcelo Pueblo Park Half Board / All Inclusive Blau Mediterraneo Club Apartments Self Catering / All Inclusive Blau Punta Reina Club Self Catering / Half Board / All Inclusive Cala Ferrera Half Board / All Inclusive Cala Vinas Self Catering / Half Board / All Inclusive Calas Park Apartments Exclusive All-Inclusive Canarios Park Exclusive All-Inclusive Club Cala D or Gardens Exclusive All-Inclusive Club Eurocalas Aparthotel Exclusive All-Inclusive Club Hotel Morito Exclusive All-Inclusive Club Hotel TONGA Exclusive All-Inclusive Club Pollentia Resort Village Bed &Break/HalfBoard/FullBoard/All Inclusive/RoomAlone Comodoro All-Inclusive only Condes De Alcúdia Half Board / All Inclusive Don Pedro Half Board / All Inclusive Es Talaial Aparthotel Exclusive All-Inclusive Estoril Exclusive All-Inclusive Flamboyan Caribe HalfBoard / All Inclusive Hawaii Mallorca Half Board / Full Board / All Inclusive Hipotels Bahia Grande Self Catering / Half Board / All Inclusive Hipotels Don Juan HalfBoard / All Inclusive Hipotels Said Half Board / All Inclusive Honolulu Hotel Half Board / All Inclusive Hotel AMERICA Exclusive All-Inclusive Hotel Don Manolo Exclusive All-Inclusive Hotel LUX Bed &Break/HalfBoard/FullBoard/All Inclusive/RoomAlone Hotetur Belsana Half Board / All Inclusive Hotetur Lagomonte Exclusive All-Inclusive Iberostar Carolina Park Self Catering / Half Board / All Inclusive Iberostar Exagon Park Half Board / All Inclusive Isla Dorada Hotel Exclusive All-Inclusive Lancaster Half Board / All Inclusive Luna Park/Tropical Park Exclusive All-Inclusive Mac Júpiter Club Exclusive All-Inclusive Mac Marte Club Hotel Exclusive All-Inclusive Mac Saturn Club Exclusive All-Inclusive Marina Barracuda Half Board / All Inclusive Marina Corfu Hotel Exclusive All-Inclusive Marina Pax Exclusive All-Inclusive Mimosa Park Half Board / All Inclusive Ola Panama Exclusive All-Inclusive Ola Maioris Exclusive All-Inclusive Palia Maria Eugenia Half Board / Full Board / All Inclusive Palma Nova Palace Half Board / All Inclusive Palmanova Half Board / All Inclusive

103
Panoramic Half Board / All Inclusive Playa Mar Self Catering / Half Board / All Inclusive Playa Blanca Half Board / All Inclusive President Hotel Half Board / All Inclusive Punta Amer Half Board / All Inclusive Riu Bravo Exclusive All-Inclusive Riu Camp de Mar Half Board / All Inclusive Riu Playa Park Half Board / All Inclusive Roc Carolina [ex Iberostar] Half Board / All Inclusive Roc Las Rocas Self Catering / Bed & Breakfast / Half Board / All Inclusive Rossella Aparthotel Exclusive All-Inclusive Samoa Exclusive All-Inclusive Simar Aparthotel Exclusive All-Inclusive Sol Balmoral All Inclusive/Self Catering/Half Board Sol Mirlos Tordos Half Board / All Inclusive Torre Blanca Club All Inclusive/Half Board Vista Odin Half Board / All Inclusive Viva Cala Mesquida Resort Self Catering / Half Board / All Inclusive
Sources: HUhttp://www.medhotels.com/hotellist.asp?AID=12&c=1UHU; UHUhttp://www.holidayhotels.com/hotel_list.php?AreaID=12