Economic Impact of the University of Wisconsin-Madison … · 2019-09-11 · 5.4 Role of Athletics...
57
1435 Walnut Street, 4 th Floor | Philadelphia, PA 19102 | econsultsolutions.com | 215-717-2777 Economic Impact of the University of Wisconsin-Madison Athletics Department June 10, 2019 Submitted to University of Wisconsin-Madison Athletics Department
Transcript of Economic Impact of the University of Wisconsin-Madison … · 2019-09-11 · 5.4 Role of Athletics...

1435 Walnut Street, 4 th Floor | Philadelphia, PA 19102 | econsultsolutions.com | 215 -717-2777
Economic Impact of the University of Wisconsin-Madison Athletics Department
June 10, 2019 Submitted to University of Wisconsin-Madison Athletics Department

Offering solutions for
PUBLIC SECTOR | PRIVATE SECTOR | ECONOMIC DEVELOPMENT | COMMUNITY DEVELOPMENT
REAL ESTATE | NON-PROFIT + INSTITUTIONAL | TRANSPORTATION + INFRASTRUCTURE

The Economic Impact of UW-Madison Athletics June 10, 2019
Executive Summary: Page 3
Executive Summary
University of Wisconsin-Madison Athletics (UW Athletics)
is a Division I athletics organization that hosts 23 different
sports teams known as the Wisconsin Badgers. UW
Athletics prides itself on providing an elite college
experience that develops student-athletes both on and off the field. In
addition to supporting its student-athletes, UW Athletics serves as an
economic engine for the City of Madison and the State of Wisconsin,
generating substantial economic impact and tax revenues through its
operational footprint and by attracting nearly two million visitors to its
campus for events each year.
1.8 million
visitors to Madison
each year
$16 million
total economic impact on
the Wisconsin economy
for each home
football game
$203 million
aggregate visitor
spending brought
into Wisconsin
$13.5 million
UW Athletics contribution
to $87.5 million
capital project—
The “Nick”
Recreation Center

The Economic Impact of UW-Madison Athletics June 10, 2019
Executive Summary: Page 4
Never lose sight of what your main goal is and
that is working with young people. [Helping
them] not only become good student-athletes,
but good leaders and good citizens and being
involved in giving back to the community.
—Barry Alvarez, Director of Athletics
Fundraising Catalyst
UW Athletics often serves as an entry point for
alumni and other boosters to support UW through
charitable contributions. It also provides multiple
points of engagement for current and prospective
donors, further strengthening UW’s donor base and
financial position.
13,596 donors contributed
$40.2 million
to UW Athletics in 2018.
A Commitment to Service
UW Athletics is deeply committed to instilling in its
student-athletes an ethos of service. This is reflected
in the many service projects and engagement
opportunities teams participate in, as well as the
lifelong lessons UW student-athletes carry into their
professional lives.
644 Student-Athletes
participating in 361 service events.
Reputational Enhancement
UW Athletics prominently elevates the profile of UW
and the entire state of Wisconsin at a national level.
High-profile coverage and particularly national
championships produce a halo effect for the
reputation of UW and the state. They also increase
awareness, student applications, and alumni giving,
which help UW climb in national rankings
and fulfill its institutional mission.
Advertising agreements worth an estimated trade value of
$1 million each year.
Social Cohesion
UW Athletics represents an intense shared
allegiance for students and alumni. Whether the
experience of that affiliation is in Madison or
anywhere else in the world, it knits the global
Badger community together. This social cohesion
can have profound implications for forging social,
civic, business, and cultural connections.
The Wisconsin Alumni Association has chapters in more than
75 cities worldwide.
The Economic Impact of UW-Madison Athletics June 10, 2019
Table of Contents: Page 5
Contents Executive Summary ....................................................................................................................................................... 3
Introduction ............................................................................................................................................................... 6 1.1.1 Report Purpose .................................................................................................................................................... 6 1.2 About UW Athletics ............................................................................................................................................. 7 1.3 Economic and Fiscal Impact Modeling ................................................................................................................ 9 1.4 Geographies of Interest ..................................................................................................................................... 10 1.5 UW-Madison Athletics as a Regional Economic Engine .................................................................................... 11
Impact from Direct Spending ................................................................................................................................... 14 2.2.1 Section Overview ............................................................................................................................................... 14 2.2 Direct Annual Operating Expenditures .............................................................................................................. 14 2.3 Direct Annualized Capital Investments ............................................................................................................. 16 2.4 Economic Impact from Direct Spending ............................................................................................................ 17 2.5 Industry Distribution of Economic Impact from Direct Spending ..................................................................... 19 2.6 Tax Revenue Impact from Direct Spending ....................................................................................................... 20
Impact from Participant/Attendee Spending .......................................................................................................... 21 3.3.1 Section Overview ............................................................................................................................................... 21 3.2 Modeling UW Athletics Visitor Activity ............................................................................................................. 21 3.3 Impact from Football Participants/Attendees ................................................................................................... 24 3.4 Impact from Participants/Attendees of Other UW Athletics Intercollegiate Sports ......................................... 27 3.5 Impact from Other Events Hosted by UW Athletics .......................................................................................... 29 3.6 Aggregate Economic Impact .............................................................................................................................. 30 3.7 Industry Distribution of Economic Impact from Participant and Attendee Spending ....................................... 31 3.8 Tax Revenue Impact from Participant/Attendee Spending ............................................................................... 32
Impact from Additional Ancillary Spending ............................................................................................................. 33 4.4.1 Section Overview ............................................................................................................................................... 33 4.2 Estimated Spending on Licensed Merchandise ................................................................................................. 33 4.3 Estimated Spending on Media Buys .................................................................................................................. 36
Broader Societal Impacts ......................................................................................................................................... 38 5.5.1 Section Overview ............................................................................................................................................... 38 5.2 Gains from Reputational Enhancement ............................................................................................................ 38 5.3 Contributions to Social Cohesion and Connectivity Within the UW Community .............................................. 39 5.4 Role of Athletics in University Fundraising ........................................................................................................ 41 5.5 Local Engagement and Service .......................................................................................................................... 43
Conclusion ............................................................................................................................................................... 45 6.6.1 Summary of Economic Impacts ......................................................................................................................... 45 6.2 Return on Investment ....................................................................................................................................... 46 6.3 UW Athletics’ Broader Return on Investment ................................................................................................... 47
Appendix A – Report Methodology ............................................................................................................................. 49 Appendix B – Economic and Fiscal Impact Models ...................................................................................................... 50 Appendix C – Ancillary Spending ................................................................................................................................. 53
About Econsult Solutions, Inc.
This report was produced by Econsult Solutions, Inc. (“ESI”).
ESI is a Philadelphia-based economic consulting firm that provides businesses and public policy makers
with economic consulting services in urban economics, real estate economics, transportation, public
infrastructure, development, public policy and finance, community and neighborhood development,
planning, as well as expert witness services for litigation support. Its principals are nationally recognized
experts in urban development, real estate, government and public policy, planning, transportation, non-
profit management, business strategy and administration, as well as litigation and commercial damages.
Staff members have outstanding professional and academic credentials, including active positions at the
university level, wide experience at the highest levels of the public policy process and extensive
consulting experience.

The Economic Impact of UW-Madison Athletics June 10, 2019
Introduction: Page 6
Introduction 1.
1.1 Report Purpose The purpose of this study is to estimate the economic impact the
University of Wisconsin-Madison Division of Intercollegiate Athletics (UW
Athletics) has on the city of Madison and the state of Wisconsin. The
University of Wisconsin (UW) is a public, four-year institution of higher
education with a 936-acre campus, founded in 1848 and boasting more
than 40,000 students and 22,000 faculty and staff. UW’s Athletics
Department is world-renowned—an NCAA Division I organization and a
member of the Big Ten Conference.
Because of the size and scale of its teaching and research activities, the University is an important
economic engine for the city of Madison and the state of Wisconsin. Similarly, UW Athletics generates a
substantial impact for the city and state. This report will articulate impact in terms of economic output,
jobs created, and tax revenues generated from UW Athletics’ annual operations and large scale capital
projects, as well as from the visitors that come to campus to enjoy a Badger game or other UW Athletics
events. UW Athletics also draws economic activity into the city and state through the sale of Badger-
licensed merchandise and advertising at Badger events covered by local and national media. In addition
to these impacts, there are broader societal impacts for which UW Athletics can take credit—including
boosting the reputation of Madison and Wisconsin on the national stage, cultivating a stronger
community within the UW-Madison alumni network, and strengthening the local community through
service initiatives led by Badger student-athletes and staff.
The Economic Impact of UW-Madison Athletics June 10, 2019
Introduction: Page 7
In all of these ways, UW Athletics delivers a substantial return on investment in the form of economic
activity, jobs, and tax revenues generated within the local and state economy. It is also a flagship brand,
ambassador, and community service provider within the state it represents both on and off the field.
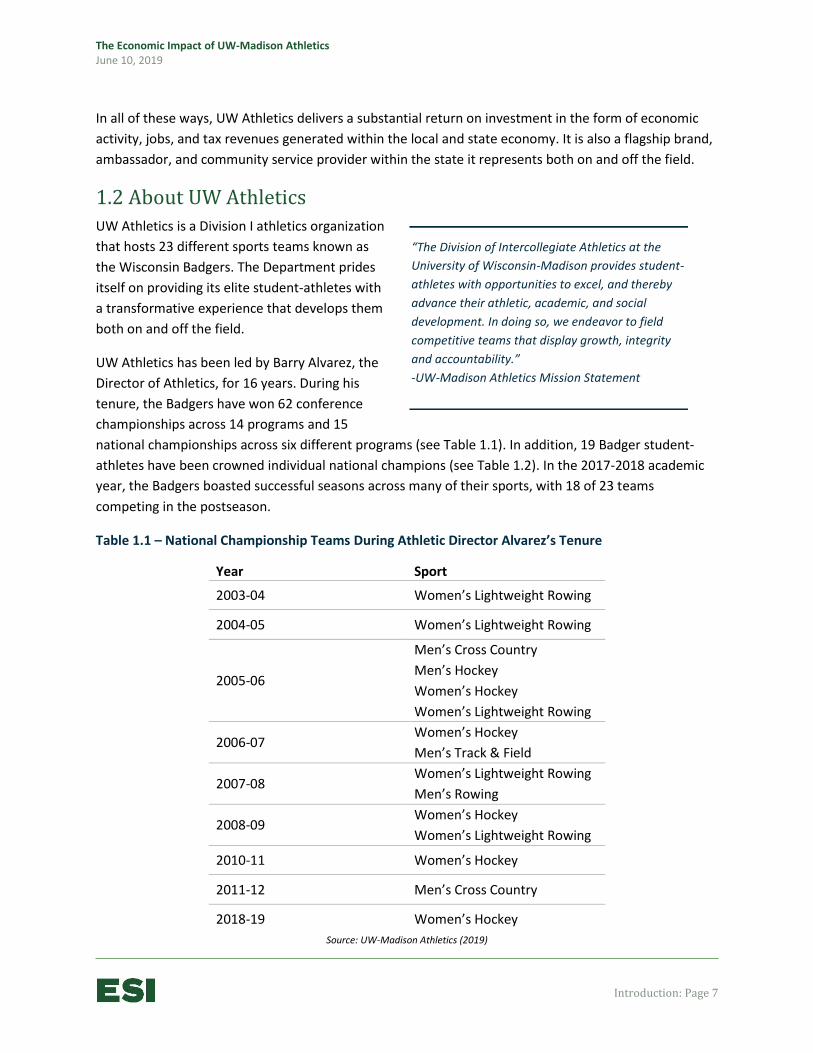
1.2 About UW Athletics UW Athletics is a Division I athletics organization
that hosts 23 different sports teams known as
the Wisconsin Badgers. The Department prides
itself on providing its elite student-athletes with
a transformative experience that develops them
both on and off the field.
UW Athletics has been led by Barry Alvarez, the
Director of Athletics, for 16 years. During his
tenure, the Badgers have won 62 conference
championships across 14 programs and 15
national championships across six different programs (see Table 1.1). In addition, 19 Badger student-
athletes have been crowned individual national champions (see Table 1.2). In the 2017-2018 academic
year, the Badgers boasted successful seasons across many of their sports, with 18 of 23 teams
competing in the postseason.
Table 1.1 – National Championship Teams During Athletic Director Alvarez’s Tenure
Year Sport
2003-04 Women’s Lightweight Rowing
2004-05 Women’s Lightweight Rowing
2005-06
Men’s Cross Country
Men’s Hockey
Women’s Hockey
Women’s Lightweight Rowing
2006-07 Women’s Hockey
Men’s Track & Field
2007-08 Women’s Lightweight Rowing
Men’s Rowing
2008-09 Women’s Hockey
Women’s Lightweight Rowing
2010-11 Women’s Hockey
2011-12 Men’s Cross Country
2018-19 Women’s Hockey
Source: UW-Madison Athletics (2019)
“The Division of Intercollegiate Athletics at the
University of Wisconsin-Madison provides student-
athletes with opportunities to excel, and thereby
advance their athletic, academic, and social
development. In doing so, we endeavor to field
competitive teams that display growth, integrity
and accountability.”
-UW-Madison Athletics Mission Statement

The Economic Impact of UW-Madison Athletics June 10, 2019
Introduction: Page 8
Table 1.2 – Individual National Champions During Athletic Director Alvarez’s Tenure
Year Individual Sport
2004-05 Simon Bairu Men's Cross Country
Chris Solinsky Indoor 3,000 Meters
2005-06 Simon Bairu Men's Cross Country
Chris Solinsky Indoor 3,000 Meters + Outdoor 5,000 Meters
2006-07 Chris Solinsky Indoor 3,000 Meters + Outdoor 5,000 Meters
2009-10 Andrew Howe 165 lbs., Wrestling
2010-11 Maggie Meyer 200-Yard Backstroke, Swimming
2012-13 Drew teDuits 200-Yard Backstroke, Swimming
2013-14 Michael Lihrman Indoor Weight Throw
2015-16 Zach Ziemek Heptathlon
Kelsey Card Discus
2018-19
Alicia Monson Indoor 5,000 Meters
Morgan McDonald Men’s Cross Country, Indoor 3,000 Meters, Indoor 5,000 Meters
Beata Nelson 100-Yard Backstroke, 200-Yard Backstroke, 200-Yard IM, Swimming
Source: UW-Madison Athletics (2019)
UW Athletics presently has more than 800 student-athletes and nearly 400 full-time staff, and it hosts
more than 1.8 million spectators each year, making the department a substantial component of the UW
experience and a major driver of visitation to the region. In addition to hosting home games in its
facilities, UW Athletics hosts a wide range of conferences, banquets, alumni activities, concerts,
commencements, tournaments, and camps that bring even more visitors to campus and increase the
visibility of the University of Wisconsin and the city of Madison throughout the region and beyond.
Under Director Alvarez’s leadership, local engagement and community service have been emphasized.

The Economic Impact of UW-Madison Athletics June 10, 2019
Introduction: Page 9
In 2012, UW Athletics created the Badgers Give Back program, a community relations platform meant to
enhance student-athlete outreach efforts. Badgers Give Back has become a staple of the student-athlete
experience at UW with two-thirds of student-athletes participating.
1.3 Economic and Fiscal Impact Modeling Econsult Solutions, Inc. (ESI) employed industry-standard economic modeling techniques to estimate the
direct economic activity generated by the Athletics Department of the University of Wisconsin-Madison,
and to translate that activity into total economic output, employment, and earnings, as well as tax
revenue impact.
Economic impacts are the sum of direct activity attributable to UW-Madison Athletics (either direct
spending by UW Athletics on operations and capital activity or spending drawn into the area by students
and visitor, and the spillover impacts of that direct activity) (see Figure 1.1). Within an interconnected
economy, each dollar of direct expenditures generates multiple waves of spillover impacts through
spending on goods and services purchased within a given region (“indirect impacts”) as well as spending
resulting from the labor income generated by the initial activity that ripples through the region
(“induced impacts”). ESI used IMPLAN modeling software to estimate indirect and induced impacts, and
sums them with the direct activity to produce total economic impact. IMPLAN also estimates the
number of jobs that are supported by the spillover impacts (indirect and induced impacts). For ease of
comprehension, ESI converts these jobs into Full-Time Equivalent (FTE) jobs, and all jobs expressed in
this report are FTE jobs.
ESI also created a custom fiscal impact model to translate economic impacts into their commensurate
effect on local and state tax bases, in order to develop estimates of local and state tax revenues
generated by UW Athletics. See Appendix B for additional details on ESI’s economic and fiscal impact
model methodology.
“Why Wisconsin? Why do fans have a connection to the
Badgers and give us such tremendous support? Why do
student-athletes choose to attend UW-Madison? Is it
because of our athletic success? Is it because of our
commitment to developing a complete student-athlete? Is
it because of the beauty of campus and the vibrant city of
Madison? We concluded that the answer is a resounding
yes! It’s all of those things and then some.
–Barry Alvarez, Director of Athletics

The Economic Impact of UW-Madison Athletics June 10, 2019
Introduction: Page 10
Figure 1.1 – Economic Impact Methodology
Source: Econsult Solutions, Inc. (2019)
1.4 Geographies of Interest Because UW Athletics’ impact is felt at various geographic levels, the report calculates economic impacts
for the following geographies (see Figure 1.2):
The city of Madison
Dane County
Greater Madison Area: Dane County, Columbia County, Iowa County, Green County, and Rock
County
The state of Wisconsin
The impact of UW Athletics will be greatest at the state level since that geography is inclusive of all the
impacts at a city, county, and region level.
While much of UW Athletics’ activity is tax-exempt because of the not-for-profit status of the institution,
the economic impact it generates every year produces considerable tax revenue generation for the State
of Wisconsin government and to a lesser extent the City of Madison government. Therefore, tax
revenue generation from all economic impact categories is modeled for the State, and where applicable
also for the City. Other jurisdictions, such as surrounding cities and towns as well as neighboring states,
likely also benefit from tax revenues generated by UW Athletics activities, but these amounts are
smaller and they are not evaluated in this report.

The Economic Impact of UW-Madison Athletics June 10, 2019
Introduction: Page 11
Figure 1.2 – Geographies of interest
Source: ArcGIS (2019), Mapbox (2019), Econsult Solutions, Inc. (2019)
1.5 UW-Madison Athletics as a Regional Economic Engine
Athletics is an important part of the identity of and experience at the University of Wisconsin. It is also a
significant driver of economic activity in the city of Madison and the state of Wisconsin, with important
implications for the local employment base, numerous regional industry sectors, and local and state tax
revenue levels. This is because Athletics represents a unique set of activities that take place locally but
are enjoyed by a population of participants and spectators that come from all over the country.
Sporting events and related activities draw people and dollars from outside the region, in the form of
out-of-town teams and fans, alumni and corporate donations, purchase of licensed merchandise, and
media buys. They are also a platform by which the University as a whole, and by extension the state of
Wisconsin, enhances its reputation to the rest of the world. And they are part of the value conferred
upon students who attend the University of Wisconsin, whose shared experience in rooting for the
school stays with them long after they leave the University. This experience creates lifelong connections
that facilitate their social and professional advancements and increases the likelihood that alumni will
remain connected to UW and to the state via return visits and charitable contributions.

The Economic Impact of UW-Madison Athletics June 10, 2019
Introduction: Page 12
Hence, it is useful to consider the range and scale of UW Athletics’ economic contribution to the city of
Madison and the state of Wisconsin, which is the focus of this report. The sections of this report are
organized to highlight those economic and societal impacts:
Section 2: Impact from Direct Spending by UW Athletics. Annual operating expenditures as well
as major capital investments represent direct dollars spent by UW Athletics, which in turn have
a multiplier effect at all geographic levels. The first content section of this report concerns itself
with the economic and fiscal impacts from UW Athletics as a major employer, a significant
procurer of a wide range of foods and services, and a major undertaker of large-scale capital
projects.
Section 3: Impact from Participant/Attendee Ancillary Spending. This section looks at impacts
for spending beyond UW Athletics’ own spending, from spectators and participants of various
events. This section separately considers football games, games for all other sports, and all
other Athletics-related events. ESI combined attendance and participant data with publicly
available industry data to develop attendee and participant archetypes as well as spending
profiles for each archetype. This yields an estimated ancillary spending amount that can be
modeled in IMPLAN to arrive at economic impact estimates, from which ESI’s tax revenue
impact model can derive local and state tax revenue estimates.
Section 4: Impact from Additional Ancillary Spending. Beyond the ancillary spending drawn to
campus by UW Athletics events, UW Athletics can take credit for two additional forms of
spending that also have a multiplier effect throughout the state economy. The first is the
purchase of UW-licensed merchandise in locations besides campus or at times other than when
attendees are on campus for an event. The second is media buys associated with UW Athletics
events. These additional spending categories, which will be estimated in part using data from
UW Athletics, represent additional spending that enriches the state economy and that therefore
must be considered when taking into account the overall impact of UW Athletics.
Section 5: Broader Societal Impacts. Beyond the above non-overlapping impact categories are a
number of broader benefits that warrant exploration in an economic impact study of UW
Athletics. The first is the reputational enhancement—to the University of Wisconsin, the state of
Wisconsin, and to people affiliated with UW or the state—that comes from the success of UW
teams. Championships drive economic activity (e.g. higher attendance and sale of merchandise),
which is accounted for above, but they also increase interest in the University and state as a
whole (as reflected in more applications and more fundraising for the University and more
visitation and business activities for the state, for example). Secondly, UW Athletics represents a
connecting force for students, staff, and alumni, both in the present and the future (as a
common alma mater that can open doors and break the ice). This is important because this is
the type of connective tissue – a common alma mater, shared team allegiances, and even
shared rituals and vocabulary – that improves one’s social experiences, strengthens professional

The Economic Impact of UW-Madison Athletics June 10, 2019
Introduction: Page 13
networks, and closes business deals. Third, UW Athletics is increasingly seen as a force for good
at the local level, as players and staff alike spend time on a number of service initiatives that
connect to and provide benefits for the local communities. In all such cases, direct calculations
are not possible, but a brief literature review demonstrates these effects, produced by UW
Athletics, on the strength and size of the state economy.
Section 6: Conclusion. The concluding section of the report summarizes economic impacts and
speaks to how they represent a return on the investment in UW Athletics. First, and particularly
of interest for audiences representing the executive and legislative branches of State
government, the conclusion summarizes economic impacts across sections and expresses them
in aggregate terms as relative to investments made by the State. At a time of fiscal uncertainty,
being able to connect State investments to the magnitude and diversity of impacts that are
produced by them is paramount, and thus represents a fundamental outcome of this economic
impact analysis that is stated clearly in the concluding section. Second, for local audiences, the
conclusion speaks to how these positive impacts have immediate local benefit, and
acknowledges the existence of costs borne at the local level (e.g. public safety and
traffic/parking consequences) but concludes that they are outweighed by an overwhelming
amount of local benefits.

The Economic Impact of UW-Madison Athletics June 10, 2019
Impact from Direct Spending: Page 14
Impact from Direct Spending 2.
2.1 Section Overview The Athletics Department of the University of Wisconsin-Madison is a major economic engine for the
state of Wisconsin and the local Madison area. The funds that UW Athletics spends on hosting sports
competitions, tournaments, and many other events have a multiplier effect that results in economic
impact rippling through different geographic levels. This section uses information provided by UW
Athletics on annual operating expenditures and major capital investments, and translates UW Athletics’
footprint into its economic impact at a city, county, regional, and statewide level using standard input-
output modeling techniques via IMPLAN. The section also describes tax revenue impacts that result
from the economic impacts at the city and state level into the commensurate effect those impacts have
on tax revenues to the City of Madison and the State of Wisconsin.
It is estimated that direct spending from UW Athletics annually
produces $293 million in economic impact in the state of Wisconsin,
supporting 1,590 jobs and $111 million in employee earnings.1 UW
Athletics’ annualized average capital investments produce $20 million
in economic impact in the state of Wisconsin, supporting 110 jobs and
$6 million in employee earnings.
2.2 Direct Annual Operating Expenditures Direct operations produce spillover
effects at each geographic level,
stimulating business activity and
supporting employment across a variety
of sectors. The total economic impact is
the sum of the direct expenditures
made by UW Athletics, the indirect
impacts that result from institutional
spending on goods and services with
vendors within each geography, and the
induced impacts that result when
employees of UW Athletics spend their
salaries and wages locally.
1 Jobs are expressed in Full-Time Equivalent (FTE) jobs. All jobs expressed in this report are FTE jobs.
UW Athletics’ operations
and capital investments
directly or indirectly
support 1,700 jobs
throughout the state of
Wisconsin each year.

The Economic Impact of UW-Madison Athletics June 10, 2019
Impact from Direct Spending: Page 15
In aggregate, UW Athletics’ total functional operating expenditures for FY 2018 are approximately
$140.7 million.2 This is a 21 percent increase from FY 2016. UW Athletics is a self-sustaining organization
within UW, paying for its expenditures from a combination of ticket sales, concessions, conference
distribution, multimedia and licensing revenues, and donor support.
To determine the magnitude of the economic impact of UW Athletics’ operational activity, it is first
necessary to understand the composition of annual expenditures within the local, regional, and state
economies. Since economic impact relates largely to where expenditures occur, deductions are made
for budgetary items that do not represent spending within a given geography. For example, this
modeling approach excludes debt service paid by UW Athletics from the analysis because that
expenditure does not represent an actual outlay of funds that is actively circulating within the local and
state economies. After that adjustment, the modeled amount of direct spending within the economy is
$129.6 million (see Table 2.1).
Table 2.1 – Summary of UW-Madison Athletics Operating Expenditures
Category Included in
Model FY 2018
Amount ($M) Modeled
Amount ($M)
All Salaries & Fringe Benefits Yes $58.4 $58.4
Financial Aid Yes $11.5 $11.5
Operational Expenses Yes $46.1 $46.1
Post Season Participation Yes $3.8 $3.8
Transfers to Institution3 Yes $9.8 $9.8
Debt Service No $11.2 $0.0
Total Expenses
$140.7 $129.6 Source: UW-Madison Athletics (2019)
Note: throughout report, columns may not sum due to rounding.
2 The Department’s annual budget also includes capital projects; those are described in the following subsection and analyzed
separately because they behave differently than typical Athletics expenditures. Expenditures include transfers to the University from revenue generated by UW Athletics’ Big Ten TV media share, licensing shares and parking revenues, and UW Athletics band travel expenses. 3 This spending comes from revenue such as the Big Ten Network media share, licensing fees, and parking fees. ESI includes
transfers to institution as an expenditure of Athletics in this model because these are real dollars flowing from the department to the University and results in real expenditures that UW spends on its educational mission.

The Economic Impact of UW-Madison Athletics June 10, 2019
Impact from Direct Spending: Page 16
2.3 Direct Annualized Capital Investments Capital investments in UW Athletics’ facilities
represent another impact spending category.
These investments represent one-time costs
that support the organization’s mission and
goals. ESI analyzes capital spending by
averaging recent past spending over the past
few years in order to smooth for peaks and
valleys in spending.
UW Athletics’ average annualized capital
investment over the past three years is $10.8
million (see Table 2.2). These project costs
include renovations, state-of-good-repair expenses, equipment purchases, and the purchase and
procurement of materials and services. These expenditures touch a wide range of manufacturers and
professional service providers in addition to construction companies within the city and state.
Table 2.2 – Capital Investments made by UW Athletics by Year
Fiscal Year Capital Expenses
(in 2019$ M)4
FY 2017 $8.2
FY 2018 $11.7
FY 2019 $12.6
Total Capital Expenses $32.5
Annualized Capital Impact $10.8 Source: UW-Madison Athletics (2019), Econsult Solutions, Inc. (2019)
It is important to note that preceding this three-year period of capital investments UW Athletics
experienced a greater amount of capital spending from the construction of new facilities such as the
LaBahn Arena ($27.9 million project) in 2012 and the Stephen M. Bennett Student-Athlete Performance
Center ($86 million project) in 2014. These activities are not captured in the analyses. Instead, the
capital investments shown here are primarily for the upkeep and expansion of existing facilities, which
helps to provide a better experience for fans and participants alike. For instance, due to the rising
attendance for volleyball matches, the UW Fieldhouse increased its occupancy capacity from 6,012 to
7,052 by bringing six sections of the upper deck to code in the summer of 2018.
4 Expenditures are inflated to 2019 dollars in order to calculate a three-year average for economic modeling purposes.

The Economic Impact of UW-Madison Athletics June 10, 2019
Impact from Direct Spending: Page 17
While UW Athletics’ capital investments decreased
following the major construction of the new
facilities built in 2012 and 2014, plans are under
way for future capital projects in FY 2019 and
beyond. The annual average in this report’s
calculations does not reflect these major future
capital investments made by UW Athletics. Those
future investments are a part of a major capital
campaign that is planned which will support
significant renovations to Camp Randall Stadium
and the Kohl Center. This spending will represent
substantial growth in capital expenditures
compared to the current spending levels, which are
primarily basic improvements and maintenance.
The completion of significant renovations to the
Nicholas Recreation Center (funded in part by UW
Athletics) as well as updating the facilities used by
football, basketball, and hockey reflects ongoing
investment in a variety of Badger teams. Further,
UW Athletics’ plans to continue to invest in its facilities demonstrate prudent stewardship of its
resources in order to provide a better experience for fans and participants alike.
2.4 Economic Impact from Direct Spending Direct operations and capital investments produce “spillover” effects at each geographic level,
stimulating business activity and supporting employment across a variety of sectors. The total economic
impact is the sum of the direct expenditures made by UW Athletics, the indirect impacts that result from
spending on goods and services with vendors within each geography, and the induced impacts that
result when employees spend their wages in local communities. Indirect and induced impacts grow at
each successive geography, due to more purchasing and recirculation activity happening within the
larger geography and due to a greater capture of downstream activity.
Table 2.3 shows the aggregate annual economic impact from UW Athletics within Madison, Dane
County, the Greater Madison Area, and Wisconsin. In total, operational activities have a $293 million
economic impact within the Wisconsin economy each year, of which 69 percent takes place within the
Madison (city) economy. This economic impact supports 1,590 jobs throughout the state economy, 67
percent of which are located within the city of Madison.
The Nicholas Recreation Center, or “The Nick,”
is the first major building project of UW-
Madison’s Master Plan. The Nick will represent
the future of recreation and wellness at the
University, replacing an aging recreational
facility with a new and modernized recreational
and wellness facility. UW Athletics is
contributing $13.5 million to the $87.5 million
building, which hosts the Badgers’ Swimming
and Diving teams.

The Economic Impact of UW-Madison Athletics June 10, 2019
Impact from Direct Spending: Page 18
Table 2.3 – Economic Impact from Annual Operations
Operating Impacts Madison Dane County Madison Area Wisconsin
Direct Output ($M) $130 $130 $130 $130
Indirect & Induced Output ($M) $74 $124 $126 $163
Total Output ($M) $203 $254 $255 $293
Annual Employment Supported 1,070 1,370 1,370 1,590
Employee Compensation ($M) $79 $94 $94 $111
Source: UW-Madison Athletics (2019), IMPLAN (2015), Econsult Solutions, Inc. (2019)
Table 2.4 shows the aggregate economic impact from annualized average capital investments made by
the Athletics Department of UW-Madison. In total, capital investments has a $20 million economic
impact within the Wisconsin economy each year. As noted in a previous section, due to the future major
capital investments to athletics facilities, the annual economic impact of capital investments will likely
increase significantly in future years.
Table 2.4 – Annualized Economic Impact from Capital Investments
Capital Impacts Madison Dane County Madison Area Wisconsin
Direct Output ($M) $11 $11 $11 $11
Indirect & Induced Output ($M) $3 $8 $8 $9
Total Output ($M) $14 $18 $19 $20
Annual Employment Supported 80 110 110 110
Employee Compensation ($M) $5 $6 $6 $6
Source: UW-Madison Athletics (2019), IMPLAN (2015), Econsult Solutions, Inc. (2019)
In the aggregate, the annual economic impact from operational activities and annualized capital
investments produce a $313 million economic impact on the Wisconsin economy each year, of which
nearly 70 percent is enjoyed within the Madison economy.
Table 2.5 – Aggregate Economic Impact from Operations and Capital Investments
Madison Dane County Madison Area Wisconsin
Direct Output ($M) $140 $140 $140 $140
Indirect & Induced Output ($M) $77 $132 $133 $172
Total Output ($M) $218 $272 $274 $313
Annual Employment Supported 1,150 1,480 1,480 1,700
Employee Compensation ($M) $84 $99 $100 $117
Source: UW-Madison Athletics (2019), IMPLAN (2015), Econsult Solutions, Inc. (2019)

The Economic Impact of UW-Madison Athletics June 10, 2019
Impact from Direct Spending: Page 19
2.5 Industry Distribution of Economic Impact from Direct Spending While the activity of the Athletics Department of UW-Madison exclusively focuses on athletics, the
economic impact of that activity supports additional economic activity beyond this sector. More than 70
percent of the jobs generated by UW Athletics’ operational impact are in industries supported by
procurement of various goods and services or by the income earned by employees who then spend
those earnings into the local and state economies. These supported industries include arts,
entertainment, and recreation (26 percent of the indirect and induced impact); educational services (20
percent); health care and social assistance (8 percent); and food and beverage services (6 percent) (see
Figure 2.1).
Figure 2.1 – Industry Distribution of Statewide Employment Impact from Annual Ongoing Operations
Source: IMPLAN (2015), Piktochart (2019), Econsult Solutions, Inc. (2019)
The economic impacts associated with UW Athletics annual capital investments result in continued
economic activity for the construction sector, but the impacts spread beyond that as spending from
construction, goods and services, and workers’ salaries recirculate in the local economy. The annualized
capital investments into UW Athletics facilities support about 110 jobs each year, inclusive of the
indirect and induced impacts. Figure 2.2 shows the proportion of the total employment impact
associated with capital investments that has accrued in and beyond the construction industry within
Wisconsin. Approximately 45 percent of the employment supported by capital investments is in sectors
outside of construction. Major industries supported include retail trade (23 percent of the indirect and
induced impact), professional and technical services (12 percent), health care and social assistance (11
percent), and food and beverage services (9 percent).

The Economic Impact of UW-Madison Athletics June 10, 2019
Impact from Direct Spending: Page 20
Figure 2.2 – Industry Distribution of Statewide Employment Impact from Annual Capital Investments
Source: IMPLAN (2015), Piktochart (2019), Econsult Solutions, Inc. (2019)
2.6 Tax Revenue Impact from Direct Spending Although UW Athletics is a not-for-profit entity, the fiscal impacts generated by its activity are
substantial. University of Wisconsin-Madison is a mission-driven institution, which seeks to foster an
enrichening learning environment and maintain a level of excellence and standards in all programs. UW
Athletics, as part of this mission-driven institution, echoes these values. UW Athletics provides student-
athletes with opportunities to excel, which advances their athletic, academic, and social development.
While it is a not-for-profit institution and does not pay taxes, UW’s operations and capital investments
generate tax revenues for the State government. These operating and capital outlays increase the State
of Wisconsin’s tax bases directly by employing staff which generates taxable income, and indirectly via
spending by vendors and employees. The same is true for UW Athletics. It is estimated that impacts
from UW Athletics operations generate about $5.3 million in personal income and business income
tax revenue for the State of Wisconsin each year; an additional $400,000 in annual State tax revenues
is generated from UW Athletics’ capital expenses (see Table 2.6).
Table 2.6 – Estimated Annual Tax Revenue Impact from UW Athletics Operations and Capital Expenses to the State of Wisconsin
Tax Type Operations Capital Expenses Total
Income ($M) $3.9 $0.2 $4.1
Sales ($M) $1.2 $0.2 $1.4
Business ($M) $0.2 $0.0 $0.2
Total $5.3 $0.4 $5.7 Source: Wisconsin CAFR (2017), Econsult Solutions, Inc. (2019)

The Economic Impact of UW-Madison Athletics June 10, 2019
Impact from Participant/Attendee Spending: Page 21
Impact from Participant/Attendee Spending 3.
3.1 Section Overview Each year, the University of Wisconsin-Madison hosts numerous athletic
events which attract both local and outside visitors. During the 2017-
2018 academic year, the University hosted 180 athletic events with an
attendance of approximately 1,328,000. The University also hosts many
athletic events that are not affiliated with any of the University’s athletics
teams. Over 50 external athletic events were hosted that year with an
estimated attendance total of 276,000; and over 200,000 visitors came to
sports camps, concerts, and other events hosted at UW Athletics
facilities. These visitors who come to UW-Madison to enjoy these events
also make a significant economic impact on the local community as they shop, dine, and stay in hotels
near the campus and throughout the region.
This visitor spending has broader implications for the local, regional, and state economy, as visitors from
outside the area serve as a net import to Madison and Wisconsin. Their spending generates subsequent
indirect and induced impacts as stores, restaurants, hotels, and other businesses purchase goods and
pay local residents.
In total, UW Athletics is responsible for drawing in 1.8 million visitors annually, and it is estimated
that these visitors spend $203 million in the Wisconsin economy. This influx of spending generates an
annual economic impact of $298 million within Wisconsin and supports about 2,800 jobs throughout
the state.
Unlike the previous section, which covered direct
spending by UW Athletics and was based on
information provided by UW Athletics, these
ancillary spending amounts are based on a
combination of direct information from UW
Athletics and assumptions anchored by research.
Where possible, a conservative approach was taken
to arrive at these estimates, in order to avoid
overstating these amounts.
3.2 Modeling UW Athletics Visitor Activity Throughout the academic year and over the summer, UW Athletics attracts thousands of visitors to its
campus on any given day. These visitors come from all over the country and spend a significant amount
of money within the local Madison economy each year, which supports employment and generates tax
revenues for Madison and Wisconsin. Thousands of alumni, parents, student-athletes, and fans come to
$203 million
aggregate visitor
spending brought
into Wisconsin

The Economic Impact of UW-Madison Athletics June 10, 2019
Impact from Participant/Attendee Spending: Page 22
campus for collegiate sporting events, athletic tournaments, UW-Madison’s Commencement, and other
events hosted at UW Athletics facilities.
As a magnet for visitors, UW Athletics plays an important role in the larger
tourism industry in the Madison area. In addition to major events like fall
football weekends, basketball, and hockey games, UW Athletics’ facilities
host events that attract local, regional, and overnight visitors throughout the
year. By attracting visitors year-round, Athletics supports demand for hotel
rooms, retail, and dining, helping the industry maintain jobs through the year.
In fact, UW Athletics, in conjunction with other annual, significant events
within Madison, such as the World Dairy Expo and Ironman Triathlon, have been credited with growing
demand for local hotel rooms in recent years.5 The value of events and conferences to a region that
draws outside spending cannot be overstated, as the activity represents new dollars into the local
economy, and in this regard, UW Athletics plays a substantial role in attracting spending to the region.
Figure 3.1 – Geographic Distribution of UW Athletics Intercollegiate Sports Visitors
Source: UW-Madison Athletics (2019), Econsult Solutions, Inc. (2019)
To accurately estimate aggregate visitor spending, it was necessary to not only determine a credible
estimate of visitors but also sort those visitors into different spending profiles, recognizing that not all
visitors have the same economic footprint. Based on reason for visit and duration of trip, distance
traveled, event type, and visitor age, unique spending pattern behaviors were created, and where
possible, conservative assumptions were used.
5 Abigail Becker, “Growth in number of Madison-area hotel rooms largest since 2008.” The Capital Times, January 11, 2018.
12 percent of UW
Athletics event
attendees are
coming from outside
the region.

The Economic Impact of UW-Madison Athletics June 10, 2019
Impact from Participant/Attendee Spending: Page 23
UW Athletics provided the attendance
figures for their events, which ESI then
sorted into separate categories in order
to develop visitor and spending
estimates:
Football participants and
attendees, for which we
estimate both a higher out-of-
town proportion and a higher
daily spending amount because football games coincide with the region’s peak travel season
(autumn) and are associated with higher hotel room rates and other expenditures.
Other UW Athletics Intercollegiate Sports participants and attendees, which includes women’s
and men’s basketball, women’s and men’s hockey, volleyball, and other major sporting events.
General Visitors include attendees of non-collegiate sporting events or tournaments, UW-
Madison Commencement, banquets, and other non-athletic events held at UW Athletics’
facilities.
It is helpful to categorize visitors in this way in order to account for
differences in travel and spending patterns within each group of
attendees. Through conversations with UW Athletics, ESI was able to
understand participants’ spending patterns and developed three visitor
spending profiles based on the visitor origin: 1) local, 2) regional/day
trip, and 3) overnight. Spending profiles were established, using four
major expenditure categories: 1) hotel/lodging, 2) food, 3)
transportation, and 4) retail expenditures. Students/local attendees
have the lowest spending amounts because they will not incur hotel or transportation expenditures;
their food and retail expenditures are also smaller. Regional/day trip attendees will incur more
transportation, food, and retail expenditures as they are traveling from a farther distance to the event.
Overnight attendees, who are traveling from an even farther distance that warrants an overnight stay,
will incur hotel/lodging expenses in addition to food, transportation, and retail expenditures.
In addition to the attendance figures provided by UW Athletics, attendance figures also include football
tailgaters, members of the media, and visiting teams for athletics events, which we define as
“participants.” ESI excludes workers maintaining or managing the event, who are often accounted for in
official attendance figures, since this impact is already accounted for in the previous section (direct
operating activities). The participants’ figures came from a combination of data that are publicly
available on the number of visiting teams that come to UW, and data also provided by UW Athletics.
Spending patterns are influenced by the distance traveled to Madison, and ESI applies the same
methodology for both attendees and participants (see Appendix C for more detail on the methodology).
1.8 million
visitors to Madison
each year

The Economic Impact of UW-Madison Athletics June 10, 2019
Impact from Participant/Attendee Spending: Page 24
3.3 Impact from Football Participants/Attendees Many attendees come from out of the
region to watch UW’s football team,
which carries a national following and
accounts for a plurality of total athletic
event attendance. In addition to
attendees, each team competing against
UW-Madison brings with them their own
fans, staff, and media. In total, there were
over 580,000 participants and attendees
of football games held at UW-Madison in
the fall of 2017 season. As noted in
Section 3.2, football has a higher spending
profile due to its national following and
due to peak travel times in Madison, in
part because home football games create
a heightened demand for lodging during
this time and they occur at a time of peak
travel to Madison. Out of town visitors for football stay the weekend and spend more on average than
other sports’ spectators. Spending profiles for football were created for students and local attendees,
regional attendees, and overnight attendees (see Table 3.1 and the appendix).
Table 3.1 – Participants/Attendees for Home Football Games by Visitor Type, 2017 Season
Visitor Type Spectators
Students and Local 184,200
Regional (Day Trip) 310,700
Overnight 90,000
Total 584,900 Source: UW-Madison Athletics (2019), Econsult Solutions, Inc. (2019)
Based on our estimated spending profiles, aggregate ancillary
spending by football games yields approximately $54 million in
Madison, $66 million in Dane County, $73 million in the Greater
Madison Area, and $78 million in Wisconsin each year. However,
an adjustment is made to account for the fact that some of that
spending immediately leaves the region and therefore does not
have a multiplier effect within the regional economy. For
example, a large proportion of retail spending goes to
manufacturers and wholesalers, most of which are outside the region. Therefore, our modeling
approach conservatively includes only the retail margin (i.e. the difference between the purchase price
for the retailer and the sales price for the customer). Based on this adjustment, the amount of spending
Football’s presence in annual
bowls elevates the reputation
of Wisconsin nationally, which
encourages the fan base to
further support the team and
attend home games.
According to national rankings from USA Today, Madison
is frequently named the top college football town in the
U.S. thanks to the Badgers.

The Economic Impact of UW-Madison Athletics June 10, 2019
Impact from Participant/Attendee Spending: Page 25
included in our analysis is $45 million of modelable activity within Madison, $55 million within Dane
County, $62 million within the Greater Madison Area, and $66 million within Wisconsin (see Table 3.2).
Table 3.2 – Total Ancillary Spending for Home Football Games by Visitor Type and Geography ($M)
Visitor Type Madison Dane County Madison Area Wisconsin
Students and Local $4 $5 $5 $6
Regional $17 $19 $20 $21
Overnight $33 $42 $48 $52
Total $54 $66 $73 $78
Minus Non-Modeled Amount ($9) ($11) ($11) ($12)
Modeled Amount $45 $55 $62 $66 Source: UW-Madison Athletics (2019), Econsult Solutions, Inc. (2019)
The influx of ancillary spending by students, participants, and attendees
has a multiplier effect throughout the region, helping to support the
tourism economy in Madison and Wisconsin. Table 3.3 shows the
aggregate annual economic impact from ancillary spending due to home
football games. This yields $67 million in economic impact within the
Madison economy, supporting about 700 jobs within the city, and $114
million within the Wisconsin economy each year, supporting about 1,100
jobs within the state.
Table 3.3 – Annual Economic Impact from Ancillary Spending by Football Participants/Attendees
Madison Dane County Madison Area Wisconsin
Direct Output ($M) $45 $55 $62 $66
Indirect & Induced Output ($M) $22 $37 $40 $48
Total Output ($M) $67 $92 $102 $114
Annual Employment Supported 690 900 990 1,080
Employee Compensation ($M) $18 $25 $28 $31
Source: UW-Madison Athletics (2019), IMPLAN (2015), Econsult Solutions, Inc. (2019)
$16 million
total economic impact on
the Wisconsin economy
for each home
football game

The Economic Impact of UW-Madison Athletics June 10, 2019
Impact from Participant/Attendee Spending: Page 26

The Economic Impact of UW-Madison Athletics June 10, 2019
Impact from Participant/Attendee Spending: Page 27
3.4 Impact from Participants/Attendees of Other UW Athletics Intercollegiate Sports
UW Athletics also boasts a number of other
teams that draw in visitors to the region, such
as basketball, hockey, and volleyball. While
the impact of football is modeled separately
from other UW Athletics events, UW has
many other prominent sports programs with
highly competitive teams that regularly win
championships and have record-setting
attendance each season. These athletic
events draw in nearly 800,000 visitors to UW-
Madison (see Table 3.4). Similar to football,
these athletics events attract visitors to the
region, drawing in new dollars to the local and
state economies and generating additional
economic activity.
Table 3.4 – Participants and Attendees by Sport and by Visitor Type, 2017-18 Season
Sport (# of Home Games) Students and Local Regional (Day Trip) Overnight
Men's Basketball (18) 138,700 180,000 21,000
Men's Hockey (19) 78,600 99,000 19,500
Women's Basketball (17) 21,300 25,500 12,400
Women's Hockey (17) 14,300 18,000 5,500
Volleyball (10) 23,900 32,600 3,900
Other Athletics6 32,900 42,000 9,300
Total 309,700 397,100 71,600 Source: UW-Madison Athletics (2019), Econsult Solutions, Inc. (2019)
Attendance figures are rounded
After adjusting for non-modelable amounts due to retail spending, aggregate ancillary spending by all
other UW Athletics intercollegiate sports besides football yields $26 million of modelable spending
within Madison, $30 million within Dane County, $32 million within the Greater Madison Area, and $34
million within Wisconsin (see Table 3.5).
6 Other Athletics include sporting events such as cross country, golf, soccer, softball, tennis, and wrestling.
In the 2017-18 season, the women’s hockey team
led the country in announced attendance, a 99.6
percent occupancy rate at the LaBahn Arena. Men’s
hockey ranked second in the country for home
game attendance, with 10,000 fans on average per
game. The team also led the Big Ten in home
attendance with 198,000 spectators.

The Economic Impact of UW-Madison Athletics June 10, 2019
Impact from Participant/Attendee Spending: Page 28
Table 3.5 – Ancillary Spending for Other UW Athletics Intercollegiate Sports by Visitor Type and Geography ($M)
Visitor Type Madison Dane County Madison Area Wisconsin
Regional Visitors $21 $24 $26 $27
Overnight Visitors $10 $13 $14 $15
Total $32 $37 $40 $42
Minus Non-Modeled Amount ($6) ($8) ($8) ($8)
Modeled Amount $26 $30 $32 $34 Source: UW-Madison Athletics (2019), Econsult Solutions, Inc. (2019)
Once a visitor has completed their time on
campus, they frequently spend additionally
on food, lodging, or retail items in the
businesses in the region, thus generating
additional economic activity. This influx of
ancillary spending by visitors of UW Athletics
intercollegiate sports besides football has a
multiplier effect throughout the region,
generating annual economic impacts.
Annually, ancillary spending generates $37
million within the Madison economy and $58
million within the Wisconsin economy.
Table 3.6 – Annual Economic Impact from Ancillary Spending by Participants/Attendees of Other UW Athletics Intercollegiate Sports
Madison Dane County Madison Area Wisconsin
Direct Output ($M) $26 $30 $32 $34
Indirect & Induced Output ($M) $11 $19 $21 $24
Total Output ($M) $37 $49 $53 $58
Annual Employment Supported 410 500 540 580
Employee Compensation ($M) $9 $13 $14 $16
Source: UW-Madison Athletics (2019), IMPLAN (2015), Econsult Solutions, Inc. (2019)

The Economic Impact of UW-Madison Athletics June 10, 2019
Impact from Participant/Attendee Spending: Page 29
3.5 Impact from Other Events Hosted by UW Athletics While a large proportion of ancillary spending
comes from intercollegiate athletic events, UW
Athletics regularly serves as a host to many
visitors for various non-collegiate sports such as
tournaments, sports camps, and other athletic
events. UW Athletics’ facilities also provide
space for UW-Madison’s Commencement, as
well as other non-sporting events such as
concerts, special events, banquets, and facility
tours. Other UW Athletics events are estimated
to draw in nearly 500,000 visitors annually (see
Table 3.7).
Of particular importance, from an ancillary spending standpoint, are the many statewide conferences
and tournaments hosted by UW Athletics. Thanks to UW Athletics’ extensive facilities, annual
conferences and tournaments are drawn to Madison each year such as the WIAA Boys State Basketball
championships. These types of events span multiple days and draw in even more overnight attendees,
attracting visitors from across the state and beyond, often spending money in the local economy on
their trip.
Table 3.7 – Number of Visitors by Event and Visitor Type, 2017-18
Event Type Students and Local Regional (Day Trip) Overnight
External Athletic Events 69,100 71,200 136,000
UW-Madison Commencement 15,900 15,900 31,800
Badger Sports Camps 3,300 6,700 3,300
Miscellaneous Events 79,600 35,900 15,900
Total 167,900 129,700 187,000 Source: UW-Madison Athletics (2019), Econsult Solutions, Inc. (2019)
After adjusting for non-modelable amounts due to retail
spending, aggregate ancillary spending by other events
hosted at UW Athletics yields $49 million of modelable
spending within Madison, $61 million within Dane
County, $68 million within the Greater Madison Area,
and $74 million within Wisconsin (see Table 3.8).
Destination Madison, the city’s tourism
bureau, cites UW as a key reason to visit
Madison—touting the Badgers’ athletic
achievements and spirit as a major draw.

The Economic Impact of UW-Madison Athletics June 10, 2019
Impact from Participant/Attendee Spending: Page 30
Table 3.8 – Aggregate Ancillary Spending for Other Events Hosted by UW Athletics, by Visitor Type and Geography ($M)
Visitor Type Madison Dane County Madison Area Wisconsin
Regional Visitors $7 $8 $8 $9
Overnight Visitors $49 $61 $68 $74
Total $56 $69 $76 $82
Minus Non-Modeled Amount ($6) ($8) ($8) ($9)
Modeled Amount $49 $61 $68 $74 Source: UW-Madison Athletics (2019), Econsult Solutions, Inc. (2019)
The influx of ancillary spending by visitors and attendees of other hosted UW Athletics events has a
multiplier effect throughout the region, helping to support the tourism economy in Madison and
Wisconsin. Table 3.9 shows the aggregate annual economic impact from ancillary spending due to other
events hosted at UW Athletics facilities besides UW Athletics intercollegiate events. This yields $73
million in economic impact within the Madison economy and $125 million within the Wisconsin
economy each year.
Table 3.9 – Annual Economic Impact from Ancillary Spending by Participants/Attendees of Other Events Hosted by UW Athletics
Madison Dane County Madison Area Wisconsin
Direct Output ($M) $49 $61 $68 $74
Indirect & Induced Output ($M) $23 $40 $43 $52
Total Output ($M) $73 $101 $111 $125
Annual Employment Supported 700 930 1,030 1,120
Employee Compensation ($M) $20 $27 $30 $33
Source: UW-Madison Athletics (2019), IMPLAN (2015), Econsult Solutions, Inc. (2019)
3.6 Aggregate Economic Impact Combined, ancillary spending generated by all UW Athletics intercollegiate events and non-athletic
events hosted at UW Athletics facilities generates a sustained economic impact on the local and state
economies. In total, more than 1.8 million attend or participate in an activity on the UW Athletics
campus.
Table 3.10 – Total Visitors to UW Athletics by Visitor Category and Event Category (2017-2018)
Students/Local Regional
(day trip) Overnight Total
Football 184,200 310,700 90,000 584,900
Other UW Athletics Events 309,700 397,100 71,600 778,400
Other UW Athletics Hosted Events 167,900 129,600 187,100 484,600
Total 661,800 837,400 348,700 1,847,900 Source: UW-Madison Athletics (2019)

The Economic Impact of UW-Madison Athletics June 10, 2019
Impact from Participant/Attendee Spending: Page 31
Table 3.11 shows the aggregate annual economic impact from ancillary spending produced by these
visitors. This yields $177 million in economic impact within the Madison economy and $298 million
within the Wisconsin economy each year.
Table 3.11 – Annual Economic Impact from Ancillary Spending
Madison Dane County Madison Area Wisconsin
Direct Output ($M) $120 $146 $162 $174
Indirect & Induced Output ($M) $57 $96 $104 $124
Total Output ($M) $177 $242 $266 $298
Annual Employment Supported 1,800 2,330 2,560 2,780
Employee Compensation ($M) $46 $66 $72 $80
Source: UW-Madison Athletics (2019), IMPLAN (2015), Econsult Solutions, Inc. (2019)
3.7 Industry Distribution of Economic Impact from Participant and Attendee Spending
Spending by participants and attendees directly impacts a number of industries, and in turn creates a
multiplier effect that reaches additional industries. This influx of spending into Wisconsin supports jobs
in a wide range of sectors statewide, particularly food and beverage services, retail, transportation and
warehousing, and administrative services.
Figure 3.2 – Industry Distribution of Statewide Employment Impact Generated by Ancillary Spending
Source: IMPLAN (2015), Econsult Solutions, Inc. (2019)

The Economic Impact of UW-Madison Athletics June 10, 2019
Impact from Participant/Attendee Spending: Page 32
3.8 Tax Revenue Impact from Participant/Attendee Spending Student and visitor spending also boosts various local and state tax bases, creating tax revenues for
various government justifications each year. It is estimated that the economic impact that results from
UW Athletics student and visitor spending produces about $6 million in tax revenues for the State of
Wisconsin each year. The City of Madison also issues a room tax on all hotel rooms and short-term
rentals (fewer than 29 nights). Thus, overnight visitors drawn to Madison due to athletic and other
events generate tax revenue from their hotel/lodging spending. This is estimated to be about $1.7
million each year (see Table 3.12).
Table 3.12 – Estimated Annual Tax Revenue Impact from UW Athletics Ancillary Spending
Tax Type City of
Madison State of
Wisconsin
Income ($M) - $2.7
Sales ($M) - $2.8
Business ($M) - $0.5
Hotel/Lodging ($M) $1.7 -
Total ($M) $1.7 $6.0 Source: City of Madison (2019), Wisconsin CAFR (2017), Econsult Solutions, Inc. (2019)

The Economic Impact of UW-Madison Athletics June 10, 2019
Impact from Additional Ancillary Spending: Page 33
Impact from Additional Ancillary Spending 4.
4.1 Section Overview Beyond the ancillary spending drawn to campus by UW Athletics events, UW Athletics can take credit for
two additional forms of spending that also have a multiplier effect throughout the state economy. The
first is the purchase of UW-licensed merchandise in locations besides campus or at times other than
when attendees are on campus for an event. The second is media buys associated with UW Athletics
events. These additional spending categories, which can be estimated in part using data from UW
Athletics, represent additional spending that enriches the state economy. While it is more difficult to
calculate the full scope of their impact because of the proprietary nature of some of the variables, it is
important to be considered when taking into account the overall impact of UW Athletics. Therefore,
these impacts have not been added to the overall economic impact of UW Athletics, but they do
represent economic activity beyond the categories previously described in this report.
4.2 Impact from Spending on Licensed Merchandise UW Athletics’ brand, sports teams, and sporting
events are valuable products; and other businesses
license the imagery related to these products in order
to sell branded merchandise. Although UW Athletics
does not make the merchandise, it allows others to
make and sell products with UW Athletics imagery,
and it collects a licensing fee off of the sale of the
merchandise. That licensing fee is a benefit to UW
Athletics, which it uses to invest in its student-athletes
through providing scholarships, enhancing programing, and improving facilities. The revenues accrued
to UW Athletics through licensing revenue has already been accounted for in the operations impact
calculated in Section 2.
UW Athletics can also take credit for the impact from purchases of licensed merchandise in the local and
state economies. When Badger merchandise is purchased within the Madison area or in the state of
Wisconsin, some of that money flows through the economy (see Figure 4.1). The licensing fee paid to
UW Athletics is only a fraction of the merchandise retail price. For every $40 sweatshirt sold by a
merchant that sells licensed UW Athletics merchandise, the merchant might pay $4 to UW Athletics in
licensing fees, resulting in a licensing fee of ten percent of the retail price (licensing fees can range from
five to ten percent).
UW Athletics merchandise is sold all over the country, including throughout the state of Wisconsin.
Those sales represent business activity throughout the state, and while only a portion of the retail price
“Bucky’s Tuition Promise” pledges to cover
four years of tuition and certain fees for all
in-state students who are accepted to UW-
Madison and come from families with
incomes below the state median. The
anticipated costs are paid in part from
revenue sources such as licensing royalties.

The Economic Impact of UW-Madison Athletics June 10, 2019
Impact from Additional Ancillary Spending: Page 34
actually stays in the state economy (much of it goes to the original manufacturer), the portion that does
stay benefits local businesses, and therefore supports jobs in the state economy.
As noted above, approximately $4 of the $40 retail price for a t-shirt is paid to UW Athletics as a
licensing fee. Of the remaining $36, the majority goes to the original manufacturer, who is most likely
out of state. What remains in the state is the margin to the retail merchant, the cut to the wholesaler,
and any other remaining cuts to those responsible for transporting and warehousing the product. In all,
25 to 50 percent of the retail price stays in-state to support the local economy.
Last year, UW Athletics earned $4.3 million
in licensing revenue. Conservatively
assuming a licensing fee percentage of ten
percent would indicate retail sales of $43
million, generating $10.75 million in new
economic activity. However, some of those
retail sales are happening outside of
Wisconsin, thereby not generating local
economic impact. Further, visitors to UW Athletics events who then purchase Badger merchandise
account for some of the retail purchases of branded merchandise. As we have accounted for the
spending of those visitors in the previous section, we need to additionally reduce our calculation to
estimate the net new economic activity spurred by the purchase of licensed merchandise.
Table 4.1 – Estimate of the Economic Impact of Spending on UW Athletics Licensed Merchandise
Calculation Estimate
Licensing Revenue Earned by UW Athletics $4,300,000
(÷)Licensing Fee % 10%
(=) Implied Sales $43,000,000
(x) Percent Retained Locally 25%
(=) Local Direct Impact $10,750,000
(x) Adjustment for Sales Already Accounted For 50%
(=) Net New Sales $5,375,000
(x) Economic Multiplier7 1.79
(=) Total Net New Impact $9,632,000 Source: UW-Madison Athletics (2019), IMPLAN (2015), Econsult Solutions, Inc. (2019)
With these considerations, we can conservatively estimate that purchases of licensed UW Athletics
merchandise add $9.6 million in net new economic activity in the state. The multiplier effect within the
7 Data from IMPLAN indicates that the multiplier effect for retail stores in Wisconsin can range from 1.79 to 1.95. We have
conservatively used the low estimate of 1.79 for this calculation.
UW Athletics sponsors an official merchandise store,
Bucky’s Locker Room, with 13 locations in the state
and an accessible online store for shipping around the
world. The store takes pride in its wide selection of
high quality gear for UW fans, students, and alumni.
UW Athletics receives a portion of the stores’ profits to
support the department and its student-athletes.

The Economic Impact of UW-Madison Athletics June 10, 2019
Impact from Additional Ancillary Spending: Page 35
state economy means the total economic impact could be $9.6 million in Wisconsin per year. While we
have not added this amount to the overall economic impact of UW Athletics, it illustrates another way
that UW Athletics, by licensing its imagery to merchants, supports the state economy.
Figure 4.1 – How Does the Purchase of Wisconsin Merchandise Impact the State Economy?

The Economic Impact of UW-Madison Athletics June 10, 2019
Impact from Additional Ancillary Spending: Page 36
4.3 Impact from Spending on Media Buys UW Athletics also attracts ancillary spending through the media companies that are interested in
broadcasting athletic events and selling advertisement space during that air time. Some of that ad space
is used by UW Athletics itself, which imparts no small value to UW Athletics, UW, and the State of
Wisconsin through promotion to a local, regional, and national audience. The value of these
reputational gains is explored further in the next section. This section focuses on the impact not to UW
Athletics but from UW Athletics to the state economy, which comes in two forms.
First, out-of-state advertisers pay money to advertise during a UW Athletics event. That represents new
dollars that are drawn into the state from elsewhere and which produce a multiplier effect, supporting
local jobs and local tax bases. Second, in-state advertisers use the advertising opportunity to promote
their businesses and therefore gain more sales. The ability to advertise in this way thus grows the state
economy by generating more sales.
That means that for every UW Athletics game
that is broadcast, local and national companies
have the opportunity to advertise to a captive
audience of Badger fans and other sports
enthusiasts—generating economic activity
through their ad spending and expanding their
business with a new customer base. Data
provided by UW Athletics was used to estimate
a conservative number of advertisement activity
that occurs during a season. Table 4.2 estimates
that total volume of advertising exposure that
occurs during a typical season for the four
largest Athletics teams. In total more than 2,000
advertising slots are supported by these four teams’ broadcasted games—a conservative estimate that
does not include the longer commercial slots during halftimes.
Table 4.2 – Estimate of Advertising Slots from a Sample of Broadcasted UW Athletics Teams8
Team Games per
season Advertising
spots per game Total Ads per
season
Football 7 74 518
Men's Basketball 20 42 840
Men's Hockey 19 12 228
Women's Basketball 17 17 28 476 Source: UW-Madison Athletics (2019)
8 Commercials spots are typically 30 seconds in length. These estimates are a conservative estimate as they did not include
commercials between halves or periods for football, men’s basketball, or men’s hockey.
The Big Ten Network (BTN), launched in 2007, is
the first national conference-owned television
network. As a member of the Big Ten, the
University of Wisconsin-Madison receives revenue
generated by advertising when a UW Athletics
game airs on the Big Ten Network. This agreement
is a major way in which UW Athletics supports its
operating activities. This also impacts the
University as a portion of this revenue is directly
transferred to the University, resulting in
increased funding for need-based aid,
enhancements to campus libraries, and additional
funding for other activities at the University.

The Economic Impact of UW-Madison Athletics June 10, 2019
Impact from Additional Ancillary Spending: Page 37
Figure 4.2 – How Ads Sold During UW Athletics Events Benefit the Local Economy
While this activity certainly supports additional
net new economic activity in the state, the
specifics of the amount, dollar value, and
advertiser information are all proprietary. We
therefore have not quantified this activity nor
added it to the overall estimate of UW Athletics’
economic impact in Wisconsin. Nevertheless,
this is yet another way that UW Athletics
generates economic activity and economic
impact in the state above and beyond its own
footprint.
Beyond the value of spending on commercials
and the subsequent economic activity that they
generate, there is an additional value related to
media exposure—the elevated visibility of UW
on the national stage when the Badgers play on
ESPN, the Big Ten Network, ABC, CBS, or other
channels. The following section describes those
reputational and social impacts in greater detail.
UW-Madison has a longtime partnership with American
Family Insurance, through which American Family has
promised to financially contribute to research,
academics, service, and athletics at UW. In exchange,
American Family is named the “Official Insurance
Sponsor of UW Athletics” and receives prime
marketing opportunities at UW Athletics events,
including sign advertisements and a gate into Camp
Randall Stadium named after the company. These types
of partnerships mutually benefit the UW community
and the local economy, which has elevated its profile
because of its collaboration with UW Athletics.
The Economic Impact of UW-Madison Athletics June 10, 2019
Broader Societal Impacts: Page 38
Broader Societal Impacts 5.
5.1 Section Overview The overall economic impact of UW Athletics can be seen as the sum of the economic impact from its
capital investments, its operating activities, and the ancillary spending from spectators and other
visitors. Each of these impact categories contributes significantly to regional economic activity and
demonstrates how universities help create vibrant communities and a competitive region. This section
elaborates on the broader societal impacts that UW Athletics’ economic activity supports. That includes
enhancing the reputation of not only the University but also Madison and Wisconsin, as well as
increasing a sense of connectivity and collegiality among UW students, staff, and alumni. In addition,
UW Athletics supports the local and regional community through service, engaging with neighborhood
schools, and educational opportunities. These impacts demonstrate UW Athletics’ role within Madison
and the state as a driver for economic growth, a magnet for talent and visitors, and an invested member
of the community.
5.2 Gains from Reputational Enhancement
Collegiate athletics are not only a major driver of visitation to a region, but have been widely
documented as a way to elevate a university’s reputation among prospective students. The media
coverage and airtime for every UW Athletics game is an opportunity for UW-Madison to showcase itself,
the city of Madison, and the state of Wisconsin. The athletics department of a university thus becomes a
point of entry for prospective students and a way to engage prospective students to learn more about
the university as a whole.
In fact, several studies have assessed the
impact of the success of an athletics
department on a university’s
competitiveness in attracting prospective
students, tracking the number of applications
after a major game win. A study conducted
by Harvard Business School Professor
Douglas J. Chung found that a major football
or basketball win increases applications to a
college by 18.7 percent. As a result of this
increase in applications, colleges can be
more academically selective, which raises the
institution’s standing in national rankings and yields a more intellectually rigorous incoming freshman
class. This study also determined that even students with higher-than-average SAT scores valued athletic
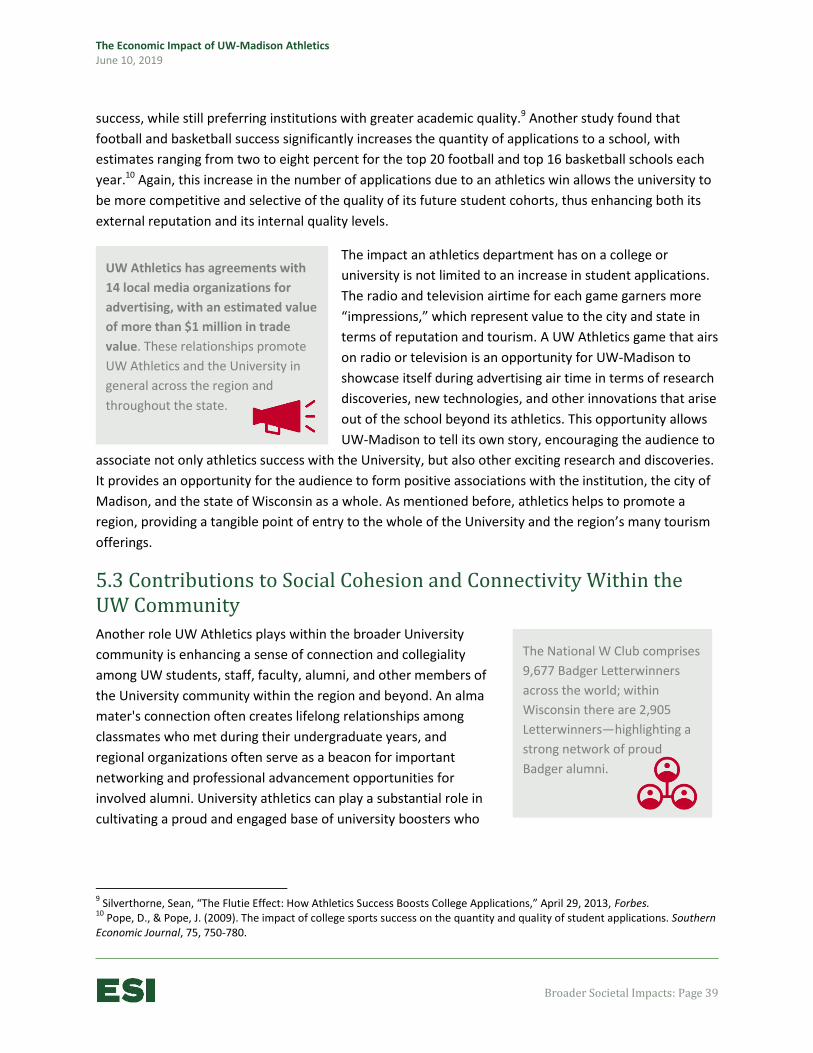
The Economic Impact of UW-Madison Athletics June 10, 2019
Broader Societal Impacts: Page 39
success, while still preferring institutions with greater academic quality.9 Another study found that
football and basketball success significantly increases the quantity of applications to a school, with
estimates ranging from two to eight percent for the top 20 football and top 16 basketball schools each
year.10 Again, this increase in the number of applications due to an athletics win allows the university to
be more competitive and selective of the quality of its future student cohorts, thus enhancing both its
external reputation and its internal quality levels.
The impact an athletics department has on a college or
university is not limited to an increase in student applications.
The radio and television airtime for each game garners more
“impressions,” which represent value to the city and state in
terms of reputation and tourism. A UW Athletics game that airs
on radio or television is an opportunity for UW-Madison to
showcase itself during advertising air time in terms of research
discoveries, new technologies, and other innovations that arise
out of the school beyond its athletics. This opportunity allows
UW-Madison to tell its own story, encouraging the audience to
associate not only athletics success with the University, but also other exciting research and discoveries.
It provides an opportunity for the audience to form positive associations with the institution, the city of
Madison, and the state of Wisconsin as a whole. As mentioned before, athletics helps to promote a
region, providing a tangible point of entry to the whole of the University and the region’s many tourism
offerings.
5.3 Contributions to Social Cohesion and Connectivity Within the UW Community
Another role UW Athletics plays within the broader University
community is enhancing a sense of connection and collegiality
among UW students, staff, faculty, alumni, and other members of
the University community within the region and beyond. An alma
mater's connection often creates lifelong relationships among
classmates who met during their undergraduate years, and
regional organizations often serve as a beacon for important
networking and professional advancement opportunities for
involved alumni. University athletics can play a substantial role in
cultivating a proud and engaged base of university boosters who
9 Silverthorne, Sean, “The Flutie Effect: How Athletics Success Boosts College Applications,” April 29, 2013, Forbes.
10 Pope, D., & Pope, J. (2009). The impact of college sports success on the quantity and quality of student applications. Southern
Economic Journal, 75, 750-780.
The National W Club comprises
9,677 Badger Letterwinners
across the world; within
Wisconsin there are 2,905
Letterwinners—highlighting a
strong network of proud
Badger alumni.
UW Athletics has agreements with
14 local media organizations for
advertising, with an estimated value
of more than $1 million in trade
value. These relationships promote
UW Athletics and the University in
general across the region and
throughout the state.

The Economic Impact of UW-Madison Athletics June 10, 2019
Broader Societal Impacts: Page 40
The Wisconsin Alumni Association has
chapters in more than 75 cities worldwide.
Alumni have the opportunity to get
together to watch Badger games, host
events such as Founders’ Day celebrations,
participate in student send-offs, participate
in networking events, and help raise money
for scholarships.
give back to their alma mater as well as the general university community of which they are a part, a
point that will be discussed further in the ensuing section.11
With numerous successful sports
programs, UW Athletics serves as a
meaningful connector within the
University community. Engagement
with athletics can play a major role in
establishing and maintaining a sense of
community. Being part of a community
helps to improve one’s emotional and
physical well-being. This social
cohesion also helps professional
advancement as athletics can serve as
a common denominator in career networks and helps to close business deals, serving as a conversation
point to stay engaged within that network. Proof of this can be found among alumni of the University
(including those that were not student-athletes), among former student-athletes who continue to build
on the experiences they had as Badgers, and even among Madison residents and Wisconsinites who
have an affinity for the Badgers.
Many university alumni programs offer opportunities to connect with their broader alumni network
through local events and travel. Because of UW Athletics' meaningful role in the UW experience, many
alumni programs center around participating in an Athletics-related event while reconnecting with
fellow former Badgers. For example, the UW Alumni Association offers group tours to away football
games, which includes Wisconsin-style tailgates, welcome events, special souvenirs and more. Many
regional alumni chapters organize watch parties for major sporting events that are televised. These
dynamics are important from a collegiality perspective but also because they are meaningful
engagements for UW alumni to meet, strengthen their relationships, and potentially find or offer
professional, social, or philanthropic opportunities within the community.
11
Young, Elise, “The Gridiron Payoff?” Inside Higher Ed, July 3, 2012.

The Economic Impact of UW-Madison Athletics June 10, 2019
Broader Societal Impacts: Page 41
Another example of social
cohesiveness is within the student-
athletes’ alumni community, thanks to
the unique dynamics of a serious NCAA
Division I sports program such as UW
Athletics. Current and former Badger
student-athletes have an important,
shared experience as elite student-
athletes who have participated in
extensive athletic training during their
college careers. The W Club recognizes
the value of that experience,
cultivating a place for former letterwinners to network, serve the community, and participate in alumni
events.
Collegiate sports often serve as a cohesive force within their host communities—offering a common
denominator for fans. As the flagship campus of the University of Wisconsin System, the prominence of
UW Athletics on the national stage can be seen as a point of pride among Wisconsinites both at home
and away, with the Badgers representing the state competitively across a number of sports.
5.4 Role of Athletics in University Fundraising UW alumni are likely well aware of the impressive reputation that the University boasts as Wisconsin’s
flagship university and as a leading research institution. However, Athletics on its own is an especially
important driver for alumni to connect back with the University and give charitably to the institution. In
fact, in 2018, 13,596 donors contributed $40.2 million to UW Athletics, demonstrating the power that
UW Athletics has in drawing outside dollars into the region (13.5 percent of contributions were from
outside of Wisconsin), and its ability to keep local and regional alumni engaged and drawn to contribute
to UW-Madison.
Athletics programs can play a major role in enhancing
a university’s overall development efforts. A study
conducted by Jonathan Meer and Harvey S. Rosen
analyzed detailed information about donations made
by alumni of a selective research university, which
also included an analysis of the alumni’s economic
and demographic characteristics. The study found
that when a male graduate’s former team wins its
conference championship, his donations for general
purpose increase by seven percent and his donations
to the athletic program increase by about the same
Studies show that NCAA Division I Athletics can
be leveraged for giving to an institution’s
academic programing. Athletics is often an
entry for prospective donors to give additional
gifts to a university’s academic activities. One
study also showed that once a relationship is
formed, donors that are inclined to donate to
athletics frequently contribute in larger
amounts to both the athletic and academic
sides of their institution.

The Economic Impact of UW-Madison Athletics June 10, 2019
Broader Societal Impacts: Page 42
percentage. Overall, athletics’ success can drive overall private contributions.12 Another study
determined that for NCAA Division I institutions, a significant number of new donors who made their
first gift to support athletics programs were twice as likely to give to athletics as well as academic
programs in future donations. The study makes a case for using athletics as a way to attract donors to
the institution, leveraging this to benefit, rather than crowd out, fundraising for academic programs.13
As mentioned in the prior section, athletics offers a source of social
cohesion for alumni, providing a tangible way in which alumni can
connect during game days. Gifts made to an athletics department are a
clear way for alumni to see the direct impact of their gift, such as
contributions to enhancements to existing facilities or scholarships for
student-athletes, which they see during game days on the field or the
court. The impact of alumni donations due to athletics has an impact
on all students—for example, philanthropist Nancy Nicholas, UW-
Madison ’55, made a $20 million gift to the Division of Recreational
Sports in honor of the late Albert “Ab” Nicholas, ’52, MBA ’55. The new recreational facility, the “Nick,”
will replace the aging Southeast Recreational Facility, and include more workout spaces, exercise
studios, basketball courts, and an Olympic-size swimming pool for the swimming and diving teams.
Athletics is contributing $13.5 million to support the completion of the facility. Ab Nicholas, a former
guard for the men’s basketball team, deeply valued his time at UW-Madison and continued to support
the University in a variety of ways after his time there. The gift represents a desire to support as many
students as possible with this new recreational facility.
12
Meer, J., & Rosen, H. (2008). The impact of athletic performance on alumni giving: An analysis of microdata. Economics of Education Review, 28, 287-294. 13
Jeffrey L. Stinson (2017) Leveraging Intercollegiate Athletics to Support Academic Giving at NCAA Division I Institutions, Journal of Nonprofit & Public Sector Marketing, 29:1, 1-19, DOI: 10.1080/10495142.2017.1293582.
“I feel as though my experience with UW
hockey and UW Athletics enhanced me as a
person and helped me to get where I am.
That’s why I thought it was important to give
toward something that other girls and guys
will be using as they make their own
Wisconsin journeys.”
–Sharon Cole, captain of 2005-06 national
women’s hockey championship team
$13.5 million
UW Athletics contribution
to $87.5 million
capital project—
The “Nick”
Recreation Center

The Economic Impact of UW-Madison Athletics June 10, 2019
Broader Societal Impacts: Page 43
5.5 Local Engagement and Service Under the leadership of Director Barry Alvarez, UW Athletics is committed to serving the community in
numerous ways. This is first and foremost reflected in the mission of UW Athletics, in which service to
the community is important to the ethos of UW Athletics and the University.
UW Athletics leverages its recognition on
and off the field to develop meaningful ways
to give back to the community in which it
resides. Badgers Give Back, established in
2012, is dedicated to making a difference in
the community through meaningful
engagement opportunities with UW
student-athletes, staff, and alumni. In 2017-
18, 644 student-athletes participated in the
Badgers Give Back activities, which
partnered with seven community partners
in 361 community events.
Student-athletes also give back to the community in a number of other ways, which further establishes
and echoes the UW Athletics’ ethos of community. This includes a partnership with the Foundation for
Madison Public Schools, where UW Athletics is a participant of the Adopt-a-School program. UW
Athletics has “adopted” Randall Elementary and is using a multifaceted approach to help close the
achievement gap for 370 students. One aspect of the program was a pen-pal program, where 636 letters
were written between Randall students and UW student-athletes in 2017-18. These types of activities
are often the first way that students in less-advantaged schools engage in a university setting.
Participating in programs on college campuses is an opportunity for young students to learn about the
undergraduate experience and serve as a starting point for them to envision a future that includes a
college education.
Never lose sight of what your main goal is and that
is working with young people. [Helping them] not
only become good student-athletes, but good
leaders and good citizens and being involved in
giving back to the community.
—Barry Alvarez, Director of Athletics

The Economic Impact of UW-Madison Athletics June 10, 2019
Broader Societal Impacts: Page 44
Another tradition of community engagement includes weekly hospital visits, called “Badger Fridays,” a
partnership with the American Family Children’s Hospital that allowed all UW teams to visit over 1,000
patients and their families. In tandem with these visits, the “Wish Upon A Badger” program, modeled
after the international Make-A-Wish Foundation, has teams adopt kids for the school year. In 2017-18,
21 children were in the program while they underwent cancer treatments or recovered from major
surgeries. This experience provided them a way to connect and engage with student-athletes, tour UW
Athletics facilities, and helped to foster and extend a supportive community for them as they underwent
major treatments and surgeries. These are but some of the tangible ways in which student-athletes give
back to the greater Madison area, leveraging their recognition, resources, and presence to help youth in
the community.

The Economic Impact of UW-Madison Athletics June 10, 2019
Conclusion: Page 45
Conclusion 6.
6.1 Summary of Economic Impacts UW Athletics’ aggregate economic impact derives from direct, indirect, and induced effects in three
mutually exclusive categories of economic activity directly attributable to the institution:
1. Annual operations, including the broad base of employment, procurement, and administrative
activities that comprise the daily activities of UW Athletics. These impacts are estimated to be at
$293 million annually within the State of Wisconsin.
2. Capital investments, which include state-of-good repairs, renovations, and ongoing maintenance
of facilities. These impacts are estimated at $20 million annually within the state.
3. Ancillary event attendee spending, reflecting participants and attendees drawn to the area by
UW Athletics that support the local hospitality, food, and retail industries. These impacts are
estimated at $298 million within the state.
In the aggregate, UW Athletics generates an annual economic impact of approximately $610 million
within the state, supporting 4,480 jobs and $197 million in earnings (see Table 6.4). Of that impact, $395
million takes place within Madison, supporting 2,950 jobs and $130 million in earnings (see Table 6.1).
Table 6.1 – Annual Economic Impact of UW Athletics on the Madison Economy
Impact Type Operations Capital
Investments Ancillary Event
Attendee Spending Annual Total
Total Output ($M) $203 $14 $177 $395 million
Annual Employment Supported 1,070 80 1,800 2,950
Employee Compensation ($M) $79 $5 $46 $130 million
Tax Revenues ($M) - - $1.7 $1.7 million
Table 6.2 – Annual Economic Impact of UW Athletics on the Dane County Economy
Impact Type Operations Capital
Investments Ancillary Event
Attendee Spending Annual Total
Total Output ($M) $254 $18 $242 $515 million
Annual Employment Supported 1,370 110 2,330 3,810
Employee Compensation ($M) $94 $6 $66 $165 million

The Economic Impact of UW-Madison Athletics June 10, 2019
Conclusion: Page 46
Table 6.3 – Annual Economic Impact of UW Athletics on the Greater Madison Area Economy
Impact Type Operations Capital
Investments Ancillary Event
Attendee Spending Annual Total
Total Output ($M) $255 $19 $266 $540 million
Annual Employment Supported 1,370 110 2,560 4,040
Employee Compensation($M) $94 $6 $72 $171 million
Table 6.4 – Annual Economic Impact of UW Athletics on the Wisconsin Economy
Impact Type Operations Capital
Investments Ancillary Event
Attendee Spending Annual Total
Total Output ($M) $293 $20 $298 $610 million
Annual Employment Supported 1,590 110 2,780 4,480
Employee Compensation ($M) $111 $6 $80 $197 million
Tax Revenues ($M) $5.3 $0.4 $6.0 $12 million
6.2 Return on Investment Articulating the Return on Investment (ROI) of UW Athletics is a simple, yet powerful, way to measure
performance, evaluating the efficiency of an investment by comparing its return relative to the initial
cost. In today’s economy, it has become increasingly popular to evaluate higher education and its
related programs using an ROI framework, especially through the lens of rising tuition rates. At a time
when the higher education proposition is being questioned, it is helpful to understand the ROI from the
perspectives of its stakeholders, including the State of Wisconsin and its taxpayers, the City of Madison
and the community surrounding UW, as well as past, present, and future students and student-athletes.
As a self-funding department within the University, UW Athletics is a net benefit to the institution and to
local, regional, and state economies. Athletics draws from funding sources such as tickets, concessions,
licensees, and media royalties to fully support its program and to generate and transfer resources to the
University for financial aid for students. Importantly, these revenue sources often are drawn from
outside of Wisconsin, whether it is out of town visitors (or opposing teams or national media) coming to
Madison for a game, the purchase of Badger apparel from outside the state, or the returns from fees for
streaming UW Athletics on major networks.
These influxes of dollars produce a significant economic impact on the city and state economies, as
described throughout this report and aggregated in the previous sub-section. They represent a
meaningful return to the local and state economy on investments made by local and state governments.
Having articulated what is meant by “return” in the form of economic activity, jobs supported, and tax
revenues generated, it is instructive to explore what is meant by “investment” in this context.
At a local level, the City of Madison bears some expenditure that make UW Athletics possible, such as
providing public safety resources and investing in infrastructure to handle the visitor volume generated

The Economic Impact of UW-Madison Athletics June 10, 2019
Conclusion: Page 47
by UW Athletics events. At a state level, the State of Wisconsin financially supports the University of
Wisconsin, including UW Athletics. Because universities and their athletic departments are not-for-profit
entities and as such do not pay taxes, they are often accused of not “paying their fair share,” which is an
argument borne of a return on investment framework, namely that the public sector has made some
form of investment in them and does not appear to have received any compensatory return for that
investment. As demonstrated throughout this report, though the University of Wisconsin is at its core an
educational and research institution and UW Athletics is focused on sports, in fact these functions are
major economic engines for the city and state. As has also been demonstrated throughout this report,
though UW and UW Athletics are tax exempt not-for-profit institutions, they are still significant tax-
generating entities for the City and State governments. This then is the return from UW Athletics on the
investment by local and state government, which is a significant multiplier of economic activity, jobs
supported, and tax revenues generated.
6.3 UW Athletics’ Broader Return on Investment Beyond the significant economic activity and positive fiscal impact produced by UW Athletics are
broader returns that are enjoyed at a community, regional, state, and societal level. Investments made
and expenditures borne by UW Athletics improve the visitor experience for thousands of fans and
participants every day, drawing additional dollars into the local and state economy and creating spillover
impacts that positively affect a wide range of industry sectors. They also enhance the reputation of the
University and the state as a whole, yielding a deeper and better student applicant pool, which improves
the University’s national academic rankings as well as the quality of its intellectual community. That has
profound implications for the region’s future competitiveness, since the University is an important
anchor participant and provider of intellectual capital and research infrastructure.
The shared experience of rooting for the home team builds social cohesion that connects together the
broader University diaspora, as a common rooting interest breaks the ice professionally and socially,
expediting business deals and yielding friendships that transcend geography. This same shared
experience is also a powerful upfront introduction and ongoing cultivation as it relates to alumni giving
to the University, which in addition to benefitting the University also draws dollars back to Madison and
Wisconsin (and often also strengthens the connection for alumni to Madison and Wisconsin, resulting in
return trips for business and/or pleasure).
Finally, under the leadership of Athletic Director Alvarez, UW Athletics has instilled a strong
commitment to local engagement and community service. This is reflected in service initiatives that not
only benefit the community but also help form student-athletes who will be caring citizens off the field
during their time on campus and who will be committed to lifelong service upon graduation. Even in
light of the impressive economic impact estimates featured here, as well as the many other broader
benefits described throughout this report, this may be the most important return generated by UW
Athletics—the education and development of young women and men who will remain connected to the
University and the state, and to a commitment to service that they learned as student-athletes.

The Economic Impact of UW-Madison Athletics June 10, 2019
Conclusion: Page 48
UW Athletics Alumni Remain Leaders On and Off the Field
Winner of three varsity rowing letters at UW, Carey Lohrenz has
continued to promote UW’s service ideals through military service,
authorship, and leadership. Lohrenz began a career serving in the US
Navy and quickly became the first female pilot to fly the F-14 Tomcat.
After resigning from the service, Lohrenz began to utilize her military
experience to help encourage others to lead in different contexts.
Carey Lohrenz, ‘90
Badgers’ varsity football lineman Jake Wood decided after graduation
to serve the nation in the Marine Corps. For his service in conflicts in
both Afghanistan and Iraq, Wood was awarded the Marine Corps
Commendation Medal. Now, Wood continues to spread good in his
community. He founded a nonprofit organization, Team Rubicon, that
helps veterans serve in disaster zones, which began when it deployed
Wood and his first team to help with hurricane relief efforts in Haiti.
Jake Wood, ‘05
Meghan Duggan, women’s ice hockey star at UW, continues to play
her sport with the passion of a UW student-athlete. Duggan has
represented her nation in the last three Winter Olympics, serving as
team captain for the last two. She has helped earn the US two silver
medals and one gold medal. Duggan also was a leading figure in the
national team’s efforts to attain compensation equal to that of their
male counterparts.
Meghan Duggan, ‘11
UW-Madison star wide receiver Al Toon, Jr. has excelled as a
professional athlete, businessman, and philanthropist. After playing
for eight seasons with the New York Jets, Toon returned to Wisconsin,
as owner and partner in Olson Toon Landscaping, director and
founding member of Capitol Bank, and operator of several franchises.
He remains active in UW Athletics and committed to service through
his work with the Boys & Girls Club and other organizations.
Al Toon ’85 (pictured on the far right)
Former Badger football All-American J.J. Watt’s impact has been
equally impressive on and off the field. A three-time NFL Defensive
Player of the Year, five-time Pro Bowl selection and 2017 NFL Man of
the Year, Watt has established himself as one of pro football’s elite
performers. His community contributions include raising close to $40
million for Hurricane Harvey relief in 2017. Watt has also raised more
than $1 million through the Justin J. Watt Foundation to support
afterschool athletics programs. J.J. Watt, ‘10
The Economic Impact of UW-Madison Athletics June 10, 2019
Conclusion: Page 49
Appendix A – Report Methodology
The purpose of this appendix is to highlight the scope and methodology of this report and of the quantitative
analysis tools used in it, so that its findings can be properly understood and interpreted. Additional detail on the
methodology and data sources used to calculate the direct economic impact in each component category and the
economic and fiscal modeling undertaken can be found in the appendices that follow.
A.1 Scope of Analysis Economic and fiscal impacts are calculated in four categories of activity: UW Athletics expenditures on operations,
UW Athletics’ expenditures on capital investments, ancillary spending by participants and visitors attracted or
retained by UW Athletics, and other spending generated by ancillary activity. Impacts are calculated on an annual
basis, and are undertaken in non-overlapping fashion, meaning that they can be summed to represent aggregate
impact. The goal of this analysis is to quantify the current annual level of economic activity associated with UW
Athletics. Data inputs on institutional activity are largely provided by UW Athletics, and are verified and
supplemented with other public data sources. In addition, assumptions are at times required to estimate the level
of activity where direct data is not available. These assumptions are anchored in research and available
information, and are detailed transparently throughout the report and appendices.
For each input, the most recent and appropriate available dataset is utilized. In the case of institution data, this
information often but not always covers FY 2018 (the most recently completed fiscal year). In the case of capital
investments, activity levels are averaged over multiple years to generate an appropriate assessment of typical
annual activity. Therefore, the analysis should be understood to represent the current annualized level of activity,
rather than representing the impact for any specific fiscal year.
The geographies of interest for this study are the City of Madison, Dane County, Greater Madison Area, and the
State of Wisconsin. Economic impacts are calculated for each of these geographies, while tax revenue impacts are
calculated for Madison and Wisconsin.
Economic impact analyses can estimate the magnitude of either the net or gross impact of its subject. A net impact
analysis, which sometimes takes the form of a cost-benefit analysis, develops a “counterfactual” that overall
impact amounts are netted against impact levels that might have occurred anyway in place of the subject’s
existence and operations. This form of analyses, while appealing in its economic logic, is often highly speculative. In
this case, such an analysis would require modeling an alternative development path for the local and regional
economy over decades absent UW Athletics. This report takes a gross, rather than net, approach to measuring UW
Athletics’ economic impact. With this approach, the direct, indirect, and induced activity associated with UW
Athletics is estimated without accounting for potential offsetting increases in activity in other institutions or
sectors absent UW Athletics. Therefore, economic impact figures implicitly represent a comparison of current
activity levels to a scenario in which the institution does not exist, and all other activity within the economy is held
constant.
It should also be noted that impacts are only estimated in four categories that are common to economic impact
studies, and for which data sources and calculation frameworks are well-defined. However, these categories do
not represent the only potential economic impacts of UW Athletics, which contributes to knowledge activity in
ways that defy straightforward quantification. Thus, while aggregate results in this analysis are gross rather than
net, they are conservative as to the categories of impact that can be reliably measured.

The Economic Impact of UW-Madison Athletics June 10, 2019
Conclusion: Page 50
Appendix B – Economic and Fiscal Impact Models
Economic impact estimates are generated by estimating the initial amount of direct activity occurring within each
geography of interest (as detailed in Appendix B), and then using input-output models to translate this direct
economic activity into the total amount of economic activity that it supports. Expenditures within a given
geography give rise to “spillover” impacts when those dollars are recirculated to suppliers and to employees within
the local and state economy. In so doing, they also support additional employment and earnings, and generate tax
revenue for local governments and for the State of Wisconsin.
ESI has constructed an input-output model of the regional and state economy using IMPLAN software to estimate
the total impact of these expenditures. The detail that follows explains briefly the theory behind input-output
modeling, the mechanics of utilizing it to estimate economic and employment impacts, and the fiscal model
utilized to estimate tax revenue impacts to local and state government from UW Athletics’ economic activity.
B.1 Input-Output Modeling
Overview
Economic impact estimates for annualized capital and operating activity are generated by utilizing input-output
models to translate an initial amount of direct economic activity into the total amount of economic activity that it
supports, which includes multiple waves of spillover impacts generated by spending on goods and services and by
spending of labor income by employees. In an inter-connected economy, every dollar spent generates two
spillover impacts:
First, some amount of the proportion of that expenditure that goes to the purchase of goods and services
gets circulated back into an economy when those goods and services are purchased from local vendors.
This represents what is called the “indirect effect,” and reflects the fact that local purchases of goods and
services support local vendors, who in turn require additional purchasing with their own set of vendors.
Second, some amount of the proportion of that expenditure that goes to labor income gets circulated
back into an economy when those employees spend some of their earnings on various goods and
services. This represents what is called the “induced effect,” and reflects the fact that some of those
goods and services will be purchased from local vendors, further stimulating a local economy.
The role of input-output models is to determine the linkages across industries in order to model out the magnitude
and composition of the spillover impacts to all industries of a dollar spent in any one industry. Thus, UW Athletics’
total economic impact is the sum of its own direct economic footprint, plus the indirect and induced effects
generated by that direct footprint.
Indirect and induced impacts grow at each successive level of geography, due both to more purchasing and
recirculation activity happening within the larger geography and to a greater capture of downstream activity. For
example, procurement that takes place elsewhere in the region outside of Dane County increases its Greater
Madison Area impact relative to its Dane County impact. Further, purchasing taking place in Dane County has
spillover impacts to the other four counties in the region, meaning that regional spillover impacts are also higher.

The Economic Impact of UW-Madison Athletics June 10, 2019
Conclusion: Page 51
Input-Out Mechanics
To model the impacts resulting from the direct expenditures, ESI developed a customized economic impact model
using the IMPLAN input/output modeling system. IMPLAN represents an industry standard approach to assess the
economic and job creation impacts of economic development projects, the creation of new businesses, and public
policy changes within a county on its surrounding area.
IMPLAN has developed a social accounting matrix (SAM) that accounts for the flow of commodities through
economics. From this matrix, IMPLAN also determines the regional purchase coefficient (RPC), the proportion of
local supply that satisfies local demand. These values not only establish the types of goods and services supported
by an industry or institution, but also the level in which they are acquired locally. This assessment determines the
multiplier basis for the local and regional models created in the IMPLAN modeling system. IMPLAN takes the
multipliers and divides them into 536 industry categories in accordance to the North American Industrial
Classification System (NAICS) codes.
The IMPLAN modeling system also allows for customization of its inputs which alters multiplier outputs.
Information from UW Athletics on the location of its purchasing and the residential location of its employees and
alumni are used to refine IMPLAN’s calculation of purchasing patterns where appropriate to generate more
customized estimates of indirect and induced impact. Importantly, procurement and employee locations are
perfectly analogous to the indirect (supply chain) and induced impacts (labor income) effects within an area, both
because initial expenditures trigger multiple waves of recirculation with various suppliers and because employees
that live in one jurisdiction may still spend their earnings in part in another jurisdictions, particularly if it is where
they work. To incorporate UW Athletics-specific information while retaining the impact of broader geographic
spending patterns, local purchasing and employment information for Madison is averaged with patterns assumed
by IMPLAN from industrywide data to yield the local activity assumption used to model indirect and induced
impacts. As described below, additional adjustments are made to estimate impacts for Madison.
B.2 Tax Revenue Impacts The direct, indirect and induced economic output from UW Athletics’ activity produce increases in various tax
bases, which in turn lead to increased tax revenue collections for local governments and for the State. While
IMPLAN produces estimates of these tax revenue amounts, ESI does not utilize these results directly. Instead, we
utilize a custom fiscal model that relies on the known relationships between various types of economic activity and
tax collections (i.e. effective tax rates) to translate the increases in activity estimates by IMPLAN into attendant tax
revenue results for the State of Wisconsin.
For a non-profit entity such as University of Wisconsin-Madison, care must also be given to ensure that taxable and
non-taxable activity types are properly distinguished. Most notably, UW’s direct activity is not subject to any sales,
income or property tax. However, income generated by UW’s employment footprint is subject to local wage tax
and Wisconsin income tax. In addition, the indirect and induced impact of UW’s activity as it ripples throughout
the economy occurs broadly within the private sector of the economy, and is therefore understood to be tax
generating. In addition, the additional earnings of alumni attributable to the wage premium provide a significant
boost to the state’s income tax base.
It is important to note that while local economies within the region are wholly contained within the Wisconsin
economy, local and State governments are separate and distinct entities with distinct tax bases and revenues.

The Economic Impact of UW-Madison Athletics June 10, 2019
Conclusion: Page 52
Therefore, fiscal impacts do not overlap – each represents distinct tax revenues generated to the respective
governments.
In addition, it is acknowledged that UW’s activity also generates taxable activity within and therefore tax revenues
to additional jurisdictions besides the City of Madison and State of Wisconsin, including within suburban
jurisdictions throughout the Greater Madison Area. These amounts are much smaller than the ones calculated
here, and are excluded from this analysis.
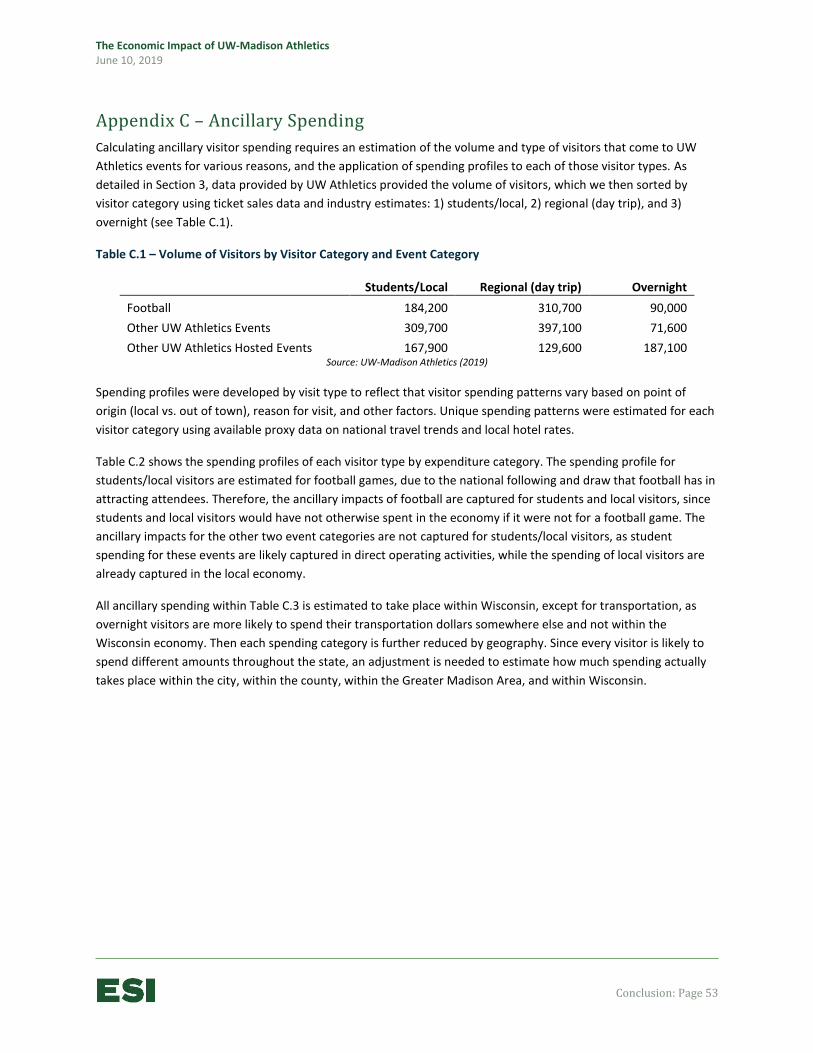
The Economic Impact of UW-Madison Athletics June 10, 2019
Conclusion: Page 53
Appendix C – Ancillary Spending
Calculating ancillary visitor spending requires an estimation of the volume and type of visitors that come to UW
Athletics events for various reasons, and the application of spending profiles to each of those visitor types. As
detailed in Section 3, data provided by UW Athletics provided the volume of visitors, which we then sorted by
visitor category using ticket sales data and industry estimates: 1) students/local, 2) regional (day trip), and 3)
overnight (see Table C.1).
Table C.1 – Volume of Visitors by Visitor Category and Event Category
Students/Local Regional (day trip) Overnight
Football 184,200 310,700 90,000
Other UW Athletics Events 309,700 397,100 71,600
Other UW Athletics Hosted Events 167,900 129,600 187,100 Source: UW-Madison Athletics (2019)
Spending profiles were developed by visit type to reflect that visitor spending patterns vary based on point of
origin (local vs. out of town), reason for visit, and other factors. Unique spending patterns were estimated for each
visitor category using available proxy data on national travel trends and local hotel rates.
Table C.2 shows the spending profiles of each visitor type by expenditure category. The spending profile for
students/local visitors are estimated for football games, due to the national following and draw that football has in
attracting attendees. Therefore, the ancillary impacts of football are captured for students and local visitors, since
students and local visitors would have not otherwise spent in the economy if it were not for a football game. The
ancillary impacts for the other two event categories are not captured for students/local visitors, as student
spending for these events are likely captured in direct operating activities, while the spending of local visitors are
already captured in the local economy.
All ancillary spending within Table C.3 is estimated to take place within Wisconsin, except for transportation, as
overnight visitors are more likely to spend their transportation dollars somewhere else and not within the
Wisconsin economy. Then each spending category is further reduced by geography. Since every visitor is likely to
spend different amounts throughout the state, an adjustment is needed to estimate how much spending actually
takes place within the city, within the county, within the Greater Madison Area, and within Wisconsin.

The Economic Impact of UW-Madison Athletics June 10, 2019
Conclusion: Page 54
Table C.2 – Spending Profiles per Visitor Type
Lodging Food Transportation Retail Spend per
Visitor
Football Local/Students $0 $15 $0 $15 $30
Regional (Day Trip) $0 $31 $11 $30 $71
Out of Town (Overnight) $154 $61 $22 $60 $296
Out of Region Team (Overnight) $88 $61 $0 $0 $149
Other UW Athletics Events Local/Students $0 $0 $0 $0 $0
Regional (Day Trip) $0 $31 $11 $30 $71
Out of Town (Overnight) $82 $61 $22 $60 $224
Out of Region Team (Overnight) $61 $61 $0 $0 $122
Other UW Athletics Hosted Events Local/Students $0 $0 $0 $0 $0
Regional (Day Trip) $0 $31 $11 $30 $71
Out of Town (Overnight) $82 $61 $22 $60 $224
Out of Town (Multi-Day Overnight) $82 $61 $22 $30 $195 Source: UW-Madison Athletics (2019), Econsult Solutions, Inc. (2019), Kayak.com (2019), General Services Administration (2019)
Table C.3 – Estimated Ancillary Visitor Spending Captured within Each Exclusive Geography
Madison Dane County Madison Area Wisconsin
Lodging 50% 75% 90% 100%
Food 80% 90% 95% 100%
Transportation 50% 60% 65% 70%
Other Retail 80% 90% 95% 100% Source: Econsult Solutions, Inc. (2019)
After developing the spending profile for each visitor category and event category, and then making an adjustment
to where these visitors are actually spending within the respective geographies, Table C.4 then shows the total
spending estimates by spending category within the respective geographies.

The Economic Impact of UW-Madison Athletics June 10, 2019
Conclusion: Page 55
Table C.4 – Total Ancillary Spending
Total Ancillary
Spending City of Madison Dane County
Greater Madison Area
State of Wisconsin
Housing / Lodging
Football Attendees $27.3 $13.7 $20.5 $24.6 $27.3
Other Athletic Event Attendees $5.8 $2.9 $4.4 $5.2 $5.8
General Visitors $31.4 $15.7 $23.6 $28.3 $31.4
Total $64.6 $32.3 $48.4 $58.1 $64.6
Food & Beverage
Football Attendees $23.2 $18.5 $20.9 $22.0 $23.2
Other Athletic Event Attendees $16.5 $13.2 $14.8 $15.7 $16.5
General Visitors $27.2 $21.8 $24.5 $25.9 $27.2
Total $66.9 $53.5 $60.2 $63.6 $66.9
Local Transportation
Football Attendees $7.3 $3.6 $4.4 $4.7 $5.1
Other Athletic Event Attendees $5.9 $2.9 $3.5 $3.8 $4.1
General Visitors $9.8 $4.9 $5.9 $6.4 $6.8
Total $22.9 $11.5 $13.8 $14.9 $16.0
Retail & Entertainment
Football Attendees $22.6 $18.1 $20.4 $21.5 $22.6
Other Athletic Event Attendees $16.0 $12.8 $14.4 $15.2 $16.0
General Visitors $16.7 $13.4 $15.0 $15.9 $16.7
Total $55.4 $44.3 $49.8 $52.6 $55.4
SUM
Football Attendees $80.4 $54.0 $66.1 $72.9 $78.3
Other Athletic Event Attendees $44.2 $31.8 $37.1 $39.9 $42.4
General Visitors $85.2 $55.8 $69.0 $76.4 $82.2
Total $209.8 million $141.6 million $172.2 million $189.2 million $202.9 million
(Retail margin deduction) ($M) ($21.2) ($26.0) ($27.5) ($28.9)
Modeled Ancillary Spending $120.4 million $146.2 million $161.7 million $174.0 million
Source: UW-Madison Athletics (2019), Econsult Solutions, Inc. (2019)

Let us help you find a solution.