
Economic Impact of Tall Buildings
44
The economic impact of high density development and tall buildings in central business districts A report for the British Property Federation by Colin Buchanan and Partners
-
Upload
john-siraut -
Category
Documents
-
view
475 -
download
2
description
Determining the economic benefit of tall buildingsFollow Colin Buchanan on twitter http://twitter.com/cbuchanancubed Read Colin Buchanan's blog at http://colinbuchanan.wordpress.com/
Transcript of Economic Impact of Tall Buildings

The economic impact of high density development and tall buildings in central business districtsA report for the British Property Federation by Colin Buchanan and Partners

2

3
The economic impact of high density development and tall buildings in central business districts
September 2008
4
Contents
1 Executive summary 6
2 Introduction 82.1 Purpose 82.2 Report structure 9
3 The economics of density and productivity 103.2 Links between density and productivity 103.3 Scale of the relationship between density and productivity 133.4 Other economic benefi ts of commercial density 153.5 Summary 17
4 Density framework 184.1 Introduction 184.2 Density interactions 184.3 Agglomeration/economic performance interaction 19
5 Agglomeration benefi ts 215.1 Introduction 215.2 Methodology 215.3 Results 24
6 The role of tall buildings 256.1 Introduction 256.2 What do we mean by ‘tall buildings’? 256.3 Tall buildings and density 256.4 Occupier perceptions of tall buildings 266.5 Density: city comparisons 27
7 Implications for London, the rest of the UK, and the core cities 327.1 Role of London in UK economy: UK-wide impacts 327.2 Implication for London’s competitiveness 337.3 Core cities implications 33
8 Summary and conclusions 34
Appendix 1: Works consulted 36
Appendix 2: Agglomeration model 40
5
Tables
Table 3.1 Scoresheet of economic performance: high density versus low density
Table 5.1 Assumptions in the agglomeration modelling
Table 5.2 Net impact equation
Table 6.1 High-rise (12 storeys or more) buildings by status
Table 6.2 Number of buildings taller than 110 metres
Table 6.3 Employment densities in key international urban cores
Table 6.4 Employment densities in key international CBDs
Table 6.5 Employment densities in UK core cities CBDs
Figures
Figure 3.1 Statistical relationship between productivity and employment density
Figure 4.1 High density economic benefi t schematic
Figure 5.1 Employment change by Railplan Zone: test scenario
Figure 7.1 Sales to London as a share of regional GVA, 2003

6
Executive summary1 1.1 There is increasing recognition of the need to increase the density of commercial development, especially in
the centres of our towns and cities. The sustainability benefi ts of high density are relatively well known. For example, less urban sprawl means less need to use greenfi eld sites, more use of public transport and, with mixed use developments, a reduced need to travel. However, there is also an economic case for increased commercial density, as specifi ed in Policy Planning Statement (PPS) 6 and the State of the English Cities. In current debates about increasing commercial density in London – including through tall buildings – this economic element has been little mentioned, and is perhaps little understood. This research has sought to explain and estimate the economic costs and benefi ts of high density commercial development in central business districts. The aim is to provide a more rounded picture of the economic impact of high density development and to strengthen the assessment of such development.
1.2 The research underpinning this report is based on a review of previous studies into the economic and sustainable impacts of high density development and tall buildings, discussions with developers and occupiers, and economic modelling of the impact of increasing employment density on output.
1.3 In order to understand why the world’s fastest growing cities are built at high density, often favouring commercial tall buildings, we need to understand why we have cities in the fi rst place. Businesses cluster together in cities because there are clear commercial benefi ts from doing so, and they will continue to do so as long as those benefi ts outweigh the congestion and cost often associated with doing business in cities.
1.4 Increased density leads to increased productivity in fi ve key ways:
increased specialisation – there may be enough business to support a general accountant or lawyer in a small town but in a large city there is enough to support business advisers who specialise in very narrow fi elds of work thereby improving effi ciency and expertise;
knowledge spillovers, both between fi rms in the same sector and across sectors, leading to increased innovation;
competition – the presence of lots of fi rms offering similar products spurs on competition, innovation and effi ciency and there are lots of buyers to compete for;
larger labour markets offer wide choices for employers and the opportunity to recruit staff with specialist skills;
economies of scale are created by serving larger markets.
1.5 These impacts are commonly referred to as agglomeration impacts. Importantly, this link between density (or agglomeration) and increased output has been extensively researched and quantifi ed. In essence, the research shows that a doubling of employment density within a given area can lead to a 12.5% additional increase in output per worker in that area. For the service sector the fi gure is far higher at 22%.
1.6 Employment density is not particularly high in the UK, with the exception of the Square Mile in the City of London, which has around 250,000 employees per square mile, and Canary Wharf, which has around 600,000 employees per square mile. This compares to around 70,000 employees per square mile in central Manchester. In contrast, midtown Manhattan in New York has over 600,000 employees per square mile, while even a city like Los Angles, which is often perceived as sprawling, has an employment density of nearly 120,000 employees per square mile in its central business district. With this higher density comes higher output per person. Output per employee in inner London, for example, is far higher than output per person in outer

7
London. This higher marginal output is worth some £45bn a year, around 5% of the UK’s total output.
1.7 The key question, then, is what is the value of adding further density to central business districts? Following a methodology in line with Department for Transport guidance, we modelled the impacts of adding 80,000 employees to locations near key transport nodes in inner London. The exercise was one of changing the distribution of employment, rather than total levels of employment. The economic benefi t was equivalent to the annual output for each of those 80,000 workers increasing by £2,500 a year. A second scenario redistributing those 80,000 workers to less accessible parts of central London produced a decline in output equivalent to £1,600 a year for every one of those 80,000 workers.
1.8 The increase in output, resulting from increased density, is an external, public benefi t from agglomeration. In our model, around 6% of the agglomeration benefi t accrues to the 80,000 ‘added’ employees, while the remaining 94% accrues to other employees in the impacted boroughs – more generally accruing to UK plc. This benefi t accrues only because of the change in the distribution of employment.
1.9 How can we deliver these density increases that contribute to productivity and UK plc? First, the added density must be in the right locations. The modelling suggests that agglomeration benefi ts are very sensitive to location. Added employment density in less accessible parts of Inner London causes a decline in agglomeration and has a negative impact on productivity. So the focus for increased density should be on locations with good accessibility, particularly with regard to public transport. Furthermore, these locations should be in key commercial districts where private sector businesses can take advantage of existing agglomerations.
1.10 These fi ndings inform the building type that is required to accommodate increased employment density. In well developed, thriving city centre commercial districts, land is scarce and at a premium. In most of our major cities, adding signifi cant commercial space at well developed transport nodes is challenging, and in many cases, building up is the only way to achieve increased density given land and conservation constraints.
1.11 As it is not practical to add a few fl oors across many of the existing commercial buildings in a developed district, extra fl oor space will principally be delivered by the replacement of existing buildings with new buildings in a few selected locations. Developers do, of course, need to make a reasonable return on their investments. In weighing up whether to redevelop a site with an existing building, which is still let-able at a reasonable level of rent, a developer has to take into account the cost of demolition, the loss of rent during rebuilding, the cost of building and regulatory and fi nancing costs. To make this type of redevelopment viable usually requires a signifi cant increase in development density, which can sometimes be attained only by building up.
1.12 Furthermore, in basic terms, effi ciently adding height (and fl oorspace) to a building design adds to the density provided on the same footprint. So, for example, given a planned fi ve storey building in a key commercial district, keeping the same footprint and doubling the fl oors to ten fl oors, while maybe not doubling the fl oorspace, still provides considerable added commercial density.
1.13 Accordingly, if you visit any of the world’s major commercial cities, you will almost always see a cluster of tall buildings in the heart of the city. This is especially true in North America and Asia: Shanghai already has 133 skyscrapers (commercial buildings taller than 110m) and Dubai 60, whilst London has only 21.
1.14 It is clear, therefore, that increased commercial density (and, in some cases, tall buildings) in the right locations can have positive economic impacts. In some cases, almost always in central business districts, those benefi ts (particularly those fl owing from agglomeration) can be delivered – or at least maximised – only by the provision of commercial tall buildings. However, the location of tall buildings is integral to the agglomeration benefi ts, and locating tall buildings in less accessible areas is likely to have a negative impact on productivity.

8
Introduction2
Purpose2.1 Most current Government policy supports the principle of building in towns and cities at higher commercial 2.1.1 densities. Government thinking in this area has been strongly driven by the sustainability benefi ts that fl ow from higher density development, particularly when such development is centred around transport nodes.
What do we mean by ‘high commercial density’? It’s very diffi cult to defi ne, and it varies with context in different 2.1.2 cities. So what is considered to be high commercial density in Newcastle may not be considered to be high commercial density in London. We believe most people recognise and understand high commercial density development. As a guide, once we have exceeded the equivalent of 30,000 jobs per square mile in an area, we would call this high density. This level of jobs would generally require multi-storey buildings, and virtually all land devoted to the built environment and supporting infrastructure (such as roads).
High density development can, of course, take many different forms. Whether high density development 2.1.3 is appropriate at all and, if so, what form it should take, will always depend on the particular context of a scheme. There are many different factors to take into account when high density is to be delivered in the form of tall buildings. Some of these considerations, notably the impact on the skyline and protected views, have understandably attracted much attention. However, the economic signifi cance of high density development has been less considered in London. This research aims to examine the external costs and benefi ts of high density development, allowing economic considerations of commercial density and tall buildings to be added to the current debate.
The report has a particular focus on London, but also has relevance for England’s core cities and other areas2.1.4 1. The focus is on commercial buildings, rather than residential or mixed use, as the latter have different economic impacts.
Since this report was commissioned, a variety of factors – including the credit crunch and the resultant impact 2.1.5 on fi nancial services – have temporarily reduced demand for offi ce space in areas such as the City of London, where pressure for high density development is most intense. However, market conditions are constantly shifting, and our analysis takes a long term view of the likely demand for commercial space.
1 The core cities include Birmingham, Bristol, Leeds, Liverpool, Manchester, Newcastle, Nottingham and Sheffi eld.

9
Report structure2.2 This report is structured as follows:2.2.1
chapter 3 presents a background review of the available relevant research to date, focusing on the economics of agglomeration and densitychapter 4 presents a theoretical framework on the relationships between density and economic developmentchapter 5 assesses the potential scale of external agglomeration benefi ts from adding tall buildings in Londonchapter 6 discusses a range of issues associated with tall buildings in London chapter 7 discusses implications for London, the rest of the UK, and the core cities chapter 8 presents summary and conclusions appendices:
Appendix 1: Works consulted- Appendix 2: Agglomeration model.-
10
The economics of density and productivity3 This section summarises the current evidence on the economic impacts of density, with emphasis on elements most relevant for London and the core cities.
Links between density and productivity3.1 Serious study of the role of location and density in economic development probably owes its origins to Alfred 3.1.1 Marshall’s work on location and economic development in the early 1900s.
Cities are economic drivers – the very core of economic growth and development. Higher earnings paid to 3.1.2 urban workers and premiums paid by fi rms to be in urban areas are evidence of cities’ productive advantages. In the US, for example, earnings in cities are around 33% more than those in non urban areas (Glaeser and Mare, 2001). Even within Greater London, the urban premium is high: the average earnings for a worker in inner London (£49,400) was nearly double that of the average for outer London workers (£26,700) in 20072.
Scale and density – essentially what makes a city a city – have long been thought to be connected to 3.1.3 these productive advantages. The ability to offer a critical mass of highly qualifi ed labour, support services, information, infrastructure and markets have all been linked to urban competitiveness and economic performance. However, the reasons behind these connections are complex.
The ways in which density is linked to productivity has been developed in a wide array of research projects. Six 3.1.4 key impacts are discussed in this section:
density allows a higher degree of specialisation, increasing effi ciency;reduced transport time and costs for products/goods/services from one stage to the next, or from producer to consumer, occurs in denser areas if the transport infrastructure is suffi cient;increased density increases the prevalence of knowledge spillovers, increasing innovationdensity allows fi rms to have access to larger markets of suppliers (especially labour supply) and consumers, allowing competition to enhance the quality of inputs and outputs;effi ciencies of scale are created in denser markets where suppliers are reaching more potential customers;reduced land take in denser areas allows more economic activity to take place on a fi xed piece of land than less dense designs;
Increased specialisationAs levels of economic activity increase, so does the ability of fi rms to specialise and increase effi ciency, due to 3.1.5 increased market size and competition.
By way of example, we consider a hypothetical instance in the accounting profession. An accountant in a rural 3.1.6 area might tend to cover a wide range of personal and business matters – acquiring as much business within a reasonable radius of the offi ce as possible in order to fi ll capacity.
An accountant in a denser area has far more potential business in a readily travelable area than one person 3.1.7 can handle. Therefore, an individual can specialise in a particular portion of the discipline – perhaps in commercial accounting, or accounting for large fi rms, or for large fi rms with Asian accounts, or for large fi rms with Asian accounts in the natural gas sector. The denser the area, the more opportunity and incentive to specialise. As the accountant specialises, productivity increases as the specialist is able to quickly navigate
2 Calculations from ASHE data 2007.

11
the nuances of accounting principles related to Asian accounts in the natural gas sector for clients requiring that skill. A more generalist accountant would need to do more background work to cover such a task, and this would be ineffi cient. Having many, specialised accountants is much more effi cient, and this is possible in dense urban areas.
Transport/time savingsTransport and time savings are interrelated with a number of the other characteristics of density listed here. 3.1.8 But in their own right, fi rms can experience direct time savings and a reduction in transport costs if travel distances and times are decreased. Time spent accessing clients and suppliers, delivering goods to markets, shuffl ing goods between intermediate stages, acquiring business support services, and other associated transactions can be reduced in denser areas. This reduction in time and cost of transport is a direct contribution to productivity (as well as sustainability).
Decreased distances between fi rms make shorter journeys (in terms of time) possible, though the state of the 3.1.9 transport infrastructure is a key factor.
Increasing density improves the potential demand for public transport and creates the critical mass of users to 3.1.10 fund high capacity transport infrastructure. In cases where spare transport capacity exists, increased density may utilize that capacity, creating a more effi cient use of transport infrastructure while decreasing travel time and expense among fi rms.
However, if density increases where transport capacity is already overstretched, additional density causes 3.1.11 increased congestion and associated costs until the situation is corrected. If transport improvements are made in the long term as a result, then density can deliver its net benefi ts from reduced travel distances and times. However, if not, then negative externalities from congestion and overcrowding may counteract any benefi ts.
As new development increases density, transport infrastructure must keep up in order for benefi ts, in terms 3.1.12 of time savings, to be experienced. Costs of transport improvements are a negative externality of increasing density, although there could also be positive externalities in the form of journey and effi ciency improvements experienced by others not associated with the particular area of increased density.
Knowledge sharing/innovationThe idea that knowledge spillovers occur and are important to innovation and productivity is widely 3.1.13 acknowledged. The role of location and agglomeration in this process, however, is more complex.
Why might there be a locational element of knowledge transfer? Knowledge transfer is thought to occur better 3.1.14 in close proximity for a variety of reasons:
less clear ‘sticky knowledge’ (Audretsch, 1998, p.21) is best transmitted in person and with multiple contacts;communication between individuals creates knowledge spillovers, not just the existence of high levels of knowledge in the region: putting people next to each other increases the chance of interaction, but the interaction also has to be encouraged;in a denser, diverse environment, knowledge can spill over from its initial use to something for which it was not originally intended. These incidental interactions are more likely in close proximity;a signifi cant share of knowledge transfer occurs informally; incentives for knowledgeable individuals to depart a fi rm already containing that knowledge, joining another one to acquire that knowledge;

12
in more basic terms, “Innovative ideas are rarely kept secret when employees from different fi rms can easily get together and talk, gossip, or even spy on one another, and a high density of economic activity facilitates such an exchange of information” (Harris and Ioannides, 2000 p.2).
Despite decreasing costs of telephone services and email connectivity, physical proximity still matters. 3.1.15 Evidence indicates that a majority of telephone and email contact is between people in close physical proximity (Imagawa 1996 in Peri 1998). Face to face contact is still crucial for communicating complex, tacit knowledge (Storper and Venables, 2003).
Audretsch (1998) summarised the work in this area: “…greater geographic concentration of production leads to 3.1.16 more, and not less, dispersion of innovative activity” (Audretsch 1998, p.23-24).
Increased competitionIncreased density can increase productivity through access to denser markets – both on the supplier side and 3.1.17 on the consumer side.
On the supplier side, access to more competing suppliers helps fi rms procure more effi cient, cheaper and more 3.1.18 appropriate inputs. Competition encourages effi ciency and survival of the fi ttest fi rms.
This holds true for labour, as well. Firms in denser areas have access to a larger labour pool, aiding recruitment 3.1.19 and retention. Beyond the intuitive benefi ts from easier staff attraction, research shows this affects the bottom line. Karlsson and Petterson (2005) found in Sweden that access to dense networks of educated people had a direct positive relationship with gross regional product. Furthermore, with the estimated recruitment cost of replacing a junior manager (earning £25,000) being nearly a year’s salary (£21,930) (Ellison and Sayce, 2006), the benefi ts from increased retention and easier recruiting can add up.
On the consumer side, better access to potential consumers can mean more exposure to a fi rm’s products 3.1.20 or services within a commutable radius of their trade, increasing the effi ciency of their sales and marketing. Increased competition among producers forces further effi ciency.
Effi ciencies of scaleEffi ciencies of scale can be identifi ed across fi rms, where more concentrated land use, energy use and service 3.1.21 provision create effi ciency of scale in providing amenities to workers. Increased density and reduced sprawl mean that fewer service providers can be used to offer support services, utility and energy provision more effi ciently.
Effi ciencies of scale can also be identifi ed within fi rms, where increased density (particularly with tall buildings) 3.1.22 provides an opportunity for workers from one fi rm to be located together, rather than spread across different locations. In a BCO (2002a) survey of tall building occupiers, intra-fi rm synergy benefi ts were thought to be derived from amalgamation by:
organisational development – promoting intra-fi rm relationships, particularly among newly merged fi rms. “Coming together in the tower will bring about value-adding synergy without a doubt” (p.9);more frequent casual encounters – adding a feeling of cohesion and increasing the frequency of chance encounters that can add value. “We want the synergy that fl ows when people bump into each other in the same building, with interaction that can lead to value. There are no numbers to describe that value” (p.10);reduced costs of running separate sites and duplicative resources – reduced costs of duplicate

13
receptionists, security staff, post distribution, caterers and other support staff and the time spent travelling between offi ces.
A report by GLA Economics (2008) highlights the value of these effi ciencies in London’s fi nance and business 3.1.23 services sector (p.13):
a fi ve-fold increase in the volume of managed funds reduces unit operating costs by two thirds; in insurance, unit-operating costs typically fall by 10% when volumes double; for banking, unit operating costs fall by 15% when volumes double.
However, not all businesses may be able to benefi t from these economies of scale. For example, one 3.1.24 interviewee in the BCO study mentioned that the cost of duplication of services across several offi ces is relatively low and that remaining in several smaller offi ces spreads the corporate risk and may project a more modest image to clients.
Scale of the relationship between density and productivity3.2 In addition to understanding the nature of the linkages between density and productivity, economic research 3.2.1 estimates the scale of these linkages.
Seminal work by Ciccone and Hall (1996) assessed the impacts of density on productivity in the US, and found 3.2.2 that doubling employment density, and keeping all other factors constant, increased average labour productivity by around 6%. Subsequent work by Ciccone (1999) found that in Europe, all other things being equal, doubling employment density increased productivity by 5%. A third paper (Harris and Ioannides, 2000) applies the logic directly to metropolitan areas and also fi nds a 6% increase in productivity with a doubling of density.
Specifi c to UK regions, Rice and Venables (2004) suggest that doubling the working age population proximate 3.2.3 to a NUTS3 region increases productivity by 3.5%3.
More recent work by Dan Graham (2005b, 2006) examines the relationship between increased effective density 3.2.4 (which takes into account time travelled between business units) and increased productivity across different industries4. Graham fi nds that across the whole economy, the urbanisation elasticity (that is, the response of productivity to changes in density) is 0.125. This means that a 10% increase in effective density, holding all other factors constant, is associated with a 1.25% increase in productivity for fi rms in that area. Doubling the density of an area would result in a 12.5% increase in productivity. For the service sector specifi cally, the elasticity for Britain is estimated to be almost twice that for the whole of the economy, 0.221. For London’s service sector, Graham’s estimate is just a little higher, at 0.224.
Further work has explored this relationship in Britain. Quantitative research has consistently shown a positive 3.2.5 relationship between employment density and productivity, as emphasised in recent Greater London Authority Reports (Ormerod et al, 2005; GLA Economics, 2008). Higher productivity is refl ected in higher salaries. Figure 3.1 (on page 14) illustrates the positive relationship between changes in employment density (increasing from left to right – ‘log(emp01) on the X axis) and changes in earnings (as a proxy for productivity – increasing from bottom to top – ‘earn01’ on the Y axis) for major UK urban centres.
3 NUTS stands for Nomenclature of Territorial Units for Statistics and is a geographical classifi cation system designed by Eurostat. In the UK, a NUTS3 region is usually along county/UA boundaries. For example, Greater London is split into fi ve NUTS3 regions.
4 Effective density is a measure of density that was defi ned by the DfT. It takes into account changes in i) employment density and ii) accessibility of jobs. If either of these two factors increases, effective density will also increase.

14
Figure 3.1 Statistical relationship between productivity and employment density
Source: Ormerod et al, 2005
The positive relationship between earnings differentials and employment density is detectable even at relatively 3.2.6 low levels of density. But the relationship intensifi es at the right side of the fi gure. The observations in the shaded portion of the fi gure are the city regions of Greater Manchester, Tyne and Wear, West Midlands and 27 London boroughs – all dense urban areas.
Inner London is one of the most economically dense areas in the UK and estimated to be approximately 38% 3.2.7 more productive (in terms of gross value added [GVA] per worker) than the national average. This has been a key underlying factor behind the London economy’s high performance relative to the UK average during the last 10 to 15 years.
As a result of such fi ndings, policy practitioners increasingly understand the importance of density to economic 3.2.8 performance in a service based economy as well as its contribution to sustainability. This was acknowledged in the most recent State of English Cities Report for 2006:
“As the economy continues to shift from manufacturing to services, ideas and innovation are driving economic growth and changing the value of density itself. Firms in large metropolitan areas value their workers more highly, because workers there are more productive. They grow more productive over time because of the variety of jobs and information spillovers within and between industries” (State of English Cities, Department for Communities and Local Government, Volume1, p.214).

15
Other economic benefi ts of commercial density3.3
Land takeSimply put, building up means less building out: an equivalent square metreage of space can be 3.3.1 accommodated on a smaller area of land. This allows more land to be used for public realm, conservation and environmental purposes. As a 2002 LSE report asserted: “In a country where land is scarce, it is crucial that we make better use of our available resources” (LSE 2002 p.4). The report went on to illustrate how this means developing urban sites more effi ciently and intensively.
Within this simple assertion, there is a more complex issue about the economies of scale that can be achieved 3.3.2 by buildings of different height. For example, with additional height, additional core and structural zones are required to resist wind loads, accommodate lift shafts and house emergency staircases. These design elements mean that some buildings have greater fl oorspace effi ciency than others. As a result, the marginal value of an additional fl oor can vary widely. After a certain point, however, taller may not mean more employment space and may not yield additional density benefi t.
At a basic level, a more dense arrangement of economic activity means that a greater quantity of activity can 3.3.3 take place within a fi xed land area. One way to think of this is that more jobs and output can be accommodated within a fi xed space over time. Another way to think about this is that more effi cient use of land for commercial space leaves more green space for other uses, such as parks, which users can enjoy. This is both economically effi cient and has sustainability benefi ts.
Effi cient public transportProvided that it is close to transport nodes, high density commercial or mixed use development has the double 3.3.4 advantage of both reducing the need to travel and encouraging the use of public transport, as many employees will only work a short walk away from their stop. With more sprawling development, and the same distribution of stations, fewer workers will be located near a stop, making public transport use less practical.
A good example of high density development built around a transport node is Canary Wharf. Many of its 90,000 3.3.5 workers are close to one of the three stations on the Jubilee Line or Docklands Light Railway (DLR). From 1988 to 2006, morning peak commuters increased by nearly 700%, but private vehicle commuters increased by just 50% or so over this period. The remainder of the increase was accommodated by public transport – bus, DLR and the Jubilee Line5. Had Canary Wharf been lower rise and more sprawling, walking times to stations would be signifi cantly longer for many, resulting in a less desirable public transport commute for employees, clients and visitors.
Higher commercial densities in central districts also encourage increased densities in surrounding areas. This 3.3.6 is because with a more centralised, dense commercial area, residential and leisure facilities are also drawn in more tightly to that core, rather than being spread out to service widely dispersed businesses. Non-commuting trip distances are lower compared with more sprawling development, enhancing effi ciency and sustainability.
However, if public transport capacity is already overstretched or insuffi cient to serve added high density 3.3.7 development, these benefi ts may not accrue, or may only accrue with further transport investment.
5 Calculations from data in Steer Davies Gleave 2007.

16
Implications on competitiveness and clusteringThe impacts of density on productivity also have positive effects on two other key concepts in urban 3.3.8 development: competitiveness and clustering.
CompetitivenessAs cities strive to be more competitive, a key component is attracting knowledge workers and higher-end 3.3.9 service industries. Specifi c sectors, such as IT and advanced fi nancial services, have been particularly desirable.
These sectors are often tenants of tall buildings – for practical fl oorspace reasons, and sometimes for image 3.3.10 reasons. Housing more employees under one roof can increase a fi rm’s effi ciency, part of the reason why occupants moved to Canary Wharf (Pank et al, 2002). Especially as mergers and consolidation has become the trend in fi nancial and business services, a large quantum of offi ce space is required to have everyone under one roof, and this often means tall buildings in key urban areas – where services businesses want to be. Tall buildings also provide a degree of fl exibility for tenants, where expanding and contracting can often be relatively easily accommodated, compared to being in a smaller building.
Tall buildings can also be attractive to these sectors by providing a high profi le space. For a city’s aim of 3.3.11 competitiveness, these sectors are among the more likely to use tall buildings for image: “Tenants appreciate a landmark address…” (Kalita and Watts, 2007 p.1).
The role that adequate offi ce space plays in competitiveness has been recognised by the Greater London 3.3.12 Authority: “London – and the UK – face the real possibility of London’s competitiveness being undermined by the lack of affordable offi ce space of all types” (GLA, 2001 p.4).
ClusteringRecently, popular ‘cluster’ theory, developed by Michael Porter (1990, 2000), designates the importance of 3.3.13 location to economic success. Porter’s clusters are “geographic concentrations of interconnected companies, specialised suppliers, service providers, fi rms in related industries, and associated institutions… in a particular fi eld that compete but also co-operate.”
In essence, a cluster is more sophisticated than a simple agglomeration of companies, and the interconnected 3.3.14 linkages that give the cluster value give value to that location, rather than just to the individual businesses. This is partly why clusters have become so popular. In the cluster model, close linkages with key suppliers, buyers, and other institutions, such as industry trade groups and universities, are important to effi ciency, improvement, and innovation.
Clusters are diffi cult to create or directly encourage from a policy perspective. The best encouragement is 3.3.15 indirect – providing the resources, facilities, and communication mechanisms that potential clusters can use as assets. Providing suffi cient commercial premises for a would-be cluster helps to remove this obstacle, and could be an integral part of encouraging clusters.
One example of a potential cluster, largely dependent on offi ce space, is that in the insurance sector in the 3.3.16 City of London. The City is the only place where all 20 of the world’s largest insurers and re-insurers have offi ces, and the concentration of insurance professionals, as well as specialised support services (attorneys, accountants, and claims handlers), creates an atmosphere of knowledge and interaction that has become an asset to the industry (GLA 2008).

17
Summary3.4 The benefi ts that fi rms derive from being in cities and the dense agglomerations found there are evident in 3.4.1 the premiums on salaries, and rent, that they are willing to pay to be located there. Additionally, on a city wide scale, productivity generally increases with density (Figure 3.1). Agglomeration benefi ts can be enhanced by high density development predominantly in central commercial districts where land is scarce, or at a premium, and there are few opportunities for adding employment other than building up.
The scale of these agglomeration benefi ts has been evaluated by a wide range of economists. Recent work by 3.4.2 Dan Graham estimates that a 10% increase in employment density across the UK results in a 1.25% increase in productivity. For the service sector, a 10% increase in employment density results in a 2.21% increase in productivity. For London’s service sector, the fi gure is slightly higher at 2.24%.
The nature of these agglomeration benefi ts has also been closely examined. The summary table below 3.4.3 provides key impacts of high density versus lower density on productivity.
Table 3.1 Scoresheet of economic performance: high density versus low density
Element of economic consideration High density Low density Notes
Land take Better performer
Access to workers Better performer
Compatibility with public transport Usually a better performer
Where transport capacity is already overstretched, benefi ts of increasing density should be weighed with the transport costs incurred
Distances/travel times between suppliers and from producer to consumer
Usually a better performer
Knowledge spillovers Better performer
Number of potential consumers within reach of producer Better performer
Number of competing suppliers within reach of producer Better performer
Specialisation encouraged by access to large numbers of consumers Better performer
Road based transport availability Usually a better performer

18
Density framework4
Introduction4.1 This section provides a conceptual framework for the interrelationships between density and economic 4.1.1 performance. In essence, the background material from the previous section is condensed into a present day operational framework, which is used in the following section to form a model demonstrating productivity impacts of density.
Density interactions4.2 Figure 4.1 presents a schematic of key impacts of increased commercial density on the economy. 4.2.1
Beginning with the top of the fi gure, increased density provides additional large offi ce buildings. Given 4.2.2 adequate demand, space in these buildings is attractive to large corporations. In a city centre, with higher rents, this usually means high end services fi rms – particularly high economic performers.
Strong economic performance feeds into further agglomeration, fuelling interaction and innovation in the local 4.2.3 economy. This dynamism becomes visible through economic performance, and encourages new fi rms in a virtuous cycle.
High density
Decreased land usage Large office
spaces Accommodates large corporations
Agglomeration benefits
Economic performance
Mass transit
Social inclusion
Environmental sustainability
Interaction/ Innovation
Figure 4.1 High density economic benefi t schematic

19
To the left of the diagram, high density creates sustainability and transport benefi ts. Benefi cial interactions 4.2.4 here are dependant on a healthy complementarity of transport infrastructure and density/tall buildings. Well managed, high density can increase demand for mass transit, resulting in reduced use of personal transit with benefi ts to the environment and to journey times and agglomeration.
Increased employment in the city centre, even with the existing public transport, expands the employment 4.2.5 possibilities for targeted groups that may not have access to a car (often groups that struggle with social and economic inclusion). Improvements to the public transport system, supported by increased density, further increase the accessibility and benefi t to disadvantaged and socially excluded groups.
Agglomeration/economic performance interaction4.3 Emerging from fi gure 4.1 is this central relationship between high density, agglomeration and economic 4.3.1 performance. This is the key way in which density delivers economic benefi ts.
This relationship is the appropriate focus for assessing the economic impacts of high density development and 4.3.2 tall buildings, and forms the basis for the measurement and modelling that follow.

20
Agglomeration benefi ts5
Introduction5.1 The positive relationship between productivity and density is well established. Increasing the density of workers 5.1.1 in a given area brings about agglomeration benefi ts because of the reasons detailed in section 3 (increased specialisation, knowledge spillovers, etc).
In this section, a model of London is developed in order to estimate the scale of agglomeration benefi t of tall 5.1.2 buildings. In essence, we have taken the estimated employment growth in London between 2006 and 2026, and calculated productivity and output in London for 2026 in a ‘business as usual’ scenario. We then use the model to calculate productivity and output in London with an estimated employment density from additional tall buildings in four sites. The total number of workers in London is held constant, and the different density of workers modelled isolates the impact of density on productivity and, therefore, output. A summary is as follows:
Modelling summary
Scenario:
Assume that new tall buildings are constructed near central London stations (Tottenham Court Road, Farringdon, Liverpool Street and Isle of Dogs), accommodating 20,000 workers at each location.
Assume that overall London employment remains constant, so workers move from jobs in the rest of central London to relocate to jobs in those tall buildings.
Assessment:
Divide London into ‘zones’ and estimate the relative density effects between the zones.
Estimate impacts on productivity using published research on the relationship between productivity and density.
Findings:
Results indicate that overall output would be over £200m higher in the fi rst year (2007 prices), relative to a base scenario where the additional tall buildings are not constructed.
Results sensitive to where buildings are located – particularly with respect to transport nodes.
Methodology5.2 The most important factors in determining agglomeration benefi ts are:5.2.1
the distribution of employment – since this determines density, and agglomeration is about the impact that density has on productivity;productivity levels – since changes in density impact on productivity, and this in turn leads to a change in total output which is equivalent to the agglomeration benefi t;

21
Table 5.1 outlines the assumptions that have been made in the base and test scenario for these two factors.5.2.2
Table 5.1: Assumptions in the agglomeration modelling
Base scenario Test scenario
Employment
Is assumed to follow the London Plan (LP)triangulated forecasts. The LP forecasts an increase in total London employment of 912,000 between 2006 and 2026 (of which 78,000 is in the City).
Total employment in London and each individual borough is the same as in the base scenario. However, it is assumed that employment within some boroughs becomes denser such that 20,000 additional jobs are located in tall buildings, nearer to each of the following Crossrail stations: Tottenham Court Road, Farringdon, Liverpool Street and Isle of Dogs.
Productivity
Productivity in 2006 is calculated by applying a mark-up to average wages in each borough of London. Beyond this it is assumed that productivity increases by 2.2% a year (in line with recent trends) in order to obtain a 2026 fi gure.
Productivity changes from the base values as a result of the changes in density. The extent of the change is driven by the agglomeration elasticity (see below).
Ultimately, the assumptions relating to employment and productivity enable the agglomeration benefi t to be 5.2.3 calculated. This has been done using a methodology that is broadly in line with Department for Transport guidance. The process has been completed twice, once for the base scenario and once for the test scenario (where the tall buildings have been added). The modelling is focused on measuring output in 2026; it is assumed that in the test scenario the tall buildings are completed and occupied by 2026.
Base scenarioThe process is as follows:5.2.4
divide London into zones: for the purposes of this work we have used a zoning system compatible with the Railplan transport model, which divides London into over 1,100 zones;the London Plan allocates employment by borough, so a weighting is applied in order to divide the employment between Railplan zones instead;output is calculated by accounting for changes in employment by borough and for an uplift in productivity of 2.2% annually, from 2006-2026;average output per worker across all of London for the base scenario in 2026 is estimated to be £77,826 (2007 prices).
Test scenariofor the test scenario, employment is redistributed between zones as described above (an additional 20,000 employees at each of four locations near central London stations, with an equivalent reduction in employment in other central London zones). For reference, all the tall buildings added in this scenario (when summed together) accommodate around the level of employment currently at Canary Wharf. The resulting employment change by zone is shown in fi gure 5.1 (page 22).

22
the resulting changes in ‘effective density’ are calculated for each zone. Effective density is a measure of density that was defi ned by the Department for Transport. It takes into account changes in i) employment density and ii) accessibility of jobs. If either of these two factors increases, effective density will also increase;an ‘agglomeration elasticity’ is then used: the value of the elasticity determines the extent to which productivity changes when effective density changes;in this particular exercise, an elasticity of 0.224 is used, in line with the service sector estimate for London estimated by Graham (2006); this means that an increase in effective density of 10% would lead to a 2.24% increase in productivity;as a result, the change in workers’ productivity due to the change in density is obtained; applying the change in productivity to the number of workers affected enables us to calculate the total change in output as a result of the change in employment distribution: this change in output is the agglomeration benefi t.
Figure 5.1 Employment change by Railplan Zone: test scenario
1
It should be noted that in fi gure 5.1, where a decline in employment is indicated, this is a decline compared 5.2.5 to the base projected employment for 2026. This does not indicate an absolute decline from the present level of employment, or that employment space in these zones will suddenly become empty. Rather, employment growth 2007-2026 within the boroughs with the added tall buildings is redistributed. Total employment in each borough in 2026 remains at the same level as in the base case.
Average output per worker across all of London for the test scenario in 2026 is estimated to be £77,860 (2007 5.2.6 prices).
More details on this modelling process can be found in appendix 2.5.2.7
23
Results5.3 The model is run using 2026 as its base year, giving an agglomeration benefi t in the tall building scenario of 5.3.1 £205.7m in 2007 prices. By comparison, this external benefi t amounts to 17% of the estimated rents paid in the tall buildings.
Rents paid in the buildings one calculated applying English Partnerships’ estimate of an average of 215 sq ft 5.3.2 GIA per employee in the City, and a just above average rent in the City of £70/sqft (estimated by Drivers Jonas for 2007). Total estimated rent paid = £1.2bn in 2026 (in 2007 prices)6.
As total private rents paid in the buildings can be seen as a proxy for the private benefi t derived from the 5.3.3 buildings, the scale of the additional public benefi t is substantial. Few private projects deliver an additional public benefi t on the scale of 17% of the private benefi t derived.
It should be reiterated that although we compare the agglomeration benefi t to rent to give a sense of scale, this 5.3.4 agglomeration benefi t is an external, public benefi t that accrues to UK plc, separate from the benefi ts accrued by building tenants and developers.
By 2030, the cumulative benefi t (undiscounted, in 2007 prices) exceeds £1bn. This external benefi t can 5.3.5 be expected to continue over the life of the building, but the scale of the benefi t will be dependent on other planning and employment distribution decisions.
This result is dependent on the agglomeration elasticity applied, in this case 0.224. This is the appropriate 5.3.6 elasticity under Department for Transport guidance. However, we believe this may be high. Sensitivity analysis of applying an agglomeration elasticity half as large would halve the benefi ts estimated – to £100m in the fi rst year.
Putting agglomeration benefi t in contextThe estimated £206m annual benefi t from the tall buildings in the modelled scenarios is the marginal 5.3.7 agglomeration benefi t of the additional buildings, which can be added to the total agglomeration benefi t already occurring in London.
Though we cannot calculate the exact contribution of agglomeration to productivity and output in London, we 5.3.8 can estimate it by looking at the differential in output between jobs in inner and outer London. In 2004, the average GVA per worker in inner London was £49,000 while average GVA per worker in outer London was £36,000. This 36% uplift in average output per worker gives a valuable indication of the scale of benefi t that being located in inner London provides. As GVA in inner London in 2004 totalled £124bn, nearly £45bn of GVA could be associated with this inner London advantage, of which agglomeration is likely a strong component.
Inner London productivity and agglomeration are crucial to London’s economy. Adding to density adds to the 5.3.9 benefi t that agglomeration is providing to London and to UK plc.
Marginal benefi t versus marginal costThe benefi ts calculated are external marginal benefi ts resulting from the agglomeration in the modelled 5.3.10 scenario. However, these need to be compared to the appropriate marginal costs.
6 Other tests suggest this is a conservative estimate – applying ratios of fl oorspace/employee in Canary Wharf, for example, would raise the scale of external benefi t to 24% of the private benefi t.

24
The key marginal costs of building tall buildings instead of more, lower rise buildings to accommodate the 5.3.11 employment growth are: 1) construction differentials; and 2) transport and infrastructure costs.
In this case, we assume that the difference in construction costs between more lower rise buildings and 5.3.12 the fewer tall buildings tested is negligible, as increased construction costs of building tall are offset by the increased land costs of building lower rise and accommodating the same number of employees (as happens in the base scenario).
In this case, we further assume that the marginal transport costs are zero. This scenario assumes that Crossrail 5.3.13 opens and increases transport capacity in central London. Additionally, as the test scenario only moves jobs within a borough (see fi gure 6.1) and within central London, commuting patterns in and out of central London remain largely unchanged between the two scenarios. The marginal cost would be higher, for example, if we moved jobs from Croydon to central London – transport capacities would need to be increased.
This is a key message in applications of this work, particularly in other cities. Marginal costs of construction 5.3.14 and transport, as well as any other marginal costs for a particular project, must be part of the impact equation. Table 5.2 presents that equation for the evaluated scenario. This is intended as a template for thinking about applications in other cities.
Table 5.2 Net impact equation
Marginal benefi t Minus marginal cost Net impact
Agglomeration Construction Transport/infrastructure
£3bn 0 0 £3bn
A closer look at the transport implications It is recognised that constructing tall buildings is not the only way in which density can be increased. However, 5.3.15 the methodology that has been used shows that an external benefi t comes about from locating a large number of workers in very small geographic areas near to stations. This would almost certainly have to be accommodated with some tall buildings as a part of the development mix.
The results of this model are dependent on where the tall buildings are assumed to be located. Since effective 5.3.16 density is partly determined by the accessibility of jobs, it follows that effective density – and therefore agglomeration benefi ts – will increase more if the tall buildings are located near to central London stations.
Indeed, a sensitivity test was run where the tall buildings were assumed to be located in less accessible zones 5.3.17 (the southern part of Tower Hamlets, in Westminster along the Thames south of the Houses of Parliament, in Southwark east of City Hall and in Camden south of St Pancras), and this showed a negative impact on output. This was also a logical outcome, as effective density was reduced by distributing employment more evenly across London – moving employment away from areas that are currently dense and moving it to less accessible areas.
This seems correct intuitively and it is unlikely that a tall offi ce building would be constructed somewhere 5.3.18 other than a location with good public transport access. This is certainly the case in central London, where for instance, tall buildings in the City, such as Tower 42 and 30 St Mary Axe, are easily accessible. This also indicates the importance of transport and accessibility concerns – both for developers and more widely for urban policy makers – in choosing a location for a tall building.
25
The role of tall buildings6
Introduction6.1 The debate about high density commercial development inevitably touches on the controversial area of tall 6.1.1 buildings. This report has drawn attention to the economic benefi ts that high density development can bring. This begs the question as to whether there is any need for or advantage in such benefi ts being delivered in the form of tall buildings.
After a period of low demand, tall buildings have grown in popularity over the last two decades, particularly in 6.1.2 commercial areas. The overwhelming demand for tall buildings is in London, and so the focus of any discussion around this aspect is inevitably on the capital.
The recent surge in interest in tall buildings stands in contrast to London’s historically low rise city centre. 6.1.3 London has relatively few tall buildings compared to its economic competitors – such as New York, Tokyo and Chicago. But compared to European counterparts, London has more tall buildings. Some characterise this as a trade-off – economic positioning versus conservation-led cities.
The current policy on tall buildings is set out in the London Plan. Policy 4B.9 (Tall Buildings) indicates that 6.1.4 “the Mayor will promote the development of tall buildings where they create attractive landmarks enhancing London’s character, help to provide a coherent location for economic clusters of related activities, and/or act as a catalyst for regeneration, and where they are also acceptable in terms of design and impact on their surroundings.” The plan also suggests that “tall buildings can be a very effi cient way of using land and can make an important contribution to creating an exemplary, sustainable world city. They can support the strategy of creating the highest levels of activity at locations with the greatest transport capacity. Well designed tall buildings can also be landmarks and can contribute to regeneration and improve London’s skyline.” With the recent election of a new London Mayor, the current policy relating to tall buildings is under review.
What do we mean by ‘tall buildings’?6.2 ‘Tall’ is a relative term, and any discussion of tall buildings needs to be set in an appropriate context. Planning 6.2.1 guidance has tended to defi ne high buildings as structures which signifi cantly exceed the general building heights of their surroundings. As the average height for buildings increases, this means that buildings defi ned as tall at one moment in time, or in one particular place, may not be considered tall in another context. We adhere to the concept that tallness is relative to the urban context. This means that tall buildings are higher and skinnier than ‘groundscrapers’, which may also be high, but tend to have a much larger footprint and bulkier appearance. For London, we loosely consider 30 storeys or more ‘tall’. For other city centres, adjustments should be made. For example, in New York City, 30 stories is rather average, while in Birmingham, 20 stories may be considered tall.
Tall buildings and density6.3 High density and tall buildings are not synonymous – it is possible to have relatively high density without tall 6.3.1 buildings, and some tall buildings have a low net to gross fl oorspace ratio, thus constraining density. However, in key commercial areas, tall buildings generally offer higher employment density than lower rise on the same plot. In cities such as London, where key employment districts are fully developed, building up offers the only real option for increasing density within key business districts, while preserving existing green space: “…within the constraints of the central London area, demand for large areas of contiguous space can only be satisfi ed
26
by building high” (DEGW, 2002 p.64). Conservation constraints on existing buildings and remaining land further limit additional density.
Additionally, in cities such as London, adding density by redeveloping existing buildings is likely to involve at 6.3.2 last some additional height in order to be commercially viable. In deciding whether it is worth redeveloping a site, the landlord needs to be able to offset the cost of demolition of the existing building, the cost of building the new structure, the cost of lost rent during this period, and the risk of the process involved. In most cases (if the existing building is still letable at market rates), this requires the new building to be at least two times the fl oorspace of the original property, and often even 3-5 times the original fl oorspace. All this means that adding employment density can only be commercially viable by adding a few relatively tall buildings, rather than adding a few storeys across many buildings.
The externalities are, of course, very different in suburban areas, and so this report focuses on the economics 6.3.3 of adding employment density to city centres.
Occupier perceptions of tall buildings6.4 At the time of a British Council for Offi ces (BCO) report in 2002(b), there were more than 50 organisations 6.4.1 occupying over 37,000 sq m each spread over several buildings in central London. They determined that 16 were candidates for consolidation over the medium term, and several were already looking. Of course, not all of these will require tall buildings, but tall buildings are likely to provide the most promise for consolidation under one roof and the effi ciency benefi ts that follow.
A BCO 2002(a) survey of tall building occupiers in London found that the large quantity of space needed in a 6.4.2 desired location frequently drove offi ce space selection for tall building tenants. Respondents often chose tall buildings for the quantity of space, which they could not fi nd elsewhere: “We had not foreseen locating in a tall building, but we wanted to put everyone together, meaning the building would have to be 200,000+ sq ft. (approx. 19,000 sq m). Given the size footprint, this meant a tall building” (BCO 2002a, p.17).
In these surveys, no large occupiers reported being infl uenced by landmark attributes of a tall building, though 6.4.3 some asserted it a positive by-product. Among those interviewed, the image aspect certainly seems secondary. “We have no appetite for being in the tallest buildings as such; we want a good building” (BCO 2002a, p.16).
However, among smaller occupiers, image appeared more important, where being in a prestigious building 6.4.4 could “enable a small tenant to have a bigger image” (BCO 2002a, p.18-19). One occupier responded: “The height of Tower 42 is relevant to us. The building is prestigious” (BCO 2002a, p.20).
As part of this study, property experts and tall building occupiers were interviewed to learn more about the 6.4.5 economics of tall buildings in practice. In particular, we wanted to assess the impact that being in a tall building, or on a tall fl oor, has on a tenant’s bottom line. Combining previous research with our own interviews, four key benefi ts emerged:
Quantum of space in key location In central London, many tenants described a tall building as the only way to get all their employees under one roof. One said, “If we wanted to be together in low rise, we’d have to go out to Reading, and we didn’t want to do that.” Tall buildings provide large quantums of fl oorspace near key districts, particularly for the fi nancial services sector.

27
Flexibility Tenants and property experts agreed that fl exibility is often an attractive part of tall buildings. Tenants can expand to other fl oors within the same building, or sub-let fl oorspace as needed, with relative ease.
Choice Property experts were clearer that tall buildings are not for everyone, but that in a competitive city like London, offering a wide range of choice of premises to occupiers helps to provide different businesses with the kind of space they need.
Prestige Tall buildings are one way for a fi rm to achieve an image boost from a prestigious location, particularly through views or a recognisable building title (for example, Tower 42).
It was stressed that this is all relative to the local culture and context, and that different types of buildings (for example, historic or low rise modern) can also provide prestige, as can being located at a prestigious street address or in a prestigious neighbourhood (even if the building is not exceptional).
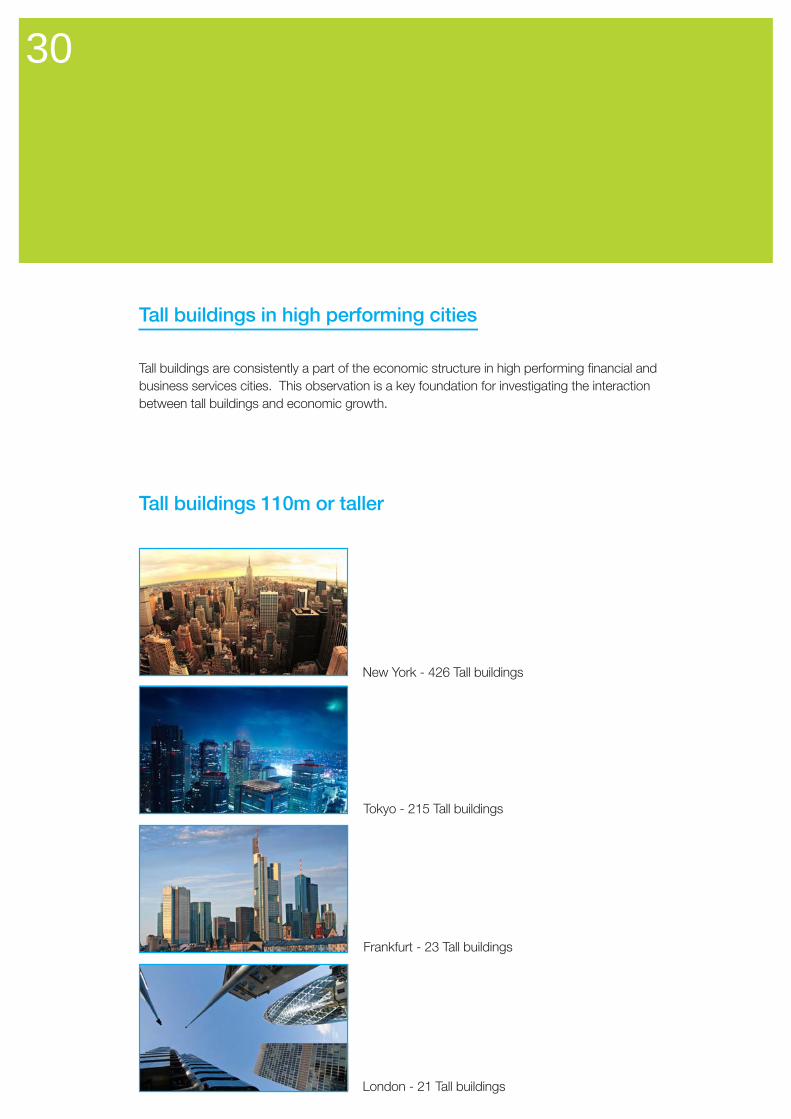
Density: city comparisons6.5 English cities are relatively low rise on the whole. Table 6.1 shows high rise buildings in UK cities (defi ned 6.5.1 as 12 storeys or more, of all types, i.e. residential as well as commercial). Putting London in context with its comparator cities, London is relatively low rise, with far fewer tall buildings than New York or Tokyo (table 6.2). Only Paris has fewer tall buildings. Here, tall buildings were defi ned as 110 metres or taller, a rough fi gure for around 30 storeys or more.
Table 6.1 High rise (12 storeys or more) buildings by status
City Completed Under construction Approved
Birmingham 172 7 26
Bristol 42 1 0
Leeds 105 11 13
Liverpool 45 8 11
Manchester 119 17 19
Newcastle 42 0 2
Nottingham 30 1 0
Sheffi eld 43 9 6
London 1,352 71 176
Source: Emporis

28
Table 6.2 Number of buildings taller than 110 metres
City Number of buildings
New York 426
Tokyo 215
Frankfurt 23
London 21
Paris 5Source: Emporis
While London has fewer tall buildings than its competitors, its relative commercial density is a mixed picture. 6.5.2
Across the wider urban area, approximately 10 square miles, London is denser than Paris, but half as dense as 6.5.3 New York (table 6.3).
Table 6.4 looks at smaller geographies, and fi nds that, among key urban districts, the City of London is 6.5.4 less than half as dense as Midtown Manhattan. Canary Wharf, however, is at the same density as Midtown Manhattan, although this covers a much smaller area (0.15 square miles at Canary Wharf, compared to 1.2 square miles in Midtown Manhatten).
Table 6.3 Employment densities in key international urban cores
City District Total employment Year Area sq mile Employment per sq mile
New YorkBelow 59th Street (includes
Midtown and Lower Manhattan)
1,738,800 2000 8.9 195,371
Tokyo CBD* core 2,434,163 2001 16.3 149,795
London CBD 1,260,500 1990 11.5 109,829
Paris CBD 1,025,000 1990 11.2 91,614
Source: Emporis *CBD: central business district

29
Table 6.4 Employment densities in key international CBDs
City District Total Employment Year Area Sq Mile Employment Per Sq Mile
New York Midtown Manhattan 739,452 1990 1.2 606,108
London Canary Wharf 90,000 2007 .15 600,000
Hong Kong Core CBD 193,520 1990 0.4 443,897
New York Downtown core 340,028 1990 0.8 441,595
Chicago CBD core (Loop) 385,399 1990 1.0 374,902
City of London Square Mile 306,000 2005 1.2 255,000
Paris La Defense 140,000 2000 0.6 233,333
Toronto CBD 143,650 1990 0.7 198,054
Frankfurt CBD 119,735 1990 0.9 129,314
Los Angeles CBD Core 167,297 1990 1.4 116,178
Source: Demographia, Canary Wharf Group at canarywharf.com, Annual Business Inquiry (UK).
For comparison, table 6.5 provides estimated employment densities in central business districts for the UK’s 6.5.5 core cities. Manchester and Birmingham are most dense, while Newcastle and Nottingham are the least dense, at around half the density of Manchester. These densities are derived for the mid-level super output areas (MSAO) that ‘best fi t’ the CBD for each city. Some are better fi ts than others, impacting the results here.
Table 6.5: Employment densities in UK core cities’ CBDs
Core city Employees (ABI 2006)
Land area (sq miles)
Employment (per sq mile) Constituent MSOAs
Manchester 131,776 2.07 63,660 Manchester 016, 014
Birmingham 124,093 2.36 52,582 Birmingham 059, 050
Sheffi eld 39,339 0.77 51,090 Sheffi eld 031
Liverpool 79,468 1.81 43,905 Liverpool 033
Leeds 123,320 2.9 42,524 Leeds 084
Bristol 92,670 2.412 38,420 Bristol 031, 032
Newcastle 66,094 1.96 33,721 Newcastle 024
Nottingham 51,338 1.77 29,005 Nottingham 033
Source: Employment data: ABI, 2006; land area: Census 2001
30
Tall buildings 110m or taller
New York - 426 Tall buildings
Tokyo - 215 Tall buildings
Frankfurt - 23 Tall buildings
London - 21 Tall buildings
Tall buildings in high performing cities
Tall buildings are consistently a part of the economic structure in high performing financial and
business services cities. This observation is a key foundation for investigating the interaction
between tall buildings and economic growth.

31
Chicago - 201 Tall buildings
San Francisco - 48 Tall buildings
Los Angeles - 45 Tall buildings
Dubai - 60 Tall buildings
Shanghai - 133 Tall buildings

32
Implications for London, the rest of the UK and the core 7 cities
Role of London in UK economy: UK-wide impacts7.1 London’s position as a driver of UK economic growth means benefi ts to London are likely to fi lter through 7.1.1 to the rest of the UK. London has 15% of England’s population and 21% of its GVA. Workers in London are signifi cantly more productive than the rest of the UK, with average GVA per job in London nearly 30% higher than the UK average.7 London is a large net tax contributor to the rest of the UK – providing a net contribution of around £12.7bn in 2005/06, which was equal to 2.6% of all tax collection in that year.8
These fi gures alone suggest London’s important role in the UK economy. Beyond the fi gures, however, London 7.1.2 plays a crucial role as the home to key sectors and international corporations that in turn provide business for UK suppliers and support services. The resulting trade between the rest of the UK and London suggests the capital has an even more crucial role in the national economy.
Figure 7.1: Sales to London as a share of regional GVA, 2003
Figure 7.1 indicates the scale of sales to London relative to each region’s GVA. Trade with London is a 7.1.3 signifi cant portion of each region’s GVA, from a high of 18% in the South East, to a still very signifi cant 8% in the North East and 5% in Northern Ireland.
Publications by Lucci and Seex (2007), and the Corporation for London (with LSE [2004] and Oxford Economic 7.1.4 Forecasting [2004]) further outline the extent and nature of the relationship between London’s economy and the rest of the UK. The relationship appears strong, particularly through trade linkages. This underpins the concept that strengthening London’s economy has trickle-down benefi ts to the rest of the UK, and vice versa.
7 Calculations from DTI (2007), GVA data from 2005.8 Calculations from data in Corporation of London and OEF (2007).
33
As one example, fi nancial services are an increasingly important component of the UK economy (currently 7.1.5 contributing more than 9% of GDP, nearly double the relative share in 1980), and London contains more than 40% of the UK’s fi nancial services industry (Corporation of London 2006). London’s 40% of fi nancial services includes many headquarters and key facilities that require the support of fi nancial and business services in the rest of the UK.
If London’s fi nancial and business services (FBS) were unable to be accommodated in London, would they 7.1.6 go elsewhere in the UK and continue the trickle down benefi ts throughout the UK? Ormerod et al (2005) use game theory to support the idea that FBS fi rms relocating from the City are likely to move to stronger FBS agglomerations elsewhere in Europe than to another location in the UK. Given the importance of agglomeration to these companies, the negative impacts of ending up in a location without suffi cient agglomeration may make it too risky for FBS fi rms to be fi rst movers to places like Leeds. They are more likely to go to Frankfurt – and bring spillover benefi ts to the rest of Germany. In this way, a linkage between economic growth in London (whether through densifi cation or other means) and across the UK can be established, though the exact scale cannot be identifi ed.
Implication for London’s competitiveness7.2 If London is to retain its ascendancy as a business and fi nancial centre then it must remain competitive. The 7.2.1 fi ndings of this report show that the provision of the type of accommodation that business needs is a signifi cant contributor to productivity. Enhancing London’s competitiveness has benefi ts for the rest of the UK as well.
Core cities implications7.3 For core cities across the UK, the implications of tall buildings on density and agglomeration are likely to be 7.3.1 similar, but should be interpreted with care.
For example, our London model uses an elasticity of 0.244 – indicating a 10% change in density will increase 7.3.2 output by 2.4%. This elasticity, set out in Graham, is specifi ed for the London services sector. For the services sector across all of the UK, Graham calculates an elasticity of 0.221. For all sectors, the elasticity falls, though is still signifi cant, at 0.125.
The services sector experiences particularly high returns to agglomeration. Given the relative importance of 7.3.3 services – particularly fi nancial services – in London, the benefi ts of agglomeration are large. These benefi ts will be smaller outside London and in cities with a less prevalent services sector.
Furthermore, land availability may be very different in other cities, and increasing density may be easier without 7.3.4 building taller than, or as tall as in London.
Also, with less developed public transport systems, increasing density may carry signifi cant impacts – either 7.3.5 by increasing congestion and/or stretching the public transport capacity too thin, or by requiring additional transport infrastructure. Core cities have varying states of public transport provision, and should seriously consider the public transport impacts of tall buildings in each city and building location’s context.
Landmark opportunities, where tall buildings put a city on the map (such as the Guggenheim Museum in Bilbao) 7.3.6 and encourage in new investment and economic development are worth consideration in the core cities (not so much in London, which already has international status). This strategy for economic development, however, is risky.

34
Summary and conclusions8 In evaluating commercial development and density, policy makers need to understand and take account of 8.3.1 the full range of impacts that such development has, including aesthetic, sustainability and economic impacts. Until now, the economic impacts have often been unconsidered, for example in debates about tall buildings in London. This research explains and estimates the scale of the economic impacts of commercial high density and tall buildings, allowing fuller consideration in development decisions.
Previous research has already established that a doubling of employment density within a given area can lead 8.3.2 to a 12.5% additional increase in output per worker in that area. For the service sector the fi gure is far higher at 22%.
The increase in output arises from the agglomeration impacts that higher employment densities can generate. 8.3.3 These impacts include:
the opportunity for increased business specialisation; knowledge spillovers (both between fi rms in the same sector and across sectors); greater competition, innovation and effi ciency generated by the presence of lots of fi rms offering similar products;larger labour markets offering wide choices for employers and the opportunity to recruit staff with specialist skills;economies of scale created by serving larger markets.
In light of the clear link between employment density and output, it is signifi cant that employment density is 8.3.4 not particularly high in the UK. Only the Square Mile in the City of London and Canary Wharf are remotely comparable to areas like Midtown Manhattan in New York, which has over 600,000 employees per square mile. The benefi cial effect of the higher density employment in central London in terms of higher output per person is plain to see. Output per employee in inner London is far higher than output per person in outer London. This higher marginal output is worth some £45bn a year, around 5% of the UK’s total output.
This research has attempted to measure the value of high density development by gauging the value of adding 8.3.5 further density to central business districts. Following a methodology in line with Department for Transport guidance, a model was constructed to gauge the impact of adding 80,000 employees to locations near key transport nodes in inner London. The exercise changed the distribution of employment, rather than total levels of employment. The economic benefi t was equivalent to the annual output for each of those 80,000 workers increasing by £2,500 a year. A second scenario redistributing those 80,000 workers to less accessible parts of central London produced a decline in output equivalent to £1,600 a year for every one of those 80,000 workers. Location of additional density in accessible areas is a key component of deriving economic benefi t.
The increase in output, resulting from increased density, is an external, public benefi t from agglomeration. 8.3.6 In our model, around 6% of the agglomeration benefi t accrues to the 80,000 ‘added’ employees, while the remaining 94% accrues to other employees in the impacted boroughs – more generally accruing to UK plc. This benefi t accrues only because of the change in the distribution of employment.
How then can we deliver these density increases that contribute to productivity and UK plc? First, the added 8.3.7 density must be in the right locations. The modelling suggests that agglomeration benefi ts are very sensitive to location. Added employment density in less accessible parts of inner London causes a decline in agglomeration and has a negative impact on productivity. So the focus for increased density should be on locations with good accessibility, particularly with regard to public transport. Furthermore, these locations should be in key

35
commercial districts where private sector businesses can take advantage of existing agglomerations.
Another key question is how increased employment density can be delivered? It is simply not practical to add a 8.3.8 few fl oors across many of the existing commercial buildings in a developed district. Extra fl oor space, therefore, will principally be delivered by the replacement of existing buildings with new buildings in a few selected locations.
Developers do, of course, need to make a reasonable return on their investments. In weighing up whether to 8.3.9 redevelop a site with an existing building which is still let-able at a reasonable level of rent, a developer has to take into account the cost of demolition, the loss of rent during rebuilding, the cost of building and regulatory and fi nancing costs. For redevelopment to be viable, therefore, there usually has to be a signifi cant increase in development density, which can sometimes be attained only by building up.
In many central business locations where land is scarce, the provision of tall buildings is often the only means 8.3.10 by which increased density, and the resulting increased productivity, can be achieved. The presence of clusters of tall buildings in the world’s major commercial cities is evidence to this point.
Equally, tall buildings and high commercial density may not contribute to productivity everywhere, as the 8.3.11 modelling exercise demonstrated. Careful consideration of a particular location and its existing infrastructure must be given to assess the potential economic benefi ts and risks.

36
Appendix 1: Works consulted1. Action Energy (2003). Energy Use in Offi ces. Energy Consumption Guide 19. London: Action Energy.
2. Audretsch, D. (1998). “Agglomeration and the Location of Innovative Activity.” Oxford Review of Economic Policy. Oxford: Oxford UP.
3. Becker, G., Glaeser, E., and Murphy, K (1999). “Population and Economic Growth.” The American Economic Review. Volume 89 (2), pages 145-149.
4. Begg, I. (1999). “Cities and Competitiveness.” Urban Studies. Volume 36(5-6), pages 795-809.
5. Boddy, M., Hudson, J., Plumridge, A., and Webber, D. (2005). Regional Productivity Differentials: Explaining the Gap. Bristol: University of the West of England.
6. Borrego, C., Martins, H. et al. (2006). “How Urban Structure Can Affect City Sustainability from an Air Quality Perspective.” Environmental Modelling & Software. Volume 21(4), pages 461-467.
7. British Council for Offi ces (BCO) (2002a). Tall Offi ce Buildings in London: Giving Occupiers a Voice. London: BCO.
8. British Council for Offi ces (BCO) (2002b). Tall Offi ce Buildings in London: Guidance on Planning. London: BCO.
9. British Council for Offi ces (BCO) (2002c). Tall Offi ce Buildings in London: The Economic Realities. London: BCO.
10. Buchanan, P., Arter, K., and Meeks, R. (2006). Agglomeration Benefi ts of Crossrail. Association for European Transport. Available at: http://www.euromedtransport.org/fi leadmin/download/InfrastructureEvents/02_ Agglomeration_ benefi ts_of_Crossrail.pdf. Accessed on 5 September 2007.
11. Lucci, P. and Seex, P. (2007). London’s Links: Who Benefi ts from London’s Success? London: Centre for Cities.
12. Carlino, G., Chatterjee, S., and Hunt, R. (2007). “Density and the Rate of Invention.” Journal of Urban Economics. Vol. 61. pages 389-419.
13. Ciccone, A. (2002). “Agglomeration Effects in Europe.” European Economic Review. Volume 46(2), pages 213-227.
14. Ciccone, A. and Hall, R. (1996). “Productivity and Density of Economic Activity.” The American Economic Review. Volume 86 (1), pages 54-70.
15. Communities and Local Government (CLG) (2007). Consultation Paper on a New Planning Policy Statement 4: Planning for Sustainable Economic Development. London: CLG.
16. Corporation of London (2006). London’s Place in the UK Economy. London: Corporation of London.
17. Corporation of London (2005a). The City’s Importance to the EU Economy 2005. London: Corporation of London.
18. Corporation of London (2005b). The Competitive Position of London as a Global Financial Centre. London: Corporation of London.
19. Corporation of London and Oxford Economic Forecasting (2007). London’s Linkages with the Rest of the UK. London: Corporation of London.
20. Corporation of London and Oxford Economic Forecasting (2004). London’s Linkages with the Rest of the UK. London: Corporation of London.

37
21. Corporation of London and the London School of Economics and Political Science (2004). London’s Place in the UK Economy, 2004. London: Corporation of London.
22. DEGW (2002). London’s Skyline, Views and High Buildings. London: DEGW.
23. DTI (2007). Regional Competitiveness & State of the Regions. London: DTI. Available at: http://www.dtistats.net/sd/ rci2007/index.asp. Accessed on 1 November 2007.
24. Dixon, T. and Thompson, B. (2005) Connectivity, Technological Change and Commercial Property in the New Economy: A New Research Agenda. Reading: College of Estate Management.
25. Donatiello, G. (2001). Environmental Sustainability Indicators in Urban Areas: An Italian Experience. Ottowa, Canada: Conference of European Statisticians. 1-4 October 2001.
26. Ellison, L. and Sayce, S. (2006) The Sustainable Property Appraisal Project. Kingston: Kingston University.
27. Emporis (2007). St Mary Axe Web Article. Available at: http://www.emporis.com/en/wm/bu/?id=30stmaryaxe- london- unitedkingdom. Accessed on 2 October 2007.
28. English Heritage (2002). Memorandum to Select Committee on Transport, Local Government and the Regions. Hansard Archives. UK Parliament. Tab 18. 22 January 2007.
29. Fujita, M., Krugman, P., and Venables, A. (2000). The Spatial Economy: Cities, regions, and international trade. Cambridge, Massachusetts: MIT Press.
30. Fujita, M., and Thiesse, J.F. (2002). Economics of Agglomeration: Cities, industrial location, and regional growth. Cambridge: Cambridge UP.
31. GLA Economics (2008). London’s Central Business District: It’s global importance. London: Greater London Authority.
32. Gibbons, S. and Machin, S. (2003) Employment and Rail Access: An evaluation of the wider benefi ts of transport improvements. London: DfT. Available at: http://www.dft.gov.uk/pgr/economics/rdg/ employmentandrailaccessaneva3065 Accessed on 18 September 2007.
33. Glaeser, E. and Mare D. (2001) “Cities and Skills.” Journal of Labor Economics, volume 19, pages 316–342
34. Graham, D. (2005a) Transport Investment, Agglomeration, and Urban Productivity. London: Imperial College London.
35. Graham, D. (2005b) Wider Economic Benefi ts of Transport Improvements: Link between Agglomeration and Productivity. Stage 1 Report. London: DfT.
36. Graham, D. (2006) Wider Economic Benefi ts of Transport Improvements: Link between Agglomeration and Productivity. Stage 2 Report. London: DfT.
37. Greater London Authority (2001). Interim Strategic Guidance on Tall Buildings, Strategic Views and the Skyline in London. London: GLA.
38. HRH The Prince of Wales (2001) Tall Buildings. Speech to the Invensys Conference, London, 11 Dec. Available at: http://www.princes-foundation.org.uk/index.php?id=149.

38
39. Harris, T. and Ioannides, Y. (2000) Productivity and Metropolitan Density. Tufts University Discussion Paper Series. Medford, Massachusetts: Tufts University.
40. Jenks, M. and Dempsey, N. (2005) eds. Future Forms and Design for Sustainable Cities. Oxford: Elsevier.
41. Kalita, N. and Watts, S. (2007) “Tall buildings – Cost model” Building. Issue 17. Available at: http://www.building. co.uk/story.asp?sectioncode=113&storycode=3085522&c=1. Accessed on: 24 September 2007.
42. Karlsson, C. and Petterson, L. (2005) Regional Productivity and Accessibility to Knowledge and Dense Markets. CESIS Electronic Working Paper Series, Paper No. 32. Jonkoping, Sweden: Centre of Excellence for Science and Innovation Studies.
43. Krugman, P. (1998) “What’s New About the New Economic Geography?” Oxford Review of Economic Policy.
44. LSE Cities Programme. (2002) Tall Buildings: Vision of the Future or Victim of the Past. London: LSE. Available at: http://www.lse.ac.uk/collections/cities/pdf/tall_buildings.pdf. Accessed on 25 September 2007.
45. London Planning Advisory Committee (LPAC). (1999) Strategic Planning Advice on High Buildings and Strategic Views in London. London: LPAC.
46. Ormerod, P., Cook, W., and Rosewell, B. (2005) Why Distance Doesn’t Die: Agglomeration and its benefi ts. London: Greater London Authority.
47. Overman, H., Redding, S., Venables, A. (2003) The Economic Geography of Trade, Production, and Income: A Survey of Empirics. London: London School of Economics. Available at: http://eprints.lse.ac.uk/archive/00000679. Accessed on 5 Sep. 2007.
48. Pank, W., Giratdet, H., and Cox, G. (2002) Tall Buildings and Sustainability. London: The Corporation of London.
49. Peri, G. (1998) Human Capital and Productivity in US Cities. Milan: Universita’ Bocconi.
50. Porter, M. (2000) “Location, Competition, and Economic Development: Local Clusters in a Global Economy.” Economic Development Quarterly. Volume 14(1), pages 15-34.
51. Rappaport, J. (2006) A Productivity Model of City Crowdedness. Kansas City: The Federal Reserve Bank of Kansas City.
52. Rice, P. and Venables, A. (2004) Spatial Determinants of Productivity: Analysis of the UK Regions. Southampton: University of Southampton.
53. Steer Davies Gleave (2007). Isle of Dogs Cordon Survey 2006. Draft Report. London: Steer Davies Gleave.
54. Storper, M. and Venables, A. (2003) Buzz: Face-to-Face Contact and the Urban Economy. Copenhagen: DRUID Summer Conference, 12-14 June 2003.
55. Sumners, J. (2007) “Can Tall Buildings Really be Sustainable?” Arup. Internet Article. Available at: http://www. arup.com/europe/feature.cfm?pageid=10354. Accessed on 5 February 2008.
56. Tavernor, R. (2007) “Visual and Cultural Sustainability: The impact of tall buildings on London.” Landscape and Urban Planning. 12 July 2007.
57. The Carbon Trust (2004). Better Business Guide to Energy Saving. London: The Carbon Trust.
39
58. UK Government. (2002) The Government’s Response to the Transport, Local Government and Regional Affairs Select Committee’s Report on Tall Buildings. London: HMSO.
59. UK Government, House of Commons, Transport, Local Government and the Regions Committee. (2002) Tall Buildings Memoranda, submitted to the Urban Affairs Sub-committee. 15 January 2002.
60. Webber, C. and Athey, G. (2007) “The Route to Growth: Transport, density, and productivity.” Discussion Paper no. 4. London: Centre for Cities at IPPR.
61. Weissbourd, R. (2005) “Strengthening Communities for Regional Prosperity.” Washington, DC: RW Ventures.
62. Wheeler, C. (2004). “Wage Inequality and Urban Density.” Journal of Economic Geography. Volume 4 (4), pages 421-437.

40
Appendix 2: Agglomeration model
Methodology
Our model assumes that the distribution and growth of employment in London follows the forecasts in the London Plan. The forecasts extend to 2026. Table A1 shows employment by borough in 2006 and 2026.
Table A1 London Plan employment by borough
Borough Employment 2006, 000s Employment 2026, 000s Increase in employment 2006 – 2026, 000s
Barking 53 60 8Barnet 133 152 20Bexley 79 89 10Brent 113 129 16Bromley 119 125 5Camden 283 347 63City 346 424 78Croydon 149 155 6Ealing 136 157 21Enfi eld 108 114 6Greenwich 76 88 12Hackney 102 122 20Hammersmith 127 165 38Haringey 77 92 15Harrow 82 94 12Havering 91 100 9Hillingdon 186 209 22Hounslow 131 151 20Islington 183 224 41Kensington and Chelsea 139 152 14Kingston 78 81 2Lambeth 141 160 19Lewisham 81 98 17Merton 79 87 8Newham 82 133 51Redbridge 83 95 13Richmond 83 87 5Southwark 183 253 70Sutton 71 73 2Tower Hamlets 191 321 130Waltham Forest 67 73 7Wandsworth 128 153 25Westminster 609 736 127Total 4,587 5,499 912
Source: Greater London Authority, triangulated employment forecasts (numbers may not add due to rounding).

41
1. Overall employment in London is therefore forecast to increase by 912,000 between 2006 and 2026. Of this growth, an additional 78,000 jobs (20% increase over existing jobs) are expected to be located in the City.
2. For productivity, the level of output per worker in 2006 is calculated fi rst. There is no published data on output per worker by borough, so as a proxy earnings data is used.
3. Using data from the Offi ce for National Statistics, it is estimated that there is a 32% uplift between total earnings and output in London. Estimates of earnings by borough from the 2006 Annual Survey of Hourly Earnings (ASHE) are then obtained, with the 32% uplift applied in order to estimate output per worker in each borough. Those values are shown in Table A1. To obtain future values, an increase of 2.2% a year is applied, in line with the average over the past decade. Table A1 also shows the resulting base values of productivity in 2026.
2000 data from Public Purpose: http://www.publicpurpose.com/ut-cprof-nyc.htm

42
Contributors
Colin Buchanan
Tracy SwinburnJohn SirautPaul BuchananKeiran Arter
Project Steering Group
Adrian Penfold, The British Land Company plcJonathan Turk, Land Securities Group plcJudith Solomon, London FirstIan Selby, British Council of Offi ces
Advisors
Bridget Rosewell, Volterra ConsultingZiona Strelitz, ZZAPaul Burgess, The British Land Company plc
British Property Federation
Michael ChambersJames AndersonJonathan Seager
For further information about this report please contact
Michael Chambers or Jonathan SeagerBritish Property Federation7th Floor1 Warwick RowLondon SW1E 5ER
Tel: 020 7828 0111
LiabilityNo liability is accepted by Colin Buchanan and Partners Limited for any use of this report, other than for the purposes for which it was originally prepared and provided. Opinions and information provided in this report are on the basis of Colin Buchanan and Partners Limited using due skill, care and diligence in the preparation of the same and no explicit warranty is provided as to their accuracy. It should be noted and is expressly stated that no independent verifi cation of any of the documents or information supplied to Colin Buchanan and Partners Limited has been made.

43

British Property Federation7th Floor, 1 Warwick Row,London SW1E 5ER
Tel: 020 7828 0111Fax: 020 7834 3442
Email: [email protected]
September 2008