Economic Impact of MICE in Thailand - WordPress.com · results can be used for comparisons with...
20
Economic Impact of MICE in Thailand Summary Presentation Date: 22 Oct. 2015
Transcript of Economic Impact of MICE in Thailand - WordPress.com · results can be used for comparisons with...

Economic Impact of MICE
in Thailand
Summary Presentation
Date: 22 Oct. 2015

Final Presentation
September 2015
What is MICE industry?
2
MICE stands for Meetings, Incentives, Conventions and Exhibitions
M MEETING
A meeting of a number of people
who work for a same company or
group of companies. It is a
general term indicating the
coming together of a number of
people in one place to confer or
carry out a particular activity.
I INCENTIVE
a modern management
motivational tool to encourage or
reward employees, workers,
dealers, distributors, agents,
sales representatives, etc.
C CONVENTION
Meeting of a number of people
who work for government or who
are people in same or similar
careers. It is a general term
indicating the coming together of
a number of people in one place
to confer or carry out a particular
activity.
E EXHIBITION
Exhibition is taken as a mean to
present products or services to
the target audiences with the
main objective of inducing sale
and/or creating awareness.

Final Presentation
September 2015
How MICE Industry Players are related?
3
There are two types industry players involved in MICE industry - Event Organizers (EOs) and Vendors
of EOs
Strong Association
Weak Association * PEOs also manage trade conferences during the trade shows
Incentive Meeting Convention Exhibition
EO
V
en
do
rs Hotels Venues Booth Stand Contractor Logistics
Professional Exhibition
Organizers (PEO)*
Professional Conference Organizer (PCO)
Destination management Company (DMC)
Strong Association
with PCO and DMC
Strong Association
with PCO and PEO
Strong Association
with PEO and weak
association with PCO
Strong Association
with PEO and weak
association with PCO

Final Presentation
September 2015
Economic Impact Assessment in MICE Industry
4
Economic impacts are effects on the level of economic activity in a given area. In this study, the “effects”
may be viewed in terms of:
* Refers to operating receipts less operating expenditure plus depreciation of fixed assets
Measures of Economic
Impact Rational
Expenditure / Spending
It includes spending of event
organizers, delegate spending,
vendor spending, investment
spending, and MICE employee
spending
As many other countries are still
using spending to capture the data
for tourism & MICE industry , the
results can be used for comparisons
with other countries.
Value
Added
It includes the sum of wage income
and corporate profit generated in the
study area. For this study, it includes
VA of EOs, VA of vendors, VA of
delegates spending, VA of vendor
spending, VA of MICE investment,
and VA of employee spending.
The results can be used to compare
with other industries in the economy
in terms of contribution to GDP.
Value Added (VA)
= Operating Surplus / Loss* + Remuneration + Indirect Taxes & Fees
For the purpose of this study, the following definition of value added is considered

Final Presentation
September 2015
Calculation of Economic Impact By Expenditure: Definition
5
The economic impact of the MICE Industry is defined below
Tier of influence
Indirect
Impact
This is a measure of the amount that suppliers which support the Thailand MICE
segment industry spend on goods and services from third parties.
Direct
Impact
This is a calculation of the value measured in Thailand baht of expenditures by
MICE segment industry visitors/delegates, exhibitors, and organizers.
Induced
Impact
This is a measure of impact of the spending by MICE segment - related employees
in the local Thailand economy.

Final Presentation
September 2015
Economic Impact Assessment in MICE Industry
6
Economic impacts are effects on the level of economic activity in a given area. In this study, the “effects”
may be viewed in terms of:
Direct Impact
Indirect Impact
Induced Impact
• Event Organizers
• Delegates
• Vendors
• Investments
• Employees of MICE industry
Total Expenditures
Spending
EO Spending
Delegate Spending
Vendor Spending
Investment Spending
MICE Employee Spending
GDP Contribution
Value Added
VA of EO (PCO,PEO,DMC)
VA of EO spending
VA of delegate spending
VA of vendor spending
VA of investment spending
VA of employee spending
Final Presentation
September 2015
Economic Impact Assessment in MICE Industry
7
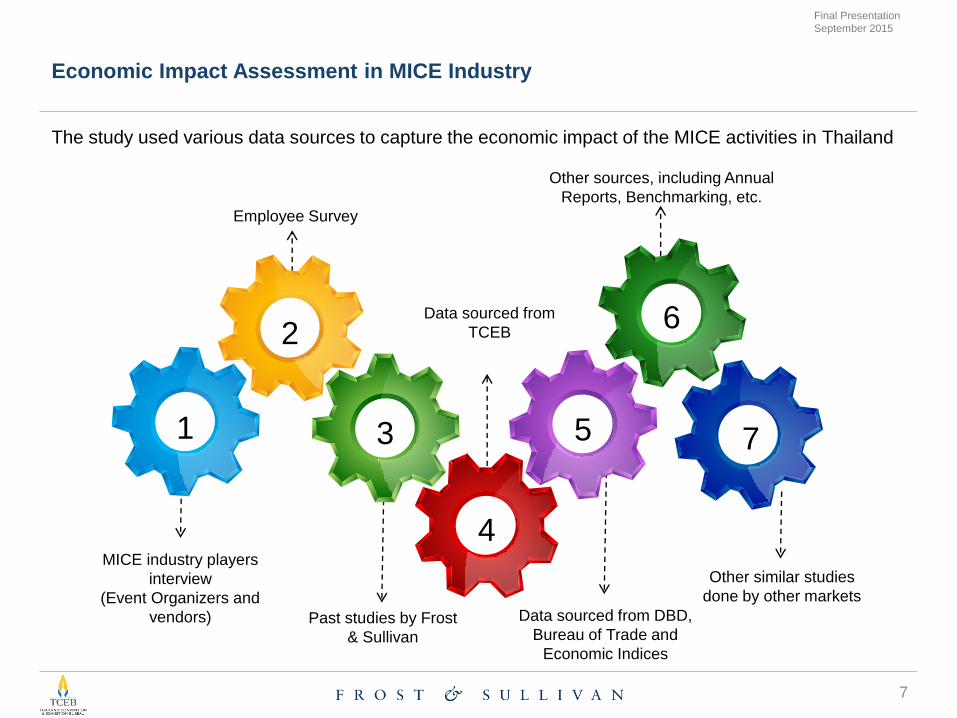
The study used various data sources to capture the economic impact of the MICE activities in Thailand
Past studies by Frost
& Sullivan
Employee Survey
MICE industry players
interview
(Event Organizers and
vendors)
Data sourced from
TCEB
Data sourced from DBD,
Bureau of Trade and
Economic Indices
Other sources, including Annual
Reports, Benchmarking, etc.
Other similar studies
done by other markets
1
6 2
3
4
7 5
Final Presentation
September 2015
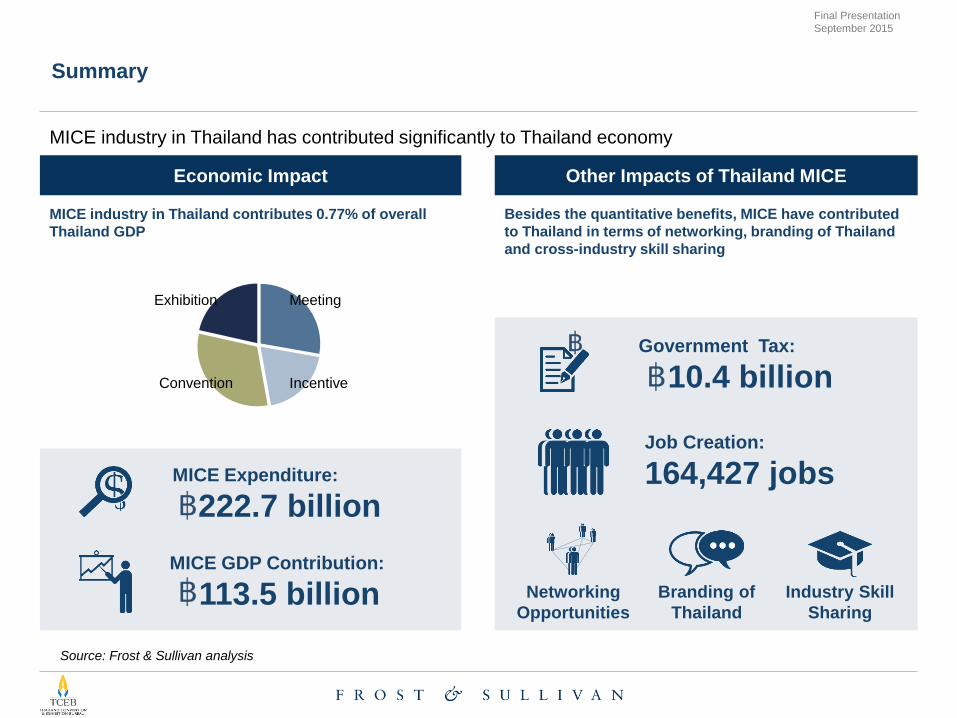
MICE industry in Thailand has contributed significantly to Thailand economy
Summary
Source: Frost & Sullivan analysis
MICE Expenditure:
222.7 billion
MICE GDP Contribution:
113.5 billion
MICE industry in Thailand contributes 0.77% of overall
Thailand GDP
Meeting
Incentive Convention
Exhibition
Job Creation:
164,427 jobs
Government Tax:
10.4 billion
Besides the quantitative benefits, MICE have contributed
to Thailand in terms of networking, branding of Thailand
and cross-industry skill sharing
Networking
Opportunities
Branding of
Thailand
Industry Skill
Sharing
Economic Impact Other Impacts of Thailand MICE

Final Presentation
September 2015
Below infographic shows major figures of Thailand MICE industry
Summary
9
Source: Frost & Sullivan analysis
Traveller Spending per Day Traveler Spending per Trip
MICE travelers’ spending per day is 3.5 times more than
leisure travelers’ spending per day
> 3.5 times
MICE Traveler:
16,095.19 (spending per day)
Leisure Traveler:
4,616.49 (spending per day)
Despite the fact that leisure travelers are staying longer
(9.85 days) than MICE travelers (5.28 days), MICE
travelers are still spending more (THB 84,982.60) than
leisure travelers (THB 45,472.43)
> 1.9 times
MICE Traveler:
84,982.6 (Spending per trip)
Leisure Traveler:
45,472.43 (spending per trip)
MICE Traveler Leisure Traveler MICE Traveler Leisure Traveler

Final Presentation
September 2015
Below infographic shows major figures of Thailand MICE industry (Cont’d)
Summary
10
Source: Frost & Sullivan analysis
Thailand MICE Figures
• As of 2013, per every 1
baht that TCEB spending,
total 104.27 baht of GDP
contribution was
generated
• MICE industry is fast-
growing industry
• CAGR (Compound
Annual Growth Rate) of
MICE industry is 1.6
times higher than
Thailand GDP growth rate
(2009-2013)
• MICE contributes more
on tax
• Comparing GDP
contribution of MICE and
Tax contribution of MICE,
MICE industry pays 2
times more tax than its
GDP contribution
Value Added
per Worker
2.1 times
more Value Added
(GDP contribution)
than average worker
• MICE contributes more to
GDP
• Comparing GDP
contribution per worker,
employees generated by
MICE industry contribute
2.1 times more than
average employees do in
Thailand
Corporate
Income Tax Growth Rate
Return on
Investment
1.6 times
faster growth rate
than overall GDP
growth of Thailand
2 times
more corporate tax
pay compare to MICE
GDP contribution
rate
104.27 baht
=Economic Impact
(VA) / TCEB Budget

Final Presentation
September 2015
Below infographic shows major figures by M, I, C, and E segment
Summary
11
Source: Frost & Sullivan analysis
Total
Expenditure (baht)
Total Value
Added (VA, baht)
VA per
Delegate (baht)
VA per
Event (baht)
Job
Creation (jobs)
Meeting
57.3 billion (2015, estimated)
31.5 billion (2015, estimated)
121,119.7 (2014, estimated)
10.5 million (2014, estimated)
40,779 (2015, estimated)
Incentive
45.9 billion (2015, estimated)
22.0 billion (2015, estimated)
81,794.2 (2014, estimated)
9.9 million (2014, estimated)
33,047 (2015, estimated)
Convention
66.4 billion (2015, estimated)
35.6 billion (2015, estimated)
110,579.2 (2014, estimated)
12.1 million (2014, estimated)
46,735 (2015, estimated)
Exhibition
53.1 billion (2015, estimated)
24.4 billion (2015, estimated)
138,840.4 (2014, estimated)
253.6 million (2014, estimated)
43,865 (2015, estimated)
Average
55.7 billion (2015, estimated)
28.4 billion (2015, estimated)
110,544.3 (2014, estimated)
13.8 million (2014, estimated)
41,107 (2015, estimated)

Final Presentation
September 2015
Overall Economic Impact
12
Source: Thailand national 2014 GDP data is based on Bank of Thailand database – Thailand Macro Economic Indicators, Frost & Sullivan
analysis
Comparison with Global Benchmarks
Meeting, 0.21%
Incentive, 0.15%
Convention, 0.24%
Exhibition, 0.17%
2014 Thailand MICE GDP contribution
0.77%
Hong Kong Exhibition Industry – 2.0%
of GDP1)
UK Exhibition Industry – 0.4% of GDP2)
Singapore MICE Industry – 1.06%1)
South Korea MICE Industry – 0.8% 2)
Vienna Convention (Conference)
Industry – 1.14% of GDP1)
UK Meeting Industry – 2.4% of GDP1)
US Meeting Industry – 3.18% of GDP2)
Singapore Meeting Industry – 0.59% of
GDP2)
1) HKTCD report
2) Oxford Economics – Economic Impact of
UK Exhibition Industry
1) Singapore Tourism Board
2) KB Financial Group research report
1) Sustainable Development report, UN
1) Meeting Professionals International report
2) Singapore Tourism Board

Final Presentation
September 2015
Importance of MICE industry
13
Importance of MICE activities in Thailand
Source: Frost & Sullivan analysis
This slide shows the importance of MICE industry in Thailand economy. With the interviews with MICE
industry participants, level of agreement on each factor was scored as below (scale from 0 to 5)
MICE activities lead to knowledge creation and
knowledge transfer
MICE activities increase sharing of cross-industry
skills and ideas
MICE activities create international awareness of
Thailand firms
MICE activities create networking opportunities
and business connection for Thai people
MICE activities enhance branding of Thailand as
the business hub
Level of Agreement
4.4/ 5.0
4.0/ 5.0
3.9/ 5.0
4.5/ 5.0
4.1/ 5.0

Final Presentation
September 2015
Importance of MICE industry (Cont’d)
14
Importance of MICE activities in Thailand
Source: Frost & Sullivan analysis
This slide shows the importance of MICE industry in Thailand economy. With the interviews with MICE
industry participants, level of agreement on each factor was scored as below (scale from 0 to 5)
MICE activities strengthen Thailand as a regional
hub
MICE activities lead to SME development in
Thailand (through vendor programs)
MICE activities create training opportunities for
Thai talent (e.g. Internships, on-the-job training)
MICE activities enhance Thailand’s position as the
tourism hub
4.0/ 5.0
4.1/ 5.0
4.1/ 5.0
4.6/ 5.0
Level of Agreement

Final Presentation
September 2015
Challenges and Opportunities of MICE industry in Thailand
15
Challenges
Source: Frost & Sullivan analysis
Despite the robust growth of MICE industry, it also faces some challenges that requires to be addressed
Not enough venue
Venues need better
transportation system (e.g. BTS link to BITEC)
Venue
Integration/cooperation
between government
sector and private sector
Cooperation
Language barriers
Required more skilled
labors
Talent Crunch
Government investment or
incentive policy for venue
development is required
Venue development plan
with proper transportation
system is required
Thailand should have one
stop service to provide all
support to all related
activities
TCEB should be more
active to coordinate with
all related parties.
Manpower development
plan for MICE industry
(e.g. training, certificates)
Language (English)
education curriculum
Recommendation

Final Presentation
September 2015
Challenges and Opportunities of MICE industry in Thailand
16
Opportunities
Source: Frost & Sullivan analysis
Thailand has abundant tourism resources, geographical location and low cost that help the growth of
MICE industry
Centre of ASEAN
One of the center of Asia’s
transportation hub
Geographical Location
Unique cultural heritage
with good hospitality
World-class MICE venues
Infrastructure
Compared to competitor
countries including
Singapore or Malaysia,
cost of traveling is low
Low cost
Continuous investment on infrastructure especially on transportation system for MICE delegates
As China and other emerging countries including Vietnam and Myanmar is growing as a MICE
destination, Thailand should start positioning itself as the creative or value added event destination
Increase in manpower cost can slow down industry growth: Thailand requires to invest more on
human resource development and start focusing on high value services (no price competition)
Strategic Direction

Final Presentation
September 2015
Historical change of Total Economic Impact
17
0
20,000
40,000
60,000
80,000
100,000
120,000
140,000
160,000
180,000
200,000
2009 2010 2011 2012 2013
Meeting Incentive Convention Exhibition
Total Economic Impact of MICE in Thailand (2009-2013)
million THB
Spending
114.1 bil. Spending
103.3 bil.
Spending
138.1 bil.
Spending
159.9 bil.
Spending
178.2 bil.
VA
58.0 bil.
VA
90.8 bil. VA
81.8 bil. VA
70.6 bil.
VA
52.5 bil.
*Compound Annual Growth Rate

Final Presentation
September 2015
MICE GDP Contribution
18
Source: World Travel & Tourism Council report, Frost & Sullivan analysis
MICE Contribution in Travel & Tourism Industry
Travel &
Tourism
Industry:
19.3%
contribution of
overall Thailand
GDP (2014)
MICE Industry:
3.5%
contribution
of Travel &
Tourism
Industry (2014) Meeting
(0.98%)
Incentive
(0.66%)
Convention
(1.09%)
Exhibition
(0.77%)
Direct Impact Total Impact
Travel &
Tourism
Industry:
8.6%
contribution of
overall Thailand
GDP (2014)
MICE Industry:
6.13%
contribution
of Travel &
Tourism
Industry (2014) Meeting
(1.72%)
Incentive
(1.16%)
Convention
(1.90%)
Exhibition
(1.35%)

Final Presentation
September 2015
Conclusion
19
Estimated direct, indirect, and induced impact of Thailand MICE industry in 2015
Summary Direct Indirect Induced Total
Spending (baht)
131,893,889,554 75,543,539,856 15,274,645,284 222,712,074,695
GDP (baht)
82,531,200,659 26,452,567,387 4,538,774,962 113,522,543,008
Tax (baht)
7,234,706,073 2,727,166,697 405,783,669 10,367,656,440
Employment (jobs)
112,064 43,127 9,236 164,427
Source: Frost & Sullivan analysis

Final Presentation
September 2015
20
Karthik Rajan
Vice President,
Public Sector & Government
Practice
M: +65 92276307