Economic Impact of a Potential Free Trade Agreement...
92
Economic Impact of a Potential Free Trade Agreement (FTA) Between the European Union and South Korea Short study by Copenhagen Economics & Prof. J. F. Francois March 2007 Views expressed in this report are attributable only to the authors, and not to the European Commission nor the Government of the Republic of Korea
Transcript of Economic Impact of a Potential Free Trade Agreement...

Economic Impact of a Potential Free Trade Agreement (FTA) Between the European Union and South Korea Short study by Copenhagen Economics & Prof. J. F. Francois
March 2007
Views expressed in this report are attributable only to the authors, and not to the European Commission nor the Government of the Republic of Korea
Economic Impact of a Potential Free Trade Agreement between the European Union and South Korea
Page 2 of 92
Table of Contents
Executive/Non-Technical Summary............................................................................ 3
Chapter 1 Introduction ................................................................................................. 7
Chapter 2 EUs and Koreas Production and Trade..................................................... 8 2.1. Bilateral Trade Agreements in Korea and the EU............................................................8 2.2. Trade Patterns...............................................................................................................10 2.3. Trading Costs ................................................................................................................15 2.4. Foreign Direct Investment in Korea ...............................................................................20
Chapter 3 The Model and the Data............................................................................ 21 3.1. The CGE model .............................................................................................................21 3.2. Model data.....................................................................................................................22 3.3. Setting up the analysis; baselines and trade liberalization scenarios ............................23
Chapter 4 Results ....................................................................................................... 25 4.1. Real Income Effects ......................................................................................................25 4.2. Effects on Sectoral Outputs ...........................................................................................28 4.3. Effects on market shares and bilateral trade flows ........................................................36 4.4. Other Macroeconomic Results ......................................................................................45 4.5. Comparison with the KIEP study ...................................................................................47
Chapter 5 Conclusions............................................................................................... 50
References .................................................................................................................. 52
Appendix I: Scenario definitions and baseline ........................................................ 55
Appendix II: Detailed results ..................................................................................... 57 5.1. Results scenario Full FTA..............................................................................................57 5.2. Results scenario Partial 1 FTA ......................................................................................63 5.3. Results scenario Partial 2 FTA ......................................................................................71 5.4. Results on Korean imports by sector.............................................................................78
Technical Annex: An Overview of the Computational Model ................................. 81

Economic Impact of a Potential Free Trade Agreement between the European Union and South Korea
Page 3 of 92
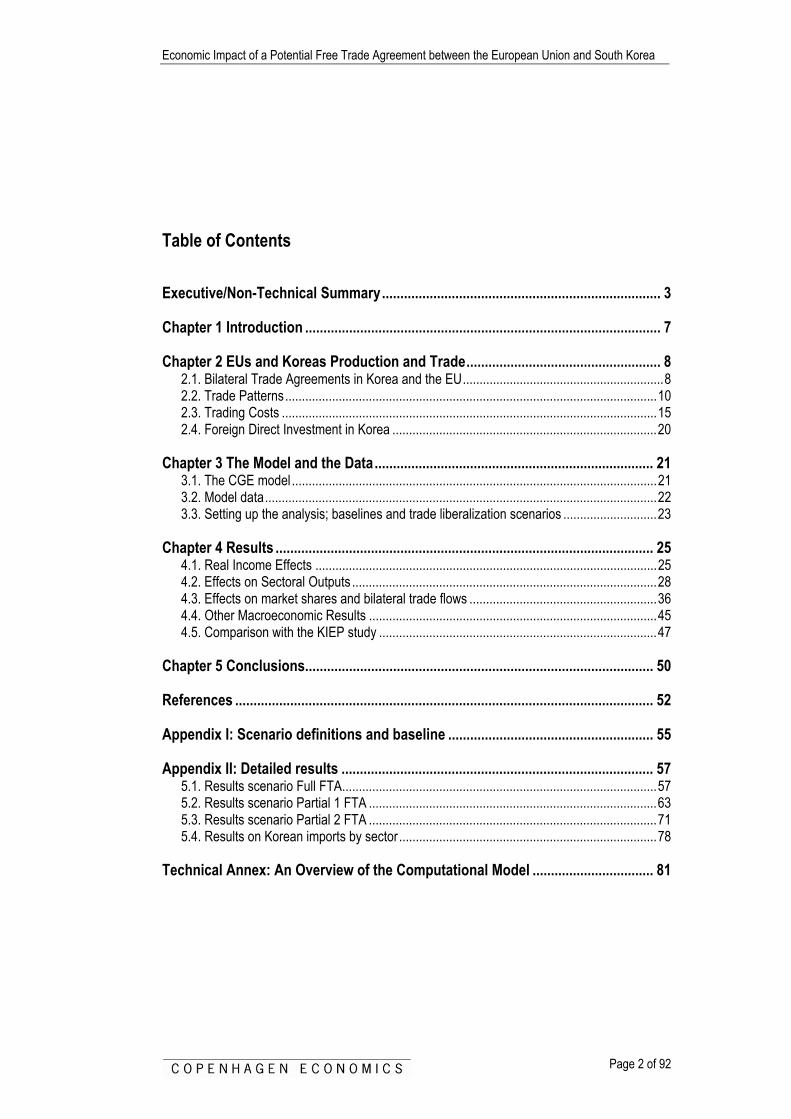
Executive/Non-Technical Summary South Korea is EU’s fourth largest non-European trading partner. Until recently, Korea only held trade discussions on a multilateral level through the WTO. Lately, there has been a change of mind, partly as a result of the economic decline in the wake of the Asian financial crisis, and partly as a result of the failure in Cancun. This change of mind, has led Korea to launching an offensive in bilateral trade talks. Since the first bilateral trade agreement with Chile, effective in 2004, Korea has also signed free trade agreements (FTAs) with EFTA, Singapore, and ASEAN. Korea is currently negotiating and/or considering FTAs with a number of other countries, among these important trading partners such as the US, Canada and India. Furthermore, Korea is currently negotiating with ASEAN to extend the goods trade agreement, to services and investment. A potential agreement with China is undergoing a study, while talks with Japan have been suspended for two years. The purpose of this study is to analyze the effects of potential measures to liberalize trade between the European Union (EU25) and South Korea (hereafter Korea). Using a computable general equilibrium (CGE) model of world trade, incorporating the most recent GTAP database, we have evaluated two scenarios for an EU-Korea free trade agreement (FTA) and compared it to the maximum potential given by a full free trade agreement. We show that a realistic FTA scenario (called “Partial 1”) yields a total gain for the two economies of 26 percent of the potential in a full FTA. If liberalization of trade in services is taken a step further, as in our more ambitious scenario (called “Partial 2”), total gains increase to 46 percent of the total potential from a full FTA between EU and Korea. Figure 1.1 Summary of results for partial scenarios
10% 10%
15%
35%
1%1%0%
10%
20%
30%
40%
50%
60%
70%
80%
90%
100%
Partial 1 Partial 2
Gai
ns fr
om fu
rther
trad
e lib
eral
isat
ion
as p
erce
nt o
f ful
l FTA
pot
entia
l
Reduction of barriers toservice trade (25% and50% respectively)
A full reduction of tariffsin manufacturing
A 40% reduction oftariffs in agriculture andfood
Current level
Full FTA potential
Partial 1 percentage of full FTA:
26%
Partial 2 percentage of full FTA:
46%
Source: Francois and Copenhagen Economics, model simulations Note: The benchmark is full FTA without trade facilitation. The underlying indicator is real income effect. The
corresponding percentages for each economy are found in the results chapter.
Economic Impact of a Potential Free Trade Agreement between the European Union and South Korea
Page 4 of 92
Our results shows that both economies stand to gain economically from all analyzed levels of trade liberalization, but the gains are unevenly distributed. Korea will obtain two-thirds of the total gains from an EU-Korea FTA in all scenarios, basically because the Korean economy initially is more protected from international competition than the EU economy, and therefore will benefit more from increased competition. In agriculture and in manufacturing we look at tariffs and we do not consider non-tariff barriers. In agriculture tariffs are cut by 40 percent and in manufacturing remaining tariffs are cut to zero. This implies that we do not simulate the effect that in both agriculture and manufacturing additional gains from an FTA can come from the removal of non-tariff barriers. Some evidence suggests that in some of these sectors, e.g. automotives, non-tariff barriers are more important than tariffs. In the service sector we analyse the effect of reducing existing barriers with 25 percent in Partial 1, with 50 percent in Partial 2 and entirely in the full FTA. It comes as no surprise that the gains from liberalization are shown to be higher, the more barriers to trade are removed. Hence, the economic gains are expected to be biggest for a full trade agreement and smallest in the realistic Partial 1 trade agreement, while a Partial 2 trade agreement yields intermediate, albeit still positive, gains from trade liberalization. It is perhaps more surprising, just how important service liberalization is to the overall effect of an EU-Korea FTA. Separating the effects of different measures taken to liberalize trade, we find that most of the economic gains are attributable to liberalizing trade in services. This is central, not least for the EU, where 70 percent of the economic gains in a Partial 1 scenario can be traced back to liberalization in services. We show that the EU is expected increase exports to Korea in the following key tradable service sectors: wholesale and retail trade, transport services, communication, financial services and banking, other business services and other services. The estimated increase in the value of exports to Korea is between 40 and 60 percent of the baseline values in these sectors. The reason for such dramatic increases is that Korea needs these advanced services to fuel the growth of their own economy, and that the Korean service sector is highly protected by non-tariff barriers. Service trade is not only important to the EU. In Korea, 53 percent of the gains in real income in the Partial 1 scenario can be attributed to opening up their economy to trade in services. Korea gain from service trade liberalization even tough we predict the Korean service sector to shrink in the short-term, as a result of an FTA with the EU. Opening up its economy to foreign service-providers will, however, benefit the Korean economy through significant positive spillovers on the Korean manufacturing sector. Today, the Korean service sector is much sheltered from international competition, as documented by substantial ex-ante tariff equivalents in services, and the resulting high prices for services as well a limited supply of varieties are hampering the growth of the Korean economy as such, and in particular its competitive and globally oriented manufacturing industry1. We show that a large part of the expected output expansion for Korean manufacturing (especially in electrical machinery and other machinery, but also in motor vehicles) is actually generated by better access to the key competitive services in the global economy, namely transport, communication and business services, which could be provided by the EU under a free trade agreement. Comparing the outcomes for different levels of trade liberalization, we find that the Korean export gains are sensitive to the degree of services liberalization taking place. This implies that as the scope for services liberalization is reduced, the Korean export gains in manufacturing
1 According to OECD’s latest review of Korea, the potential gains from enhanced competition through market
opening and regulatory reforms appear greatest in the services sector, given its lower level of productivity. For example, labour productivity in services is around 60% of that in manufacturing, and the difference is widening; see OECD (2004) p. 10, p. 34.
Economic Impact of a Potential Free Trade Agreement between the European Union and South Korea
Page 5 of 92
fall accordingly. Put in short: by succeeding in exporting advanced services, the EU can help Korea succeed in exporting advanced manufacturing. A free trade agreement can make this possible - to the benefit of both economies. However, service is not the only matter on the agenda. Reducing tariff on non-food products yield almost all of the remaining effects in EU. In EU 28 percent of the gain in the Partial 1 scenario is due to lower tariffs on non-food. For Korea this share is even higher. In Korea 43 percent of the gain in the Partial 1 scenario is resulting from non-food tariff reductions. While output on average will increase in both economies, on industry level, some industries in both economies will in fact expand while others are expected to contract. In general, as could be expected, the domestic industries with higher ex-ante levels of import protection are those expected to decrease as a result of increased trade and thus competition. With regards to expected changes in sector output, a pattern emerges where there is a drop in merchandise production for the EU, while the output for European services will increase. For Korea, the effects of increased trade are expected to be the opposite. The Korean merchandise sector will expand, while the service sector is expected to contract as a result of increased international competition. The picture is however more complex. According to our study, the Korean motor vehicles sector will exhibit the largest increase in production, while the largest decrease is found in the sectors for processed food. For the EU, we predict a mirroring pattern: the relatively largest decline is found in the motor vehicles sector, while processed food sectors are expected to grow. The largest drops in output in the EU are found in two sectors where ex-ante European trade barriers were higher than their Korean counterparts, namely in motor vehicles and electrical machinery. These sectors show a contraction of output corresponding to 1 percent and 0.5 percent respectively. It should be noted that these sectors enjoys high a priori import protection, and therefore removing tariffs is having stronger impact in these sectors for the EU. Our study also predicts a growth in iron and steel sector in Korea, and a decline within the EU. In our baseline without Korea engaging in other FTAs, EU has a 17.5 percent share of total Korean imports from all countries (measured in values). If Korea concludes FTAs with other partners (US, Canada, India, China, ASEAN and Japan), but not with the EU, the EU25 will lose a market share of total Korean imports of 2.8 percentage points, making EU25 share of total Korean imports go down to 14.7 percent. We show that the isolated drop in EU25 market share from other Korean FTA is not a bad thing for EU. The explanation is very simple. When Korea opens up trade with other trading partners, but not with the EU, two things are likely to happen: One, Korea will import more goods and services. Two, Korea will import relatively more from the other trade partners compared to the EU. We predict that the loss in market share will be compensated by an increase in the total market size of Korean imports from world, and our simulations show that the value of EU exports to Korea will increase if Korea engages in FTAs with other partners than the EU. So even if the EU market share in Korea should decline, the growth in the value of the Korean import market more than compensates for this decline in share, and our study suggest the net result to be an increase in EU exports to Korea. This result also holds for the main sectors, except in agriculture and processed food, where we predict that the income effect will not be strong enough to compensate for the loss in market share, and the net result for Korean imports of EU agriculture and food will be negative if Korea engages in other FTAs and not with the EU. This is not surprising, since agriculture and food are the less income sensitive than manufacturing and services. What is most important is that in the realistic scenario (Partial 1) EU25 market share of total Korean imports will increase by 5,8 percentage points from the baseline level with the other
Economic Impact of a Potential Free Trade Agreement between the European Union and South Korea
Page 6 of 92
FTAs (from 14,7 percent to 20,5 percent of total imports), when including the effect of other Korean-centered FTAs. At the same time we predict that the entire Korean market, measured by the total value of Korean imports, will go up by an estimated 6 percent alone due to the EU-Korea free trade agreement. So even in the most moderate of the three scenarios, EU25 will not only regain its share of the growing Korean market, it will also expand its market share vis-a-vis its competitors. Koreas import from the EU will increase by 19.1 billion Euros, or 48 percent if the EU engage in a Partial 1 agreement with Korea (and Korea also concludes the other FTAs as predicted). The largest trade impacts for the EU are found within business services (22% of the total increase in the value of Korean imports from EU25), machinery (16% of the gain) and processed food (11%). These three sectors account for nearly half of the total trade impact on EU25. Twelve of the 36 aggregated sectors in our simulations account for more than 90 percent of the total trade impact on the EU25 in Korea (the remaining 24 sectors sum up to a mere seven percent of the total change in EU imported value to Korea). EU25 imports from Korea will increase by 12.8 billion Euros, or 36 percent if EU and Korea engages in a Partial 1 agreement. For Korea, motor vehicles account for 40 percent of the total increase in import value, making it by far the most important traded sector for Korea-EU relation. Motor vehicles are followed by electrical machinery, which accounts for 13,5 percent of the total increase in EU25 imports from Korea, textiles with 9 percent, transport with 6 percent, other machinery with a little less than 6 percent, and processed food and clothing, accounting for around 4 percent. We finally find that the measures taken with regards to increase trade in agriculture are expected to have little overall effect of the results of a potential trade agreement for Korea’s part, and a larger, but still very limited effect for the EU, primarily driven by an important increase in EU market share in processed food. Our analysis is based on the last available and most detailed data on input-output relations, trade and final demand structures for the world economy. On top we include expected changes to the trade policy environment in the basic dataset. We include the ATC phase-out and China’s accession to the WTO in our model. Moreover, changes similar to those of the Doha round will most likely give some results before a potential EU-Korean trade agreement is realised. Therefore, we implement a stylized realistic representation of the Doha-round in our baseline. In addition, we also take into account that five other Korean-centered FTAs, namely with the US, Canada, China, India, Japan, ASEAN and EFTA, are expected to take place. We assume that the various Korea-centered FTAs include limited trade liberalization in agriculture, a full trade agreement in manufacturing, and a 25 percent reduction in services. All results in this study are based on this base setting. However, the results given here are in general not very sensitive to these underlying assumptions about these other FTAs, and our conclusions hold even if none of the Korean-centered FTAs are effectuated. Comparing our results with a previous study from The Korea Institute for International Economic Policy, KIEP (Kim, 2005) show similar results, at the aggregate level, and results are pointing in the same direction. However, there are differences at the more detailed sector level. Compared to the KIEP study, our study has more sectoral detail.
Economic Impact of a Potential Free Trade Agreement between the European Union and South Korea
Page 7 of 92
Chapter 1 Introduction Korea is a rich country. Korean GDP per capita has recently reached the level of Spain, and the size of the Korean economy is also about the size of Spain. Nevertheless, trade between Korea and the European Union is below its full potential. For comparison, trade between Spain and the rest of the EU is more than five times higher than trade between EU and Korea. However, bilateral trade between the EU and Korea has been growing steadily. Since 2001, bilateral trade in merchandise has increased by over 35 percent and in 2005 the volume of trade amounted to 53 billion Euros. Furthermore the Korean market is expanding; the average annual increase in GDP over the last five years has been close to five percent. Moreover, the EU and US are the largest foreign direct investors in Korea, with EU being the largest cumulative investor since 1962. The general level of protection is quite high in Korea, where average import protection for agriculture and processed foods is close to double the European (e.g. 28 and 15 % respectively) and 50 % higher in manufacturing (e.g. 5.8 vs 4.0%) .The estimates for level of protection in Korean services points to even bigger discrepancies with estimated tariff equivalents of 46% in Korea, where the corresponding figure for the EU is estimated at 17%. Until recently, Korea was committed to dealing with trade negotiations through the WTO. Now however, they have launched an offensive towards bilateral trade talks. Koreas first FTA was signed with Chile. In addition, Korea has concluded FTAs with EFTA, nine tenth of ASEAN, and are currently negotiation and or considering FTAs with a number of other important trading partners, thereof some EU competitors, namely the US, Canada, India, Mexico, and Japan. The purpose of this study is to evaluate the effect of potential measures to open trade between Korea and the EU. In so doing, we employ a computable general equilibrium model. The model follows recent development in trade theory in taking industry specific market structures and elasticities into account. Furthermore, we employ estimates on tariff equivalent for the service sector, which are obtained through econometric estimations. As Korea currently is undertaking a number of bilateral trade talks, the models baseline has been modified to take a number of potential Korean-centered free trade agreements into account. Among these are EU competitors, such as the US, Canada and EFTA, but also other important Korean trading partners, i.e. China, India, ASEAN and Japan. The rest of the study is organized as follows, Chapter 2 offers a general background to the production and trade of the EU and Korea, Chapter 3 describes the theoretical background of the model, the data used and the set up of the analysis. Readers not directly interested in trade theory, can skip ahead to the discussion of results. These are presented in Chapter 4 of the study. Concluding comments are found in Chapter 5.

Economic Impact of a Potential Free Trade Agreement between the European Union and South Korea
Page 8 of 92
Chapter 2 EUs and Koreas Production and Trade The aim of this chapter is to give an overview of the underlying patterns of production and trade for EU and Korea, with special attention given to the nature of bilateral trade. In so doing we also offer a description of current status with regards to bilateral trade negotiations and agreements for both economies. Furthermore, this chapter includes a descriptive analysis of FDI in Korea.
2.1. Bilateral Trade Agreements in Korea and the EU Until recently, Korea, which was one of the founding members of the WTO, was skeptical to participating in regional Free Trade Agreements, (FTAs) and committed to handling all negotiations with regards to trade liberalization on a multilateral level2. Recently, however, there has been a change in mind, leading to a launch of a Korean offensive with regards to trade liberalization on a bilateral level. Effective in April of 2004, Koreas first FTA was signed with Chile. Since then Korea has also concluded FTAs with EFTA (i.e. Iceland, Lichtenstein, Norway and Switzerland) and Singapore. Furthermore, Korea has signed a FTA with nine of the ten member states in ASEAN (i.e. Brunei, Cambodia, Indonesia, Laos, Malaysia, Myanmar, Philippines, and Vietnam. Thailand has not signed). As can be seen from Table 2.1. below, Korea is currently negotiating and/or considering FTAs with the US, Canada, India, Mexico and Japan3.
2 In fact in until signing their first FTA with Chile, Korea was together with Mongolia, one of the last two countries in
the world not participating in any FTAs. 3 The 2004 WTO trade report on Korea, also discusses a possible trilateral agreement between Korea, Japan and
China.
Economic Impact of a Potential Free Trade Agreement between the European Union and South Korea
Page 9 of 92
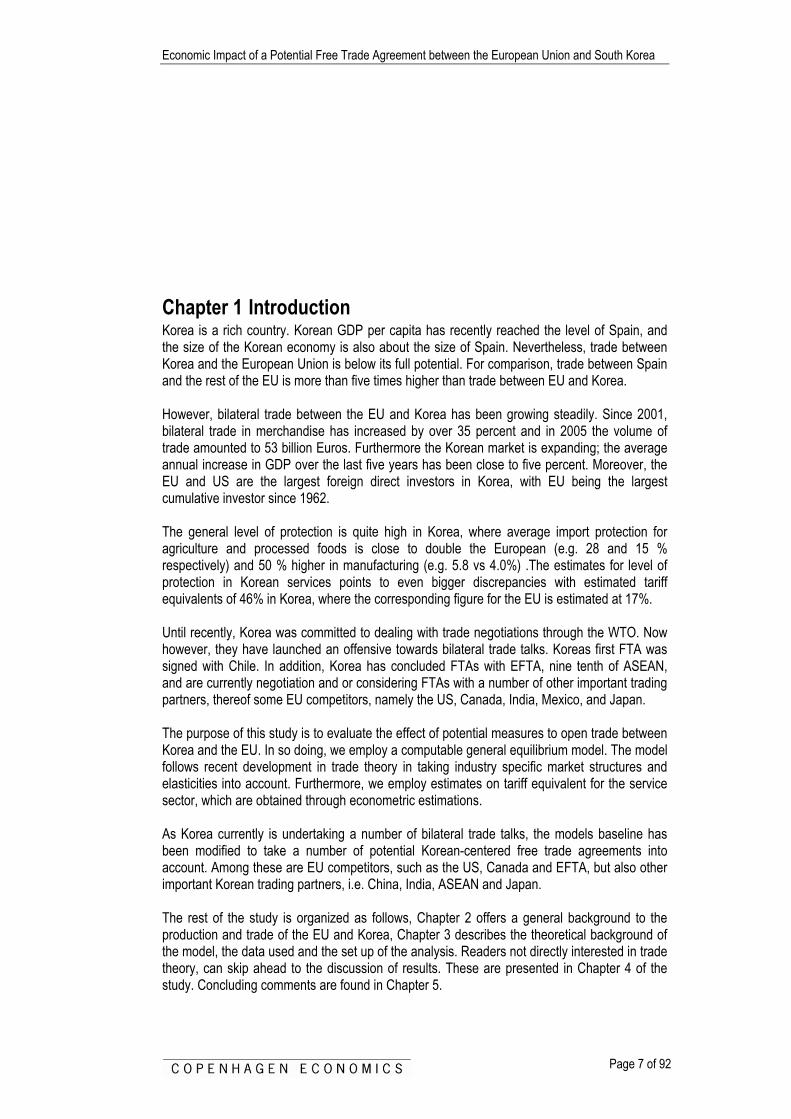
Table 2.1: Koreas bilateral trade partners Korea merchandise trade, 2005
Country/region 2005 GDP
Korean exports
to
Korean imports
from Trade
balance Total trade
FTA status1
Year of entry into
force EFTA-42 541 1 1 -1 2 A 2006 Singapore 94 6 4 2 10 A 2006 Chile 91 1 2 -1 3 A 2004 ASEAN-103 686 22 21 1 43 B Japan 3.639 19 39 -19 58 C United States 9.939 33 25 9 58 C Canada 900 3 2 1 5 C India 617 4 2 2 5 D Mexico 612 3 0 3 3 D Subtotal4 (FTA partners) 17.204 92 96 -5 188 Korea (world trade totals) 631 226 208 18 434
Source: FTA partners: Schott et al (2006) and WTO (2006), GDP: IMF World Economic Outlook Database, April 2006, Trade data: UN Comtrade database
Note: 1) A = in effect; B = signed; C = under negotiation; D = under consideration 2) EFTA-4: Iceland, Liechtenstein, Norway, and Switzerland. Due to data unavailability, figures for EFTA-4 do not
include the contribution from Liechtenstein. 3) ASEAN-10: Brunei, Cambodia, Indonesia, Laos, Malaysia, Myanmar, Philippines, Singapore, Thailand, and
Vietnam. All signed except Thailand. 4) Due to its inclusion in ASEAN-10, Singapore is counted twice in these subtotals. In the past decade there has also been a large increase in the number of bilateral FTAs on EUs part. In the past, the EU had only specific agreements with a few countries of certain economic, historical and geopolitical significance, while mainly handling trade liberalization through the means of multilateral talks. In the last decade, as a wave of bilateral trade negotiations has swept across the world economy, a number of new bilateral FTAs have been signed on EUs part. These FTAs have mostly been negotiated with developing countries, as a means of increasing the trade liberalization on the WTO level. Currently, the focus seems more to be on working out agreements on groups of countries, e.g. discussions are taking place between the EU and both MERCOSUR4 and the Gulf-Cooperation Council, GCC5. Table 2.2., below shows an overview of the EUs FTA agreements.
4 Mercosur consists of Argentine, Brazil, Uruguay and Paraguay. 5 GCC consists of Bahrain, Kuwait, Oman, Qatar, Saudi-Arabia and the United Arab Emirates.

Economic Impact of a Potential Free Trade Agreement between the European Union and South Korea
Page 10 of 92
Table 2.2: Bilateral Trade Partners of the EU Country/region Year of entry into force Egypt 2004 Chile 2003 Lebanon 2003 Croatia 2002 Jordan 2002 FYROM1 2001 South Africa 2000 Morocco 2000 Israel 2000 Mexico 2000 Tunisia 1998 Palestinian Authority 1997 Faroe Islands 1997 Bulgaria 1993 Romania 1993 Syrian Arab Republic 1977 Algeria 1976 EFTA 1973 OCTs1 1971
Source: WTO (2006) Note: The list includes those FTAs notified to the WTO. 1) FYROM = The Former Yugoslav Republic of Macedonia 2) OCT = Overseas Countries and Territories.
2.2. Trade Patterns Bilateral trade between the EU and Korea has been growing steadily. In real numbers, bilateral trade in merchandise has increased by over 35% in the last 4 years and in 2005, the volume of this trade between the two economies amounted to 53 billion Euros. As can be seen from Table 2.3 below, on the import side, Korea is the EU’s eight largest trading partner, and the fourth largest non-European trading partner. Looking at exports, Korea is the destination for close to 2 % of the EU’s exports, making it the fourteenth largest export partner world wide and ninth non-European export partner.
Economic Impact of a Potential Free Trade Agreement between the European Union and South Korea
Page 11 of 92
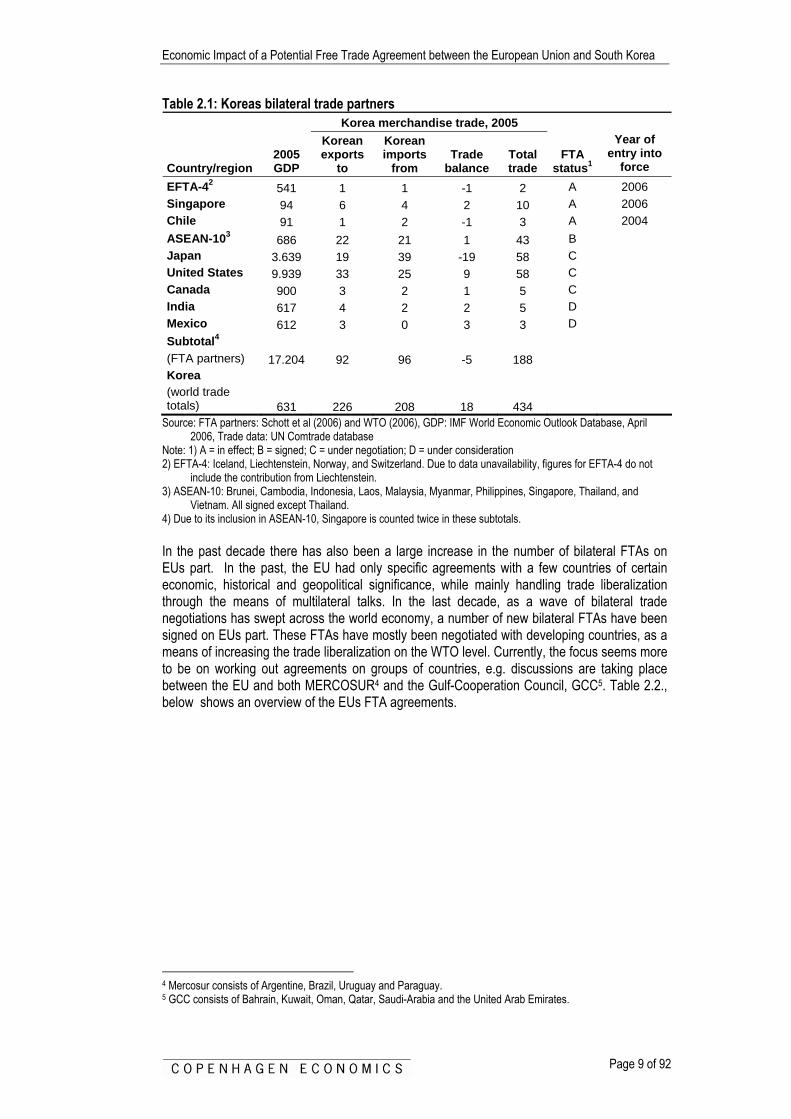
Table 2.3: EU’s major trading partners (merchandise) 2005 Imports Exports
Partner Millions of
Euro % of total Partner
Millions of Euro
% of total
1 USA 162.926 13,9 1 USA 251.291 23,7 2 China 158.040 13,5 2 Switzerland 81.913 7,7 3 Russia 106.729 9,1 3 Russia 56.398 5,3 4 Japan 73.039 6,2 4 China 51.746 4,9 5 Norway 67.127 5,7 5 Japan 43.655 4,1 6 Switzerland 66.080 5,6 6 Turkey 41.825 3,9 7 Turkey 33.451 2,8 7 Norway 33.810 3,2 8 Korea, South 33.227 2,8 8 United Arab E 25.281 2,4 9 Taiwan 23.815 2,0 9 Canada 23.672 2,2 10 Brazil 23.225 2,0 10 Romania 21.804 2,1 11 Saudi Arabia 22.060 1,9 11 India 21.101 2,0 12 Algeria 20.729 1,8 12 Australia 20.694 2,0 13 Libya 19.473 1,7 13 Hong Kong 20.438 1,9 14 India 18.904 1,6 14 Korea, South 20.134 1,9 15 Singapore 18.203 1,5 15 South Africa 18.071 1,7
Rest of the world 327.606 27,9
Rest of the world 329.178 31,0
World total 1.174.633 100,0 World total 1.061.013 100,0 Source: Eurostat, COMEXT database Note: The data corresponds to trade flows in 2005. Since the economic recession in the aftermath of the Asian financial crisis in 1997, the Korean economic development has been characterized by strong growth. By 2003, GDP per capita levels was restored to the pre-Asian financial crisis.6 In the years 2001-2005, Korean GDP grew by average 4.7% annually. A large share of this growth is attributed to export, with the EU being their fourth largest trading partner in merchandise, after, Japan and the US. As can be seen from Table 2.4 below, more than 10 percent of Korean merchandise imports in 2005 stemmed from the EU. If trade in services is included, where EU has large market shares, the EU share of total Korean imports would be even higher. On the export side, the EU is the second biggest export destination for Korean merchandise, surpassed only by the Chinese market.
6 According to the (2004) WTO report on Korea.

Economic Impact of a Potential Free Trade Agreement between the European Union and South Korea
Page 12 of 92
Table 2.4: Koreas Major trading partners in merchandise, 2005 Imports Exports
Partner Millions of
Euro % of total Partner
Millions of Euro
% of total
1 Japan 38.526 18,5 1 China 49.280 21,8 2 China 30.765 14,8 2 EU 34.753 15,4 3 United States 24.350 11,7 3 United States 32.907 14,5 4 EU 21.731 10,5 4 Japan 19.128 8,4 5 Saudi Arabia 12.824 6,2 5 Hong Kong 12.362 5,5 6 United Arab E 7.976 3,8 6 Taiwan 8.645 3,8 7 Australia 7.849 3,8 7 Singapore 5.898 2,6 8 Indonesia 6.511 3,1 8 Indonesia 4.020 1,8 9 Taiwan 6.408 3,1 9 Malaysia 3.670 1,6 10 Malaysia 4.784 2,3 10 India 3.662 1,6
Rest of the world 46.222 22,2
Rest of the world 52.074 23,0
World total 207.945 100,0 World total 226.398 100,0 Source: KITA (global.kita.org) and Korea Ministry of Finance and Economy, Major Economic Indicators, May 18,
2006. Note: The data corresponds to trade flows in 2005.
Composition of Bilateral Merchandise Trade Next, we turn our attention to the contents of merchandise trade, divided by sectors, as presented in Table 2.5 below. As can be seen from the Table, total trade between EU and Korea has been steadily increasing, as has the EU trade deficit. EU export to Korea, which in 2001 amounted to a little more than fifteen thousand Euros had increased by more than 25 % in 2005. The corresponding figures for EU imports from Korea, shows an overall increase of close to 45 %. Meanwhile, EUs trade deficit has increased from 7 billion Euros to 13 billion.

Page 13 of 92
Table 2.5: EU-Korea Merchandise trade 2001 2002 2003 2004 2005
Category Millions of Euro
Percent of total
Millions of Euro
Percent of total
Millions of Euro
Percent of total
Millions of Euro
Percent of total
Millions of Euro
Percent of total
EU exports to Korea Total 15.791 100,0 17.595 100,0 16.370 100,0 17.843 100,0 20.134 100,0 Food and live animals 436 2,8 488 2,8 389 2,4 601 3,4 631 3,1 Beverages and tobacco 426 2,7 545 3,1 394 2,4 276 1,5 321 1,6 Crude materials 330 2,1 475 2,7 346 2,1 421 2,4 483 2,4 Mineral fuels etc 12 0,1 29 0,2 70 0,4 82 0,5 30 0,1 Chemicals 2.539 16,1 2.747 15,6 2.595 15,9 2.896 16,2 3.261 16,2 Basic manufactures 2.047 13,0 2.173 12,4 2.083 12,7 2.240 12,6 2.643 13,1 Machines, transport equip. 7.258 46,0 7.972 45,3 7.464 45,6 8.285 46,4 8.747 43,4 Misc. Manufactured goods 2.171 13,7 2.554 14,5 2.516 15,4 2.548 14,3 3.394 16,9 Goods nec. 296 1,9 280 1,6 221 1,3 163 0,9 328 1,6
EU imports from Korea Total 23.044 100,0 24.276 100,0 25.718 100,0 30.275 100,0 33.227 100,0 Food and live animals 125 0,5 9 0,0 113 0,4 89 0,3 83 0,3 Beverages and tobacco 6 0,0 9 0,0 9 0,0 18 0,1 8 0,0 Crude materials 259 1,1 247 1,0 207 0,8 251 0,8 245 0,7 Mineral fuels etc 13 0,1 34 0,1 47 0,2 49 0,2 363 1,1 Chemicals 998 4,3 1.035 4,3 993 3,9 1.020 3,4 1.127 3,4 Basic manufactures 2.608 11,3 2.409 9,9 2.257 8,8 2.330 7,7 2.475 7,4 Machines, transport equip. 16.980 73,7 18.605 76,6 20.361 79,2 24.634 81,4 27.077 81,5 Misc. Manufactured goods 1.892 8,2 1.723 7,1 1.604 6,2 1.776 5,9 1.702 5,1 Goods nec. 89 0,4 77 0,3 110 0,4 103 0,3 134 0,4
EU's trade balance -7.253 -6.681 -9.348 -12.432 -13.092 Source: Eurostat, COMEXT database Note: "Animal and vegetable oils and fats" are included in "Food and live animals".
A very small share of the bilateral trade between Korea and the EU, takes place within the agricultural sector. The majority of trade with merchandise consists of trade with manufactured goods. The merchandise exports from the EU to Korea, consists mainly of “Machines and Transport Equipment”, “Chemicals” and “Miscellaneous Manufactured Goods”. In terms of goods, Korea’s import, as can be seen from table 2.6 below and in the appendix, consists mainly of power generating machinery, ITA equipment7 and road vehicles. EUs imports from Korea are dominated by goods in the “Machines and Transport Equipment Sector”. In 2005 over 80 % of all imports from Korea originated from this sector. Worth noticing is that exports in this sector has grown more important over the years. In 2001 this sector accounted for three quarters of Korean exports to the EU. In 2005, the corresponding figure was more than 80%, implying an increase of exports of close to 60% in this sector in the last four years. In terms of goods, EU’s main imports comprised of ITA equipment, telecommunications equipment and road vehicles.
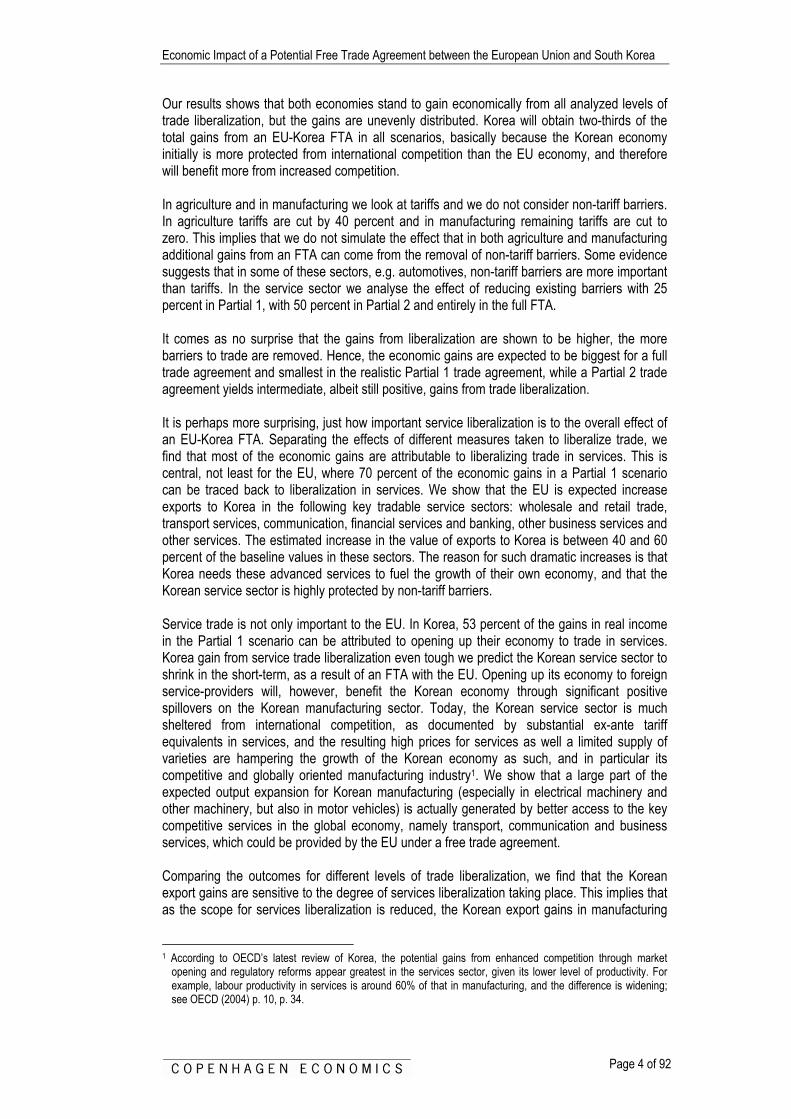
Trade in services The service sector in the Korean economy is expanding. In 2003, production in the service sector accounted for approximately 70 % of GDP. The manufacturing still accounted for a little over 25 %8, albeit its share of total production is descending. The corresponding figures for the EU depicts that approximately three quarters of GDP is attributable to services while a little less than 20 % of production derives from manufacturing. Although a large share of production is attributable to the service sector, this is not mirrored in the amount of bilateral trade taking place. This can partly be attributable to the nature of the non-tradable services9 and partly to the difficulty in obtaining adequate data on trade in services actually taking place10. However, a large share of this lack of trade is believed to originate from the high levels of barriers to trade in services. While the world economy in general exhibits this pattern, i.e. much less trade in services taking place than could be expected, this is particularly evident in the case of bilateral trade between the EU and Korea. Figure 2.1 below gives an indication of this relatively low level of services trade between EU and Korea. Although the Korean and European economies are similar in the allocation of production among sectors, Korea, which accounts for 2.4 percent of European trade in merchandise, is only attributable for 1.3 percent of EU’s trade in services.
7 ITA is a WTO abbreviation for Information Technology Agreement, which contains IT-equipment, e.g. computers,
telecom equipment and semiconductors 8 26.6% to be exact, according to the latest WTO Trade Policy Review of Korea. 9 e.g. it is difficult to export a haircut or a visit to a restaurant. 10 Since these commodities don’t actually go through customs, there is no readily made data on trade flows in this
sector.

Economic Impact of a Potential Free Trade Agreement between the European Union and South Korea
Page 15 of 92
Figure 2.1 EUs major trading partners in services, 2004
Source: Eurostat (2006) Note: The graph shows shares of imports+exports for the EU25. The data corresponds to trade flows in 2004.
2.3. Trading Costs In order to understand the general landscape in which discussions of a possible FTA is to take place, we now turn our attention to describing existing levels of import protection across sectors for trade between Korea and EU25. We point out that there are difficulties in obtaining measures of import protection in services. While the figures for the impediments to trade in merchandise in Table 2.6 below depicts tariffs, the corresponding figures for the service sector comes from econometric, gravity type estimations (more extensive information about these calculations is available in the Technical Annex).
Korea1,3%
United States32,4%
Switzerland11,4%Japan
4,3%
Other47,3%
Norway3,2%
Economic Impact of a Potential Free Trade Agreement between the European Union and South Korea
Page 16 of 92
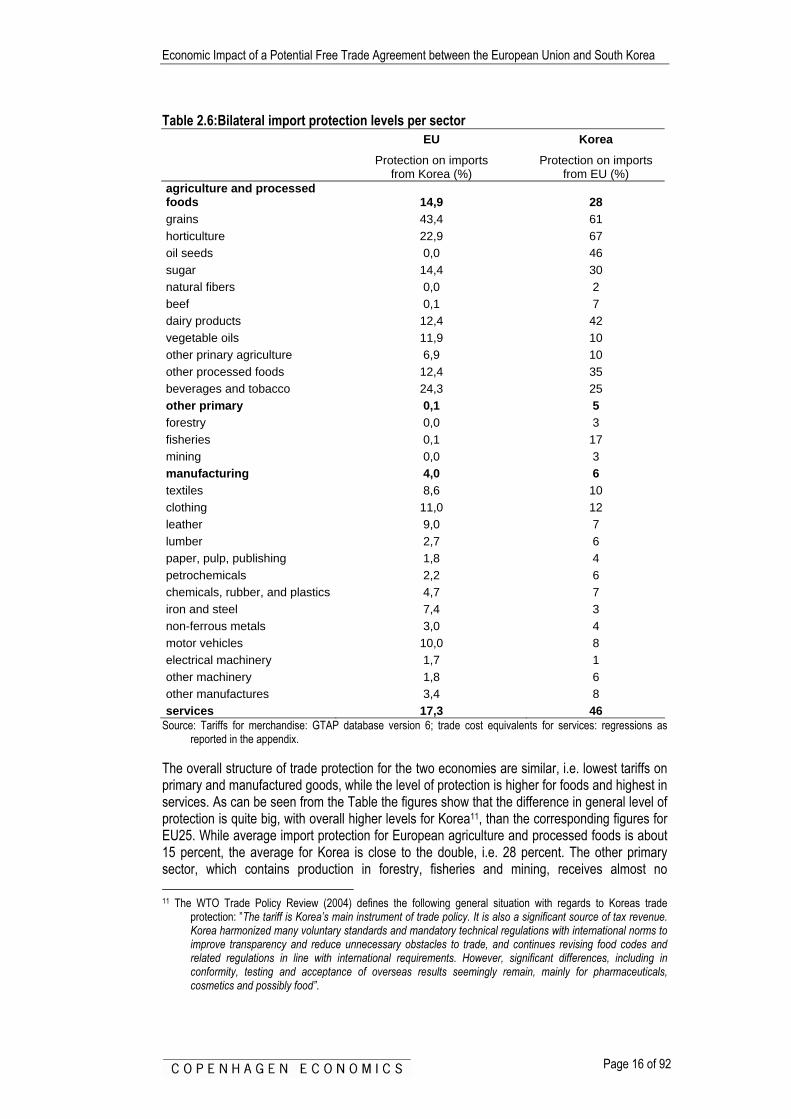
Table 2.6:Bilateral import protection levels per sector EU Korea
Protection on imports from Korea (%)
Protection on imports from EU (%)
agriculture and processed foods 14,9 28 grains 43,4 61 horticulture 22,9 67 oil seeds 0,0 46 sugar 14,4 30 natural fibers 0,0 2 beef 0,1 7 dairy products 12,4 42 vegetable oils 11,9 10 other prinary agriculture 6,9 10 other processed foods 12,4 35 beverages and tobacco 24,3 25 other primary 0,1 5 forestry 0,0 3 fisheries 0,1 17 mining 0,0 3 manufacturing 4,0 6 textiles 8,6 10 clothing 11,0 12 leather 9,0 7 lumber 2,7 6 paper, pulp, publishing 1,8 4 petrochemicals 2,2 6 chemicals, rubber, and plastics 4,7 7 iron and steel 7,4 3 non-ferrous metals 3,0 4 motor vehicles 10,0 8 electrical machinery 1,7 1 other machinery 1,8 6 other manufactures 3,4 8 services 17,3 46
Source: Tariffs for merchandise: GTAP database version 6; trade cost equivalents for services: regressions as reported in the appendix.
The overall structure of trade protection for the two economies are similar, i.e. lowest tariffs on primary and manufactured goods, while the level of protection is higher for foods and highest in services. As can be seen from the Table the figures show that the difference in general level of protection is quite big, with overall higher levels for Korea11, than the corresponding figures for EU25. While average import protection for European agriculture and processed foods is about 15 percent, the average for Korea is close to the double, i.e. 28 percent. The other primary sector, which contains production in forestry, fisheries and mining, receives almost no 11 The WTO Trade Policy Review (2004) defines the following general situation with regards to Koreas trade
protection: ”The tariff is Korea’s main instrument of trade policy. It is also a significant source of tax revenue. Korea harmonized many voluntary standards and mandatory technical regulations with international norms to improve transparency and reduce unnecessary obstacles to trade, and continues revising food codes and related regulations in line with international requirements. However, significant differences, including in conformity, testing and acceptance of overseas results seemingly remain, mainly for pharmaceuticals, cosmetics and possibly food”.
Economic Impact of a Potential Free Trade Agreement between the European Union and South Korea
Page 17 of 92
protection in the EU, while the average level of the Korean sector is 5 percent. For manufacturing, the figures are more similar, although still higher for Korea, i.e. 4.0 vs. 5.8 percent. Not surprisingly, and closely mirrored in the low levels of trade taking place in the service sector, our estimates of tariff equivalents in the service sector reveals much higher levels of protection. The average level of protection for this sector in Korea is estimated at an equivalent of a 46 percent tariff – or almost the double of the tariffs in agriculture and food. The corresponding figure for trade in services coming into the European Union was estimated at a little over a third of that value, i.e. a tariff equivalent of 17 percent. Looking at these figures on a more disaggregate level (see Appendix for import protection in effect on industry level), there are some exceptions to the rule of Korean levels of protection being higher than the European, mainly in the manufacturing sector. In the manufacturing sector, the EU levels of protection are relatively highest in iron and steel (7.4% compared to 3.1%), motor vehicles (10% and 8%), leather (9% and 7%) and electrical machinery (1.7% and 1.2%, respectively). We have also analyzed Korea’s market access to other markets than the EU. Below we analyze the current openness for Korean exports to other main markets than the EU. In a second step, we include the expected effect of expected future Korean-centered FTA’s in our analysis, such that the effect of an EU-Korea FTA is evaluated in the most likely setting, where Korea has completed FTAs with other partners. First, however, we turn to the current market access for Korean exporters.
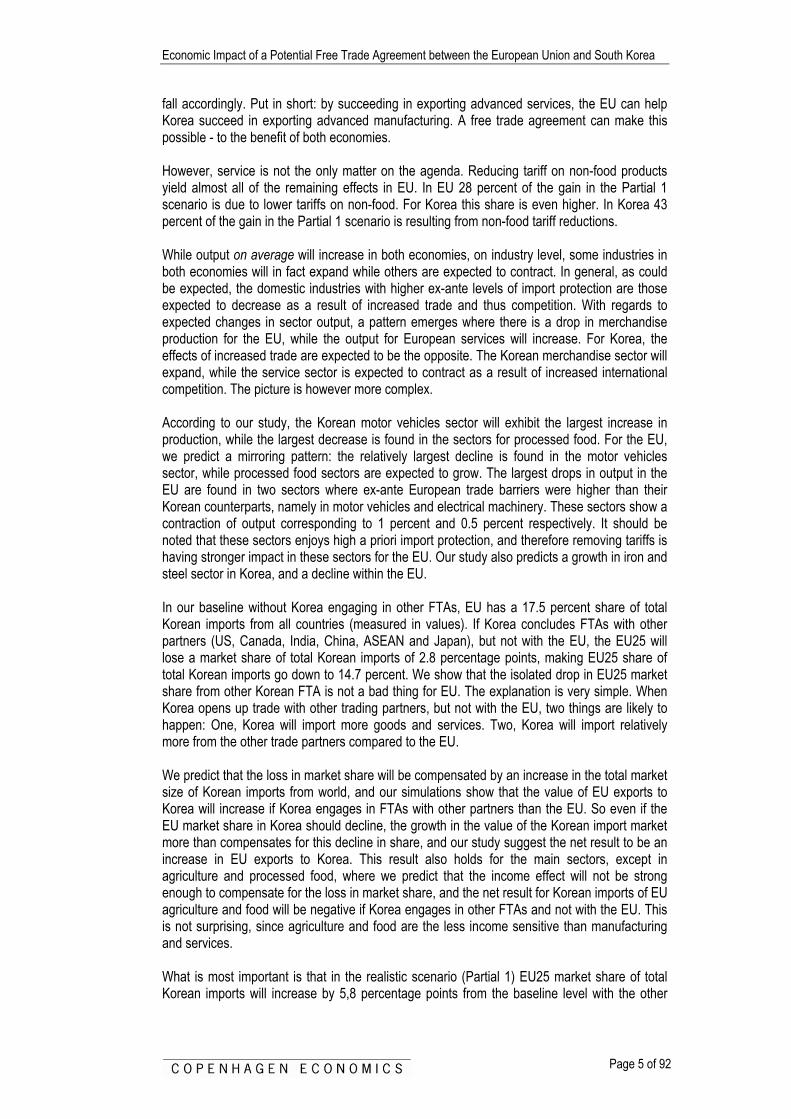
Korea faces few barriers on major goods markets in Japan and US Korean exporters of goods face barriers in terms of duties on many of their key foreign markets -on some more than others. China, for example, collects one third of the total duties paid on Korean exports, even tough China is only the sixth biggest Korean export market for goods (with a share of 10 percent of total Korean goods exports). The largest Korean export market for goods, Japan, which accounts for 20 percent of total Korean goods exports, only collects five percent of the total duties paid on Korean exports worldwide. There are course many reasons for these differences (composition of trade, specific tariff lines etc.), but the bottom-line is that Korean has fairly good overall access to the Japanese market in goods, and fairly poor overall access to the Chinese markets. Following this argument, also the US goods market is quite open for Korean exports, whereas EU and ASEAN have an average openness. Other markets like India, Latin America and North Africa & Middle East are relatively closed by this aggregate measure, cf. Figure 2.2.

Economic Impact of a Potential Free Trade Agreement between the European Union and South Korea
Page 18 of 92
Figure 2.2 Goods trade - Barriers faced by Korean exporters on foreign markets
0%
5%
10%
15%
20%
25%
30%
35%
Japa
n
Chi
na
Uni
ted
Sta
tes
EU
25
AS
EA
N
Indi
a
Latin
Am
eric
a
Nor
th A
frica
& M
iddl
eE
ast
Oth
er
Shar
e of
tota
l Kor
ean
expo
rt/d
utie
sShare of Korean exports
Share of trade taxescollected on Korea exportsby its partners
Source: Francois and Copenhagen Economics, own calculations. Note: The diagram shows the distribution of duties collected and the distribution of trade. Data are from WITS, at the
fully disaggregated level. In order to be comparable with the modelling base year, the data here are from 2001.
The above picture is confirmed by the average effective tariffs on goods. The average tariffs across all goods (weighted by trade value) for Korean exports to the EU is 4,4 percent. For the US and Japan the same number is around 1 percent. Again China and India have the highest level of goods protection for Korean exports with effective average tariffs of 14 and 21 percent respectively, cf. Table 2.7. Table 2.7 Duties Collected on Korean Goods
exports,
millions $
duties collected, millions $
duties collected,
percent
Share of Korean exports
Share of trade taxes collected on Korea exports by
its partners Japan 26.348 297 1,13 21% 5% China 13.747 1.924 14,00 11% 32% United States 23.725 382 1,61 18% 6% EU25 15.083 665 4,41 12% 11% ASEAN 13.740 606 4,41 11% 10% India 861 233 21,17 1% 4% Latin America 3.354 299 8,92 3% 5% North Africa & Middle East 16.552 1.156 6,99 13% 19% Other 15.002 501 3,34 12% 8%
Source: Francois and Copenhagen Economics, own calculations. Note: The table shows the duties collected on Korean goods exports and the distribution of trade. Data are from
WITS, at the fully disaggregated level. In order to be comparable with the modelling base year, the data here are from 2001.

Economic Impact of a Potential Free Trade Agreement between the European Union and South Korea
Page 19 of 92
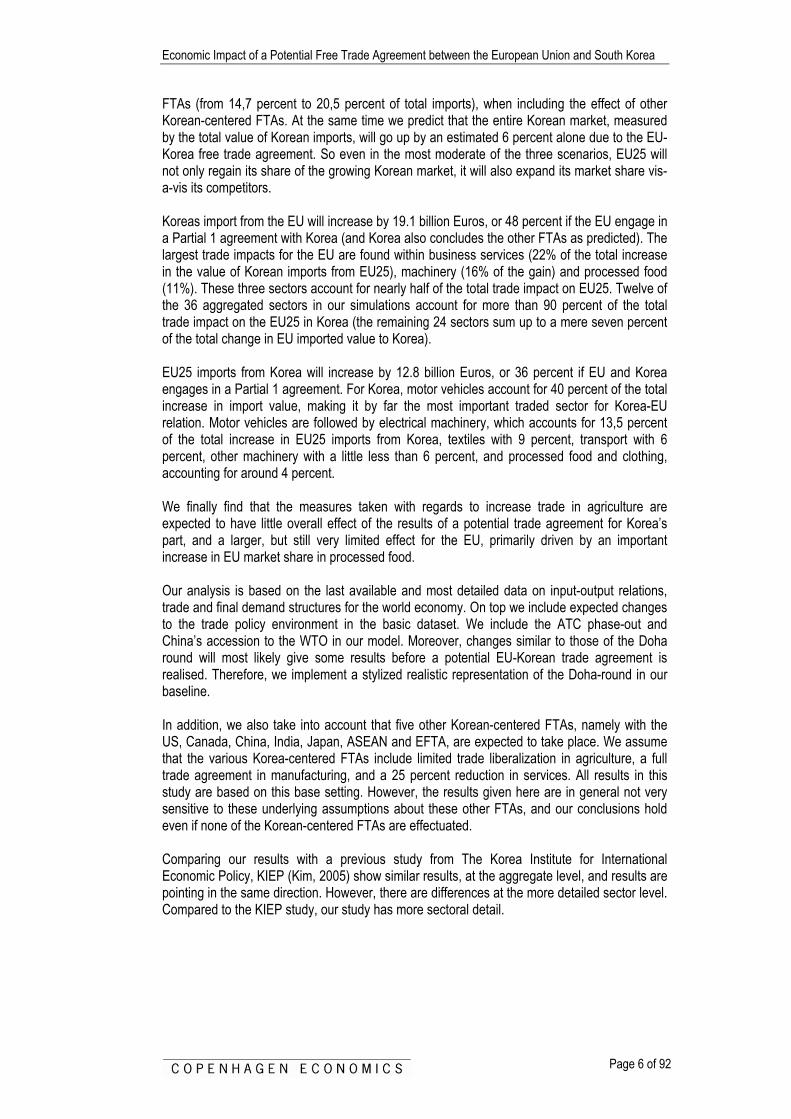
Figure 2.3 and Table 2.8 below depict the corresponding data on exports from the EU. As was the case for Korea, European exporters face least protection when exporting to the US and Japan. Here the average tariffs amount to less than 5%. Figure 2.3 Goods trade - Barriers faced by EU25 exporters on foreign markets
0%
5%
10%
15%
20%
25%
30%
35%
40%Ja
pan
Chi
na
Uni
ted
Sta
tes
Kor
ea
AS
EA
N
Indi
a
Latin
Am
eric
a
Nor
th A
frica
&M
iddl
e E
ast
Oth
er
Shar
e of
tota
l Kor
ean
expo
rt/du
ties
Share of EU25 exports
Share of trade taxescollected on EU25 exportsby its partners
Source: Francois and Copenhagen Economics, own calculations. Note: The diagram shows the distribution of duties collected and the distribution of trade. Data are from WITS, at the
fully disaggregated level. In order to be comparable with the modelling base year, the data here are from 2001.
Average tariffs across all goods (weighted by trade value) for EU trade with Korea is a little over 7%. The Latin American countries, together with China and especially India, exhibit the highest levels of protection for European exports, with tariff levels of about 15% Table 2.8 Duties Collected on EU25 Goods
exports,
millions $
duties collected, millions $
duties collected,
percentShare of
EU25 exports
Share of trade taxes collected on
EU25 exports by its partners
Japan 42.328 1.953 4,61 5,5% 4,1%China 38.043 5.280 13,88 4,9% 11,1%United States 211.997 4.083 1,93 27,6% 8,6%Korea 15.083 1.070 7,09 2,0% 2,2%ASEAN 37.601 1.895 5,04 4,9% 4,0%India 11.331 3.459 16,48 1,5% 7,3%Latin America 60.399 7.365 12,19 7,9% 15,5%North Africa & Middle East 85.894 8.317 9,68 11,2% 17,5%Other 265.887 14.146 2,71 34,6% 29,7%
Source: Francois and Copenhagen Economics, own calculations. Note: The table shows the duties collected on Korean goods exports and the distribution of trade. Data are from
WITS, at the fully disaggregated level. In order to be comparable with the modelling base year, the data here are from 2001.
Economic Impact of a Potential Free Trade Agreement between the European Union and South Korea
Page 20 of 92
This part of the analysis indicates that a free trade agreement between Korea and the EU, which comprises a reduction in the effective average goods market access for Korean exports on the European market could lead to substantial increases in Korean exports of goods to the EU. At the same time the analysis also indicates that, for Korea, there might be larger potential for further trade agreements with the EU than with Japan or the US, simply because tariffs on those markets are already quite low.
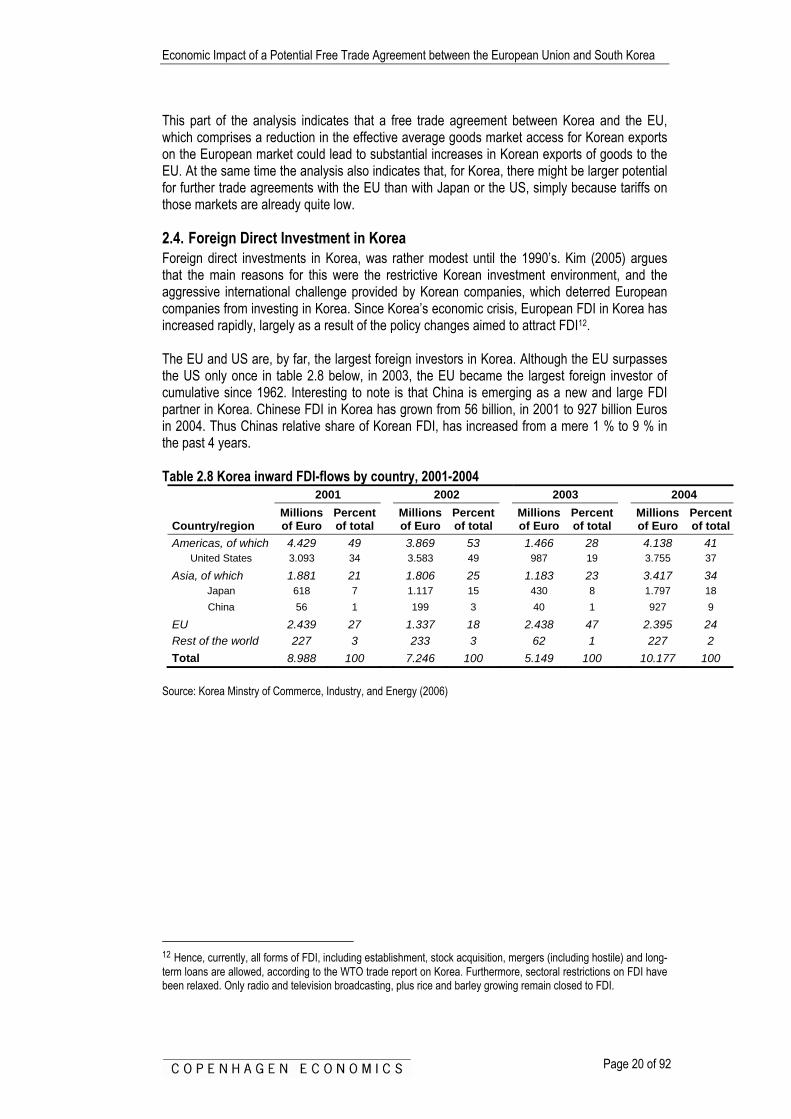
2.4. Foreign Direct Investment in Korea Foreign direct investments in Korea, was rather modest until the 1990’s. Kim (2005) argues that the main reasons for this were the restrictive Korean investment environment, and the aggressive international challenge provided by Korean companies, which deterred European companies from investing in Korea. Since Korea’s economic crisis, European FDI in Korea has increased rapidly, largely as a result of the policy changes aimed to attract FDI12. The EU and US are, by far, the largest foreign investors in Korea. Although the EU surpasses the US only once in table 2.8 below, in 2003, the EU became the largest foreign investor of cumulative since 1962. Interesting to note is that China is emerging as a new and large FDI partner in Korea. Chinese FDI in Korea has grown from 56 billion, in 2001 to 927 billion Euros in 2004. Thus Chinas relative share of Korean FDI, has increased from a mere 1 % to 9 % in the past 4 years. Table 2.8 Korea inward FDI-flows by country, 2001-2004
2001 2002 2003 2004
Country/region Millions of Euro
Percent of total
Millions of Euro
Percent of total
Millions of Euro
Percent of total
Millions of Euro
Percent of total
Americas, of which 4.429 49 3.869 53 1.466 28 4.138 41 United States 3.093 34 3.583 49 987 19 3.755 37
Asia, of which 1.881 21 1.806 25 1.183 23 3.417 34 Japan 618 7 1.117 15 430 8 1.797 18 China 56 1 199 3 40 1 927 9
EU 2.439 27 1.337 18 2.438 47 2.395 24 Rest of the world 227 3 233 3 62 1 227 2 Total 8.988 100 7.246 100 5.149 100 10.177 100
Source: Korea Minstry of Commerce, Industry, and Energy (2006)
12 Hence, currently, all forms of FDI, including establishment, stock acquisition, mergers (including hostile) and long-term loans are allowed, according to the WTO trade report on Korea. Furthermore, sectoral restrictions on FDI have been relaxed. Only radio and television broadcasting, plus rice and barley growing remain closed to FDI.

Chapter 3 The Model and the Data In this chapter, we aim to describe the model and the data on which we base our analysis. Also we discuss the general landscape, with regards to existing impediments to trade between Korea and the EU. Furthermore, we describe the general outline of the analysis defining underlying assumptions as well as the employed scenarios.
3.1. The CGE model The methodology used in this study is comparable with recent policy analyses of the World Bank, the IMF and the OECD, incorporating a similar quantitative modeling framework. This section provides a brief overview of the global computable general equilibrium (CGE) model used in this study. The CGE-model is based on an input-output structure (which stem from national input-output tables) which explicitly links industries through chain of value added in production, from primary goods, through stages of intermediate processing, to the final assembling of goods and services for consumption. This inter-sectoral linkage works both through direct linkages, e.g. the use of steel in the production of transport equipment, and indirect, i.e. via intermediate use in other sectors. These linkages are captured in the model by the usage of firms’ use of factors and intermediate inputs. An overview of the model is provided in Box 3.1 below, while a more detailed description is available in the Technical Annex Recent developments in international trade and economic geography focuses on the importance of scale economies (e.g. starting from Krugman (1979), (1980), Helpman and Krugman (1989) and onwards) and imperfect competition in determining the patterns of production and trade. In order to incorporate this development into the analysis, our model is expanded to take differences in underlying market structures across sectors into account. Furthermore, in order to further increase the quality of the analysis, we employ estimates on elasticities as reported in the recent paper by Antweiler and Trefler (2002). Impediments to trade in services are not as clearly visible as is the case with tariffs for trade in merchandise. Rather, trade barriers in the service sector often entail prohibitions, quantitative restrictions and government regulations, which are designed to limit the market access of foreign suppliers. These are not easy to quantify. In order to remedy this lack of data, we follow Francois (2003) in estimating tariff equivalents for the service sector through the use of a gravity type equation. These estimates are then incorporated into the analysis. Further information about these estimates is available in the Technical Annex.

Economic Impact of a Potential Free Trade Agreement between the European Union and South Korea
Page 22 of 92
Box 3.1: Overview of the model The model employed in this study is a global, multi-regional, multi-sectoral general equilibrium model. In each region, there is a single representative household, which allocates its expenditures over personal consumption today and savings (future consumption). The representative household owns all production factors and receives income by selling them to firms. It also receives income from tariff revenues. Part of the income is distributed as subsidy payments to some sectors. On the production side, firms use domestic production factors (capital, labour and land) and interme-diate inputs from domestic and foreign sources to produce outputs in the most cost-efficient way that technology allows. Factor markets are competitive, and labour and capital are mobile between sectors but not between regions. Perfect competition is assumed in 16 of our 36 sectors. In these sectors, products from different regions are assumed to be imperfect substitutes in accordance with the so-called ‘Armington’ assumption. In the remaining sectors, we assume imperfect competition. The approach followed involves monopolistic competition. Monopolistic competition entails scale economies that are internal to each firm, depending on its own production level. In particular, based on estimates of price-cost mark-ups, we model the sector as being characterized by Chamberlinian large-group monopolistic competition. An important property of the monopolistic competition model is that increased specialization at intermediate stages of production yields returns due to specialization, where the sector as a whole becomes more productive the broader the range of specialized inputs. These gains spill over through two-way trade in specialized intermediate goods. With these spill-over effects, trade liberalization can lead to global scale effects related to specialization. With international scale economies, regional welfare effects depend on a mix of efficiency effects, global scale effects, and terms-of-trade effects. Similar gains follow from consumer goods specialization. Prices on goods and factors adjust until all markets are simultaneously in (general) equilibrium. This means that we solve for an equilibrium in which all markets clear. While we model changes in gross trade flows, we do not model changes in net international capital flows. Rather our capital market closure involves fixed net capital inflows and outflows. A full description of the model is provided in the technical appendix.
3.2. Model data The GTAP database, version 6.213, provides the majority of the data for the empirical implementation of the model. The database is the best and most updated source for internally consistent data on production, consumption and international trade by country and sector. For more information, please refer to Dimaranan and McDougall (2006). The GTAP version 6.2 dataset is benchmarked to 2001, and includes detailed information on input-output, trade and final demand structures for the whole world this year. However, there are some important changes to the trade policy environment that have happened since then, that we wish to include in the basic dataset. Therefore, before conducting any policy experiments, we first run a ‘pre-experiment’, where we include the ATC phase-out and China’s accession to the WTO. Moreover, the Doha round will most likely give results before a potential EU-Korean trade agreement is realised. Therefore, we implement the result from a successful Doha-round as well in our baseline. Hence, the dataset we work with for actual experiments is a representation of a notional world economy in 2001 where we have realised many of the trade policy reforms that have taken place since then, and is likely to happen soon in the future.
13 Available in June 2006.
Economic Impact of a Potential Free Trade Agreement between the European Union and South Korea
Page 23 of 92
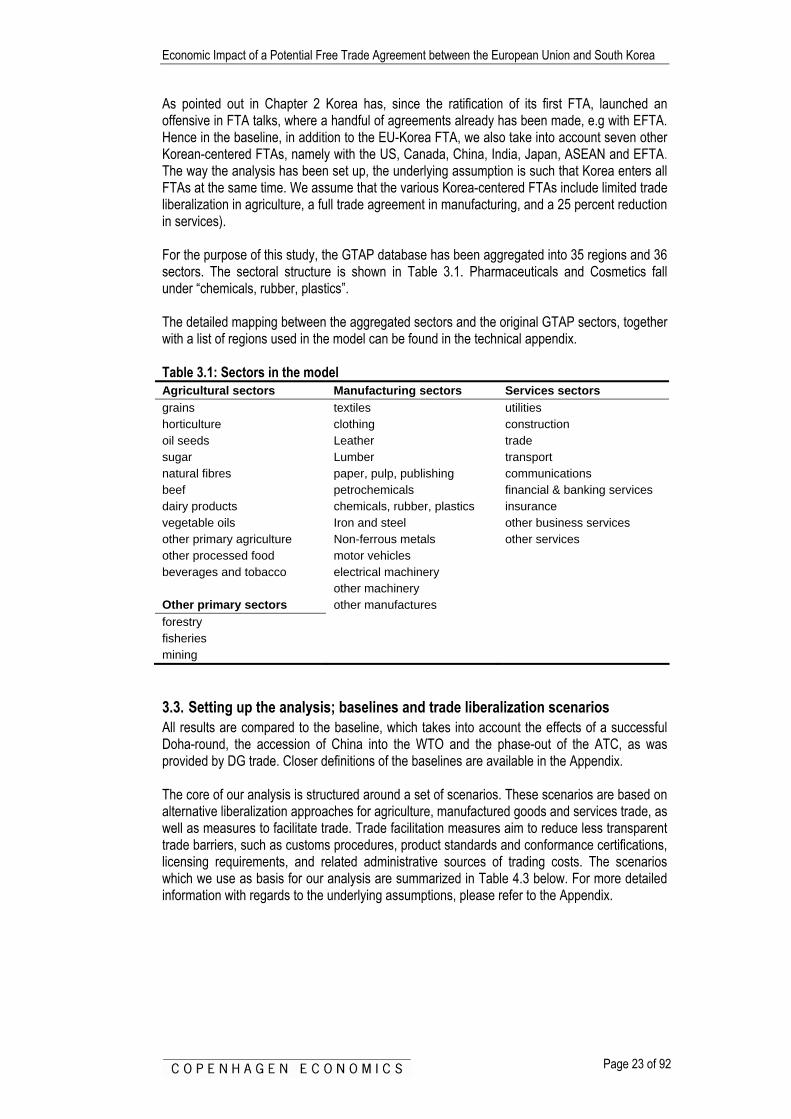
As pointed out in Chapter 2 Korea has, since the ratification of its first FTA, launched an offensive in FTA talks, where a handful of agreements already has been made, e.g with EFTA. Hence in the baseline, in addition to the EU-Korea FTA, we also take into account seven other Korean-centered FTAs, namely with the US, Canada, China, India, Japan, ASEAN and EFTA. The way the analysis has been set up, the underlying assumption is such that Korea enters all FTAs at the same time. We assume that the various Korea-centered FTAs include limited trade liberalization in agriculture, a full trade agreement in manufacturing, and a 25 percent reduction in services). For the purpose of this study, the GTAP database has been aggregated into 35 regions and 36 sectors. The sectoral structure is shown in Table 3.1. Pharmaceuticals and Cosmetics fall under “chemicals, rubber, plastics”. The detailed mapping between the aggregated sectors and the original GTAP sectors, together with a list of regions used in the model can be found in the technical appendix. Table 3.1: Sectors in the model Agricultural sectors Manufacturing sectors Services sectors grains textiles utilities horticulture clothing construction oil seeds Leather trade sugar Lumber transport natural fibres paper, pulp, publishing communications beef petrochemicals financial & banking services dairy products chemicals, rubber, plastics insurance vegetable oils Iron and steel other business services other primary agriculture Non-ferrous metals other services other processed food motor vehicles beverages and tobacco electrical machinery other machinery Other primary sectors other manufactures forestry fisheries mining
3.3. Setting up the analysis; baselines and trade liberalization scenarios All results are compared to the baseline, which takes into account the effects of a successful Doha-round, the accession of China into the WTO and the phase-out of the ATC, as was provided by DG trade. Closer definitions of the baselines are available in the Appendix. The core of our analysis is structured around a set of scenarios. These scenarios are based on alternative liberalization approaches for agriculture, manufactured goods and services trade, as well as measures to facilitate trade. Trade facilitation measures aim to reduce less transparent trade barriers, such as customs procedures, product standards and conformance certifications, licensing requirements, and related administrative sources of trading costs. The scenarios which we use as basis for our analysis are summarized in Table 4.3 below. For more detailed information with regards to the underlying assumptions, please refer to the Appendix.
Economic Impact of a Potential Free Trade Agreement between the European Union and South Korea
Page 24 of 92
Table 3.2: Scenarios Assumptions Nr Description Food Non-food Services Trade facilitation 1 Partial 1 trade
agreement 40% tariff reductions
Full bilateral tariff reductions
25% services reduction
None
2 Partial 2 trade
agreement 40% tariff reductions
Full bilateral tariff reductions
50% services reduction
None
3 Full FTA Full bilateral
tariff reductions Full bilateral tariff reductions
Full services liberalisation
1% of value of trade
Source: Copenhagen Economics The Full FTA agreement implies full bilateral tariff reductions for merchandise goods, full liberalization of trade in services and trade facilitation measures corresponding to 1 percent of value of trade. From a policy point of view, this scenario can be seen as quite radical in its assumptions. Nonetheless it is very useful in providing a upper benchmark for the effect of potential measures to liberalize trade. The partial trade agreements imply more realistic outcomes of the trade negotiations than the Full FTA scenario described above. With regards to the outcome of the bilateral trade agreements on non-food, the assumption is the same as in the full FTA, namely full bilateral tariff reduction. With regards to the outcome of trade negotiations in the food sector, a 40 % reduction in tariffs is assumed to take place14. No trade facilitation is assumed to take place in the partial scenarios. . The two partial scenarios differ with respect to assumptions regarding liberalization in the service sector. The Partial 2 trade agreement assumes a 50 percent reduction of barriers to trade in services. The most restricted scenario – Partial 1 trade agreement - assumes a 25 percent reduction in tariff equivalents.
14 The sectors with the highest tariff rates in agriculture and processed foods, which were found in grains,
horticulture, oil seeds, sugar, dairy and vegetable oils, were shown to account for less than 5% of both tariff lines and bilateral trade. This implies that these sensitive sectors can be excluded from a FTA, with the agreement still complying with WTO-rules, i.e. still covers 95% of tariff lines and bilateral trade.

Economic Impact of a Potential Free Trade Agreement between the European Union and South Korea
Page 25 of 92
Chapter 4 Results We next turn to the results of the experiments as outlined in Chapter 3. In this chapter, we describe and discuss the main results of the analysis, while more detailed results can be found in the appendix.
4.1. Real Income Effects Trade liberalization has positive net income effects on both economies, in all our scenarios. As could be expected, the gains from liberalization are higher the more trade barriers are removed, i.e. economic gains in the two partial scenarios are smaller than for a full free trade agreement. However, around 26 percent of the total potential can be realised with a Partial 1 agreement, and 46 percent of the full FTA potential (excluding trade facilitation) is expected in a Partial 2 agreement, cf.Figure 4.1. Still for both economies a full FTA would provide the largest economic gains, and both economies will be better off implementing a full FTA than any of the partial scenarios. For other reasons, a partial agreement might be more realistic, but from an economist point of view, a full FTA is the most attractive scenario. Figure 4.1 Gain in real income as percentage of full FTA potential
2% 0% 2% 0%
6% 12% 6% 12%
20% 13%
42%32%
0%
10%
20%
30%
40%
50%
60%
EU Korea EU Korea
Partial 1 Partial 2
Perc
ent o
f ful
l FTA
pot
entia
l
Reduction of barriers to service trade (25% and 50% respectively)A full reduction of tariffs in manufacturingA 40% reduction of tariffs in agriculture and food
28%25%
50%
44%Joint percentage of full potential:
26%
Joint percentage of full potential: 46%
Source: Francois and Copenhagen Economics, model simulations

Economic Impact of a Potential Free Trade Agreement between the European Union and South Korea
Page 26 of 92
In both our partial scenarios the EU will reach a larger percentage of its full FTA potential than will Korea. In the Partial 2 scenario, the EU is expected to obtain 50 percent of the gains in real income it would gain in a full FTA. Korea will gain 44 percent of its full FTA potential in Partial 2. For our Partial 1 scenario the corresponding percentages are 28 percent and 25 percent for EU and Korea respectively. In monetary terms, Korea will obtain two-thirds of the joint gains from any of the analyzed FTAs. Compared to Korea’s GDP the gains in relative terms are much more important for Korea, than for the EU, cf. Table 4.1. Table 4.1. Real Income Effects (billions of 2001 Euros and percentage change from baseline)
Scenario Partial 1
trade agreement
Partial 2 trade
agreement
Full FTA (excl. trade facilitation)
1,2 2,2 4,3 EU
0,01% 0,03% 0,05%
2,5 4,3 10,0
0,58% 1,01% 2,32%
Korea
Source: Model simulations. Note: All results are reported for a baseline including expected effects from the Doha-round and other Korean FTAs.
Results presented here exclude effects from trade facilitation. The possible additional effects from trade facilitation are included in results presented in the technical annex.
The results of our analysis of a Partial 1 trade agreement show that: For EU25, real income is expected to increase by 1.2 billion Euros (0.01%) compared to baseline real income. The corresponding figure for Korea is 2.5 billion Euros (0.58%). Seeing that Korea has higher initial trade barriers, the bigger effect on the Korean economy is as expected15. In the Partial 1 scenario, import protection on agriculture and food is lowered by 40 percent (but still assuring compliance with WTO-rules), the remaining import protection on manufacturing is removed completely, and 25 percent of the barriers to services trade are removed. Compare to a full FTA this is a limited free trade agreement, but nevertheless it will still lead to real income gains for both economies. The Partial 2 trade agreement scenario, is similar to the Partial 2 scenario with respect to agriculture, food, and manufacturing, but is more progressive with respect to services (50% reduction instead of 25% reduction). Not surprisingly, the gains from this trade agreement will be larger than from a Partial 1 trade agreement, since more liberalization of services trade brings significant opportunities for both economies. For the Korean economy, the gains from implementing a Partial 2 trade agreement, will amount to a 4.3 billion Euros gain (1.0%) in real income. For the EU, the corresponding figure is 2.2 billion (0.03%). Thus the results show that both economies will still stand to gain economically from a partial 2 agreement. Moreover, these gains will be considerably larger, i.e. 75 percent higher than what is expected to arise in the case of a Partial 1 trade agreement.
15 Lowering import protection leads to better access to more competitive international products. These can be used
either directly by consumers or indirectly as intermediate inputs in domestic production. The benefit to the domestic economy will thus be two-fold, leading to both an increase in the level of consumption and the international competitiveness of domestically produced goods. Seeing that the a priori levels of protection are higher in Korea than in the EU, the potential gain for the Korean economy is expected to be higher. This was confirmed by the calculations.

Economic Impact of a Potential Free Trade Agreement between the European Union and South Korea
Page 27 of 92
The results for our experiment for a full free trade agreement show an increase in EU25 real income of 4.3 billion Euros (0.05%) and a gain for Korea of 10.0 billion Euros (2.32%). In this scenario all import protection is removed (both in agriculture, food and manufacturing) and barriers to services trade are also removed. Measures within trade facilitation are likely to be part of an agreement between EU and Korea. The extra gains from trade facilitation that can be added to any of the three scenarios are 0.4 billion Euros (2001-prices) for the EU and 0.5 billion Euros for Korea. We have modelled trade facilitation as a 1 percent decrease in trade costs due to more transparent trade systems, such as customs procedures, product standards and conformance certifications, licensing requirements, and related administrative sources of trading costs. As we shall see below, trade facilitation is only a small part of the total gains in the full FTA scenario (between 5 and 10% of the gains are from trade facilitation). If trade facilitation is included – under these assumptions – in the partial 1 scenario, gains will increase with 0.4 billion Euros for the EU and 0.5 billion Euros for Korea, increasing the gains in the Partial 1 scenario with 36 percent for EU and 20 percent for Korea. Looking at real income effects as percent of national real income, a full FTA between Korea and the EU, implies a 2.3 percent increase in total Korean real income (or 2.4 percent if trade facilitation is included). The corresponding relative effect on EU25, i.e. less than 0.1 percent of GDP, will be much smaller, because the European economy is much larger16.
Decomposition of Real Income Effects To find out more about the underlying reasons for the gains from trade, we decompose the effects with regards to each trade liberalization measure, i.e. import protection in agriculture and food, import protection in manufacturing and barriers in services. These are summarized in Table 4.2 below. As can be seen from the table, the smallest share is attributable to lowering tariffs in manufacturing and agriculture, i.e. import protection, while a majority of the results in all scenarios, for both countries originate from trade liberalization in services. Table 4.2. Decomposition of real income effects from the trade agreements (billions of 2001 Euros) Import protection Services Total
Agri. and food Manufac. Trade
facilitation EU 0,1 0,3 0,8 - 1,2
Partial 1 trade agreement
Korea 0,0 1,2 1,3 - 2,5 EU 0,1 0,3 1,8 - 2,2
Partial 2 trade agreement
Korea 0,0 1,2 3,2 - 4,3 EU 0,1 0,2 3,9 0,4 4,7
Full FTA
Korea 0,0 1,3 8,7 0,5 10,5 Source: Model simulations Note: The parts do not exactly sum to the total, due to rounding errors. Note that the effects are roughly additive. The effect of import protection is approximately 1.2 billion for Korea and 0.3 billion for the EU, in all scenarios. The measure import protection incorporates measures in both manufacturing, which is assumed to be stable across agreements, and agriculture, which assumes more liberalization in the full FTA scenario than in the partial scenario. This implies that the
16 For comparison, GDP for EU25 is approximately 20 times bigger than Korean GDP.
Economic Impact of a Potential Free Trade Agreement between the European Union and South Korea
Page 28 of 92
estimated gains from the FTA are not very sensitive to the level of reduction taking place in agriculture. The effect of services is 4 billion for EU and almost 9 billion in Korea for the full free trade agreement. This effect is approximately halved when moving to the partial trade agreement and again halved when assuming the limited trade agreement. Remembering that these scenarios differ with regards to underlying assumptions on services, i.e 100% for a full FTA, 50% for a partial and 25% for the limited, we can conclude that the gains from trade are roughly mirrored in the definition with regards to services. In short, liberalization of services is very important to the overall effect of a potential free trade agreement.
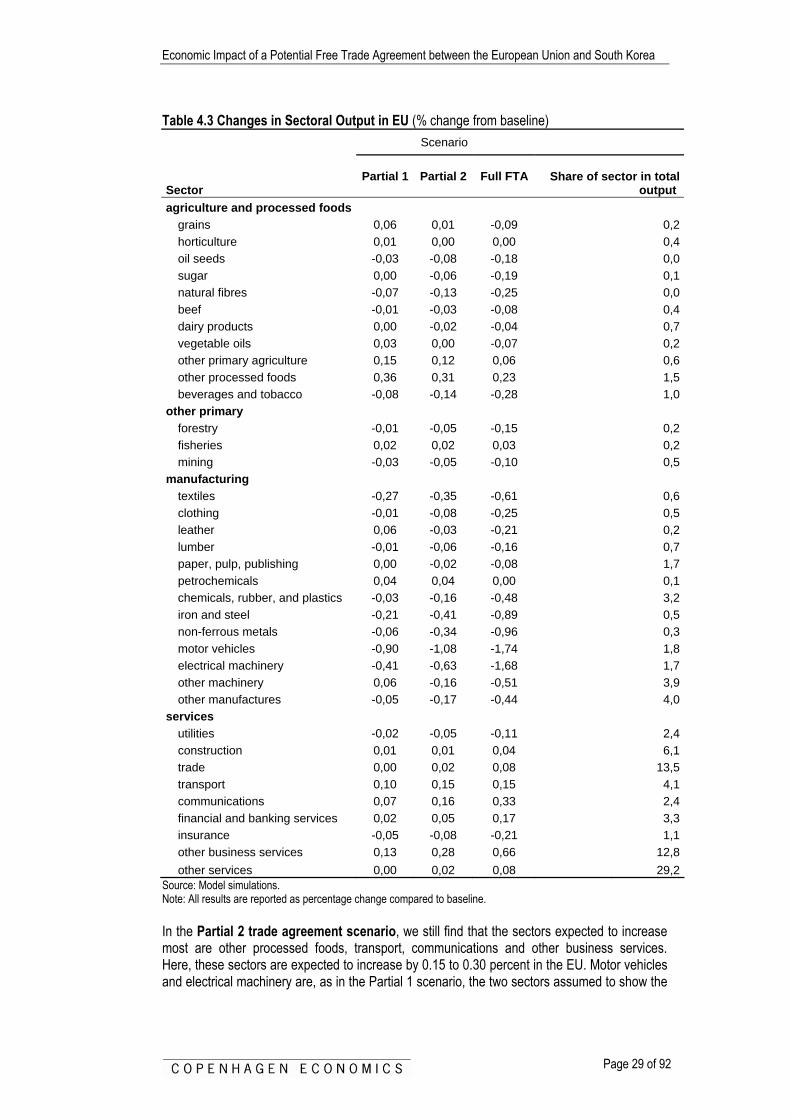
4.2. Effects on Sectoral Outputs Our analyses of the expected changes in sectoral output as a result of increased trade reveal a pattern where EU merchandise production will drop, while the output in European services sectors will increase. For Korea, the effects of trade are expected to be the opposite, i.e. causing an expansion in the output of merchandise, while the service sector is expected to contract. The changes in sectoral outputs for both economies are shown in Table 4.3 for the EU and in Table 4.4 for Korea.
Changes in sectoral output in the EU The analysis with regards to a Partial 1 agreement for EU shows an overall increase across the service sector, with the largest increase in the Other Business service, Transport and Communications services. These industries are expected to expand by 0.13%, 0.10% and 0.07% respectively. Other industries, which show a relatively large increase in production, are Other Processed Foods and Other Machinery. Here output is expected to increase by 0.36% and 0.06% respectively. The contracting industries can be found in within the manufacturing sector. The largest drops in output could be found in the two sectors which were among the sectors where ex-ante European trade barriers were higher than their Korean counterparts, namely in motor vehicles and electrical machinery. These sectors show a contraction of output corresponding to 1 percent and 0.5 percent respectively. However, it should be noted that although the relative drop in the shrinking industries are higher then the increase in the expanding ones e.g. 1 percent vs. 0.36 percent, the overall effect on the European economy is positive, since the service sector is so much larger in overall output.
Economic Impact of a Potential Free Trade Agreement between the European Union and South Korea
Page 29 of 92
Table 4.3 Changes in Sectoral Output in EU (% change from baseline) Scenario
Sector Partial 1 Partial 2 Full FTA
Share of sector in total
output agriculture and processed foods
grains 0,06 0,01 -0,09 0,2horticulture 0,01 0,00 0,00 0,4oil seeds -0,03 -0,08 -0,18 0,0sugar 0,00 -0,06 -0,19 0,1natural fibres -0,07 -0,13 -0,25 0,0beef -0,01 -0,03 -0,08 0,4dairy products 0,00 -0,02 -0,04 0,7vegetable oils 0,03 0,00 -0,07 0,2other primary agriculture 0,15 0,12 0,06 0,6other processed foods 0,36 0,31 0,23 1,5beverages and tobacco -0,08 -0,14 -0,28 1,0
other primary forestry -0,01 -0,05 -0,15 0,2fisheries 0,02 0,02 0,03 0,2mining -0,03 -0,05 -0,10 0,5
manufacturing textiles -0,27 -0,35 -0,61 0,6clothing -0,01 -0,08 -0,25 0,5leather 0,06 -0,03 -0,21 0,2lumber -0,01 -0,06 -0,16 0,7paper, pulp, publishing 0,00 -0,02 -0,08 1,7petrochemicals 0,04 0,04 0,00 0,1chemicals, rubber, and plastics -0,03 -0,16 -0,48 3,2iron and steel -0,21 -0,41 -0,89 0,5non-ferrous metals -0,06 -0,34 -0,96 0,3motor vehicles -0,90 -1,08 -1,74 1,8electrical machinery -0,41 -0,63 -1,68 1,7other machinery 0,06 -0,16 -0,51 3,9other manufactures -0,05 -0,17 -0,44 4,0
services utilities -0,02 -0,05 -0,11 2,4construction 0,01 0,01 0,04 6,1trade 0,00 0,02 0,08 13,5transport 0,10 0,15 0,15 4,1communications 0,07 0,16 0,33 2,4financial and banking services 0,02 0,05 0,17 3,3insurance -0,05 -0,08 -0,21 1,1other business services 0,13 0,28 0,66 12,8other services 0,00 0,02 0,08 29,2
Source: Model simulations. Note: All results are reported as percentage change compared to baseline. In the Partial 2 trade agreement scenario, we still find that the sectors expected to increase most are other processed foods, transport, communications and other business services. Here, these sectors are expected to increase by 0.15 to 0.30 percent in the EU. Motor vehicles and electrical machinery are, as in the Partial 1 scenario, the two sectors assumed to show the
Economic Impact of a Potential Free Trade Agreement between the European Union and South Korea
Page 30 of 92
largest contraction. In this scenario, these sectors will decrease production with around 1 percent. An interesting point to note is that as the level of trade liberalization advances, i.e going from the Partial 1 to the full FTA, we find that the positive effect on the “other processed foods” sector is falling. This is attributable to the fact that the results in this sector, as most sector in agriculture and manufacturing, are negatively affected by further liberalization in services.
Changes in sectoral output in Korea We now turn our attention to changes in sectoral output in Korea. Here, a picture emerges where there is a broad based contraction in the food and service sector, while the manufacturing sector will expand. These results are summarized in Table 4.4 below. The output from “Other business services”, show a large estimated decline, as a result of a Partial 1 agreement. This particular industry is expected to decline by almost five percent of its output. Other industries that show large decreases in output are “other processed foods” (-5%), and beef (-2%). On the expanding side, we find that motor vehicles are expected to increase by 16 percent, and that and electrical machinery is expanding with six percent. Iron and steel and clothing also show that large increases are expected to take place as a result of trade liberalization measures. Looking at the effect of the more ambitious trade agreement scenarios, we find that the sectors that were most affected by the Partial 1 scenario remains most affected, even as the measures to liberalize trade are more ambitious. In the case of a partial 2 trade agreement, it is again other business services (-10%) and other processed foods (-5%) and communication (-3%) that are expected to show the largest decrease in production. Meanwhile the sectors electrical machinery, motor vehicles and iron and steel are assumed to increase most. The biggest change in expected output as we move from analyzing full FTA to the partial trade agreement is in electrical machinery, where the effect of trade liberalization is almost doubled, from 6 percent to 12 percent change in sectoral output. This indicates that this sector is especially sensitive to the level of trade liberalization in services taking place.

Economic Impact of a Potential Free Trade Agreement between the European Union and South Korea
Page 31 of 92
Table 4.4. Changes in sectoral output in Korea
Scenario
Sector Partial 1 Partial 2 Full FTA Share of sector in total output
agriculture and processed foods
grains 0,02 -0,10 -0,45 1,7horticulture 0,08 0,09 0,13 1,5oil seeds -1,01 -1,23 -1,86 0,0sugar -1,51 -1,45 -1,40 0,1natural fibres 0,37 0,29 0,06 0,0beef -2,28 -2,32 -2,70 0,1dairy products -0,17 -0,01 0,16 0,2vegetable oils -1,74 -1,60 -1,22 0,0other primary agriculture -1,86 -1,90 -2,25 0,6other processed foods -5,23 -5,23 -5,79 0,9beverages and tobacco -1,28 -0,74 0,28 1,2
other primary forestry -1,11 -1,25 -1,82 0,1fisheries -0,80 -0,76 -0,78 0,3mining -1,51 -1,50 -1,94 0,3
manufacturing textiles 1,45 1,25 0,93 1,6clothing 2,21 2,27 2,87 0,5leather 0,66 0,64 0,55 0,2lumber -1,13 -0,93 -0,71 0,3paper, pulp, publishing -2,31 -2,88 -4,78 1,1petrochemicals -0,33 0,22 1,69 0,4chemicals, rubber, and plastics -0,78 0,27 2,73 3,8iron and steel 4,45 8,39 18,12 1,7non-ferrous metals -0,27 3,00 10,67 0,5motor vehicles 16,35 18,93 28,80 2,5electrical machinery 6,26 11,58 27,06 3,5other machinery 0,22 3,14 10,62 7,2other manufactures -1,25 -0,26 1,71 2,7
services utilities -0,19 0,06 0,50 4,1construction 0,24 0,30 0,54 6,3trade -0,42 -1,01 -2,96 9,4transport -0,03 0,91 4,07 4,3communications -1,64 -3,15 -6,65 3,2financial and banking services -0,23 -0,60 -2,17 5,9insurance -0,28 -0,28 -0,19 1,3other business services -4,88 -9,91 -23,08 9,6other services -0,44 -0,87 -2,36 23,1
Source: Model simulations. Note: All results are reported as percentage change compared to baseline. This picture is confirmed when comparing the outcome of the analysis with respect to a full free trade agreement, where there are both differences with respect to to liberalizing trade in services and in agriculture and food. The key message from the scenario is that the results in agriculture and food are not altered very much by the move from a 40 percent reduction to a full reduction. Processed food will also shrink with about five percent in the full free trade

Economic Impact of a Potential Free Trade Agreement between the European Union and South Korea
Page 32 of 92
scenario, as it did in the partial scenarios. The full FTA confirms that the service sectors are generally most sensitive to further trade liberalization, i.e. the service sectors exhibits the largest change in output as a result of a full free trade agreement, with a decrease in business service output of 23 percent. Again service trade liberalization (and trade facilitation) has significant impact on the key Korean manufacturing industries: motor vehicles (up from 18 to 29 percent output expansion between partial 2 and full FTA) and electrical machinery (up from 12 to 27 percent output expansion between partial 2 and full FTA).
Decomposition of Sectoral Effects Returning to the discussion above with regards to some sectors being more sensitive to the liberalization in services taking place, we now turn to decomposing the effects on sectoral outputs on measures to liberalize trade. With regards to the effect on the agricultural sectors, decomposition reveals the major contributor to these effects as being the removal of tariffs. The removal of barriers to trade in services has a relatively small effect on this sector, which is due to the fact that these sectors use fewer services as intermediate inputs, as compared to the manufacturing sector. For presentational purposed, we have chosen to focus the discussion in the text on the sectors expected to exhibit the largest relative changes in output. These are summarized in Table 4.5-Table 4.10 below, while tables in the appendix show the decomposition of sectoral output for all sectors. With respect to Korea, we find that although the service sector is expected to expand in the wake of increased international competition, the increase in the manufacturing sector is in fact largely driven by measures taken with regards to liberalizing trade in services Table 4.5. Decomposition of effects on sectoral output in Korea from Full FTA, selected sectors
Trade liberalisation measure
Sector Trade
faciltiation Import
protection Services Total beef -0,3 -2,3 -0,1 -2,7 other processed foods -0,5 -5,4 0,1 -5,8 electrical machinery 3,0 2,5 21,6 27,1 motor vehicles 1,4 16,2 11,2 28,8 iron and steel -1,3 2,0 17,4 18,1 other machinery 0,1 -2,2 12,7 10,6 other business services -0,4 -1,4 -21,3 -23,1
Source: Model simulations Note: The results are from the Full FTA scenario. All results are reported for a baseline including a full Doha-round
and other Korean FTAs. The parts do not exactly sum to the total, due to rounding errors. As can be seen from the Table above, the effect of the different measures differ across sectors. The change in the food sector is highly attributable to measures in import protection, while the effect of services is negligible. Meanwhile, 11 percentage points of the 29 percent expected increase in the motor vehicles stems from liberalization in the service sector. For electrical machinery, 80 percent of the expected growth is attributable to increased trade in services. The corresponding figures for the service industries are even higher, and reducing tariffs in manufacturing and agriculture even have a small negative effect in services. The underlying explanation for the large effect of services on the increase in Korean manufacturing is twofold. First, services, which are an important input in the Korean manufacturing sector, are highly protected, (e.g. the average tariff equivalence for the Korean service sector was shown about 46%, while the corresponding figure for the EU is 17%). The
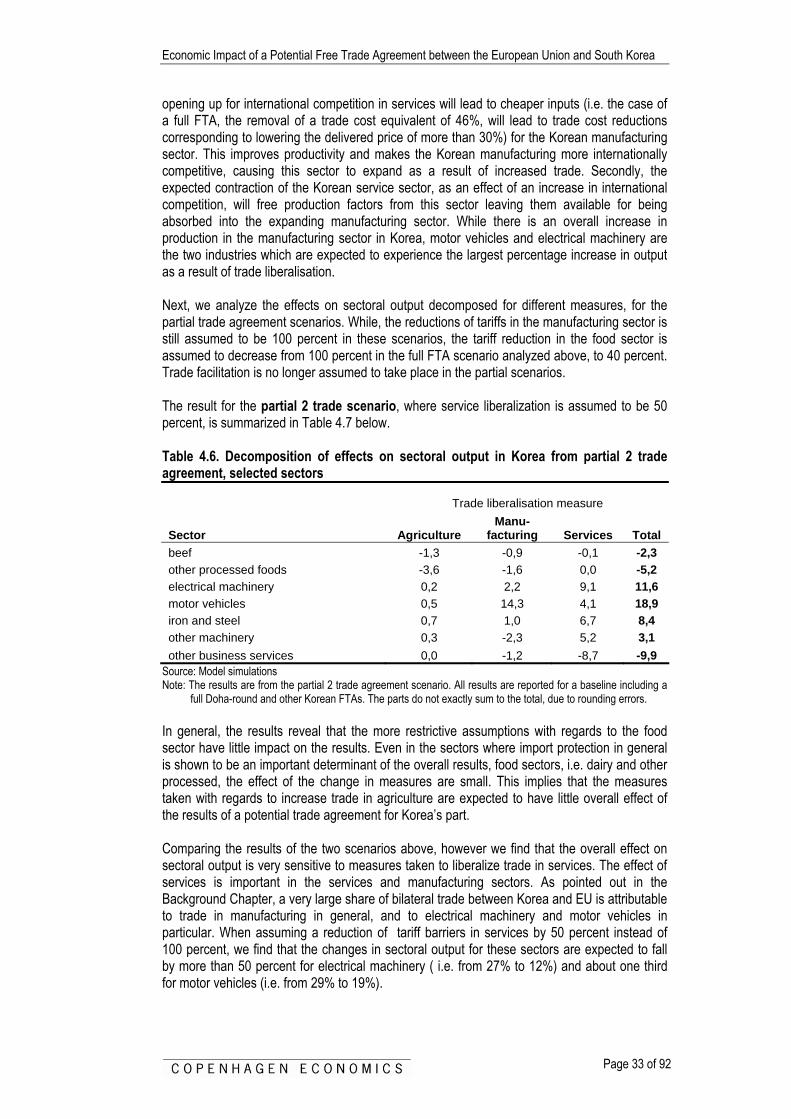
Economic Impact of a Potential Free Trade Agreement between the European Union and South Korea
Page 33 of 92
opening up for international competition in services will lead to cheaper inputs (i.e. the case of a full FTA, the removal of a trade cost equivalent of 46%, will lead to trade cost reductions corresponding to lowering the delivered price of more than 30%) for the Korean manufacturing sector. This improves productivity and makes the Korean manufacturing more internationally competitive, causing this sector to expand as a result of increased trade. Secondly, the expected contraction of the Korean service sector, as an effect of an increase in international competition, will free production factors from this sector leaving them available for being absorbed into the expanding manufacturing sector. While there is an overall increase in production in the manufacturing sector in Korea, motor vehicles and electrical machinery are the two industries which are expected to experience the largest percentage increase in output as a result of trade liberalisation. Next, we analyze the effects on sectoral output decomposed for different measures, for the partial trade agreement scenarios. While, the reductions of tariffs in the manufacturing sector is still assumed to be 100 percent in these scenarios, the tariff reduction in the food sector is assumed to decrease from 100 percent in the full FTA scenario analyzed above, to 40 percent. Trade facilitation is no longer assumed to take place in the partial scenarios. The result for the partial 2 trade scenario, where service liberalization is assumed to be 50 percent, is summarized in Table 4.7 below. Table 4.6. Decomposition of effects on sectoral output in Korea from partial 2 trade agreement, selected sectors
Trade liberalisation measure
Sector Agriculture Manu-
facturing Services Total beef -1,3 -0,9 -0,1 -2,3 other processed foods -3,6 -1,6 0,0 -5,2 electrical machinery 0,2 2,2 9,1 11,6 motor vehicles 0,5 14,3 4,1 18,9 iron and steel 0,7 1,0 6,7 8,4 other machinery 0,3 -2,3 5,2 3,1 other business services 0,0 -1,2 -8,7 -9,9
Source: Model simulations Note: The results are from the partial 2 trade agreement scenario. All results are reported for a baseline including a
full Doha-round and other Korean FTAs. The parts do not exactly sum to the total, due to rounding errors. In general, the results reveal that the more restrictive assumptions with regards to the food sector have little impact on the results. Even in the sectors where import protection in general is shown to be an important determinant of the overall results, food sectors, i.e. dairy and other processed, the effect of the change in measures are small. This implies that the measures taken with regards to increase trade in agriculture are expected to have little overall effect of the results of a potential trade agreement for Korea’s part. Comparing the results of the two scenarios above, however we find that the overall effect on sectoral output is very sensitive to measures taken to liberalize trade in services. The effect of services is important in the services and manufacturing sectors. As pointed out in the Background Chapter, a very large share of bilateral trade between Korea and EU is attributable to trade in manufacturing in general, and to electrical machinery and motor vehicles in particular. When assuming a reduction of tariff barriers in services by 50 percent instead of 100 percent, we find that the changes in sectoral output for these sectors are expected to fall by more than 50 percent for electrical machinery ( i.e. from 27% to 12%) and about one third for motor vehicles (i.e. from 29% to 19%).

Economic Impact of a Potential Free Trade Agreement between the European Union and South Korea
Page 34 of 92
When analyzing the corresponding date for the Partial 1 trade agreement scenario, the underlying assumption with regards to reducing barriers to trade in 25%. These results are summarized in Table 4.7 below. Table 4.7. Decomposition of effects on sectoral output in Korea from Partial 1 trade agreement
Trade liberalisation measure
Sector Agriculture Manufacturing Services Total beef -1,3 -0,9 0,0 -2,3 other processed foods -3,6 -1,6 0,0 -5,2 electrical machinery 0,2 2,1 3,9 6,3 motor vehicles 0,6 14,1 1,7 16,4 iron and steel 0,7 0,9 2,8 4,5 other machinery 0,3 -2,3 2,3 0,2 other business services 0,0 -1,1 -3,8 -4,9
Source: Model simulations Note: The results are from the partial 1 trade agreement scenario. All results are reported for a baseline including a
full Doha-round and other Korean FTAs. The parts do not exactly sum to the total, due to rounding errors. As in the analysis with respect to the Partial 1 trade agreement scenario, we again find that the sectoral effects are sensitive to the measures taken to lower barriers to trade in services. Hence, as we decrease the scope of liberalization in services, the expected sectoral effects have decreased accordingly. This is most visible in the case is electrical machinery, which is expected to expand with 27 percent in the full FTA, where 80 percent was attributable to services and approximately one fifth (20%) to less import protection and trade facilitation. As we decrease the scope of liberalization the effects are shown to fall accordingly. Here, the expected expansion in electrical machinery is 6 percent. There is also a large decrease in the expected expansion of the motor vehicles sector. In short, comparing the outcomes for our different levels of trade liberalization, we find that the Korean export gains are sensitive to the degree of services liberalization taking place. This implies that as the scope for services liberalization is reduced, the Korean export gains in manufacturing fall accordingly. Next , we turn to the decomposition of effects with regards to the EU. The decomposition for a full free trade scenario is summarized in Table 4.8 below. While services is the major determinant of the expected sectoral changes for most of the sectors in the table, there are two exceptions, namely other processed foods and motor vehicles. Other processed foods, as is the case for most agricultural sectors, use very little services as intermediate inputs. The fact that the expected contraction in the motor vehicles is mostly attributable to the lowering of tariffs is that this sector enjoys high a priori levels of import protection. Removing these will open up to international competition, leading to an expected fall in production.

Economic Impact of a Potential Free Trade Agreement between the European Union and South Korea
Page 35 of 92
Table 4.8. Decomposition of effects on sectoral output in EU from Full FTA, selected sectors.
Trade liberalisation measure
Sector Trade
facilitation Import
protection Services Total other processed foods 0,0 0,4 -0,2 0,2 motor vehicles -0,1 -0,9 -0,8 -1,7 electrical machinery -0,1 -0,2 -1,4 -1,7 transport 0,0 0,0 0,1 0,2 communications 0,0 0,0 0,3 0,3 other business services 0,0 0,0 0,6 0,7
other machinery 0,0 0,2 -0,8 -0,5 Source: Model simulations Note: The results are from the Full FTA scenario. All results are reported for a baseline including a full Doha-round
and other Korean FTAs. The parts do not exactly sum to the total, due to rounding errors. As previously noted, the general expected expansion in the services sectors is driven by measures to liberalize trade in services. Seeing the close to 75% of EUs production takes place within services, it is made obvious that the overall positive outcome of a potential trade agreement between EU and Korea is in fact very much dependant on the liberalization of trade in services. These findings are also confirmed when turning to the decomposition of the more limited trade agreements. These are summarized in Table 4.9 and Table 4.10 below. Table 4.9: Decomposition of effects on sectoral output in EU from partial 2 trade agreement
Trade liberalisation measure
Sector Agriculture Manu-
facturing Services Total other processed foods 0,4 0,0 -0,1 0,3 motor vehicles 0,0 -0,7 -0,3 -1,1 electrical machinery 0,0 -0,1 -0,5 -0,6 transport 0,0 0,0 0,1 0,2 communications 0,0 0,0 0,2 0,2 other business services 0,0 0,0 0,3 0,3
other machinery 0,0 0,2 -0,4 -0,2 Source: Model simulations Note: The results are from the partial 2 trade agreement scenario. All results are reported for a baseline including a
full Doha-round and other Korean FTAs. The parts do not exactly sum to the total, due to rounding errors. When lowering the assumptions with regards to liberalization in agriculture, we find that the effect of import protection remain largely unchanged. This implies that these effects are not very sensitive to the level of tariff reductions taking place in the food sector, but rather in manufacturing. These results were also obtained in the analysis regarding Korea. The fact that the overall result with to a potential FTA is more sensitive to service liberalization is also clearly visible for EU, as was the case for Korea above. This is most evident in the sectors for electrical machinery and other business services. Here, the effects on relative change in sectoral output are closely mirrored in the level of trade liberalization assumed for services.
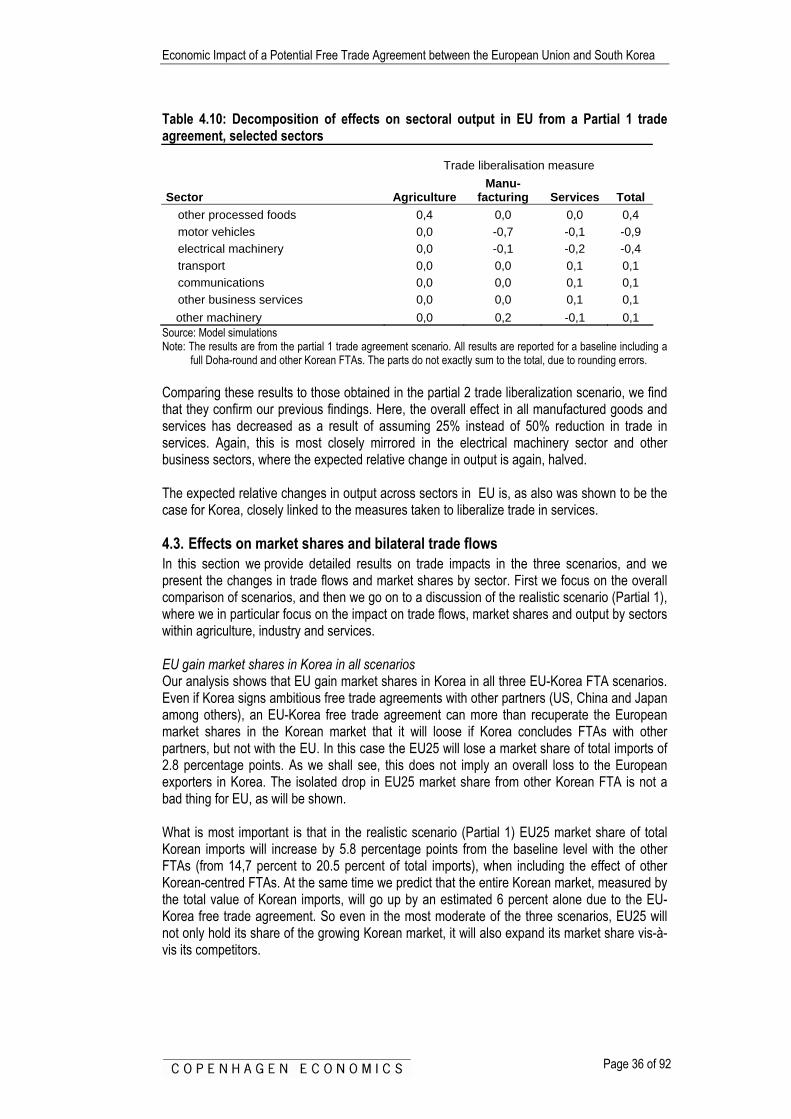
Economic Impact of a Potential Free Trade Agreement between the European Union and South Korea
Page 36 of 92
Table 4.10: Decomposition of effects on sectoral output in EU from a Partial 1 trade agreement, selected sectors
Trade liberalisation measure
Sector Agriculture Manu-
facturing Services Total other processed foods 0,4 0,0 0,0 0,4 motor vehicles 0,0 -0,7 -0,1 -0,9 electrical machinery 0,0 -0,1 -0,2 -0,4 transport 0,0 0,0 0,1 0,1 communications 0,0 0,0 0,1 0,1 other business services 0,0 0,0 0,1 0,1
other machinery 0,0 0,2 -0,1 0,1 Source: Model simulations Note: The results are from the partial 1 trade agreement scenario. All results are reported for a baseline including a
full Doha-round and other Korean FTAs. The parts do not exactly sum to the total, due to rounding errors. Comparing these results to those obtained in the partial 2 trade liberalization scenario, we find that they confirm our previous findings. Here, the overall effect in all manufactured goods and services has decreased as a result of assuming 25% instead of 50% reduction in trade in services. Again, this is most closely mirrored in the electrical machinery sector and other business sectors, where the expected relative change in output is again, halved. The expected relative changes in output across sectors in EU is, as also was shown to be the case for Korea, closely linked to the measures taken to liberalize trade in services.
4.3. Effects on market shares and bilateral trade flows In this section we provide detailed results on trade impacts in the three scenarios, and we present the changes in trade flows and market shares by sector. First we focus on the overall comparison of scenarios, and then we go on to a discussion of the realistic scenario (Partial 1), where we in particular focus on the impact on trade flows, market shares and output by sectors within agriculture, industry and services. EU gain market shares in Korea in all scenarios Our analysis shows that EU gain market shares in Korea in all three EU-Korea FTA scenarios. Even if Korea signs ambitious free trade agreements with other partners (US, China and Japan among others), an EU-Korea free trade agreement can more than recuperate the European market shares in the Korean market that it will loose if Korea concludes FTAs with other partners, but not with the EU. In this case the EU25 will lose a market share of total imports of 2.8 percentage points. As we shall see, this does not imply an overall loss to the European exporters in Korea. The isolated drop in EU25 market share from other Korean FTA is not a bad thing for EU, as will be shown. What is most important is that in the realistic scenario (Partial 1) EU25 market share of total Korean imports will increase by 5.8 percentage points from the baseline level with the other FTAs (from 14,7 percent to 20.5 percent of total imports), when including the effect of other Korean-centred FTAs. At the same time we predict that the entire Korean market, measured by the total value of Korean imports, will go up by an estimated 6 percent alone due to the EU-Korea free trade agreement. So even in the most moderate of the three scenarios, EU25 will not only hold its share of the growing Korean market, it will also expand its market share vis-à-vis its competitors.

Economic Impact of a Potential Free Trade Agreement between the European Union and South Korea
Page 37 of 92
Our simulations also suggest that the potential in a full FTA between EU and Korea will give the EU a market share of almost one third (31.1%) of the total Korean import value, or a leap forward of 16.4 percentage points compared to the “with other FTA baseline” of 14.7 percent share of total Korean imports. The Partial 2 scenario predicts an increase of 8.9 percentage points to 23.6 percent share for the EU25, again when compared to the most likely baseline with the other Korean FTA included, cf. Figure 4.2. Figure 4.2 EU25 Shares of Korean Imports, percent of imports
17,5%
14,7%
20,5%
23,6%
31,1%
0%
5%
10%
15%
20%
25%
30%
35%
BASELINE Noother FTA
BASELINEIncluding otherKorean FTAs
EU Partial 1 +other Korean
FTAs
EU Partial 2 +other Korean
FTAs
EU full FTA +other Korean
FTAs
EU25
sha
re o
f tot
al K
orea
n im
port
s(p
erce
ntag
e of
tota
l im
ports
)
+4,5+6,4
+9,2
-2.8
Source: Francois and Copenhagen Economics, own model simulations Note: The first baseline (red) is without other Korea-centered FTAs. The second (green) baseline includes other
Korea-centered FTA. Scenarios also include the effect from other FTAs. The diagram covers all trade in both agriculture, goods and services.
Why is the isolated drop in EU25 market share not such a bad thing? The explanation is very simple. When Korea opens up trade with other trading partners, but not with the EU, two things are likely to happen: One, Korea will import more goods and services. Two, Korea will import relatively more from the other trade partners compared to the EU. Thus EU market shares will drop due to this substitution effect, but our simulations suggest that total value of EU exports to Korea will remain unchanged or even increase slightly as a result of Korea engaging in other FTAs. This is due to the income effect. If Korea engages in FTAs with six large trading partners, Korean GDP will boom rapidly. We predict between four and five percent increase in Korean GDP as a result of the other FTAs17. The result for the EU is that the value of Korean imports from EU25 will increase by 6 percent alone as an effect of Korea concluding FTAs with others, cf. Figure 4.3. So behind the drop in EU market share from 17.5 percent to 14.7 percent, there is a dramatic increase in the total Korean import value as their economy grow due to trade liberalization, but there is also – in our simulations – a slight increase in the value of Korean imports from the EU. So even if the EU market share in Korea decline, the growth in the value of the Korean import market more than compensate for this decline in share, the net result being an increase in EU exports to Korea. The income effect out rules the substitution effect. If the EU and Korea engage in a FTA gains for the EU will of course increase. In the realistic scenario (Partial 1) the value of Korean imports from the EU will increase with almost 50 percent (from index value 100 to index value 148). The total Korean import market will increase with 6 percent (from index value 100 to index value 106), cf. Figure 4.3. 17 This result is of course dependent on our formulation of other FTAs. See chapter three.

Economic Impact of a Potential Free Trade Agreement between the European Union and South Korea
Page 38 of 92
Figure 4.3 Value of total Korean imports and value of Korean imports from EU25
95 100
148
177
80
100106 110
-
20
40
60
80
100
120
140
160
180
200
BASELINE w ithoutother Korean FTA
BASELINE Includingother Korean FTAs
EU Partial 1 + otherKorean FTAs
EU Partial 2 + otherKorean FTAs
Valu
e of
Kor
ean
impo
rts
(Inde
xed
to th
e ba
selin
e va
lue
incl
udin
g ot
her F
TA =
100
)
Korean imports from EU25 Total Korean import from world
EU25=14.7%EU25=17.5%
EU25=20.5%
EU25=22.6%EU25 share of total Korean imports
Source: Francois and Copenhagen Economics, own model simulations Note: The first baseline (red) is without other Korea-centered FTAs. The second (green) baseline includes other
Korea-centered FTA. Scenarios also include the effect from other FTAs. Full FTA is excluded for the sake of simplicity. The diagram covers all trade in both agriculture, goods and services.
It should be noted that Korea is only a small trading partner for the EU25 and these changes in market shares in Korea represents an increase of total EU25 to world export value of 0,3 percent in the Partial 1 scenario and 0,7 percent in the full FTA scenario. The results presented above include all sectors (agriculture, manufacturing and services). The result that EU will lose market share if Korea proceeds with other FTAs, but not with the EU, holds in all main sectors. The other part of our result – that EU can regain its market share in Korea even in a Partial 1 agreement – also holds for all main sectors, cf. Table 4.12. Table 4.11 EU25 share of total Korean imports (%)
Sector (share of EU25 exports to Korea)
BASELINE without other
Korean FTA
BASELINE Including
other Korean FTAs
EU Partial 1 + other
Korean FTAs
EU Partial 2 + other Korean
FTAs Agriculture and processed foods (1,8%)
4,3% 2,8% 10,5% 10,4%
Other primary (0,2%)
0,2% 0,2% 0,2% 0,2%
Manufacturing (52,8%)
15,6% 12,7% 16,5% 16,4%
Services (45,3%)
44,1% 36,2% 48,0% 59,0%
TOTAL 17,5% 14,7% 20,5% 23,6%
Source: Francois and Copenhagen Economics, own model simulations Note: The first baseline is without other Korea-centered FTAs. The second baseline includes other Korea-centered
FTA. Scenarios also include the effect from other FTAs.

Economic Impact of a Potential Free Trade Agreement between the European Union and South Korea
Page 39 of 92
Looking at the total value of Korean imports from the EU we found that the loss in market share was compensated by an increase in the total market size of Korean imports from world. This results also holds for the main sectors, except in agriculture and processed food, where we predict that the income effect will not be strong enough to compensate for the loss in market share, and the net result for Korean imports of EU agriculture and food will be negative if Korea engages in other FTAs and not with the EU, cf. Table 4.12. This is not surprising, since agriculture and food are the less income sensitive than manufacturing and services. Table 4.12 Value of Korean imports from EU25 benchmarked to baseline (Index “with other FTA Baseline” = 100)
Sector (share of EU25 exports to Korea)
BASELINE without other
Korean FTA
BASELINE Including
other Korean FTAs
EU Partial 1 + other
Korean FTAs
EU Partial 2 + other Korean
FTAs Agriculture and processed foods (1,8%)
106 100 392 391
Other primary (0,2%)
97 100 123 123
Manufacturing (52,8%)
98 100 135 137
Services (45,3%)
90 100 153 215
TOTAL 95 100 148 177
Source: Francois and Copenhagen Economics, own model simulations Note: The first baseline is without other Korea-centered FTAs. The second baseline includes other Korea-centered
FTA. Scenarios also include the effect from other FTAs. Turning to the Korean side of the agreement, Korea will also gain market shares in the EU as a result of a free trade agreement. Compared to the much larger value of EU25 total imports, Korea only signifies a small share of total EU25 imports. In most sectors Korea’s share of imports is less than one percent. Only in textiles (3.8% of total EU25 textile imports), clothing (1.5%), motor vehicles (2.7%), electrical machinery (2.7%), transport (1.6%) and communications (1.1%) as well as other business services (1.1%) and other services (1.2%) do Korean imports represent more than one percent of total EU25 imports. All of these sectors will expand their share in European imports, but only moderately (e.g. Korean clothing will increase from 1.5% of total EU clothing imports to 2.2% in the Partial 1 scenario). Other sectors show similar reactions to a free trade agreement, cf. appendix III. The highest Korean market share in the Partial 1 scenario will be textiles and motor vehicles both predicted to reach a five percent share of total EU imports. Even these changes seem less dramatic from a European point of view. However, for the Korean export sectors the EU-Korea FTA is an important opportunity. The value of total Korean export is predicted to go up by six percent alone as a result of a Partial 1 agreement with the EU, and the full FTA potential is estimated at a 16 percent increase in total Korean export value (not counting the gains from other FTA with e.g. US, Japan and China). The value of EU25 imports from Korea will increase with 12.8 billion euros, or 36 percent. To understand these changes in trade patterns it is necessary to analyse in which sectors these gains arise.
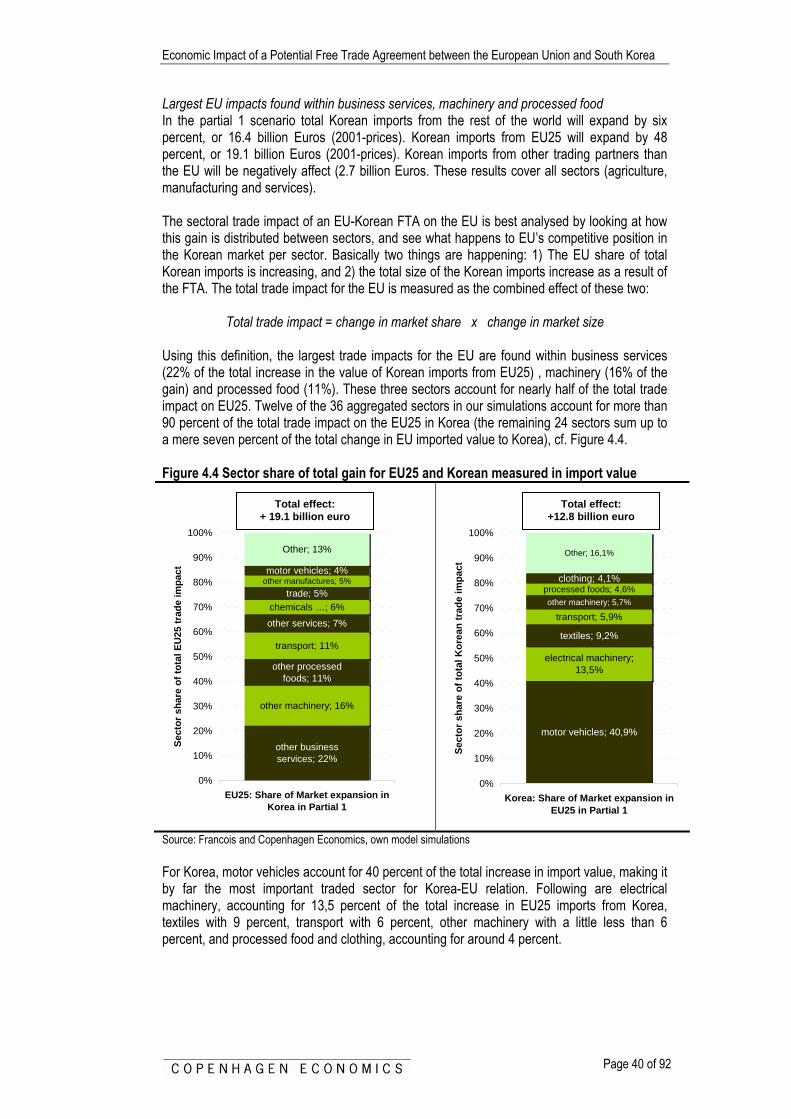
Economic Impact of a Potential Free Trade Agreement between the European Union and South Korea
Page 40 of 92
Largest EU impacts found within business services, machinery and processed food In the partial 1 scenario total Korean imports from the rest of the world will expand by six percent, or 16.4 billion Euros (2001-prices). Korean imports from EU25 will expand by 48 percent, or 19.1 billion Euros (2001-prices). Korean imports from other trading partners than the EU will be negatively affect (2.7 billion Euros. These results cover all sectors (agriculture, manufacturing and services). The sectoral trade impact of an EU-Korean FTA on the EU is best analysed by looking at how this gain is distributed between sectors, and see what happens to EU’s competitive position in the Korean market per sector. Basically two things are happening: 1) The EU share of total Korean imports is increasing, and 2) the total size of the Korean imports increase as a result of the FTA. The total trade impact for the EU is measured as the combined effect of these two:
Total trade impact = change in market share x change in market size Using this definition, the largest trade impacts for the EU are found within business services (22% of the total increase in the value of Korean imports from EU25) , machinery (16% of the gain) and processed food (11%). These three sectors account for nearly half of the total trade impact on EU25. Twelve of the 36 aggregated sectors in our simulations account for more than 90 percent of the total trade impact on the EU25 in Korea (the remaining 24 sectors sum up to a mere seven percent of the total change in EU imported value to Korea), cf. Figure 4.4. Figure 4.4 Sector share of total gain for EU25 and Korean measured in import value
other business services; 22%
other machinery; 16%
other processed foods; 11%
transport; 11%
other services; 7%
chemicals …; 6%trade; 5%
other manufactures; 5%motor vehicles; 4%
Other; 13%
0%
10%
20%
30%
40%
50%
60%
70%
80%
90%
100%
EU25: Share of Market expansion inKorea in Partial 1
Sect
or s
hare
of t
otal
EU
25 tr
ade
impa
ct
motor vehicles; 40,9%
electrical machinery; 13,5%
textiles; 9,2%
transport; 5,9%other machinery; 5,7%
processed foods; 4,6%clothing; 4,1%
Other; 16,1%
0%
10%
20%
30%
40%
50%
60%
70%
80%
90%
100%
Korea: Share of Market expansion inEU25 in Partial 1
Sect
or s
hare
of t
otal
Kor
ean
trad
e im
pact
Source: Francois and Copenhagen Economics, own model simulations For Korea, motor vehicles account for 40 percent of the total increase in import value, making it by far the most important traded sector for Korea-EU relation. Following are electrical machinery, accounting for 13,5 percent of the total increase in EU25 imports from Korea, textiles with 9 percent, transport with 6 percent, other machinery with a little less than 6 percent, and processed food and clothing, accounting for around 4 percent.
Total effect: +12.8 billion euro
Total effect: + 19.1 billion euro
Economic Impact of a Potential Free Trade Agreement between the European Union and South Korea
Page 41 of 92
We have identified the key sectors for the EU based on four criteria: • EU baseline market share in Korea: Key sectors already have an important EU
market share of total Korean imports (sectors where EU initially has small market shares are filtered off)
• Changes in EU market shares in Korea: Key sectors for the trade impact are those that are most affected when trade barriers are reduced (sectors that are unaffected by trade liberalisation are filtered off)
• Initial size of Korean import market: The key sectors represent a reasonable share of total Korean import values (sectors with small Korean imports are filtered away)
• Change in total Korean import value: Key sectors in Korea expand more than other sectors (sectors with no Korean import expansion are filtered off).
These indicators give us part of the explanation of why some sectors grow as a result of an FTA with Korea, while other sectors do not. Business services is key sector for EU in Korea. More than six percent of total Korean import value is in this sector, and the EU has a baseline market share of total sector import in Korea of 40 percent (40.3%). Furthermore, the EU share of total Korean imports is predicted to grow with another 12,1 percentage-points to a market share of 52,5 percent of total Korean imports of business services. Finally, output in the sector in the EU is expected to grow with 0.13 percent alone because of a Partial 1 agreement, cf. table 4.3. In summary this means that 22 percent of the increase in Korean imports from EU25 comes in this sector. Machinery (more precisely “other machinery”) is also an important sector for the trade impacts, even though the EU market share in Korea do not increase much (EU share of total Korean imports of other machinery goes up from 15 to 20 percent). Machinery is however by far the largest import sector for Korea (accounting for 18 percent of total Korean import value). Korean imports of machinery will also expand as a result of an FTA with Korea (with 6 pecent expansion this corresponds to the average increase in Korean imports). The net result for Korean imports from EU25 is large gain accounting for 16 percent of the total trade impact. Processed food is another important sector for the EU mainly because the Korean market a priori is quite protected from EU imports (with an average protection of 35 percent), and thus trade impacts from a free trade agreement are expected to be large in this sector. Even though the EU has a relatively small baseline market share in the sector of 5.6 percent, the EU market share is expected to more than triple double (to 28.2% of total sector imports) as a result of a Partial 1 agreement. Also, the sector is among the larger of the agricultural sectors in Korea with a share of total Korean imports of 1.3 percent. Finally, and most importantly, output in the EU processed food sector is expected to grow by 0.36 percent alone as a result of a Partial 1 agreement. The results in the Partial 1 scenario for these key sectors, and the other sectors, are documented in the following three tables showing the changes in market shares per sector in Table 4.13, the Korean import market expansion in Table 4.14, and the result net-trade impact in Table 4.15.

Economic Impact of a Potential Free Trade Agreement between the European Union and South Korea
Page 42 of 92
Table 4.13 Market share for EU25 in Partial 1 scenario
Baseline Partial 1 FTA %-point change from Baselineagriculture and processed foods
1 grains 0,0% 0,0% 0,0%2 horticulture 1,6% 1,6% 0,0%3 oil seeds 0,0% 0,0% 0,0%4 sugar 1,8% 1,8% 0,0%5 natural fibers 1,0% 1,1% 0,1%6 beef 0,2% 0,3% 0,1%7 dairy products 32,2% 32,2% -0,1%8 vegetable oils 7,8% 7,8% 0,0%9 other prinary agriculture 4,1% 5,8% 1,6%
10 other processed foods 5,6% 28,2% 22,6%11 beverages and tobacco 0,1% 0,2% 0,1%
other primary12 forestry 1,1% 1,2% 0,1%13 fisheries 2,4% 2,8% 0,4%14 mining 0,1% 0,2% 0,0%
manufacturing15 textiles 9,7% 13,3% 3,7%16 clothing 15,2% 20,9% 5,7%17 leather 27,6% 34,5% 7,0%18 lumber 12,1% 15,0% 2,9%19 paper, pulp, publishing 14,1% 16,1% 2,1%20 petrochemicals 1,9% 2,2% 0,3%21 chemicals, rubber, and plastics 16,9% 21,0% 4,1%22 iron and steel 7,6% 8,8% 1,2%23 non-ferrous metals 13,7% 16,2% 2,5%24 motor vehicles 22,2% 30,4% 8,2%25 electrical machinery 6,4% 7,1% 0,8%26 other machinery 15,5% 20,6% 5,0%27 other manufactures 13,1% 18,5% 5,4%
services28 utilities 15,0% 22,4% 7,4%29 construction 49,3% 61,3% 12,0%30 trade 31,5% 42,8% 11,4%31 transport 36,0% 48,1% 12,0%32 communications 41,3% 53,5% 12,2%33 financial and banking services 31,7% 43,0% 11,4%34 insurance 31,2% 42,5% 11,4%35 other business services 40,3% 52,5% 12,1%36 other services 28,8% 39,7% 10,9%
TOTAL 14,7% 20,5% 5,8%
EU25 share of total Korean import value
Source: Francois and Copenhagen Economics, own model simulations Note: We use the second baseline which includes other Korea-centered FTA. Scenario also include the effect from
other FTAs.

Economic Impact of a Potential Free Trade Agreement between the European Union and South Korea
Page 43 of 92
Table 4.14. Size of Korean import market in Partial 1 scenario
Baseline (with other FTAs) Partial 1 FTA Change
% change from Baseline
agriculture and processed foods1 grains 2.814 2.720 -94 -3,3%2 horticulture 670 664 -5 -0,8%3 oil seeds 1.956 1.957 1 0,1%4 sugar 497 490 -7 -1,4%5 natural fibers 802 809 7 0,9%6 beef 1.881 1.886 5 0,3%7 dairy products 479 486 7 1,4%8 vegetable oils 6 6 0 -1,4%9 other prinary agriculture 3.136 3.119 -18 -0,6%
10 other processed foods 7.239 8.768 1.530 21,1%11 beverages and tobacco 6.343 6.367 24 0,4%
other primary12 forestry 657 652 -5 -0,8%13 fisheries 758 722 -36 -4,8%14 mining 29.256 29.261 5 0,0%
manufacturing15 textiles 10.104 10.547 443 4,4%16 clothing 3.755 3.923 169 4,5%17 leather 2.104 2.212 109 5,2%18 lumber 2.118 2.164 45 2,1%19 paper, pulp, publishing 3.144 3.277 133 4,2%20 petrochemicals 4.066 4.084 18 0,4%21 chemicals, rubber, and plastics 21.382 22.444 1.062 5,0%22 iron and steel 9.647 9.719 73 0,8%23 non-ferrous metals 6.352 6.491 139 2,2%24 motor vehicles 6.452 7.172 719 11,2%25 electrical machinery 34.243 34.881 638 1,9%26 other machinery 48.915 51.874 2.959 6,0%27 other manufactures 13.504 14.339 834 6,2%
services28 utilities 247 281 34 13,7%29 construction 133 180 47 35,0%30 trade 5.122 6.134 1.012 19,8%31 transport 13.575 14.422 847 6,2%32 communications 2.055 2.385 330 16,1%33 financial and banking services 1.220 1.522 302 24,8%34 insurance 443 492 48 10,9%35 other business services 19.841 23.331 3.490 17,6%36 other services 7.416 8.929 1.513 20,4%
TOTAL 272.332 288.710 16.377 6,0%
Total Korean import value (mio. euro)
Source: Francois and Copenhagen Economics, own model simulations Note: We use the second baseline which includes other Korea-centered FTA. Scenario also include the effect from
other FTAs.
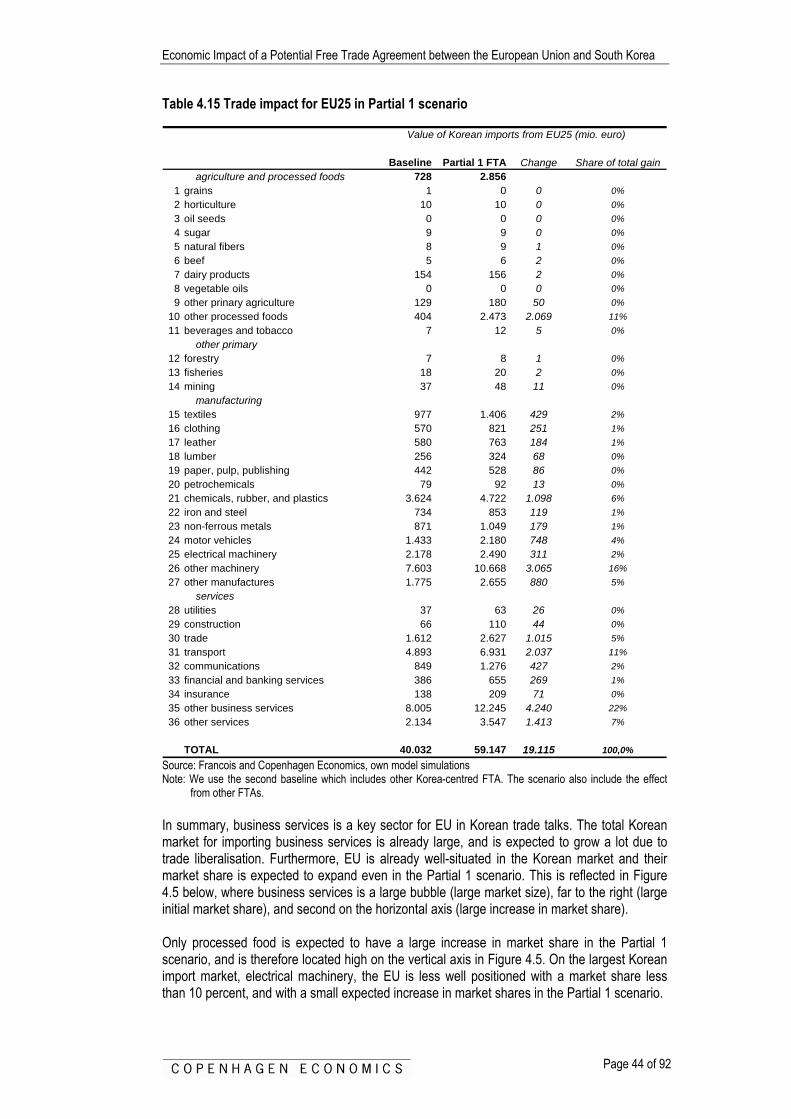
Economic Impact of a Potential Free Trade Agreement between the European Union and South Korea
Page 44 of 92
Table 4.15 Trade impact for EU25 in Partial 1 scenario
Baseline Partial 1 FTA Change Share of total gainagriculture and processed foods 728 2.856
1 grains 1 0 0 0%2 horticulture 10 10 0 0%3 oil seeds 0 0 0 0%4 sugar 9 9 0 0%5 natural fibers 8 9 1 0%6 beef 5 6 2 0%7 dairy products 154 156 2 0%8 vegetable oils 0 0 0 0%9 other prinary agriculture 129 180 50 0%
10 other processed foods 404 2.473 2.069 11%11 beverages and tobacco 7 12 5 0%
other primary12 forestry 7 8 1 0%13 fisheries 18 20 2 0%14 mining 37 48 11 0%
manufacturing15 textiles 977 1.406 429 2%16 clothing 570 821 251 1%17 leather 580 763 184 1%18 lumber 256 324 68 0%19 paper, pulp, publishing 442 528 86 0%20 petrochemicals 79 92 13 0%21 chemicals, rubber, and plastics 3.624 4.722 1.098 6%22 iron and steel 734 853 119 1%23 non-ferrous metals 871 1.049 179 1%24 motor vehicles 1.433 2.180 748 4%25 electrical machinery 2.178 2.490 311 2%26 other machinery 7.603 10.668 3.065 16%27 other manufactures 1.775 2.655 880 5%
services28 utilities 37 63 26 0%29 construction 66 110 44 0%30 trade 1.612 2.627 1.015 5%31 transport 4.893 6.931 2.037 11%32 communications 849 1.276 427 2%33 financial and banking services 386 655 269 1%34 insurance 138 209 71 0%35 other business services 8.005 12.245 4.240 22%36 other services 2.134 3.547 1.413 7%
TOTAL 40.032 59.147 19.115 100,0%
Value of Korean imports from EU25 (mio. euro)
Source: Francois and Copenhagen Economics, own model simulations Note: We use the second baseline which includes other Korea-centred FTA. The scenario also include the effect
from other FTAs. In summary, business services is a key sector for EU in Korean trade talks. The total Korean market for importing business services is already large, and is expected to grow a lot due to trade liberalisation. Furthermore, EU is already well-situated in the Korean market and their market share is expected to expand even in the Partial 1 scenario. This is reflected in Figure 4.5 below, where business services is a large bubble (large market size), far to the right (large initial market share), and second on the horizontal axis (large increase in market share). Only processed food is expected to have a large increase in market share in the Partial 1 scenario, and is therefore located high on the vertical axis in Figure 4.5. On the largest Korean import market, electrical machinery, the EU is less well positioned with a market share less than 10 percent, and with a small expected increase in market shares in the Partial 1 scenario.

Economic Impact of a Potential Free Trade Agreement between the European Union and South Korea
Page 45 of 92
Figure 4.5 Changes in market shares for key EU exports to Korea in Partial 1 scenario
other services
other business servicesinsurance
other manufactures
electrical machinerymotor vehicles
non-ferrous metals
iron and steel
chemicals, rubber, and plastics
other processed foods
-5
0
5
10
15
20
25
30
-10 0 10 20 30 40 50 60
Baseline: EU25 share of total Korean imports (percent)
Cha
nge
in p
erce
ntag
e po
ints
from
bas
elin
e PA
RTI
AL
1 Sc
enar
io
Source: Francois and Copenhagen Economics, own simulations Note: The size of the bubble reflects the size of the total Korean import market. The horizontal axis is the baseline EU market share including other FTAs, and the vertical axis is the change in market share as a result of the Partial 1 agreement. The bubbles are colour coded according to main sector. Agriculture is light green, manufacturing sectors are grey, and service sectors are dark green. Market shares, changes in market size and total trade impact for the other scenarios are provided in the appendix.
4.4. Other Macroeconomic Results Wrapping up the results of our analysis, with regards to other macroeconomic variables level, we find that these results are very much in line with the previous discussion. These results are summarized in Tables 4.9 and 4.10 above. Overall these variables follow the general pattern previously pointed out; the impact of a trade agreement is higher for Korea than for the EU for all variables. As could be expected, the change in GDP is of the same size as the change in real income, with a larger gain for Korea than for the EU both in absolute and in relative terms. While there are some effects on worker wages in Korea, there are no substantial differences for skilled and unskilled workers. On EUs part, in all analyzed scenarios, a potential FTA with Korea is not expected to have any measurable impact on wages. Table 4.16 below shows the resulting changes in some selected macroeconomic variables from a full FTA. The relative change in GDP corresponds to relative change in real income, i.e. the 0.3 percent for the EU and 1.6 percent for Korea. Exports from Korea are expected to increase by 20.8 percent, while the corresponding increase in the EU is 1 percent. The increase in wages is also larger in Korea than in the EU (where the effect on wages is small and not distinguishable from zero). Moreover, there is some difference between the effect for unskilled and skilled Korean workers. As can be seen in Table 4.16 below, unskilled workers in Korea are predicted to benefit from higher wage increases than skilled workers as a result of the full FTA.
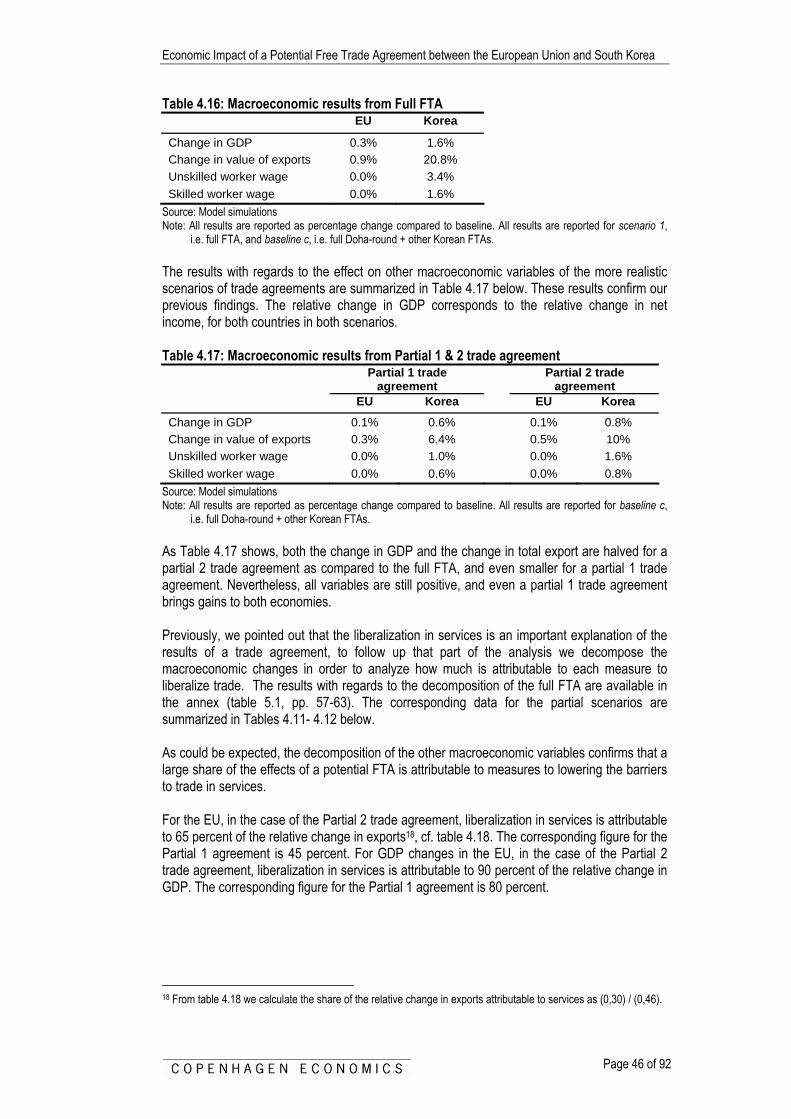
Economic Impact of a Potential Free Trade Agreement between the European Union and South Korea
Page 46 of 92
Table 4.16: Macroeconomic results from Full FTA EU Korea
Change in GDP 0.3% 1.6% Change in value of exports 0.9% 20.8% Unskilled worker wage 0.0% 3.4% Skilled worker wage 0.0% 1.6%
Source: Model simulations Note: All results are reported as percentage change compared to baseline. All results are reported for scenario 1,
i.e. full FTA, and baseline c, i.e. full Doha-round + other Korean FTAs. The results with regards to the effect on other macroeconomic variables of the more realistic scenarios of trade agreements are summarized in Table 4.17 below. These results confirm our previous findings. The relative change in GDP corresponds to the relative change in net income, for both countries in both scenarios. Table 4.17: Macroeconomic results from Partial 1 & 2 trade agreement Partial 1 trade
agreement Partial 2 trade
agreement EU Korea EU Korea
Change in GDP 0.1% 0.6% 0.1% 0.8% Change in value of exports 0.3% 6.4% 0.5% 10% Unskilled worker wage 0.0% 1.0% 0.0% 1.6% Skilled worker wage 0.0% 0.6% 0.0% 0.8%
Source: Model simulations Note: All results are reported as percentage change compared to baseline. All results are reported for baseline c,
i.e. full Doha-round + other Korean FTAs. As Table 4.17 shows, both the change in GDP and the change in total export are halved for a partial 2 trade agreement as compared to the full FTA, and even smaller for a partial 1 trade agreement. Nevertheless, all variables are still positive, and even a partial 1 trade agreement brings gains to both economies. Previously, we pointed out that the liberalization in services is an important explanation of the results of a trade agreement, to follow up that part of the analysis we decompose the macroeconomic changes in order to analyze how much is attributable to each measure to liberalize trade. The results with regards to the decomposition of the full FTA are available in the annex (table 5.1, pp. 57-63). The corresponding data for the partial scenarios are summarized in Tables 4.11- 4.12 below. As could be expected, the decomposition of the other macroeconomic variables confirms that a large share of the effects of a potential FTA is attributable to measures to lowering the barriers to trade in services. For the EU, in the case of the Partial 2 trade agreement, liberalization in services is attributable to 65 percent of the relative change in exports18, cf. table 4.18. The corresponding figure for the Partial 1 agreement is 45 percent. For GDP changes in the EU, in the case of the Partial 2 trade agreement, liberalization in services is attributable to 90 percent of the relative change in GDP. The corresponding figure for the Partial 1 agreement is 80 percent.
18 From table 4.18 we calculate the share of the relative change in exports attributable to services as (0,30) / (0,46).
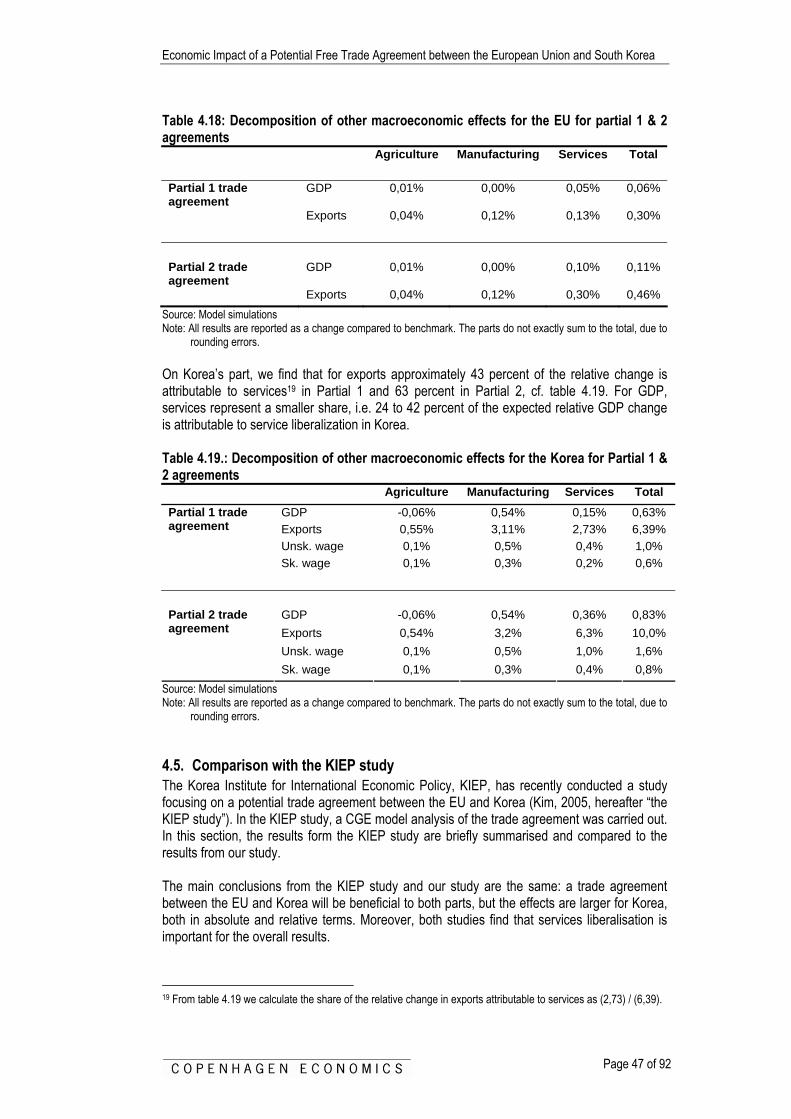
Economic Impact of a Potential Free Trade Agreement between the European Union and South Korea
Page 47 of 92
Table 4.18: Decomposition of other macroeconomic effects for the EU for partial 1 & 2 agreements Agriculture Manufacturing Services Total
Partial 1 trade agreement
GDP 0,01% 0,00% 0,05% 0,06%
Exports 0,04% 0,12% 0,13% 0,30% Partial 2 trade agreement
GDP 0,01% 0,00% 0,10% 0,11%
Exports 0,04% 0,12% 0,30% 0,46% Source: Model simulations Note: All results are reported as a change compared to benchmark. The parts do not exactly sum to the total, due to
rounding errors. On Korea’s part, we find that for exports approximately 43 percent of the relative change is attributable to services19 in Partial 1 and 63 percent in Partial 2, cf. table 4.19. For GDP, services represent a smaller share, i.e. 24 to 42 percent of the expected relative GDP change is attributable to service liberalization in Korea. Table 4.19.: Decomposition of other macroeconomic effects for the Korea for Partial 1 & 2 agreements Agriculture Manufacturing Services Total
GDP -0,06% 0,54% 0,15% 0,63% Exports 0,55% 3,11% 2,73% 6,39% Unsk. wage 0,1% 0,5% 0,4% 1,0%
Partial 1 trade agreement
Sk. wage 0,1% 0,3% 0,2% 0,6%
GDP -0,06% 0,54% 0,36% 0,83% Exports 0,54% 3,2% 6,3% 10,0% Unsk. wage 0,1% 0,5% 1,0% 1,6%
Partial 2 trade agreement
Sk. wage 0,1% 0,3% 0,4% 0,8% Source: Model simulations Note: All results are reported as a change compared to benchmark. The parts do not exactly sum to the total, due to
rounding errors.
4.5. Comparison with the KIEP study The Korea Institute for International Economic Policy, KIEP, has recently conducted a study focusing on a potential trade agreement between the EU and Korea (Kim, 2005, hereafter “the KIEP study”). In the KIEP study, a CGE model analysis of the trade agreement was carried out. In this section, the results form the KIEP study are briefly summarised and compared to the results from our study. The main conclusions from the KIEP study and our study are the same: a trade agreement between the EU and Korea will be beneficial to both parts, but the effects are larger for Korea, both in absolute and relative terms. Moreover, both studies find that services liberalisation is important for the overall results.
19 From table 4.19 we calculate the share of the relative change in exports attributable to services as (2,73) / (6,39).
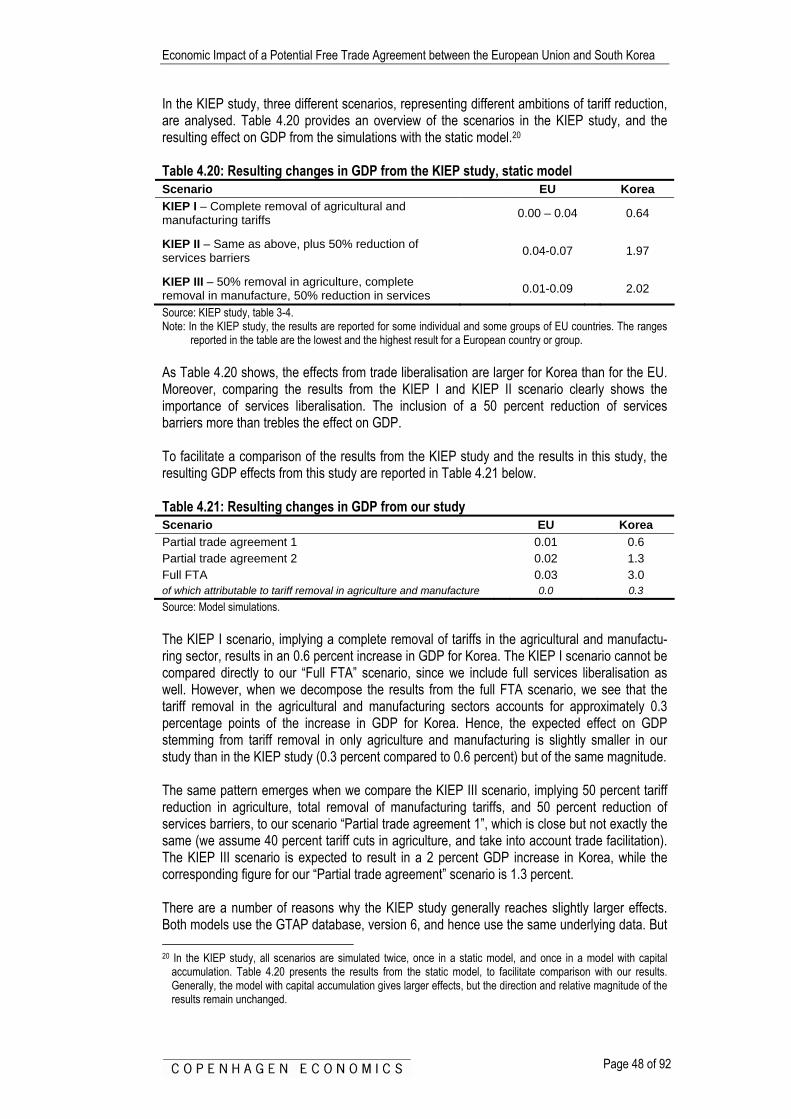
Economic Impact of a Potential Free Trade Agreement between the European Union and South Korea
Page 48 of 92
In the KIEP study, three different scenarios, representing different ambitions of tariff reduction, are analysed. Table 4.20 provides an overview of the scenarios in the KIEP study, and the resulting effect on GDP from the simulations with the static model.20 Table 4.20: Resulting changes in GDP from the KIEP study, static model Scenario EU Korea KIEP I – Complete removal of agricultural and manufacturing tariffs
0.00 – 0.04 0.64
KIEP II – Same as above, plus 50% reduction of services barriers
0.04-0.07 1.97
KIEP III – 50% removal in agriculture, complete removal in manufacture, 50% reduction in services
0.01-0.09 2.02
Source: KIEP study, table 3-4. Note: In the KIEP study, the results are reported for some individual and some groups of EU countries. The ranges
reported in the table are the lowest and the highest result for a European country or group. As Table 4.20 shows, the effects from trade liberalisation are larger for Korea than for the EU. Moreover, comparing the results from the KIEP I and KIEP II scenario clearly shows the importance of services liberalisation. The inclusion of a 50 percent reduction of services barriers more than trebles the effect on GDP. To facilitate a comparison of the results from the KIEP study and the results in this study, the resulting GDP effects from this study are reported in Table 4.21 below. Table 4.21: Resulting changes in GDP from our study Scenario EU Korea Partial trade agreement 1 0.01 0.6 Partial trade agreement 2 0.02 1.3 Full FTA 0.03 3.0 of which attributable to tariff removal in agriculture and manufacture 0.0 0.3 Source: Model simulations. The KIEP I scenario, implying a complete removal of tariffs in the agricultural and manufactu-ring sector, results in an 0.6 percent increase in GDP for Korea. The KIEP I scenario cannot be compared directly to our “Full FTA” scenario, since we include full services liberalisation as well. However, when we decompose the results from the full FTA scenario, we see that the tariff removal in the agricultural and manufacturing sectors accounts for approximately 0.3 percentage points of the increase in GDP for Korea. Hence, the expected effect on GDP stemming from tariff removal in only agriculture and manufacturing is slightly smaller in our study than in the KIEP study (0.3 percent compared to 0.6 percent) but of the same magnitude. The same pattern emerges when we compare the KIEP III scenario, implying 50 percent tariff reduction in agriculture, total removal of manufacturing tariffs, and 50 percent reduction of services barriers, to our scenario “Partial trade agreement 1”, which is close but not exactly the same (we assume 40 percent tariff cuts in agriculture, and take into account trade facilitation). The KIEP III scenario is expected to result in a 2 percent GDP increase in Korea, while the corresponding figure for our “Partial trade agreement” scenario is 1.3 percent. There are a number of reasons why the KIEP study generally reaches slightly larger effects. Both models use the GTAP database, version 6, and hence use the same underlying data. But 20 In the KIEP study, all scenarios are simulated twice, once in a static model, and once in a model with capital
accumulation. Table 4.20 presents the results from the static model, to facilitate comparison with our results. Generally, the model with capital accumulation gives larger effects, but the direction and relative magnitude of the results remain unchanged.

Economic Impact of a Potential Free Trade Agreement between the European Union and South Korea
Page 49 of 92
there are a number of differences between the two models. Importantly, the KIEP model assumes perfect competition and constant returns to scale in all sectors, while the model employed in this study assumes imperfect competition and increasing returns to scale in a number of sectors (for an overview of the model and assumptions about market structure in different sectors, see appendix). Moreover, the KIEP study does not take into account important changes in the trade policy environment that have happened since 2001 (such as China’s accession to WTO and the phase-out of ATC) and changes that are expected to happen in the future (i.e. the potential outcome of the Doha round). This might lead to an overstatement of the potential effects of tariff liberalisation from a free trade agreement, i.e. that some of the gains from tariff reductions that will take place because of other trade policy measures are attributed to the free trade agreement.
Detailed results on sectoral level Turning to the sectoral output results, the main conclusions for the agricultural and manufacturing sectors are the same in the two studies. It should be noted that sectoral output results from the two studies are not directly comparable, since the aggregation of sectors differs. The KIEP study divides the economy in 15 sectors, while our study uses 35 separate sectors. However, despite these different sectoral classifications, some conclusions can be drawn. Both studies find the largest increase in production in Korea in the motor vehicles sector, while the largest decrease is found in the sectors for processed food. For the EU, both studies predict a mirroring pattern: the relatively largest decline is found in the motor vehicles sector, while processed food sectors are expected to grow. Even though the pattern of growing and declining agricultural and manufacturing sectors is the same, there are some exceptions for which the KIEP study and our study reaches different conclusions. The iron and steel sector is in the KIEP study expected to decline in Korea, while our study predicts a growth in this sector in Korea, and a decline within the EU. There is an interesting difference to note in the effects for the services sectors in the two studies. Both studies find that the services sectors in the EU generally are expected to grow. However, in the KIEP study, the services sectors in Korea are also expected to grow a result of the services liberalisation, but our study reaches the conclusion that the services sectors in Korea are expected to decline. We should moreover note that both studies assume higher initial barriers in the Korean services sectors than in their European counterparts. It should furthermore be noted that the sectoral effects are generally of a larger magnitude in our study than in the KIEP study, as is the case with predicted increases in trade flows. The reason behind this is the different model specification, with different assumptions about market structure.
Economic Impact of a Potential Free Trade Agreement between the European Union and South Korea
Page 50 of 92
Chapter 5 Conclusions In this short-study, we explore the economic effects of potential measures to liberalize trade between the European Union, EU 25 and Korea. In so doing, we have a Computable General Equilibrium Model, CGE Model, based on the most recent version of the GTAP data base, i.e. GTAP 6.2, which is benchmarked to data from 2001. Our CGE model follows recent research in trade theory in taking different in underlying industry specific market structures and elasticities into account. Furthermore, the model incorporates estimated non-tariff trade barriers to trade in services, stemming from industry-specific gravity equation, which enhances the analysis of the service sector. The results are compared to a baseline which incorporates recent developments in the trade policy environment, i.e. Chinas accession to WTO and the phase out of ATC, as well as an expected outcome of the Doha round21. The analysis takes agricultural liberalization, liberalization in industrial tariffs, and liberalization in services trade as well as trade facilitation measures into account. Our results show that all analyzed levels of liberalization lead to economic benefits for both economies. Both economies show an increase in real income, output and GDP. The effects are bigger, not only in relative, but also in absolute terms for the Korean Economy. This was expected, since Korea is ex-ante more protective than the EU. The same pattern emerges when focusing on expected change in sectoral output across each economy as an effect of increased trade taking place. The biggest contractions in each economy are expected to arise in sectors which are ex-ante subject to the highest levels of domestic import protection. On a sectoral level, we find that the greatest increases in EU will be in other business services, communications, transport and other processed foods. The largest EU decreases in output are expected in motor vehicles and electrical machinery. Total output from the EU economy will increase in all three scenarios in this study. In effect, this causes an expansion in the corresponding sector in the other economy as a result of gaining further access to the foreign market. In terms of changes across sectors, the EU service sector will expand, as will the Korean manufacturing sector. For Korea, we predict increase in motor vehicles and electrical machinery, and decreasing output in processed foods, communications and other business services. Total output from the Korean economy will increase in all three scenarios in this study. The effect on output change in service sectors are of course sensitive to the degree of liberalization in services, but this is also shown to be the case in the manufacturing sectors, electrical machinery in particular. Interestingly, the expansion in the Korean manufacturing sector is, indirectly through the use of services as intermediate inputs in production, shown to be attributable to the expansion of European services.
21 The assumptions with regards to expected outcome of the Doha-round was provided by DG trade.

Economic Impact of a Potential Free Trade Agreement between the European Union and South Korea
Page 51 of 92
A key finding is that the overall outcome of trade liberalization is very much dependent on the level trade liberalization taking place in the service sector .Focusing on the decomposition of the expansion in production as a result of different trade liberalization measures we find that a very large portion is attributable to increased trade in services. In summary: services are very important. Agriculture is not. Agriculture account for less than 3 percent of bilateral trade. Trade facilitation have small, but positive effects, whereas lowering tariffs for manufactured goods gives some effect, but not a lot since tariffs not very high to begin with.
Economic Impact of a Potential Free Trade Agreement between the European Union and South Korea
Page 52 of 92
References Data: Eurostat (2006), various tables.
Korea International Trade Association (KITA) (2006), Statistics on Korean Trade, available on-line at http://global.kita.net/
Korea Ministry of Finance and Economy (2006), Major Economic Indicators, May 18, 2006.
Korea Ministry of Commerce, Industry, and Energy (2006), FDI Flows by Country, available at http://english.mocie.go.kr/index.jsp
WTO (2006), Regional Trade Agreements Notified to the GATT/WTO and in Force, available at http://www.wto.org/english/tratop_e/region_e/regfac_e.htm
Schott, J., S. Bradford, and T. Moll (2006), “Negotiating the Korea – United States Free Trade Agreement”, Policy Brief in International Economics, Number PB06-4, Institute for International Economics.
IMF (2006), World Economic Outlook Database, accessible from http://www.imf.org/external/pubs/ft/weo/2006/01/data/dbginim.cfm
UN (2006), Comtrade database, accessible from http://unstats.un.org/unsd/comtrade
Literature: Anderson, James E. (1979) A Theoretical Foundation for the Gravity Equation, The American Economic
Review 69, 106- 116.
Anderson, J.E. and E. van Wincoop ( 2001) Gravity with Gravitas: a Solution to the Border Puzzle, NBER working paper 8079.
Antweiler, W. and D. Trefler (2002) Increasing Returns and All That: A View from Trade, The American Economic Review 92:1, 93-119.
Dimaranan, B. V. and McDougall, R. A. Editors (2006, forthcoming), Global Trade, Assistance, and Production: The GTAP 6 Data Base, Center for Global Trade Analysis, Purdue University.
Ethier, W. J. (1982) National and International Returns to Scale in the Modern Theory of International Trade, The American Economic Review 72, 389-405.
Francois, J. H. and B. J. Mc Donald (1996) Liberalization and Capital Accumulation in the GTAP model, GTAP Technical Paper No.7.
Francois, J. (1998), Scale Economies and Imperfect Competition in the GTAP model, GTAP Technical Paper No. 14.
Francois, J., van Meijl, H. and F. von Tongeren (2005) Trade Liberalization and Developing Countries under the Doha Round, Economic Policy 42, 349-391.
Francois, J., van Meijl, H. and F. von Tongeren (2002) Economic Benefits of the Doha Round for the Netherlands, Netherlands: LEI-Wageningen University and Research Center, December.
Helpman, E. and P. R. Krugman (1989), Trade policy and market structure, Cambridge, MA; MIT Press.
Hertel, T. W. and M.E. Tsigas (1997) Structure of GTAP, in T.W. Hertel (ed.) Global Trade Analysis: Modeling and Applications, Cambridge University Press.
Heungchong Kim (2005), Korea-EU FTA: Prospects for the Future, mimeo.
Heungchong Kim (2005), An analysis of the Economic effects of a Korea-EU FTA. KIEP-study, Korea Institute for International Economic Policy.
Krugman,P. R. (1979), Increasing Returns, Monopolistic Competition and International Trade, Journal of International Economics 9, 469-479.
Krugman,P. R. (1980), Scale economies, Product Differentiation and the Pattern of Trade, The American Economic Review 10, 950-959.
OECD (2004), 2004 Economic Review – Korea, document ECO/EDR(2004)8/REV1, 13 May 2004.

Economic Impact of a Potential Free Trade Agreement between the European Union and South Korea
Page 53 of 92
Oliviera Martins, J., S. Scarpetta and D. Pilat (1996), Mark-Up Ratios in manufacturing Industries: Estimates for 14 OECD Countries”, OECD Economics Department working Papers, No. 162, OECD Publishing.
Park, Soon-Shan (2002) Measuring Tariff Equivalents in Cross-Border Trade in Services, KIEP Working paper 02-15, Korea Institute for International Economic Policy.
Schott, Jeffrey J, Scott C. Bradford and Thomas Moll (2006) Negotiating the Korea-United States Free trade Agreement, Policy Brief O6-4, Washington Institute for International Economics.
WTO (World Trade Organization), (2004), Trade Policy Review: Korea, Geneva.

Economic Impact of a Potential Free Trade Agreement between the European Union and South Korea
Page 54 of 92
Appendices Table of Contents
Appendix I: Scenario definitions and baseline ........................................................ 55
Appendix II: Detailed results ..................................................................................... 57 Results scenario Full FTA.....................................................................................................57 Results scenario Partial 1 FTA .............................................................................................63 Results scenario Partial 2 FTA .............................................................................................71 Results on Korean imports by sector....................................................................................78
Technical Annex: An Overview of the Computational Model ................................. 81
Economic Impact of a Potential Free Trade Agreement between the European Union and South Korea
Page 55 of 92
Appendix I: Scenario definitions and baseline

Economic Impact of a Potential Free Trade Agreement between the European Union and South Korea
Page 56 of 92
Scenario I Scenario II Scenario IIILikely agreement o limited bi-lateral tariff reductions in food (amounts to between 96% and 97% of tariff lines, while excluding sensitive, highly protected food sectors. Excludes less than 1% of total trade, and 20% of agricultural tariff lines) o full bilaterael non-food tariff reductions o 25% services liberalization
Ambitious agreement o limited bi-lateral tariff reductions in food (amounts to between 96% and 97% of tariff lines, while excluding sensitive, highly protected food sectors. Excludes less than 1% of total trade, and 20% of agricultural tariff lines) o full bilaterael non-food tariff reductions o 50% services liberalization
Full free trade o Full agriculture liberalization o full bilaterael non-food tariff reductions o 100% services liberalization o Trade facilitation yielding a 1% cost saving on goods traded
BASELINE
Uruguay Round and related o ATC phaseout o China accessionDoha Round o 40% cut to agriculture tariff lines o Swiss formula for manufactures - maximum tariff of 10 for industrial countries (ICs) - 100% duty free access for LDCs by ICs - LDCs and non-WTO Members exempt from any reductions - maximim tariff of 18 for DCs under Swiss formula - sensitive products with half of swiss formula 18 reductions for DCs o 3% cost reduction for services trade o 1% facilitation trading cost reduction
Various Korea-centered FTAs (limited agriculture, 25% services, full manufacturing)o Korea-USAo Korea-Canadao Korea-Chinao Korea-Indiao Korea-Japano Korea-EFTA o Korea-ASEAN
Database benchmarked to 2001
Source: Francois & Copenhagen Economics Note: The definition of baselines and scenarios are agreed by DG Trade.

Economic Impact of a Potential Free Trade Agreement between the European Union and South Korea
Page 57 of 92
Appendix II: Detailed results
5.1. Results scenario Full FTA Real Income Effects, billions of 2001 eurosFULL FTA, 2001 post-Doha baseline, with other Korean FTAs
food non-food food non-food services TOTALEU25 0,0 0,4 0,1 0,2 3,9 4,7Korea 0,0 0,5 0,0 1,3 8,7 10,5Other 0,0 0,0 0,0 -0,5 1,7 1,2of which 0,0 0,0 0,0 0,0 0,0 0,0LDCs 0,0 0,0 0,0 0,0 0,1 0,0Japan 0,0 0,0 0,0 -0,1 -0,2 -0,3India 0,0 0,0 0,0 0,0 -0,1 -0,1NAFTA 0,0 0,1 0,0 -0,1 1,3 1,4EFTA 0,0 0,0 0,0 0,0 0,0 0,0note: based on equivalent variation
Trade facilitation Import protection
Real Income Effects, percent of national incomeFULL FTA, 2001 post-Doha baseline, with other Korean FTAs
food non-food food non-food services TOTALEU25 0,0 0,0 0,0 0,0 0,0 0,06Korea 0,0 0,1 0,0 0,3 2,0 2,44Otherof whichLDCsJapan 0,0 0,0 0,0 0,0 0,0 -0,01India 0,0 0,0 0,0 0,0 0,0 -0,02NAFTAEFTA 0,0 0,0 0,0 0,0 0,0 -0,01note: based on equivalent variation
Trade facilitation Import protection
GDP, % change in valueFULL FTA, 2001 post-Doha baseline, without other Korean FTAs
food non-food food non-food services TOTALEU25 0,0 0,0 0,0 0,0 0,2 0,3Korea 0,0 0,2 -0,1 0,6 0,9 1,6Otherof whichLDCsJapanIndiaNAFTAEFTAnote: based on fixed quantity GDP index
Trade facilitation Import protection
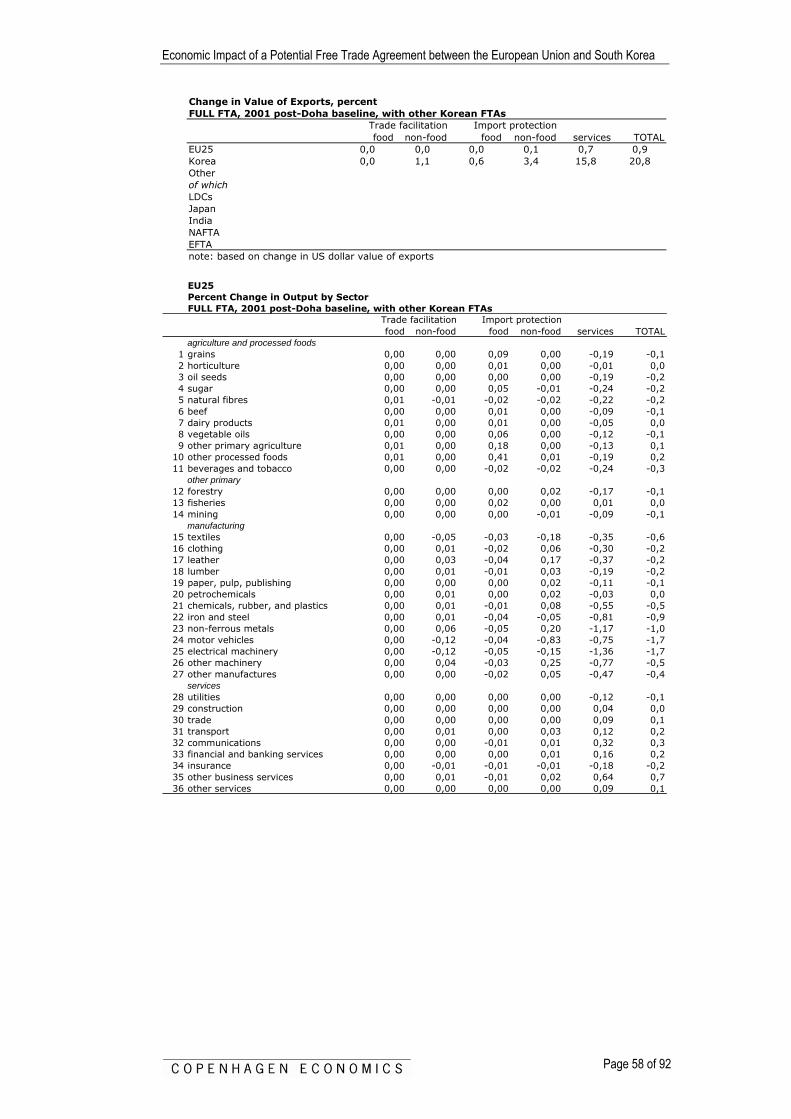
Economic Impact of a Potential Free Trade Agreement between the European Union and South Korea
Page 58 of 92
Change in Value of Exports, percentFULL FTA, 2001 post-Doha baseline, with other Korean FTAs
food non-food food non-food services TOTALEU25 0,0 0,0 0,0 0,1 0,7 0,9Korea 0,0 1,1 0,6 3,4 15,8 20,8Otherof whichLDCsJapanIndiaNAFTAEFTAnote: based on change in US dollar value of exports
Trade facilitation Import protection
EU25Percent Change in Output by SectorFULL FTA, 2001 post-Doha baseline, with other Korean FTAs
food non-food food non-food services TOTALagriculture and processed foods
1 grains 0,00 0,00 0,09 0,00 -0,19 -0,12 horticulture 0,00 0,00 0,01 0,00 -0,01 0,03 oil seeds 0,00 0,00 0,00 0,00 -0,19 -0,24 sugar 0,00 0,00 0,05 -0,01 -0,24 -0,25 natural fibres 0,01 -0,01 -0,02 -0,02 -0,22 -0,26 beef 0,00 0,00 0,01 0,00 -0,09 -0,17 dairy products 0,01 0,00 0,01 0,00 -0,05 0,08 vegetable oils 0,00 0,00 0,06 0,00 -0,12 -0,19 other primary agriculture 0,01 0,00 0,18 0,00 -0,13 0,1
10 other processed foods 0,01 0,00 0,41 0,01 -0,19 0,211 beverages and tobacco 0,00 0,00 -0,02 -0,02 -0,24 -0,3
other primary12 forestry 0,00 0,00 0,00 0,02 -0,17 -0,113 fisheries 0,00 0,00 0,02 0,00 0,01 0,014 mining 0,00 0,00 0,00 -0,01 -0,09 -0,1
manufacturing15 textiles 0,00 -0,05 -0,03 -0,18 -0,35 -0,616 clothing 0,00 0,01 -0,02 0,06 -0,30 -0,217 leather 0,00 0,03 -0,04 0,17 -0,37 -0,218 lumber 0,00 0,01 -0,01 0,03 -0,19 -0,219 paper, pulp, publishing 0,00 0,00 0,00 0,02 -0,11 -0,120 petrochemicals 0,00 0,01 0,00 0,02 -0,03 0,021 chemicals, rubber, and plastics 0,00 0,01 -0,01 0,08 -0,55 -0,522 iron and steel 0,00 0,01 -0,04 -0,05 -0,81 -0,923 non-ferrous metals 0,00 0,06 -0,05 0,20 -1,17 -1,024 motor vehicles 0,00 -0,12 -0,04 -0,83 -0,75 -1,725 electrical machinery 0,00 -0,12 -0,05 -0,15 -1,36 -1,726 other machinery 0,00 0,04 -0,03 0,25 -0,77 -0,527 other manufactures 0,00 0,00 -0,02 0,05 -0,47 -0,4
services28 utilities 0,00 0,00 0,00 0,00 -0,12 -0,129 construction 0,00 0,00 0,00 0,00 0,04 0,030 trade 0,00 0,00 0,00 0,00 0,09 0,131 transport 0,00 0,01 0,00 0,03 0,12 0,232 communications 0,00 0,00 -0,01 0,01 0,32 0,333 financial and banking services 0,00 0,00 0,00 0,01 0,16 0,234 insurance 0,00 -0,01 -0,01 -0,01 -0,18 -0,235 other business services 0,00 0,01 -0,01 0,02 0,64 0,736 other services 0,00 0,00 0,00 0,00 0,09 0,1
Trade facilitation Import protection

Economic Impact of a Potential Free Trade Agreement between the European Union and South Korea
Page 59 of 92
KOREAPercent Change in Output by SectorFULL FTA, 2001 post-Doha baseline, with other Korean FTAs
food non-food food non-food services TOTALagriculture and processed foods
1 grains 0,01 -0,01 0,21 -0,11 -0,55 -0,452 horticulture 0,00 0,03 0,05 0,03 0,02 0,133 oil seeds 0,17 -0,22 -0,01 -0,87 -0,92 -1,864 sugar -0,01 -0,14 -1,04 -0,57 0,37 -1,405 natural fibres 0,00 0,00 0,47 -0,02 -0,39 0,066 beef 0,01 -0,26 -1,36 -0,97 -0,12 -2,707 dairy products -0,24 -0,08 0,07 -0,36 0,76 0,168 vegetable oils 0,17 -0,24 -1,09 -0,80 0,75 -1,229 other primary agriculture -0,01 -0,23 -1,09 -0,81 -0,12 -2,25
10 other processed foods 0,00 -0,47 -3,69 -1,72 0,09 -5,7911 beverages and tobacco 0,13 -1,21 2,45 -4,08 3,00 0,28
other primary12 forestry 0,00 -0,19 -0,35 -0,70 -0,58 -1,8213 fisheries 0,00 -0,08 -0,53 -0,32 0,15 -0,7814 mining 0,00 -0,54 0,04 -1,60 0,15 -1,94
manufacturing15 textiles 0,01 0,00 0,10 1,55 -0,73 0,9316 clothing 0,00 0,22 0,02 2,23 0,39 2,8717 leather 0,07 -0,21 0,96 -0,25 -0,02 0,5518 lumber 0,00 -0,36 0,00 -1,31 0,96 -0,7119 paper, pulp, publishing 0,00 -0,46 -0,10 -1,85 -2,35 -4,7820 petrochemicals 0,00 -0,34 -0,02 -0,70 2,75 1,6921 chemicals, rubber, and plastics 0,00 -0,79 0,11 -1,57 4,97 2,7322 iron and steel -0,02 -1,27 0,68 1,35 17,39 18,1223 non-ferrous metals -0,02 -0,91 0,44 -3,28 14,45 10,6724 motor vehicles -0,01 1,37 0,55 15,67 11,21 28,8025 electrical machinery -0,01 3,00 0,24 2,25 21,58 27,0626 other machinery -0,01 0,08 0,26 -2,43 12,73 10,6227 other manufactures -0,01 -0,78 0,17 -2,17 4,49 1,71
services28 utilities 0,00 -0,21 0,00 -0,37 1,09 0,5029 construction 0,00 0,08 -0,04 0,23 0,26 0,5430 trade 0,00 0,03 0,02 -0,11 -2,91 -2,9631 transport 0,00 -0,24 0,01 -0,79 5,09 4,0732 communications 0,00 -0,09 -0,03 -0,45 -6,08 -6,6533 financial and banking services 0,00 -0,01 0,00 -0,08 -2,08 -2,1734 insurance 0,00 -0,04 -0,05 -0,23 0,12 -0,1935 other business services 0,00 -0,37 -0,01 -1,36 -21,34 -23,0836 other services 0,00 -0,02 -0,03 -0,19 -2,13 -2,36
Trade facilitation Import protection
REAL WAGE EFFECTS, percent change
food non-food food non-food services TOTALKorea
unskilled workers 0,0 0,1 0,1 0,6 2,7 3,4skilled workers 0,0 0,1 0,1 0,3 1,1 1,6
EU25unskilled workers 0,0 0,0 0,0 0,0 -0,1 0,0skilled workers 0,0 0,0 0,0 0,0 -0,1 0,0
Trade facilitation Import protection
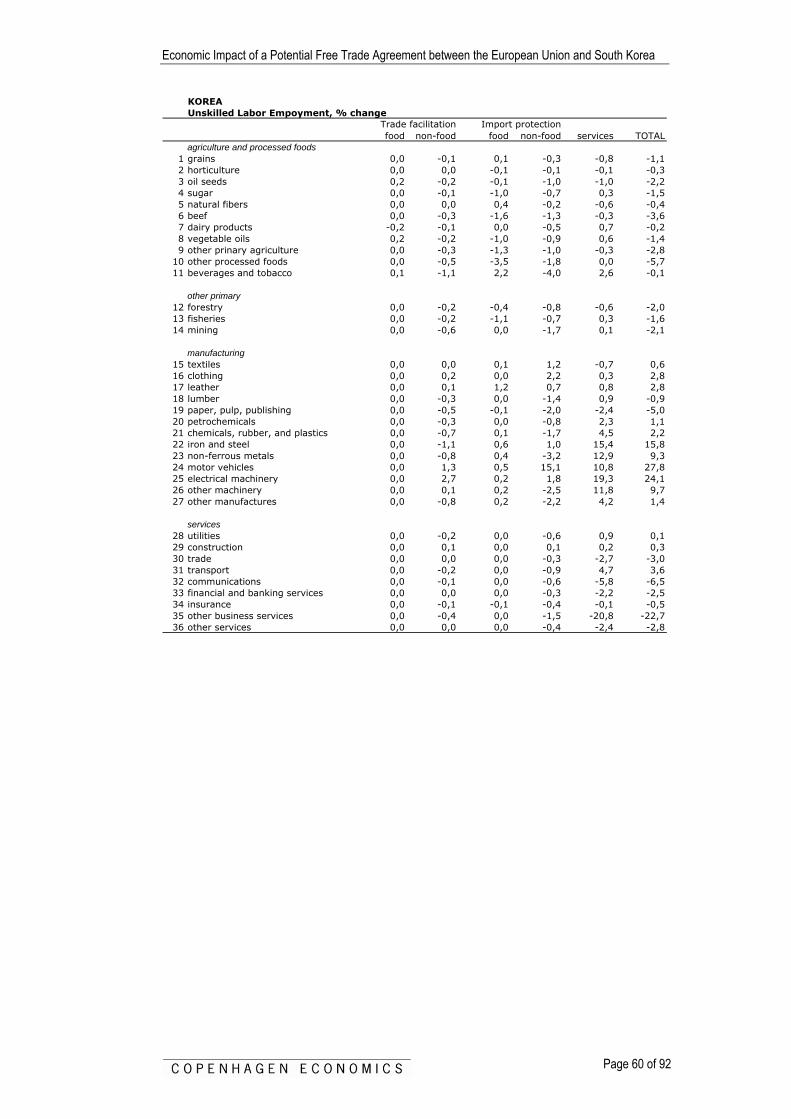
Economic Impact of a Potential Free Trade Agreement between the European Union and South Korea
Page 60 of 92
KOREAUnskilled Labor Empoyment, % change
food non-food food non-food services TOTALagriculture and processed foods
1 grains 0,0 -0,1 0,1 -0,3 -0,8 -1,12 horticulture 0,0 0,0 -0,1 -0,1 -0,1 -0,33 oil seeds 0,2 -0,2 -0,1 -1,0 -1,0 -2,24 sugar 0,0 -0,1 -1,0 -0,7 0,3 -1,55 natural fibers 0,0 0,0 0,4 -0,2 -0,6 -0,46 beef 0,0 -0,3 -1,6 -1,3 -0,3 -3,67 dairy products -0,2 -0,1 0,0 -0,5 0,7 -0,28 vegetable oils 0,2 -0,2 -1,0 -0,9 0,6 -1,49 other prinary agriculture 0,0 -0,3 -1,3 -1,0 -0,3 -2,8
10 other processed foods 0,0 -0,5 -3,5 -1,8 0,0 -5,711 beverages and tobacco 0,1 -1,1 2,2 -4,0 2,6 -0,1
other primary
12 forestry 0,0 -0,2 -0,4 -0,8 -0,6 -2,013 fisheries 0,0 -0,2 -1,1 -0,7 0,3 -1,614 mining 0,0 -0,6 0,0 -1,7 0,1 -2,1
manufacturing15 textiles 0,0 0,0 0,1 1,2 -0,7 0,616 clothing 0,0 0,2 0,0 2,2 0,3 2,817 leather 0,0 0,1 1,2 0,7 0,8 2,818 lumber 0,0 -0,3 0,0 -1,4 0,9 -0,919 paper, pulp, publishing 0,0 -0,5 -0,1 -2,0 -2,4 -5,020 petrochemicals 0,0 -0,3 0,0 -0,8 2,3 1,121 chemicals, rubber, and plastics 0,0 -0,7 0,1 -1,7 4,5 2,222 iron and steel 0,0 -1,1 0,6 1,0 15,4 15,823 non-ferrous metals 0,0 -0,8 0,4 -3,2 12,9 9,324 motor vehicles 0,0 1,3 0,5 15,1 10,8 27,825 electrical machinery 0,0 2,7 0,2 1,8 19,3 24,126 other machinery 0,0 0,1 0,2 -2,5 11,8 9,727 other manufactures 0,0 -0,8 0,2 -2,2 4,2 1,4
services28 utilities 0,0 -0,2 0,0 -0,6 0,9 0,129 construction 0,0 0,1 0,0 0,1 0,2 0,330 trade 0,0 0,0 0,0 -0,3 -2,7 -3,031 transport 0,0 -0,2 0,0 -0,9 4,7 3,632 communications 0,0 -0,1 0,0 -0,6 -5,8 -6,533 financial and banking services 0,0 0,0 0,0 -0,3 -2,2 -2,534 insurance 0,0 -0,1 -0,1 -0,4 -0,1 -0,535 other business services 0,0 -0,4 0,0 -1,5 -20,8 -22,736 other services 0,0 0,0 0,0 -0,4 -2,4 -2,8
Trade facilitation Import protection

Economic Impact of a Potential Free Trade Agreement between the European Union and South Korea
Page 61 of 92
KOREASkilled Labor Empoyment, % change
food non-food food non-food services TOTALagriculture and processed foods
1 grains 0,0 0,0 0,1 -0,2 -0,2 -0,32 horticulture 0,0 0,0 0,0 -0,1 0,2 0,13 oil seeds 0,1 -0,2 -0,1 -0,7 -0,5 -1,34 sugar 0,0 -0,1 -0,5 -0,3 0,6 -0,25 natural fibers 0,0 0,0 0,3 -0,1 -0,2 0,06 beef 0,0 -0,2 -0,9 -0,6 0,2 -1,47 dairy products -0,1 0,0 0,0 -0,2 0,8 0,48 vegetable oils 0,1 -0,1 -0,4 -0,3 0,8 0,19 other prinary agriculture 0,0 -0,2 -0,9 -0,7 0,0 -1,8
10 other processed foods 0,0 -0,2 -1,3 -0,6 0,5 -1,611 beverages and tobacco 0,0 -0,4 0,7 -1,2 1,4 0,6
other primary12 forestry 0,0 -0,2 -0,3 -0,6 -0,3 -1,213 fisheries 0,0 -0,1 -0,8 -0,5 0,4 -1,014 mining 0,0 -0,4 0,0 -1,3 0,3 -1,4
manufacturing
15 textiles 0,0 0,0 0,0 0,5 0,3 0,816 clothing 0,0 0,1 0,0 0,8 0,7 1,617 leather 0,0 -0,1 0,3 0,0 0,5 0,818 lumber 0,0 -0,1 0,0 -0,4 0,8 0,319 paper, pulp, publishing 0,0 -0,2 0,0 -0,7 -0,4 -1,220 petrochemicals 0,0 -0,1 0,0 -0,2 1,3 1,021 chemicals, rubber, and plastics 0,0 -0,2 0,0 -0,5 2,0 1,422 iron and steel 0,0 -0,4 0,2 0,4 6,0 6,223 non-ferrous metals 0,0 -0,3 0,1 -1,1 5,2 4,024 motor vehicles 0,0 0,4 0,2 4,6 3,7 8,925 electrical machinery 0,0 0,9 0,1 0,7 7,0 8,726 other machinery 0,0 0,0 0,1 -0,8 4,8 4,127 other manufactures 0,0 -0,3 0,1 -0,7 2,1 1,1
services28 utilities 0,0 -0,1 0,0 -0,1 0,8 0,729 construction 0,0 0,0 0,0 0,1 0,6 0,730 trade 0,0 0,0 0,0 0,0 -0,3 -0,331 transport 0,0 -0,1 0,0 -0,2 2,0 1,832 communications 0,0 0,0 0,0 -0,2 -1,6 -1,833 financial and banking services 0,0 0,0 0,0 0,0 -0,3 -0,334 insurance 0,0 0,0 0,0 0,0 0,5 0,435 other business services 0,0 -0,1 0,0 -0,5 -7,9 -8,636 other services 0,0 0,0 0,0 -0,1 -0,3 -0,4
Trade facilitation Import protection

Economic Impact of a Potential Free Trade Agreement between the European Union and South Korea
Page 62 of 92
EU25Unskilled Labor Empoyment, % change
food non-food food non-food services TOTALagriculture and processed foods
1 grains 0,0 0,0 0,1 0,0 -0,2 -0,12 horticulture 0,0 0,0 0,0 0,0 0,0 0,03 oil seeds 0,0 0,0 0,0 0,0 -0,2 -0,24 sugar 0,0 0,0 0,1 0,0 -0,2 -0,15 natural fibers 0,0 0,0 0,0 0,0 -0,2 -0,26 beef 0,0 0,0 0,0 0,0 -0,1 0,07 dairy products 0,0 0,0 0,0 0,0 0,0 0,08 vegetable oils 0,0 0,0 0,1 0,0 0,0 0,19 other prinary agriculture 0,0 0,0 0,2 0,0 -0,1 0,1
10 other processed foods 0,0 0,0 0,4 0,0 -0,1 0,311 beverages and tobacco 0,0 0,0 0,0 0,0 -0,1 -0,1
other primary
12 forestry 0,0 0,0 0,0 0,0 -0,2 -0,113 fisheries 0,0 0,0 0,0 0,0 0,0 0,114 mining 0,0 0,0 0,0 0,0 -0,1 -0,1
manufacturing15 textiles 0,0 -0,1 0,0 -0,2 -0,3 -0,516 clothing 0,0 0,0 0,0 0,1 -0,2 -0,217 leather 0,0 0,0 -0,2 0,1 0,1 0,018 lumber 0,0 0,0 0,0 0,0 -0,1 -0,119 paper, pulp, publishing 0,0 0,0 0,0 0,0 0,0 0,020 petrochemicals 0,0 0,0 0,0 0,0 0,1 0,221 chemicals, rubber, and plastics 0,0 0,0 0,0 0,1 -0,5 -0,422 iron and steel 0,0 0,0 0,0 0,0 -0,8 -0,823 non-ferrous metals 0,0 0,1 -0,1 0,2 -1,1 -0,924 motor vehicles 0,0 -0,1 0,0 -0,9 -0,7 -1,825 electrical machinery 0,0 -0,1 -0,1 -0,2 -1,4 -1,826 other machinery 0,0 0,0 0,0 0,3 -0,8 -0,527 other manufactures 0,0 0,0 0,0 0,1 -0,4 -0,3
services28 utilities 0,0 0,0 0,0 0,0 0,0 0,129 construction 0,0 0,0 0,0 0,0 0,1 0,230 trade 0,0 0,0 0,0 0,0 0,2 0,231 transport 0,0 0,0 0,0 0,0 0,2 0,332 communications 0,0 0,0 0,0 0,0 0,5 0,533 financial and banking services 0,0 0,0 0,0 0,0 0,3 0,334 insurance 0,0 0,0 0,0 0,0 -0,1 -0,135 other business services 0,0 0,0 0,0 0,0 0,8 0,836 other services 0,0 0,0 0,0 0,0 0,2 0,2
Trade facilitation Import protection

Economic Impact of a Potential Free Trade Agreement between the European Union and South Korea
Page 63 of 92
EU25Skilled Labor Empoyment, % change
food non-food food non-food services TOTALagriculture and processed foods
1 grains 0,0 0,0 0,1 0,0 -0,1 -0,12 horticulture 0,0 0,0 0,0 0,0 0,0 0,03 oil seeds 0,0 0,0 0,0 0,0 -0,2 -0,14 sugar 0,0 0,0 0,0 0,0 -0,1 -0,15 natural fibers 0,0 0,0 0,0 0,0 -0,2 -0,26 beef 0,0 0,0 0,0 0,0 -0,1 0,07 dairy products 0,0 0,0 0,0 0,0 0,0 0,08 vegetable oils 0,0 0,0 0,0 0,0 0,0 0,09 other prinary agriculture 0,0 0,0 0,1 0,0 -0,1 0,0
10 other processed foods 0,0 0,0 0,2 0,0 -0,1 0,111 beverages and tobacco 0,0 0,0 0,0 0,0 -0,1 -0,1
other primary12 forestry 0,0 0,0 0,0 0,0 -0,1 -0,113 fisheries 0,0 0,0 0,0 0,0 0,0 0,014 mining 0,0 0,0 0,0 0,0 -0,1 -0,1
manufacturing15 textiles 0,0 0,0 0,0 -0,1 -0,1 -0,216 clothing 0,0 0,0 0,0 0,0 -0,1 -0,117 leather 0,0 0,0 0,0 0,1 -0,1 -0,118 lumber 0,0 0,0 0,0 0,0 -0,1 -0,119 paper, pulp, publishing 0,0 0,0 0,0 0,0 0,0 0,020 petrochemicals 0,0 0,0 0,0 0,0 0,0 0,021 chemicals, rubber, and plastics 0,0 0,0 0,0 0,0 -0,2 -0,222 iron and steel 0,0 0,0 0,0 0,0 -0,3 -0,323 non-ferrous metals 0,0 0,0 0,0 0,1 -0,4 -0,424 motor vehicles 0,0 0,0 0,0 -0,3 -0,3 -0,725 electrical machinery 0,0 0,0 0,0 -0,1 -0,6 -0,726 other machinery 0,0 0,0 0,0 0,1 -0,3 -0,227 other manufactures 0,0 0,0 0,0 0,0 -0,2 -0,2
services28 utilities 0,0 0,0 0,0 0,0 0,0 0,029 construction 0,0 0,0 0,0 0,0 0,0 0,030 trade 0,0 0,0 0,0 0,0 0,0 0,031 transport 0,0 0,0 0,0 0,0 0,0 0,032 communications 0,0 0,0 0,0 0,0 0,1 0,133 financial and banking services 0,0 0,0 0,0 0,0 0,1 0,134 insurance 0,0 0,0 0,0 0,0 -0,1 -0,135 other business services 0,0 0,0 0,0 0,0 0,2 0,236 other services 0,0 0,0 0,0 0,0 0,0 0,0
Trade facilitation Import protection
5.2. Results scenario Partial 1 FTA
Real Income Effects, billions of 2001 eurosPartial 1 FTA, 2001 post-Doha baseline, with other Korean FTAs
food non-food services TOTALEU25 0,1 0,3 0,8 1,2Korea 0,0 1,2 1,3 2,5Other 0,0 -0,4 0,3 -0,1of which 0,0 0,0 0,0 0,0LDCs 0,0 0,0 0,0 0,0Japan 0,0 -0,1 0,0 -0,1India 0,0 0,0 0,0 0,0NAFTA 0,0 -0,1 0,2 0,2EFTA 0,0 0,0 0,0 0,0note: based on equivalent variation
Import protection
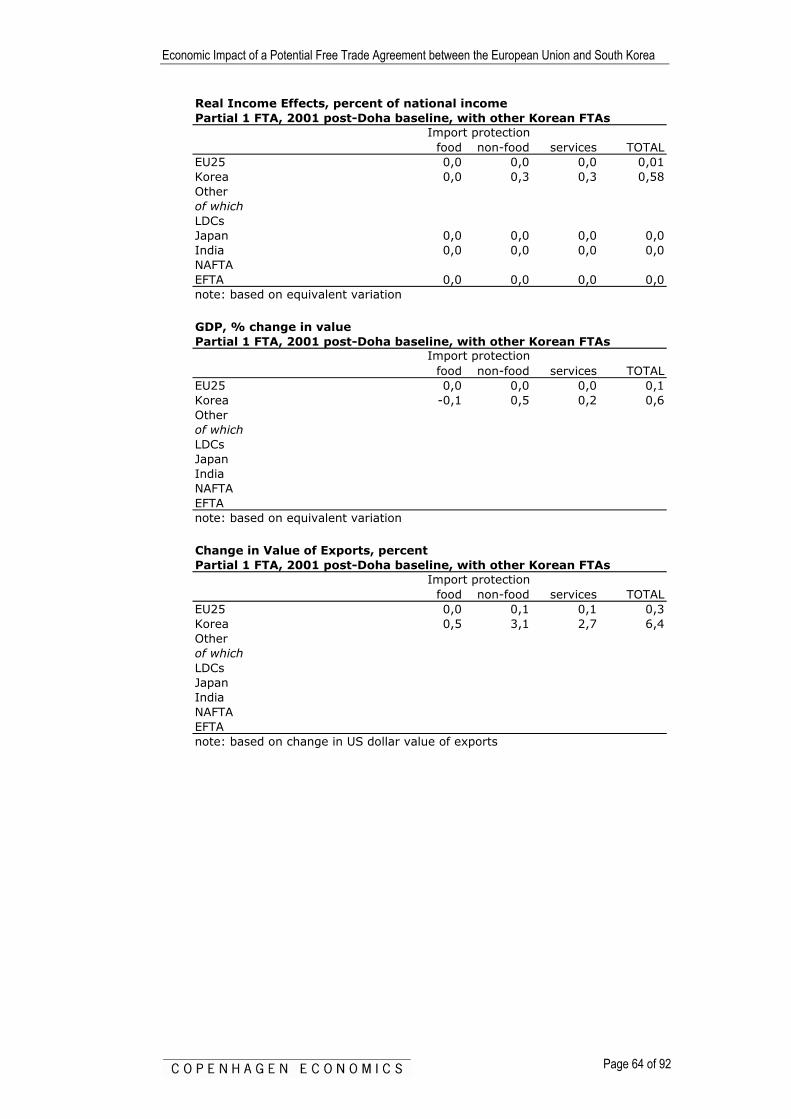
Economic Impact of a Potential Free Trade Agreement between the European Union and South Korea
Page 64 of 92
Real Income Effects, percent of national incomePartial 1 FTA, 2001 post-Doha baseline, with other Korean FTAs
food non-food services TOTALEU25 0,0 0,0 0,0 0,01Korea 0,0 0,3 0,3 0,58Otherof whichLDCsJapan 0,0 0,0 0,0 0,0India 0,0 0,0 0,0 0,0NAFTAEFTA 0,0 0,0 0,0 0,0note: based on equivalent variation
Import protection
GDP, % change in valuePartial 1 FTA, 2001 post-Doha baseline, with other Korean FTAs
food non-food services TOTALEU25 0,0 0,0 0,0 0,1Korea -0,1 0,5 0,2 0,6Otherof whichLDCsJapanIndiaNAFTAEFTAnote: based on equivalent variation
Import protection
Change in Value of Exports, percentPartial 1 FTA, 2001 post-Doha baseline, with other Korean FTAs
food non-food services TOTALEU25 0,0 0,1 0,1 0,3Korea 0,5 3,1 2,7 6,4Otherof whichLDCsJapanIndiaNAFTAEFTAnote: based on change in US dollar value of exports
Import protection

Economic Impact of a Potential Free Trade Agreement between the European Union and South Korea
Page 65 of 92
EU25Percent Change in Output by SectorPartial 1 FTA, 2001 post-Doha baseline, with other Korean FTAs
food non-food services TOTALagriculture and processed foodsgrains 0,09 0,00 -0,04 0,06horticulture 0,01 0,00 0,00 0,01oil seeds 0,00 0,00 -0,04 -0,03sugar 0,05 0,00 -0,05 0,00natural fibres -0,01 -0,02 -0,04 -0,07beef 0,01 0,00 -0,02 -0,01dairy products 0,01 0,00 -0,01 0,00vegetable oils 0,06 0,00 -0,02 0,03other primary agriculture 0,17 0,00 -0,03 0,15other processed foods 0,39 0,01 -0,04 0,36beverages and tobacco -0,02 -0,01 -0,05 -0,08other primaryforestry 0,00 0,02 -0,03 -0,01fisheries 0,02 0,00 0,00 0,02mining 0,00 0,00 -0,02 -0,03manufacturingtextiles -0,02 -0,18 -0,06 -0,27clothing -0,02 0,06 -0,06 -0,01leather -0,04 0,17 -0,07 0,06lumber -0,01 0,03 -0,04 -0,01paper, pulp, publishing 0,00 0,02 -0,02 0,00petrochemicals 0,00 0,02 0,01 0,04chemicals, rubber, and plastics -0,01 0,08 -0,10 -0,03iron and steel -0,04 -0,03 -0,15 -0,21non-ferrous metals -0,05 0,21 -0,22 -0,06motor vehicles -0,04 -0,73 -0,13 -0,90electrical machinery -0,05 -0,12 -0,24 -0,41other machinery -0,04 0,24 -0,15 0,06other manufactures -0,02 0,05 -0,09 -0,05servicesutilities 0,00 0,00 -0,02 -0,02construction 0,00 0,00 0,01 0,01trade 0,00 0,00 0,01 0,00transport 0,00 0,02 0,07 0,10communications -0,01 0,01 0,07 0,07financial and banking services 0,00 0,00 0,01 0,02insurance -0,01 -0,01 -0,03 -0,05other business services -0,01 0,01 0,13 0,13other services 0,00 0,00 0,01 0,00
Import protection

Economic Impact of a Potential Free Trade Agreement between the European Union and South Korea
Page 66 of 92
KOREAPercent Change in Output by SectorPartial 1 FTA, 2001 post-Doha baseline, with other Korean FTAs
food non-food services TOTALagriculture and processed foodsgrains 0,20 -0,10 -0,08 0,02horticulture 0,05 0,03 0,00 0,08oil seeds -0,01 -0,83 -0,17 -1,01sugar -1,01 -0,55 0,04 -1,51natural fibres 0,46 -0,02 -0,07 0,37beef -1,32 -0,93 -0,04 -2,28dairy products 0,07 -0,35 0,12 -0,17vegetable oils -1,06 -0,78 0,10 -1,74other primary agriculture -1,05 -0,78 -0,03 -1,86other processed foods -3,56 -1,64 -0,02 -5,23beverages and tobacco 2,31 -3,91 0,32 -1,28other primaryforestry -0,34 -0,67 -0,10 -1,11fisheries -0,51 -0,31 0,03 -0,80mining 0,05 -1,56 0,00 -1,51manufacturingtextiles 0,10 1,53 -0,18 1,45clothing 0,02 2,17 0,02 2,21leather 0,94 -0,23 -0,04 0,66lumber 0,00 -1,28 0,15 -1,13paper, pulp, publishing -0,10 -1,76 -0,45 -2,31petrochemicals -0,01 -0,69 0,37 -0,33chemicals, rubber, and plastics 0,12 -1,60 0,70 -0,78iron and steel 0,70 0,92 2,84 4,45non-ferrous metals 0,43 -3,13 2,42 -0,27motor vehicles 0,56 14,12 1,67 16,35electrical machinery 0,23 2,12 3,91 6,26other machinery 0,26 -2,30 2,26 0,22other manufactures 0,18 -2,14 0,71 -1,25servicesutilities 0,00 -0,37 0,18 -0,19construction -0,03 0,22 0,05 0,24trade 0,01 -0,06 -0,37 -0,42transport 0,00 -0,66 0,63 -0,03communications -0,03 -0,38 -1,23 -1,64financial and banking services 0,00 -0,03 -0,20 -0,23insurance -0,05 -0,21 -0,02 -0,28other business services -0,01 -1,08 -3,78 -4,88other services -0,03 -0,14 -0,26 -0,44
Import protection
REAL WAGE EFFECTS, percent changeagriculture manuf. services total
Koreaunskilled workers 0,1 0,5 0,4 1,0skilled workers 0,1 0,3 0,2 0,6
EU25unskilled workers 0,0 0,0 0,0 0,0skilled workers 0,0 0,0 0,0 0,0

Economic Impact of a Potential Free Trade Agreement between the European Union and South Korea
Page 67 of 92
KOREAUnskilled Labor Empoyment, % change
agriculture manuf. services totalagriculture and processed foods
1 grains 0,1 -0,3 -0,1 -0,32 horticulture -0,1 -0,1 0,0 -0,23 oil seeds -0,1 -0,9 -0,2 -1,24 sugar -0,9 -0,6 0,0 -1,65 natural fibers 0,4 -0,2 -0,1 0,16 beef -1,6 -1,3 -0,1 -2,97 dairy products 0,0 -0,5 0,1 -0,48 vegetable oils -1,0 -0,9 0,1 -1,89 other prinary agriculture -1,2 -1,0 -0,1 -2,3
10 other processed foods -3,4 -1,7 0,0 -5,111 beverages and tobacco 2,1 -3,8 0,3 -1,4
other primary12 forestry -0,4 -0,8 -0,1 -1,213 fisheries -1,0 -0,7 0,1 -1,614 mining 0,0 -1,7 0,0 -1,6
manufacturing15 textiles 0,1 1,2 -0,2 1,116 clothing 0,0 2,1 0,0 2,217 leather 1,1 0,7 0,1 1,918 lumber 0,0 -1,4 0,1 -1,219 paper, pulp, publishing -0,1 -1,9 -0,5 -2,520 petrochemicals 0,0 -0,8 0,3 -0,521 chemicals, rubber, and plastics 0,1 -1,7 0,6 -0,922 iron and steel 0,6 0,6 2,5 3,823 non-ferrous metals 0,4 -3,0 2,2 -0,424 motor vehicles 0,6 13,6 1,6 15,825 electrical machinery 0,2 1,7 3,5 5,526 other machinery 0,2 -2,3 2,1 0,027 other manufactures 0,2 -2,2 0,7 -1,4
services28 utilities 0,0 -0,5 0,1 -0,429 construction 0,0 0,1 0,0 0,130 trade 0,0 -0,3 -0,3 -0,631 transport 0,0 -0,8 0,6 -0,232 communications 0,0 -0,5 -1,2 -1,733 financial and banking services 0,0 -0,2 -0,2 -0,434 insurance -0,1 -0,3 -0,1 -0,435 other business services 0,0 -1,2 -3,7 -4,936 other services 0,0 -0,3 -0,3 -0,7
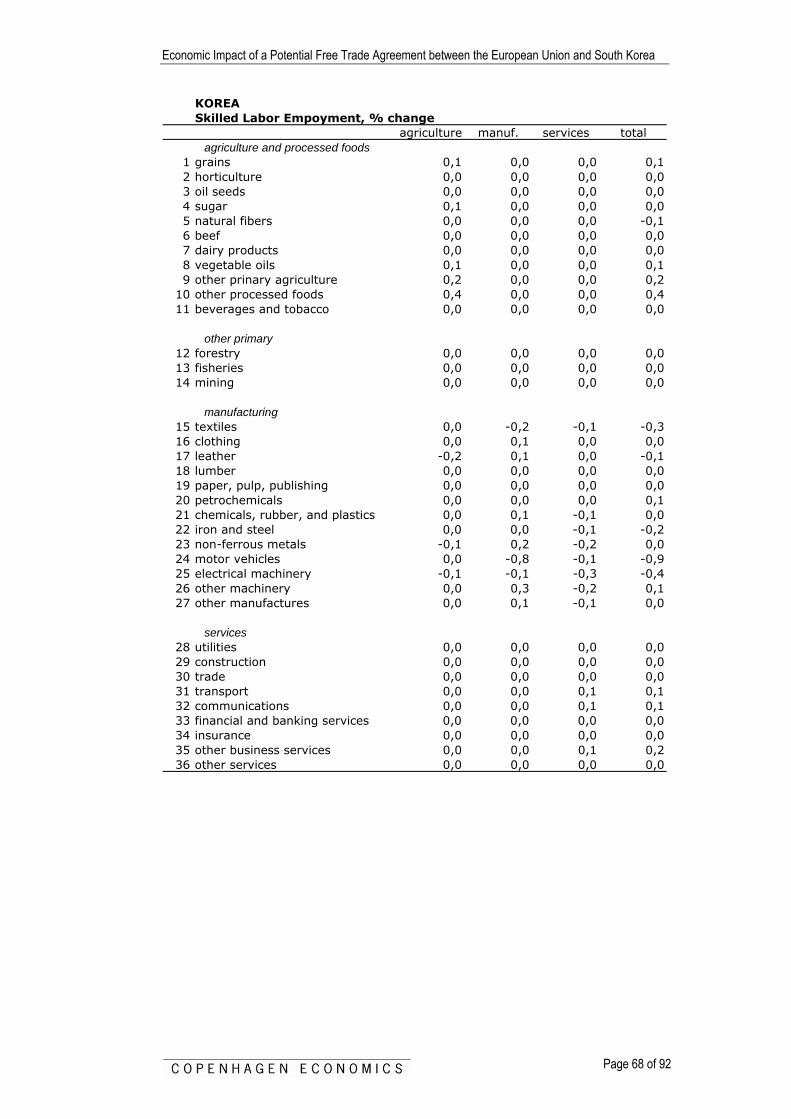
Economic Impact of a Potential Free Trade Agreement between the European Union and South Korea
Page 68 of 92
KOREASkilled Labor Empoyment, % change
agriculture manuf. services totalagriculture and processed foods
1 grains 0,1 0,0 0,0 0,12 horticulture 0,0 0,0 0,0 0,03 oil seeds 0,0 0,0 0,0 0,04 sugar 0,1 0,0 0,0 0,05 natural fibers 0,0 0,0 0,0 -0,16 beef 0,0 0,0 0,0 0,07 dairy products 0,0 0,0 0,0 0,08 vegetable oils 0,1 0,0 0,0 0,19 other prinary agriculture 0,2 0,0 0,0 0,2
10 other processed foods 0,4 0,0 0,0 0,411 beverages and tobacco 0,0 0,0 0,0 0,0
other primary12 forestry 0,0 0,0 0,0 0,013 fisheries 0,0 0,0 0,0 0,014 mining 0,0 0,0 0,0 0,0
manufacturing15 textiles 0,0 -0,2 -0,1 -0,316 clothing 0,0 0,1 0,0 0,017 leather -0,2 0,1 0,0 -0,118 lumber 0,0 0,0 0,0 0,019 paper, pulp, publishing 0,0 0,0 0,0 0,020 petrochemicals 0,0 0,0 0,0 0,121 chemicals, rubber, and plastics 0,0 0,1 -0,1 0,022 iron and steel 0,0 0,0 -0,1 -0,223 non-ferrous metals -0,1 0,2 -0,2 0,024 motor vehicles 0,0 -0,8 -0,1 -0,925 electrical machinery -0,1 -0,1 -0,3 -0,426 other machinery 0,0 0,3 -0,2 0,127 other manufactures 0,0 0,1 -0,1 0,0
services28 utilities 0,0 0,0 0,0 0,029 construction 0,0 0,0 0,0 0,030 trade 0,0 0,0 0,0 0,031 transport 0,0 0,0 0,1 0,132 communications 0,0 0,0 0,1 0,133 financial and banking services 0,0 0,0 0,0 0,034 insurance 0,0 0,0 0,0 0,035 other business services 0,0 0,0 0,1 0,236 other services 0,0 0,0 0,0 0,0

Economic Impact of a Potential Free Trade Agreement between the European Union and South Korea
Page 69 of 92
EU25Unskilled Labor Empoyment, % change
agriculture manuf. services totalagriculture and processed foods
1 grains 0,1 0,0 0,0 0,02 horticulture 0,0 0,0 0,0 0,03 oil seeds 0,0 0,0 0,0 0,04 sugar 0,0 0,0 0,0 0,05 natural fibers 0,0 0,0 0,0 -0,16 beef 0,0 0,0 0,0 0,07 dairy products 0,0 0,0 0,0 0,08 vegetable oils 0,0 0,0 0,0 0,09 other prinary agriculture 0,1 0,0 0,0 0,1
10 other processed foods 0,1 0,0 0,0 0,111 beverages and tobacco 0,0 0,0 0,0 0,0
other primary12 forestry 0,0 0,0 0,0 0,013 fisheries 0,0 0,0 0,0 0,014 mining 0,0 0,0 0,0 0,0
0,0 0,0 0,0 0manufacturing 0,0 0,0 0,0 0
15 textiles 0,0 -0,1 0,0 -0,116 clothing 0,0 0,0 0,0 0,017 leather 0,0 0,1 0,0 0,018 lumber 0,0 0,0 0,0 0,019 paper, pulp, publishing 0,0 0,0 0,0 0,020 petrochemicals 0,0 0,0 0,0 0,021 chemicals, rubber, and plastics 0,0 0,0 0,0 0,022 iron and steel 0,0 0,0 -0,1 -0,123 non-ferrous metals 0,0 0,1 -0,1 0,024 motor vehicles 0,0 -0,3 0,0 -0,325 electrical machinery 0,0 0,0 -0,1 -0,226 other machinery 0,0 0,1 -0,1 0,027 other manufactures 0,0 0,0 0,0 0,0
services28 utilities 0,0 0,0 0,0 0,029 construction 0,0 0,0 0,0 0,030 trade 0,0 0,0 0,0 0,031 transport 0,0 0,0 0,0 0,032 communications 0,0 0,0 0,0 0,033 financial and banking services 0,0 0,0 0,0 0,034 insurance 0,0 0,0 0,0 0,035 other business services 0,0 0,0 0,0 0,036 other services 0,0 0,0 0,0 0,0

Economic Impact of a Potential Free Trade Agreement between the European Union and South Korea
Page 70 of 92
EU25Skilled Labor Empoyment, % change
agriculture manuf. services totalagriculture and processed foods
1 grains 0,0 0,0 0,0 0,02 horticulture 0,0 0,0 0,0 0,03 oil seeds 0,0 0,0 0,0 0,04 sugar 0,0 0,0 0,0 0,05 natural fibers 0,0 0,0 0,0 0,06 beef 0,0 0,0 0,0 0,07 dairy products 0,0 0,0 0,0 0,08 vegetable oils 0,0 0,0 0,0 0,09 other prinary agriculture 0,0 0,0 0,0 0,0
10 other processed foods 0,0 0,0 0,0 0,011 beverages and tobacco 0,0 0,0 0,0 0,0
other primary12 forestry 0,0 0,0 0,0 0,013 fisheries 0,0 0,0 0,0 0,014 mining 0,0 0,0 0,0 0,0
manufacturing15 textiles 0,0 0,0 0,0 0,016 clothing 0,0 0,0 0,0 0,017 leather 0,0 0,0 0,0 0,018 lumber 0,0 0,0 0,0 0,019 paper, pulp, publishing 0,0 0,0 0,0 0,020 petrochemicals 0,0 0,0 0,0 0,021 chemicals, rubber, and plastics 0,0 0,0 0,0 0,022 iron and steel 0,0 0,0 0,0 0,023 non-ferrous metals 0,0 0,0 0,0 0,024 motor vehicles 0,0 0,0 0,0 0,025 electrical machinery 0,0 0,0 0,0 0,026 other machinery 0,0 0,0 0,0 0,027 other manufactures 0,0 0,0 0,0 0,0
services28 utilities 0,0 0,0 0,0 0,029 construction 0,0 0,0 0,0 0,030 trade 0,0 0,0 0,0 0,031 transport 0,0 0,0 0,0 0,032 communications 0,0 0,0 0,0 0,033 financial and banking services 0,0 0,0 0,0 0,034 insurance 0,0 0,0 0,0 0,035 other business services 0,0 0,0 0,0 0,036 other services 0,0 0,0 0,0 0,0
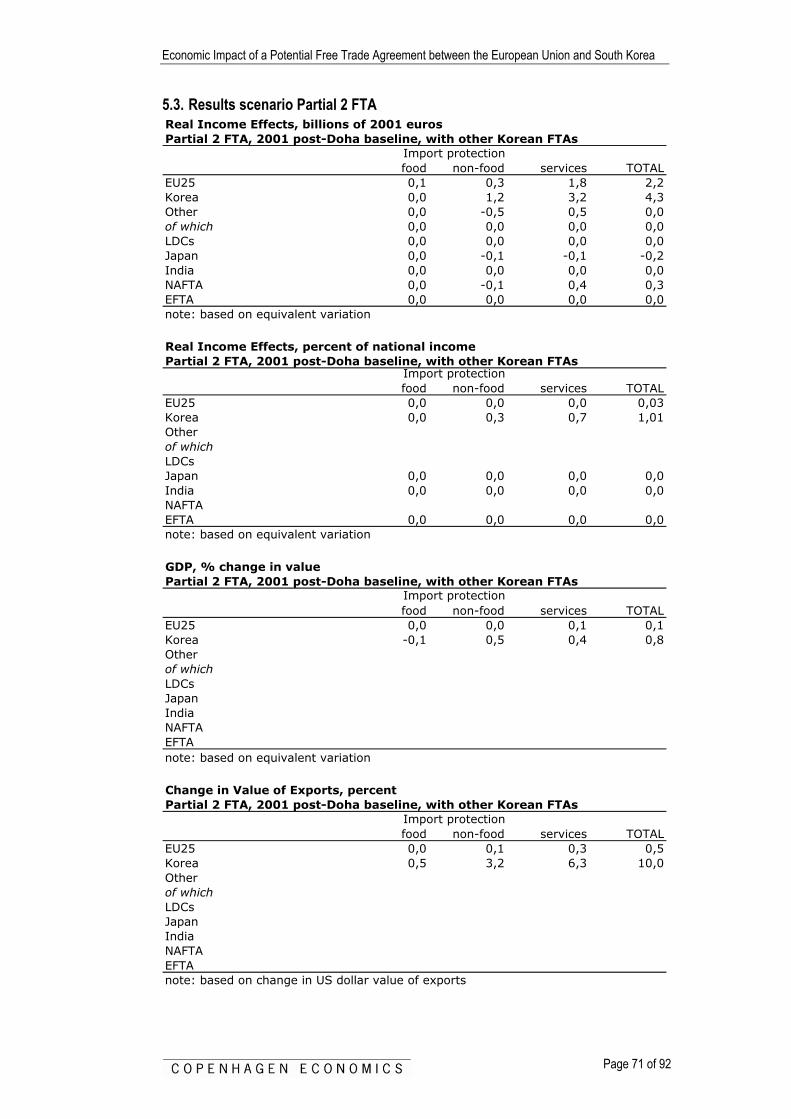
Economic Impact of a Potential Free Trade Agreement between the European Union and South Korea
Page 71 of 92
5.3. Results scenario Partial 2 FTA Real Income Effects, billions of 2001 eurosPartial 2 FTA, 2001 post-Doha baseline, with other Korean FTAs
food non-food services TOTALEU25 0,1 0,3 1,8 2,2Korea 0,0 1,2 3,2 4,3Other 0,0 -0,5 0,5 0,0of which 0,0 0,0 0,0 0,0LDCs 0,0 0,0 0,0 0,0Japan 0,0 -0,1 -0,1 -0,2India 0,0 0,0 0,0 0,0NAFTA 0,0 -0,1 0,4 0,3EFTA 0,0 0,0 0,0 0,0note: based on equivalent variation
Import protection
Real Income Effects, percent of national incomePartial 2 FTA, 2001 post-Doha baseline, with other Korean FTAs
food non-food services TOTALEU25 0,0 0,0 0,0 0,03Korea 0,0 0,3 0,7 1,01Otherof whichLDCsJapan 0,0 0,0 0,0 0,0India 0,0 0,0 0,0 0,0NAFTAEFTA 0,0 0,0 0,0 0,0note: based on equivalent variation
Import protection
GDP, % change in valuePartial 2 FTA, 2001 post-Doha baseline, with other Korean FTAs
food non-food services TOTALEU25 0,0 0,0 0,1 0,1Korea -0,1 0,5 0,4 0,8Otherof whichLDCsJapanIndiaNAFTAEFTAnote: based on equivalent variation
Import protection
Change in Value of Exports, percentPartial 2 FTA, 2001 post-Doha baseline, with other Korean FTAs
food non-food services TOTALEU25 0,0 0,1 0,3 0,5Korea 0,5 3,2 6,3 10,0Otherof whichLDCsJapanIndiaNAFTAEFTAnote: based on change in US dollar value of exports
Import protection

Economic Impact of a Potential Free Trade Agreement between the European Union and South Korea
Page 72 of 92
EU25Percent Change in Output by SectorPartial 2 FTA, 2001 post-Doha baseline, with other Korean FTAs
food non-food services TOTALagriculture and processed foods
1 grains 0,09 0,00 -0,08 0,012 horticulture 0,01 0,00 -0,01 0,003 oil seeds 0,00 0,00 -0,08 -0,084 sugar 0,05 -0,01 -0,11 -0,065 natural fibres -0,01 -0,02 -0,09 -0,136 beef 0,01 0,00 -0,04 -0,037 dairy products 0,01 0,00 -0,02 -0,028 vegetable oils 0,05 0,00 -0,06 0,009 other primary agriculture 0,17 0,00 -0,06 0,12
10 other processed foods 0,39 0,01 -0,08 0,3111 beverages and tobacco -0,02 -0,02 -0,11 -0,14
other primary12 forestry 0,00 0,02 -0,07 -0,0513 fisheries 0,02 0,00 0,00 0,0214 mining 0,00 -0,01 -0,04 -0,05
manufacturing15 textiles -0,02 -0,18 -0,15 -0,3516 clothing -0,02 0,06 -0,13 -0,0817 leather -0,04 0,17 -0,16 -0,0318 lumber -0,01 0,03 -0,08 -0,0619 paper, pulp, publishing 0,00 0,02 -0,05 -0,0220 petrochemicals 0,00 0,02 0,02 0,0421 chemicals, rubber, and plastics -0,01 0,08 -0,23 -0,1622 iron and steel -0,04 -0,03 -0,34 -0,4123 non-ferrous metals -0,05 0,21 -0,50 -0,3424 motor vehicles -0,04 -0,74 -0,30 -1,0825 electrical machinery -0,04 -0,11 -0,49 -0,6326 other machinery -0,04 0,23 -0,35 -0,1627 other manufactures -0,02 0,05 -0,20 -0,17
services28 utilities 0,00 0,00 -0,05 -0,0529 construction 0,00 0,00 0,01 0,0130 trade 0,00 0,00 0,02 0,0231 transport 0,00 0,02 0,13 0,1532 communications -0,01 0,01 0,16 0,1633 financial and banking services 0,00 0,00 0,04 0,0534 insurance -0,01 -0,01 -0,06 -0,0835 other business services -0,01 0,01 0,28 0,2836 other services 0,00 0,00 0,02 0,02
Import protection
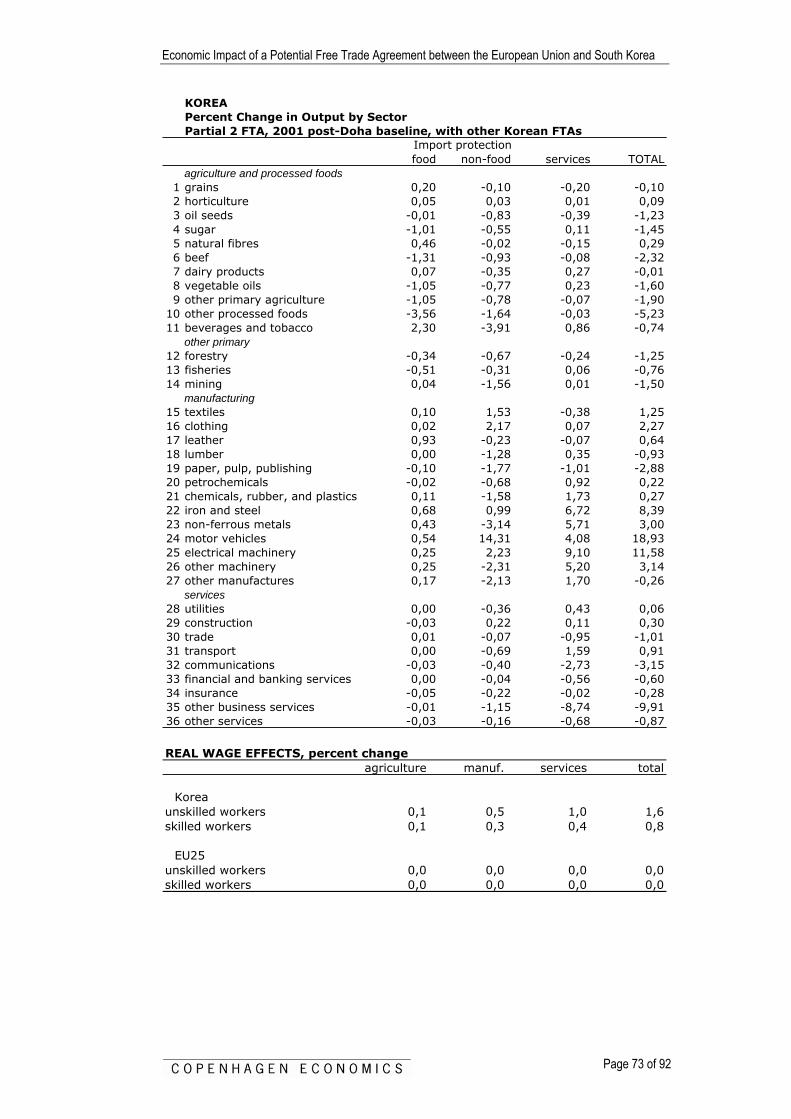
Economic Impact of a Potential Free Trade Agreement between the European Union and South Korea
Page 73 of 92
KOREAPercent Change in Output by SectorPartial 2 FTA, 2001 post-Doha baseline, with other Korean FTAs
food non-food services TOTALagriculture and processed foods
1 grains 0,20 -0,10 -0,20 -0,102 horticulture 0,05 0,03 0,01 0,093 oil seeds -0,01 -0,83 -0,39 -1,234 sugar -1,01 -0,55 0,11 -1,455 natural fibres 0,46 -0,02 -0,15 0,296 beef -1,31 -0,93 -0,08 -2,327 dairy products 0,07 -0,35 0,27 -0,018 vegetable oils -1,05 -0,77 0,23 -1,609 other primary agriculture -1,05 -0,78 -0,07 -1,90
10 other processed foods -3,56 -1,64 -0,03 -5,2311 beverages and tobacco 2,30 -3,91 0,86 -0,74
other primary12 forestry -0,34 -0,67 -0,24 -1,2513 fisheries -0,51 -0,31 0,06 -0,7614 mining 0,04 -1,56 0,01 -1,50
manufacturing15 textiles 0,10 1,53 -0,38 1,2516 clothing 0,02 2,17 0,07 2,2717 leather 0,93 -0,23 -0,07 0,6418 lumber 0,00 -1,28 0,35 -0,9319 paper, pulp, publishing -0,10 -1,77 -1,01 -2,8820 petrochemicals -0,02 -0,68 0,92 0,2221 chemicals, rubber, and plastics 0,11 -1,58 1,73 0,2722 iron and steel 0,68 0,99 6,72 8,3923 non-ferrous metals 0,43 -3,14 5,71 3,0024 motor vehicles 0,54 14,31 4,08 18,9325 electrical machinery 0,25 2,23 9,10 11,5826 other machinery 0,25 -2,31 5,20 3,1427 other manufactures 0,17 -2,13 1,70 -0,26
services28 utilities 0,00 -0,36 0,43 0,0629 construction -0,03 0,22 0,11 0,3030 trade 0,01 -0,07 -0,95 -1,0131 transport 0,00 -0,69 1,59 0,9132 communications -0,03 -0,40 -2,73 -3,1533 financial and banking services 0,00 -0,04 -0,56 -0,6034 insurance -0,05 -0,22 -0,02 -0,2835 other business services -0,01 -1,15 -8,74 -9,9136 other services -0,03 -0,16 -0,68 -0,87
Import protection
REAL WAGE EFFECTS, percent change
agriculture manuf. services total
Koreaunskilled workers 0,1 0,5 1,0 1,6skilled workers 0,1 0,3 0,4 0,8
EU25unskilled workers 0,0 0,0 0,0 0,0skilled workers 0,0 0,0 0,0 0,0

Economic Impact of a Potential Free Trade Agreement between the European Union and South Korea
Page 74 of 92
KOREAUnskilled Labor Empoyment, % change
agriculture manuf. services totalagriculture and processed foods
1 grains 0,1 -0,3 -0,3 -0,52 horticulture -0,1 -0,1 0,0 -0,23 oil seeds -0,1 -0,9 -0,4 -1,44 sugar -0,9 -0,6 0,1 -1,55 natural fibers 0,4 -0,2 -0,2 0,06 beef -1,6 -1,3 -0,2 -3,07 dairy products 0,0 -0,5 0,2 -0,28 vegetable oils -1,0 -0,9 0,2 -1,79 other prinary agriculture -1,2 -1,0 -0,1 -2,3
10 other processed foods -3,4 -1,7 -0,1 -5,211 beverages and tobacco 2,1 -3,8 0,8 -0,9
other primary12 forestry -0,4 -0,8 -0,3 -1,413 fisheries -1,0 -0,7 0,1 -1,614 mining 0,0 -1,7 0,0 -1,6
manufacturing15 textiles 0,1 1,2 -0,4 0,916 clothing 0,0 2,1 0,0 2,217 leather 1,1 0,7 0,3 2,118 lumber 0,0 -1,4 0,3 -1,019 paper, pulp, publishing -0,1 -1,9 -1,0 -3,020 petrochemicals 0,0 -0,8 0,8 -0,121 chemicals, rubber, and plastics 0,1 -1,7 1,6 0,022 iron and steel 0,6 0,7 6,0 7,323 non-ferrous metals 0,4 -3,0 5,1 2,524 motor vehicles 0,5 13,8 3,9 18,325 electrical machinery 0,2 1,8 8,2 10,326 other machinery 0,2 -2,3 4,9 2,827 other manufactures 0,2 -2,2 1,6 -0,4
services28 utilities 0,0 -0,5 0,3 -0,229 construction 0,0 0,1 0,1 0,130 trade 0,0 -0,3 -0,9 -1,131 transport 0,0 -0,8 1,5 0,732 communications 0,0 -0,6 -2,6 -3,233 financial and banking services 0,0 -0,2 -0,6 -0,834 insurance -0,1 -0,3 -0,1 -0,535 other business services 0,0 -1,3 -8,5 -9,836 other services 0,0 -0,3 -0,8 -1,1
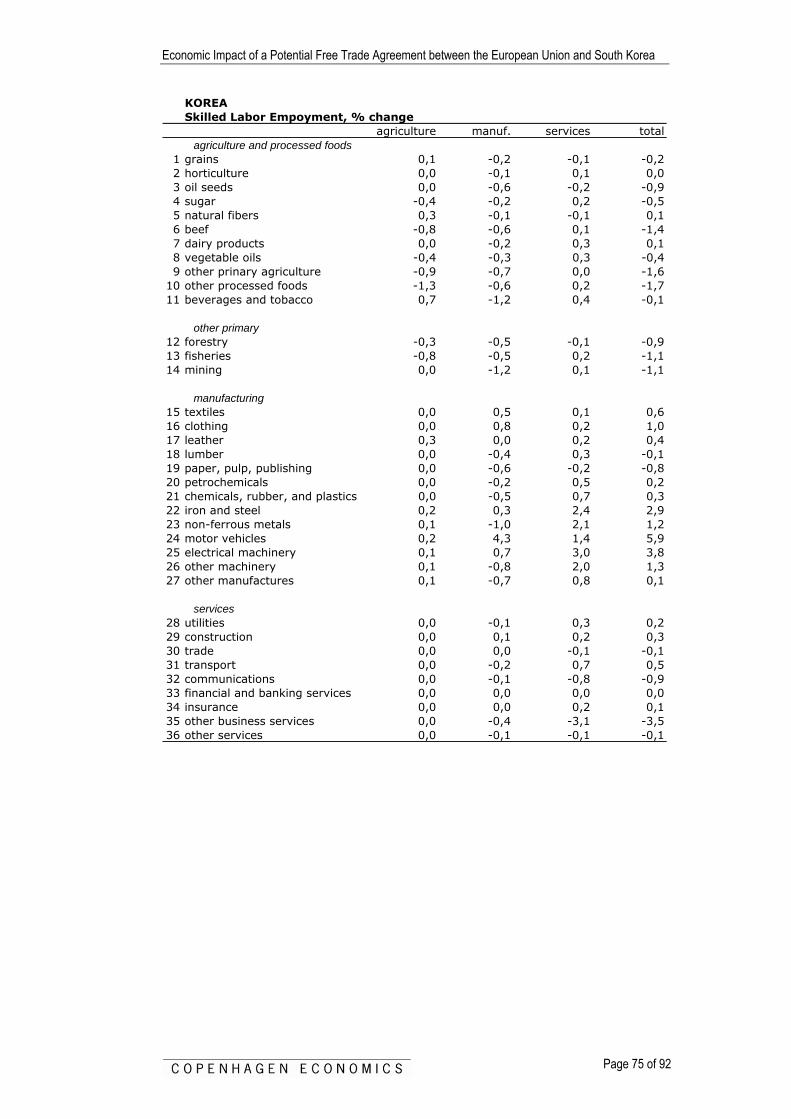
Economic Impact of a Potential Free Trade Agreement between the European Union and South Korea
Page 75 of 92
KOREASkilled Labor Empoyment, % change
agriculture manuf. services totalagriculture and processed foods
1 grains 0,1 -0,2 -0,1 -0,22 horticulture 0,0 -0,1 0,1 0,03 oil seeds 0,0 -0,6 -0,2 -0,94 sugar -0,4 -0,2 0,2 -0,55 natural fibers 0,3 -0,1 -0,1 0,16 beef -0,8 -0,6 0,1 -1,47 dairy products 0,0 -0,2 0,3 0,18 vegetable oils -0,4 -0,3 0,3 -0,49 other prinary agriculture -0,9 -0,7 0,0 -1,6
10 other processed foods -1,3 -0,6 0,2 -1,711 beverages and tobacco 0,7 -1,2 0,4 -0,1
other primary12 forestry -0,3 -0,5 -0,1 -0,913 fisheries -0,8 -0,5 0,2 -1,114 mining 0,0 -1,2 0,1 -1,1
manufacturing15 textiles 0,0 0,5 0,1 0,616 clothing 0,0 0,8 0,2 1,017 leather 0,3 0,0 0,2 0,418 lumber 0,0 -0,4 0,3 -0,119 paper, pulp, publishing 0,0 -0,6 -0,2 -0,820 petrochemicals 0,0 -0,2 0,5 0,221 chemicals, rubber, and plastics 0,0 -0,5 0,7 0,322 iron and steel 0,2 0,3 2,4 2,923 non-ferrous metals 0,1 -1,0 2,1 1,224 motor vehicles 0,2 4,3 1,4 5,925 electrical machinery 0,1 0,7 3,0 3,826 other machinery 0,1 -0,8 2,0 1,327 other manufactures 0,1 -0,7 0,8 0,1
services28 utilities 0,0 -0,1 0,3 0,229 construction 0,0 0,1 0,2 0,330 trade 0,0 0,0 -0,1 -0,131 transport 0,0 -0,2 0,7 0,532 communications 0,0 -0,1 -0,8 -0,933 financial and banking services 0,0 0,0 0,0 0,034 insurance 0,0 0,0 0,2 0,135 other business services 0,0 -0,4 -3,1 -3,536 other services 0,0 -0,1 -0,1 -0,1
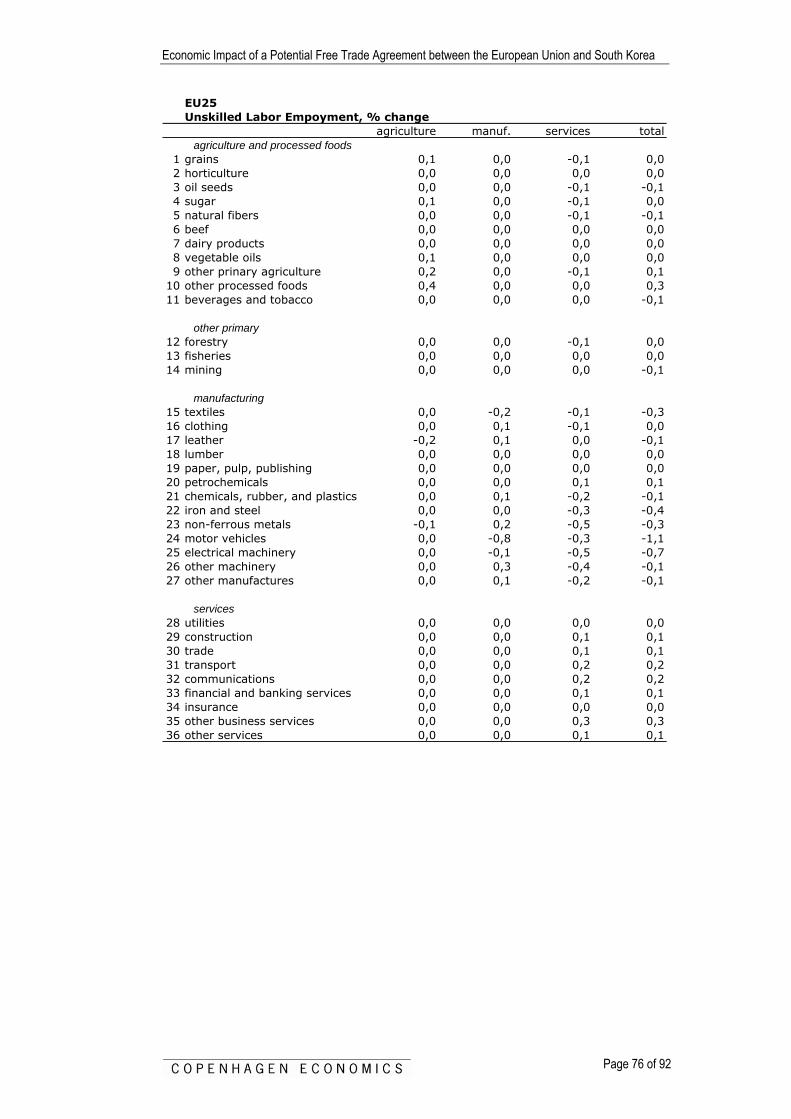
Economic Impact of a Potential Free Trade Agreement between the European Union and South Korea
Page 76 of 92
EU25Unskilled Labor Empoyment, % change
agriculture manuf. services totalagriculture and processed foods
1 grains 0,1 0,0 -0,1 0,02 horticulture 0,0 0,0 0,0 0,03 oil seeds 0,0 0,0 -0,1 -0,14 sugar 0,1 0,0 -0,1 0,05 natural fibers 0,0 0,0 -0,1 -0,16 beef 0,0 0,0 0,0 0,07 dairy products 0,0 0,0 0,0 0,08 vegetable oils 0,1 0,0 0,0 0,09 other prinary agriculture 0,2 0,0 -0,1 0,1
10 other processed foods 0,4 0,0 0,0 0,311 beverages and tobacco 0,0 0,0 0,0 -0,1
other primary12 forestry 0,0 0,0 -0,1 0,013 fisheries 0,0 0,0 0,0 0,014 mining 0,0 0,0 0,0 -0,1
manufacturing15 textiles 0,0 -0,2 -0,1 -0,316 clothing 0,0 0,1 -0,1 0,017 leather -0,2 0,1 0,0 -0,118 lumber 0,0 0,0 0,0 0,019 paper, pulp, publishing 0,0 0,0 0,0 0,020 petrochemicals 0,0 0,0 0,1 0,121 chemicals, rubber, and plastics 0,0 0,1 -0,2 -0,122 iron and steel 0,0 0,0 -0,3 -0,423 non-ferrous metals -0,1 0,2 -0,5 -0,324 motor vehicles 0,0 -0,8 -0,3 -1,125 electrical machinery 0,0 -0,1 -0,5 -0,726 other machinery 0,0 0,3 -0,4 -0,127 other manufactures 0,0 0,1 -0,2 -0,1
services28 utilities 0,0 0,0 0,0 0,029 construction 0,0 0,0 0,1 0,130 trade 0,0 0,0 0,1 0,131 transport 0,0 0,0 0,2 0,232 communications 0,0 0,0 0,2 0,233 financial and banking services 0,0 0,0 0,1 0,134 insurance 0,0 0,0 0,0 0,035 other business services 0,0 0,0 0,3 0,336 other services 0,0 0,0 0,1 0,1

Economic Impact of a Potential Free Trade Agreement between the European Union and South Korea
Page 77 of 92
EU25Skilled Labor Empoyment, % change
agriculture manuf. services totalagriculture and processed foods
1 grains 0,1 0,0 -0,1 0,02 horticulture 0,0 0,0 0,0 0,03 oil seeds 0,0 0,0 -0,1 -0,14 sugar 0,0 0,0 0,0 0,05 natural fibers 0,0 0,0 -0,1 -0,16 beef 0,0 0,0 0,0 0,07 dairy products 0,0 0,0 0,0 0,08 vegetable oils 0,0 0,0 0,0 0,09 other prinary agriculture 0,1 0,0 0,0 0,1
10 other processed foods 0,1 0,0 0,0 0,111 beverages and tobacco 0,0 0,0 0,0 0,0
other primary12 forestry 0,0 0,0 -0,1 0,013 fisheries 0,0 0,0 0,0 0,014 mining 0,0 0,0 0,0 0,0
manufacturing15 textiles 0,0 -0,1 -0,1 -0,116 clothing 0,0 0,0 0,0 0,017 leather 0,0 0,1 -0,1 0,018 lumber 0,0 0,0 0,0 0,019 paper, pulp, publishing 0,0 0,0 0,0 0,020 petrochemicals 0,0 0,0 0,0 0,021 chemicals, rubber, and plastics 0,0 0,0 -0,1 -0,122 iron and steel 0,0 0,0 -0,1 -0,223 non-ferrous metals 0,0 0,1 -0,2 -0,124 motor vehicles 0,0 -0,3 -0,1 -0,425 electrical machinery 0,0 0,0 -0,2 -0,326 other machinery 0,0 0,1 -0,1 -0,127 other manufactures 0,0 0,0 -0,1 -0,1
services28 utilities 0,0 0,0 0,0 0,029 construction 0,0 0,0 0,0 0,030 trade 0,0 0,0 0,0 0,031 transport 0,0 0,0 0,0 0,032 communications 0,0 0,0 0,1 0,133 financial and banking services 0,0 0,0 0,0 0,034 insurance 0,0 0,0 0,0 0,035 other business services 0,0 0,0 0,1 0,136 other services 0,0 0,0 0,0 0,0

Economic Impact of a Potential Free Trade Agreement between the European Union and South Korea
Page 78 of 92
5.4. Results on Korean imports by sector Korea Import Value in baseline and experiments
Baseline Partial 1 FTA Partial 2 FTA Full FTAagriculture and processed foods
1 grains 2.518 2.434 2.430 2.4402 horticulture 599 594 596 6033 oil seeds 1.750 1.751 1.753 1.7684 sugar 445 439 439 4425 natural fibers 718 724 723 7256 beef 1.683 1.687 1.685 1.6837 dairy products 429 435 434 4408 vegetable oils 6 5 6 59 other prinary agriculture 2.807 2.791 2.793 2.826
10 other processed foods 6.478 7.847 7.867 7.99211 beverages and tobacco 5.677 5.698 5.697 5.710
other primary12 forestry 588 583 584 59113 fisheries 678 646 643 64214 mining 26.181 26.186 26.378 27.117
manufacturing15 textiles 9.042 9.438 9.448 9.60016 clothing 3.360 3.511 3.515 3.56517 leather 1.882 1.980 1.984 2.01518 lumber 1.896 1.936 1.942 1.97119 paper, pulp, publishing 2.813 2.933 2.944 2.98920 petrochemicals 3.639 3.655 3.658 3.68621 chemicals, rubber, and plastics 19.134 20.085 20.151 20.33122 iron and steel 8.633 8.698 8.570 8.15323 non-ferrous metals 5.684 5.809 5.919 6.16124 motor vehicles 5.774 6.418 6.375 6.40325 electrical machinery 30.644 31.215 32.361 32.40326 other machinery 43.774 46.422 47.553 48.61127 other manufactures 12.085 12.832 12.921 13.230
services28 utilities 221 252 285 40029 construction 119 161 216 39830 trade 4.584 5.490 6.552 9.64331 transport 12.148 12.906 13.717 15.71132 communications 1.839 2.134 2.433 3.10333 financial and banking services 1.092 1.362 1.685 2.74234 insurance 397 440 482 59635 other business services 17.756 20.879 24.242 32.10236 other services 6.637 7.991 9.595 14.600
TOTAL 243.710 258.366 268.576 291.398

Economic Impact of a Potential Free Trade Agreement between the European Union and South Korea
Page 79 of 92
EU25 share of total Korean importsBaseline Partial 1 FTA Partial 2 FTA Full FTA
agriculture and processed foods1 grains 0,0% 0,0% 0,0% 0,0%2 horticulture 1,6% 1,6% 1,6% 1,6%3 oil seeds 0,0% 0,0% 0,0% 0,0%4 sugar 1,8% 1,8% 1,8% 1,9%5 natural fibers 1,0% 1,1% 1,1% 1,1%6 beef 0,2% 0,3% 0,3% 0,4%7 dairy products 32,2% 32,2% 32,1% 33,3%8 vegetable oils 7,8% 7,8% 7,7% 8,1%9 other prinary agriculture 4,1% 5,8% 5,8% 6,0%
10 other processed foods 5,6% 28,2% 28,1% 29,7%11 beverages and tobacco 0,1% 0,2% 0,2% 0,2%
other primary12 forestry 1,1% 1,2% 1,2% 1,2%13 fisheries 2,4% 2,8% 2,8% 2,8%14 mining 0,1% 0,2% 0,2% 0,2%
manufacturing15 textiles 9,7% 13,3% 13,3% 14,0%16 clothing 15,2% 20,9% 21,0% 21,9%17 leather 27,6% 34,5% 34,5% 35,9%18 lumber 12,1% 15,0% 14,9% 15,6%19 paper, pulp, publishing 14,1% 16,1% 16,1% 16,6%20 petrochemicals 1,9% 2,2% 2,2% 2,3%21 chemicals, rubber, and plastics 16,9% 21,0% 20,9% 21,8%22 iron and steel 7,6% 8,8% 8,8% 9,1%23 non-ferrous metals 13,7% 16,2% 16,3% 16,6%24 motor vehicles 22,2% 30,4% 30,4% 31,9%25 electrical machinery 6,4% 7,1% 7,3% 7,5%26 other machinery 15,5% 20,6% 20,3% 21,9%27 other manufactures 13,1% 18,5% 18,5% 19,5%
services28 utilities 15,0% 22,4% 31,1% 50,1%29 construction 49,3% 61,3% 71,3% 84,7%30 trade 31,5% 42,8% 54,0% 72,5%31 transport 36,0% 48,1% 59,4% 77,2%32 communications 41,3% 53,5% 64,5% 80,5%33 financial and banking services 31,7% 43,0% 54,2% 72,4%34 insurance 31,2% 42,5% 54,0% 72,4%35 other business services 40,3% 52,5% 63,5% 79,8%36 other services 28,8% 39,7% 50,8% 69,7%
TOTAL 14,7% 20,5% 23,6% 31,1%
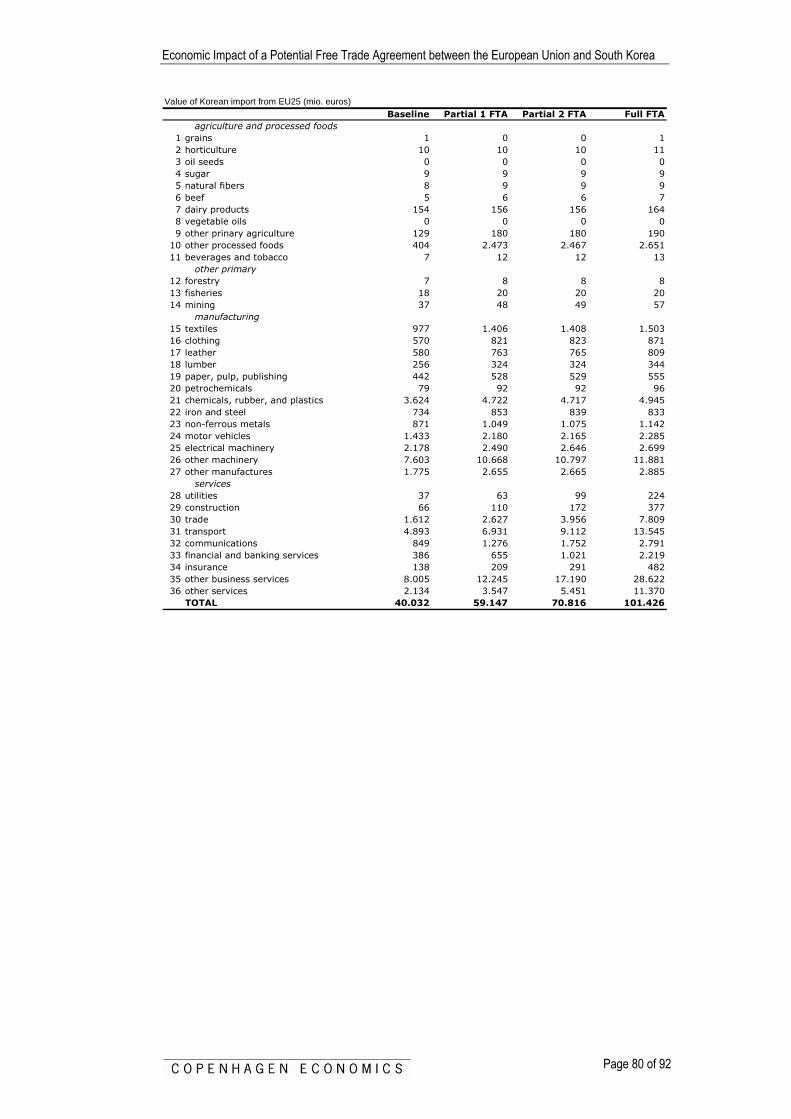
Economic Impact of a Potential Free Trade Agreement between the European Union and South Korea
Page 80 of 92
Value of Korean import from EU25 (mio. euros)Baseline Partial 1 FTA Partial 2 FTA Full FTA
agriculture and processed foods1 grains 1 0 0 12 horticulture 10 10 10 113 oil seeds 0 0 0 04 sugar 9 9 9 95 natural fibers 8 9 9 96 beef 5 6 6 77 dairy products 154 156 156 1648 vegetable oils 0 0 0 09 other prinary agriculture 129 180 180 190
10 other processed foods 404 2.473 2.467 2.65111 beverages and tobacco 7 12 12 13
other primary12 forestry 7 8 8 813 fisheries 18 20 20 2014 mining 37 48 49 57
manufacturing15 textiles 977 1.406 1.408 1.50316 clothing 570 821 823 87117 leather 580 763 765 80918 lumber 256 324 324 34419 paper, pulp, publishing 442 528 529 55520 petrochemicals 79 92 92 9621 chemicals, rubber, and plastics 3.624 4.722 4.717 4.94522 iron and steel 734 853 839 83323 non-ferrous metals 871 1.049 1.075 1.14224 motor vehicles 1.433 2.180 2.165 2.28525 electrical machinery 2.178 2.490 2.646 2.69926 other machinery 7.603 10.668 10.797 11.88127 other manufactures 1.775 2.655 2.665 2.885
services28 utilities 37 63 99 22429 construction 66 110 172 37730 trade 1.612 2.627 3.956 7.80931 transport 4.893 6.931 9.112 13.54532 communications 849 1.276 1.752 2.79133 financial and banking services 386 655 1.021 2.21934 insurance 138 209 291 48235 other business services 8.005 12.245 17.190 28.62236 other services 2.134 3.547 5.451 11.370
TOTAL 40.032 59.147 70.816 101.426

Economic Impact of a Potential Free Trade Agreement between the European Union and South Korea
Page 81 of 92
Technical Annex: An Overview of the Computational Model
1. Introduction This annex provides an overview of the basic structure of the global CGE model employed for our assessment of an EU-Korea FTA.. The model is based on Francois, van Meijl, and van Tongeren (2005) and is implemented in GEMPACK -- a software package designed for solving large applied general equilibrium models. The reader can download and replicate our results, but will need access to GEMPACK to make modifications to the code or data. The model is solved as an explicit non-linear system of equations, through techniques described by Harrison and Pearson (1994). More information can be obtained at the following URL -- http://www.monash.edu.au/policy/gempack.htm. The reader is referred to Hertel (1996) for a detailed discussion of the basic algebraic model structure represented by the GEMPACK code. While this appendix provides a broad overview of the model, detailed discussion of mathematical structure is limited to added features, beyond the standard GTAP structure covered in that document. The model is a standard multi-region computable general equilibrium (CGE) model, with important features related to the structure of competition (as described by Francois and Roland-Holst 1997). Imperfect competition features are described in detail in Francois (1998:). Social accounting data are based on the most recent Version 6.2 of the GTAP dataset (www.gtap.org).
2. General structure The general conceptual structure of a regional economy in the model is as follows. Within each region, firms produce output, employing land, labour, capital, and natural resources and combining these with intermediate inputs. Firm output is purchased by consumers, government, the investment sector, and by other firms. Firm output can also be sold for export. Land is only employed in the agricultural sectors, while capital and labour (both skilled and unskilled) are mobile between all production sectors. Capital is fully mobile within regions. All demand sources combine imports with domestic goods to produce a composite good. In constant returns sectors, these are Armington composites. In increasing returns sectors, these are composites of firm-
Economic Impact of a Potential Free Trade Agreement between the European Union and South Korea
Page 82 of 92
differentiated goods. Relevant substitution and trade elasticities are presented in Appendix Table 1.
3. Taxes and policy variables Taxes are included in the theory of the model at several levels. Production taxes are placed on intermediate or primary inputs, or on output. Some trade taxes are modeled at the border. Additional internal taxes can be placed on domestic or imported intermediate inputs, and may be applied at differential rates that discriminate against imports. Where relevant, taxes are also placed on exports, and on primary factor income. Finally, where relevant (as indicated by social accounting data) taxes are placed on final consumption, and can be applied differentially to consumption of domestic and imported goods. Trade policy instruments are represented as import or export taxes/subsidies. This includes applied most-favored nation (mfn) tariffs, antidumping duties, countervailing duties, price undertakings, export quotas, and other trade restrictions. The major exception is service-sector trading costs, which are discussed in the next section. The full set of tariff vectors are based on WTO tariff schedules, combined with possible Doha and regional initiatives as specified by the Commission during this project, augmented with data on trade preferences. The set of services trade barrier estimates is described below.
4. Trade and transportation costs and services barriers International trade is modeled as a process that explicitly involves trading costs, which include both trade and transportation services. These trading costs reflect the transaction costs involved in international trade, as well as the physical activity of transportation itself. Those trading costs related to international movement of goods and related logistic services are met by composite services purchased from a global trade services sector, where the composite "international trade services" activity is produced as a Cobb-Douglas composite of regional exports of trade and transport service exports. Trade-cost margins are based on reconciled f.o.b. and c.i.f. trade data, as reported in version 6.2 of the GTAP dataset. A second form of trade costs is known in the literature as frictional trading costs. These are implemented in the service sector. They represent real resource costs associated with producing a service for sale in an export market instead of the domestic market. Conceptually, we have implemented a linear transformation technology between domestic and export services. This technology is represented in Annex Figure 1. The straight line AB indicates, given the resources necessary to produce a unit of services for the domestic market, the feasible amount that can instead be produced for export using those same resources. If there are not frictional barriers to trade in services, this line has slope -1. This free-trade case is represented by the line AC. As we reduce trading costs, the linear transformation line converges on the free trade line, as indicated in the figure. The basic methodology for estimation of services barriers involves the estimation of an equation where import demand is a function of the size of the economy (GDP) and its income level (per-capita income). We have also

Economic Impact of a Potential Free Trade Agreement between the European Union and South Korea
Page 83 of 92
included dummy variables by sector, and country-specific dummies (with Hong Kong and Singapore being the base case). Our import data are on a sector basis by country with respect to the world, and are at the same level of aggregation as the CGE model data. Formally, out estimating equation is (1) Mi, j = ai + a j + a
1ln(GDP) j + a2 ln(PCI) j + ε j
where Mi,j represents imports in sector i by country j, ai and a j are sector and country effect variables, GDPj represents national GDP (taken in logs), PCIj is per-capita income (again taken in logs) and ε is an error term. This is an improvement on the apporoach in Francois, ven Meijl and van Tongeren (2005) as under this approach we have several points for estimation of each national restriction index (the a j coefficient). Adjusted by the import substitution elasticity, these national coefficients provide an estimate of the trade-cost equivalent of existing barriers in services, as an average across service sectors. (2)
a j = −σ ln Tj( ) Here, Tj is the power of the tariff equivalent (1+tj ) such that in free trade T0 =1, and σ is the trade substitution elasticity relative to domestic production (taken to be the substitution elasticity from Annex Table 1). Regression results from this approach are reported in Annex Table 2, while the relevant estimates of tariff equivalents for this study are reported in the report.
5. The composite household and final demand structure Final demand is determined by an upper-tier Cobb-Douglas preference function, which allocates income in fixed shares to current consumption, investment, and government services. This yields a fixed savings rate. Government services are produced by a Leontief technology, with household/government transfers being endogenous. The lower-tier nest for current consumption is also specified as a Cobb-Douglas. The regional capital markets adjust so that changes in savings match changes in regional investment expenditures. (Note that the Cobb-Douglas demand function is a special case of the CDE demand function employed in the standard GTAP model code. It is implemented through GEMPACK parameter files.)
6. Market Structure
6.1 Demand for imports: Armington sectors The basic structure of demand in constant returns sectors is Armington preferences. In Armington sectors, goods are differentiated by country of origin, and the similarity of goods from different regions is measured by the elasticity of substitution. Formally, within a particular region, we assume that demand goods from different regions are aggregated into a composite import according to the following CES function: (3)
j
jR
irijrij
Mrj Mq
ρρα
/1
1,,,,, ⎥⎦
⎤⎢⎣
⎡= ∑
=

Economic Impact of a Potential Free Trade Agreement between the European Union and South Korea
Page 84 of 92
In equation (3), Mj,i,r is the quantity of Mj from region i consumed in region r. The elasticity of substitution between varieties from different regions is then equal to σM
j , where σMj=1/(1-ρj). Composite imports are combined with the
domestic good qD in a second CES nest, yielding the Armington composite q. (4)
qj ,r = Ω j .M .r q j ,rM( )β j + Ω j ,D,r q j ,r
D( )β j⎡⎣
⎤⎦
1/β j
The elasticity of substitution between the domestic good and composite imports is then equal to σD
j, where σDj=1/(1-βj). At the same time, from the first
order conditions, the demand for import Mj,i,r can then be shown to equal (5)
M j ,i ,r =α j ,i ,r
Pj ,i,r
⎡
⎣⎢⎢
⎤
⎦⎥⎥
σ im
α j ,i,rσ j
M
Pj ,i,r1−σ j
M
i=1
R
∑⎡⎣⎢
⎤
⎦⎥
−1
Ej ,rM
=α j ,i ,r
Pj ,i,r
⎡
⎣⎢⎢
⎤
⎦⎥⎥
σ jM
Pj ,rM( )σ j
M −1Ej ,r
M
where EM
j,r represents expenditures on imports in region r on the sector j Armington composite. In practice, the two nests can be collapsed, so that imports compete directly with each other and with the corresponding domestic product. This implies that the substitution elasticities in equations (3) and (4) are equal. (These elasticities are reported in Annex Table 1).
6.2 Imperfect competition As indicated in Annex Table 1, we model manufacturing sectors and service sectors as being imperfectly competitive. The approach we follow has been used in the Michigan and the WTO assessment of the Uruguay Round. Recent model testing work indicates that this approach works “best” vis-à-vis Armington models, when tracked against actual trade patterns. (See Fox 1999, who uses the U.S.-Canada FTA as a natural experiment for model testing). Formally, within a region r, we assume that demand for differentiated intermediate products belonging to sector j can be derived from the following CES function, which is now indexed over firms or varieties instead of over regions. We have
(6) j
jn
irijrijrj Xq
Γ
=
Γ⎥⎦
⎤⎢⎣
⎡= ∑
/1
1,,,,, γ
where γj,i,r is the demand share preference parameter, Xj,i,r is demand for variety i of product j in region r, and σj = 1/(1-Γj) is the elasticity of substitution between any two varieties of the good. Note that we can interpret q as the output of a constant returns assembly process, where the resulting composite product enters consumption and/or production. Equation (6) could therefore be interpreted as representing an assembly function embedded in the production technology of firms that use intermediates in production of final goods, and alternatively as representing a CES aggregator implicit in consumer utility functions. In the literature, and in our model, both cases are specified with the same functional form. While we have technically dropped

Economic Impact of a Potential Free Trade Agreement between the European Union and South Korea
Page 85 of 92
the Armington assumption by allowing firms to differentiate products, the vector of γ parameters still provides a partial geographic anchor for production. (Francois and Roland-Holst 1997, Francois 1998). Globally, firms in different regions compete directly. These firms are assumed to exhibit monopolistically competitive behaviour. This means that individual firms produce unique varieties of good or service j, and hence are monopolists within their chosen market niche. Given the demand for variety, reflected in equation (6), the demand for each variety is less than perfectly elastic. However, while firms are thus able to price as monopolists, free entry (at least in the long-run) drives their economic profits to zero, so that pricing is at average cost. The joint assumptions of average cost pricing and monopoly pricing, under Bertrand behaviour, imply the following conditions for each firm fi in region i: (7) ⎟
⎟
⎠
⎞
⎜⎜
⎝
⎛⎟⎟⎠
⎞⎜⎜⎝
⎛⎟⎟⎠
⎞⎜⎜⎝
⎛ − −
∑∑PP
XX
= r f, j,
r k, j,1
r ,f j,
r k, j,n
1=k
1
f j,
r ,f j,R
1=rf j,
j
i
j
i
i
i
σσ
ααζ
(8) AC=P i f,i f,
The elasticity of demand for each firm fi will be defined by the following conditions. (9) ζσσε i f, j,jji f, j, )(1 + = −
(10) ε i f,i f,
i f,i f, 1=PMCP
In a fully symmetric equilibrium, we would have ζ=n-1. However, the calibrated model includes CES weights γ , in each regional CES aggregation function, that will vary for firms from different regions. Under these conditions, ζ is a quantity weighted measure of market share. To close the system for regional production, we index total resource costs for sector j in region i by the resource index Z. Full employment of resources hired by firms in the sector j in region i then implies the following condition.
(11) TC = Z f i, j,
n
1=fi j,
i
∑
Cost functions for individual firms are defined as follows: (12) P )x b + a( = )xC( Zi j,i j,i j,i j, i j,
This specification of monopolistic competition is implemented under the “large group” assumption, which means that firms treat the variable n as "large", so that the perceived elasticity of demand equals the elasticity of substitution. The relevant set of equations then collapses to the following:

Economic Impact of a Potential Free Trade Agreement between the European Union and South Korea
Page 86 of 92
(13)
X nn = x
n =
]x [ = q
r i, j,0i j,
i j,)/(1
rij
0i j,1
r i, j,rij
rijrij
R
1=i
1
r j,
jj
j
j j
⎟⎟⎠
⎞⎜⎜⎝
⎛ΓΓ−
Γ−
Γ Γ
∑
,,
,,
,,,,
αγ
γ
(14) X ZZ = x i j,
0i j,
1i j,)/(1
ij
jj
⎟⎟⎠
⎞⎜⎜⎝
⎛− ρρ
,
In equation (14), n0 denotes the number of firms in the benchmark. Through calibration, the initial CES weights in equation (14) include the valuation of variety. As a result, the reduced form exhibits external scale effects, determined by changes in variety based on firm entry and exit, and determined by the substitution and scale elasticities. 6.3 Markups Scale elasticities, based on our average markup estimates, are reported in the Annex Table 1. The starting point for these is recent estimated price-cost markups from the OECD (Martins, Scarpetta, and Pilat 1996). These provide estimates of markups, based on methods pioneered by Hall (1988) and Roeger (1995). The Martins et al paper provides an overview of the recent empirical literature. We have supplemented these with price-cost markups estimated, given our theoretical structure, from the set of GTAP Armington elasticities, and also from estimates reported in Antweiler and Trefler (2002).
7. Aggregation scheme The basic aggregation scheme for the model is presented in Annex Tables 1 and 3.

Economic Impact of a Potential Free Trade Agreement between the European Union and South Korea
Page 87 of 92
References Antweiller, W. and D. Trefler 2002. “Increasing Returns and All That: A View from Trade,” American Economic Review, 96: March. Ethier, W. (1982), “National and International Returns to Scale in the Modern Theory of International Trade,” American Economic Review, 72 (June), 950-959. Finger, J.M., U. Reincke, and M. Ingco (1996), The Uruguay Round: Statistics on Tariff Concessions Given and Received, World Bank: Washington. Fox, Alan K. (1999), "Evaluating the Success of a CGE Model of the Canada-U.S. Free Trade Agreement," presented at The Second Annual Conference in Global Economic Analysis, June 20-22. Francois. J.F., H. van Meijl and F. van Tongeren (2005), “Trade Liberalization in the Doha Development Round,” Economic Policy April: 349-391. Francois, J.F., THE NEXT WTO ROUND: North-South stakes in new market access negotiations , CIES Adelaide and the Tinbergen Institute, CIES: Adelaide, 2001. ISBN: 086396 474 5. Francois, J.F. (1998), "Scale economies and imperfect competition in the GTAP model," GTAP consortium technical paper. http://www.gtap.agecon.purdue.edu/resources/res_display.asp?RecordID=317 Francois, J.F., B. McDonald and H. Nordstrom (1996b), "Trade liberalization and the capital stock in the GTAP model," GTAP consortium technical paper. http://www.gtap.agecon.purdue.edu/resources/res_display.asp?RecordID=310) Francois, J.F. and D.W. Roland-Holst (1997), "Scale economies and imperfect competition, in Francois,J.F. and K.A. Reinert, eds. (1997), Applied methods for trade policy analysis: a handbook, Cambridge University Press: New York. Hall, R.E. (1988), "The relation between price and marginal cost in U.S. industry", Journal of Political Economy, Vol. 96, No. 5, pp. 921-947. Hertel, T. and M. Tsigas (1996), “The Structure of GTAP,” in Hertel, T., ed., (1996), Global Trade Analysis, Cambridge University Press: Cambridge MA. http://www.gtap.agecon.purdue.edu/models/current.asp Martins, J.O., Scarpetta, S. and D. Pilat (1996), " Mark-Up Ratios In Manufacturing Industries Estimates For 14 OECD Countries," OECD Economics Department Working Paper No. 162. McDougall, R., ed. (2001). The GTAP database -- version 5, Global Trade Analysis Center: Purdue University.

Economic Impact of a Potential Free Trade Agreement between the European Union and South Korea
Page 88 of 92
Roeger, W. (1995), "Can Imperfect Competition explain the Difference between Primal and Dual Productivity Measures? Estimates for US manufacturing", Journal of Political Economy, Vol. 103, No. 2, pp. 316-330.

Economic Impact of a Potential Free Trade Agreement between the European Union and South Korea
Page 89 of 92
Annex Table 1
Model Paramaters and Market Structure by Sector 1/
elasticity of substitution in value added
trade substitution
elasticityelasticity of
scalemarket
structureSECTORS
agriculture and processed foods1 grains 0.35 5.82 0.00 PC2 horticulture 0.24 3.70 0.00 PC3 oil seeds 0.24 4.90 0.00 PC4 sugar 0.73 5.40 0.00 PC5 natural fibers 0.24 5.00 0.00 PC6 beef 0.65 6.92 0.08 IRTS/AC7 dairy products 0.69 7.30 0.08 IRTS/AC8 vegetable oils 1.12 6.60 0.08 IRTS/AC9 other prinary agriculture 0.24 5.82 0.00 PC
10 other processed foods 1.12 10.91 0.11 MC11 beverages and tobacco 1.12 10.91 0.11 MC
other primary12 forestry 0.20 5.00 0.00 PC13 fisheries 0.20 2.50 0.00 PC14 mining 0.20 13.44 0.05 IRTS/AC
manufacturing
15 textiles 1.26 7.50 0.00 PC16 clothing 1.26 7.40 0.00 PC17 leather 1.26 8.10 0.00 PC18 lumber 1.26 6.80 0.00 PC19 paper, pulp, publishing 1.26 5.90 0.20 MC20 petrochemicals 1.26 4.20 0.31 MC21 chemicals, rubber, and plastics 1.26 6.60 0.18 MC22 iron and steel 1.26 6.85 0.17 MC23 non-ferrous metals 1.26 6.85 0.17 MC24 motor behicles 1.26 9.85 0.11 MC25 electrical machinery 1.26 9.85 0.11 MC26 other machinery 1.26 9.85 0.11 MC27 other manufactures 1.26 9.33 0.12 MC
services28 utilities 1.26 7.60 0.00 PC29 construction 1.40 7.60 0.29 IRTS/AC30 trade 1.68 7.60 0.00 PC31 transport 1.68 7.60 0.00 PC32 communications 1.26 7.60 0.15 MC33 financial and banking services 1.26 7.60 0.15 MC34 insurance 1.26 7.60 0.15 MC35 other business services 1.26 7.60 0.15 MC36 other services 1.26 7.60 0.00 PC
1/
PC: perfect competition, with Armington-based trade.MC: monopolistic competition.IRTS/AC industry-wide scale economies, average cost pricing, and Armington trade.
source: GTAP (2006), Antweiller and Trefler (2002), Francois (2001), and Inui and Kwan (2004).

Economic Impact of a Potential Free Trade Agreement between the European Union and South Korea
Page 90 of 92
Annex Table 2, Services regression results NAME COEFFICIENT t-ratio
sector dummies utilities -0.82 -2.14trade 2.74 7.96transport 3.81 10.70communications 1.47 4.00other financial services 1.37 3.60insurance and real estate 1.37 3.50other business services 3.54 8.81other services 3.05 7.39
country values and dummies GDP 13.60 1.95GDPsquared -0.47 -1.87PCI 0.08 0.54Australia -2.47 -2.29New Zealand -0.34 -0.26Other Oceania 6.30 1.74China -3.14 -2.36Japan -2.96 -3.32Korea -2.87 -2.48Taiwan -2.41 -2.48Other East Asia 2.79 1.27Indonesia -1.60 -2.28Malaysia 0.83 1.09Philippines -0.14 -0.15Thailand -0.44 -0.65Vietnam 2.50 1.24Other Southeast Asia -1.65 -1.84Bangladesh -2.30 -1.56Cambodia 12.20 1.70India -3.92 -3.24Pakistan -1.35 -1.15Sri Lanka 3.80 1.13Other South Asia 3.67 1.51Other Central Asia -0.22 -0.31Canada -2.12 -1.63Mexico -3.22 -2.53Other Americas -2.51 -1.91EU25 -1.21 -2.50EFTA -1.10 -0.96Turkey -1.09 -1.56Russia -2.63 -2.55Other Europe 0.74 1.02North Africa and ME -2.20 -1.66South Afria -0.90 -1.32Sub-Saharan Africa -1.36 -1.58R-squared: 0.74 Singapore and Hong Kong and the US are taken as the benchmark. The US is included because it was not statistically different from the other two.
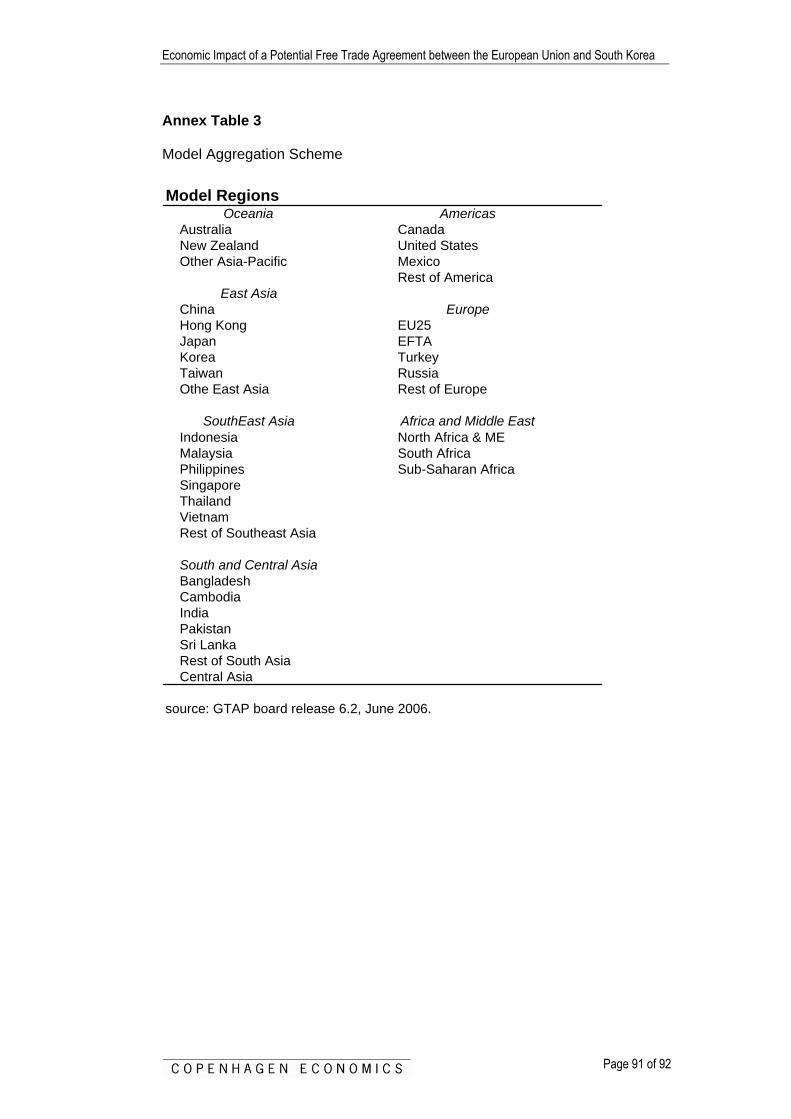
Economic Impact of a Potential Free Trade Agreement between the European Union and South Korea
Page 91 of 92
Annex Table 3 Model Aggregation Scheme
Oceania AmericasAustralia CanadaNew Zealand United StatesOther Asia-Pacific Mexico
Rest of AmericaEast Asia
China EuropeHong Kong EU25Japan EFTAKorea TurkeyTaiwan RussiaOthe East Asia Rest of Europe
SouthEast Asia Africa and Middle EastIndonesia North Africa & MEMalaysia South AfricaPhilippines Sub-Saharan AfricaSingaporeThailandVietnamRest of Southeast Asia
South and Central AsiaBangladeshCambodiaIndiaPakistanSri LankaRest of South AsiaCentral Asia
source: GTAP board release 6.2, June 2006.
Model Regions
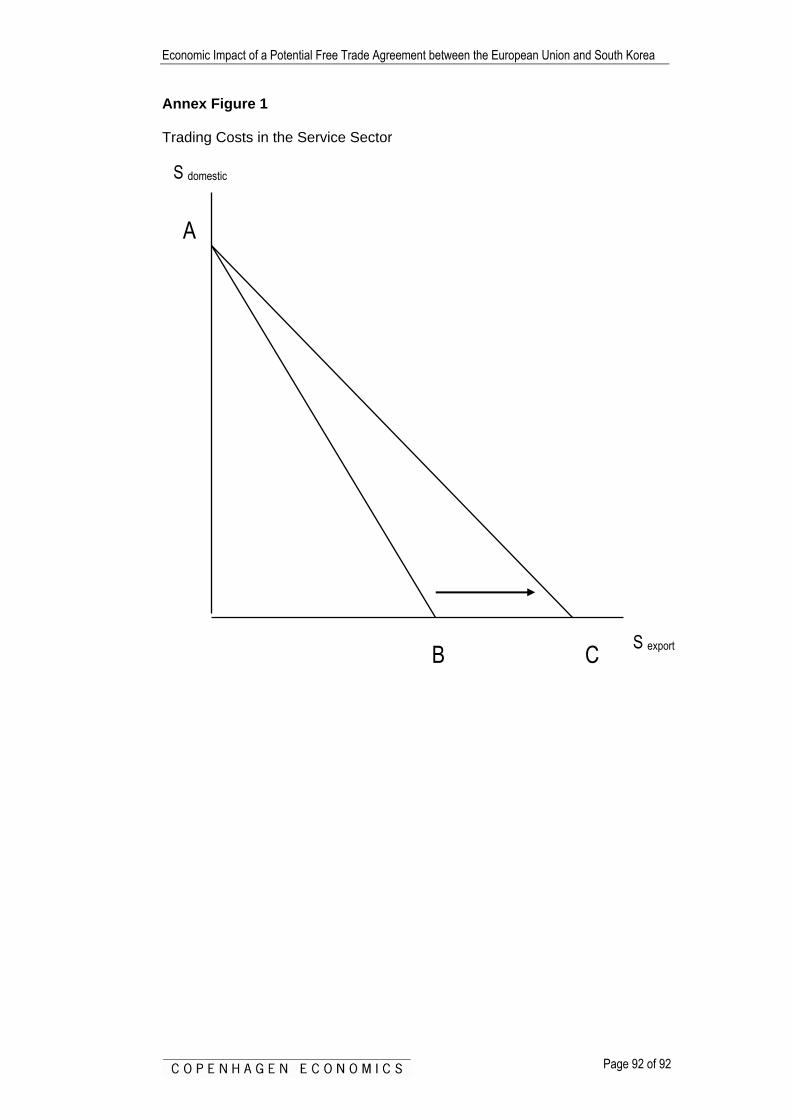
Economic Impact of a Potential Free Trade Agreement between the European Union and South Korea
Page 92 of 92
Annex Figure 1 Trading Costs in the Service Sector
S domestic
S export
A
B C