Economic Impact and Regeneration in City Economies
82
Financial Inclusion Initiatives Economic Impact and Regeneration in City Economies APPENDICES Appendix A List of interviewees Appendix B Business Intervention Model (BIM) Overview Appendix C Survey Report and Data Appendix D Questionnaire Appendix E Description of the Economic Model and Applications Appendix F Input/Output Modelling Spreadsheet Appendix G Leeds and the Yorkshire and Humber Economy
Transcript of Economic Impact and Regeneration in City Economies

Financial Inclusion Initiatives
Economic Impact and Regeneration in
City Economies
APPENDICES
Appendix A List of interviewees Appendix B Business Intervention Model (BIM) Overview Appendix C Survey Report and Data Appendix D Questionnaire Appendix E Description of the Economic Model and Applications Appendix F Input/Output Modelling Spreadsheet Appendix G Leeds and the Yorkshire and Humber Economy

2
Appendices – Table of Contents
A. List of interviewees..............................................................................3 B. BIM overview......................................................................................4 C. Survey report, Community Consultants, March 2009 ................................6 Summary..................................................................................................6 1. Introduction........................................................................................9
1.1 Background..................................................................................9 1.2 Methodology ................................................................................9 1.3 Presentation of results ................................................................. 10
2. Profile of sample ............................................................................... 11 2.1 Age, gender and ethnic origin ....................................................... 11 2.2 Household type........................................................................... 12 2.3 Disability, longstanding illness or infirmity ...................................... 13 2.4 Employment and worklessness...................................................... 13 2.5 Household income and receipt of benefits ....................................... 14 2.6 Access to the internet at home...................................................... 16
3. Contacting the organisation and support received .................................. 16 3.1 Time since contacting organisation ................................................ 16 3.2 Main reason for contacting the service ........................................... 16 3.3 Other advice agencies contacted ................................................... 17 3.4 Membership of the Credit Union .................................................... 17
4. Changes since the financial inclusion intervention................................... 19 4.1 Changes in income since the financial intervention........................... 19 4.2 Savings ..................................................................................... 21 4.3 Credit or borrowings.................................................................... 23 4.4 Debts ........................................................................................ 25 4.5 Managing debts .......................................................................... 28 4.6 The level of debts ....................................................................... 29 4.7 Change in employment since the intervention ................................. 31 4.8 Change in income levels since the intervention................................ 31 4.9 Reasons for feeling better off........................................................ 32 4.10 Amount better off a week............................................................. 33 4.11 Where extra money is spent ......................................................... 37
5. Other changes since the financial inclusion intervention .......................... 37 5.1 Managing money ........................................................................ 37 5.2 Concern about getting into debt .................................................... 39 5.3 Where respondents would go if they needed money in a hurry .......... 40 5.4 Quality of life.............................................................................. 41 5.5 Stress about financial matters....................................................... 47 5.6 Change in general health ............................................................. 48 5.7 Other changes............................................................................ 49
D Questionnaire....................................................................................... 50 E. The economic impact – models and applications..................................... 63
Introduction ......................................................................................... 63 The Keynesian income-expenditure model ................................................ 63 The input-output approach ..................................................................... 64 Applications of multiplier models in financial inclusion evaluations ................ 68 Selecting a model for Leeds – considerations and justification...................... 70 The Yorkshire and Humber input-output table............................................ 70
F. The input-output modelling spreadsheet ............................................... 71 G. Leeds and the Yorkshire and Humber economy ...................................... 80

3
A. List of interviewees
1. Steve Hunt, East North East Homes Leeds 2. Jill Wildman, East North East Homes Leeds 3. Roger Smith, Leeds Corporate Debt Unit 4. Garry Kerrigan, Leeds Corporate Debt Unit 5. Joy Wetherill, Leeds Welfare Rights Unit 6. Steve Blighton, Advice and Benefit Liaison Team 7. Stephanie Brown, Leeds City Credit Union 8. Norma Thompson, NHS Leeds 9. Chris Hartley, Connect Housing 10. Ruth Hays, npower 11. Dianne Lyons, Leeds CAB 12. Nick Morgan, Chapeltown CAB

4
B. BIM overview
Name of intervention / function Total revenue generated
Total costs incurred (includes "wastage" where
appropriate) Net absolute
return
Return on Investment (per £1 invested)
Return per beneficiary assisted
(pre‐costs)
Return per beneficiary assisted
(post‐costs)
Estimated "untapped" potential
ABLT £7,742,760 £673,577 £7,069,183 £11.49 £375.19 £342.55 N/A Leeds MAP £1,995,138 £808,543 £1,186,595 £2.47 £778.44 £462.97 N/A Connect Housing £20,095 £17,863 £2,233 £1.13 N/A N/A N/A Corporate Debt Policy Unit £355,393 £88,335 £267,057 £4.02 £2,552.01 £1,917.69 £3,472,621 Leeds City Credit Union £3,021,468 £312,500 £2,708,968 £9.67 £501.07 £449.25 N/A npower £925,084 £67,192 £857,891 £13.77 £196.62 £182.34 £18,051,771
Welfare Rights Unit £9,404,653 £847,394 £8,557,259 £11.10 £548.12 £498.73 N/A
Total (BIM verified) £23,464,591 £2,815,404 £20,649,187 £8.33 £458.01 £403.05 £21,524,392
East North East Homes £1,164,005 £184,660 £979,345 £6.30 £650.28 £547.12 Leeds MAP (NHS funded provision) £1,320,337 £236,297 £1,084,040 £5.59 £994.23 £816.30 Total (non‐BIM verified) £2,484,342 £420,957 £2,063,385 £5.90 £796.77 £661.77 £0
Total ‐ BIM & non‐BIM (non‐weighted for City) £25,948,934 £3,236,361 £22,712,572 £8.02 £477.44 £417.89 £21,524,392
Total ‐ BIM & non‐BIM (weighted for City) £28,060,747 £3,546,056 £24,514,691 £7.91 £475.92 £415.78 £21,524,392
Cost of LCC Administrative £22,720
5
function (net of Value Added)
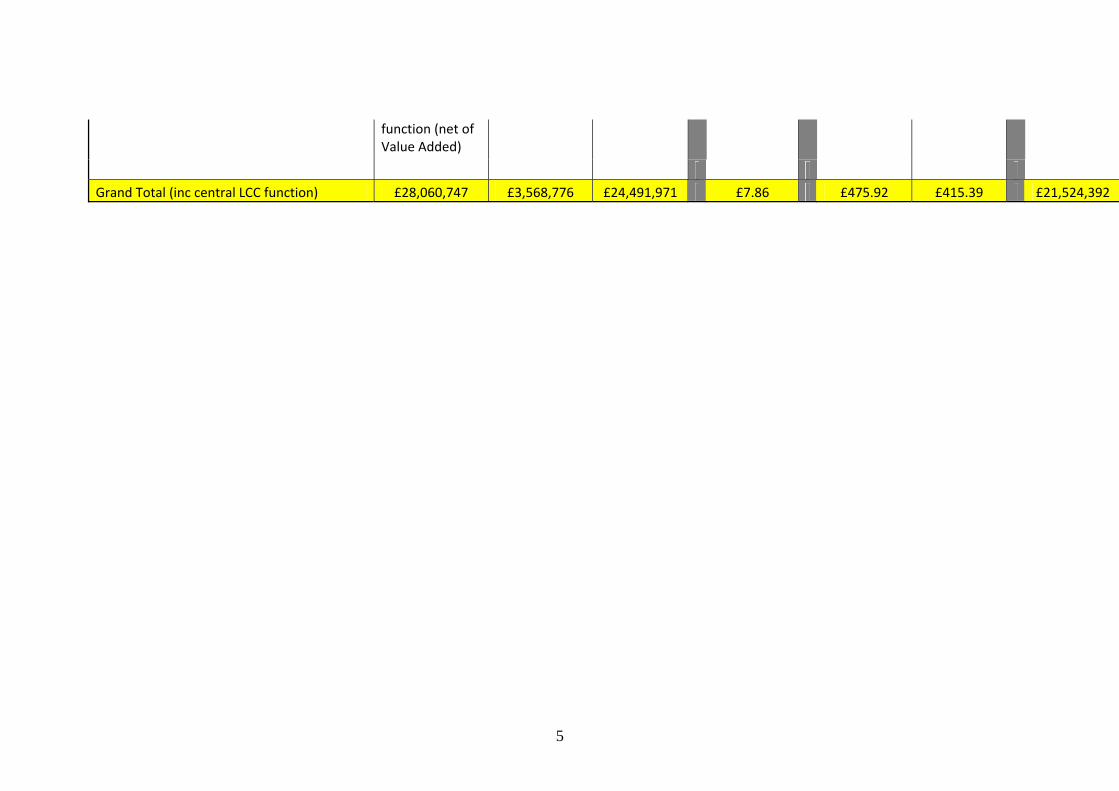
Grand Total (inc central LCC function) £28,060,747 £3,568,776 £24,491,971 £7.86 £475.92 £415.39 £21,524,392

6
C. Survey report, Prepared by Jane Dawson, Community Consultant, March 2009
Summary This report presents the findings of a survey of people who have received financial support from Leeds Money Advice Partnership (MAP)1, Leeds City Credit Union or Leeds City Council’s Welfare Rights Unit or Benefits Service. A total of 527 people were interviewed over the phone. Profile of respondents The three samples had markedly different profiles.
The MAP sample who were debt advice clients were more likely than average to be living alone. Just over one in three were women and 45% were aged between 30 and 44. The LCCU sample who were Credit Union members using services which had received financial exclusion funding were mainly women (79%) younger than average with 39% aged 18-29 with a high proportion of lone parents (48%). The WRU/LBS sample were older than average (42% aged 60 or over) with a high proportion of people being disabled or having a long term illness. Many of this sample were having help with claiming disability and related benefits. Changes since seeking support Since receiving the support, the main changes to income for the MAP sample were reducing or paying off debts (60%), making new arrangements for paying off debts (61%) and claiming more benefits or tax credits (23%). The main changes for the LCCU sample were in paying off loans (39%) and reducing or paying off debts (29%). The main change for the WRU/LBS sample was the receipt of additional benefits or tax credits (69%). Most of the remainder of the sample were either awaiting the outcome of their application or appeal, were not eligible for any further benefits or had received support with completing an application to continue receiving benefits and were not entitles to anything additional.
Savings Half the MAP sample do not save at all, with a quarter having a building society or bank savings account and a quarter putting money aside in a jar or envelope. Three quarters of the LCCU sample have a Credit Union account and over half the WRU/LBS sample have a bank or building society savings account. The LCCU sample are far more likely to save now than before joining (56%). A total of 19% of MAP respondents and 14% of the WRU/LBS sample save more now than before the support. 1 Leeds Money Advice Partnership includes the following organisations; Leeds CAB, Chapeltown CAB, Burley Lodge Advice Centre, St Vincents Support Centre, and Ebor Gardens Advice Centre

7
Credit or borrowings The proportion of the MAP sample with credit or borrowings had reduced from 86% to 71% at the time of the interview. The main sources of credit were credit cards, bank loans and catalogues.
Half the LCCU sample had credit or borrowings before joining with door step lenders being the main source of credit. At the time of the interview the proportion of the sample with credit had increased to 69% s 55% had a credit union loan. However the proportion using high interest credit such as door step lenders had decreased to 11%. About one in three of the WRU/LBS sample had credit before receiving support and this was little changed at the time of the interview. A debt was expressed as falling behind with payments, a loan for which people were making payments Debts as the schedule were not counted as debts. The proportion of the MAP sample with debts reduced from 95% before to 74% at the time of interview.14% of the MAP sample with debts became bankrupt. The total debt before seeking support was approaching £2m which had reduced to about £1m at the time of the interview (163 respondents giving figures). £625,000 of this was owed by people becoming bankrupt. The remaining sample had reduced their debts by about £375,000 The proportion of the LCCU sample with debts reduced from 44% to 24%. Some of these debts were paid off with money taken out as Credit Union loans. The LCCU sample (64 respondents giving a figure) owed a total of £1.1m which reduced to £60,000 at the time of the interview.
A quarter of the WRU/LBS sample had debts, little changed after the support. The WRU/LBS sample (32 respondents giving a figure) reduced from £60,000 to about £45,000. Change in income levels Almost half the MAP sample (47%), half the LCCU sample (52%) and 57% of the WRU/LBS sample felt better off as a result of the support. For the MAP sample the main reasons were reduced payments of loans and debts and better money management. For the LCCU sample the main reasons were better money management and reduced interest payments on loans. For the WRU/LBS sample the main reason was increased benefit/tax credit payments. The MAP sample in total claimed to be nearly £3000 w eek better off (90 respondents); the LCCU sample nearly £1900 (89 respondents) and the WRU sample nearly £4,500 (96 respondents). Managing money

8
A total of 60% of the MAP sample and 64% of the LCCU sample said that their ability to manage their money has improved since receiving the support or joining the Credit Union. When asked where they would go if they needed money such as £250 in a hurry, fewer respondents now mentioned high interest forms of credit such as credit cards or door step lenders. Quality of life Respondent’s quality of life has improved since seeking the support with financial matters (57% of the MAP sample, 52% of the LCCU sample and 36% of the WRU/LBS sample). Respondents mentioned less stress, being able to cope better, being able to manage their money better and having the security of some savings. Some of the WRU/LBS sample mentioned being able to pay for some of the support they needed such as taxis or help around the home. Two in three MAP respondents, 45% of the LCCU sample and 38% of the WRU/LBS sample said stress about financial matters had been reduced. A total of 41% of the MAP sample said their general health had improved.

9
1. Introduction
1.1 Background This report presents the findings of a survey of clients who have received financial support and to assess the impact this intervention had. The aim was to establish the extent to which clients had benefited from these services in terms of:
• managing their money; • the extent to which they used sub-prime sources of credit; • their level of debt; • how much better off they were in financial terms; • the extent to which this benefited the Leeds economy; • other benefits such as changes to health and lifestyle.
Clients of the following organisations who have received funding for financial inclusion work were included in the study:
• Leeds Money Advice Partnership (MAP) including Leeds Citizens Advice Bureau, Burley Lodge Advice Centre, Chapeltown CAB, Ebor Gardens Advice Centre and St Vincents Support Centre;
• Leeds Welfare Rights Unit (WRU) and Leeds Benefits Service (LBS); • Members of Leeds City Credit Union (LCCU) who use services supported
with financial inclusion resources such as budgeting accounts and Handiloans.
1.2 Methodology Interviews were conducted over the telephone with clients of the four organisations. To ensure the confidentiality of the agencies’ clients, the agencies concerned contacted their clients and asked them if they would be willing to take part in this survey. All respondents were offered a £5 voucher as an incentive. The contact details of those interested were then passed on to the survey company.
The MAP contacted clients who had received their intervention at least six months previously so that there was time to establish what the impact had been. WRU and LBS collected permissions from clients when they visited an advisor (or when an advisor visited the client) with but in many cases these were on-going clients. LCCU asked clients if they wished to participate when they were visiting a branch. The final part of the sample was collected by interviewers visiting Credit Union offices and collecting names of people willing to be interviewed. Credit Union clients were to have a budgeting account, handiloan or have benefits paid into their accounts, that is in receipt of services which have received support from the Growth Fund. The Credit Union sample is not representative of all Credit Union members. The survey took considerable longer than initially anticipated as it took time to build up a large enough contact list. Interviews with the MAP clients, Leeds Benefits Service and the majority of WRU clients were conducted between mid July and mid

10
August 2008 with further WRU clients being interviewed in early October 2008. LCCU clients were interviewed between mid July and mid February 2009. The number of interviews conducted is shown in Table 1.1
Table 1.1 Number of interviews conducted with clients of each service Number NumberLeeds CAB 81 St Vincents 26 Chapeltown CAB 21 Burley Lodge 46 Ebor Gardens 16
190
Credit Union 140 170 WRU 125 Benefits Service 42 167
Base: complete sample 527 527
1.3 Presentation of results Percentages are either based on the complete sample (total) or on a sub-sample. The number of respondents for each column is given at the foot of the column (termed base). In some cases columns do not sum to 100%. This could be due to computer rounding errors (which means any sum between 98 and 102 should be considered as 100%), cases where respondents could give more than one response or cases where ‘don’t know’ responses have been omitted. An asterisk in tables means that fewer than 0.5% of respondents gave that response.
Statistical significance of the results
The sampling tolerance depends on both the number of interviews and on the proportion of people giving a particular response.
Approximate sampling tolerance: percentage of respondents giving a response at or near these levels
10% or 90% 30% or 70% 50%
All interviews with an agency (~175)
+/- 4.0% +/- 7% +/-7.5%
This means that if 30% of the sample overall gave a particular response, the true answer lies between 23% and 37%, although it is more likely to be near 30%.
The results are only presented for the three client groups separately; aggregated data has no meaning as the organisations have different aims. Analysis for different groups within each sample are generally not presented because the number of interviews was not sufficient or there were no differences in opinion.

11
2. Profile of sample This section presents the profile of the sample.
2.1 Age, gender and ethnic origin More than half the respondents for each of the services were women (Figure 2.1), with 79% of Credit Union respondents being women. Figure 2.1 Gender profile of the sample
38%21%
40%
62%79%
60%
0%
25%
50%
75%
100%
MAP Credit Union WRU, LBS
FemaleMale
Base: complete sample (MAP 190, WRU 167, Credit Union 170) The age profiles of the users of the three services differed markedly. Almost half the MAP clients (45%) were aged between 30 and 44 with 9% aged under 30, 30% 44-59 and 15% 60 or over. Credit Union respondents were younger on average with 39% aged under 30, 43% aged 30-44 and only 12% aged 44-59 and 6% 60 or above. The WRU/LBS sample was much older with 42% aged 60 or over, 32% 45-59 and only 26% under 45. Figure 2.2 Age profile of the sample
9%
39%
3%
45%
43%
23%
31%
12%
32%
15% 6%
42%
0%
25%
50%
75%
100%
MAP Credit Union WRU, LBS
60+45-5930-4418-29
Base: complete sample (MAP 190, WRU 167, Credit Union 170)
12
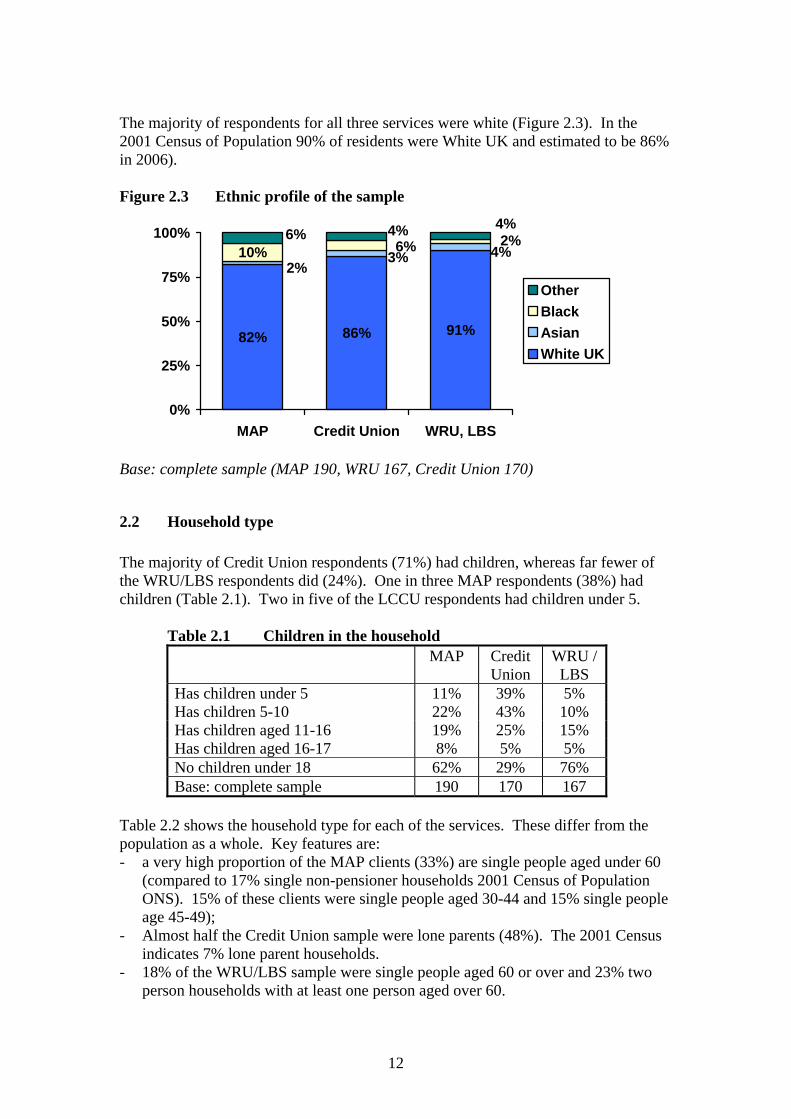
The majority of respondents for all three services were white (Figure 2.3). In the 2001 Census of Population 90% of residents were White UK and estimated to be 86% in 2006).
Figure 2.3 Ethnic profile of the sample
82% 86% 91%
10% 4%3%2%
6% 2%4%6%
4%
0%
25%
50%
75%
100%
MAP Credit Union WRU, LBS
OtherBlackAsianWhite UK
Base: complete sample (MAP 190, WRU 167, Credit Union 170)
2.2 Household type The majority of Credit Union respondents (71%) had children, whereas far fewer of the WRU/LBS respondents did (24%). One in three MAP respondents (38%) had children (Table 2.1). Two in five of the LCCU respondents had children under 5.
Table 2.1 Children in the household MAP Credit
Union WRU /
LBS Has children under 5 11% 39% 5% Has children 5-10 22% 43% 10% Has children aged 11-16 19% 25% 15% Has children aged 16-17 8% 5% 5% No children under 18 62% 29% 76% Base: complete sample 190 170 167
Table 2.2 shows the household type for each of the services. These differ from the population as a whole. Key features are: - a very high proportion of the MAP clients (33%) are single people aged under 60
(compared to 17% single non-pensioner households 2001 Census of Population ONS). 15% of these clients were single people aged 30-44 and 15% single people age 45-49);
- Almost half the Credit Union sample were lone parents (48%). The 2001 Census indicates 7% lone parent households.
- 18% of the WRU/LBS sample were single people aged 60 or over and 23% two person households with at least one person aged over 60.

13
Table 2.2 Household Structure MAP
Credit Union
WRU, LBS
One adult <60 33% 14% 22% One adult 60+ 7% 4% 19% Two adults both 60 or under 7% 6% 7% Two adults at least one age 60+ 9% 2% 24% Three or more adults 6% 4% 5% Lone parent 22% 48% 11% Couple + kids 15% 18% 11% Extended family with children 1% 4% 1% Other - 1% 1% Base: complete sample 190 170 167
2.3 Disability, longstanding illness or infirmity There was a high incidence of disability of longstanding illness in the sample (Figure 2.3) amongst the MAP and WRU/LBS respondents. The 2001 Census found 18% of the population had a limiting long term illness (ONS). Figure 2.3 Disability and long standing illness
37%
21%
68%
14% 15%27%
55%66%
19%
0%
20%
40%
60%
80%
MAP Credit Union WRU / LBS
Self Other in household None
Base: complete sample (MAP 190, WRU 167, Credit Union 170)
Just over one in three of the MAP respondents (37%) said they had a disability or long standing illness. Overall, two in three (68%) of the WRU clients had a disability or long standing illness and 27% said this applied to another person in their household. Only one in five (19%) of the WRU/LBS clients said no-one in their household had a disability or longstanding illness. This reflects the age profile of this sample and the fact that many respondents had sought advice about disability benefits.
2.4 Employment and worklessness Relatively few respondents were in employment (Table 2.3). Of the MAP sample, 19% worked full-time, 13% part time and 2% were self-employed. A total of 15% of the LCCU sample worked full-time and 14% part-time. Very few of the WRU/LBS sample were in employment with 53% saying they were permanently sick or disabled.

14
Table 2.3 Employment status of sample MAP Credit
Union WRU /
LBS Employee full time 19% 15% 2% Employee part time 13% 14% 5% Self employed (full or part-time) 2% - 1% Unemployed available for work 12% 11% 4% Retired 9% 4% 26% Full time education 1% 3% - Looking after family / home 17% 41% 4% Sick / disabled 23% 11% 53% Other (mainly caring) 4% 1% 5% Base: complete sample 190 170 167
One in three of the MAP and LCCU samples said there was someone working in their household (Table 2.4). One in five (20%) of the WRU/LBS sample had a working person in their household. This is far higher than the national average where, in 2008, 16% of working age households were workless (Labour Force Survey ONS).
Table 2.4 Workless households MAP Credit
Union WRU /
LBS Total 63% 63% 80% Children in household 51% 71% 63% Respondent aged under 60 58% 64% 74% Lone parent 68% 80% 89% Base: all respondents 190 170 167
Note: number of respondents in sub categories is small, data illustrative only
2.5 Household income and receipt of benefits Respondents were asked for the income coming in to their household including any benefits or pensions they may be receiving. Table 2.5 and Figure 2.4 show that incomes are very low. The results need to be treated with caution as respondents may not have included all their benefits, such as benefits which they do not see such as housing or council tax benefit and some respondents do not know about the income of other household members. However, taken with the high proportion claiming benefits, these results can be taken as indicative of very low incomes.
Table 2.5 Estimated weekly household incomes for the sample MAP Credit
Union WRU /
LBS Under £60 pw 4% 2% 1% £60-£119 18% 21% 16% £120-199 26% 31% 26% £200-299 28% 23% 28%

15
£300-£479 10% 11% 11% £480-£674 3% 3% 1% £675+ - 2% - Refused 7% 2% 13% Not sure 4% 5% 5% Base: complete sample 191 169 167
Figure 2.4 Estimated weekly household incomes for the sample
47%
54%
43%
28%23%
28%
10% 11% 11%
3% 5%1%
11%7%
17%
0%
10%
20%
30%
40%
50%
60%
MAP Credit Union WRU / LBS
Under £200 pw £200-£300 pw £300-£479 pw £480+ pw Refused, not sure
Base: complete sample (MAP 191, WRU 167, Credit Union 169)
The majority of respondents received one or more benefits (Table 2.6); 8% of MAP respondents, 88% of LCCU respondents and 94% or WRU/LBS respondents.
Almost two in three of the WRU/LBS sample were in receipt of one or more benefits relating to disability or illness.
Table 2.6 Receipt of benefits MAP Credit
Union WRU /
LBS Housing benefit 58% 71% 48% Council tax benefit 59% 68% 65% JSA 8% 11% 2% Income support 31% 45% 20% Disability benefits, Incapacity Benefit 31% 20% 62% Working Tax Credit 14% 14% 6% Child Tax Credit 25% 58% 17% Pensioner Credit 8% 2% 20% Other - 1% 2% None of these 17% 11% 5% Don't know 1% 1% 1% Base: complete sample 190 170 167
16
2.6 Access to the internet at home Two in five (41%) of the MAP sample, 45% of the LCCU sample and 37% of the WRU/LBS sample had access to the internet at home.
3. Contacting the organisation and support received
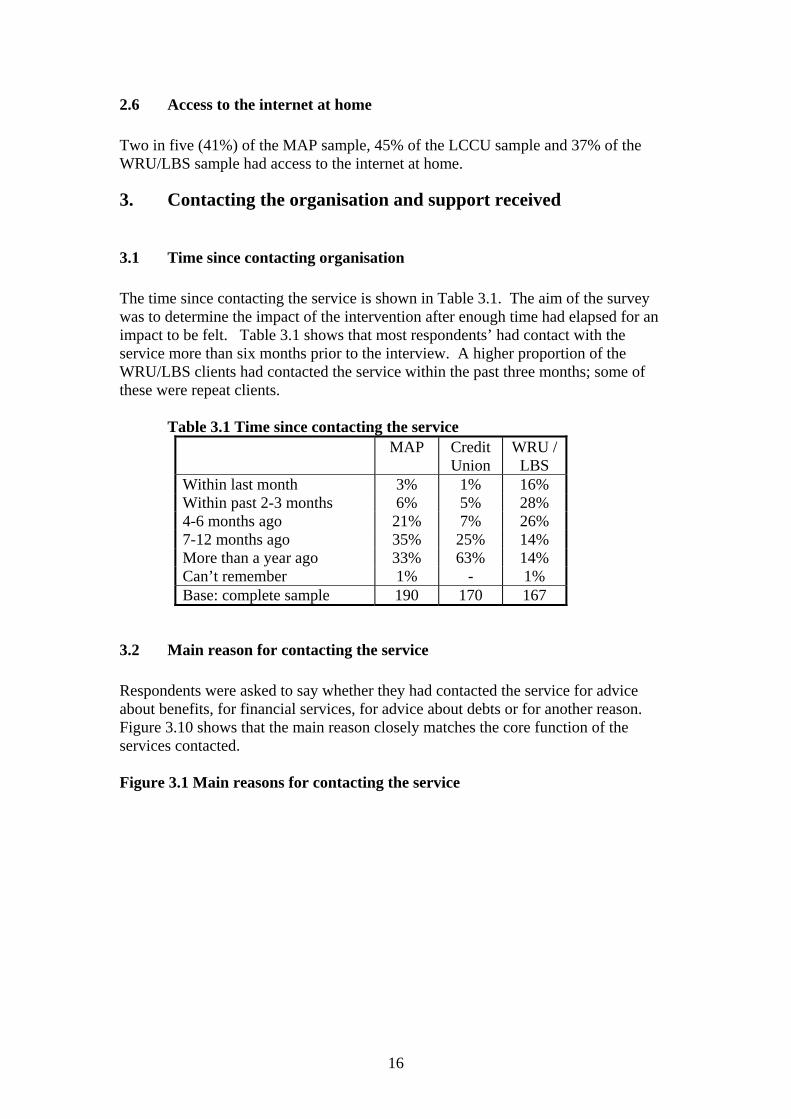
3.1 Time since contacting organisation The time since contacting the service is shown in Table 3.1. The aim of the survey was to determine the impact of the intervention after enough time had elapsed for an impact to be felt. Table 3.1 shows that most respondents’ had contact with the service more than six months prior to the interview. A higher proportion of the WRU/LBS clients had contacted the service within the past three months; some of these were repeat clients.
Table 3.1 Time since contacting the service
MAP Credit Union
WRU / LBS
Within last month 3% 1% 16% Within past 2-3 months 6% 5% 28% 4-6 months ago 21% 7% 26% 7-12 months ago 35% 25% 14% More than a year ago 33% 63% 14% Can’t remember 1% - 1% Base: complete sample 190 170 167
3.2 Main reason for contacting the service Respondents were asked to say whether they had contacted the service for advice about benefits, for financial services, for advice about debts or for another reason. Figure 3.10 shows that the main reason closely matches the core function of the services contacted.
Figure 3.1 Main reasons for contacting the service

17
9% 4%
97%
5%
98%
1%
91%
4% 2%4%0%
20%
40%
60%
80%
100%
120%
MAP Credit Union WRU / LBS
Benefit advice Financial services Debts Other
Base: complete sample (MAP 190, WRU 167, Credit Union 170)
3.3 Other advice agencies contacted One in five of the MAP sample (19%, Table 3.2) had contacted another organisation for advice including the main MAP if they had contacted one of the other centres from which MAP advisors work. Other sources included the National Debt Line, the Consumer Credit Counselling Service and various debt management companies, ‘the internet’ or a housing support team. A total of 8% of the LCCU sample had contacted someone else, mainly high street banks which were unable to offer the service they wanted. A total of 7% of the WRU / LBS sample had been somewhere else, mainly the CAB or other advice centres which offer a CAB service.
Table 3.2 Other agencies contacted
MAP Credit Union
WRU / LBS
Yes 19% 8% 7% No 81% 92% 92% Credit Union 1% - - Leeds CAB 5% 2% 2% St Vincent’s 1% - 1% Burley Lodge - - 1% Ebor Gardens 1% - - National Debt Line 2% - - CCCS 3% - - Other 9% 6% 4% Base: complete sample 190 170 167
3.4 Membership of the Credit Union One in five of the MAP (19%) sample and 7% of the WRU/LBS sample were members of the Credit Union. The survey asked what services members used (Table 3.3). The list on the questionnaire did not include the membership account which was

18
coded as a savings account. Some respondents said they had a ‘normal’ account, also coded as a savings account. Few respondents said they had a budget or bill paying account, people might have referred to this as a current account.
Table 3.4 Services used by LCCU members Credit Union
sample MAP or WRU
sample Current account 47% 62% Savings account 69% 47% Savings account for a child 4% 2% Child Trust Fund account 3% 2% Christmas Club account 19% 4% Budget account (bill paying) 8% - Loan 79% 26% Other 1% 2% Base: complete sample 170 48
Almost half the CU sample (47%) said they had a current account, 69% a savings account and 8% a bill paying account. A total of 4% had a savings account for a child, 3% a child trust fund account and 19% a Christmas club account. The majority of respondents (89%) said they had a loan. A half the CU sample aid they had a handiloan with 15% saying they were not sure what type of loan they had, 6% said a general loan, 4% a consolidation loan and 4% a flexi-loan. Respondents were read a list of possible reasons for joining LCCU (Figure 3.2). Figure 3.2 Reasons for joining LCCU
12%
13%
20%
22%
23%
36%
37%
38%
42%
0% 10% 20% 30% 40% 50% 60%
Local service
Other reason
Staff understanding
Advised to join
Office convenient location
Loans at a reasonable rate
To save small amounts of money
Borrow small amounts of money
Open account to receive benefits
Credit UnionMAP/WRU sample
Base: LCCU sample (170)
The main reasons for joining were to open an account to receive their benefits (42%) (one of the criteria for being interviewed), to be able to save small amounts of money

19
(37%) and to be able to borrow at a reasonable rate of interest (36%). One in five (22%) said they had been advised to join, often by friends or family and 20% said the staff were understanding.
4. Changes since the financial inclusion intervention
4.1 Changes in income since the financial intervention Respondents were asked about changes they may have made since the financial intervention that might have contributed to changing their income, that is contacting MAP, WRU, LBS or joining the Credit Union (Figure 4.1). The main change for the WRU/LBS sample is an increase in benefits claimed. The main changes for the MAP sample is in the reduction of the level of debt and new arrangements being made for paying off debts. The main changes for the LCCU sample is in paying off loans and the reduction in the level of debt. Figure 4.1 Changes made since the financial intervention
4%
8%
2%
8%
2%
2%
10%
66%
10%
29%
4%
6%
6%
39%
8%
8%
61%
60%
4%
11%
1%
15%
7%
8%
17%
0% 10% 20% 30% 40% 50% 60% 70%
New arrangements for payingdebts, payment plan
Reduced or paid off debts
Changed from prepayment meter
Changed fuel supplier to lowercharge
Transferred loans to provider withlower interest
Paid off loans
Joined LCCU
Claimed tax credits not claimingbefore
Claimed benefits not claimingbefore
MAPLCCUWRU/LBS
Base: complete sample (MAP 190, WRU 167, Credit Union 170)

20
Claimed benefits/tax credits that you were not claiming before: Almost a quarter (23%) of the MAP sample were claiming benefits or tax credits that they were not claiming before they visited the MAP. A total of 13% of the LCCU sample were claiming benefits or tax credits they were not claiming before. A total of 69% of the WRU/LBS sample were claiming benefits or tax credits that they were not claiming before. A total of 8% commented that they were not eligible for any extra benefits and 13% were still awaiting the outcome from their application or appeal. One in ten of the WRU/LBS sample made no comment specifically that they were still waiting to hear or were not eligible but it is likely that these respondents were people who had reapplied for benefits, often where the application forms are complex, so they carried on claiming the benefits they had before. Of those who had contacted the WRU, 73% were claiming additional benefits or tax credits compared with 60% of those contacting the LBS (but the sample size was small). Joined Leeds City Credit Union: 7% of the MAP sample and 2% of the WRU/LBS sample said they had joined the Credit Union since contacting these organisations. Paid off loans: Overall, 15% of the MAP sample and 39% of the LCCU sample had paid off loans since seeking advice or joining the Credit Union. Transferred loans to a provider with a lower interest rate: A total of 1% of the MAP sample and 6% of the Credit Union sample said they had transferred loans to a provided with a lower interest rate. It is possible that the true figure is higher than this because a number of LCCU respondents appear to have a loan from the Credit Union now and had previously had loans from other companies. They may have used the Credit Union loan to pay off other loans but not considered this as ‘transferring loan to another provider’. Changed fuel supplier to one with a lower charge: relatively few respondents had changed their fuel supplier to one with a lower charge since contacting the agency or joining the Credit Union, ranging from 11% of MAP respondents to 8% of WRU/LBS respondents and 6% of LCCU respondents. Changed from a prepayment meter: Small numbers of respondents (4% MAP, 4% LCCU and 3% WRU/LBL) had changed from a prepayment meter. Reduced or paid off debts: Three in five of the MAP sample (60%) has reduced or paid off debts since receiving advice. Just over a quarter (29%) of LCCU respondents (just over half of those with debts). A total of 2% of the WRU/LBS sample had paid off debts but very few of this sample had any debts.
Made new arrangements for paying off debts or set up a payment plan: A total of 61% of the MAP sample had made such arrangements as had 10% of the LCCU sample and 4% of the WRU/LBS sample. Some of the LCCU sample who had

21
reduced their debts said they had just paid it off themselves without any specific arrangement. When asked if their income had changed in any other way, 18% of MAP respondents, 16% of LCCU respondents and 3% of WRU/LBS respondents said that it had. Respondents’ income had changed for a variety of reasons, mainly relating to changing jobs, getting a job or losing a job (Table 3.1.).
Table 4.1 Other ways in which respondents’ incomes have changed since the intervention
MAP Credit Union
WRU / LBS
Got a job 9 4 - Stopped work 6 3 1 Just usual increase in benefit levels 2 5 2 Better paid job 5 3 - My / partner's wages/hours decreased 2 1 1 Had a baby - 4 - Partner moved in / married 2 1 - Me / partner work more hours 2 1 - No longer on tax credits 2 - - Come off IB and back to JSA or IS 2 - - Child left home so no tax credits - 2 - Base: those whose income has changed other than by ways shown in Fig 3.4)
34 28 5
4.2 Savings The survey asked about how people saved and whether they saved more or less since the intervention. Table 4.2 shows that almost half the MAP sample (46%) do not save using any of the methods covered. A quarter of the MAP sample (27%) put money aside in jar or envelope and 27% have a bank or building society savings account. The majority of the LCCU sample use one or more of these methods of saving with 72% having a Credit Union savings account.
Table 4.2 How people save MAP Credit
Union WRU /
LBS Bank or building society savings account 27% 16% 54% Credit Union savings account 12% 72% 7% Christmas hamper scheme or similar 1% 6% - Christmas club or similar run by local shop 1% 7% 1% Informally with work colleagues, friends etc. 1% - - Putting money in a jar or envelope 27% 36% 23% Asking relative/friends to save/look after for you 6% 8% 3% None of these 46% 16% 32%

22
Base: complete sample 190 170 167
Just over half the WRU/LBS sample have a bank or building society savings account. In general respondents who had a bank or building society savings account had this account prior to the financial inclusion intervention:
• 15% of the MAP sample with a bank or building society account had opened it after the intervention;
• 44% of the LCCU sample with bank or building society account had opened it after the interventions;
• 4% of the WRU/LBS account holders had opened it after the intervention.
When asked about their approach to saving (Table 4.3), more than half the MAP sample and 44% of the WRU/LBS sample said they did not really save at all. A higher proportion of LCCU respondents said they saved (24% don’t really save).
Table 4.3 Approach to saving MAP Credit
Union WRU /
LBS I don't save at all 56% 24% 44% I save money to pay bills 13% 23% 29% I save up to but things I want or need 22% 46% 27% I tend to put money away for the future 9% 15% 20% I save money for emergencies 12% 30% 21% Base: complete sample 190 170 167
The main reason for saving was to save up to buy things they need or want then to save for emergencies or to pay bills. Fewer people ‘save for the future’. Table 4.4 shows show often people save. Generally, about half of savers said they save regularly, at least once a month, with most of the rest savings as and when they can.
Table 4.4 Frequency of saving MAP Credit
Union WRU /
LBS Don't really save 56% 22% 44% I save regularly, at least once a month 20% 41% 29% I save regularly but less than once a month 3% 3% 4% I put money by as and when I can 21% 34% 23% I have paid money in before but not in past 12 months
- - 1%
Base: complete sample 190 170 167
The LCCU respondents (56%) were more likely to save now they were members of the Credit Union (Figure 4.2). A total of 19% of the MAP sample and 14% of the WRU/LBS sample said they saved more.
Figure 4.2 Change in pattern of savings since the intervention

23
19%
56%
14%
21%
22%
36%
57%
20%
45%
0%
10%
20%
30%
40%
50%
60%
70%
80%
90%
100%
MAP Credit Union WRU / LBS
Still save nothingSaved lessSaved the sameSaved more
Base: complete sample (MAP 190, WRU 167, Credit Union 170) Very few respondents said they actually saved less but 57% of the MAP sample, 45% of the WRU/LBS sample and 20% of the LCCU sample still save nothing.
4.3 Credit or borrowings
The survey asked about the type of credit or borrowings respondents had before the intervention and what they had now in order to see whether there was any change in the sources of credit away from sub-prime lenders (Tables 4.5 to 4.7, Figure 4.3). The key features are:
• 86% of the MAP sample had credit or borrowings before the intervention which reduced to 71% (Table 4.5). The main sources of credit were credit cards (53%), overdraft (42%), bank loans (31%) and catalogues (25%). All sources of borrowings reduced after the intervention.
• Half the LCCU sample (51%; Table 4.6) had credit or borrowings before joining the Credit Union with door step lenders being the main source of credit (25%). 28% of the LCCU sample had one or more of the sub-prime or high interest sources of credit listed. This reduced to 11% at the time of the interview. However, the proportion of the LCCU sample with credit or borrowings had increased to 69% due to 55% of the sample having a Credit Union loan.
• One in three of the WRU/LBS sample had some sort of credit or borrowings which was little changed after contacting the agency (Table 4.7).
Table 4.5 Sources of credit – MAP sample Before Now Mortgage 12% 11% Overdraft at bank 42% 28% Hire purchase 16% 8%

24
Interest free loan 1% - Credit card not paid off 53% 36% Store card not paid off 11% 6% Bank loan 31% 23% Building society loan 2% 2% Student loan 4% 3% Credit Union loan 4% 5% Finance company loan (door step lender) 19% 14% Unlicensed lender 4% 3% Brighthouse 1% 1% Pawnbrokers, cash converters etc. 2% 1% Other lenders such as payday lenders 1% 1% Catalogues 25% 19% Social fund 4% 4% Family 7% 3% Friends 4% 3% Other 2% 2% None 14% 29% Base: MAP sample 190 190
Table 4.6 Sources of credit – LCCU sample Before Now Mortgage 1% 1% Overdraft at bank 8% 6% Hire purchase 3% 2% Credit card not paid off 5% 2% Store card not paid off 2% 1% Bank loan 6% 2% Building society loan 1% - Student loan 1% 1% Credit Union loan 1% 55% Finance company loan (door step lender) 25% 9% Unlicensed lender 1% 1% Brighthouse 3% 1% Pawnbrokers, cash converters etc. 2% 1% Other lenders such as payday lenders 1% 1% Catalogues 10% 8% Social fund 13% 8% Family 5% 2% Friends 4% 1% Other 1% 1% None 49% 31% Base: LCCU sample 170 170
Table 4.7 Sources of credit WRU/LBs sample
Before Now Mortgage 10% 10% Overdraft at bank 10% 7% Hire purchase 1% 1%

25
Interest free loan 1% 1% Credit card not paid off 11% 10% Store card not paid off 1% 1% Bank loan 7% 5% Building society loan 1% 1% Student loan 1% 1% Credit Union loan 1% 1% Finance company loan (door step lender) 4% 4% Brighthouse 1% 1% catalogues 6% 5% Local shops 1% 1% Social fund 1% 2% Family 2% 2% None 66% 66% Base: WRU/LBS sample 167 167
Figure 4.3 Selected sources of credit before intervention and at time of interview
12%
13%
4%
9%
43%
61%
6%
8%
2%
6%
24%
33%
5%
5%
11%
28%
16%
22%
66%
66%
31%
49%
29%
14%
0% 20% 40% 60% 80%
WRU / LBS -now
WRU / LBSthen
Credit Union- now
Credit Unionthen
MAP -now
MAP - then
None
Doorstep / pawnbrokersetc.Bank, building society loan
Credit cards/HP
Base: complete sample (MAP 190, WRU 167, Credit Union 170)
4.4 Debts
Tables 4.8 to 4.10 show the debts of the sample before the intervention and at the time of the interview. The main points are discussed below.

26
MAP sample
The MAP sample comprised clients of debt advice services so virtually all respondents had debts when they sought advice (95%). The remaining 5% were people who had received notices about debts that were errors or the debt was that of another family member. At the time of the interview, the proportion of the sample with debts had reduced to 74% and the proportion with individual types of debts had also fallen. The number of different debts that any one individual respondent had had also decreased.
Almost half the sample had credit card debts (47%) which had reduced to 32% (Table 4,8). About one in three respondents had debts with rent, council tax electricity or water. About a quarter of had debts with their gas accounts, bank overdrafts and bank loans. As will be shown debts were reduced either by paying off some of the balance or by becoming bankrupt.
Table 4.8 Debts – MAP sample Before After Mortgage 6% 3% Rent 38% 25% Council tax 35% 22% Water rates 36% 23% Electricity 32% 17% Gas 27% 15% Telephone, mobile 12% 3% Rental TV, DVD 2% 1% TV Licence 8% 4% Credit card bill 47% 32% Store card bill 11% 5% Catalogues 21% 15% Bank overdraft 26% 17% Bank building society loan 24% 15% HP 6% 3% Finance company / door step lenders 15% 9% Loans family or friends 7% 4% Other loans 4% 2% Parking fines 3% 2% Other 3% 2% Refused 1% 1% Not sure 1% - None 5% 26% Complete sample 190 190
Credit union sample The proportion of the LCCU sample with debts almost halved since joining the Credit Union, with 44% having debts before joining which had reduced to 24% at the time of

27
interview. Small proportions of respondents had almost all the possible types of debt listed with the most significant being rent (13%), water rates (13%) and door step lenders (12%). At the time of the interview 4% of the LCCU sample had debts with a door step lender.
Table 4.9 Debts – LCCU sample Before Now Mortgage - - Rent 13% 8% Council tax 5% 4% Water rates 13% 8% Electricity 9% 5% Gas 8% 6% Telephone, mobile 3% 2% TV Licence 8% 4% Credit card bill 4% 2% Store card bill 2% 2% Catalogues 5% 2% Bank overdraft 2% 2% Bank building society loan 3% 2% HP 1% - Finance company / door step lenders 12% 4% Loans family or friends 1% - Parking fines 1% 1% Other 2% 1% Refused 1% - None 56% 76% Base: complete LCCU sample 170 170
WRU/LBS sample About a quarter of the WRU/LBS sample had debts before receiving advice from the WRU which fell slightly to 25% at the time of the interview. Small proportions of respondents had debts in almost all of the categories listed.
Table 4.10 Debts WRU/LBS sample Before Now Mortgage 2% 1% Rent 8% 5% Council tax 6% 5% Water rates 8% 7% Electricity 7% 5% Gas 4% 3% Telephone, mobile 1% 1% TV Licence 1% 1% Credit card bill 7% 7% Catalogues 4% 3% Bank overdraft 2% 2% Bank building society loan 3% 2%

28
HP 1% - Finance company / door step lenders 2% 2% Loans family or friends 1% 1% Not sure 1% 1% None 72% 75% Base: complete WRU/LBS sample 167 167
4.5 Managing debts Virtually all the MAP sample with debts (95%) said the various options open to them were explained. Far fewer LCCU or WRU clients (Table 4.11) said the options for dealing with their debts were explained to them but some respondents said that they did not ask for any advice or did not tell the agency that they had debts.
Table 4.11 Whether the agency explained options for managing debts MAP Credit
Union WRU /
LBS Yes 93% 38% 24% No 6% 45% 67% Not sure 1% - 2% NA, did not discuss my debt / did not tell them
- 18% 7%
Base: all with debts 179 74 45
Two in three of the MAP sample said the MAP set up a payment plan with their creditors (Table 4.12). A total of 15% of the LCCU sample said they had been helped with setting up a payment plan.
Table 4.12 What happened to manage debts MAP Credit
Union WRU /
LBS Agency set up payment plan 69% 15% 16% Went bankrupt 14% 1% - Did nothing 4% 46% 40% Other action 11% 35% 38% Not sure if set up payment plan 2% 3% 7% Base: those with debts 179 74 45
A total of 14% of the MAP sample said they were declared bankrupt as was one LCCU respondent. Just under half the LCCU and WRU samples said they did nothing about their debts as result of the intervention. About one in three of the LCCU and WRU/LBS samples said ‘did something else’, mainly making their own payment arrangements with the creditors themselves rather than an agency doing it on their behalf. Almost all the MAP sample (82%) said they were still paying their payment plan and 6% had completed their payments. Those who had stopped paying their plan gave a
29
variety of reasons including losing their job, the fact that the plan was only for a year and the year was now up, that they could not manage the payments and had renegotiated with one respondent saying he could not get to he post office in time to make the payments and another saying they fell behind so decided to go bankrupt. All the LCCU sample were still making their payments or had paid the debts off.
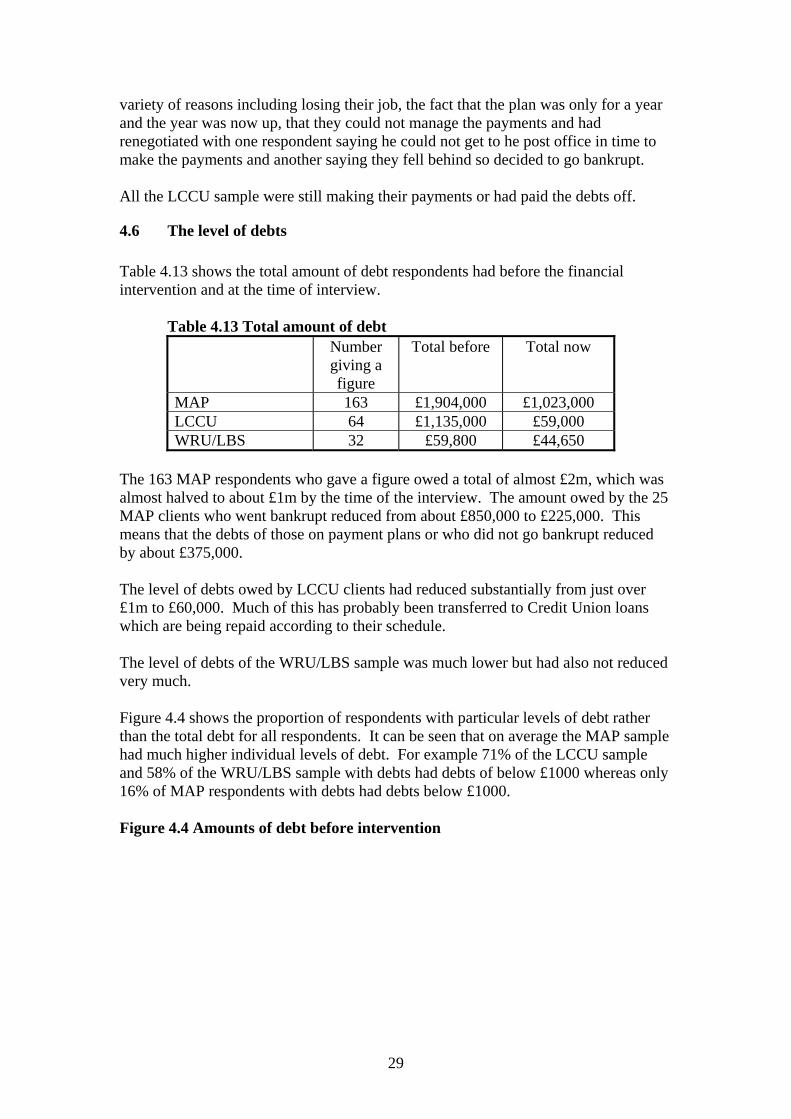
4.6 The level of debts
Table 4.13 shows the total amount of debt respondents had before the financial intervention and at the time of interview.
Table 4.13 Total amount of debt Number
giving a figure
Total before Total now
MAP 163 £1,904,000 £1,023,000 LCCU 64 £1,135,000 £59,000 WRU/LBS 32 £59,800 £44,650
The 163 MAP respondents who gave a figure owed a total of almost £2m, which was almost halved to about £1m by the time of the interview. The amount owed by the 25 MAP clients who went bankrupt reduced from about £850,000 to £225,000. This means that the debts of those on payment plans or who did not go bankrupt reduced by about £375,000. The level of debts owed by LCCU clients had reduced substantially from just over £1m to £60,000. Much of this has probably been transferred to Credit Union loans which are being repaid according to their schedule. The level of debts of the WRU/LBS sample was much lower but had also not reduced very much. Figure 4.4 shows the proportion of respondents with particular levels of debt rather than the total debt for all respondents. It can be seen that on average the MAP sample had much higher individual levels of debt. For example 71% of the LCCU sample and 58% of the WRU/LBS sample with debts had debts of below £1000 whereas only 16% of MAP respondents with debts had debts below £1000.
Figure 4.4 Amounts of debt before intervention

30
2%
14%
25% 25%20%
11%16%
55%
3% 1%
9%
24%
7%2%
23%
49%
0%
10%
20%
30%
40%
50%
60%
Up to £100 £199-999 £1000-4999
£5000-£9999
£10,000-£24999
£25+
MAPCredit UnionWRU / LBS
Base: number with debts (MAP 179, WRU 45, Credit Union 74)
Figure 4.5 Amounts of debt at time of interview
23%
3%
10%
28%
17%
11%
3%
32%
8%
3%1%
40%
22%
2% 2%
15%
39%
11% 13%
0%
5%
10%
15%
20%
25%
30%
35%
40%
45%
None Up to£100
£199-999 £1000-4999
£5000-£9999
£10,000-£24999
£25+
MAPCredit UnionWRU / LBS
Base: number with debts (MAP 179, WRU 45, Credit Union 74)
At the time of the interview, about a quarter of the MAP sample and a third of the LCCU sample no longer had any debts. One in three of the MAP sample (36%) either had no debts or debts below £1000. The equivalent figure for the LCCU sample was 79% and for the WRU/LBS sample 64%. Figure 4.6 summarises these findings showing that three in four of the MAP and LCCU samples with debts at the time of the intervention had reduced their level of debt. A total of 15% of the MAP sample, 14% of the LCCU sample and 22% of the WRU/LBS sample said their debt levels were unchanged. A small proportion said their debts had increased (5% - MAP, 8% LCCU and 9% WRU/LBS).
Figure 4.6 Change in level of debts since the intervention

31
5% 8% 9%
77% 74%60%
15% 14%22%
0%
25%
50%
75%
100%
MAP Credit Union WRU / LBS
Not sureAbout the sameLessMore
Base: number with debts (MAP 179, WRU 45, Credit Union 74)
4.7 Change in employment since the intervention A total of 9% of the MAP and LCCU samples had taken up employment since the intervention, with small numbers of respondents having taken up training (Table 4.14.
Table 4.14 Change in employment status since the intervention MAP Credit
Union WRU /
LBS Taken up paid employment 9% 9% 1% Started a training course 7% 4% 2% Been made redundant 4% 2% - None of these 83% 86% 98% Base: complete sample 190 170 167
A total of eleven respondents said that receiving the advice or support had helped them with finding a job or training.
4.8 Change in income levels since the intervention
Respondents were asked whether or not they were financially better off as a result of the intervention, and if better off by how much. Some respondents found it very hard to estimate amounts or even to decide whether or not they were better off because of the effects of inflation particularly of utility and food bills. Just under half the MAP sample (47%) felt better off and 12% saying they felt much better off. Just over half the LCCU sample felt better off with 8% saying they felt much better off. The WRU/LBS sample were the most likely to feel better off (57%) with 16% saying they were much better off.
Table 4.15 Extent to which respondents feel better off after the intervention
MAP Credit Union
WRU / LBS

32
Much better off 12% 8% 16% Better off 35% 44% 41% Much the same 45% 44% 38% Worse off 6% 4% 2% Much worse off 1% - 1% Don't know 1% 1% 2% Base: complete sample 190 170 167
Figure 4.7 Extent to which respondents feel better off after the intervention
47% 52% 57%
45% 44% 38%
7% 4% 3%
0%
25%
50%
75%
100%
MAP Credit Union WRU / LBS
Worse offMuch the sameBetter off
Base: complete sample (MAP 190, WRU 167, Credit Union 170)
A small proportion of respondents said they were worse off (Table 4.15). The following reasons were given:
• Bills going up (5 respondents) • No longer in employment (5 respondents) • The payments for the debts make it hard to keep up with current bills (3
respondents) • My debts are mounting (2 respondents) • Initially better off but after year the interest went up again (1 respondent) • I had to take out another loan (1 respondent) • A benefit has been stopped (1 respondent) • Payment plan increased from £1 to £12 pcm (1 respondent) • I am not getting benefits I am entitled to (1 respondent) • Family member sick - cost money in hospital visits etc (1 respondent) • Husband missing and left me all his debts which were in his name (1
respondent) • Initially better off but then I got into debt again (1 respondent) • I took a job but then left it as I was worse off than before (1 respondent)
4.9 Reasons for feeling better off All respondents who felt better off were read a list of possible reason (Table 4.16). The main reasons why the MAP sample felt better off were that they had reduced payments on loans or debts (51% of those feeling better off) and that they were

33
managing their money better. The main reasons why the LCCU sample felt better off were that they were managing their money better (71%) and/or they were paying less interest on loans (31%). The WRU/LBS sample felt better off because they were claiming more benefits (93%) or tax credits (16%). Other reasons for feeling better off including having some savings now making people feel more secure, having a job or better paid job and one respondent said she was £40 a week better off as she had stopped smoking.
Table 4.16 Reasons for feeling better off (prompted) MAP Credit
Union WRU /
LBS Claiming more benefits 14% 8% 93% Claiming more tax credits 7% 9% 16% Someone working 11% 1% - Reduced payments on loans, debts etc. 51% 17% 2% Paying less interest on loans or credit 11% 31% 2% Managing money better 31% 71% 3% Other 8% 16% - Bankrupt 11% - - Base: all feeling better off 90 89 96
4.10 Amount better off a week
Respondents were then asked to say how much a week better off they were. Some found this hard to say and others said that they felt better off because they were managing their money better and could buy more of what they needed but they did not actually have any more money in their pocket. The total extra money per week for the MAP sample was just under £3000 per week and just under £2000 for the LCCU sample. The total for the WRU/LBS sample was almost £4,400 per week. Of this, £3,500 was for respondents who had a disability or long term limiting illness and £560 to respondents whose partner had a disability or long term limiting illness. £260 of this was to respondents where no household members were disabled or long term ill. Half the WRU/LBS respondents who felt better off said they had more than £30 a week more than before (Table 4.18).
Table 4.17 Total amount better off per week Number
feeling better off
Number giving a figure
Total Per week
MAP 90 69 £2,872 LCCU 89 63 £1,856 WRU/LBS 96 81 £4,583
Table 4.16 Amount better off per week

34
MAP Credit Union
WRU / LBS
Nothing 11% 8% 2% £5 or less 10% 2% 3% £6-10 9% 15% 9% £11-15 3% 8% 3% £16-20 7% 9% 6% £21-30 8% 9% 6% More than £30 29% 20% 54% Don't know, hard to say 23% 29% 16% Base: all feeling better off 90 89 96
The main things the additional money was sent on were food, bills and for the LCCU sample savings and things for the children (Table 4.17). Some WRU/LBS respondents spent their additional money on things to help them with their day to day living such as a cleaner or taxis so they were able to get out.
Table 4.17 What extra money is spent on MAP Credit
Union WRU /
LBS Food 30% 28% 27% Bills 21% 15% 27% Savings 9% 35% 9% Things for the children 9% 31% 3% Clothes 6% 9% 6% Debts 9% 6% 4% Things that help me with my disability 1% - 16% Increasing prices, inflation 4% 1% 10% Going out / socialising 6% 7% 2% Things for the house 4% 2% 4% Taxis - - 9% Holiday 4% 2% 2% Petrol 4% 1% 2% Repairs to the house/decorating 1% 1% 5% Not sure - not had it yet - - 7% Birthdays / treats 2% 3% 1% Essentials 2% 1% 3% Transport 3% 1% 1% Other 2% 2% 1% To help the person I care for - - 2% Bus pass 1% - - No idea - just goes! - - 1% Rent - - 1% No extra money, just feel better off 19% 11% 7% Base 90 89 96
Some comments illustrating how important this additional money has been for some respondents are listed below:

35
“I can afford a bus pass now, I used to have to walk to work and could not eat until I got to work as I have free food at work. Now I spend £10 on my bus pass and about £10-£15 per month on food.” “It has made life easier, I have not really spent it, it has just gone on bills and things. I pay everything Direct Debit and everything is increasing.” “Just bills and helping my dad out - he is 85 and I am his carer.” “I was not actually paying any of the debts so I am not actually any better off - going bankrupt has cleared the debts, it is more of a mental thing than financial.” “I am not better off moneywise, I am just able to manage better, with food and everything going up there is no extra money.” “Shopping, saving each month and taking the kids out. I am better off because I can pay for what I need now, they told me how I could cut down on things.” “I don't know how much but it is better. I buy for the children, better food, taking them out more, clothes, shoes, upkeep of the house. The Credit Union put me in touch with Burley Lodge who put me on a payment plan.” “On my daughter, food clothes and going out - spending time together.” “Normal living plus a taxi for shopping because of my disability.” “I am not really better off in money terms but I am paying off my debts now.” “I feel much better off, I was always getting behind, now it is all going out by direct debit so I don't have to think about it.” “I am not sure how much better off I am but I feel much better off. The money goes on bills and paying off my debts so I don’t have any extra in my pocket. I was not really paying my bills before.” “I can pay for taxis now and pay friends if they help me - and I have had my garden done.” “I try and save a bit, the rest goes on food and sometimes we take a taxi to take my husband to hospital.” “Hard to say how much, I now have the Credit Union loan so I am gradually paying off my debts and I pay my bills now - I save up and what I have left each week I buy little things for myself like knickers.”
“Food, I eat properly now.” “I bought a new shirt, something I need.”

36
“I am not really any better off money wise but I am better off with their advice and support, without this it would have got worse.” “Hard to say, I am not paying out on my debts but I don't own anything now so I can pay my bills.” “I am paying my bills now and buy more food - just general day to day things” “Being able to get out more, being able to get a taxi when I want to .” “Not sure really, an odd game of bingo now and then.”
“Food, they were absolutely brilliant, they were really supportive, they even phoned to see how I was after I went bankrupt. Before I used all my benefits to pay my debts - I kept up to date with my bills but my parents were feeding us. I don't have a lot of money now but it does feed and house us.” “Just keeping out heads above water - bills and shopping; it just stops the worry.” “I pay for a cleaner and for people to come and help me shower etc. I am still waiting to see if I can get pensioner credit.” “At the moment I am using it to pay back to mother because she kept me while the benefit claim was going through.” “I can pay people to do the things that need doing that I can't do my self, I will also have motability.”
“I am not sure, the money has been approved after I went to Welfare Rights but I have not actually got it yet - the first thing is for a headstone for my wife.” “I have the same money. I am managing it better - I am using it more sensibly. I am saving for Christmas etc., before I was spending it.” “My daughter or clothes, or I leave it in the account ready to pay any bills. It stops unnecessary spending. I have learned to manage my money better and I now manage to pay my car insurance which means I can drive my car and I can manage my time better too.” “For the kids. In what I pay each week I am not paying such high interest, I can go to a cash machine and get the exact amount what I need out; I can budget better.” “I cannot say an amount, just that they pay all my bills from my budget account with the money that goes in so I know how much I have left.” “Hard to say but it gives me peace of mind, the Credit Union gives me a comfort zone.” “I spend the extra on food and clothes. Since joining the credit union my money goes into my credit union account not direct to me so I don't spend it all at once.”

37
4.11 Where extra money is spent One of the aims of this study was to assess the economic benefit to the Leeds economy of the financial inclusion interventions. The survey therefore asked respondents to say where they spent any additional money, was it in their neighbourhood, in the rest of Leeds or outside the Leeds Metropolitan area. Respondents found this hard and many said they spent it all locally, even where they were including such things as utility bills. They presumably spent the money on their prepayment cards in local shops or post offices. The results are much the same for the three samples and many respondents were not really certain, so for simplicity the overall responses are shown in Table 4.18. These data should just be treated as giving an indication that respondents spend most of this additional money in their local area.
Table 4.18 Where additional money is spent – all respondents who feel better off In local
area In rest of Leeds
Outside Leeds
All 50% 3% 1% 50% or more 15% 7% 1% 25-49% 1% 6% 1% Under 25% 1% 3% 2% None 6% 52% 66% No reply/don't know 27% 29% 28% Base: all who feel better off 275 275 275
5. Other changes since the financial inclusion intervention
5.1 Managing money Respondents were asked how good they were at managing their money and whether they thought this had improved since the financial inclusion intervention. Overall, about half the MAP sample thought their skills at dealing with money matters were good and 19% poor. Nearly three in five of the LCCU sample (Figure 5.1) thought their skills were good and 19% that they were poor. The WRU/LBS sample were more likely to think these skills were good (76%) with 11% thinking them poor. Almost all respondents aged over 60 thought their money management skills were good. Figure 5.1 Skills about dealing with money matters

38
12% 11%
32%
39% 48%
44%
29% 22%
12%15% 14%
7%
0%
25%
50%
75%
100%
CAB Credit Union WRU / LBS
Very poorPoorNeither good nor poorGoodVery good
Base: complete sample (MAP 190, WRU 167, Credit Union 170) The MAP and LCCU samples in general thought their money management skills had improved whereas there was little difference for the WRU/LBS sample. The WRU/LBS sample was far less likely to be in debt or to use sub-prime sources of credit anyway. Overall 60%of the MAP sample thought their ability to manage money had improved with 21% saying it had improved a lot and 39% that it had improved a bit. Overall two in three of the LCCU sample thought their ability to manage money had improved with 18% saying it had improved a lot and 46% that it had improved a bit. Figure 5.2 whether ability to manage money has changed as a result of the intervention
21% 18%3%
39% 46%
13%
39% 35%
81%
2% 1% 3%
0%
25%
50%
75%
100%
MAP Credit Union WRU / LBS
WorseMade little differenceImproved a bitImproved a lot
Base: complete sample (MAP 190, WRU 167, Credit Union 170) When asked how well they thought they were managing their money at present a small percentage (Table 5.3) said they were getting into difficulties (15% MAP, 5% LCCU and 8% WRU/LBS). About half of each sample said they were just getting by.

39
Just over a quarter (29%) of the MAP sample, 39% of the LCCU sample and 42% of the WRU/LBS sample said they were managing well. Figure 5.3 How respondents feel they are managing their money at present
29%39% 42%
56%56% 50%
15%5% 8%
0%
25%
50%
75%
100%
MAP Credit Union WRU / LBS
Getting into difficultiesJust getting byManaging well
Base: complete sample (MAP 190, WRU 167, Credit Union 170)
5.2 Concern about getting into debt The MAP sample was the most worried about getting into debt with 33% saying they were very worried and 28% fairly worried. The LCCU sample was the least worried with 12% saying they were very worried and 28% fairly worried. This lower level of concern might be because some of these respondents now had low interest Credit Union loans which worried them less than pervious sources of credit. A total of 23% of the WRU/LBS sample were very worried and 23% fairly worried. Three or four respondents commented that they were not worried about getting into debt because they had learned their lesson and were never going to allow this to happen to them again. Figure 5.4 Level of concern about getting into debt

40
33%
12%23%
28%
28%23%
22%
32%29%
17%28% 25%
0%
25%
50%
75%
100%
MAP Credit Union WRU / LBS
Not at all worriedNot very worriedFairly worriedVery worried
Base: complete sample (MAP 190, WRU 167, Credit Union 170)
5.3 Where respondents would go if they needed money in a hurry Respondents were asked to say if they had an emergency and need £250 in a hurry what they would do now, and what they would have done before the intervention (Table 5.1. to 5.3). The main findings are: - The MAP sample was less likely now to say they would use a credit card, take out
a bank loan or a loan from a door step lender. They were more likely to say they would ask family or friends or to say they did not know. Small percentage said they would do without or that they would go back to the advice agency for support.
- Three in four of the LCCU sample would now ask for a Credit Union loan. Previously 22% would have gone to a door step lender, with only 1% saying they would do this now (Table 5.2).
- The behaviour of the WRU/LBS sample would not change much. About one in three would draw on savings and just under one in three would ask family or friends (Table 5.3).
Table 5.1 What MAP respondents would do if they needed £250 in a hurry
Now Before Ask family / friends 42% 27% Ask for Social Fund loan 5% 3% Draw on savings 7% 4% Take out bank loan / overdraft 2% 18% Take out door step lender loan 3% 11% Take out other loan 1% 3% Credit Union loan 4% 2% Credit card 2% 20% Sell something 3% 2% Other 6% 1% Don't know 28% 21%

41
Base: complete MAP sample 190 190 Table 5.2 What LCCU respondents would do if they needed £250 in a hurry
Now Before Ask family / friends 22% 33% Ask for Social Fund loan 2% 8% Draw on savings 6% 2% Take out bank loan / overdraft 1% 11% Take out door step lender loan 1% 22% Take out other loan 1% 3% Credit Union loan 74% 2% Credit card 2% 2% Sell something - 1% Other - 2% Don't know 4% 24% Base: all LCCU sample 170 170
Table 5.3 What WRU/LBL respondents would do if they needed £250 in a hurry
Now Before Ask family / friends 29% 32% Ask for Social Fund loan 2% 2% Draw on savings 38% 37% Take out bank loan / overdraft 4% 5% Take out door step lender loan 2% 4% Take out other loan - 1% Credit Union loan 4% 2% Credit card 2% 3% Sell something 1% 1% Other 4% 1% Don't know 16% 14% Base: all WRU/LBL sample 167 167
5.4 Quality of life About half of respondents said their quality of life had improved since the financial intervention. Few respondents said their quality of life had got worse.
• 57% of MAP respondents thought their quality of life had improved with 19% saying it had improved a lot and 38% a bit. People who were declared bankrupt were particularly likely to say their quality of life had improved.
• Half the LCCU respondents (52%) said their quality of life had improved with 12% saying it had improved a lot and 40% a bit.
• One in three WRU/LBS respondents said their life had improved with 16% saying it had improved a lot and 20% a bit.
Figure 5.5 Change in quality of life since the intervention

42
19% 12% 16%
38%40%
20%
39% 47%60%
4% 1% 3%
0%
25%
50%
75%
100%
MAP Credit Union WRU / LBS
Don't knowGot worseNot changed muchImproved a bitImproved a lot
Base: complete sample (MAP 190, WRU 167, Credit Union 170) All respondents who thought their quality of life had changed were asked why this was (Table 5.4).
• The main reason given by MAP respondents was having less worry or stress. Other reasons included having a bit more money, being able to cope with things better and being able to manage their money better.
• The main reason given by LCCU respondents was being able to mange their money better. Other important factors were having a bit more money, being able to save a little and less worry or stress.
• The main reason mentioned by WRU/LBS clients was having more money. Other reasons included less worry or stress and being able to but the help or support they needed.
Table 5.4 Reasons given for saying quality of life had improved MAP Credit
Union WRU /
LBS Less worry / stress 65% 20% 27% Deal / cope with things better 16% 6% 5% Have more money 11% 14% 62% Can manage my money better 11% 42% 3% I am paying/paid off my debts 6% 3% - I can save a bit now 4% 20% 3% I can pay my bills / pay people now 3% 6% 5% I can buy things for the kids 3% 6% - Not being hassled 3% 2% - I can buy food 2% 1% 2% I am not scared when knock at door / phone rings 2% 2% - I enjoy life more 2% 1% 2% More confident 1% - - Health improved 1% - - Gave me useful advice 1% 2% - Mental health has improved 1% - - Improved family relationships 1% 1% - I have/partner has a job now (won't lose house) 1% - -

43
Did a payment plan 1% - - Improved home 1% - - Had a baby 1% 1% - I can pay for the things/ support / help I need - - 18% I can now take out a loan on low interest so I can buy things I could not buy before
- 5% -
Paying less interest on my loan - 9% - The staff are kind and helpful - 1% - I can pay my bills through this account - 1% - Base: all saying quality of life has improved 108 88 60
Some comments made by MAP respondents are listed below: “I have more confidence, I am more friendly and outgoing, more in control of myself. I have more confidence that I can sort it out. I was thinking of suicide.” MAP respondent “I got a job so I have less worries and I can pay people now, I got into debt when I lost my job, they helped me get JSA and with a payment plan.” MAP respondent “I can look after myself, don't worry now and I can buy food.” MAP respondent “I answer the door and go and answer the phone – I’m not scared anymore.” MAP respondent “It has taken a massive load of my shoulders, I feel safer as I had the bailiffs round, my mental health has improved.” MAP respondent “xx has been a rock to me, she has helped sort bills out. I was crying all the time and on antidepressants before I went to St Vincents.” MAP Respondents “I know where I am now, no letters coming in now asking for money; everything is arranged now.” MAP respondent
“I feel better about myself, I used to get anxiety attacks, I am not so stressed now.” MAP respondent “No stress, no money stress, I sleep better now.” MAP respondent “I feel more at ease with myself because I know the CAB are there and they will help me - the lady I spoke to was very pleasant.” MAP respondent “My husband did not know anything about the £45,000 debt so I got really poorly. It has brought us closer together a bit more as a family. I am 100 times better, I cannot even think of how I was before.” MAP respondent “She has really helped me - I feel more in control now. I am still worried but not so much.” MAP respondent

44
“I have more money now, I can now spend money of the kids and give them pocket money.” MAP respondent “Although it is still being sorted out I am not so worried now. They have taken away the worry, they are so helpful, so skilled and so sensitive.” MAP respondent
“In every way. I am happy, I feel more in control. Burley Lodge gave me the confidence to face up to all my debts and helped organise things for me. Being more confident also helped me get a job. I would have committed suicide if it was not for Burley Lodge.” MAP respondent “No stress now as I don't owe any money as I have gone bankrupt.” MAP respondent “I am more contented in my mind, they got it sorted for me. I was getting threatening letters about debts but I had never been in debt it was someone else. They would not believe me but the CAB sorted it for me.” MAP respondent “I'm not as stressed, happier and I'm eating properly.” MAP respondent “I feel more in control. I did not dare go out of the house before, I could not communicate. I went to Burley Lodge because I kept getting letters about my debts and I did not know what to do - I felt that I just wanted to disappear - they were better than psychiatrists. I feel much better now, my stress level has decreased - now I have someone to talk to - they have been a God send.” MAP respondent “Now I am not trying to clear all the debts I can feed the kids - everything was spiraling out of control.” MAP respondent “I am better at dealing with things, I follow things up. For example my Council Tax, a man came to make a plan for me to pay it and said he would get back to me but he didn't. So today I will ring him, I would not have done that before.” MAP respondent Some comments made by LCCU clients about why their quality of life has improved are listed below: “It took a lot of the worry we had away. Generally we get on better together we argued before about money.” LCCU respondent “Because I have the payment plan and debit card I can pay my bills on time. I've been able to buy food and take the kids out. I am less worried and stressed. The Debit Card is good as I take money out when I need it, before I just spent it.” LCCU respondent “I can save a bit no - and it is much easier to get a loan with low interest, they don't take long to come through and the office is very near to me, the Credit Union is within walking distance.” LCCU respondent “I am better off every week, I can now afford shopping.” LCCU respondent “I have got peace of mind, I have a few pounds put away.” LCCU respondent

45
“I am not really any better off but I don't have to worry now. I would not go down the same road again (borrowing from Provident and Nortons). I don't get letters asking for money now.” LCCU respondents
“In general my life has settled down, more consistent and I am saving monthly.” LCCU respondent “With the Christmas Club you cannot touch it until November. This means I don't get so stressed about Christmas.” LCCU respondent “I have not got door step lenders knocking in the door. I used to have a Norton's loan, I now have a Credit Union loan which has a lower interest.” LCCU respondent “It enabled me to get a car in a shorter time, my work moved and I needed a car to get to the new office. The car has made so much difference to my life and my daughters's. It has enabled me to go to so many places.” LCCU respondent “I don't have to worry now about any bills as I have savings now. It gives me peace of mind.” LCCU respondent “I don't worry so much now, I know I can pay my Credit Union payments and the interest is low - my Credit Union loan paid off all my debts.” LCCU respondent “It has helped me reduce my debts, I can now see the benefit of paying it back, allowed me to monitor my debts on the website - I check on a daily basis - it has helped me manage my money.” LCCU respondent “Although I have the same money, I manage it a little better now, I seem to have a bit left over.” LCCU respondent “I know they are there if I get into any trouble and they will help - they are really friendly and helpful and deal with anything straightaway - they are always there for me.” LCCU respondent “Less worry, I used to have people knocking on the door every week asking for their money. Now all my money goes into the credit union and my bills are paid straight out of it.” LCCU respondent “There is no-one knocking on the door now, not got loads on interest on top.” LCCU respondent “The Credit Union has improved my life financially. I had tax credit overpayments and I had no way of paying them back. I took out a Welcome Finance loan - my MP is looking into it for me. My stress levels have reduced, I can borrow money with less interest - they are very fair. You can sleep at night when you are with them.” LCCU respondent “I have had a loan for a holiday to take the kids away, the loans are manageable to pay back.” LCCU respondent

46
“I am not worried now - I just live off the money I get - before I was using it all to pay things off.” LCCU respondent “Well I am able to save a bit of money now which makes me feel better. Also I know I can get a loan if I want to.” LCCU respondent “I have learned how to budget now - the credit Union on line advice was very helpful - and I have some free money now.” LCCU respondent
“They are kind thoughtful and helpful - they speak to you. I can manage my money much better now, they will only give you what they know you can pay back.” LCCU respondent “If I wasn't with them I wouldn't be able to cope and support ourselves - I can rely on them if I'm worried, I can ask for advice. They are helping me sort out my debts - I will be paying off my doorstep loans so I have one payment - they are doing this for me now. I didn't realise I could go to them for this help.” LCCU respondent “I can give the kids a better life” LCCU respondent “I can save for the first time in my life and I can treat the kids at Christmas.” LCCU respondent “In every way - I manage my money better - I am just better altogether – calmer.” LCCU respondent Some comments made by WRU/LBS respondents about why their quality of life has improved are listed below:
“Now I can get taxis and help when needed without worrying about it.” WRU/LBS respondent “Because we have seemed to have got better at dealing with things, i.e. writing letters or ringing up rather than leaving things.” WRU/LBS respondent “We can pay for things that we need doing, cannot do decorating ourselves anymore but now we can pay someone to do it.” WRU/LBS respondent “I just don't worry so much, it has just improved my quality of life.” WRU/LBS respondent “I get the extra £12 per week which has gone up to £14.81.” WRU/LBS respondents “I understand it more now and I feel better having spoken to someone.” WRU/LBS respondent “I can just afford little things which I could not afford before.” WRU/LBS respondents

47
“I have more money so I can go out more because I can get a taxi where I want to go.” WRU/LBS respondent “I have no stress filling out the forms, they come and help so I know they are filled in right.” WRU/LBS respondent “I am able to pay for the help we need, we don't have to worry now that we are too old and that I am too ill to do the things round the house.” WRU/LBS respondent “It makes a hell of a lot of difference. When we go shopping we do not worry about the total bill, we can put the heating on and replace old clothes.” WRU/LBS respondent “I can get help now, showering cleaning, practical help, they make meals for us.” WRU/LBS respondent “It helps a lot and they have been very kind. It helps us with the garden and with the home and we have more money to spend on the central heating - keeping warm.” WRU/LBS respondent “I feel better now because I got some help without stressing out, I was confused with it all but I am not now.” WRU/LBS respondent “I now have money that if I want to go out I can go out. I do not have to rely on my husband, I can now visit mum without worrying about money.” WRU/LBS respondent Those that thought their quality of life had got worse mostly gave reasons unrelated to the financial intervention such as poor health, bereavement or losing their job. The following comments were made: “I am cutting back on food because of paying off my debts, and food and other things are getting more expensive.” “The electricity is going up and I am unable to pay it, but I think the bills are wrong and I am being charged far too much, something is wrong with the meter.” “It is not the CAB's fault just everything is getting harder, increasing costs. I now pay 28% of my income on gas and electricity bills.” “I am no longer working so I have not got enough to live on.” “Because it has all got worse again after the year was up.” “I am struggling to sort everything out as debts are increasing.”
5.5 Stress about financial matters
As shown in section 5.4, many respondents mentioned their levels of stress were reduced when asked about quality of life. Figure 5.6 shows that two in three MAP

48
respondents, just under half the LCCU respondents and just over a third of WRU/LBS respondents report reduced stress levels. Figure 5.6 Change in stress levels about financial matters
67%
45% 38%
29%
51%57%
4% 3% 4%
0%
25%
50%
75%
100%
MAP Credit Union WRU / LBS
IncreasedStayed much the sameReduced
Base: complete sample (MAP 190, WRU 167, Credit Union 170)
5.6 Change in general health
A total of two in five of the MAP respondents (41%) said their general health had improved after seeking support (Figure 5.7). Smaller proportions of LCCU respondents (11%) and WRU/LBS respondents (18%) said their general health had improved.
Figure 5.7 Change in general health
41%
13% 11%
52%
87%80%
6% 7%
0%
25%
50%
75%
100%
MAP Credit Union WRU / LBS
Don't knowGot worseStayed much the sameGot better
Base: complete sample (MAP 190, WRU 167, Credit Union 170)
The majority of those (96% MAP; 86% LCCU and 95% WRU/LBS) of those who said their health had improved said the support they had with financial matters had contributed towards this improvement.

49
5.7 Other changes
Respondents were asked to say whether or they had made a number of possible changes (Table 5.5), these ranged from buying food, paying bills, saving and visits to the doctor. One third of MAP respondents, a quarter of LCCU respondents and one in five of WRU/LBS respondents say they now buy the food their family needs. Small proportions of respondents (12% MAP, 3% LCCU and 2% WRU/LBS) now make fewer visits to the doctor with some of these now having fewer prescriptions. A significant minority of respondents (29% MAP, 18% LCCU and 17% WRU/LBS) say they are now paying their gas and electricity bills. Slightly higher proportions say they now pay other bills (see Table 5.7). More than half the MAP (55%) and LCCU (59%) respondents say they now find it easier to manage their money. Small percentages (16% MAP, 11% WRU/LBS) say they now save a bit rising to 41% of LCCU respondents.
Table 5.7 Changes made since financial support MAP Credit
Union WRU /
LBS Buy amount of food family needs 33% 25% 19% Make less visits to doctor 12% 3% 2% Fewer prescriptions 6% 2% 1% Pay gas and electricity bills 29% 18% 17% Pay other bills 35% 23% 19% Easier to manage your money 55% 59% 21% Been able to save more than before 16% 41% 11% None of these 35% 22% 60% Base: complete sample 190 170 167

50
D Questionnaire Organisation contacted: (from contact sheet) Leeds City Credit Union ……………………………… 1 Citizens Advice Bureau ………………………………. 2 Leeds City Council Welfare Rights …………… 3 Leeds Benefits Service ……………………………… .. 4 St Vincents ………………………………………………….. 5 ……. 6 Name of respondent:
Address:
Post Code LS ____ __ __ __
Tel:
Date of interview __ __ / __ __ / __ __
Interviewer:
Hello, I am calling from Community Consultants. Leeds City Council has commissioned Salford University and Community Consultants to carry out a study to see what the effect of receiving financial advice has on people’s lives. You were recently contacted by ….. (insert organisation name from contact sheet) and you said you were willing to take part in this survey. Are you still interested in taking part. All respondents will receive a £5 voucher. 1. When did you contact the organisation? Was it (if they cannot remember probe for an approximate time) Within the last month ………………………………… 1 Within the past 2-3 months ………………………. 2 Between 4 and 6 months ago ……………………. 3 7 months to a year ago ……………………………… 4 More than a year ago ……………………………….. 5 Not sure / can’t remember ……………………….. 6 2. Why did you contact ……. (insert name of organisation)? Was it for…
READ OUT AND CODE ALL THAT APPLY
Advice about benefits ……………………… … 1 General financial advice ………………………. 2 Advice about debts ……………………………… 3
Other – say what 4

51
3. Have you contacted any other agencies or organisations about these
matters? This could include telephone or on-line support Yes …………………………………………………………. 1 Ask Q4 No ………………………………………………………….. 2 Go to Q5 Don’t know / can’t remember ………………. 3 Go to Q5 4. Which other agencies or organisations have you contacted?
Leeds City Credit Union ……………………………… 1 Citizens Advice Bureau ………………………………. 2 Leeds City Council Welfare Rights …………… 3 Leeds Benefits Service ……………………………… 4 St Vincents ………………………………………………….. 5 National Debt Line ………………………………………. 6 Others to include? Other (say which) 6
5. Are you a member of a Credit Union?
Yes ……………………………………………………… 1 Ask Q6 No ……………………………………………………….. 2 Go to Q9 Don’t know ………………………………………….. 3 Go to Q9
6. Which Credit Union services do you use?
READ OUT AND CODE ALL THAT APPLY Savings account ………………………………….. 1 Current account …………………………………… 2 A Handiloan ………………………………………….. 3 Other Loan ………………………………………….. 4 Budgeting account (what is this called? Other service (say what)
7. Why did you decide to join the Credit Union?
Write in
8. Was it because .. READ OUT AND CODE ALL THAT APPLY
Because you can have a loan at a reasonable rate of interest .. 1 To be able to save small amounts of money at a time …………….. 2 I was advised to join ……………………………………………………… 3 The office is in a convenient location …………………………………. 4 It is a local service ………………………………………………………… 5 The staff are understanding ……………………………………………. 6 (other prompts??)

52
Now I would like you to think about any changes you have made since you contacted ….. (name of organisations from contact sheet).
9. Since contacting ……. (name of organisation / joining the Credit Union),
have you done any of the following ….. READ OUT AND CODE ALL THAT APPLY Yes No Not sureClaimed any welfare benefits that you were not claiming before
1 2 3
Claimed any tax credits that you were not claiming before
1 2 3
Joined a credit union
1 2 3
Paid off any loans
1 2 3
Transferred loan or loans to a new provider with a lower rate of interest
1 2 3
Changed your fuel supplier to one with a lower charge
1 2 3
Changed from a prepayment meter to paying by direct debit or
1 2 3
Reduced or paid off any debts you had
1 2 3
10. Has the amount of money you have changed in any other way?
Yes ……………………………………………………… 1 Ask Q11 No ……………………………………………………….. 2 Go to Q12 Not sure ……………………………………………… 3 Go to Q12
11. Please give details.
SAVINGS 12. Which of the following best describes your own approach to saving?
READ OUT I don’t really save at all ……………………..….……. 1 I save money to pay bills ……………………….……. 2 I save up to buy things I want or need …….…. 3 I tend to put money away for the future…….… 4 I save money for emergencies ………………….…. 5 Not sure ………………………………………………………... 6

53
13. How often do you put money into a savings account or save money? Don’t save /never…………………………………….………….……….. 1 I save money regularly at least once a month……………..………… 2 I save money regularly but less often than once a month …….. 3 I put money in as and when I can…………………………………….… 4 I have paid in money before but not in the past 12 months…... 5 I have not added any money since the account was opened…... 6 Not sure……………………………………………………………………. 7
14. Do you use any of the following ways of saving money? READ OUT
Yes No Not sure Bank or Building Society Savings or deposit account 1 2 3 Credit Union 1 2 3 A Christmas hamper scheme or similar 1 2 3 A Christmas Club or similar run by a local shop 1 2 3 Informally with work colleagues, friends or the committee system, pardner or church schemes
1 2 3
Putting money by in a jar or envelope 1 2 3 Asking a relative or friends to save or look after money for you
1 2 3
IF HAS SAVINGS ACCOUNT WITH BANK OR BUILDING SOCIETY OR
WITH CREDIT UNION ASK Q15, OTHERS GO TO Q16 15. Have you opened this account since receiving the advice / joining the
credit Union or did you have this before?
Since the advice …………………………………. 1 Had it before ………………………………………. 2 Don’t know …………………………………………. 3 16. Would you say you saved more saved less, saved the same or still save
nothing since receiving the advice/joining the Credit Union? Saved more ………………………………………. 1 Saved the same ……………………………….. 2
Saved less …………………………………………. 3 Still save nothing ……………………………… 4 Don’t know ………………………………………. 5

54
18. Which, if any, of the following sources of credit or borrowing did you have you or use when you contacted (insert organisation from contact sheet)? For each YES, ask And do you still have this credit or borrowing now? READ OUT CHECKLIST
When
contacted x
Now
A Mortgage 01 01 B Overdraft at the bank 02 02 C Hire purchase (HP agreement) 03 03 D Interest free loan from a store / garage etc. 04 04 E Credit card account not paid off 05 05 F Store card account not paid off 06 06 G Loan from a bank 07 07 H Loan from a building society 08 08 I Student loan 09 09 J Credit Union 10 10 K Loan from a licensed finance company such as
Provident or Greenwoods or other where weekly repayments are made, often on the doorstep
11 11
L Loan from a moneylender (unlicensed) 12 12 M Catalogues or club books 13 13 N Local shops 14 14 O Shoppacheckers, payday lenders 15 15 P Companies such as Brighthouse, Cash Converters 16 16 Q Pawnbrokers (somewhere where you borrow money
and leave goods). 17 17
R Social fund loan / loan from ‘the Social’ 18 18 S Loan from family 19 19 T Loan from friends or other private individuals 20 20 U None of these 21 21

55
19. I am going to read you a list of bills some people have to pay. Were you behind or in debt with any of them when you contacted (insert organisation from contact sheet)? For each yes Ask and are you still behind with this now?
When contacted
x Now
Mortgage 01 01 Rent 02 02 Council tax 03 03 Water rates 04 04 Electricity 05 05 Gas 06 06 Telephone or mobile phone 07 07 Rental on TV, video, DVD player 08 08 Credit card bill 09 09 Store card bill 10 10 Catalogues, club book payment 11 11 Bank overdraft 12 12 Bank or building society loan 13 13 Hire purchase agreement 14 14 Finance company loan such as the Provident or any other company
15 15
Loans from family or friends 16 16 Other loans 17 17 Refused to say 18 18 Not sure 19 19 NONE 20 20
IF HAD ANY DEBTS ASK Q20, OTHERS GO TO Q21 20. Would you say the total amount of money you owed was more, less or
about the same as when you contacted ……. ? More ………………………………………… 1 Less ……………………………………. ….. 2 About the same ………………………. 3 Not sure ………………………………….. 4 21. Have you / others in household been able to find a job or start work or
start a training course since you received this advice? Yes self ………………………………………………… 1 Ask Q22
Yes – other person in household ……………… 2 Ask Q22 No ………………………………………………………… 3 Go to Q23 Not sure …………………………………………………… 4 Go to Q23

56
Q22. Did receiving this advice/joining the Credit Union help with being able to start work?
Yes ……………………………………………………… 1 No ……………………………………………………….. 2 Don’t know ………………………………………….. 3
23. Are you better off, worse off or no different as a result of the
advice/joining CU? Much better off …………………………….……. 1 Ask Q25 Better off …………………………………….…….. 2 Ask Q25 About the same ………………………….….….. 3 Go to Q29
Worse off …………………………………..…….…. 4 Go to Q24 Much worse off ……………………….………….. 5 Go to Q24 Don’t know …………………………………………... 6 Go to Q29
24. Why do you think you are worse off? Write in Go to Q29
25. How much a week more money do you have now?
IF RESPONDENT DOES NOT KNOW, PROBE FOR AN APPROXIMATE FIGURE £ …………………………….. 26. Is this because …. READ OUT You are claiming more benefits …………………………………………… 1 You are claiming more tax credits ………………………………………. 2 You or someone else in your household is working …………… 3 You are paying less interest on loan or credit ……………………. 4 You are managing your money better ………………………………… 5 Other reason – say what 6 27. Thinking of this extra money, how much of it do you think is spent in
your local community, how much in the rest of Leeds and how much outside the City (this would include mail order/internet etc.) (IF RESPONDENT IS NOT SURE, ASK THEM TO GIVE A ROUGH
PROPORTION) In local area ………………………………. _____ % In the rest of Leeds …………………….. _____ % Outside Leeds …………………………….. _____% Don’t know …………………………………..

57
28. What would you say you have spent this extra money on? Write in
ASK ALL 29. How good would you say your skills about dealing with money matters
are? Very good …………………………………….. 1 Good …………………………………………….. 2 Neither good nor poor …………………. 3 Poor ………………………………………………. 4 Very poor ……………………………………… 5 Don’t know …………………………………… 6
30. At present how well do you think you are managing your money? Are you ….. Managing well ……………………..……. 1 Just getting by …………………..………. 2 Getting into difficulties ……………… 3 Don’t know …………………………………. 4
31. Since contacting (insert organisation from contact sheet) would you say
your ability to manage your money has improved, not changed or got worse? Has it….
Improved a lot …………………………………. 1 Improved a bit …………………………………. 2
Made little difference ………………………… 3 Got a bit worse …………………………………. 4 Got a lot worse …………………………………. 5 Don’t know ……………………………………….. 6
32. How would you describe your financial position at present? Is it …..
Usually difficult…………………………………………….…..… 1 Sometimes it’s tight………………………………………...… 2 I’m getting by………………………………………………………. 3 I’m doing OK………………………………………………………… 4 I’m doing very well…………………………………………….… 5 Other 6 Please specify Don’t know …………………….……………………………….. 7
33. At present, how worried are you about getting into or being debt? Very worried ……………………………… 1 Fairly worried …………………………….. 2 Not very worried …………………………. 3 Not at all worried …………………………. 4 Not sure …………………………………… 5

58
34. If you had an emergency and needed £100 in a hurry, what do you think you would do? Ask family or friends …………………………..… 1 Ask for a Social Fund loan /DSS………..... 2 Draw on savings …………………………………… 3 Take out a bank loan/ overdraft………….. 4 Take out loan other source ………………… 5 Take out loan from Credit Union…………. 6 Use my credit card ……………………………… 7 Sell something …………………………………..… 8 Other, please state……………………………… 9 Don’t know ……………………………………….… 10
35. Since contacting (insert organisation from contact sheet has your day to day life quality of life ….?
Improved a lot …………………………………. 1 Ask Q36 Improved a bit …………………………………. 2 Ask Q36
Not changed much …….…………………… 3 Go to Q37 Got a bit worse …………………………………. 4 Ask Q36 Got a lot worse …………………………………. 5 Ask Q36 Don’t know ……………………………………….. 6 Go toQ37
36. In what way has it been affected?
Probe fully 37. Since contacting (insert organisation from contact sheet), would you say
that your level of stress or worry about financial matters has reduced, stayed much the same or increased?
Reduced …………………………………….. 1 Stayed much the same ……………… 2 Increased ………………………………….. 3 Was not stressed anyway ………… 4 Don’t know ………………………………… 5 38. Since contacting (insert organisation from contact sheet), would you say
that your general health has got better, stayed much the same or got worse?
Got better …………………………………….. 1 Ask Q39 Stayed much the same ……………… 2 Go to Q40 Got worse ………………………………….. 3 Go to Q40 Don’t know ………………………………… 4 Go to Q40

59
39. And has this improvement been as a result of the support you have received with financial matters or not?
Yes ……………………………………………………… 1 No ……………………………………………………….. 2 Don’t know ………………………………………….. 3
40. As a result of contacting (insert organisation from contact sheet), has it
meant that …… READ OUT AND CODE ALL THAT APPLY Can purchase more fruit and vegetables …………………………. 1 Have had fewer prescriptions from the doctor …………………. 2 Been able to pay off bills …………………………………………………… 3 Found it easier to manage my money ……………………………… 4 Been able to start saving or save more than before ……….. 5 DEMOGRAPHIC QUESTIONS Finally so we know we have talked to a range of people, we have a few questions about you and your household.
41. Interviewer to code: Male ………………. 1
Female …………….. 2 42. What is your age? __ __ Years 43. How many people usually live in this household in total – including
yourself?
44. Are there any children aged 18 or under in this household? Yes …………………………………………… 1 Ask Q45 No …………………………………………….. 2 Go to Q46 Not sure ……………………………………… 3 Go to Q46
45. How many children do you have in each of these age groups? If none
enter ‘0’.
Children aged 0-4 Children aged 5-10 Children aged 11-16 Young people aged 17-18
46. How would you describe the composition of your household?
One adult under 60 ……………………………….…………………... 1 One adult aged 60 or over ……………..…………………………. 2 Two adults both under 60 ……………………..…………………… 3 Two adults at least one over 60 ………………………………… 4 Three or more adults aged 16 or over …………..…………. 5

60
Lone parent with child/ren at least one under 16 …….. 6 2 parent family with child/ren at least one under 16 … 7 Extended family with children ……………………………………… 8 Other ………………………………………………………………….. 9
(specify) 47. Do you, or anyone else in this household, have any longstanding illness, disability or infirmity? By longstanding we mean anything that has troubled you over a long period of time or that is likely to affect you over a period of time?
Self Other in household Yes …………………………….
1 1
No ………………………………
2 2
Not sure ……………………….
3 3
Not applicable 4 48. Which of the following applies to you? And which to your partner / spouse (if applicable)
Self Partner/
spouse
Employee in full time job (30 hours or more) ……………………. 01 01 Employee in part time job (less than 30 hours) …………………. 02 02 Self-employed – full or part time ……………………………………... 03 03 Government supported training …………………………………………. 04 04 Unemployed and available for work ………………………………..…. 05 05 Wholly retired from work ………………………………………………….…. 06 06 Full time education – school, college or university ………………. 07 07 Looking after family / home ……………………………………………….… 08 08 Permanently sick or disabled ………………………………………………… 09 09 Other 10 10 Not applicable ………………………………………………………................. 11
49. Just to check, Is there anyone in this household who is in paid employment, whether full-time or part-time? Yes ……………….. 1 No ………………… 2 Not sure ………….. 3

61
50. And which of these best describes your ethnic origin?
White British ……………………..………….. 01 Irish ………………………….……..…. 02 Other white ………………….……… 03 ………………………. Mixed Mixed – white and Black Caribbean 04 Mixed – White and Black African .. 05 Mixed – white and Asian …………… 06 Mixed – other ……………………… 07 ……………………….. Asian Indian …….……….…………………. 08 Pakistani ………..…………………… 09 Bangladeshi ………………………… 10 Other Asian …………………………. 11 ………………………… Black African ……………..……….……….. 12 Somali ……………………………….. 13 Caribbean …………………………… 14 Any other Black background ……..… 15 …………………………. Other ethnic group Chinese …………………………..….. 16 Other ……………………… …………. 17……………………………
51. What is the income coming into this household including any benefits or pensions you may have been receiving. READ OUT
IF THEY ARE UNSURE PROBE FOR A BEST ESTIMATE Weekly Annual A Nil Nil 1 B Under £60 Under £3000 2 C £60-£119 £3000-£5999 3 D £120-£199 £6000-£9,999 4 E £200-£299 £10,000-£14,999 5 F £300-£479 £15,000-£24,999 6 G £480 -£674 £25,000-£34,999 7 H £675 or over £35,000+ 8 Refused to say 9 Not sure 10

62
52. Which of the following benefits does this household receive? READ OUT AND CODE ALL THAT APPLY
A Housing benefit 1 B Council tax benefit 2 C Job Seekers Allowance 3 D Income Support 4 E Incapacity benefit, disability benefits 5 F Working Tax Credit 6 G Child tax credit 7 H Pensioner Credit 8 I Other (specify) 9
___________________
J None of these 10 Don’t know, not sure 11
Thank respondent and check that address is correct for mailing the voucher.

63
E. The economic impact of financial inclusion interventions – models and applications
Introduction The economic landscape of local communities and cities is constantly evolving as plants open and close, the industry mix changes, and public investment oscillates. This has potentially important implications for employment opportunities for the local population, for industries interlinked through trade and for the planning of public infrastructure and service provision. Thus economists have long been developing methods and models, often referred to as impact analysis or multiplier models, to estimate the impact of such changes.
This appendix critically analyses and discusses impact or multiplier analysis models and their applications in the evaluation of financial inclusion interventions. We start by examining the two main models for estimating the impact of increased demand resulting from new economic activities or public investment on a local or regional economy: the Keynesian income-expenditure model and the input-output approach. We then examine and discuss various applications of such models in the evaluation of financial inclusion interventions. We discuss the main considerations and justification guiding the selection of an appropriate model for assessing the economic impact of financial inclusion activities in Leeds. Finally, we provide some information about the Yorkshire and Humber input-output table on which our analysis is based.
The Keynesian income-expenditure model John Maynard Keynes is arguably one of the most influential economists in the field of regional economic analysis and methodology. Perhaps one of his most important contributions to this discipline has been the Keynesian income-expenditure model. Central to Keynes model is that an initial injection of capital into a local economy has ripple effects beyond the initial investment as recipients of the injection spend money on local suppliers and households (for labour) who in turn spend part of that amount in the local economy. These ripple effects continue over several rounds of spending.
Keynes’ framework for estimating the impact of these changes in demand on an economy is based on calculating income and employment multipliers of government investment and the establishment of new plants (Miernyk, 1965). Multipliers measure the magnitude of the impact of a change in investment beyond what is immediately measurable. In other words, if a government or a company invests a given amount on a particular project or in an economic activity, how would that affect local firms and households beyond the immediate investment? For example, an employment multiplier of 1.25 means that for each job created as a direct result of the investment leads to the creation of .25 jobs elsewhere in the economy.
Inevitably the initial injection and subsequent rounds of spending are not spent in their entirety in the local economy as inward commuters spend wages in other economies and as local industries and residents purchase goods imported from other economies. The likelihood of households and firms in purchasing locally produced goods is called the marginal propensity to consume locally. It is also important to seek to identify leakages in the initial injection, as the investment may include inputs and workers from other economies.

64
There are two principal ways of estimating the marginal propensity to consume locally produced goods. First, it is possible to conduct a survey of a sample of local residents enquiring about the proportion of their income being spent locally. This approach may be problematic given that it is costly and because local residents may not be able to provide accurate estimates of the proportion of their income they spend locally.
A second and more commonly used approach was developed by Archibald (1967). He used data from the Family Expenditure Survey (FRS) to identify services and goods typically bought locally to calculate a national figure for marginal propensity to consume. By using data on regional disposable income, Archibald (1967) would then estimate a regional figure for marginal propensity to consume and subsequently a regional multiplier. Most empirical studies use a variant of this approach.
Because sub-national economies, relative to national economies, tend to rely to a greater degree on imports and inward commuters, producing a realistic estimate of the marginal propensity to consume locally produced goods and services is crucial in determining the economic impact of increased demand. The marginal propensity to consume goods from that locality depends on numerous factors (Armstrong and Taylor, 2000). First, the marginal propensity to consume locally is likely to be smaller in smaller regions as they are likely to rely more on imports. Second, highly specialised regions will to a greater extent rely on imports and the marginal propensity to consume locally will, therefore, be smaller. Finally, the greater the flow of inward commuters is, the smaller is the propensity to consume locally. This is because inward commuters tend to spend most of their income where they live rather than where they work.
The Keynesian income-expenditure model is a scientifically sound and useful methodology for assessing the impact of increased demand on local and national economies. The Keynesian income-expenditure model is especially suitable for assessment of specific economic activities for which there are audited accounts and similar information available. For example, Bleaney et al (1992) used university audited accounts and local statistics to assess the impact of the University of Nottingham on the city-economy.
However, the model also has some drawbacks. Among frequently cited weaknesses is that it is too aggregate in that it does not separate out sectoral effects (Armstrong and Taylor, 2000), unlike the input-output model discussed below. The ability to differentiate between the impacts of different industries is crucial in local economic planning as different industries may have different infrastructure and service needs. Moreover, the expansion of some industries may have greater impact on the local economy than others owing to greater embeddedness in the local economy through trade links and local employment
Another criticism levelled at Keynes’ model is that it disregards capacity constraints, although this is a common trait of most regional economic models including the input-output approach which we turn to in the next section. The model assumes that local industries face no constraints in coping with increased demand for their goods.
The input-output approach The input-output approach to economic modelling was first developed by the US economist Leontief in the 1930s. Today it is one of the most widely used methods by national and sub-national policy-makers and authorities in forecasting the

65
development of the economy and in planning future infrastructure and service provision needs. Input-output analysis is also used to calculate important regional and national economic indicators, namely GDP and Gross Value Added.
At the heart of the input-output approach to modelling local and regional economies lies the input-output table (Table A.1).

66
Table A.1: Illustrative input-output table
Inputs purchased by Final demand sector Gross output Agriculture Manufacturing Services Households Government Exports Investments Outputs purchased by: Agriculture 20 40 0 20 0 20 0 100 Manufacturing 20 20 10 75 10 55 10 200 Services 0 40 10 25 20 5 0 100 Payments for: Household services 40 45 70 5 0 0 0 160 Government services 10 15 5 0 0 0 0 30 Imports into regions 10 40 5 0 0 0 5 60 Gross inputs 100 200 100 125 30 80 15 650
Source: Yan (1969, p.20)

67
The input-output table is a transaction table which shows purchases (input) and sales (output) by sector within a regional or local economy in a given year. Sales by sector are displayed horizontally, while purchases are displayed vertically. For example, if we turn to Table 2.1, we can see that Services purchase 10 from Manufacturing, 10 from Services, 70 from Households (labour), 5 from Government and 5 from Imports totalling inputs of 100 to produce an output of 100. Services sell their outputs to Manufacturing (40), Services (10), Households (25), Government (20) and Exports (5). For each unit of output there must be an input so that outputs are always equal to inputs. If outputs are smaller (loss) or greater (profit) than input then this is recorded in the payments sector.
Input-output tables vary greatly in complexity and size. The simplest tables consist of a handful of sectors, like our illustrative transactions table (Table 2.1), while national input-output tables can consist of as many as 500 industrial sectors (Miernyk, 1965). The input-output table for the Yorkshire and Humber region consists of 30 industries.
In itself the input-output table constitutes a rich insight and snapshot of an economy, facilitating an understanding of inter-industry links, dependency between different economic agents and of relationships with other economies. Nevertheless, arguably the most useful aspect of the input-output table is that it can be applied to predict or assess the impact of increased demand.
In order to use the input-output table to model the impact of an increase in demand of one or more sectors, the impact of the increased demand has to be calculated between each of the industries. For example, if the demand for agricultural goods increases by £10, we have to calculate how this impacts upon manufacturing, services and all the other industries separately.
The initial increase in output of the industry in question leads to increased demand for inputs from other sectors, whose increased output in turn leads to increased demand for inputs from other sectors. This process occurs over several rounds of spending until the net increases in output for the sectors converge to zero. So an initial increase in demand for agricultural goods of £10 will have greater impact on the regional economy than the initial injection.
Like with the Keynesian income-expenditure model, income, employment and sectoral multipliers can also be calculated using input-output tables. For example, as we discuss in the next section, an evaluation of CAB in Glasgow used an input-output approach to calculate multipliers and found that an increase in benefit uptake by £5.48 million supported 97.6 additional jobs in the city (The Fraser of Allander Institute, 2005).
The input-output approach to modelling the local economy can provide policy-makers and economists with rich picture and forecasts of past and future trends in the economy. One can see how increased output in one sector affects the output of other sectors and employment opportunities for the local population. Nevertheless, there are also some limitations of the use of the input-output approach to analysing the local economy.
In particular, there are a range of challenges concerning the accuracy of input-output tables themselves with important implications for their use in impact assessments. Due to high costs associated with conducting direct surveys with all firms, most statistical authorities use non-survey methods or estimates based on a sample of industries. This may negatively affect the accuracy of the input-output tables in

68
describing industry relations. Another problem possibly affecting the accuracy of transaction tables is that it assumes that the relationships between industries are constant. Thus, changing technology and industry sensitivity to prices of inputs may erode the usefulness of the transactions table to model economic impact (Armstrong and Taylor, 2000). These issues may cause problems in the modelling of impacts, because the model is only as accurate as the input-output table upon which it is based.
Applications of multiplier models in financial inclusion evaluations Above we have outlined the two key approaches to economic impact analysis. In this section we examine how these approaches have been applied in two cases of financial inclusion intervention analyses. First, we discuss a study by the Fraser of Allander Institute (2005) using the input-output approach to modelling. Second, we consider the application of the LM3 (Local Multiplier 3) methodology of the New Economics Foundation (NEF), which is based on the Keynesian income-expenditure model.
Fraser of Allander Institute study The impact assessment of Glasgow Citizens Advice Bureaux (CAB) conducted by the Fraser of Allander Institute (2005) assesses the employment effect of CABs on the local economy. The study estimates the number of jobs supported in Glasgow by expenditures generated through CAB advisory services using an input-output approach to modelling.
It is assumed that CAB advisory services can enhance income of low-income households through maximising up-take of benefits which in turn can be spent in the local economy generating jobs. The increased up-take is estimated based on figures provided by CAB, which for the financial year of 2003/2004 was £5.48 million. The researchers assume all of this increased income results in increased expenditure. The areas or sectors in which this is spent (e.g. household fuel and power, transport etc) is broken down using the 2001/2002 Expenditure and Food Survey data for the lowest income quintile. It is believed that all CAB clients are among the 20% poorest households.
They then estimate the impact of this increased income on the local economy through being re-spent within Scotland. This is because there is no way of directly estimating the impact for Glasgow. They argue that a high proportion will be spent locally based on the fact that CAB’s clients live locally in Glasgow and because they are on a low income the study assumes that they do not travel outside of Glasgow to spend additional payments.
They then run this estimated increase in spending through a version of the Scottish Input-Output model, which results in total effects on Scotland. Using sectoral employment/output ratios (multipliers) they then estimated the number of jobs created at a national level. By examining the sectoral composition of the local economy, the authors estimate that 82% of the jobs created at a national level through increased spending are created in Glasgow. They also estimate wage effects estimated using a similar procedure. By examining at the structure of the local economy, they estimate that 65% of the wage increase across Scotland would benefit Glasgow.
The study then derives the cost per job of this increased employment. The study does this by looking at the total cost of running the CAB offices in Glasgow for the financial year of 2003/2004. They then divide this sum by the number of jobs created in Scotland and for the number of jobs created in Glasgow. The study concluded that

69
the increase in benefit uptake by £5.48 million supported 97.6 additional jobs in the city and that the cost per job support was £6,279 (The Fraser of Allander Institute, 2005).
New Economics Foundation study Based on the Keynesian income-expenditure model, the New Economics Foundation (NEF) has developed a simplified method for calculating local multipliers called Local Multiplier 3 (LM3) (Sacks, 2002). The methodology is designed to measure the impact of a certain economic activity, company or investment on a local economy.
It attempts to do this by measuring the impact of the initial increase in demand over three rounds. The first round measures the initial income of the group of people, the organisation or the company in question. The second round measures the proportion of this initial income spent locally, while the third measures the proportion of the locally spent income estimated in the second round spent locally. The three rounds of local spending are added together and divided by the initial income to produce a multiplier.
Most of the data needed for LM3 has to be collected from accounts or registers of individual business or through surveys of local people and businesses. NEF has developed a set of generic surveys for interviewing individuals and businesses (see Sacks, 2002).
However, NEF has also calculated a set of standardised percentage figures of how much major chains and public sector organisations (including the armed forces) are likely to spend in the local economy based on annual reports published by the companies (Sacks, 2002). These percentages are calculated as follows. It is assumed that most of turnover is spent on VAT, supplies, rent, profit and labour. It is further assumed that “almost all” of VAT, supplies, rent and profit leave the local economy leaving only spending on labour which, NEF assumes, is spent in its entirety in the local economy (Sacks, 2002).
This methodology has been applied by NEF on numerous studies including in the evaluations of financial inclusion interventions. For example, the methodology has been applied in the village of Killamarsh outside of Sheffield to evaluate the impact of a cash machine put in by Coop Bank following local pressure. A survey was conducted of users of the cash point and revealed that between 50 and 70% of cash taken out was spent in the local community.
Another example of the application of LM3 is the evaluation of effort by Newham Council to encourage people in low-income employment to take up Working Family Tax Credit. A survey found that people eligible for this means-tested tax credit spent most of their income locally and the intervention carried a multiplier of 1.77.
The LM3 is a practical methodology which local community groups and policy-makers can use and replicate with relative ease. It is especially useful in evaluating economic effects of economic activities and interventions in small economies and for individual organisations and companies with few suppliers.
However, the LM3 does require collection of primary data, through surveys and from company accounts, which makes it difficult and impractical for larger and more complex economies. Moreover, the methodology does not differentiate between the different sectors.
70
Selecting a model for Leeds – considerations and justification In the preceding sections, we examined the underlying methodology and the applications of the Keynesian income-expenditure model and the input-output approach. One could have justified using either of these models in the economic impact analysis of financial inclusion interventions in Leeds. Both models have a strong theoretical underpinning and there is a wealth of examples of where they have been applied, though perhaps not so extensively in the context of financial inclusion interventions.
Ultimately for three reasons we opted for an input-output approach instead of the Keynesian income-expenditure model; - The necessary data for an input-output analysis were readily available data in the
form of a recent input-output table for Yorkshire and Humber. Conversely, to use a Keynesian income-expenditure model we would have to collect data on marginal propensity to consume using a survey or estimated the propensity to consume locally from the FRS.
- The second advantage of the input-output approach over the Keynesian income-expenditure model was the ability to disaggregate impact by industry and sector.
- In choosing the input-output analysis we also put emphasis on the ease with which the analysis could be replicated. As detailed in the next chapter, repeating an analysis would only requiring inputting basic information, such as number of beneficiaries and amount in increased disposable income. Moreover, the input-output table and the percentile expenditure of the lowest income decile could be updated when Yorkshire Forward and Office of National Statistics produce new data.
The Yorkshire and Humber input-output table The input-output table used in the analysis is the estimated coefficients matrix for Yorkshire and Humber showing the relationship between industries in the region. The coefficients matrix tells us for each unit of output produced the purchases made of each input.
The Yorkshire and Humber matrix is based on the equivalent matrix for the UK, which itself was estimated from UK input-output tables updated to 2004. The UK coefficients matrix was adjusted to account for the differences in the relative size between industries in the region compared to the UK, and the absolute size of the industry in the region compared with the UK. The general idea is that industries in the region are smaller than at the UK level, and the economy as a whole is smaller, so industries in Yorkshire and Humber will not be able to supply as much to the purchasing industries as at the UK level per unit of output. This means the values in the regional matrix will be smaller than for the UK (a higher proportion will be imports) and that the multipliers will be smaller. It is important to bear in mind that the table does not use any actual data on industry purchases in the region, but as explained above estimates the relationships based on UK input-output tables.

71
F. The input-output modelling spreadsheet In the main report we have explained the methodology, the rationale behind its selection and the findings of the application of the methodology in Leeds. In this Appendix, we will briefly outline and display the excel spreadsheet developed for the input-output model. After briefly explaining the layout of the spreadsheet we display how the results of the modelling play out in each of the individual sheets in the spreadsheet. For illustrative purposes we have modelled the impact of 100 individuals benefiting with an increase of £30 per person.
In brief, the spreadsheet works as follows. Sheet “Y&H base” contains the Yorkshire and Humber input-output table showing the trading relationships between the different industries. This can be updated whenever Yorkshire Forwards releases new input-output tables.
The sheet “Ind results” summarises and aggregates the industry impact of the financial inclusion interventions. It also displays how, according to the FRS 2005-2006, beneficiaries spend the increase in income. This can also be updated regularly as new FRSs are published. The category “non-consumption spending” refers to additions to savings, investments, financing costs (loan and mortgage repayments), cash donations, house purchases and major renovations and alterations. In the left-hand corner of the same sheet, we can insert on average how much a financial inclusion service client benefits and the number of beneficiaries.
The sheets “Primary Links”, “Secondary Links”, “Tertiary Links” and “Fourth Links” refer to the different rounds of spending. For example, the beneficiaries spend £10 on clothing and footwear (Primary Link). In turn, clothing and footwear spend £5 on regional imports, £3 on Agriculture and £2 on Transport (Secondary Link). Agriculture spends £1 on imports, £1 on agriculture and £1 on Transport (Tertiary Link). Transport in turn spends £0.75 on imports and £0.25 (Fourth link). In theory this goes on and on but we opted to end after four rounds given that impact would be negligible (£0.000…).

72
From input-output modelling spreadsheet: “Ind Results” Assumed addition in pocket of an individual Assume number of individuals benefiting £30.00 100 Industrial benefit in locality Agriculture, Forestry & Fishing £0.22 £22.08 Oil & Gas Extraction £0.16 £16.42 Other Mining £0.04 £4.32 Gas, Electricity & Water £7.22 £722.00 Fuel Refining £0.10 £9.91 Chemicals £0.05 £5.16 Minerals £0.03 £2.89 Metals £0.08 £8.03 Machinery & Equipment £0.04 £3.98 Electrical & Optical Equipment £0.02 £2.42 Transport Equipment £0.03 £2.66 Food, Drink & Tobacco £6.31 £630.98 Textiles & Clothing £1.26 £125.79 Wood & Wood Products £0.01 £0.85 Paper, Printing & Publishing £0.15 £15.25 Rubber & Plastics £0.09 £9.12 Other Manufacturing £0.02 £2.42 Construction £0.16 £16.29 Retailing £2.20 £220.44 Wholesaling £0.42 £42.48 Hotels & Catering £1.86 £185.51 Transport £3.34 £333.84 Communications £1.39 £139.45 Banking & Insurance £0.48 £47.85 Business Services £0.94 £93.82 Other F&Bs £0.29 £29.13 Public Admin. & Defence £0.02 £2.49 Education £0.36 £36.46

73
Health £0.33 £33.46 Other (mainly Public) Services £5.67 £566.52 £33.32 £3,332.02

74
From input-output modelling spreadsheet: “Ind Results”
Personal
spend Primary Link Secondary
Link Tertiary Link Fourth Link Impact Impact Accumulated Impact Accumulated Impact Accumulated Impact Accumulated Agriculture, Forestry & Fishing 0.19325 0.19325 0.02446 0.21771 0.00277 0.22047 0.00035 0.22082 Oil & Gas Extraction 0.13697 0.13697 0.02319 0.16016 0.00349 0.16365 0.00055 0.16420 Other Mining 0.03674 0.03674 0.00547 0.04221 0.00082 0.04302 0.00013 0.04316 Gas, Electricity & Water 6.30 0.79454 7.09454 0.10751 7.20206 0.01555 7.21761 0.00240 7.22001 Fuel Refining 0.07999 0.07999 0.01562 0.09561 0.00291 0.09851 0.00054 0.09905 Chemicals 0.03445 0.03445 0.01375 0.04819 0.00284 0.05104 0.00053 0.05157 Minerals 0.02043 0.02043 0.00650 0.02693 0.00159 0.02852 0.00037 0.02889 Metals 0.05656 0.05656 0.01873 0.07528 0.00414 0.07942 0.00085 0.08027 Machinery & Equipment 0.03101 0.03101 0.00718 0.03819 0.00137 0.03956 0.00026 0.03982 Electrical & Optical Equipment 0.01916 0.01916 0.00403 0.02319 0.00086 0.02405 0.00018 0.02423 Transport Equipment 0.02178 0.02178 0.00384 0.02562 0.00082 0.02644 0.00017 0.02660 Food, Drink & Tobacco 5.70 0.54628 6.24628 0.05584 6.30212 0.00669 6.30882 0.00094 6.30976 Textiles & Clothing 1.20 0.05380 1.25380 0.00357 1.25737 0.00042 1.25779 0.00007 1.25786 Wood & Wood Products 0.00468 0.00468 0.00275 0.00742 0.00088 0.00830 0.00023 0.00853 Paper, Printing & Publishing 0.11265 0.11265 0.03167 0.14433 0.00684 0.15116 0.00138 0.15254 Rubber & Plastics 0.07266 0.07266 0.01508 0.08774 0.00290 0.09064 0.00057 0.09122 Other Manufacturing 0.01930 0.01930 0.00388 0.02318 0.00084 0.02402 0.00017 0.02420 Construction 0.10504 0.10504 0.04309 0.14813 0.01190 0.16003 0.00283 0.16286 Retailing 2.10 0.07986 2.17986 0.01978 2.19965 0.00399 2.20363 0.00078 2.20441 Wholesaling 0.36042 0.36042 0.05327 0.41369 0.00938 0.42307 0.00173 0.42480 Hotels & Catering 1.80 0.04561 1.84561 0.00756 1.85317 0.00161 1.85478 0.00033 1.85511 Transport 2.70 0.49102 3.19102 0.11810 3.30912 0.02444 3.33357 0.00487 3.33844 Communications 1.20 0.14430 1.34430 0.03917 1.38347 0.00908 1.39255 0.00190 1.39445 Banking & Insurance 0.35843 0.35843 0.09630 0.45473 0.01993 0.47466 0.00387 0.47853 Business Services 0.68984 0.68984 0.19498 0.88481 0.04419 0.92900 0.00920 0.93820 Other F&Bs 0.22190 0.22190 0.05481 0.27672 0.01212 0.28884 0.00249 0.29133 Public Admin. & Defence 0.01583 0.01583 0.00696 0.02279 0.00174 0.02453 0.00038 0.02491 Education 0.30 0.04882 0.34882 0.01225 0.36108 0.00291 0.36399 0.00063 0.36462

75
Health 0.30 0.02864 0.32864 0.00492 0.33357 0.00088 0.33445 0.00016 0.33461 Other (mainly Public) Services 5.10 0.49802 5.59802 0.05751 5.65553 0.00829 5.66382 0.00141 5.66523 26.70000 5.32198 32.02198 1.05177 33.07375 0.20621 33.27996 0.04027 33.32023

76
From input-output modelling spreadsheet: “Personal spend” Input assumptions How s/he spends How the
the additional increase Individual work role funds will be
if appropriate spent Food & Non-Alcoholic Drinks £4.80
Amount of wage increase Alcoholic Drinks, Tobacco & Narcotics £0.90 £30.00 Clothing and footwear £1.20
Housing, fuel and power £6.30 Household Goods & Services £2.10 Health £0.30 Transport £2.70 Communications £1.20 Recreation Culture £3.30 Education £0.30 Restaurants & Hotels £1.80 Miscellaneous goods & services £1.80 £26.70 Non-consumption spending £3.30 £30.00

77
From input-output modelling spreadsheet: “Primary links”
How s/he spends the additional funds Industrial specification Food & Non-Alcoholic Drinks 4.80 Food, Drink & Tobacco Alcoholic Drinks, Tobacco & Narcotics 0.90 Food, Drink & Tobacco Clothing and footwear 1.20 Textiles & Clothing Housing, fuel and power 6.30 Gas, Electricity & Water Household Goods & Services 2.10 Retailing Health 0.30 Health Transport 2.70 Transport Communications 1.20 Communications Recreation Culture 3.30 Other (mainly Public) Services Education 0.30 Education Restaurants & Hotels 1.80 Hotels & Catering Miscellaneous goods & services 1.80 Other (mainly Public) Services

78
From input-output modelling spreadsheet: “Primary links”2
Agr
icul
ture
3
Oil
& G
as
Oth
er m
inin
g
Gas
& e
l
Fuel
refin
ing
Che
mic
als
Min
eral
s
Met
als
Mac
hine
ry
El &
opt
ical
Tran
spor
t eq.
Food
, drin
k…
Text
iles
Woo
d
Pape
r & p
rint
Rub
ber&
plas
t
Oth
er m
anuf
.
Con
stru
ctio
n
Ret
ailin
g
Who
lesa
ling
Hot
els&
cate
r
Tran
spor
t
Com
mun
ic.
Ban
king
Bus
. ser
vice
s
Oth
er F
&B
s
Publ
. adm
Educ
atio
n
Hea
lth
Oth
er se
rvic
e
Agriculture, Forestry & Fishing
0.000
0.000
0.000
0.000
0.000
0.000
0.000
0.000
0.000
0.000
0.000
0.178
0.000
0.000
0.000
0.000
0.000
0.000
0.002
0.000
0.012
0.000
0.000
0.000
0.000
0.000
0.000
0.000
0.000
0.001
Oil & Gas Extraction
0.000
0.000
0.000
0.136
0.000
0.000
0.000
0.000
0.000
0.000
0.000
0.000
0.000
0.000
0.000
0.000
0.000
0.000
0.000
0.000
0.000
0.001
0.000
0.000
0.000
0.000
0.000
0.000
0.000
0.000
Other Mining 0.000
0.000
0.000
0.036
0.000
0.000
0.000
0.000
0.000
0.000
0.000
0.000
0.000
0.000
0.000
0.000
0.000
0.000
0.000
0.000
0.000
0.000
0.000
0.000
0.000
0.000
0.000
0.000
0.000
0.000
Gas, Electricity & Water
0.000
0.000
0.000
0.723
0.000
0.000
0.000
0.000
0.000
0.000
0.000
0.028
0.007
0.000
0.000
0.000
0.000
0.000
0.007
0.000
0.007
0.007
0.003
0.000
0.000
0.000
0.000
0.001
0.001
0.012
Fuel Refining 0.000
0.000
0.000
0.032
0.000
0.000
0.000
0.000
0.000
0.000
0.000
0.006
0.001
0.000
0.000
0.000
0.000
0.000
0.004
0.000
0.004
0.025
0.002
0.000
0.000
0.000
0.000
0.000
0.000
0.006
Chemicals 0.000
0.000
0.000
0.003
0.000
0.000
0.000
0.000
0.000
0.000
0.000
0.004
0.009
0.000
0.000
0.000
0.000
0.000
0.001
0.000
0.002
0.001
0.000
0.000
0.000
0.000
0.000
0.000
0.003
0.011
Minerals 0.000
0.000
0.000
0.000
0.000
0.000
0.000
0.000
0.000
0.000
0.000
0.011
0.000
0.000
0.000
0.000
0.000
0.000
0.001
0.000
0.001
0.001
0.000
0.000
0.000
0.000
0.000
0.000
0.000
0.005
Metals 0.000
0.000
0.000
0.015
0.000
0.000
0.000
0.000
0.000
0.000
0.000
0.030
0.003
0.000
0.000
0.000
0.000
0.000
0.003
0.000
0.002
0.002
0.000
0.000
0.000
0.000
0.000
0.000
0.000
0.001
Machinery & Equipment
0.000
0.000
0.000
0.013
0.000
0.000
0.000
0.000
0.000
0.000
0.000
0.010
0.002
0.000
0.000
0.000
0.000
0.000
0.003
0.000
0.001
0.001
0.001
0.000
0.000
0.000
0.000
0.000
0.000
0.001
Electrical & Optical Equipment
0.000
0.000
0.000
0.006
0.000
0.000
0.000
0.000
0.000
0.000
0.000
0.000
0.000
0.000
0.000
0.000
0.000
0.000
0.001
0.000
0.001
0.001
0.005
0.000
0.000
0.000
0.000
0.000
0.001
0.003
Transport Equipment
0.000
0.000
0.000
0.001
0.000
0.000
0.000
0.000
0.000
0.000
0.000
0.001
0.000
0.000
0.000
0.000
0.000
0.000
0.011
0.000
0.001
0.006
0.000
0.000
0.000
0.000
0.000
0.000
0.000
0.003
Food, Drink & Tobacco
0.000
0.000
0.000
0.002
0.000
0.000
0.000
0.000
0.000
0.000
0.000
0.391
0.006
0.000
0.000
0.000
0.000
0.000
0.020
0.000
0.089
0.003
0.002
0.000
0.000
0.000
0.000
0.001
0.001
0.031
Textiles & Clothing
0.000
0.000
0.000
0.000
0.000
0.000
0.000
0.000
0.000
0.000
0.000
0.000
0.045
0.000
0.000
0.000
0.000
0.000
0.002
0.000
0.001
0.000
0.000
0.000
0.000
0.000
0.000
0.000
0.000
0.004
Wood & Wood Products
0.000
0.000
0.000
0.000
0.000
0.000
0.000
0.000
0.000
0.000
0.000
0.001
0.000
0.000
0.000
0.000
0.000
0.000
0.000
0.000
0.001
0.000
0.000
0.000
0.000
0.000
0.000
0.000
0.000
0.001
Paper, Printing & Publishing
0.000
0.000
0.000
0.016
0.000
0.000
0.000
0.000
0.000
0.000
0.000
0.049
0.007
0.000
0.000
0.000
0.000
0.000
0.005
0.000
0.004
0.006
0.002
0.000
0.000
0.000
0.000
0.002
0.001
0.021
2 The sheet “Secondary Links”, “Tertiary Links” and “Fourth Link” are identical to this sheet. 3 Some of the selling sectors (displayed horizontally) are abbreviated due to space constraints

79
Rubber & Plastics
0.000
0.000
0.000
0.002
0.000
0.000
0.000
0.000
0.000
0.000
0.000
0.043
0.002
0.000
0.000
0.000
0.000
0.000
0.006
0.000
0.001
0.006
0.007
0.000
0.000
0.000
0.000
0.000
0.000
0.003
Other Manufacturing
0.000
0.000
0.000
0.001
0.000
0.000
0.000
0.000
0.000
0.000
0.000
0.001
0.004
0.000
0.000
0.000
0.000
0.000
0.001
0.000
0.001
0.001
0.000
0.000
0.000
0.000
0.000
0.001
0.000
0.009
Construction 0.000
0.000
0.000
0.053
0.000
0.000
0.000
0.000
0.000
0.000
0.000
0.005
0.001
0.000
0.000
0.000
0.000
0.000
0.006
0.000
0.005
0.013
0.009
0.000
0.000
0.000
0.000
0.001
0.001
0.012
Retailing 0.000
0.000
0.000
0.006
0.000
0.000
0.000
0.000
0.000
0.000
0.000
0.005
0.000
0.000
0.000
0.000
0.000
0.000
0.017
0.000
0.010
0.021
0.004
0.000
0.000
0.000
0.000
0.001
0.000
0.015
Wholesaling 0.000
0.000
0.000
0.038
0.000
0.000
0.000
0.000
0.000
0.000
0.000
0.153
0.047
0.000
0.000
0.000
0.000
0.000
0.010
0.000
0.060
0.007
0.009
0.000
0.000
0.000
0.000
0.002
0.006
0.029
Hotels & Catering
0.000
0.000
0.000
0.005
0.000
0.000
0.000
0.000
0.000
0.000
0.000
0.003
0.001
0.000
0.000
0.000
0.000
0.000
0.013
0.000
0.004
0.005
0.002
0.000
0.000
0.000
0.000
0.001
0.001
0.011
Transport 0.000
0.000
0.000
0.009
0.000
0.000
0.000
0.000
0.000
0.000
0.000
0.065
0.016
0.000
0.000
0.000
0.000
0.000
0.045
0.000
0.020
0.283
0.018
0.000
0.000
0.000
0.000
0.003
0.002
0.031
Communications
0.000
0.000
0.000
0.011
0.000
0.000
0.000
0.000
0.000
0.000
0.000
0.011
0.002
0.000
0.000
0.000
0.000
0.000
0.011
0.000
0.012
0.013
0.055
0.000
0.000
0.000
0.000
0.001
0.001
0.026
Banking & Insurance
0.000
0.000
0.000
0.101
0.000
0.000
0.000
0.000
0.000
0.000
0.000
0.088
0.031
0.000
0.000
0.000
0.000
0.000
0.030
0.000
0.022
0.039
0.009
0.000
0.000
0.000
0.000
0.001
0.001
0.036
Business Services
0.000
0.000
0.000
0.074
0.000
0.000
0.000
0.000
0.000
0.000
0.000
0.081
0.014
0.000
0.000
0.000
0.000
0.000
0.077
0.000
0.058
0.095
0.039
0.000
0.000
0.000
0.000
0.007
0.006
0.239
Other F&Bs 0.000
0.000
0.000
0.030
0.000
0.000
0.000
0.000
0.000
0.000
0.000
0.013
0.005
0.000
0.000
0.000
0.000
0.000
0.068
0.000
0.017
0.044
0.011
0.000
0.000
0.000
0.000
0.002
0.001
0.030
Public Admin. & Defence
0.000
0.000
0.000
0.002
0.000
0.000
0.000
0.000
0.000
0.000
0.000
0.001
0.001
0.000
0.000
0.000
0.000
0.000
0.001
0.000
0.001
0.008
0.001
0.000
0.000
0.000
0.000
0.000
0.000
0.001
Education 0.000
0.000
0.000
0.003
0.000
0.000
0.000
0.000
0.000
0.000
0.000
0.002
0.001
0.000
0.000
0.000
0.000
0.000
0.002
0.000
0.003
0.006
0.005
0.000
0.000
0.000
0.000
0.009
0.001
0.016
Health 0.000
0.000
0.000
0.003
0.000
0.000
0.000
0.000
0.000
0.000
0.000
0.002
0.001
0.000
0.000
0.000
0.000
0.000
0.001
0.000
0.001
0.001
0.001
0.000
0.000
0.000
0.000
0.000
0.011
0.008
Other (mainly Public) Services
0.000
0.000
0.000
0.006
0.000
0.000
0.000
0.000
0.000
0.000
0.000
0.007
0.002
0.000
0.000
0.000
0.000
0.000
0.004
0.000
0.011
0.008
0.007
0.000
0.000
0.000
0.000
0.001
0.002
0.450

80
G. Leeds and the Yorkshire and Humber economy In this appendix we examine the relationship between Leeds and the Yorkshire and Humber economy. One of the key limitations of the methodology for estimating the economic impact of financial inclusion interventions is that it relies on an input-output table for the Yorkshire and Humber region rather than one for Leeds. Therefore in the above sections we present the impact of financial inclusion interventions on the regional rather than the local economy.
Regional economic theory and research suggests that smaller economies, such as Leeds, tend to be more reliant on imports than larger economies, such as Yorkshire and Humber (see for example Armstrong and Taylor, 2000). An estimate for economic impact produced using input-output data for Leeds would most likely have been smaller as industries in Leeds, on average, are likely to be net importers of inputs from Yorkshire and Humber industrial sectors.
However, in the absence of data on the trading relationship between Leeds and the Yorkshire and Humber region, there is no scientifically reliable way of disentangling the impact on the Leeds economy. That said contextual information and data on the relationship between the two economies will aid in placing the findings in context.
Leeds is the regional capital of Yorkshire and Humber and the single-largest centre of economic activity of the region. The city accounts for nearly 15% of the regional population and just over 15% of the economically active population (Table E.1).
Table E.1: Population and labour force selected Local Authorities for Yorkshire and Humber
Total population EA population* Yorkshire and Humber 5, 255,000 3,291,000Leeds 772,000 504,000Bradford 510,000 315,000Kirklees 406,000 254,000Wakefield 326,000 206,000Barnsley** 223,000 NACalderdale** 198,000 126,000York*** 192,000 NANotes: *EA = Economically Active (population aged 16 to retirement) Source: 2009 data provided by Leeds City Council. ** Based on data in Leeds Economy Handbook (2008)
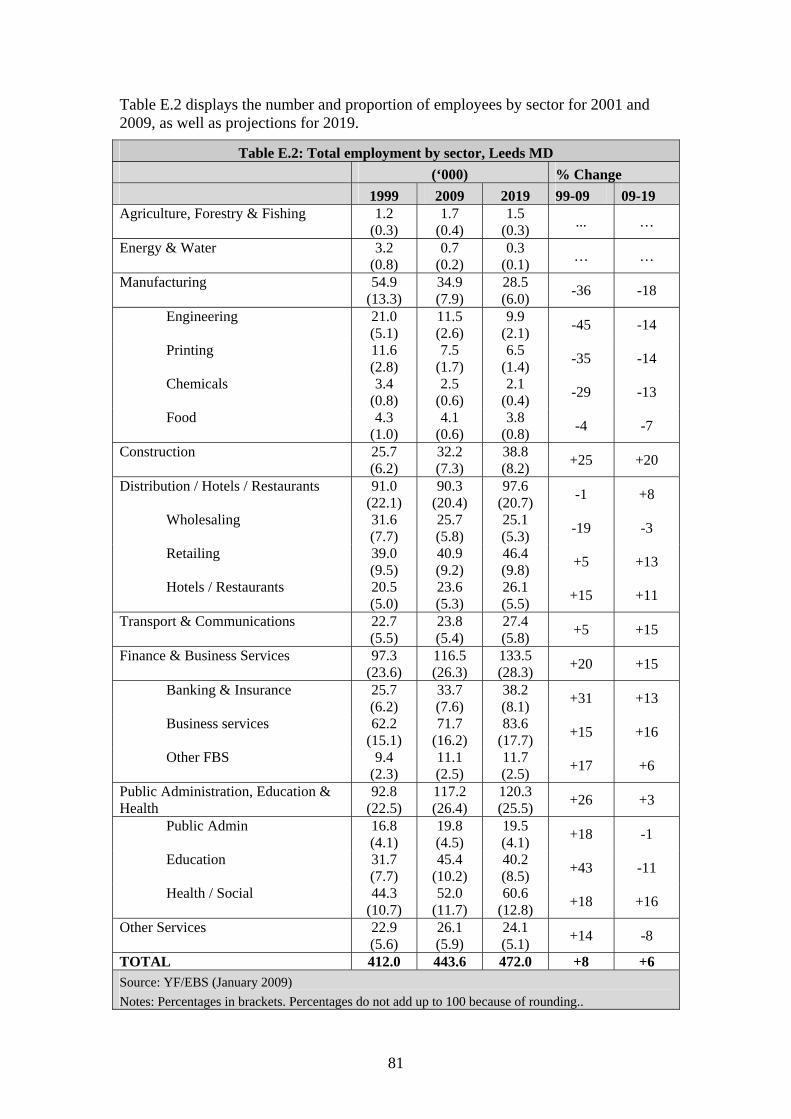
81
Table E.2 displays the number and proportion of employees by sector for 2001 and 2009, as well as projections for 2019.
Table E.2: Total employment by sector, Leeds MD (‘000) % Change 1999 2009 2019 99-09 09-19 Agriculture, Forestry & Fishing 1.2
(0.3) 1.7
(0.4) 1.5
(0.3) ... …
Energy & Water 3.2 (0.8)
0.7 (0.2)
0.3 (0.1) … …
Manufacturing 54.9 (13.3)
34.9 (7.9)
28.5 (6.0) -36 -18
Engineering 21.0 (5.1)
11.5 (2.6)
9.9 (2.1) -45 -14
Printing 11.6 (2.8)
7.5 (1.7)
6.5 (1.4) -35 -14
Chemicals 3.4 (0.8)
2.5 (0.6)
2.1 (0.4) -29 -13
Food 4.3 (1.0)
4.1 (0.6)
3.8 (0.8) -4 -7
Construction 25.7 (6.2)
32.2 (7.3)
38.8 (8.2) +25 +20
Distribution / Hotels / Restaurants 91.0 (22.1)
90.3 (20.4)
97.6 (20.7) -1 +8
Wholesaling 31.6 (7.7)
25.7 (5.8)
25.1 (5.3) -19 -3
Retailing 39.0 (9.5)
40.9 (9.2)
46.4 (9.8) +5 +13
Hotels / Restaurants 20.5 (5.0)
23.6 (5.3)
26.1 (5.5) +15 +11
Transport & Communications 22.7 (5.5)
23.8 (5.4)
27.4 (5.8) +5 +15
Finance & Business Services 97.3 (23.6)
116.5 (26.3)
133.5 (28.3) +20 +15
Banking & Insurance 25.7 (6.2)
33.7 (7.6)
38.2 (8.1) +31 +13
Business services 62.2 (15.1)
71.7 (16.2)
83.6 (17.7) +15 +16
Other FBS 9.4 (2.3)
11.1 (2.5)
11.7 (2.5) +17 +6
Public Administration, Education & Health
92.8 (22.5)
117.2 (26.4)
120.3 (25.5) +26 +3
Public Admin 16.8 (4.1)
19.8 (4.5)
19.5 (4.1) +18 -1
Education 31.7 (7.7)
45.4 (10.2)
40.2 (8.5) +43 -11
Health / Social 44.3 (10.7)
52.0 (11.7)
60.6 (12.8) +18 +16
Other Services 22.9 (5.6)
26.1 (5.9)
24.1 (5.1) +14 -8
TOTAL 412.0 443.6 472.0 +8 +6 Source: YF/EBS (January 2009) Notes: Percentages in brackets. Percentages do not add up to 100 because of rounding..

82
Leeds appears to be predominantly a service-based economy, with public administration, education & health, hotels, retailing and finance & business services accounting for nearly 80% of local employment. These sectors have also been growing, especially finance, while manufacturing in particular has been in decline over the past few years.
This is an important observation given that the region overall has a proportionally larger manufacturing sector than Leeds (Table E.3), possibly indicating a sector where Leeds may import from other parts of the region.
Table E.3: Employment by sector for Leeds and Yorkshire and Humber (%) Leeds Yorkshire and Humber Manufacturing 9.4 13.8Construction 5.4 5.1Distribution, hotels & restaurants 21.1 24.0Transport & communications 5.0 6.0Public administration, education & health 27.0 28.2Other services 5.4 4.7Source: Leeds Economic Handbook
Although it cannot be observed from the table, given the data is suppressed for reasons of confidentiality, other parts of Yorkshire and Humber have more agricultural production than Leeds which is classed as a predominantly urban area (Yorkshire and the Humber Rural Observatory, 2006). It is possible that Leeds may be a net importer of agricultural produce from other parts of the region.