Economic Impact Analysis of Final Rule on Controlled Substances
35
ECONOMIC IMPACT ANALYSIS of Final Rule on Controlled Substances and List I Chemical Registration and Reregistration Fees, DEA-346 Drug Enforcement Administration U.S. Department of Justice February 2012
Transcript of Economic Impact Analysis of Final Rule on Controlled Substances

ECONOMIC IMPACT ANALYSIS
of
Final Rule on Controlled Substances and List I Chemical Registration and
Reregistration Fees, DEA-346
Drug Enforcement Administration
U.S. Department of Justice
February 2012

Table of Contents
CHAPTER 1: PURPOSE ......................................................................................................................................... 3
CHAPTER 2: STATEMENT OF NEED FOR A NEW FEE SCHEDULE ........................................................................... 4
2.1 STATUTORY AUTHORITY ......................................................................................................................................... 4 2.2 REGISTRATION AND REREGISTRATION FEES ................................................................................................................ 5
CHAPTER 3: REGISTRANT LANDSCAPE ................................................................................................................ 8
CHAPTER 4: ALTERNATIVE FEE CALCULATION METHODOLOGIES CONSIDERED ................................................ 11
4.1 SCOPE OF ANALYSIS ............................................................................................................................................ 11 4.2 WEIGHTED-RATIO OPTION (SELECTED METHODOLOGY) ............................................................................................ 14
4.2.1 Description ........................................................................................................................................... 14 4.2.2 Analysis ................................................................................................................................................ 15
CHAPTER 5: IMPACT ANALYSIS OF NEW FEES ................................................................................................... 18
5.1 ANNUAL ECONOMIC EFFECT LESS THAN $100 MILLION ............................................................................................. 18 5.2 NO MATERIAL ADVERSE AFFECT ........................................................................................................................... 19
5.2.1 Registration Fees as Business Expense ................................................................................................ 19 5.2.2 Registration Fees as Percentage of Income ......................................................................................... 20 5.2.3 Fee-Exempt Registrants ............................................................................................................................ 21 5.2.4 Conclusion ................................................................................................................................................ 22
CHAPTER 6: IMPACT OF RULE ON SMALL ENTITIES ........................................................................................... 23
6.1 IMPACT OF FEES ON SMALL BUSINESSES.................................................................................................................. 23 6.2 IMPACT OF FEES ON OTHER REGISTRANTS ............................................................................................................... 25
6.2.1 Impact on Pharmacies ......................................................................................................................... 25 6.2.2 Impact on Manufacturers and Distributors ......................................................................................... 26
CHAPTER 7: COST-BENEFIT ANALYSIS OF REGULATORY ACTION ....................................................................... 28
7.1 COSTS OF THE RULE ............................................................................................................................................ 28 7.2 BENEFITS OF THE RULE ........................................................................................................................................ 28 7.3 EVALUATION OF COSTS AND BENEFITS OF RULE (THRESHOLD ANALYSIS) ........................................................................ 31 7.4 ALTERNATIVE EVALUATION OF COSTS AND BENEFITS OF RULE ..................................................................................... 34
3
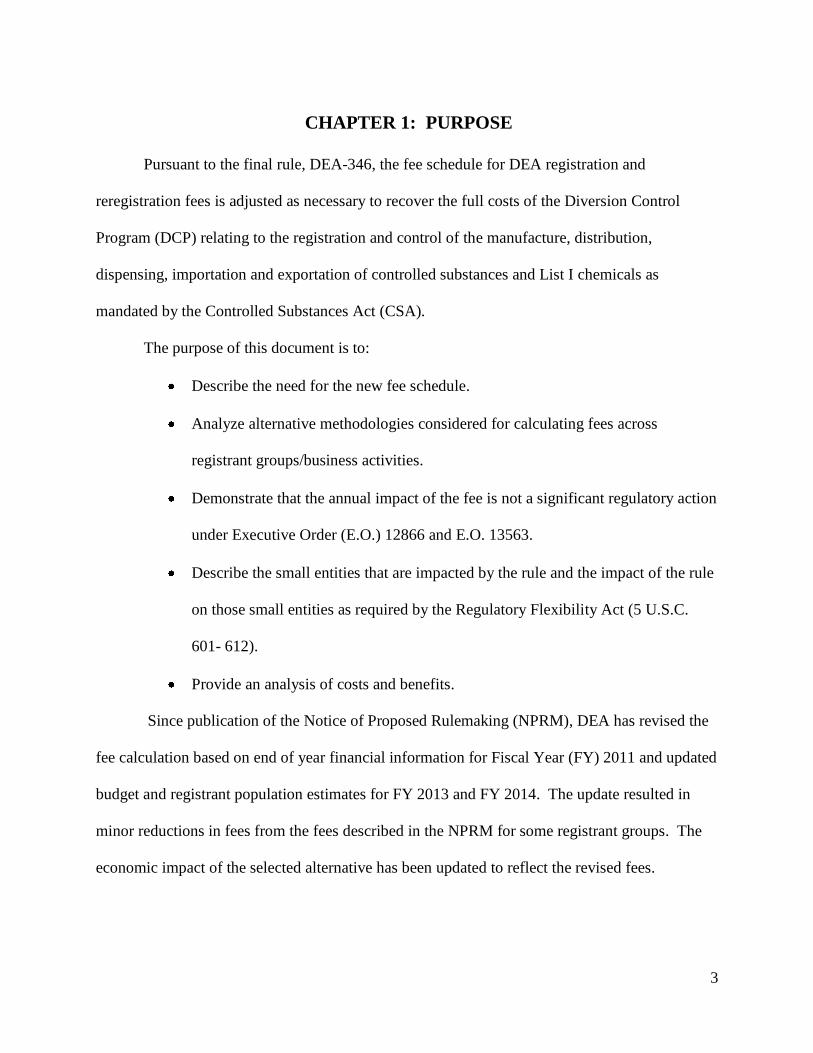
CHAPTER 1: PURPOSE
Pursuant to the final rule, DEA-346, the fee schedule for DEA registration and
reregistration fees is adjusted as necessary to recover the full costs of the Diversion Control
Program (DCP) relating to the registration and control of the manufacture, distribution,
dispensing, importation and exportation of controlled substances and List I chemicals as
mandated by the Controlled Substances Act (CSA).
The purpose of this document is to:
Describe the need for the new fee schedule.
Analyze alternative methodologies considered for calculating fees across
registrant groups/business activities.
Demonstrate that the annual impact of the fee is not a significant regulatory action
under Executive Order (E.O.) 12866 and E.O. 13563.
Describe the small entities that are impacted by the rule and the impact of the rule
on those small entities as required by the Regulatory Flexibility Act (5 U.S.C.
601- 612).
Provide an analysis of costs and benefits.
Since publication of the Notice of Proposed Rulemaking (NPRM), DEA has revised the
fee calculation based on end of year financial information for Fiscal Year (FY) 2011 and updated
budget and registrant population estimates for FY 2013 and FY 2014. The update resulted in
minor reductions in fees from the fees described in the NPRM for some registrant groups. The
economic impact of the selected alternative has been updated to reflect the revised fees.

4
CHAPTER 2: STATEMENT OF NEED FOR A NEW FEE SCHEDULE
2.1 STATUTORY AUTHORITY
A new fee schedule is required by statute and the final rule, DEA-346, implements a new
fee calculated pursuant to federal law. The final rule adjusts the registration and re-registration
fees relating to the registration and control of the manufacture, distribution, dispensing,
importation, and exportation of controlled substances and List I chemicals. For calculation
purposes, the collection of the new fee is estimated to begin on March 1, 2012, for the Fiscal
Year 2012-2014 period.
The Drug Enforcement Administration (DEA) implements and enforces Titles II and III
of the Comprehensive Drug Abuse Prevention and Control Act of 1970, often referred to as the
Controlled Substances Act (CSA) and the Controlled Substances Import and Export Act
(CSIEA) (21 U.S.C. 801-971), as amended (hereinafter “CSA”).1 DEA drafts and publishes the
implementing regulations for these statutes in Title 21 of the Code of Federal Regulations (CFR),
Parts 1300 to 1321. The Diversion Control Program (DCP) is a strategic component of DEA that
carries out the mandates of the CSA and its regulations to prevent, detect, and eliminate the
diversion of controlled substances and listed chemicals into the illicit market while ensuring a
sufficient supply of controlled substances and listed chemicals for legitimate medical, scientific,
research, and industrial purposes.
All manufacturers, distributors, dispensers, importers, and exporters of controlled
substances and List I chemicals are required to maintain an annual registration with DEA (21
U.S.C. 822 and 958(f)). Under the CSA, DEA is authorized to charge reasonable fees relating to
1 The Attorney General’s delegation of authority to DEA may be found at 28 CFR 0.100.

5
the registration and control of the manufacture, distribution, dispensing, importation, and
exportation of controlled substances and listed chemicals. 21 U.S.C. 821 and 958(f). DEA must
set fees at a level that ensures the recovery of the full costs of operating the various aspects of its
DCP. 21 U.S.C. 886a. Each year, DEA is required by statute to transfer the first $15 million of
fee revenues into the General Fund of the Treasury and the remainder of the fee revenues is
deposited into a separate fund of the Treasury called the Diversion Control Fee Account
(DCFA). 21 U.S.C. 886a(1). On at least a quarterly basis, the Secretary of the Treasury is
required to reimburse DEA an amount from the DCFA “in accordance with estimates made in
the budget request of the Attorney General for those fiscal years” for the operation of the DCP.2
21 U.S.C. 886a(1)(B) and (D). The first $15 million of fee revenues that are transferred to the
Treasury do not support any DCP activities.
2.2 REGISTRATION AND REREGISTRATION FEES
Currently, handlers of controlled substances and List I chemicals pay registration and
reregistration fees as required by statute. These fees (some of which are paid annually and some
of which are paid every three years) range from $184 to $2,293, depending on registrant
category. Practitioners, mid-level practitioners, dispensers, researchers, and narcotic treatment
programs pay an annual registration or annual equivalent of $184 (practitioners pay a registration
fee of $551 every three years). Distributors, importers, and exporters pay an annual fee of
$1,147, and manufacturers pay an annual fee of $2,293.
In accordance with the statutory requirements of the CSA, DEA continually monitors the
anticipated budget and collections to determine whether the registration fees need to be adjusted.
2 The diversion control program (DCP) consists of the controlled substance and chemical diversion control activities
of DEA. These activities are related to the registration and control of the manufacture, distribution, dispensing,
importation, and exportation of controlled substances and listed chemicals (21 U.S.C. 886a(2)).

6
DEA has determined that the fees need to increase in Fiscal Year (FY) 2012 to the amounts
indicated in Table 1: Registration and Reregistration Fees by Class/Business in order to fully
fund the DCP. For purposes of calculating the fee, collections are estimated to begin on March
1, 2012.
Table 1: Registration and Reregistration Fee by Class/Business
Registrants on Three Year Registration Cycle Registrant Class/Business Current Three Year
Fee*
New Three Year Fee*
Difference Per Year
Pharmacy $551 $731 $60
Hospital/Clinic $551 $731 $60
Practitioner $551 $731 $60
Teaching Institution $551 $731 $60
Mid-Level Practitioner $551 $731 $60
*Pharmacies, hospitals/clinics, practitioners, teaching institutions, and mid-level practitioners currently pay a fee for a three year period. This current three-year fee is $551. The new fee for the three-year registration period would be $731. The three year difference is $180 or an annual difference of $60.
Registrants on Annual Registration Cycle Registrant Class/Business Current Annual Fee
New Annual Fee
Difference
Researcher/Canine Handler $184 $244 $60
Analytical Lab $184 $244 $60
Maintenance $184 $244 $60
Detoxification $184 $244 $60
Maintenance and Detoxification $184 $244 $60
Compounder/Maintenance $184 $244 $60
Compounder/Detoxification $184 $244 $60
Compounder/Maintenance/ Detoxification $184 $244 $60
Distributor (chemical and controlled substances) $1,147 $1,523 $376
Reverse distributor $1,147 $1,523 $376
Importer (chemical and controlled substances) $1,147 $1,523 $376
Exporter (chemical and controlled substances) $1,147 $1,523 $376
Manufacturer (chemical and controlled substances)
$2,293 $3,047 $754
DEA last adjusted the registration fees in 2006 for the Fiscal Year 2006-2008 period.
Since that time, the diversion control responsibilities and activities of the DCP have grown but
the fees have not. For example, Congress has passed several amendments to the CSA which

7
have resulted in additional responsibilities and activities within the DCP. Such amendments
include the Methamphetamine Production Prevention Act of 2008, the Ryan Haight Online
Pharmacy Consumer Protection Act of 2008, and the Secure and Responsible Drug Disposal Act
of 2010. Without an adjustment of the fees, DEA will face a projected budgetary shortfall by
mid FY 2012 that would require dramatic program reductions to maintain budget solvency.

8
CHAPTER 3: REGISTRANT LANDSCAPE
This rule affects those manufacturers, distributors, dispensers, importers, and exporters of
controlled substances and List I chemicals that are required to obtain and pay a registration fee
with DEA pursuant to the CSA (21 U.S.C. 822 and 958(f)). As of August 2011, there were
1,407,119 controlled substances and chemical registrants (1,406,021 controlled substances
registrants and 1,098 chemical registrants), as shown in Table 2.
Pharmacies, hospitals/clinics, practitioners, teaching institutions, and mid-level
practitioners make up 98.9 percent of all registrants. These registrants register every three years.
Other registrants maintain an annual registration. Registration and reregistration costs vary by
registrant category as described in more detail in the sections below.
Table 2: Number of Registrants by Business Activity
Registrant Class/Business Controlled Substances Chemicals
Pharmacy 66,934
Hospital/Clinic 15,737
Practitioner 1,115,398
Teaching Institution 336
Mid-Level Practitioner 193,877
Researcher/Canine Handler 9,120
Analytical Lab 1,500
Narcotic Treatment Program 1,267
Distributor 828 550
Reverse Distributor 60
Importer 209 182
Exporter 233 159
Manufacturer 522 207
Total 1,406,021 1098
Total (all registrants) 1,407,119
*Data as of August 2011.
The fees affect a wide variety of entities. Table 3 indicates the sectors affected by the
rule and their average annual revenue/income. Most DEA registrants are small entities under

9
Small Business Administration (SBA) standards. Almost all practitioners, which are the largest
category of registrants, are considered small businesses (annual revenues of less than $6 million
to $8.5 million, depending on specialty). Practitioners and mid-level practitioners make up the
largest registration category with total 1,309,275 registrants (as of August 2011).
Table 3: Industrial Sectors of DEA Registrants
Sector NAICS
Code
Average Annual Revenue
per Establishment
Manufacturers
Petro-chemical Manufacturing (organic, inorganic) 32511 $1,390,485,971
Medicinal and Botanical Manufacturing 325411 $27,601,834
Pharmaceutical Manufacturing 325412 $144,173,821
Adhesive Manufacturing 325520 $17,482,468
Toilet Preparation Manufacturing 325620 $50,322,290
Other Chemical Manufacturing 325998 $13,720,807
Distributors
Drugs and Druggist Sundries Wholesalers 424210 $64,793,480
General Line Grocery Wholesalers 424410 $45,518,407
Confectionary Merchant Wholesalers 424450 $17,175,982
Chemical Wholesalers 424690 $12,856,993
Tobacco Wholesalers 424940 $71,437,205
Miscellaneous Wholesalers 424990 $2,741,857
Pharmacies
Supermarkets 445110 $7,247,540
Drug Stores 446110 $4,829,487
Discount Stores 452112 $26,535,201
Warehouse Clubs and Superstores 452910 $76,300,280
Other
Testing Labs 541380 $1,907,414
Packaging and Labeling Services 561910 $2,696,904
Other Practitioners
Professional Schools 611310 $1,373,855
Ambulatory Health Care Services 621 $1,236,852
Hospitals 622 $108,286,641
Source: 2007 Economic Census. http://www.census.gov/econ/census07.

10
Supermarkets, discount stores, warehouse clubs, and superstores handle controlled
substances through their distribution centers and pharmacies. Drug products containing List I
chemicals are primarily distributed as over-the-counter medicines. These are distributed by drug
wholesalers who specialize in non-prescription drugs, wholesalers who supply convenience
stores, and grocery, pharmacy, and discount stores (e.g., superstores) that operate their own
distribution centers.

11
CHAPTER 4: ALTERNATIVE FEE CALCULATION METHODOLOGIES
CONSIDERED
4.1 SCOPE OF ANALYSIS
As presented in the NPRM and analyzed in the Economic Impact Analysis of the Proposed
Fee Rule, DEA considered four methodologies to calculate registration and reregistration fees:
Past-Based Option, Future-Based Option, Flat Fee Option, and Weighted-Ratio Option.
Although the increase in the fees may be passed down to the registrants’ customers, the
alternatives are analyzed assuming that the increase in the fee is absorbed fully by the registrants.
Some commenters have confirmed this statement and have indicated some registrants may
decide not to renew their registration as a result of the higher fees.
For each of the alternatives considered, the calculated fees are analyzed for
reasonableness by examining: (1) the absolute amount of the fee increase, (2) the change in fee
as a percentage of revenue from 2007 to 2012, and (3) the relative fee increase across registrant
groups. Additionally, each calculation methodology is re-evaluated for its overall strengths and
weaknesses in recovering the full costs of the DCP.
Based on the analysis provided in the NPRM, DEA did not adopt the “Past-Based
Option.” There are two key reasons for rejecting this methodology. First, the fee increase would
be disproportionately burdensome to a small number of registrants. Distributors’ fees would
increase by over three fold, while the fees for the remaining registrant groups would increase
from 10 percent to 32 percent. DEA believes this is unreasonable. Second, the past-based
option is backward looking and implicitly assumes that the future will be similar to the past.
DEA cannot assume that future workload will reflect past DEA work hour data. For example,
DEA plans to conduct more scheduled investigations in accordance with the new scheduled

12
investigation work plan. As a result, DEA has concluded that past data is not the best basis for
the calculation of registration fees.
The second option analyzed in the NPRM is the “Future-Based Option” which is based
on projected work hours for each registrant class using scheduled investigation work plan goals
and anticipated/planned resources. Under this option, DEA based its calculations on projected
work hour data by registrant group for FY 2012-2014. In other words, the future-based option is
based on DEA’s projection of work plan goals and the resources required for these years—
specifically examining the direct cost of anticipated scheduled investigations.
DEA rejects this methodology because DEA believes it would result in an unreasonable
increase in fees for some registrants and reflect a severe disparity of increased fees among the
registrant groups. The large proportional increase in fees for two registrant categories would not
pass the “reasonable” standard required by statute. The vast disparity in the increase, where fees
for manufacturers increase by more than 700 percent while fees for dispensers increase by 26
percent, is unreasonable.
The third option analyzed in the NPRM is called the “Flat Fee Option.” This
methodology would provide equal fees across all registrant groups regardless of the proportion
of DCP costs and resources the registrant group may require (e.g. investigation resources). The
fee calculation is straightforward: the total amount needed to be collected over the three year
period is divided by the total number of registration fee transactions over the three year period,
adjusting for registrants on the three year registration cycle.
DEA did not select this methodology because of the great disparity in fees among
registrant groups. Under this option, the calculation results in reduced fees for manufacturers
and distributors by 89 percent and 78 percent respectively, while practitioner fees would increase

13
by 34 percent. Thus, setting the fees at the same level across all registrant groups is not
“reasonable.” DEA registrants include some of the largest corporations in the world although the
vast majority of registrants are practitioners, such as physicians, dentists and nurse practitioners.
To satisfy the “reasonable” standard, registration fees should not be a flat fee regardless of the
category of registrant. There are cost differences for scheduled investigations and other DCP
costs among the registrant categories.
The fourth methodology evaluated and selected for the calculation in the NPRM is the
“Weighted-Ratio Option.” In this option, fees are assigned to different registrant categories
based on DEA’s historical cost data. This option distinguishes among the categories to establish
a “reasonable” fee for each category. The different fees are expressed in ratios: 1 for
researchers, canine handlers, analytical labs, and narcotics treatment programs; 3 for registrants
on three year registration cycles such as pharmacies, hospitals/clinics, practitioners, teaching
institutions, and mid-level practitioners; 6.25 for distributors and importers/exporters; and 12.5
for manufacturers. The adopted ratios are applied for administrative convenience since
historically costs vary and a fee must be set in advance. To determine the fee, a weighted ratio is
assigned based on registrant group, and the amount needed to be collected over the FY 2012 –
FY 2014 period to cover the costs of the DCP is divided by the weighted number of estimated
registrations to determine the fees.
The weighted-ratio methodology, much like the flat fee methodology, is straightforward
and easy to understand, but unlike the flat fee, this method applies historic weighted ratios to
differentiate fees among registrant groups. The fees calculated using this methodology are
similar to fees calculated in the past-based option, which allocates historical pre-registration and
scheduled investigations costs to registrant groups. This method, however, does not create a

14
disproportionate fee increase in any registrant group. The proposed fee published in the NPRM
calculated proposed fees using this methodology with an increase of approximately 33 percent
from current fees for all registrant groups.
Since the publication of the NPRM, DEA has revised the fee calculation based on new
financial information for Fiscal Year (FY) 2011 and updated budget and registrant population
estimates for FY 2013 and FY 2014. The update resulted in minor reductions in fees for some
registrant groups from the fees described in the NPRM. The economic impact of the weighted-
ratio methodology has been updated to reflect the revised fees. The revised fees result in an
increase of approximately 33 percent from current fees for all registrant groups.
4.2 WEIGHTED-RATIO OPTION (Selected Methodology)
4.2.1 Description
Option 4 is called the Weighted-Ratio Option. In this option, fees are assigned to
different registrant categories based on DEA’s historical cost data. This option distinguishes
among the categories to establish a “reasonable” fee for each category. The different fees are
expressed in ratios: 1 for researchers, canine handlers, analytical labs, and narcotics treatment
programs; 3 for registrants on three year registration cycles, pharmacies, hospitals/clinics,
practitioners, teaching institutions, and mid-level practitioners (all of such registrants are on a
three-year cycle, meaning the ratio is equivalent to a 1 ratio on an annual basis); 6.25 for
distributors and importers/exporters; and 12.5 for manufacturers. The adopted ratios are applied
for administrative convenience since historically costs vary and a fee must be set in advance. To
determine the fee, a weighted ratio is assigned based on registrant group, and the amount needed
to be collected over the FY 2012 – FY 2014 period is divided by the weighted number of
estimated registrations to determine the fees.

15
Table 4: Annual Registrant Fees Under Weighted-Ratio Option
Registrants on Three Year Registration Cycle Registrant Class/Business Current Three Year
Fee*
New Three Year Fee*
Difference Per Year
Pharmacy $551 $731 $60
Hospital/Clinic $551 $731 $60
Practitioner $551 $731 $60
Teaching Institution $551 $731 $60
Mid-Level Practitioner $551 $731 $60
*Pharmacies, hospitals/clinics, practitioners, teaching institutions, and mid-level practitioners currently pay a fee for a three year period. This current three year fee is $551. The new fee for the three year registration period would be $731. The three year difference is $180 or an annual difference of $60.
Registrants on Annual Registration Cycle Registrant Class/Business Current Annual Fee
New Annual Fee
Difference
Researcher/Canine Handler $184 $244 $60
Analytical Lab $184 $244 $60
Maintenance $184 $244 $60
Detoxification $184 $244 $60
Maintenance and Detoxification $184 $244 $60
Compounder/Maintenance $184 $244 $60
Compounder/Detoxification $184 $244 $60
Compounder/Maintenance/ Detoxification $184 $244 $60
Distributor (chemical and controlled substances) $1,147 $1,523 $376
Reverse distributor $1,147 $1,523 $376
Importer (chemical and controlled substances) $1,147 $1,523 $376
Exporter (chemical and controlled substances) $1,147 $1,523 $376
Manufacturer (chemical and controlled substances)
$2,293 $3,047 $754
4.2.2 Analysis
Analysis of Fees
In the weighted-ratio option, the registration fees for all registrant groups increase 33
percent from current fees. The new registration fees range from $244 annually (or annual
equivalent) to $3,047. Registration fees are collected by location and by registered business

16
activity. Most small registrants are expected to pay a single registration fee of $244 ($60 annual
increase), $1,523 ($376 annual increase) or $3,047 ($754 annual increase).
(See Chapter 6 for analysis of fees as percentage of revenue).
Registration fees for all registrant groups increase by 33 percent and, as a result, there is
no disparity in the fee increase among registrant groups.
Evaluation of Methodology
The weighted-ratio methodology, much like the flat fee, is straightforward and easy to
understand, but unlike the flat fee, this method applies historic weighted ratios to differentiate
fees among registrant groups. Additionally, the fees calculated using this methodology are
similar to fees calculated in the past-based option, which allocates historical pre-registration and
scheduled investigations costs to registrant groups. Finally, this method does not create a
disproportionate fee increase in any registrant groups.
Conclusion
DEA selected the weighted-ratio option to calculate the new fee schedule. This approach
has been used since Congress established registrant fees and continues to be a reasonable
reflection of differing costs. The registration fees under the weighted-ratio option result in
differentiated fees among registrant groups, where registrants with larger revenues pay higher
fees than registrants with lower revenues. Furthermore, the weighted-ratio does not create a
disparity in the relative increase in fees from the current to the new fees. The weighted ratios
used by DEA to calculate the new fee have proven effective and reasonable over time.
Additionally, the selected calculation methodology accurately reflects the differences in activity
level, such as in pre-registration and scheduled investigations by registrant category; for

17
example, these costs are greatest for manufacturers. DEA selected this option because it is the
only option that resulted in “reasonable” fees for all registrant groups.

18
CHAPTER 5: IMPACT ANALYSIS OF NEW FEES
Executive Order 12866 provides that agencies must submit a regulatory impact analysis only
for those regulatory actions that are "significant." A regulatory action is significant if it is anticipated
to: (1) have an annual effect on the economy of $100 million or more, (2) adversely affect in a
material way the economy, a sector of the economy, productivity, competition, jobs, the
environment, public health or safety, or State, local, or tribal governments or communities, (3) create
a serious inconsistency or otherwise interfere with an action taken or planned by another agency, (4)
materially alter the budgetary impact of entitlements, grants, user fees, or loan programs, or the rights
and obligations of recipients thereof, or (5) raises novel legal or policy issues arising out of legal
mandates, the President’s priorities, or the principles set forth in Executive Order 12866.3
DEA has concluded that this rule is not an economically significant regulatory action
pursuant to Executive Order 12866 (58 FR 51735, October 4, 1993) as supplemented and
affirmed by Executive Order 13563 (76 FR 3821, January 18, 2011). This rule does not meet
any of the criteria set forth for “significant” regulatory action, including:
1. Annual effect on the economy of $100 million or more.
2. Adversely affect in a material way the economy, a sector of the economy,
productivity, competition, jobs, the environment, public health or safety, or State,
local, or tribal governments or communities.
5.1 ANNUAL ECONOMIC EFFECT LESS THAN $100 MILLION
DEA estimates that it would collect approximately $812,254,676 in registration fees at
current fee levels for the Fiscal Year 2012 – FY2014 period. This estimated collection amount is
3 E.O. 12866. See also Office of Management and Budget, Office of Information and Regulatory Affairs,
“Regulatory Impact Analysis: Frequently Asked Questions,” February 7, 2011.

19
insufficient to fully fund the DCP as mandated by law. However, the new fees are estimated to
result in a total registration fee collection of $1,040,934,380 for the FY 2012-2014 period. The
estimated increase in collections is $228,679,704 for the three year period. The average annual
increase in estimated registration fee collections is $76,226,568. Therefore, the annual effect on
the economy is less than $100 million and does not meet the “annual effect on the economy of
$100 million or more” criteria for “significant” regulatory action.
5.2 NO MATERIAL ADVERSE AFFECT
The fee is expected to have two levels of impact. Initially, the increase in the fee will
impact the registrants. Then the fee increase or portion of the fee increase is expected to
eventually be passed on to the general public. The analysis below assumes that the impact of the
fee increase is absorbed entirely by the registrants. Some commenters have confirmed this
statement and have indicated some registrants may decide not to renew their registration as a
result of the higher fees.
5.2.1 Registration Fees as Business Expense
DEA assumes that the registration fees are business expenses for all registrants. As a
result, the increase in the fee will be dampened by reduced tax liability from the increase in
registration fee expense. For example, if a practitioner pays an additional $60 per year in
registration fees and the combined federal and state income tax is 35 percent, the net cash impact
is $39, not $60. The additional $60 causes income/profit to decrease by $60, decreasing the tax
liability by $21. The net cash outlay is $39.4
4 This example is for illustration purposes only. Each entity should seek competent tax advice for tax consequences
of the fees established by this rule.

20
5.2.2 Registration Fees as Percentage of Income
DEA examined the new fees as a percentage of income for physicians, dentists, and
physician’s assistants. The fee increase is expected to have the greatest effect on small
businesses. The majority of practitioners and mid-level practitioners work in small businesses.
Physicians, dentists, and physician’s assistants reflect a representative sub-group of the
practitioner and mid-level practitioner registrant groups.
The table below describes the average income for physicians, dentists, and physician’s
assistants from 2004 to 2012. The table below also reflects the impact of the fee increase as a
percentage of average income. This analysis assumes that the fee increase is absorbed personally
by each practitioner/mid-level practitioner. The analysis ignores the dampening effect of
registration fees as a business expense and the potential that the fee increase might be passed on
to customers.
Table 8: Fee as Percentage of Income FY 2004 - 2012
Average Income5 Fee Fee as % of Average Income
Year Physicians Dentists
Physician
Assistants
(Annual
Basis) Physicians Dentists
Physician
Assistants
2004 137,610 130,300 68,780
2005 138,910 133,680 71,070
2006 142,220 140,950 74,270 184 0.129% 0.131% 0.248%
2007 155,150 147,010 77,800 184 0.119% 0.125% 0.237%
2008 165,000 154,270 81,610 184 0.112% 0.119% 0.225%
2009 173,860 156,850 84,830 184 0.106% 0.117% 0.217%
2010 179,370 163,901 87,933 184 0.103% 0.112% 0.209%
2011 187,154 169,632 91,230 184 0.098% 0.108% 0.202%
2012 194,939 175,363 94,528 244 0.125% 0.139% 0.258%
Increase
from 2007
to 2012 26% 19% 22% 33% 6% 11% 9%
5 Source: Bureau of Labor Statistics, http://www.bls.gov.

21
Increase
from 2006
to 2012 37% 24% 27% 33% -3% 7% 4%
*Average income data for 2004 to 2009 is provided by the Bureau of Labor Statistics. 2010 to 2012 are estimated
figures based on linear regression, where a straight-line increase is calculated from years 2004 to 2009, then using
the line to estimate average income for 2010 to 2012.
In 2007, the current fee of $184 on an annual basis represented 0.119 percent, 0.125
percent, and 0.237 percent of average annual income for physicians, dentists, and physician’s
assistants respectively. In 2012, the fee of $244 (on an annual basis) would represent
approximately 0.125 percent, 0.139 percent, and 0.258 percent of average annual income for
physicians, dentists, and physician’s assistants respectively. This is a negligible difference.
While fees are 33 percent above the current fees implemented at the end of 2006, average
incomes for physicians, dentists, and physician’s assistants increased 26 percent, 19 percent, and
22 percent respectively over the same period. This estimated increase in average income
dampens the effect of the fee increase as a percentage of average income. The 33 percent fee
increase as a percentage of average income is 6 percent for physicians (0.125%/0.119% - 1), 11
percent for dentists, and 9 percent for physician’s assistants from 2007 to 2012. The diminishing
effect is more apparent when comparing 2012 to 2006, the year for which the current fee was
calculated and implemented. Additionally, as the average income grows in 2013 and 2014, the
adjusted fees relative to average income are not any higher than in recent history.
5.2.3 Fee-Exempt Registrants
Exempt from the payment of registration fees are any hospital or other institution that is
operated by an agency of the United States, of any State, or any political subdivision of an
agency thereof. Likewise, an individual who is required to obtain a registration in order to carry

22
out his/her duties as an official of a federal or State agency is also exempt from registration fees.6
Fee exempt registrants are not affected by the fees.
5.2.4 Conclusion
DEA concludes that this rule is not a significant regulatory action because it does not
result in a materially adverse effect on the economy, a sector of the economy, productivity,
competition, jobs, the environment, public health or safety, or State, local, or tribal governments
or communities.7 The fee will initially affect all fee paying registrants. The fees may eventually
be passed on to the general public, diminishing the impact of the fee increase on individual
registrants. The impact of the fee on registrants is also diminished by a reduction in tax
liabilities and an increase in average income. Additionally, hospitals and institutions operated by
federal, State, or local governments and for their employees are exempt from registration fees.8
Moreover, DEA believes that this rule will enhance public health and safety.
6 See 21 CFR 1301.21 for complete fee exemption requirements.
7 In accordance with 25 U.S.C. 1616q, employees of a tribal health or urban Indian organization are exempt from
“payment of licensing, registration, and any other fees imposed by a Federal agency to the same extent that officer
of the commissioned corps of the Public Health Service and other employees of the Service are exempt from those
fees.” To the extent that any hospital or other institution operated by or any individual practitioner associated with
an Indian Tribal Government must pay fees, the economic impact is not substantial. 8 See 21 CFR 1301.21 for complete requirements for exemption of registration fees.

23
CHAPTER 6: IMPACT OF RULE ON SMALL ENTITIES
In accordance with the Regulatory Flexibility Act of 1980 (5 U.S.C. 601-612) (RFA),
DEA has evaluated the impact of this rule on small entities and has determined that this rule will
not have a significant economic impact on a substantial number of small entities. As discussed
in Chapter 3, most DEA registrants are small entities under Small Business Administration
(SBA) standards. DEA has concluded that the adjustments in registration fees will not have a
significant effect on these small business entities.
6.1 IMPACT OF FEES ON SMALL BUSINESSES
To assess whether the new fee schedule could impose a significant economic impact on a
substantial number of small entities, DEA compared the fees as a percentage of revenue in 2012
to the current fees as a percentage of revenue in 2007.9 DEA has determined that the rule will
not have a significant economic impact on a substantial number of small entities. Economic
impact by registrant classes is discussed in the following sections. Practitioners and mid-level
practitioners represent 93 percent of all registrants and nearly all practitioners and mid-level
practitioners are employed by small businesses pursuant to SBA standards. Among all
registrants, practitioners and mid-level practitioners have the lowest annual revenues. While
there are many specialists listed in the Bureau of Labor Statistics income data, incomes for
physicians, dentists, and physician’s assistants are representative of the practitioner and mid-
level practitioner registrant groups.
Below is the table from Chapter 5.
9 2007 is the first full year of the previous registration fee increase. DEA proposes that 2012 be the first full year of
the proposed new fee increase. Due to annual increases in annual income, the fees as a percentage of income would
also change. Comparing the fees to annual income at the first full year of fee increase would be a like comparison.

24
Table 6: Fee as Percentage of Income FY 2004 - 2012
Average Income10
Fee Fee as % of Average Income
Year Physicians Dentists
Physician
Assistants
(Annual
Basis) Physicians Dentists
Physician
Assistants
2004 137,610 130,300
68,780
2005 138,910 133,680
71,070
2006 142,220 140,950
74,270 184 0.129% 0.131% 0.248%
2007 155,150 147,010
77,800 184 0.119% 0.125% 0.237%
2008 165,000 154,270
81,610 184 0.112% 0.119% 0.225%
2009 173,860 156,850
84,830 184 0.106% 0.117% 0.217%
2010 179,370 163,901
87,933 184 0.103% 0.112% 0.209%
2011 187,154 169,632
91,230 184 0.098% 0.108% 0.202%
2012 194,939 175,363
94,528 244 0.125% 0.139% 0.258%
Increase
from
2007 to
2012 26% 19% 22% 33% 6% 11% 9%
Increase
from
2006 to
2012 37% 24% 27% 33% -3% 7% 4%
For practitioners and mid-level practitioners, the new fee, on an annual basis, is $244; the
annual increase is $60 from the current fee. Physicians constitute the largest percentage of all
practitioner registrants. Based on Bureau of Labor Statistics annual salary data, the current fee in
2007, the first full year of the current fee, represented 0.119 percent, 0.125 percent, and 0.237
percent of annual income for physicians, dentists, and physician’s assistants respectively. In
10
Source: Bureau of Labor Statistics, http://www.bls.gov. Average income data for 2004 to 2009 is provided by the
Bureau of Labor Statistics. 2010 to 2012 are estimated figures based on linear regression, where a straight-line
increase is calculated from years 2004 to 2009, then using the line to estimate average income for 2010 to 2012.

25
2012, the fee of $244, on an annual basis, is estimated to be approximately 0.125 percent, 0.139
percent, and 0.258 percent of annual income for physicians, dentists, and physician’s assistants
respectively. The annual impact of the rule is the difference between the fee as a percentage of
income in 2012 to the current fee as a percentage of income in 2007, which are 0.007 percent
(0.125% - 0.119% = 0.007%, rounded), 0.014 percent, and 0.022 percent for physicians, dentists,
and physician’s assistants respectively. (Numbers are rounded to the third decimal point.)
As discussed in Chapter 5, there are additional mitigating factors not included in the
above analysis. The fee increase may be passed on to consumers; however, this analysis does
not consider that the fees may be passed onto consumers in the form of higher prices for medical
services or products. The fees may be treated as business expenses where after-tax impact is
diminished; however, this analysis does not take potential deductions into account.
For consideration of the impact of the fee increase on small businesses, DEA analyzed
the registration fee as a percentage of annual income for a representative group: physicians,
dentists, and physician’s assistants. The impact of the fees, $60 per year increase from current
fees, were found to be 0.007 percent, 0.014 percent, and 0.022 percent of annual income for
physicians, dentists, and physician’s assistants respectively, when normalized for income
increases. In consideration of the calculated impact and potentially further mitigating factors
discussed in Chapter 5, DEA concludes that the rule will not have a significant economic impact
on a substantial number of small entities.
6.2 IMPACT OF FEES ON OTHER REGISTRANTS
6.2.1 Impact on Pharmacies
Pharmacies represent 4.8 percent of all registrants. Many pharmacies are parts of chains,
and some chains have thousands of stores. A corporate chain has the choice of having each store

26
in the chain pay a registration fee on the individual location’s behalf or having the corporation
pay for all locations at one time. Regardless of how the fee is paid, registration fees for a large
chain can be substantial. For example, the registration fee for each pharmacy is $244 on an
annual basis. Therefore, a chain with 4,000 stores would have a combined annual fee equivalent
of $976,000. The increase in fees would be $240,000. Such fees are large, but compared to
revenue, they are a much smaller percentage than those for physicians and dentists. The
incremental increase in the fee from current fees as a percentage of revenue is even lower. Table
9 shows the new fees (annual equivalent) as percentage of average yearly revenue for various
types of pharmacies.
Table 7: New Fees as Percentage of Revenue for Pharmacies
Pharmacy Types Current
fee
(annual)
New fee
(annual)
Amount of
increase
from
Current fee
Ratio:
New fee to
Current
fee
% of
Annual
Revenue
Current
fee**
% of
Annual
Revenue
New fee**
Supermarkets $ 184 $ 244 $ 60 1.33 0.003% 0.003%
Drug Stores $ 184 $ 244 $ 60 1.33 0.004% 0.005%
Discount Stores $ 184 $ 244 $ 60 1.33 0.001% 0.001%
Warehouse Clubs and Superstores
$ 184 $ 244 $ 60 1.33 0.000% 0.000%
Source: 2007 Economic Census. ** Current and Proposed Fees divided by average revenue in 2007, first full year the current fee.
6.2.2 Impact on Manufacturers and Distributors
The impact of the fee increase on manufacturers and distributors is minimal. For
manufacturers, the new fee as a percentage of revenue ranges from 0.000 to 0.022 percent of a
manufacturing establishment. For distributors, it is slightly higher: 0.002 to 0.055 percent. The

27
incremental increase in the fee from current fees as a percentage of revenue is even lower.
Manufacturers’ and distributors’ fees are high relative to practitioners’ fees, but they are a much
lower fraction of revenue than is the case for individual practitioners. Most manufacturers and
distributors do not qualify as small businesses under SBA standards.
Even for manufacturers and distributors that have multiple facilities and pay a registration
fee for each facility, the percentage of revenue (economic impact) does not change. The
percentages cited above are based on average revenue per establishment; increasing the number
of establishments will not change the fee as a fraction of revenue.
Table 8: New Fees as Percentage of Annual Revenue for Manufacturers and Distributors
Business Types Current
fee
(annual)
New fee
(annual)
Amount of
increase
from
Current fee
Ratio:
New fee to
Current
fee
% of
Annual
Revenue
Current
fee**
% of
Annual
Revenue
New fee**
Manufacturer
Petrochemical
Manufacturing
$ 2,293 $ 3,047 $ 754 1.33 0.000% 0.000%
Medicinal & Botanical
Manufacturing
$ 2,293 $ 3,047 $ 754 1.33 0.008% 0.011%
Pharmaceutical
Manufacturing
$ 2,293 $ 3,047 $ 754 1.33 0.002% 0.002%
Adhesive
Manufacturing
$ 2,293 $ 3,047 $ 754 1.33 0.013% 0.017%
Toilet Preparation
Manufacturing
$ 2,293 $ 3,047 $ 754 1.33 0.005% 0.006%
Other Chemical
Manufacturing
$ 2,293 $ 3,047 $ 754 1.33 0.017% 0.022%
Distributor
Drugs and Druggist
Sundries Wholesalers
$ 1,147 $ 1,523 $ 376 1.33 0.002% 0.002%
General Line Grocery
Wholesalers
$ 1,147 $ 1,523 $ 376 1.33 0.003% 0.003%
Confectionary
Merchant Wholesalers
$ 1,147 $ 1,523 $ 376 1.33 0.007% 0.009%
Chemical Wholesalers $ 1,147 $ 1,523 $ 376 1.33 0.009% 0.012%

28
Tobacco Wholesalers $ 1,147 $ 1,523 $ 376 1.33 0.002% 0.002%
Miscellaneous
Wholesalers
$ 1,147 $ 1,523 $ 376 1.33 0.042% 0.056%
Source: 2007 Economic Census. ** Current and Proposed Fees divided by average revenue in 2007, first full year the current fee.
CHAPTER 7: COST-BENEFIT ANALYSIS OF REGULATORY ACTION
In developing the Cost-Benefit Analysis (CBA), DEA focused on the costs and benefits
that accrue to citizens and residents of the United States over the three year period, 2012 to 2014.
The costs and benefits are measured against a baseline to capture the incremental costs and
benefits of the rule.
7.1 COSTS OF THE RULE
The cost of the rule is the incremental increase in the combined registration fees paid by
registrants. DEA estimates that it will collect approximately $812,254,676 in registration fees at
current fee levels for the FY 2012 – FY2014 period. This figure, $812,254,676, represents the
baseline. The fees are estimated to result in a total registration fee collection of $1,040,934,380
for Fiscal Years 2012-2014. The estimated increase in collections above the baseline is
$228,679,704 for the three year period. Thus, the average annual increase in estimated
registration fee collections is $76,226,568. Therefore, the cost of the rule is $76,226,568 per
year during FY 2012 – FY2014. Although registration fees are paid by registrants, some or all of
the registration fees are passed on to the citizens and residents of the United States. For this
CBA, DEA assumes the annual cost of the rule is $76,226,568.
7.2 BENEFITS OF THE RULE

29
Benefits of the rule are an extension of the benefits of the DCP. The DCP is a strategic
component of DEA that carries out the mandates of the CSA and its regulations to prevent,
detect, and eliminate the diversion of controlled substances and listed chemicals into the illicit
market while ensuring a sufficient supply of controlled substances and listed chemicals for
legitimate medical, scientific, research, and industrial purposes.
The citizens and residents of the United States bear an enormous cost from the diversion
of controlled substances and listed chemicals into the illicit market. To capture the benefits of
the rule, DEA estimated the cost of diversion to the citizens and residents of the United States:
(1) at a baseline, without implementation of the rule, and (2) under the rule.
DEA used “Economic Costs of Nonmedical Use of Prescription Opioids”11
and
“Estimated Costs of Prescription Opioid Analgesic Abuse in the United States in 2001”12
as
primary sources for obtaining costs to the citizens and residents of the U.S. associated with the
diversion of controlled substances and listed chemicals into the illicit market. While opioids
discussed in the publications represent a subset of all controlled substances regulated by the
DCP, the cost estimates in the publications represent a conservative estimated cost of diversion
of all controlled substances and listed chemicals from a reputable source.
The researchers gathered data from numerous sources including emergency department
information from the Drug Abuse Warning Network (DAWN), nonmedical use of prescription
opioids information from the National Survey on Drug Use and Health (NSDUH), substance
abuse treatment information from the Treatment Episode Data Sets (TEDS), statistical
information from the U.S. Department of Justice Bureau of Justice Statistics, Federal Bureau of
11
Clin J Pain (The Clinical Journal of Pain), Volume 27, Number 3, March/April 2011. 12
Clin J Pain (The Clinical Journal of Pain), Volume 22, Number 8, October 2006.
30
Investigation, National Forensic Laboratory, and Drug Enforcement Administration Budget
Summaries. Data related to the total cost of treatment for the abuse of prescription opioids also
included input from the Substance Abuse and Mental Health Services Administration at the U.S.
Department of Health and Human Services.
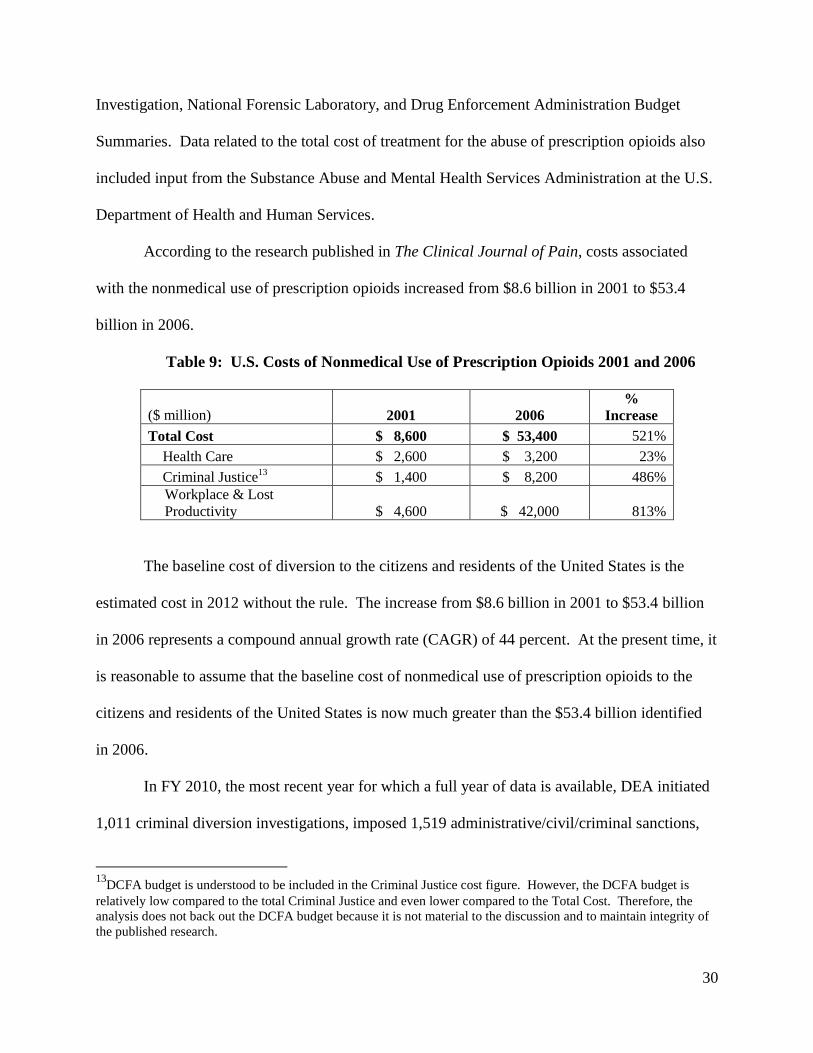
According to the research published in The Clinical Journal of Pain, costs associated
with the nonmedical use of prescription opioids increased from $8.6 billion in 2001 to $53.4
billion in 2006.
Table 9: U.S. Costs of Nonmedical Use of Prescription Opioids 2001 and 2006
($ million) 2001 2006
%
Increase
Total Cost $ 8,600 $ 53,400 521%
Health Care $ 2,600 $ 3,200 23%
Criminal Justice13
$ 1,400 $ 8,200 486%
Workplace & Lost
Productivity $ 4,600 $ 42,000 813%
The baseline cost of diversion to the citizens and residents of the United States is the
estimated cost in 2012 without the rule. The increase from $8.6 billion in 2001 to $53.4 billion
in 2006 represents a compound annual growth rate (CAGR) of 44 percent. At the present time, it
is reasonable to assume that the baseline cost of nonmedical use of prescription opioids to the
citizens and residents of the United States is now much greater than the $53.4 billion identified
in 2006.
In FY 2010, the most recent year for which a full year of data is available, DEA initiated
1,011 criminal diversion investigations, imposed 1,519 administrative/civil/criminal sanctions,
13
DCFA budget is understood to be included in the Criminal Justice cost figure. However, the DCFA budget is
relatively low compared to the total Criminal Justice and even lower compared to the Total Cost. Therefore, the
analysis does not back out the DCFA budget because it is not material to the discussion and to maintain integrity of
the published research.

31
and conducted 3,553 scheduled investigations. In FY 2012, DEA estimates that it will have
1,802 administrative/civil/criminal sanctions and 3,906 scheduled investigations.14
DEA
believes that each administrative/civil/criminal sanction prevents the diversion of controlled
substances and listed chemicals into the illicit market and that scheduled investigations deter the
diversion of controlled substances and listed chemicals into the illicit market.
An increase in scheduled investigations and administrative/civil/criminal sanctions, in
addition to added resources for criminal diversion investigations, is expected to, at a minimum,
slow down the growth in the cost of nonmedical use of prescription opioids and diversion as a
whole.
This rule provides additional resources to enhance the performance of the DCP and slow
down the growth in the cost of controlled substances and listed chemicals diverted into the illicit
market. Although difficult to accurately quantify, the benefit of this rule is the slowdown in the
growth of the cost of diversion of controlled substances and listed chemicals into the illicit
market.
7.3 EVALUATION OF COSTS AND BENEFITS OF RULE (THRESHOLD
ANALYSIS)
In evaluating the costs and benefits of the rule, the annual cost of the rule of $76,226,568,
which represents 0.14 percent of the cost of diversion – $53.4 billion – is compared with the
anticipated reduction in the growth rate of costs associated with diversion of controlled
substances and listed chemicals into the illicit market. The CBA uses the costs associated with
the nonmedical use of prescription opioids as a conservative estimate of the total cost associated
with diversion of controlled substances and listed chemicals into the illicit market.
14
FY 2012 Performance Budget Congressional Submission, p. DEA-70.

32
It is preferable to conduct a discounted cash flow analysis where the costs and benefits
are quantified and the net benefits are calculated and presented in today’s dollar value.
However, the baseline costs associated with diversion of controlled substances and listed
chemicals into the illicit market is unreliable. Therefore, a quantitative analysis is not possible
and a threshold analysis is utilized.
The threshold analysis considers whether the benefits of the rule are greater than or equal
to the cost of the rule.
As discussed above, the cost of the rule is $76,226,568 per year.
The benefits of the rule are represented as the difference between the costs associated
with diversion of controlled substances and listed chemicals into the illicit market at the baseline
and the costs associated with the diversion of controlled substances and listed chemicals into the
illicit market under the rule.
Benefits of Rule $0.076 billion

Cost Associated Cost Associated
with Diversion to with Diversion to illicit market - illicit market
$0.076 billion
(baseline) (rule)
33
The baseline costs associated with the diversion of controlled substances and listed
chemicals into the illicit market is estimated to be at least $53.4 billion (the cost associated with
the nonmedical use of prescription opioids in 2006).
Cost Associated
At least
$53.4 - with Diversion to
illicit market
$0.076 billion
(rule)
Rearranging the equation,
Cost Associated
with Diversion to
illicit market
At least
$53.4 billion - $0.076 billion
(rule)
Therefore, the break-even would occur if the costs associated with diversion of controlled
substances and listed chemicals into the illicit market are reduced to $0.076 billion from a
baseline of “at least $53.4 billion.”
billion

34
7.4 ALTERNATIVE EVALUATION OF COSTS AND BENEFITS OF RULE
As an alternative way to present the threshold analysis, DEA offers an overall cost-
benefit analysis comparing the increased fee collections under this rule, which support essential
enhancement in the effective operations of the Diversion Control Program (DCP), in correlation
to the societal costs from deaths resulting from the abuse of controlled substance
pharmaceuticals.
The DCP is a strategic component of DEA that carries out the mandates of the CSA and
its regulations to prevent, detect, and eliminate the diversion of controlled substances and listed
chemicals into the illicit market while ensuring a sufficient supply of controlled substances and
listed chemicals for legitimate medical, scientific, research, and industrial purposes. The citizens
and residents of the United States bear an enormous cost from the abuse of controlled substance
pharmaceuticals. The National Drug Control Strategy is focused on all aspects of the problem—
supply, demand, and treatment. The DCP is focused on the supply side of this serious threat to
the public health and safety. DCP enforcement activities are designed to maintain the integrity
of the closed system of distribution for controlled substances in order to prevent, detect, and
eliminate diversion, thereby reducing the supply of dangerous controlled substance
pharmaceuticals available for abuse and the potential for deadly overdoses.
DEA notes that the Department of Transportation, for rulemaking purposes, calculates the
value of a statistical life (VSL) saved at an estimated $6.2 million each for purposes of cost-benefit
analyses. The last two updates to its estimate and its sources can be found at:
http://regs.dot.gov/docs/VSL%20Guidance%202008%20and%202009rev.pdf and
http://regs.dot.gov/docs/Value_of_Life_July_29_2011.pdf. See also OMB Circular A-4, which
contains more information on the factors that typically go into such an estimate.

35
For the purposes of this cost-benefit analysis, DEA is using $6.2 million as an appropriate
VSL estimate.
With respect to the prevalence of drug overdose deaths, DEA notes that the Centers for
Disease Control and Prevention (CDC) reported that the number of poisoning deaths involving
any opioid analgesics increased from 4,041 in 1999 to 14,800 in 2008, more than tripling in 9
years.15
The estimated annual increase in registration and reregistration fees under this rule is $76
million.
Using these figures, only 13 lives (at a VSL of $6.2 million ) would need to be saved
each year through enhanced enforcement by the Diversion Control Program in order for the
benefits of such increased enforcement to exceed the cost of the additional fees collected in
support of the DCP.
15
Centers for Disease Control and Prevention, Morbidity and Mortality Weekly Report, November 4, 2011.