Louisiana’s Economy Resources and Rewards. Basic Economic Concepts Section 1 - Vocabulary.

Economic Forecast
OUTPUT AND EMPLOYMENT WHAT THE TABLE SHOWS:
Louisiana’s GDP forecast is derived from
the national forecast by allocating output to
each of the 50 states based on employment
shares. So, forecast misses reflect surprises
in the aggregate forecast as well as
unexpected shifts in a state’s GDP share.
Louisiana has been swimming against the
national economic tide, thanks to the
rebuilding from damage caused by
Hurricane Katrina in 2005.
KEY MESSAGES:
Louisiana benefits from the ongoing
recovery from Hurricane Katrina and the
nation’s strong energy conditions.
Note: GDP figures are based on quarterly values that are
interpolated from annual GDP estimates using quarterly
employment changes. Unbolded figures are reported actual
values and bold figures represent forecasts.
Sources: US Department of Commerce;
US Department of Labor.
November 30, 2012
Regional Perspectives: Louisiana Economic Outlook
Commercial Banking 2
2007 2008 2009 2010 2011 2012 2013 2014
United States
Real GDP
$ billions (fourth quarter) $13,326 $12,884 $12,873 $13,181 $13,441 $13,739 $14,203 $14,771
% change over the four quarters 2.2% -3.3% -0.1% 2.4% 2.0% 2.2% 3.4% 4.0%
Nonfarm employment
Job count (fourth quarter) 137,885,333 135,087,333 129,447,000 130,225,667 131,985,000 133,880,120 135,600,470 137,918,040
% change over the four quarters 0.9% -2.0% -4.2% 0.6% 1.4% 1.4% 1.3% 1.7%
Average monthly change 98,778 -233,167 -470,028 64,889 146,611 157,927 157,927 157,927
Louisiana
Real GDP
$ billions (fourth quarter) $187 $184 $187 $205 $206 $212 $218 $227
% change over the four quarters -2.4% -0.2% 4.5% 6.0% 1.4% 2.8% 3.2% 4.1%
Nonfarm employment
Job count (fourth quarter) 1,931,533 1,940,200 1,881,600 1,884,433 1,924,067 1,948,991 1,976,331 2,013,162
% change over the four quarters 2.7% 0.4% -3.0% 0.2% 2.1% 1.3% 1.4% 1.9%
Average monthly change 4,267 722 -4,883 236 3,303 2,077 2,278 3,069
The Economy’s Structure
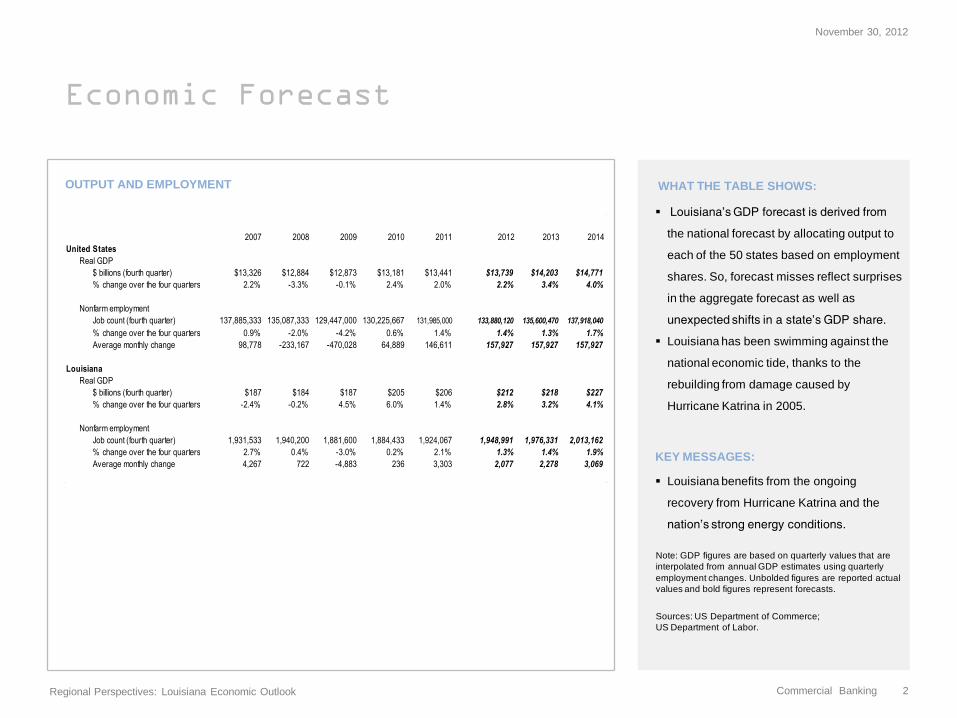
PERCENT OF TOTAL GDP DERIVED FROM SELECTED INDUSTRIES WHAT THE CHART SHOWS:
The percentage of private-sector real GDP
produced by each industry, compared with
the national foot print of each industry.
Louisiana’s economy is heavily concentrated
in the energy and forest products area and
so far this has been an asset. Real estate
has a much smaller footprint in the state
compared with the national economy.
KEY MESSAGES:
Louisiana’s steady performance rests
importantly on the robustness of its oil and
natural gas businesses.
Source: US Department of Commerce. Updated through
2008.
November 30, 2012
Regional Perspectives: Louisiana Economic Outlook
Commercial Banking 3
0
2
4
6
8
10
12
14
16
18
Ag
ricu
lture
Min
ing
Util
itie
s
Co
nst
ruct
ion
Du
rab
le m
an
ufa
ctu
ring
No
nd
ud
rab
le m
an
ufa
ctu
ring
Wh
ole
sale
tra
de
Re
tail
tra
de
Tra
nsp
ort
atio
n
Info
rma
tion
Fin
an
ce a
nd
insu
ran
ce
Re
al e
sta
te
Pro
fess
ion
al a
nd
tech
nic
al …
Ma
na
ge
me
nt o
f co
mp
an
ies
Ad
min
istr
ativ
e a
nd
wa
ste
se
rvic
es
Ed
uca
tion
al s
erv
ice
s
He
alth
ca
re a
nd
so
cia
l ass
ista
nce
Art
s, e
nte
rta
inm
en
t, a
nd
…
Ho
tel a
nd
foo
d s
erv
ice
Oth
er
serv
ice
s
Go
vern
me
nt
US industry mix
Louisiana's industry mix
Bankruptcies
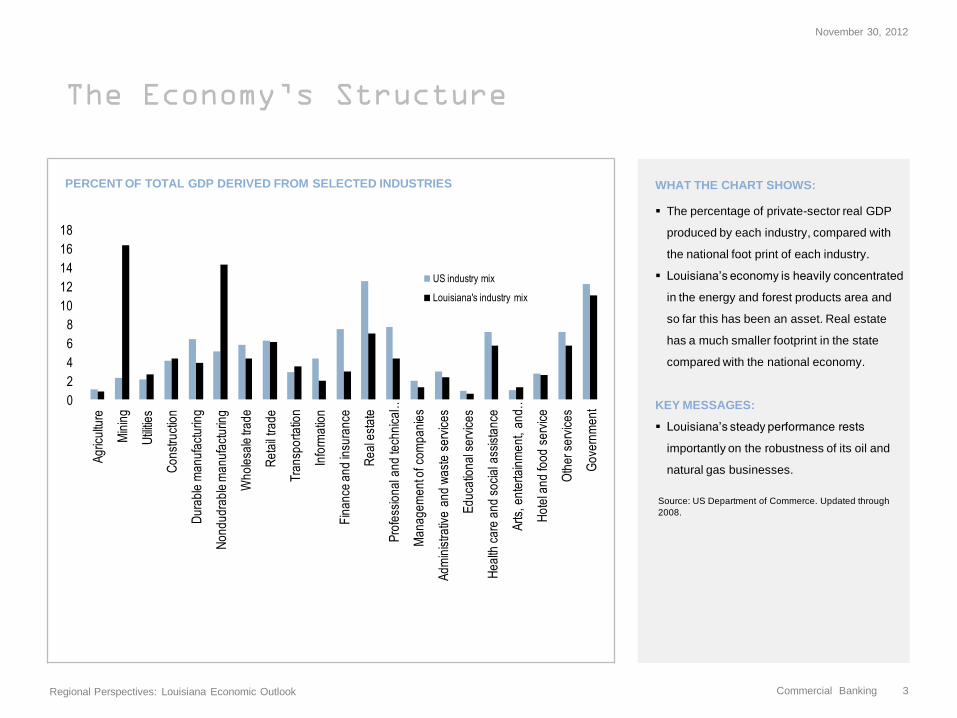
RATIO OF BANKRUPTCY FILINGS TO THE 2007 Q4 NUMBER WHAT THE CHART SHOWS:
The ratio of bankruptcy filing by businesses
and persons to filings in 2007 Q4.
Bankruptcy filings remain low and are
receding.
KEY MESSAGES:
Indicators of financial stress are a useful
coincident barometer of economic distress.
Financial strains remain relatively muted, all
things considered.
Source: Administrative Office of the U.S. Courts; Updated
through June 2012 (state) and September 2012 (national).
November 30, 2012
Regional Perspectives: Louisiana Economic Outlook
Commercial Banking 4
0
1
2
3
4
5
0
1
2
3
4
5
90 92 95 98 01 04 07 10
Business bankruptcy filingsNonbusiness bankruptcy filings
All US bankruptcy filings (shaded area)
Oil & Gas Activity
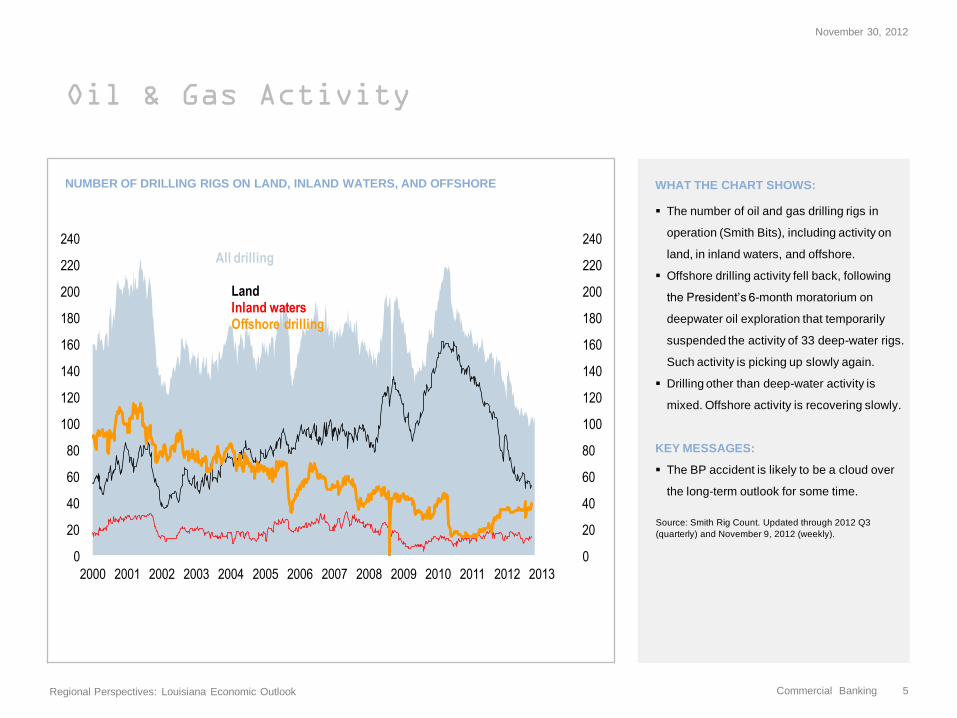
NUMBER OF DRILLING RIGS ON LAND, INLAND WATERS, AND OFFSHORE WHAT THE CHART SHOWS:
The number of oil and gas drilling rigs in
operation (Smith Bits), including activity on
land, in inland waters, and offshore.
Offshore drilling activity fell back, following
the President’s 6-month moratorium on
deepwater oil exploration that temporarily
suspended the activity of 33 deep-water rigs.
Such activity is picking up slowly again.
Drilling other than deep-water activity is
mixed. Offshore activity is recovering slowly.
KEY MESSAGES:
The BP accident is likely to be a cloud over
the long-term outlook for some time.
Source: Smith Rig Count. Updated through 2012 Q3
(quarterly) and November 9, 2012 (weekly).
November 30, 2012
Regional Perspectives: Louisiana Economic Outlook
Commercial Banking 5
0
20
40
60
80
100
120
140
160
180
200
220
240
0
20
40
60
80
100
120
140
160
180
200
220
240
2000 2001 2002 2003 2004 2005 2006 2007 2008 2009 2010 2011 2012 2013
All drilling
LandInland watersOffshore drilling

FRB Atlanta Business Survey
REAL GDP (% CHANGE 12 MONTHS EARLIER) DIFFUSION INDEXES (0 = NO CHANGE) WHAT THE CHART SHOWS:
The figure compares an index of business
activity produced by the Federal Reserve
Bank of Atlanta with Louisiana’s real GDP
growth. The index is an estimate of the trend
common to 25 distinct monthly series of
economic data for the six states in the
Bank’s. The D6 Factor filters out
idiosyncratic shocks that disproportionately
affect individual states. A “0” value for the
index appears to match trend-like growth for
the national economy.
The FRB Atlanta’s index stands at a level
consistent with growth that is slightly subpar.
KEY MESSAGES:
The Southeast region of the country is
recovering but at a slow pace.
Sources: Federal Reserve Bank of Atlnata; US Department
of Commerce. Updated through September 2012 (surveys)
and 2012 Q3 (GDP).
November 30, 2012
Regional Perspectives: Louisiana Economic Outlook
Commercial Banking 6
-6
-5
-4
-3
-2
-1
0
1
2
3
4
5
6
7
8
9
-7
-6
-5
-4
-3
-2
-1
0
1
2
1999 2000 2001 2002 2003 2004 2005 2006 2007 2008 2009 2010 2011 2012 2013
FRB Atlanta D6 Factor, columns (left)
Louisiana real GDP, line (right)
Initial Jobless Claims
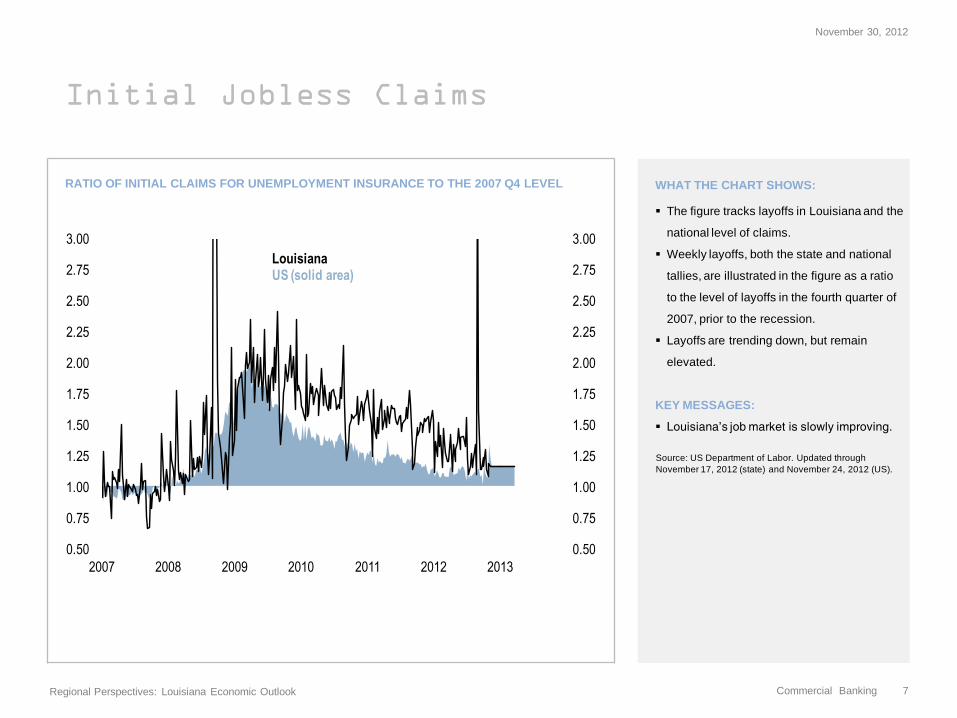
RATIO OF INITIAL CLAIMS FOR UNEMPLOYMENT INSURANCE TO THE 2007 Q4 LEVEL WHAT THE CHART SHOWS:
The figure tracks layoffs in Louisiana and the
national level of claims.
Weekly layoffs, both the state and national
tallies, are illustrated in the figure as a ratio
to the level of layoffs in the fourth quarter of
2007, prior to the recession.
Layoffs are trending down, but remain
elevated.
KEY MESSAGES:
Louisiana’s job market is slowly improving.
Source: US Department of Labor. Updated through
November 17, 2012 (state) and November 24, 2012 (US).
November 30, 2012
Regional Perspectives: Louisiana Economic Outlook
Commercial Banking 7
0.50
0.75
1.00
1.25
1.50
1.75
2.00
2.25
2.50
2.75
3.00
0.50
0.75
1.00
1.25
1.50
1.75
2.00
2.25
2.50
2.75
3.00
2007 2008 2009 2010 2011 2012 2013
LouisianaUS (solid area)

Economic Growth
REAL GDP GROWTH (PERCENT CHANGE FROM FOUR QUARTERS EARLIER) WHAT THE CHART SHOWS:
Real GDP growth in Louisiana (the line in
the figure) is superimposed on top of US
real GDP growth (bars in the figure).
Louisiana’s economy has been recovering
amid the national recession, faster when the
national economy began to recover and
more in line with national growth trends now.
KEY MESSAGES:
Development of the Barnett shale field and
the rebuilding from hurricane damage has
cushioned the state amid a severe national
recession.
Growth is forecast to speed up again this
year and the next.
Source: US Department of Commerce. Updated through
2012 Q3.
November 30, 2012
Regional Perspectives: Louisiana Economic Outlook
Commercial Banking 8
-6
-5
-4
-3
-2
-1
0
1
2
3
4
5
6
7
8
9
-6
-5
-4
-3
-2
-1
0
1
2
3
4
5
6
7
8
9
90 91 92 93 94 95 96 97 98 99 00 01 02 03 04 05 06 07 08 09 10 11 12 13 14 15
LouisianaUS
Economic Output
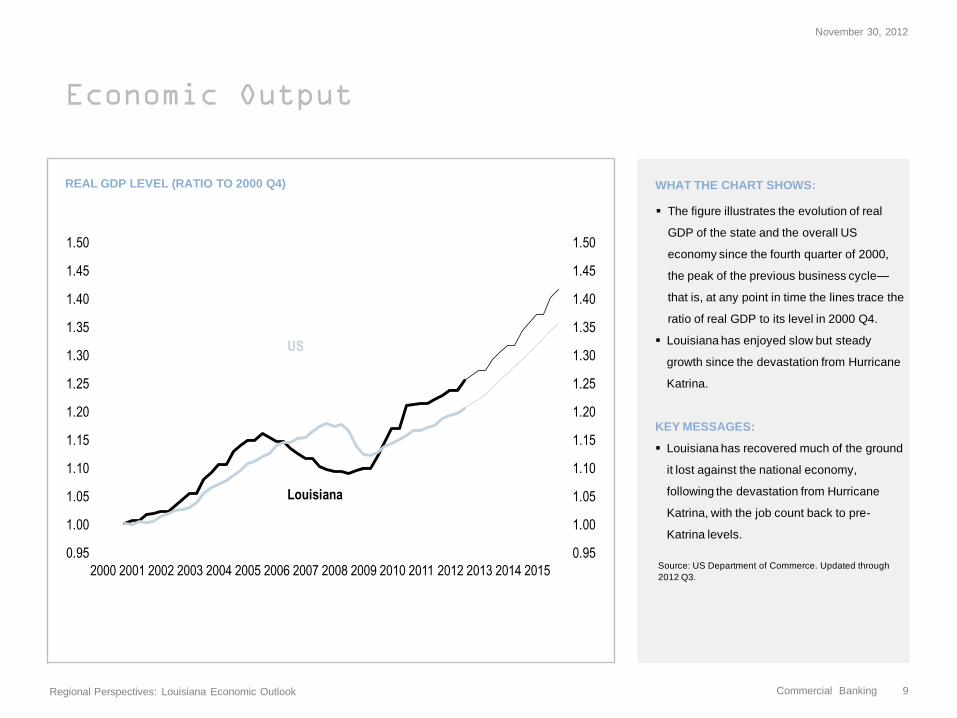
REAL GDP LEVEL (RATIO TO 2000 Q4) WHAT THE CHART SHOWS:
The figure illustrates the evolution of real
GDP of the state and the overall US
economy since the fourth quarter of 2000,
the peak of the previous business cycle—
that is, at any point in time the lines trace the
ratio of real GDP to its level in 2000 Q4.
Louisiana has enjoyed slow but steady
growth since the devastation from Hurricane
Katrina.
KEY MESSAGES:
Louisiana has recovered much of the ground
it lost against the national economy,
following the devastation from Hurricane
Katrina, with the job count back to pre-
Katrina levels.
Source: US Department of Commerce. Updated through
2012 Q3.
November 30, 2012
Regional Perspectives: Louisiana Economic Outlook
Commercial Banking 9
0.95
1.00
1.05
1.10
1.15
1.20
1.25
1.30
1.35
1.40
1.45
1.50
0.95
1.00
1.05
1.10
1.15
1.20
1.25
1.30
1.35
1.40
1.45
1.50
2000 2001 2002 2003 2004 2005 2006 2007 2008 2009 2010 2011 2012 2013 2014 2015
US
Louisiana
Employment Growth
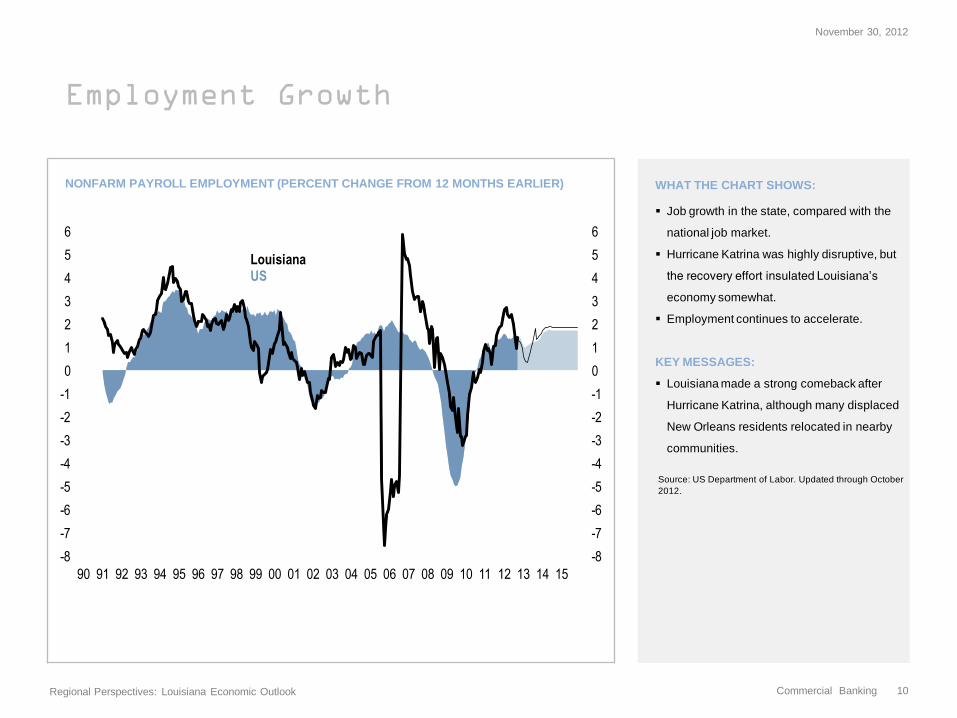
NONFARM PAYROLL EMPLOYMENT (PERCENT CHANGE FROM 12 MONTHS EARLIER) WHAT THE CHART SHOWS:
Job growth in the state, compared with the
national job market.
Hurricane Katrina was highly disruptive, but
the recovery effort insulated Louisiana’s
economy somewhat.
Employment continues to accelerate.
KEY MESSAGES:
Louisiana made a strong comeback after
Hurricane Katrina, although many displaced
New Orleans residents relocated in nearby
communities.
Source: US Department of Labor. Updated through October
2012.
November 30, 2012
Regional Perspectives: Louisiana Economic Outlook
Commercial Banking 10
-8
-7
-6
-5
-4
-3
-2
-1
0
1
2
3
4
5
6
-8
-7
-6
-5
-4
-3
-2
-1
0
1
2
3
4
5
6
90 91 92 93 94 95 96 97 98 99 00 01 02 03 04 05 06 07 08 09 10 11 12 13 14 15
LouisianaUS
Employment
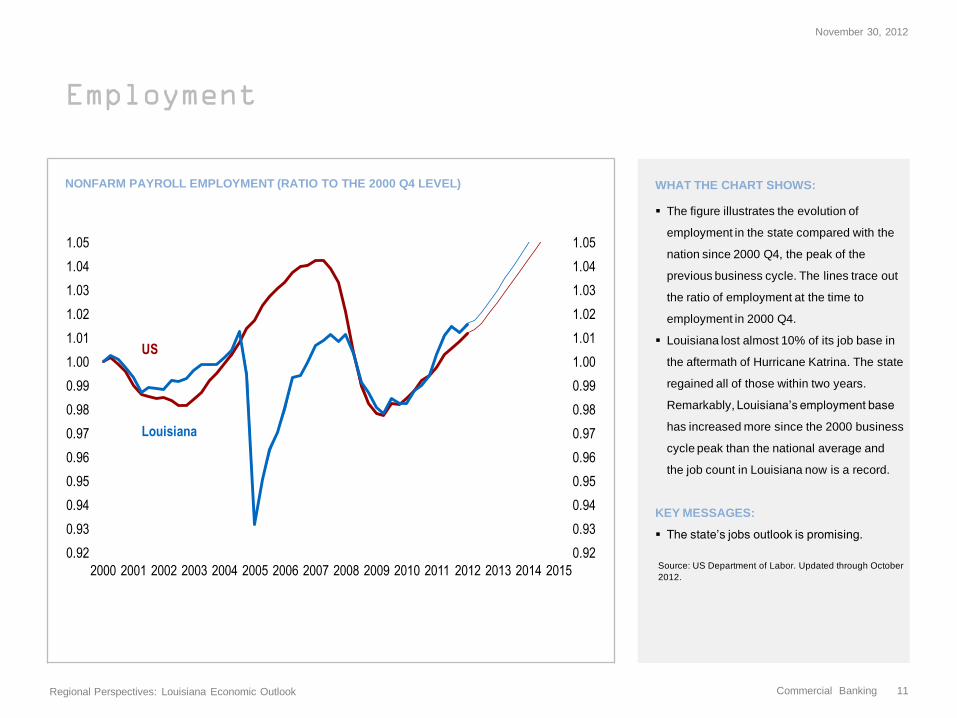
NONFARM PAYROLL EMPLOYMENT (RATIO TO THE 2000 Q4 LEVEL) WHAT THE CHART SHOWS:
The figure illustrates the evolution of
employment in the state compared with the
nation since 2000 Q4, the peak of the
previous business cycle. The lines trace out
the ratio of employment at the time to
employment in 2000 Q4.
Louisiana lost almost 10% of its job base in
the aftermath of Hurricane Katrina. The state
regained all of those within two years.
Remarkably, Louisiana’s employment base
has increased more since the 2000 business
cycle peak than the national average and
the job count in Louisiana now is a record.
KEY MESSAGES:
The state’s jobs outlook is promising.
Source: US Department of Labor. Updated through October
2012.
November 30, 2012
Regional Perspectives: Louisiana Economic Outlook
Commercial Banking 11
0.92
0.93
0.94
0.95
0.96
0.97
0.98
0.99
1.00
1.01
1.02
1.03
1.04
1.05
0.92
0.93
0.94
0.95
0.96
0.97
0.98
0.99
1.00
1.01
1.02
1.03
1.04
1.05
2000 2001 2002 2003 2004 2005 2006 2007 2008 2009 2010 2011 2012 2013 2014 2015
US
Louisiana
Intrastate Employment
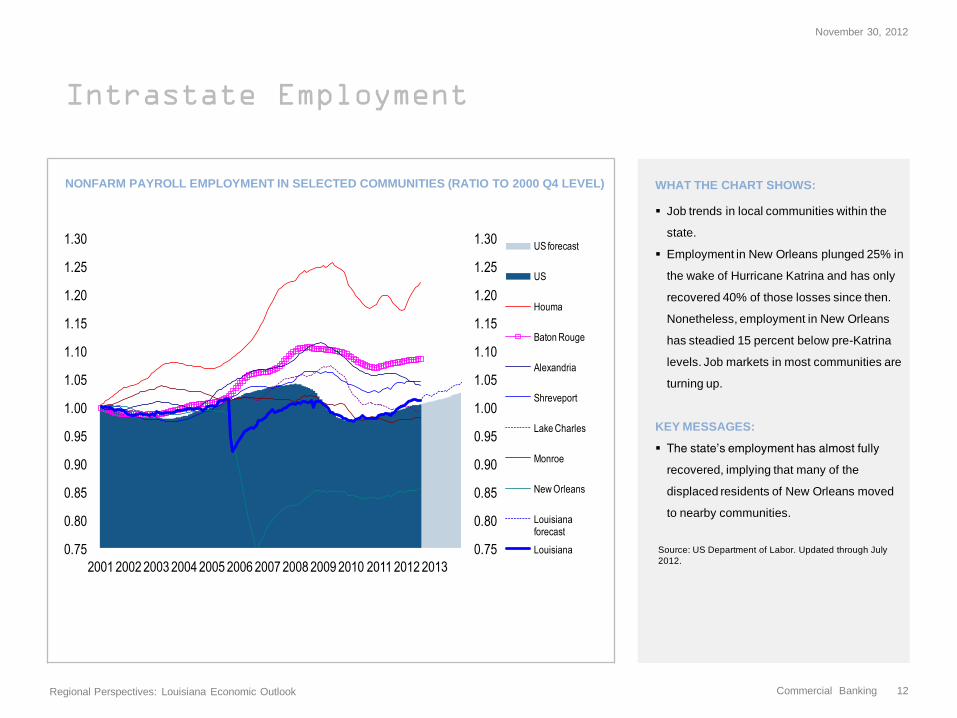
NONFARM PAYROLL EMPLOYMENT IN SELECTED COMMUNITIES (RATIO TO 2000 Q4 LEVEL) WHAT THE CHART SHOWS:
Job trends in local communities within the
state.
Employment in New Orleans plunged 25% in
the wake of Hurricane Katrina and has only
recovered 40% of those losses since then.
Nonetheless, employment in New Orleans
has steadied 15 percent below pre-Katrina
levels. Job markets in most communities are
turning up.
KEY MESSAGES:
The state’s employment has almost fully
recovered, implying that many of the
displaced residents of New Orleans moved
to nearby communities.
Source: US Department of Labor. Updated through July
2012.
November 30, 2012
Regional Perspectives: Louisiana Economic Outlook
Commercial Banking 12
0.75
0.80
0.85
0.90
0.95
1.00
1.05
1.10
1.15
1.20
1.25
1.30
0.75
0.80
0.85
0.90
0.95
1.00
1.05
1.10
1.15
1.20
1.25
1.30
2001 2002 2003 2004 2005 2006 2007 2008 2009 2010 2011 2012 2013
US forecast
US
Houma
Baton Rouge
Alexandria
Shreveport
Lake Charles
Monroe
New Orleans
Louisiana forecast
Louisiana
Unemployment
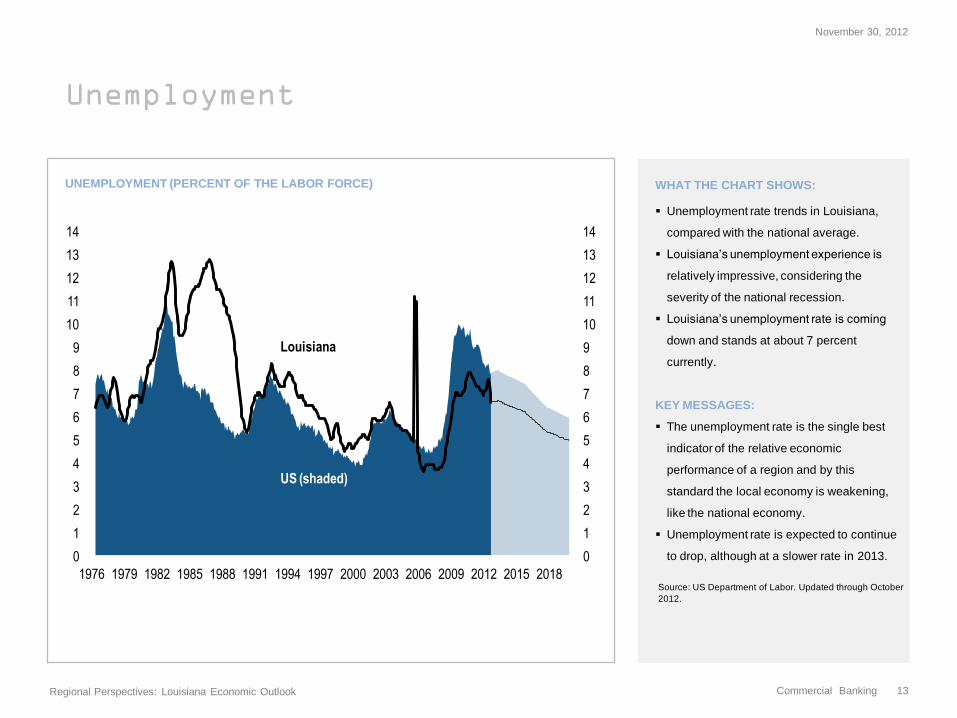
UNEMPLOYMENT (PERCENT OF THE LABOR FORCE) WHAT THE CHART SHOWS:
Unemployment rate trends in Louisiana,
compared with the national average.
Louisiana’s unemployment experience is
relatively impressive, considering the
severity of the national recession.
Louisiana’s unemployment rate is coming
down and stands at about 7 percent
currently.
KEY MESSAGES:
The unemployment rate is the single best
indicator of the relative economic
performance of a region and by this
standard the local economy is weakening,
like the national economy.
Unemployment rate is expected to continue
to drop, although at a slower rate in 2013.
Source: US Department of Labor. Updated through October
2012.
November 30, 2012
Regional Perspectives: Louisiana Economic Outlook
Commercial Banking 13
0
1
2
3
4
5
6
7
8
9
10
11
12
13
14
0
1
2
3
4
5
6
7
8
9
10
11
12
13
14
1976 1979 1982 1985 1988 1991 1994 1997 2000 2003 2006 2009 2012 2015 2018
Louisiana
US (shaded)
Relative House Prices
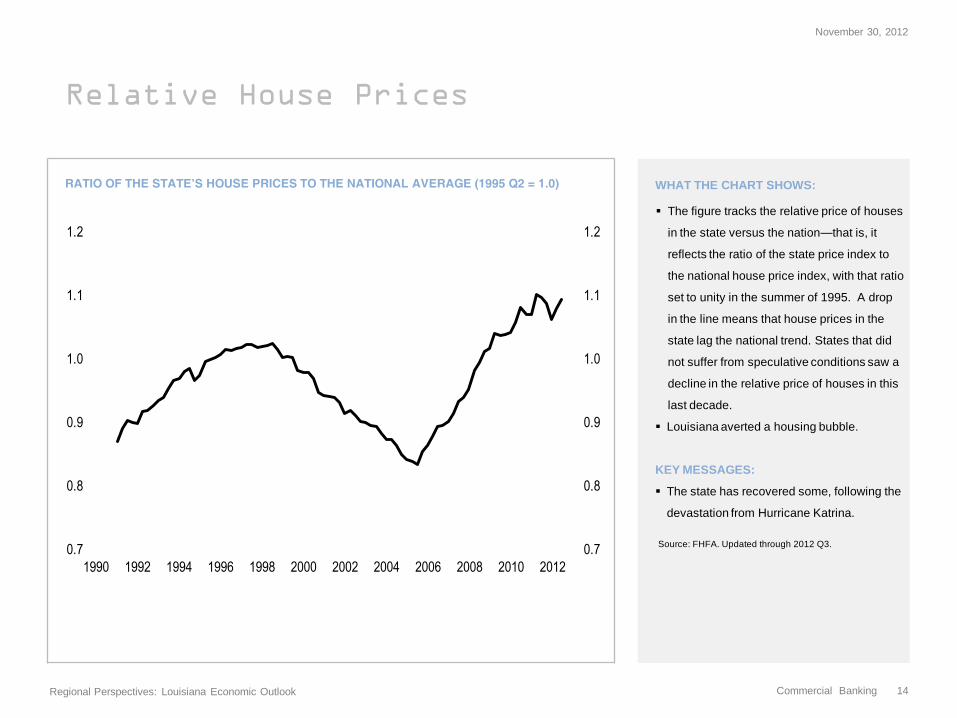
RATIO OF THE STATE’S HOUSE PRICES TO THE NATIONAL AVERAGE (1995 Q2 = 1.0) WHAT THE CHART SHOWS:
The figure tracks the relative price of houses
in the state versus the nation—that is, it
reflects the ratio of the state price index to
the national house price index, with that ratio
set to unity in the summer of 1995. A drop
in the line means that house prices in the
state lag the national trend. States that did
not suffer from speculative conditions saw a
decline in the relative price of houses in this
last decade.
Louisiana averted a housing bubble.
KEY MESSAGES:
The state has recovered some, following the
devastation from Hurricane Katrina.
Source: FHFA. Updated through 2012 Q3.
November 30, 2012
Regional Perspectives: Louisiana Economic Outlook
Commercial Banking 14
0.7
0.8
0.9
1.0
1.1
1.2
0.7
0.8
0.9
1.0
1.1
1.2
1990 1992 1994 1996 1998 2000 2002 2004 2006 2008 2010 2012

Real Estate Markets
HOUSE PRICES IN SELECTED COMMUNITIES (RATIO TO THE 1995 Q2 LEVEL) WHAT THE CHART SHOWS:
The figure tracks the cumulative percentage
deviation in house prices since 1995 in
selected local markets and compares those
with the national average.
Real estate values in most markets have
bucked the national downdraft.
KEY MESSAGE:
Slower activity in the energy industry may
moderate trends in some communities.
Sources: FHFA; Standard & Poor’s. Updated through
2012 Q3.
November 30, 2012
Regional Perspectives: Louisiana Economic Outlook
Commercial Banking 15
1.00
1.25
1.50
1.75
2.00
2.25
1.00
1.25
1.50
1.75
2.00
2.25
1995 1997 1999 2001 2003 2005 2007 2009 2011
US
New Orleans-Metairie-Kenner, LA
Lake Charles, LA
Lafayette, LA
Monroe, LA
Houma-Bayou Cane-Thibodaux, LA
Baton Rogue, LA
Alexandria, LA
Shreveport-Bossier City, LA

New Home Building
HOUSING STARTS (RATIO TO THE JULY 1990 LEVEL) WHAT THE CHART SHOWS:
New home construction in Louisiana,
compared with the US average level of
construction.
New home building in the state has been
quite robust all things considered, and is
only down to half the level of the pre-
recession years.
New home building may be on the mend.
KEY MESSAGES:
The muted cutbacks in new home building is
a testimony to the absence of a real estate
bubble in the state.
Source: Census Department. Updated through October
2012 (US) and September 2012 (state).
November 30, 2012
Regional Perspectives: Louisiana Economic Outlook
Commercial Banking 16
0
1
2
3
4
5
0
1
2
3
4
5
2000 2003 2006 2009 2012 2015
LouisianaUS