Economic Evaluation of an Automated Retinal Image … Myers Building, Gate 14 Barker St, Sydney,...
20
Economic Evaluation of an Automated Retinal Image Analysis in Australian Aboriginal and Torres Strait Islander populations for detection of Diabetic Retinopathy Jeromie Ballreich, MHS, PhD Candidate 2016 ISPOR Annual Meeting
Transcript of Economic Evaluation of an Automated Retinal Image … Myers Building, Gate 14 Barker St, Sydney,...

Economic Evaluation of an Automated Retinal
Image Analysis in Australian Aboriginal and
Torres Strait Islander populations for detection
of Diabetic Retinopathy
Jeromie Ballreich, MHS, PhD Candidate
2016 ISPOR Annual Meeting

© 2014, Johns Hopkins University. All rights reserved.©2016, Johns Hopkins University. All rights reserved.
PartnersContributing Authors: Jeromie Ballreich1, AntheaBurnett,2,3 Arthur Ho,2,3 Luke Arkapaw,2 Andrew Kleinert,2 Kevin D. Frick4
1Johns Hopkins Bloomberg School of Public Health, Baltimore, Maryland, USA2Brien Holden Vision Institute and Vision CRC, Public Health, Level 4 North Wing, Rupert Myers
Building, Gate 14 Barker St, Sydney, NSW, Australia3School of Optometry & Vision Science, Rupert Myers Building, Gate 14 Barker St, UNSW, NSW, Australia4Johns Hopkins Carey Business School, Baltimore, Maryland, USA

© 2014, Johns Hopkins University. All rights reserved.
© 2014, Johns Hopkins University. All rights reserved.© 2014, Johns Hopkins University. All rights reserved.©2015, Johns Hopkins University. All rights reserved.©2016, Johns Hopkins University. All rights reserved.©2016, Johns Hopkins University. All rights reserved.
Public Health Problem (1/2)
• Indigenous Australians are 3x more likely to have
diabetes1
• Only 20% of Indigenous Australians receive annual
retinal examination2
• Indigenous Australians have 6x rate of blindness
compared to mainstream Australian population3

© 2014, Johns Hopkins University. All rights reserved.
© 2014, Johns Hopkins University. All rights reserved.© 2014, Johns Hopkins University. All rights reserved.©2015, Johns Hopkins University. All rights reserved.©2016, Johns Hopkins University. All rights reserved.©2016, Johns Hopkins University. All rights reserved.Source: Australian Bureau of Statistics, 2007

© 2014, Johns Hopkins University. All rights reserved.
© 2014, Johns Hopkins University. All rights reserved.© 2014, Johns Hopkins University. All rights reserved.©2015, Johns Hopkins University. All rights reserved.©2016, Johns Hopkins University. All rights reserved.©2016, Johns Hopkins University. All rights reserved.
Automated Retinal Image Analysis (ARIA)
• Uses algorithm to automatically
assess presence of Diabetic
Retinopathy (DR)
• Can be operated by Aboriginal
Health Worker (AHW)
• Cheaper than traditional cameras
Cotton wool spots (red andpurple), hemorrhages (yellow andgreen). Source: Abramoff

©2015, Johns Hopkins University. All rights reserved.©2015, Johns Hopkins University. All rights reserved.©2016, Johns Hopkins University. All rights reserved.©2016, Johns Hopkins University. All rights reserved.
Evaluate the net economic benefit of ARIA
compared to standard screening methods
for Indigenous Australians under varying
technical assumptions?
• Gradeability
• Sensitivity
• Specificity
© 2014, Johns Hopkins University. All rights reserved.
© 2014, Johns Hopkins University. All rights reserved.© 2014, Johns Hopkins University. All rights reserved.©2015, Johns Hopkins University. All rights reserved.©2016, Johns Hopkins University. All rights reserved.©2016, Johns Hopkins University. All rights reserved.
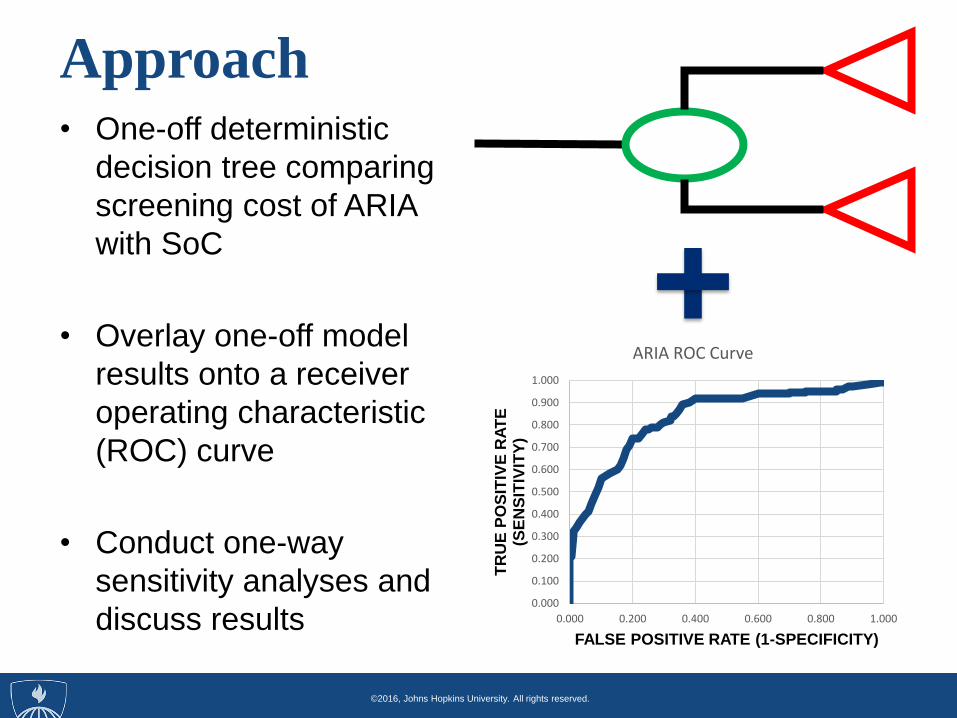
Approach• One-off deterministic
decision tree comparing
screening cost of ARIA
with SoC
• Overlay one-off model
results onto a receiver
operating characteristic
(ROC) curve
• Conduct one-way
sensitivity analyses and
discuss results0.000
0.100
0.200
0.300
0.400
0.500
0.600
0.700
0.800
0.900
1.000
0.000 0.200 0.400 0.600 0.800 1.000
TR
UE
PO
SIT
IVE
RA
TE
(S
EN
SIT
IVIT
Y)
FALSE POSITIVE RATE (1-SPECIFICITY)
ARIA ROC Curve

© 2014, Johns Hopkins University. All rights reserved.
© 2014, Johns Hopkins University. All rights reserved.© 2014, Johns Hopkins University. All rights reserved.©2015, Johns Hopkins University. All rights reserved.©2016, Johns Hopkins University. All rights reserved.©2016, Johns Hopkins University. All rights reserved.
Model Assumptions (1/2)
• Australian Department of Health perspective
• Single-cycle screening
• 100% Coverage (Indigenous Australians aged 40+
years with self-reported diabetes, n=45,197)
• Each Aboriginal health center has camera (189
cameras)
• SoC Screening pathway was adopted from Cost to
Close the Gap Report5

© 2014, Johns Hopkins University. All rights reserved.
© 2014, Johns Hopkins University. All rights reserved.© 2014, Johns Hopkins University. All rights reserved.©2015, Johns Hopkins University. All rights reserved.©2016, Johns Hopkins University. All rights reserved.©2016, Johns Hopkins University. All rights reserved.
Model Assumptions (2/2)KEY PROBABILITIES VALUE
Prevalence of DR .297
Performance of ARIA .9
Sensitivity of ARIA .8
Specificity of ARIA .7
Ophthalmology treatment .344
Sensitivity of Optometrist .898
Specificity of Optometrist .951
KEY COSTS (per screened patient) VALUE ($ AUS)
ARIA Camera Cost* $2,000
ARIA Operating cost $76.20
Transport Cost (Opt/GP) $19.15
GP Screen $71
Opt Consult (includes VOS) $325
Treatment Cost $761.18

© 2014, Johns Hopkins University. All rights reserved.
© 2014, Johns Hopkins University. All rights reserved.© 2014, Johns Hopkins University. All rights reserved.©2015, Johns Hopkins University. All rights reserved.©2016, Johns Hopkins University. All rights reserved.©2016, Johns Hopkins University. All rights reserved.
ARIA
SCREENGRADEABLE?
UNGRADED
SoC
SCREEN
Ophth Con
(TP, FP)
(TN and
FN)
GRADED
Normal
Fundus
Abnormal
Fundus
ARIA Pathway

© 2014, Johns Hopkins University. All rights reserved.
© 2014, Johns Hopkins University. All rights reserved.© 2014, Johns Hopkins University. All rights reserved.©2015, Johns Hopkins University. All rights reserved.©2016, Johns Hopkins University. All rights reserved.©2016, Johns Hopkins University. All rights reserved.
Decision Tree (ARIA branch)

© 2014, Johns Hopkins University. All rights reserved.
© 2014, Johns Hopkins University. All rights reserved.© 2014, Johns Hopkins University. All rights reserved.©2015, Johns Hopkins University. All rights reserved.©2016, Johns Hopkins University. All rights reserved.©2016, Johns Hopkins University. All rights reserved.
Decision Tree (SoC branch)

© 2014, Johns Hopkins University. All rights reserved.
© 2014, Johns Hopkins University. All rights reserved.© 2014, Johns Hopkins University. All rights reserved.©2015, Johns Hopkins University. All rights reserved.©2016, Johns Hopkins University. All rights reserved.©2016, Johns Hopkins University. All rights reserved.
One-off Model Results (1/2)
• ARIA screening cost: $354.35
• SoC screening cost: $586.10
• Net Difference: $232.15
• 1 point increase in Sensitivity (ARIA): +$1.91
• 1 point increase in Specificity (ARIA): -$1.50
• 1 point increase in Performance (ARIA): -$3.00
• ARIA cost $16 million, SoC cost $26.5 million

© 2014, Johns Hopkins University. All rights reserved.
© 2014, Johns Hopkins University. All rights reserved.© 2014, Johns Hopkins University. All rights reserved.©2015, Johns Hopkins University. All rights reserved.©2016, Johns Hopkins University. All rights reserved.©2016, Johns Hopkins University. All rights reserved.
One-off Model Results (1/2)
• ARIA detected 81.1% of True DR
• SoC detected 89.9% of True DR
• 1,176 missed cases
• $8,929 per missed case

© 2014, Johns Hopkins University. All rights reserved.
© 2014, Johns Hopkins University. All rights reserved.© 2014, Johns Hopkins University. All rights reserved.©2015, Johns Hopkins University. All rights reserved.©2016, Johns Hopkins University. All rights reserved.©2016, Johns Hopkins University. All rights reserved.
One-off Model Tornado Diagram
Model is most sensitive to Optometrist Consultation cost

© 2014, Johns Hopkins University. All rights reserved.
© 2014, Johns Hopkins University. All rights reserved.© 2014, Johns Hopkins University. All rights reserved.©2015, Johns Hopkins University. All rights reserved.©2016, Johns Hopkins University. All rights reserved.©2016, Johns Hopkins University. All rights reserved.
Benefits of ROC Curve
• ROC curve reflects co-varying combinations
of sensitivity and specificity
• Better reflects modifications to the go-no-go
threshold for DR
• Provides guidance to developers on ways to
“tune” diagnostics to achieve best outcomes

© 2014, Johns Hopkins University. All rights reserved.
© 2014, Johns Hopkins University. All rights reserved.© 2014, Johns Hopkins University. All rights reserved.©2015, Johns Hopkins University. All rights reserved.©2016, Johns Hopkins University. All rights reserved.©2016, Johns Hopkins University. All rights reserved.
ImplicationsARIA
• ARIA is less effective but cost-saving
• Low-cost will allow for greater
deployment
• Greater coverage improves population
health
Project
• Provides an analytic framework for
evaluating diagnostic devices

© 2014, Johns Hopkins University. All rights reserved.©2016, Johns Hopkins University. All rights reserved.
References1. Australian Bureau of Statistics: Australian Aboriginal and Torres Strait Islander Health
Survey: Biomedical Results. In.; 2014.
2. Xie J, Arnold AL, Keeffe J, Goujon N, Dunn RA, Fox S, Taylor HR: Prevalence of
self‐reported diabetes and diabetic retinopathy in indigenous Australians: the National
Indigenous Eye Health Survey. Clin Experiment Ophthalmol 2011, 39(6):487-493.
3. Taylor HR, Xie J, Fox S, Dunn R, Arnold AL, Keeffe JE: The prevalence and causes of
vision loss in Indigenous Australians: the National Indigenous Eye Health Survey. Med J
Aust 2010, 192(6):312-318.
4. Abràmoff, M. D., Niemeijer, M., Suttorp-Schulten, M. S., Viergever, M. A., Russell, S. R.,
& Van Ginneken, B. (2008). Evaluation of a system for automatic detection of diabetic
retinopathy from color fundus photographs in a large population of patients with
diabetes. Diabetes care, 31(2), 193-198.
5. Hsueh Y-S, Brando A, Dunt D, Anjou M, Taylor H: The Cost to Close the Gap for Vision.
In.: Indigenous Eye Health Unit; 2011.

©2015, Johns Hopkins University. All rights reserved.©2015, Johns Hopkins University. All rights reserved.©2016, Johns Hopkins University. All rights reserved.©2016, Johns Hopkins University. All rights reserved.
Contact: Jeromie Ballreich, MHS, PhD
Candidate
Questions?
Thank you!


![LocalandSystemicCardiovascularEffectsfromMonochromatic ...downloads.hindawi.com/journals/ecam/2012/583016.pdf · 3School of Nursing and Management in ... [22]. Phototherapy has been](https://static.fdocuments.us/doc/165x107/5b8180f97f8b9ae47b8c72cd/localandsystemiccardiovasculareffectsfrommonochromatic-3school-of-nursing.jpg)