Economic Developments in Portuguese-speaking African ... · 5 feword to the English versionor The...
96
Transcript of Economic Developments in Portuguese-speaking African ... · 5 feword to the English versionor The...

BANCO DE PORTUGAL E U R O S Y S T E M
ECONOMICDEVELOPMENTS IN PORTUGUESE-SPEAKING AFRICAN COUNTRIES AND TIMOR-LESTE
2013 2014|


ECONOMIC DEvElOpMENts IN pOrtuguEsE- spEakINg afrICaN COuNtrIEs aND tIMOr-lEstE2013|2014
Lisbon, 2014 • www.bportugal.pt

ECONOMIC DEvELOpMENts IN pORtUGUEsE-spEAKING AFRICAN COUNtRIEs AND tIMOR-LEstE • Banco de portugal Av. Almi-
rante Reis, 71 | 1150-012 Lisboa • www.bportugal.pt • Edition International Relations Department • Design, printing and finishing
Adiministrative services Department | Editing and Publishing Unit • IssN 2182-9837 (online)

Contents
INtErNatIONal ENvIrONMENt
Recent developments and outlook | 11
ECONOMIC DEvElOpMENts IN pOrtuguEsE-spEakINg afrICaN COuNtrIEs aND tIMOr-lEstE
1. Angola | 17
2. Cabo verde | 29
3. Guinea-Bissau | 41
4. Mozambique | 51
5. são tomé and príncipe | 63
6. timor-Leste | 75
pOrtugal’s ECONOMIC aND fINaNCIal rElatIONsHIps WItH pOrtuguEsE-spEakINg afrICaN COuNtrIEs aND tIMOr-lEstE
Overview | 87


5
foreword to the English versionThe publication Economic Developments in Portuguese-speaking African Countries and Timor-Leste 2013/2014 is a condensed version of the portuguese Evolução das Economias dos PALOP e de Timor-Leste 2013/2014.
This English version includes the text on the international environment, an overview of the
current economic conditions in portuguese-speaking African Countries and timor-Leste and of these countries’ financial relations with Portugal, and the extensive statistical annexes of the Portuguese original.
October 2014


7
forewordAs in previous editions, the publication Economic Developments in Portuguese-speaking African Countries and Timor-Leste aims to contribute to a better knowledge of current economic condi-tions in those countries, focusing both on key macroeconomic data and economic and finan-cial relations with Portugal.
The overview of the current economic condi-tions in portuguese-speaking African Countries and Timor-Leste and of these countries’ finan-cial relations with Portugal were prepared on the basis of information received up to the end
of July 2014. In some cases, this information corresponds to preliminary data or estimates which may be revised.
We thank the entities contacted for their kind cooperation, in particular the Central Banks of Angola, Cabo verde, Mozambique, são tomé and Príncipe and Timor-Leste, and the natio-nal branch of the Central Bank of West African States in Guinea-Bissau. Their assistance was crucial in obtaining the information needed to prepare this report.
september 2014


INtErNatIONal ENvIrONMENt


11
recent developments and outlook*
The global economy has been recovering in 2014 – in an uneven way across regions, as expected, but at a slower pace than initially foreseen – while there are still considerable risks that the macroeconomic environment may deteriorate. The most recent data (see Chart 1) seem to confirm that certain cross--cutting and ongoing trends are expected to persist and have a net growth-accelerating impact in the short to medium term. By con-trast, this impact is due to have been partially mitigated by a number of negative tempo-rary factors (at a regional level but with global repercussions) in the first months of 2014.
In turn, inflationary pressures have mostly remained subdued (notably, but not exclu-sively, in the better known cases of certain advanced economies – see Chart 2) and the external positions of the world’s main regions seem to be stabilising in 2014, broadly keeping the relative pattern of global imbalances seen last year (which reflected a number of changes from 2012 – see Chart 3).
Among the above-mentioned cross-cutting trends that favour a short-term increase in
growth, a few stand out, most notably the maintenance of an accommodative monetary policy stance by the main advanced econo-mies and developments in public finances and global financial conditions. Advanced econo-mies as a whole have moved to a slower pace of fiscal consolidation than up to 2012, while a number of the main emerging economies have adopted a more expansionary fiscal stance (see Chart 4). Turning to financial conditions, the trend of decreasing bond market yields in advanced economies has continued (also as regards sovereign debt markets), together with a broadly based moderation in financial volatility and a recovery in capital flows towards emerging and developing economies.
Despite the favourable effects induced by these trends, the acceleration in growth expected for 2014 has turned out to be relatively modest. However, the scenario of a recovery in advanced economies as a whole seems to be confirmed (although more uneven and, in most cases, less pronounced than initially expected), as well as that of a slight slowdown in the majority of the
-1 0 1 2 3 4 5 6 7
Advanced economies
United States
Euro area
Japan
Emerging and developing economies
Emerging and developing Asia
Latin America and the Caribbean
Sub-Saharan Africa
2014 2013 2012
Chart 1 • Real GDP annual percent change; selected economies
Source: IMF, World Economic Outlook Database, August 2014.
* This text was prepared on the basis of information available up to 12 September 2014, and, as such, does not yet include the annually updated macroeconomic projections typically released by major international financial institutions in the weeks following that date. For this reason, charts presented here are supported by figures that may have been revised under that regular update (more specifically figures for 2014, which correspond to the projections released by the IMF, in its World Economic Outlook database, as at the date mentioned above). However, the analysis presented in the text takes into account various partial data and leading indicators through which it was possible to obtain a more up-to-date and accurate overview of the recent macroeconomic environment.
International environment

Banco de Portugal • Economic Developments in Portuguese-speaking African Countries and Timor-Leste • 2013 | 2014 12
main emerging and developing economies. As mentioned above, this slightly less robust per-formance is partially associated with a variety of unfavourable factors that were mostly felt at the start of 2014 – from severe weather con-ditions and a stronger decrease in inventories in the United States to a weakening real estate market in China.
The importance of these factors may be only temporary, i.e. they may not significantly under-mine the previous prospects of sustained reco-very in 2015. Nevertheless, two other adverse risks have recently joined the unfavourable ones already identified, thereby increasing the probability of a negative bias in the eco-nomic environment. The risks incorporated in previous analyses included inter alia potential disturbances associated with a withdrawal of monetary stimulus in the United States, a potential worsening of the disinflation process in the euro area and a possible deterioration in the conditions prevailing in several segments of the Chinese financial market. The two new risks are a worsening of geopolitical tensions, particularly in the Near and Middle East and in Ukraine, (which may potentially cause global disturbances through various channels, nota-bly the commodity markets) and an increased likelihood that the exceptionally benign condi-tions prevailing in global capital markets may lead to financial bubbles.
As regards the macroeconomic environment specific to major global economies or groups of economies, the United States continues to show signs of a growth acceleration, after the moderation in 2013 – which unexpecte-dly extended into early 2014, mostly owing to the above-mentioned factors (exceptionally adverse weather conditions and sharper than expected changes in inventories). This accele-ration is expected to continue to be reflected in a labour market recovery and is supported by the persistence of favourable conditions: from an accommodative monetary policy stan-ce (with a gradual withdrawal of standard and non-standard stimulus measures) to a reduc-tion in the pace of fiscal consolidation and favourable developments in several financial market segments, including the real estate market.
The euro area as a whole is expected to return to positive growth rates in 2014, although une-venly across countries (including as regards its positive impact on unemployment). However, this recovery seems to be less pronounced than initially anticipated, in part owing to wea-ker than expected domestic demand in some of the main euro area countries (while their external positions continue to post a sur-plus and/or tend mostly to improve). In turn, inflation persistently below the medium-term objectives has given the ECB leeway for a more accommodative monetary policy stance, thus
Chart 2 • Inflation
End-of-period percent changes
in the CpI; selected
economies
Source: IMF, World Economic Outlook
Database, August 2014.
-2 0 2 4 6 8 10 12
Advanced economies
United States
Euro area
Japan
Emerging and developing economies
Emerging and developing Asia
Latin America and the Caribbean
Sub-Saharan Africa
2014 2013 2012

13
helping maintain growth-friendly conditions, reflected in particular in a trend decline in inte-rest rates on both sovereign debt and corpo-rate loans.
With regard to Japan, the macroeconomic scena-rio already outlined for 2014 and 2015 remains valid, i.e. sustained (albeit modest) growth recovery and an acceleration in the inflation pace to levels that are low by international standards, but considerably above the levels of near deflation typical of the Japanese eco-nomy over much of the past two decades. The impact of last April’s hike in the consumption tax rate was also confirmed – an impact that is expected to be only temporary and offset by other factors favourable to a recovery in priva-te investment. In turn, the extent of fiscal con-solidation in the Japanese economy – mainly resulting from this measure – is expected to be the most pronounced of the main advanced economies both in terms of deficit and debt. Among these economies, Japan nevertheless remains in the worst position as regards both these indicators (although the Japanese State’s funding needs continue to be mostly met by domestic savings).
Emerging Asia as a whole is still the major dri-ver of global economic growth, as the slowdown anticipated for 2014 and 2015 is not expec-ted to be significant. Indeed, its main national economies are projected to move in different
directions, with the recovery expected to par-ticularly intensify in India. Despite this trend, inflationary pressures in the Indian economy seem to be slowing down, while remaining subdued in most countries in the region. The latter continues to be characterised by a posi-tive external position – with a tendency to improve further, given the expected increase in demand by advanced economies. This effect is supposed to be particularly beneficial to Chi-na, which experienced a lower than projected pace of growth at the start of 2014, leading the authorities to introduce fiscal and monetary sti-mulus measures, as the Chinese economy had room to accommodate them. In turn, develop-ments in this economy continue to be largely conditioned by its gradual transition to a pro-duction structure geared more towards priva-te consumption and less towards investment and external demand.
turning to Latin America and the Caribbean, the slowdown anticipated for 2014 was the most marked of all the major global economic regions, with the exception of the Commonwealth of Independent States (especially Russia, which was particularly affected by tensions in Ukraine). Only two of the main Latin-American economies are expected not to be affected by the global trend slowdown (Mexico and Colombia), but not the largest of them (Brazil) and even less so two other economies which may even experience recession (Argentina and venezuela) – against a
-4 -3 -2 -1 0 1 2 3 4
Advanced economies
United States
Euro area
Japan
Emerging and developing economies
Emerging and developing Asia
Latin America and the Caribbean
Sub-Saharan Africa
2014 2013 2012
Chart 3 • External current account percentage of gDp; selected economies
Source: IMF, World Economic Outlook Database, August 2014.
International environment

Banco de Portugal • Economic Developments in Portuguese-speaking African Countries and Timor-Leste • 2013 | 2014 14
background characterised, to differing degrees, by a slowdown in foreign demand and dete-riorating terms of trade, but also by various phenomena with an unfavourable impact on domestic demand. However, the external posi-tion is not expected to deteriorate significan-tly, and inflationary pressures, already fought since 2013 in some of the main countries in this region through a tightening of monetary policy (which indeed favoured a recovery in foreign capital inflows), are also not expected to intensify.
As regards Sub-Saharan Africa, the outlook indi-cates sustained high regional growth, although with considerable differences across countries. In effect, the pace of growth seems to tend to accelerate mostly in oil-producing countries (virtually all of them), but also in several lower--income countries, while many of the middle--income countries are facing greater relative difficulties (specifically South Africa, most affec-ted by constraints in infrastructures and labour relations). The expansion in Sub-Saharan eco-nomies continues to benefit from favourable conditions in terms of foreign demand, but has been mostly supported by buoyant domestic consumption and investment (which have also contributed, particularly public investment, to additional pressure on the fiscal side in some of these countries). In addition, access to inter-national markets has expanded in several Sub--Saharan countries, while some of them have
also revised their national accounts. Overall, the latter resulted in a landscape of economies that are larger and more diversified than pre-viously thought, particularly Nigeria (which is now considered the continent’s main economy, overtaking South Africa).
Chart 4 • Fiscal balance
percentage of gDp; selected
economies
Source: IMF, World Economic Outlook
Database, August 2014.
-10 -9 -8 -7 -6 -5 -4 -3 -2 -1 0
Advanced economies
United States
Euro area
Japan
Emerging and developing economies
Emerging and developing Asia
Latin America and the Caribbean
Sub-Saharan Africa
2014 2013 2012

ECONOMIC DEvElOpMENts IN pOrtuguEsE- spEakINg afrICaN COuNtrIEs aND tIMOr-lEstE1. Angola
2. Cabo verde
3. Guinea-Bissau
4. Mozambique
5. são tomé and príncipe
6. timor-Leste


1. aNgOlaArea: 1,246,700 Km2
Capital city: Luanda
Population: 21.6 milion (2013; source: UN)
Currency: Kwanza
The ongoing recovery dynamics of the Angolan economy continued to prevail in 2013 and the early months of 2014, following the adjustment process launched in 2009 to absorb the impact of the international financial crisis. Such dynamics were reflected simultaneously in an acceleration of economic growth and a downturn in inflation to historical lows. The unfavourable oil sector developments and the fiscal stimulus focusing on investment expenditure have determined, however, a significant decline in the budget and external surpluses (that have been nonetheless preserved).

Banco de Portugal • Economic Developments in Portuguese-speaking African Countries and Timor-Leste • 2013 | 2014 18
1.1. Angola overviewAccording to the best, partly preliminary, estima-tes available for 2013 and the early months of 2014, the Angolan economy maintained the reco-very dynamics that have mainly predominated since 2010, following the IMF-supported adjust-ment programme then adopted, in order to overcome the impact caused by the international financial crisis. Such dynamics were particularly visible in the estimated acceleration of economic growth (with the performance of non-oil activities again exceeding the oil sector’s) and in the sustai-ned slowdown of the inflationary pace (that had previously suffered, in particular, from foreign--exchange depreciation within the scope of the mentioned adjustment effort) – see Table 1.
Notwithstanding the extension of positive trends as shown by such crucial indicators, some signs of stress in the macroeconomic environment were also visible, particularly clear with res-pect to external accounts and public finances. In effect, there was a considerable decline in both cases in the substantial “twin surpluses” of previous years as regards the external cur-rent account and the overall budget balance (see Table 1), due to the combination of two main factors: the planned fiscal stimulus imple-mentation (chiefly translated into intensified investment spending, started in 2012) and the marginally unfavourable developments of oil activities.
The latter continue to be critically relevant in the Angolan economy (approximately 44 per
cent of GDp, 73 per cent of public revenue and 97 per cent of merchandise exports, according to most recent data) and therefore develop-ments in this area always have significant pass through. During the period under review, the sector has been affected by negative volu-me and price effects (penalising exports, and determining more than 2/3 of the decline in the external current account surplus in 2013). Adding to these effects, other circumstances also had an impact, such as the fact that extrac-tion is being moved to new areas (where the income share for the Angolan State is initially smaller, in order to offset high investments made by oil companies) – as a whole, all the-se factors led public revenue to decline from 37.9 per cent of GDp in 2012 to an estimate close to 30.6 per cent in 2013.
It should be highlighted, however, that both the external and the fiscal positions remain comfortable, while sundry reforms continue to be implemented by the Angolan authori-ties, who expect to gain benefits from them over time, in terms of economic diversification, efficiency and equity. This was the case of ini-tiatives during the period under review, such as the new foreign exchange framework of the oil sector, the reform of non-oil taxation and the operationalisation of the Angolan Sovereign Wealth Fund – broadly in line with the larger efforts to reduce structural constraints in fields such as infrastructures, human resources, and the business environment.
Table 1 • Main economic indicators2010 2011 2012 2013 2014
Est. Est. Est. Proj. Est. Proj.
Real GDP (annual % change) 3.4 3.9 5.2 7.1 6.8 3.9
Inflation (end-of-period % change) 15.3 11.4 9.0 9.0 7.7 8.0
Broad money (annual % change) 7.1 34.0 6.0 49.4 14.3 22.5
Current account (% of GDp) 9.1 12.6 12.2 4.2 4.9 2.2
Overall fiscal balance (% of GDP) 5.3 10.2 6.7 -3.8 0.3 -4.9
External public debt (% of GDP) 21.6 20.2 19.9 20.4 22.7 22.7
Sources: Banco Nacional de Angola, Ministry of Finance (Angola) and International Monetary Fund.

19
Table 2 • Main economic indicators
2009 2010 2011 2012 2013 2014
Est. Est. Est. Est. Proj. Est. Proj. Est.
Output and prices
Nominal GDp AOK Billions 5,989 7,579 9,780 10,830 11,951 11,745 12,767
EUR billions 54.1 62.1 74.9 88.3 91.6
UsD billions 75.2 82.4 104.2 113.5 124.1 123.0 130.3
Real GDp Annual % change 2.4 3.4 3.9 5.2 7.1 6.8 3.9
Oil sector Annual % change -5.1 -3.0 -5.4 4.5 6.6 -1.1 -3.5
Other sectors Annual % change 8.1 7.6 9.5 5.5 7.3 10.8 7.3
Inflation (CPI-Luanda) E-o-p % change 14.0 15.3 11.4 9.0 9.0 7.7 8.0 7.0 May
Average % change 13.7 14.5 13.5 10.3 8.8 8.1 May
Public finances
total revenue % of GDp 34.6 43.5 48.8 46.7 38.2 41.9 37.2
Oil revenue % of GDp 24.2 33.0 39.0 37.9 27.5 30.6 26.0
Total expenditure(a) % of GDp 44.2 38.2 38.6 39.9 42.0 41.5 42.1
Current expenditure % of GDp 31.7 28.5 29.9 29.4 28.0 29.3 28.8
Capital expenditure % of GDp 12.4 9.7 8.6 10.6 14.1 12.2 13.3
Overall balance (commitment base) % of GDp -9.6 5.3 10.2 6.7 -3.8 0.3 -4.9
Overall balance (cash basis) % of GDp -8.6 4.3 11.8 9.4 -3.8 0.2 -4.9
Money and credit
Net foreign assets Annual % change -23.8 50.4 70.3 9.4 55.0 -1.5 9.8 -7.7 Apr.
Credit to the economy Annual % change 55.4 25.8 28.5 23.7 8.0 9.9 7.8 15.1 Apr.
Broad money (M3) Annual % change 21.5 7.1 34.0 6.0 49.4 14.3 22.5 28.4 Apr.
Interest rates
Credit in national currency(b) (180 d) Annual rate 15.6 19.0 18.1 15.3 15.1 17.3 May
Deposits in national currency (180 d) Annual rate 12.6 10.0 6.7 4.7 3.9 4.5 May
Deposits in foreign currency (180 d) Annual rate 4.9 7.2 2.7 2.3 2.2 2.5 May
Central bank bills (63 d) Annual rate 21.4 10.0 7.2 4.1 4.0
Treasury bills (182 d) Annual rate 11.6 4.8 3.7 4.6 3.8 Jun.
Treasury bonds(c) (3 years) Annual rate 5.5 7.0 7.0 7.3 7.3 7.8 Jun.
Balance of payments
Exports (current USD) Annual % change -36.1 23.9 33.0 5.6 -9.8 -0.2 0.7
Imports (current UsD) Annual % change 8.0 -26.4 21.4 17.2 3.3 6.4 12.3
trade balance % of GDp 24.1 41.2 45.2 41.7 31.9 37.2 33.1
Current account % of GDp -10.1 9.1 12.6 12.2 4.2 4.9 2.2
Foreign reserves (gross) UsD billions 13.2 19.4 28.4 33.0 34.4 33.1 33.9 32.4 Apr.
External public debt
Total external public debt EUR billions 10.9 13.4 15.1 17.6 20.8
UsD billions 15.1 17.8 21.0 22.6 25.3 28.0 29.6
% of GDp 20.1 21.6 20.2 19.9 20.4 22.7 22.7
Exchange rates
Bilateral rate EUR/AOK Average rate 110.7 122.0 130.5 122.6 128.2 134.3 May
Bilateral rate UsD/AOK Average rate 79.6 92.0 93.9 95.4 95.5 97.7 May
Nominal EERI [appreciation: +](d) Annual % change -5.8 -13.0 -4.8 -1.5 -2.4 -1.8 May
Real EERI [appreciation: +](d) Annual % change 7.7 -2.7 3.7 6.1 4.3 3.0 May
Sources: Banco Nacional de Angola, Ministry of Finance (Angola) and Banco de Portugal calculations.Notes: (a) Includes, for all years shown, current and capital expenditure incurred by state-owned enterprises (mainly Sonangol) and now included in the budget (quasi-fiscal operations); (b) Credit granted to enterprises. (c) Bonds issued in AOK but indexed to the USD/AOK exchange rate. (d) Effective exchange rate index (EERI), calculated on the basis of exchange rates applied to the currencies of the four major trading partners over the period 2005/2009.
angola
Banco de Portugal • Economic Developments in Portuguese-speaking African Countries and Timor-Leste • 2013 | 2014 20
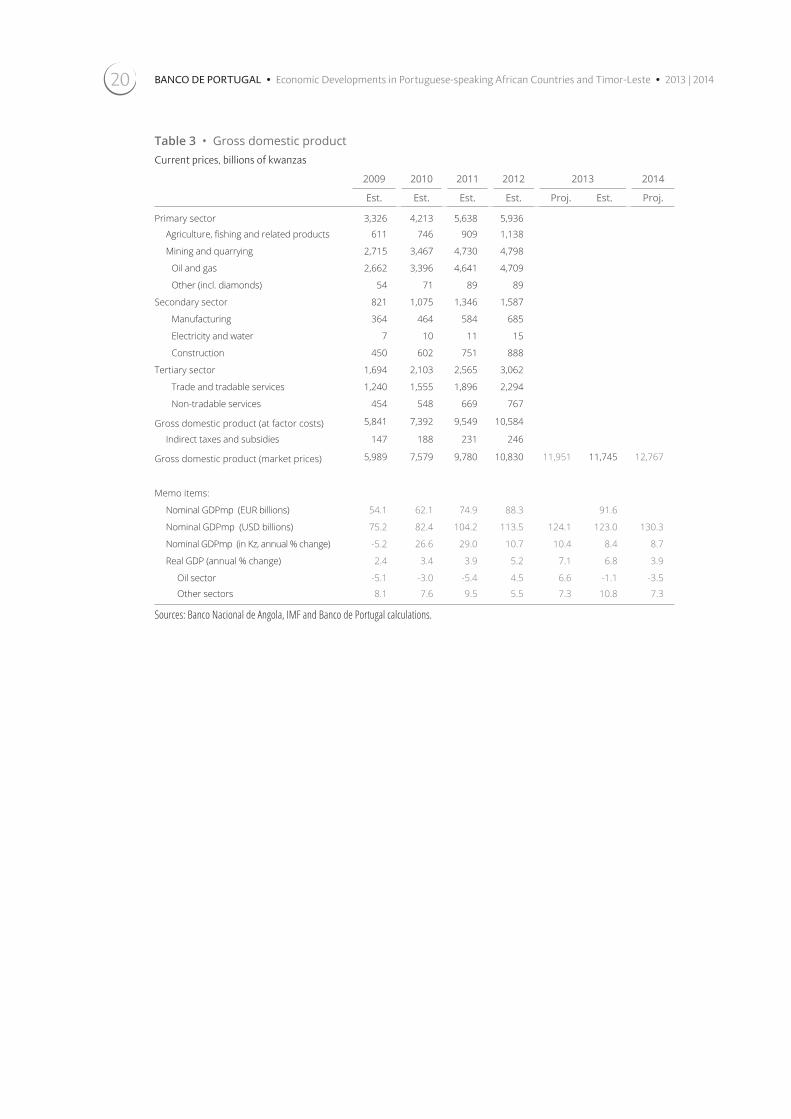
Table 3 • Gross domestic productCurrent prices, billions of kwanzas
2009 2010 2011 2012 2013 2014
Est. Est. Est. Est. Proj. Est. Proj.
Primary sector 3,326 4,213 5,638 5,936
Agriculture, fishing and related products 611 746 909 1,138
Mining and quarrying 2,715 3,467 4,730 4,798
Oil and gas 2,662 3,396 4,641 4,709
Other (incl. diamonds) 54 71 89 89
Secondary sector 821 1,075 1,346 1,587
Manufacturing 364 464 584 685
Electricity and water 7 10 11 15
Construction 450 602 751 888
Tertiary sector 1,694 2,103 2,565 3,062
trade and tradable services 1,240 1,555 1,896 2,294
Non-tradable services 454 548 669 767
Gross domestic product (at factor costs) 5,841 7,392 9,549 10,584
Indirect taxes and subsidies 147 188 231 246
Gross domestic product (market prices) 5,989 7,579 9,780 10,830 11,951 11,745 12,767
Memo items:
Nominal GDpmp (EUR billions) 54.1 62.1 74.9 88.3 91.6
Nominal GDpmp (UsD billions) 75.2 82.4 104.2 113.5 124.1 123.0 130.3
Nominal GDPmp (in Kz, annual % change) -5.2 26.6 29.0 10.7 10.4 8.4 8.7
Real GDP (annual % change) 2.4 3.4 3.9 5.2 7.1 6.8 3.9
Oil sector -5.1 -3.0 -5.4 4.5 6.6 -1.1 -3.5
Other sectors 8.1 7.6 9.5 5.5 7.3 10.8 7.3
Sources: Banco Nacional de Angola, IMF and Banco de Portugal calculations.

21
Table 4 • Consumer price indexper cent
Monthly change Cumulative change End-of-period change Average change
[1] [2] [3] [4]
2000 December 268.4 268.4 325.02001 December 116.1 116.1 152.6
2002 December 105.6 105.6 109.0
2003 December 76.6 76.6 98.2
2004 December 31.0 31.0 43.5
2005 December 18.5 18.5 23.0
2006 December 12.2 12.2 13.3
2007 December 11.7 1.7 12.2
2008 December 13.2 13.2 12.5
2009 December 14.0 14.0 13.7
2010 December 15.3 15.3 14.5
2011 December 11.4 11.4 13.5
2012 December 9.0 9.0 10.3
2013 December 7.7 7.7 8.8
2012 January 0.7 0.7 11.5 13.2
February 0.7 1.4 11.3 12.9
March 0.6 2.0 11.1 12.6
April 0.7 2.7 10.9 12.3
May 0.7 3.4 10.5 11.9
June 0.7 4.1 10.1 11.6
July 0.7 4.8 10.0 11.2
August 0.6 5.4 9.9 10.9
september 0.6 6.0 9.7 10.7
October 0.9 7.0 9.8 10.6
November 0.9 8.0 9.8 10.5
December 1.0 9.0 9.0 10.3
December (proj.) 9.6 10.8
2013 January 0.6 0.6 8.9 10.1
February 0.8 1.4 9.1 9.9
March 0.7 2.1 9.1 9.7
April 0.6 2.7 9.0 9.6
May 0.9 3.6 9.2 9.5
June 0.6 4.3 9.2 9.4
July 0.5 4.8 9.0 9.3
August 0.5 5.4 9.0 9.2
september 0.5 5.9 8.9 9.2
October 04 6.3 8.4 9.1
November 0.5 6.9 7.9 8.9
December 0.7 7.7 7.7 8.8
December (proj.) 9.0
2014 January 0.8 0.8 7.8 8.7
February 0.5 1.2 7.5 8.6
March 0.5 1.8 7.3 8.4
April 0.5 2.3 7.2 8.3
May 0.6 2.9 7.0 8.1December (proj.) 8.0
Sources: Banco Nacional de Angola, IMF and Banco de Portugal calculations.Notes: [1] month (n) / month (n-1); [2] month (n) / previous December; [3] month (n) / month (n) of the previous year; [4] last 12 months / previous 12 months.
angola

Banco de Portugal • Economic Developments in Portuguese-speaking African Countries and Timor-Leste • 2013 | 2014 22
Table 5 • Balance of paymentsusD millions
20092010 2011 2012 2013 2014
Est. Est. Est. Proj. Est. Proj.
1. Current account -7,572 7,506 13,085 13,853 5,170 6,038 2,823
trade balance 18,168 33,928 47,082 47,376 39,647 45,725 43,132
Exports (f.o.b.) 40,828 50,595 67,310 71,093 64,144 70,951 71,450
Oil sector 39,803 49,352 65,591 69,716 62,700 69,119 69,513
of which: crude oil 39,271 48,629 64,539 68,871 61,718 67,865 68,180
Diamonds 814 976 1,205 1,159 1,110 1,243 1,331
Other 212 267 514 218 334 589 606
Imports (f.o.b.) -22,660 -16,667 -20,228 -23,717 -24,497 -25,226 -28,318
services and income -25,369 -25,984 -32,635 -31,761 -34,013 -39,464 -40,084
services (net) -18,546 -17,897 -22,938 -21,339 -23,068 -26,996 -27,375
Credit 623 857 732 780 724 760 802
Debit -19,169 -18,754 -23,670 -22,119 -23,792 -27,756 -28,177
of which: Transportation and travel -4,288 -3,237 -3,810 -4,597
Construction -4,676 -4,643 -7,932 -6,230
Technical assistance -7,114 -6,158 -9,173 -8,908
Income (net) -6,823 -8,087 -9,697 -10,422 -10,945 -12,468 -12,709
of which: Interest on public debt -504 -392 -534 -662
Dividends and profits -6,130 -7,525 -9,040 -9,722
Current transfers (net) -370 -438 -1,362 -1,762 -464 -223 -225
2. Capital and financial accounts 2,955 -897 -3,997 -9,210 -2,050 -6,351 -1,539Capital transfers (net) 11 1 2 0 3 3 2
Foreign direct investment (net) 2,199 -4,568 -5,116 -9,639 597 -2,992 -1,755
In reporting country (net)(a) 2,205 -3,227 -3,024 -1,044 -1,000
Abroad (net) -7 -1,340 -2,093 -1,948 -755
Other investiment (net) (incl. errors and omissions) 185 3,670 1,117 428 -2,650 -3,362 214
3. Overall balance: [1 + 2] -4,616 6,609 9,088 4,643 3,120 -313 1,284
4. Financing 4,616 -6,609 -9,088 -4,643 -3,120 313 -1,284Change in official reserves (net) [increase: -] 4,631 -6,101 -9,054 -4,642 -3,120 313 -1,284
Exceptional financing(b) -15 -508 -34 -1 0 0 0
5. Financing gap 0 0 0 0 0 0 0
Memo items:
trade balance (% of GDp) 24.1 41.2 45.2 41.7 31.9 37.2 33.1
Current account (% of GDp) -10.1 9.1 12.6 12.2 4.2 4.9 2.2
Sources: Banco Nacional de Angola, IMF and Banco de Portugal calculations.Notes: (a) Negative values from 2010 onwards (disinvestment in Angola) reflect mostly the higher weight of the recovery of prior investment by foreign oil companies; (b) Mainly change in arrears and debt forgiveness or rescheduling.

23
Table 6 • Merchandise exportsproducts, usD millions ; Destinations, % of total
2006 2007 2008 20092010 2011 2012 2006 to 2012
Est. Est. Est. Est.
Total exports 31,862 44,396 63,914 40,828 50,595 67,310 71,093
Crude oil 29,929 42,352 61,666 39,271 48,629 64,539 68,871
Refined oil products and gas 554 652 792 532 722 1,052 845
Diamonds 1,155 1,182 1,210 814 976 1,205 1,159
Other 225 211 247 212 267 292 292
Exports by destination(a)
South Africa 1.8 3.9 4.1 3.2 3.1 2.6 4.2 3.4
Canada 5.5 5.9 5.2 5.4 5.8 8.7 5.0 6.0
China 30.1 26.4 29.7 38.5 42.8 37.7 49.6 37.4
United states 31.4 24.0 23.3 19.0 18.1 15.9 8.7 18.7
France 3,5 5,2 5,0 7,6 3.7 3.2 1.6 4.0
India 2.0 5.5 4.3 9.4 10.1 10.7 10.1 7.9
portugal 0.0 1.0 0.8 0.5 1.8 2.4 2.5 1.5
taiwan 5.2 4.2 2.5 2.9 4.8 8.2 6.1 5.0
Other 20.5 24.0 25.1 13.5 9.8 10.6 12.2 16.1
Sources: Banco Nacional de Angola, IMF and Banco de Portugal calculations.Note: (a) Crude oil exports only.
Table 7 • Merchandise importsproducts, usD millions ; Origins, % of total
2006 2007 2008 20092010 2011 2012 2006 to 2012
Est. Est. Est. Est.
total imports 8,778 13,662 20,982 22,660 16,667 20,228 23,717
of which: SNA (a) 5,664 8,590 14,828 22,548 16,667 20,228 23,717
Imports by origin
South Africa 8.7 6.6 5.7 3.9 4.0 3.8 3.8 4.6
Belgium 4.8 5.0 4.5 6.4 7.3 6.0 6.7 6.1
Brazil 8.7 7.7 8.2 6.2 5.1 4.2 4.4 5.8
China 9.6 4.3 10.0 7.4 8.5 7.6 9.2 8.2
United states 6.4 11.0 9.1 10.7 7.4 8.2 5.5 8.3
portugal 18.5 19.3 17.7 14.0 14.5 15.4 16.4 15.9
United Kingdom 3.4 4.8 3.6 4.4 5.1 2.9 2.4 3.7
Other 39.8 41.3 41.3 46.9 48.1 52.0 51.7 47.5
Sources: Banco Nacional de Angola, IMF and Banco de Portugal calculations.Note: (a) Data from the National Customs Service of Angola.
angola

Banco de Portugal • Economic Developments in Portuguese-speaking African Countries and Timor-Leste • 2013 | 2014 24
Table 8 • External public debt and foreign reservesusD millions
20092010 2011 2012 2013 2014
Est. Est. Est. Proj. Est. Proj.
1. Net foreign assets 12,628 18,425 30,341 33,011 48,909 31,916 31,289of which: foreign reserves (gross) 13,238 19,444 28,393 33,035 34,416 33,125 33,931
2. Total external public debt (incl. arrears) 15,125 17,829 20,992 22,583 25,317 27,980 29,573Commercial 9,002 10,676 13,125 13,786 18,522
Banking 8,114 9,882 12,105 12,813 17,549Enterprises 888 794 1,020 974 973
Official bilateral 5,386 5,816 6,221 6,978 7,809Official multilateral 738 1,328 1,640 1,813 1,645Fees 8 5 6 4
Memo items:Net foreign assets (% of GDp) 16.8 22.4 29.1 29.1 39.4 25.9 24.0Gross foreign reserves (% of GDp) 17.6 23.6 27.3 29.1 27.7 26.9 26.0
Total external public debt (% of GDP) 20.1 21.6 20.2 19.9 20.4 22.7 22.7
Sources: Banco Nacional de Angola, IMF and Banco de Portugal calculations.
Table 9 • Government operationsBillions of kwanzas
2009 2010 2011 2012 2013 2014
Est. Est. Est. Est Budg. Est. l.e.(a) Budg.
1. total revenue 2,070 3,295 4,776 5,054 4,571 4,920 107.6 4,745Tax revenue 1,988 3,094 4,528 4,826 4,401 4,571 103.9 4,540
Oil revenue 1,449 2,500 3,817 4,103 3,282 3,599 109.7 3,313Non-oil revenue 539 594 711 723 1,119 972 86.8 1,227
Non-tax revenue 80 199 246 226 169 347 204.8 205Grants 2 2 2 2 0 2 0
2. Total expenditure(b) 2,644 2,894 3,774 4,325 5,021 4,879 97.2 5,375Current expenditure 1,901 2,161 2,928 3,180 3,341 3,442 103.0 3,674
Compensation of employees 665 714 877 1,031 1,296 1,155 89.1 1,369Goods and services 539 619 1,031 1,297 1,156 1,403 121.4 1,431Debt interest 103 90 95 101 65 99 152.7 128
Domestic 24 27 56 69 27 59 217.3 69External 79 63 38 33 38 40 106.2 59
transfers and subsidies 594 738 926 752 824 785 95.3 746Capital expenditure 743 733 846 1,145 1,680 1,437 85.5 1,701
3. Overall balance (commitment basis) [1 - 2] -575 402 1,002 729 -450 41 -6304. Change in arrears (net) 59 -73 150 289 0 -18 0
Domestic(c) 95 -73 150 289 0 -18 0External interest -36 0 0 0 0 0 0
5. Overall balance (cash basis) [3 + 4] -516 328 1,153 1,018 -450 23 -6306. Financing 516 -328 -1,153 -1,018 450 -23 630
External financing (net) 111 16 51 218 596 233 733Disbursements 380 154 186 384 775 432 1,036Amortisation -269 -138 -135 -166 -179 -199 -303
Domestic financing (net) 405 -344 -1,203 -1,236 -146 -256 -103Bank financing 514 -324 -826 -432 289 29 116Non-bank financing (incl. errors and omissions) -109 -20 -378 -804 -434 -285 -219
Memo item:Overall balance, commitment basis (% of GDp) -9.6 5.3 10.2 6.7 -3.8 0.3 -4.9
Sources: Banco Nacional de Angola, Ministry of Finance (Angola), IMF and Banco de Portugal calculations.Notes: (a) Level of budget execution (%); (b) Includes, for all years shown, current and capital expenditure incurred by state-owned enterprises (mainly Sonangol) and now included in the budget (quasi-fiscal operations); (c) Net of changes in arrears to suppliers (expenditure) and changes in Sonangol's arrears to the Treasury (revenue).

25
Table 10 • Monetary surveyBillions of kwanzas
2009 2010 2011 2012 20132013 / 2012
2014Apr.14 / Dec.13
2014
Dec. Dec.Dec. Dec. Dec. Dec. [1] Dec.
Est. Est. Proj. Est. [1] [2] Est. [1] [2] Proj.
Net foreign assets 1,129 1,698 2,891 3,163 4,904 3,116 -1.5 -1.2 3,029 -2.8 -2.0 3,422
Net foreign assets, UsD billions
13 18 30 33 49 32 -3.3 31 -2.8 31
Banco Nacional de Angola 1,127 1,683 2,568 3,014 3,399 3,097 2.7 2.1 3,009 -2.8 -2.0 3,252
Net international reserves 1,128 1,605 2,485 2,935 3,219 3,021 2.9 2.2 2,966 -1.8 -1.2 3,499
Gross reserves 1,183 1,792 2,705 3,166 3,234 2.1 1.8 3,159 -2.3 -1.7
Gross reserves, UsD billions
13 19 28 33 34 33 0.3 32 -2.3 34
Short-term liabilities -55 -186 -220 -230 -213 -7.6 0.4 -193 -9.3 0.4
Other foreign assets (net) -2 78 82 79 180 76 -3.9 -0.1 43 -43.2 -0.7 -247
Commercial banks 2 14 323 149 1,505 19 -87.4 -3.4 20 5.2 0.0 170
Net domestic assets 1,419 1,031 765 713 887 1,316 84.7 15.6 1,867 41.9 12.4 2,005
Domestic credit (net) 1,728 1,782 1,742 1,733 1,595 2,277 31.3 14.0 2,851 25.2 13.0 3,047
Claims on general govern-ment (net)
396 106 -412 -931 -1,282 -651 30.1 7.2 -231 64.5 9.5 -108
Credit to the economy 1,332 1,676 2,154 2,664 2,877 2,928 9.9 6.8 3,083 5.3 3.5 3,155
Other domestic assets (net) -309 -751 -977 -1,021 -708 -961 5.9 1.6 -984 -2.5 -0.5 -1,042
total assets 2,548 2,728 3,656 3,876 5,791 4,432 14.3 14.3 4,896 10.5 10.5 5,427
Broad money (M3) 2,548 2,728 3,656 3,876 5,791 4,432 14.3 14.3 4,896 10.5 10.5 5,427
Money and quasi-money (M2) 2,304 2,626 3,506 3,799 5,641 4,379 15.3 4,838 10.5 5,375
Money 1,635 1,700 2,151 2,215 2,574 16.2 2,932 13.9
Currency in circulation 170 172 209 245 325 276 12.9 259 -6.3 350
Demand deposits 1,466 1,528 1,942 1,970 2,298 16.6 2,673 16.3
in national currency 609 733 956 1,041 1,490 1,463 40.5 1,683 15.1 1,755
in foreign currency 857 795 986 929 835 -10.1 990 18.5
Quasi-money 669 926 1,356 1,584 1,805 13.9 1,906 5.6
time deposits in national currency 260 409 596 724 899 24.2 1,073 19.4
time deposits in foreign currency 409 517 759 861 907 5.3 833 -8.1
Repurchase agreements 244 102 150 77 150 52 -32.1 58 11.1 52
Sources: Banco Nacional de Angola, IMF and Banco de Portugal calculations.Notes: [1] Percent changes from the end of the previous year; [2] Changes as a percentage of the initial stock of broad money (expansion/contraction determinants)..
angola

Banco de Portugal • Economic Developments in Portuguese-speaking African Countries and Timor-Leste • 2013 | 2014 26
Table 11 • Interest ratesannual rates, per cent
2009 2010 2011 2012 2013 2014
Dec. Dec. Dec. Dec. Jun. Sep. Dec. Mar. May Jun.
Deposits(in national currency)
Demand deposits 2.56 2.44 5.79 0.00 0.00 0.00 0.00 0.00 0.00time deposits
Up to 90 days 12.06 8.18 4.32 3.07 2.91 2.97 3.32 3.11 4.0591-180 days 12.59 9.99 6.67 4.69 4.13 4.01 3.87 4.47 4.45181-365 days 11.62 6.81 5.55 4.90 4.28 5.36 5.10 6.02 593Over 1 year 4.62 1.65 8.58 7.02 7.23 5.50 5.56 4.87 4.95
(in foreign currency)Demand deposits 0.95 0.08 2.00 0.00 0.00 0.00 0.00 0.00 0.00time deposits
Up to 90 days 4.05 2.32 2.38 1.84 1.82 1.79 2.10 1.99 1.8391-180 days 4.91 7.15 2.68 2.32 1.92 1.98 2.25 1.83 2.46181-365 days 5.78 2.73 3.72 2.65 2.47 2.74 2.87 2.57 2.88Over 1 year 5.95 1.12 3.88 3.11 3.88 2.73 4.96 4.77 4.96
Credit (to enterprises)(in national currency)
Up to 180 days 15.62 18.96 18.09 15.32 15.35 14.62 15.08 15.51 17.33181-365 days 19.39 18.23 15.98 14.36 14.42 14.11 13.86 13.88 14.31Over 1 year 19.02 23.74 17.70 15.09 15.33 14.47 13.11 12.91 13.67
(in foreign currency)Up to 180 days 11.32 14.84 10.17 8.94 12.64 7.70 11.78 14.53 11.21181-365 days 9.90 8.72 10.03 11.54 10.32 10.81 12.07 13.11 12.85Over 1 year 8.57 9.86 10.42 11.29 12.99 11.71 9.83 10.12 9.58
BNA intervention ratesRediscount 30.00 25.00 20.00 20.00 15.00 15.00 15.00 10.00 10.00 10.00Reference rate 10.50 10.25 10.00 9.75 9.75 9.25 9.25 9.25standing facilities
Liquidity provision facility 12.50 11.50 11.25 11.00 10.25 10.00 10.00 10.00Overnight deposit facility 2.00 1.50 1.00 0.75 0.75 1.50 1.75 1.75
Open market operationsLiquidity provision 15.45Liquidity absorption 5.22 2.00 2.11 3.00 3.50 3.50 3.50
LUIBOR(b) overnight 21.94 17.12 6.39 6.20 6.13 5.53 4.71 3.15 2.96 2.94Central bank bills
14 days 7.0028 days 20.04 8.5063 days 21.44 9.99 7.18 4.12 3.9791 days 23.28 10.82182 days 20.88 11.55 6.80 5.08364 days 13.69
Treasury bills91 days 23.28 10.82 3.94 3.35 3.00 2.46 3.64 3.82 3.71 3.64182 days 11.55 4.82 3.71 4.31 2.94 4.60 4.06 3.94 3.75364 days 13.69 5.18 5.10 5.96 3.97 5.07 4.84 5.41
Treasury bonds(a)
1 year 4.462 years 4.96 7.00 7.00 7.00 7.00 7.00 7.00 7.003 years 5.46 7.00 7.00 7.25 7.25 7.25 7.25 7.75 7.75 7.754 years 6.46 7.00 7.25 7.50 7.50 7.50 8.00 8.00 8.005 years 7.00 7.75 7.75 7.75 7.75 7.75 8.25 8.25 8.256 years 8.00
Memo item:Inflation (end-of-period % change) 14.00 15.30 11.38 9.02 9.19 8.93 7.70 7.31 6.96
Source: Banco Nacional de Angola.Notes: (a) Luanda Interbank Offered Rate (weighted average rate of liquidity-providing operations without collateral, applied by banks in the interbank money market). (b) Treasury bonds issued in kwanzas but indexed to the USD/AOK exchange rate.

27
Table 14 • Exchange ratesaverage rates (primary market - BNa reference rates)
EUR / AOK USD / AOKEERI(a) (b)
Nominal Real
2000 9.02 9.89 100.00 100.00
2001 19.58 21.84 45.45 112.68
2002 41.21 43.34 22.74 116.98
2003 83.98 74.35 12.91 129.34
2004 103.56 83.36 11.33 157.98
2005 108.91 87.24 10.75 179.92
2006 100.79 80.38 11.54 213.65
2007 105.11 76.71 11.66 233.84
2008 110.44 75.03 11.30 243.61
2009 110.66 79.59 10.65 262.39
2010 122.00 91.98 9.26 255.38
2011 130.53 93.90 8.82 264.84
2012 122.65 95.42 8.69 280.90
2013 128.19 95.47 8.48 292.84
2012 January 122.77 95.29 8.70 272.95
February 125.99 95.30 8.65 272.78
March 125.84 95.32 8.66 273.09
April 125.53 95.33 8.65 274.59
May 122.19 95.35 8.69 278.18
June 119.41 95.36 8.76 283.25
July 117.46 95.38 8.78 285.88
August 118.07 95.39 8.78 285.89
september 122.60 95.42 8.70 283.84
October 123.78 95.38 8.65 285.20
November 122.54 95.71 8.63 287.32
December 125.56 95.80 8.58 287.80
2013 January 127.23 95.89 8.55 287.40
February 128.42 95.95 8.53 286.56
March 124.48 95.97 8.56 289.91
April 124.98 96.01 8.54 290.73
May 124.77 96.10 8.50 292.69
June 126.83 96.25 8.47 293.03
July 125.91 96.28 8.48 294.72
August 128.28 96.34 8.44 294.15
september 129.26 96.79 8.39 292.81
October 132.97 97.44 8.30 290.90
November 131.57 97.42 8.30 293.07
December 133.63 97.56 8.27 293.43
2014 January 133.03 97.62 8.25 293.54
February 133.20 97.61 8.27 294.78
March 135.01 97.60 8.31 296.94
April 134.87 97.62 8.34 299.80
May 134.27 97.66 8.35 301.41
Sources: Banco Nacional de Angola and Banco de Portugal calculations.Notes: (a) Effective exchange rate index (EERI, nominal and real), calculated on the basis of official exchange rates applied to the currencies of the four main trading partners over the period 2005/2009; (b) An increase / decrease in the EERI (nominal or real) corresponds to an appreciation / depreciation of the kwanza.
angola


2. CaBO vErDE Area: 4,033 Km2
Capital city: praia
Population: 512 thousand (2013; source: ONU)
Currency: Cabo verde escudo
Weak domestic demand and the unfavourable external context caused near stagnation in the Cabo Verde economy in 2013. However, the resulting reduction in imports and the ongoing growth of tourism improved the external accounts and strengthened foreign exchange reserves, supporting the exchange rate peg to the euro. The slowdown of economic activity had a negative impact on public revenue, requiring further cost containment to curb the State's financing needs.

Banco de Portugal • Economic Developments in Portuguese-speaking African Countries and Timor-Leste • 2013 | 2014 30
2.1. Cabo Verde overviewThe unfavourable external environment and the low confidence levels among economic actors in Cabo Verde affected the macroeconomic deve-lopments in the country during 2013. The conti-nuation of the difficulties in certain EU countries negatively impacted tourism revenue, official transfers, foreign direct investment (FDI) and emigrant remittances.
The continuing low expectations and the stag-nation of credit to the economy reflected nega-tively on domestic demand, above all in hou-sehold consumption and investment. Domestic product is likely to have continued its slowing trend, reaching real growth of 0.5 per cent, ver-sus 1.2 per cent in 2012.
The price decrease of certain imported goods as well as the contraction in domestic demand and the increase of national production of fresh food items had an impact on inflation, which reached negative values year-on-year in the second quarter of 2014. They also led to the reduction in the amounts of goods and services imports in 2013, which caused a sharp improvement in the external current deficit (to 2.8 per cent of GDP), aided also by the growth in goods exports and tourism revenue. The current deficit improvement led to the accu-mulation of EUR 50 million of foreign exchange reserves, covering an equivalent of 5.0 months of goods and services imports.
The economic slowdown also restricted tax col-lection, while grants also fell. The authorities introduced measures to reduce current expen-diture and adjustments to the investment pro-gramme, closing 2013 with a budget deficit of 9 per cent of GDP (less than the 10.5 per cent of 2012). The difficulties mainly affected income taxes and international transaction taxes. The containment measures taken mostly affected the investment programme expenditure.
As usual, the Cabo Verde State financed itself mainly through external credit lines, with stock rising to 75.9 per cent of GDP. Nonetheless it also used domestic financing, lifting domestic debt to 24 per cent of GDP (excluding the consolidated financial mobilisation securities - "TCMF").
The external improvement and the growth of credit to the general government accelerated monetary expansion in 2013, in a context of excess liquidity, with high excess reserves and increasing access to the permanent deposit facility of Banco de Cabo Verde (BCV). Limited internal opportunities and strong risk aversion led the banks to restrict lending to the priva-te sector and to find alternative solutions, including deposits abroad. The low profitabi-lity of these investments and the reduction of Treasury Bill and BCV securities rates, along with the deterioration in creditworthiness, had a consequence for the profitability and sol-vency of most of the banking institutions.
Table 15 • Main economic indicators
2011 2012 2013 2014 Est. Prog.
Real GDP (annual % change) 4.0 1.2 0.5 3.0
Inflation (end-of-period % change) 3.6 4.1 0.1 2.2
Broad money (annual % change) 3.6 6.0 10.8 7.8
Current account (% of GDp) -16.3 -10.9 -2.8 -9.2
Official reserves (months of imp.) 3.2 4.0 5.0 5.0
Fiscal balance (% of GDp) -7.7 -10.5 -9.0 -8.1
public debt (% of GDp) 86.0 98.4 107.2 –
Sources: International Monetary Fund, Banco de Cabo Verde, Ministry of Finance (Cabo Verde) and Cabo Verde National Institute of Statistics.

31
some economic recovery is expected in 2014, with a positive impact on the public accounts, through a reduction of the budget deficit (not confirmed by the results to March), including an increase in revenue and above all the plan-ned slowdown in the investment programme. The expected resumption of domestic con-sumption and investment should lead to the deterioration of the external accounts, chie-fly through the increase of imports. The first quarter of this year revealed a year-on-year
reduction in tourism revenue, with fewer domestic and foreign tourists, mainly from the United Kingdom, Germany and Portugal.
The main risks continue to relate to potentially prolonged difficulties in the EU and an increase in competition from North Africa as a tourism destination. Internally, the developments in the public finances and public debt will have to be taken into account and monitored closely, along with the financial situation of the banks.
Cabo verde

Banco de Portugal • Economic Developments in Portuguese-speaking African Countries and Timor-Leste • 2013 | 2014 32
Table 16 • Main economic indicators
2009 2010 2011 2012 2013 2014
Est. Est. Est. Est. Prog. Est. Prog. Est.
Output and prices
GDp m.p. EUR millions 1,232 1,257 1,342 1,367 1,473 1,409 1,484
Real % change -1.3 1.5 4.0 1.2 1.5 0.5 3.0Inflation (CPI) E-o-p % change -0.4 3.4 3.6 4.1 2.2 0.1 2.2 -0.1 Jun.
Avg % change 1.0 2.1 4.5 2.5 3.3 1.5 3.3 0.3 Jun.
Public financestotal revenue % of GDp 27.6 28.6 25.6 24.1 25.3 24.1 27.3
Grants % of GDp 5.5 6.8 2.9 2.8 3.1 2.4 3.2Total expenditure % of GDp 33.3 39.0 33.3 34.6 33.0 33.0 35.2Overall balance (commitment basis)
% of GDp -5.8 -10.6 -7.7 -10.5 -7.5 -9.0 -8.1
Excluding grants % of GDp -11.3 -17.4 -10.6 -13.3 -10.6 -11.4 -11.3Domestic debt % of GDp 28.3 29.5 29.1 30.5 31.3 31.9 May
of which: TCMF(a) % of GDp 8.4 8.2 7.7 7.6 7.3 7.0 May
Money and creditClaims on general government (net)
Annual % change 7.0 -10.3 12.7 20.3 24.6 10.3 19.6 13.0 May(e)
Credit to the economy Annual % change 11.8 12.0 11.8 0.3 4.5 1.2 13.0 -0.9 May(e)
Broad money (M3) Annual % change 3.3 5.9 3.6 6.0 5.8 10.8 7.8 0.7 May(e)
Interest rates(b)
One-year deposits (average of OMIs)
Annual rate 4.14 4.53 4.22 3.80 4.29 4.34 May
Rediscount Annual rate 7.50 7.50 7.50 9.75 9.75 8.25 MayLiquidity provision Annual rate 8.25 7.25 7.25 8.75 8.75 7.25 May Treasury bills (91 days) Annual rate 3.59 4.00 4.10 4.06 2.88 1.50 May
Balance of paymentsExports (current USD) Annual % change -19.1 46.0 56.0 -13.1 -2.4 7.8 7.2Imports (current UsD) Annual % change -12.0 6.2 29.5 -20.9 6.0 -2.0 15.1Current account % of GDp -14.6 -13.5 -16.3 -10.9 -9.8 -2.8 -9.2
Excluding official transfers % of GDp -19.6 -19.9 -20.0 -14.3 -11.9 -5.8 -10.9Current and capital account % of GDp -11.9 -11.1 -15.6 -10.2 -10.3 -2.4 -9.0Net international reserves Months of imports(d) 4.2 4.2 3.2 4.0 4.1 5.0 5.0 4.5 May
External debttotal EUR millions 527.9 638.8 762.5 928.7 1,069.8 1,101.2 May
% of GDp 42.8 50.8 56.8 67.9 75.9 74.2 May % of exports(d) 128.4 133.1 134.5 152.9 167.5 161.5 May
Debt service % of exports(d) 5.5 4.7 4.1 4.3 4.6 4.5 May
Exchange rates (averages)EUR/CVE (official market) Average rate 110.3 110.3 110.3 110.3 110.3 110.3 110.3 110.3 Jun.USD/CVE (official market) Average rate 79.4 83.3 79.3 85.8 84.2 83.1 83.0 81.1 Jun.Nominal EERI (Index, 100: 2000)(c) Annual % change 0.3 -1.3 0.0 0.6 1.0 -0.4 Jun.(e)
Real EERI (Index, 100: 2000)(c) Annual % change 1.3 -0.9 0.9 0.3 1.2 -2.4 Jun.(e)
Sources: Banco de Cabo Verde, Ministry of Finance (Cabo Verde), IMF and Banco de Portugal calculations.Notes: (a) Títulos Consolidados de Mobilização Financeira (consolidated financial mobilisation securities); (b) Monthly averages (corresponding to Decem-ber for annual figures); (c) Effective exchange rate index (EERI), calculated on the basis of official exchange rates applied to the currencies of Cape Verde's four main trading partners over the period 2005/09 (appreciation: +; depreciation: -); (d) Imports and exports of goods and services; (e) Change from the previous December.

33
Table 17 • Gross domestic productCurrent prices, CvE millions
2007 2008 2009 2010 2011 2012 2013 2014
Est. Est. Proj.
Primary sector 11,191 11,456 12,077 11,779 12,214 12,975
Agriculture, livestock and forestry 9,386 9,655 10,043 9,705 10,595
Fishing and aquaculture 1,003 786 1,261 1,367 1,030
Mining and quarrying 802 1,014 774 708 589
Secondary sector 19,816 24,253 25,398 24,441 25,666 25,275
Food, beverages and tobacco products 2,704 3,365 3,810 3,974 4,632
Other manufactured products 2,837 3,161 2,879 3,554 3,452
Electricity, gas, water 900 1,318 2,125 1,940 2,227
Construction 13,376 16,409 16,584 14,973 15,355
Tertiary sector 74,355 80,511 81,782 84,751 89,645 93,685
Whole. & retail trade, repair of motor vehicles 15,389 15,540 16,833 17,610 18,994
Accommodation and food service activities 4,255 4,712 4,653 4,793 5,976
transportation, storage and communication 19,929 22,083 20,917 21,035 20,296
Financial and insurance activities 4,844 6,016 5,316 5,119 5,030
Other market services 13,897 15,465 15,587 16,668 17,899
Non-market services 16,041 16,695 18,476 19,526 21,450
Gross value added 105,362 116,219 119,258 120,970 127,525 131,935
Taxes and subsidies on products 16,612 18,479 16,621 17,598 20,399 18,789
Gross domestic product (m.p.) 121,974 134,698 135,879 138,569 147,924 150,724 155,359 163,659
Consumption 98,067 104,603 111,547 112,865 120,265 122,813 131,698 138,769
public 21,296 22,739 24,708 25,536 27,401 29,499 30,358 33,425
private 76,770 81,864 86,839 87,328 92,864 93,314 101,340 105,344
Investment 60,731 65,376 59,501 66,024 70,277 54,128 45,415 46,299
Gross fixed capital formation 53,944 57,285 52,337 62,625 69,128 49,177 41,249 42,883
public 10,085 14,828 14,403 23,935 17,286 19,765 17,560 16,959
private 43,858 42,457 37,934 38,690 51,842 29,412 23,689 25,924
Changes in inventories 6,787 8,091 7,164 3,399 1,149 4,951 4,166 3,416
Domestic demand 158,798 169,979 171,048 178,889 190,542 176,941 177,113 185,068
Exports of goods and services 38,470 43,242 36,699 40,059 46,555 52,638 55,699 59,013
Overall demand 197,268 213,221 207,747 218,948 237,098 229,579 232,812 244,081
Imports of goods and services 75,294 78,523 71,867 80,379 89,173 78,855 77,453 80,422
Memo items:
Gross domestic savings
Nominal GDpmp (EUR millions) 23,907 30,095 24,332 25,704 27,659 27,911 23,660 24,890
Nominal GDpmp (UsD millions) 1,106 1,222 1,232 1,257 1,342 1,367 1,409 1,484
GDP deflator (annual % change) 1,513 1,788 1,712 1,664 1,866 1,756 1,870 1,971
Nominal GDP (annual % change) 3.9 3.5 2.2 0.5 2.7 0.6 2.6 2.3
Real GDP (annual % change) 13.5 10.4 0.9 2.0 6.8 1.9 3.1 5.3
pIB real (variação anual em %) 9.2 6.7 -1.3 1.5 4.0 1.2 0.5 3.0
Sources: Cabo Verde National Institute of Statistics, Banco de Cabo Verde, IMF and Banco de Portugal calculations.
Cabo verde

Banco de Portugal • Economic Developments in Portuguese-speaking African Countries and Timor-Leste • 2013 | 2014 34
Table 18 • Consumer price indexper cent
Monthly change End-of-period change Average change
[1] [2] [3]
2001 December − 4.14 3.35
2002 December − 2.98 1.88
2003 December − -2.28 1.19
2004 December − 0.61 -1.89
2005 December − 1.80 0.40
2006 December − 5.81 4.85
2007 December − 3.97 4.40
2008 December − 6.69 6.78
2009 December − -0.37 0.98
2010 December − 3.43 2.08
2011 December − 3.58 4.47
2012 December − 4.15 2.54
2013 December − 0.08 1.51
2012 January -0.61 2.95 4.45
February 0.70 2.48 4.32
March 0.00 2.03 4.13
April 0.43 1.04 3.77
May 0.86 2.00 3.50
June 0.26 1.55 3.19
July 1.02 2.50 2.97
August -0.17 2.15 2.80
september 0.59 2.23 2.59
October 0.75 3.62 2.52
November -0.17 3.81 2.49
December 0.42 4.15 2.54
December (proj.) − 4.00 2.60
2013 January -0.25 4.52 2.67
February -0.67 3.11 2.73
March -0.50 2.59 2.77
April 0.17 2.32 2.88
May 0.00 1.45 2.83
June 0.00 1.19 2.80
July 0.50 0.67 2.64
August 0.42 1.26 2.57
september 0.42 1.09 2.47
October -0.25 0.08 2.17
November -0.25 0.00 1.85
December 0.50 0.08 1.51
December (proj.) − 2.20 3.30
2014 January -0.33 0.00 1.14
February -0.17 0.50 0.93
March -0.42 0.59 0.76
April -0.67 -0.25 0.55
May 0.08 -0.17 0.42
June 0.08 -0.08 0.31 December (proj.) − 2.20 3.30
Sources: Banco de Cabo Verde and Banco de Portugal calculations.Notes: [1] month (n)/month (n-1); [2] month (n)/month (n) of the previous year; [3] last 12 months/previous 12 months.

35
Table 19 • Balance of paymentsCvE millions
2010 2011 2012 2013 2014
Est. Est. Est. Proj. Q I Est. Proj. Q I
1. Current account -18,722 -24,093 -16,456 -15,878 688 -4,288 -15,106 134trade balance -56,822 -67,206 -56,176 -59,653 -11,159 -51,801 -60,866 -11,162
Exports (f.o.b.)(a) 11,282 16,759 15,777 15,106 3,264 16,462 17,642 5,054
Imports (f.o.b.) -68,104 -83,965 -71,953 -74,760 -14,423 -68,263 -78,509 -16,216
services 16,529 20,448 23,936 28,338 7,865 30,393 31,426 7,966
Exports 41,634 45,749 51,208 54,140 13,719 53,951 57,558 12,632
of which: Transport 14,321 11,749 10,806 2,979 10,149 2,544
tourism 22,026 27,851 33,799 36,718 8,965 36,716 40,247 8,656
Imports -25,105 -25,300 -27,272 -25,802 -5,854 -23,558 -26,133 -4,666
of which: Transport -8,472 -8,953 -8,589 -2,143 -6,981 -1,359
tourism -4,838 -4,579 -4,343 -924 -3,728 -581
Income -6,710 -5,798 -6,448 -5,513 -959 -5,137 -6,065 -1,532
Exports 1,171 1,124 1,068 1,103 155 1,121 1,158 130of which: Income f/ the TF(b)
(prev. year)518 486 373 373 0 373 373 0
Imports -7,881 -6,922 -7,515 -6,616 -1,115 -6,258 -7,222 -1,662of which: Interest on sched. public debt -667 -805 -1,151 -1,213 -351 -1,407 -1,433 -363
Current transfers 28,281 28,463 22,233 20,950 4,941 22,257 20,399 4,862
Official transfers 8,790 5,535 5,084 3,528 842 4,796 2,757 1,102
private transfers 19,492 22,928 17,148 17,422 4,100 17,461 17,642 3,760
of which: Emigrant remittances 10,338 13,381 14,446 2,906 13,762 3,372
2. Capital and financial account 27,944 22,115 23,811 17,312 4,489 16,306 20,399 2,029
Capital account 3,311 985 1,122 -882 120 533 441 389
Capital transfers 3,311 985 1,122 -882 120 533 441 389
Financial account 24,634 21,130 22,689 18,194 4,369 15,773 19,958 1,640
Direct investment 9,645 8,312 4,832 6,120 1,404 3,017 4,411 -534
portfolio investment 458 0 -134 0 20 19 0 0
Other transactions 14,531 12,818 17,990 12,074 2,945 12,737 15,547 2,174of which: Disburs. of loans to gen. gov.
16,488 16,043 18,930 19,737 2,774 17,787 18,635 4,874
Scheduled amortisation
-1,832 -1,778 -1,723 -1,875 -351 -1,811 -1,985 -555
3. Errors and omissions -6,969 -2,454 -3,329 0 -3,942 -6,516 0 -2,746
4. Overall balance: (1)+(2)+(3) 2,253 -4,432 4,026 1,433 1,235 5,502 5,293 -583
5. Financing -2,253 443 -4,026 -1,433 -1,235 -5,502 -5,293 583Change in internat. reserves (increase: - )
-2,185 3,676 -4,026 -1,433 -1,235 -5,502 -5,293 583
Exceptional financing -68 756 0 0 0 0 0 0of which: Drawings from ACC Facility(c)
0 0 0 0 0 0 0 0
Reimb. of ACC Facility(c)
0 0 0 0 0 0 0 0
Change in arrears (increase: +)
-68 756 0 0 0 0 0 0
6. Financing GAp(d): (4)+(5) 0 0 0 0 0 0 0 0
Memo items:
Current account (% of GDp) -13.5 -16.3 -10.9 -10.2 − -2.8 -9.2 −Current and capital account(% of GDp)
-11.1 -15.6 -10.2 -10.8 − -2.4 -9.0 −
International reserves (in months of imports)(e)
4.2 3.2 4.0 4.1 4.1 5.0, 5.0 4.3
Sources: Banco de Cabo Verde, IMF and Banco de Portugal calculations.Notes: (a) Includes sales of fuel to ships and re-exports; (b) Offshore fund (Trust Fund) to support the conversion of domestic debt; (c) Foreign exchange cooperation agreement (Acordo de Cooperação Cambial) between Portugal and Cabo Verde; (d) Net lending (+) / net borrowing (-); (e) Net external assets of Banco de Cabo Verde and imports of goods and services in the year.
Cabo verde

Banco de Portugal • Economic Developments in Portuguese-speaking African Countries and Timor-Leste • 2013 | 2014 36
Table 20 • Merchandise exportsDestinations as a percentage of total exports
2005 2006 2007 2008 2009 2010 2011 2012 2013 2005 to 2013
Germany 0.1 0.0 0.0 0.0 0.0 0.0 0.0 0.0 0.2 0.0 spain 21.3 27.3 20.9 37.2 62.0 72.6 70.2 76.3 67.4 56.8 The Netherlands 0.6 0.6 0.2 0.5 0.5 0.3 0.2 0.2 0.2 0.3 portugal 51.6 49.8 58.3 40.6 33.6 22.7 18.0 16.0 16.2 29.0 UsA 12.3 1.4 1.4 0.4 0.9 1.6 0.5 1.3 1.1 1.9 Other 14.1 20.9 19.2 21.3 3.0 2.8 11.1 6.2 15.0 12.0 Total exports 100.0 100.0 100.0 100.0 100.0 100.0 100.0 100.0 100.0 100.0
Sources: Banco de Cabo Verde, IMF and Banco de Portugal calculations.
Table 21 • Merchandise importsOrigins as a percentage of total exports
2005 2006 2007 2008 2009 2010 2011 2012 2013 2005 to 2013
Germany 0.7 1.1 1.4 1.6 2.3 0.4 0.5 1.0 1.4 1.2 Brazil 8.0 6.4 6.3 5.7 4.5 3.7 2.7 4.0 3.6 4.7 spain 7.6 5.6 4.5 7.3 9.8 10.6 9.9 7.2 7.9 8.0 UsA 2.7 1.4 1.2 0.9 1.0 1.6 0.9 5.3 1.2 1.8
The Netherlands 15.7 11.2 16.3 17.0 16.7 16.8 19.1 15.0 20.8 16.9
portugal 45.6 50.2 45.2 50.3 48.3 51.4 44.7 48.2 43.8 47.5
Other 19.6 24.1 25.1 17.3 17.3 15.4 22.0 19.3 21.4 20.1
total imports 100.0 100.0 100.0 100.0 100.0 100.0 100.0 100.0 100.0 100.0
Sources: Banco de Cabo Verde, IMF and Banco de Portugal calculations.
Table 22 • Public debtCvE millions
2007 2008 2009 2010 2011 2012 2013 May 14
Est. Est. Est. Est. Est.
Total external debt 48,664 51,880 58,210 70,433 84,074 102,404 117,962 121,426
Multilateral creditors 40,391 42,248 46,185 48,274 49,777 53,261 54,159 54,026
Bilateral creditors 8,273 9,632 12,026 22,159 34,297 49,143 63,803 67,400
Government 5,608 7,375 9,846 13,369 18,131 21,800 23,993 24,225
Other 2,665 2,257 2,179 8,790 16,166 27,343 39,810 43,175
total domestic debt 38,991 36,492 38,519 40,907 43,106 45,934 48,618 52,140
of which: Treasury bills 4,285 3,005 1,730 600 1,550 680 682 2,630
Treasury bonds 21,207 20,182 23,870 27,369 28,609 32,254 34,870 36,470
Banking system 16,082 13,421 14,379 15,162 17,236 17,429 20,801 25,067
Non-banking system 11,520 11,682 12,752 14,356 14,482 17,117 16,428 15,685
tCMF (a) 11,389 11,389 11,389 11,389 11,389 11,389 11,389 11,389
(% of GDp)
Total external debt 39.9 38.5 42.8 50.8 56.8 67.9 75.9 74.2
Total domestic debt (excluding TCMF) 22.6 18.6 20.0 21.3 21.4 22.9 24.0 24.9
tCMF 9.3 8.5 8.4 8.2 7.7 7.6 7.3 7.0
total domestic debt (including tCMF) 32.0 27.1 28.3 29.5 29.1 30.5 31.3 31.9
(% of exports of goods and services)
Total external debt 105.9 97.3 128.4 133.1 134.5 152.9 167.5 161.5
Medium and long-term debt service 5.1 4.6 5.5 4.7 4.1 4.3 4.6 4.5
Sources: Banco de Cabo Verde, Ministry of Finance (Cabo Verde), IMF and Banco de Portugal calculations.Notes: (a) Títulos Consolidados de Mobilização Financeira (consolidated financial mobilisation securities).

37
Table 23 • Government operations CvE millions
2010 2011 2012 2013 2014
Est. Est. Est. Budg. Q I Est. l.e.(a) Budg. Q I l.e.(a)
1. total revenue 39,679 37,915 36,385 41,079 8,690 37,420 91.1 44,623 12,326 27.61.1. Current revenue 30,239 33,573 32,183 36,054 8,271 33,629 93.3 39,346 7,984 20.3
Taxes 26,241 29,581 27,268 29,639 6,708 27,500 92.8 32,692 6,726 20.6Income taxes 7,892 8,678 8,311 8,497 2,307 8,325 98.0 9,572 2,110 22.0Taxes on goods and services 12,015 13,840 12,512 14,440 2,970 12,808 88.7 16,159 3,216 19.9
of which: VAT 10,521 11,603 10,405 11,500 2,398 10,522 91.5 12,893 2,536 19.7Taxes on international trans. 5,634 6,228 5,778 5,816 1,267 5,700 98.0 6,129 1,208 19.7Other taxes 701 835 668 885 164 668 75.4 832 191 23.0
social contributions 42 37 43 4 9 38 – 17 10 59.7transfers (public Admin) 0 0 0 26 0 0 – 0 3 –Other revenue 3,956 3,956 4,872 6,386 1,553 6,091 95.4 6,637 1,245 18.8
1.2. Grants 9,440 4,342 4,203 5,021 419 3,791 75.5 5,241 4,342 82.91.3. transf. f/ state owned entrep.(b) 0 0 0 4 0 0 0.0 36 0 0.0
2. Total expenditure(c) 54,060 49,214 52,127 53,578 10,309 51,344 95.8 57,662 22,854 39.62.1. Current expenditure(d) 33,099 34,329 34,464 39,181 7,727 35,720 91.2 43,694 7,968 18.2
of which: From invest. projects 5,602 5,515 4,668 6,379 650 4,477 70.2 8,372 5,515 65.9Compensation of employees 14,810 15,679 15,886 17,761 3,929 16,495 92.9 18,486 4,129 22.3Goods and services 5,171 5,248 4,995 6,591 672 4,757 72.2 8,396 729 8.7Interest 2,173 2,276 2,863 3,681 703 3,426 93.1 4,200 743 17.7
of which: Domestic debt 1,460 1,425 1,715 1,850 314 1,878 101.5 2,266 368 16.2External debt 699 852 1,142 1,753 383 1,489 84.9 1,838 376 20.4
subsidies 752 994 274 434 38 101 23.3 170 31 18.5transfers 4,939 4,309 4,070 4,636 889 4,073 87.9 5,371 862 16.0Social benefits 2,893 3,715 3,918 3,852 1,013 4,148 107.7 3,986 1,047 26.3Other expenditure 2,362 2,107 2,457 2,227 274 2,046 91.8 3,085 216 7.0
of which: Scholarships 455 465 565 585 110 568 97.2 584 75 12.92.2. Investment programme 20,961 14,885 17,663 14,397 2,582 15,624 109 13,968 14,885 106.6
3. Non-financial assets: (3.1-3.2) 248 27 81 -315 3 27 -8.4 198 27 13.43.1. Purchase of non-financial assets 252 97 81 35 3 41 116.0 198 97 48.73.2. Sale of non-financial assets 4 70 0 350 0 14 4.1 1 70 −
4. Current balance: (1.1-2.1) -2,860 -755 -2,281 -3,127 544 -2,090 − -4,348 16 −
5. Overall balance excl. grants: (1-2-3-1.2) -24,069 -15,667 -20,025 -17,205 -2,041 -17,741 − -18,477 -14,896 −
6. Overall balance (commitment basis): (1-2-3)
-14,629 -11,325 -15,823 -12,184 -1,622 -13,950 − -13,237 -10,554 −
7. Financing 14,629 11,325 15,823 12,184 1,572 13,950 − 13,236 11,325 −7.1. Financial assets -1,445 -5,350 -6,645 -7,265 -1,544 -7,718 − -8,244 -5,350 −
Loan repay. to state ow. enterp. 29 58 0 238 0 4 − 354 58 −Loans to state owned enterprises -1,459 -5,362 -5,601 -4,941 -990 -7,175 − -7,652 -5,362 −Shares and other equity -15 -46 -1,044 -1,500 -553 -546 − -500 -46 −Other financial assets 0 0 0 -1,062 0 0 -446 0
7.2. Financial liabilities 16,075 16,676 22,468 19,449 3,116 21,668 − 21,480 16,676 −External (net) 14,524 14,237 17,728 15,724 2,780 19,722 − 17,257 14,237 −
Disbursements 16,498 16,052 19,474 17,724 3,403 21,497 − 19,319 16,052 −Amortisation -1,975 -1,815 -1,746 -2,001 -623 -1,775 − -2,062 -1,815 −
Domestic (net) 1,551 2,439 4,740 3,726 336 1,946 − 4,224 2,439 −Banking system -1,936 2,143 3,849 2,658 1,451 2,350 − 3,186 2,143 −Other 3,486 296 891 1,067 -1,115 -404 − 1,037 296 −
8. Fin. gap/discrepancy(e) : (6+7) 0 0 0 0 -49 0 − 0 771 −
Sources: Banco de Cabo Verde, Ministry of Finance (Cabo Verde), IMF and Banco de Portugal calculations.Notes: (a) Level of budget execution (%); (b) Share of capital expenditure of public enterprises (usually to finance infrastructures related to the activities of these enterprises); (c) Includes expenditure on arrears and expenditure that is not classified; (d) Includes values to settle in 2011 and 2012; (e) Net borrowing (+) / net lending (-).
Cabo verde

Banco de Portugal • Economic Developments in Portuguese-speaking African Countries and Timor-Leste • 2013 | 2014 38Ta
ble
24 •
Mon
etar
y su
rvey
CvE
mill
ions
2009
20
10
2011
20
12
2012
/201
120
13
2013
/201
220
14
2014
p/20
13 2
014
Est.
[1]
[2]
Proj
. Es
t. [1
] [2
] Pr
oj.
[1]
[2]
Mar
ch
May
Exte
rnal
pos
ition
28,4
4229
,417
23,0
6027
,897
21.0
4.2
29,4
2035
,270
26.4
6.0
38,6
199.
52.
537
,345
35,6
37
Fore
ign
asse
ts (n
et)
31,0
6433
,686
26,8
1029
,164
8.8
2.0
36,3
9424
.85.
938
,437
37,1
06
Banc
o de
Cab
o ve
rde
30,4
4532
,505
28,8
3732
,861
14.0
3.5
38,3
6016
.74.
537
,777
39,4
02
Net
fore
ign
asse
ts30
,242
32,4
2728
,752
32,7
7814
.03.
534
,450
38,2
8016
.84.
543
,652
14.0
4.0
37,6
9739
,321
Oth
er a
sset
s (n
et)
203
7886
83-2
.80.
080
-3.8
0.0
8081
Com
mer
cial
ban
ks61
91,
181
-2,0
28-3
,698
82.4
-1.4
-1,9
65-4
6.8
1.4
660
-2,2
96
Med
ium
and
long
-term
lia
bilit
ies
-2,6
22-4
,269
-3,7
50-1
,267
-66.
22.
1-1
,124
-11.
20.
1-1
,091
-1,4
69
Dom
estic
ass
ets
(net
)77
,010
82,2
4592
,589
94,6
932.
31.
810
0,26
510
0,58
66.
24.
810
7,77
37.
15.
310
0,96
110
1,17
7
tota
l dom
estic
cre
dit
93,3
2410
0,33
011
2,32
611
6,45
83.
73.
612
6,31
911
9,95
63.
02.
913
7,20
414
.412
.712
1,39
512
2,34
7
Net
cla
ims
on g
ener
al
gove
rnm
ent
18,7
8416
,848
18,9
9222
,841
20.3
3.3
28,4
5425
,191
10.3
1.9
30,1
3119
.63.
627
,212
28,4
57
of w
hich
: on
Cent
ral
g
over
nmen
t7,
528
5,95
48,
362
12,1
7645
.63.
316
,468
14,2
6817
.21.
717
,872
25.3
2.7
16,9
4118
,126
inve
stm
ent i
n tC
MF (a
)11
,339
11,5
9710
,802
11,1
923.
60.
311
,499
11,1
920.
00.
011
,499
2.7
0.2
11,1
9211
,192
Cred
it to
the
econ
omy
74,5
4083
,481
93,3
3493
,617
0.3
0.2
97,8
6594
,765
1.2
0.9
107,
073
13.0
9.1
94,1
8393
,890
publ
ic e
nter
pris
es18
917
486
382
4-4
.50.
072
1-1
2.5
-0.1
726
708
priv
ate
sect
or74
,351
83,3
0792
,471
92,7
940.
30.
394
,044
1.3
1.0
93,4
5793
,182
Cred
it to
NM
FI0
00
0−
−0
0−
−0
−−
00
Oth
er it
ems
(net
)-1
6,31
4-1
8,08
5-1
9,73
7-2
1,76
5-1
0.3
-1.8
-26,
054
-19,
369
11.0
2.0
-29,
431
-51.
9-7
.4-2
0,43
4-2
1,17
0
tota
l ass
ets
105,
452
111,
662
115,
649
122,
590
6.0
−,12
9,68
513
5,85
610
.8−
146,
392
7.8
−13
8,30
613
6,81
4
Broa
d m
oney
105,
452
111,
662
115,
649
122,
590
6.0
6.0
129,
685
135,
856
10.8
10.8
146,
392
7.8
7.8
138,
306
136,
814
Base
mon
ey26
,830
25,9
2224
,439
32,5
7433
.37.
033
,791
38,4
2718
.04.
843
,201
12.4
3.5
40,1
3141
,549
Curr
ency
in c
ircul
atio
n8,
362
8,51
48,
376
7,88
6-5
.9-0
.47,
553
8,09
62.
70.
29,
125
12.7
0.8
7,52
67,
452
Dem
and
depo
sits
in n
atio
nal
curr
ency
31,5
0535
,050
31,1
1333
,187
6.7
1.8
40,4
1639
,462
18.9
5.1
45,0
2414
.14.
140
,788
40,0
19
Qua
si-m
oney
65,5
8568
,098
76,1
5981
,517
7.0
4.6
81,7
1588
,298
8.3
5.5
92,2
434.
52.
989
,993
89,3
43
tota
l lia
bilit
ies
105,
452
111,
662
115,
649
122,
590
6.0
−12
9,68
513
5,85
610
.8−
146,
392
7.8
−13
8,30
613
6,81
4
Sour
ces:
Banc
o de C
abo V
erde
, IMF a
nd Ba
nco d
e Por
tugal
calcu
lation
s.No
tes: (
a) O
ffsho
re fu
nd (T
rust
Fund
) to s
uppo
rt the
conv
ersio
n of d
omes
tic de
bt by
issu
ing Tí
tulos
Cons
olida
dos d
e Mob
ilizaç
ão Fi
nanc
eira (
cons
olida
ted fin
ancia
l mob
ilisati
on se
curit
ies).
[1] C
hang
e fro
m the
end o
f the p
revio
us ye
ar; [
2] Ch
ange
in pe
r cen
t of th
e init
ial st
ock o
f mon
ey su
pply
(exp
ansio
n / co
ntrac
tion d
eterm
inants
).

39
Table 25 • Interest ratesannual rates, per cent
2007 2008 2009 2010 2011 2012 2013 2014
Dec. Dec. Dec. Dec. Dec. Dec. Mar. Jun. Sep. Dec. Mar. May
Lending rates7 - 30 days 12.84 11.59 12.99 13.91 9.33 11.54 12.33 11.42 12.98 12.46 11.84 12.91
31 - 90 days 9.79 11.80 12.09 11.55 9.38 11.69 12.07 12.77 11.52 11.33 10.90 11.36
91 - 180 days 10.78 10.17 11.26 11.80 9.04 10.11 10.03 10.14 11.17 11.20 10.57 10.57
181 days - 1 year 9.83 9.33 9.30 9.04 9.52 9.31 9.41 9.18 8.47 8.97 9.45 9.02
1 - 2 years 11.81 11.82 10.69 10.08 10.13 10.03 10.88 10.51 10.43 10.38 10.46 10.68
2 - 5 years 12.03 11.15 10.84 10.05 10.07 10.21 10.14 9.99 10.22 10.46 10.66 10.77
5 - 10 years 10.71 10.27 10.20 10.23 9.55 9.51 9.27 9.40 9.49 9.47 9.66 9.72
Over 10 years 10.77 10.43 10.12 9.83 9.22 8.83 8.79 8.80 8.84 8.91 8.83 8.80
Overdraft 16.04 15.38 14.95 15.72 16.27 16.30 16.55 16.51 18.31 17.85 18.02 18.07
Deposit rates
Residents
7 - 30 days 4.10 3.06 3.01 2.94 2.91 3.35 3.39 3.38 4.59 4.43 2.00 2.53
31 - 90 days 3.05 2.83 3.40 3.39 3.40 4.08 4.40 4.20 4.22 4.26 4.19 3.90
91 - 180 days 3.69 3.85 4.26 4.10 4.04 4.13 4.04 4.00 4.14 4.15 3.73 3.61
181 days - 1 year 4.16 4.15 4.14 4.53 4.22 3.80 4.27 4.28 4.28 4.29 4.33 4.34
1 - 2 years 4.17 4.19 4.47 4.14 4.67 4.85 5.18 5.39 4.93 4.91 4.90 4.83
Non-residents
7 - 30 days 2.25 2.21 1.62 2.98 2.98 2.06 2.20 2.16 4.24 4.01 2.35 2.59
31 - 90 days 3.56 3.81 1.81 2.88 3.13 4.06 3.52 3.89 3.39 3.75 2.78 2.53
91 - 180 days 3.99 3.99 3.52 3.92 3.76 3.77 4.03 3.88 4.07 3.85 3.78 3.50
181 days - 1 year 4.31 4.19 3.96 3.91 3.98 3.42 4.01 4.05 4.04 4.12 4.22 3.91
1 - 2 years 4.08 4.14 4.59 4.66 4.72 5.09 5.29 5.60 5.24 4.79 5.08 4.95
Emigrants
7 - 30 days 3.70 3.42 3.49 3.49 3.49 1.76 1.77 1.77 4.28 4.31 2.54 2.36
31 - 90 days 3.41 3.43 3.48 3.51 3.52 5.56 5.47 5.48 4.25 4.49 3.42 3.34
91 - 180 days 4.20 4.13 4.08 4.10 4.22 4.04 4.45 4.32 4.34 4.33 3.67 4.68
181 days - 1 year 4.33 4.32 3.71 4.14 4.17 3.69 4.15 4.15 4.16 4.17 4.13 4.17
1 - 2 years 4.36 4.25 4.44 4.93 4.99 5.48 5.63 5.63 5.48 5.42 5.40 5.32
Reference rates
BCv instruments
Rediscount 8.50 7.50 7.50 7.50 7.50 9.75 9.75 9.75 9.75 9.75 8.25 8.25
Liquidity provision 7.50 8.25 8.25 7.25 7.25 8.75 8.75 8.75 8.75 8.75 7.25 7.25
Liquidity absorption 1.00 2.75 2.75 1.75 1.75 3.25 3.25 3.25 1.00 1.00 1.00 1.00
TRM (14 days) 4.00 5.25 5.25 4.25 4.25 5.75 5.75 3.49 2.16 0.64 0.73
Treasury bills
91 days 3.40 3.59 4.00 4.10 3.63 1.50
182 days 3.49 4.19 1.94
364 days 3.49 4.50
Memo item:Inflation (e-o-p % change) 3.97 6.69 -0.37 3.43 3.58 4.15 2.59 1.19 1.09 0.08 0.59 -0.17
Sources: Banco de Cabo Verde and Banco de Portugal calculations.Notes: Lending and deposit rates shown refer to effective interest rates by calculating average rates weighted by the amounts of credit / investments regarding lending / deposit operations applied to residents, non-residents and emigrants.
Cabo verde

Banco de Portugal • Economic Developments in Portuguese-speaking African Countries and Timor-Leste • 2013 | 2014 40
Table 26 • Exchange ratesaverage rates
EERI(a)
Index, 100: 2000
USD/CVE Nominal Real
2001 123.21 101.59 100.47
2002 117.26 103.41 100.28
2003 97.80 105.53 99.60
2004 88.74 105.91 95.64
2005 88.65 104.42 92.31
2006 87.93 103.67 94.35
2007 80.62 103.47 96.16
2008 75.34 103.46 99.75
2009 79.38 103.75 101.01
2010 83.28 102.45 100.14
2011 79.28 102.43 101.01
2012 85.84 103.00 101.33
2013 83.07 104.01 102.52
2012 January 85.58 102.38 99.76
February 83.47 102.26 100.09
March 83.51 102.57 99.34
April 83.77 102.80 99.54
May 86.01 103.10 100.87
June 88.02 103.19 101.45
July 89.69 102.96 101.99
August 89.05 103.04 101.83
september 85.89 103.31 102.21
October 85.01 103.39 102.73
November 85.98 103.44 102.92
December 84.10 103.66 103.41
2013 January 83.09 103.58 103.97
February 82.45 103.40 102.94
March 84.95 103.20 100.87
April 84.81 103.31 100.98
May 84.92 103.41 100.90
June 83.64 104.04 101.49
July 84.31 104.26 102.23
August 82.83 104.70 103.53
september 82.70 104.49 103.42
October 80.91 104.37 103.07
November 81.72 104.65 103.33
December 80.54 104.94 103.86
2014 January 80.95 105.02 104.64
February 80.82 105.05 104.56
March 79.76 104.96 102.88
April 79.84 104.63 101.43
May 80.23 104.54 101.39
June 81.14 104.50 101.42
Sources: Banco de Cabo Verde and Banco de Portugal calculations.Notes: (a) Effective exchange rate index (EERI), calculated on the basis of official exchange rates applied to the currencies of Cabo Verde's four main trading partners over the period 2005 − 2009 (appreciation: +; depreciation: -).

3. guINEa-BIssauArea: 36,125 Km2
Capital city: Bissau
Population: 1,716 thousand (2013; source: ONU)
Currency: CFA franc
Political instability continued to affect Guinea-Bissau’s economy in 2013, which grew modestly, accompanied by a generalised drop in prices. In spite of decreased support from development partners, the external accounts showed signs of recovering from the imbalances seen in the previous year, while public finances deteriorated, mainly due to weak revenue collection, resulting in an accumulation of arrears and an increase in external debt.

Banco de Portugal • Economic Developments in Portuguese-speaking African Countries and Timor-Leste • 2013 | 2014 42
3.1. Guinea-Bissau overviewThroughout 2013, economic developments in Guinea-Bissau continued to be affected by the April 2012 political instability. Nevertheless, the economy showed some signs of recovering from the previous year, with gross domestic product increasing by 0.3 per cent. The elec-tion of a new President of the Republic and a new National Popular Assembly as a result of the general elections that took place in the first half of 2014 is expected to help normalise the country’s political climate and create the con-ditions needed for a stronger economic reco-very. The latest forecasts from the International Monetary Fund (IMF) predict growth of 2.7 per cent this year. More optimistic forecasts for economic developments are also supported by more favourable price prospects for cashew nuts, Guinea-Bissau’s main export. Support by traditional donors is expected to return, after decreasing markedly as a result of the country’s political situation, and to be another factor dri-ving economic growth in 2014.
Weak economic performance and subdued domestic demand in the past few years help explain the stronger downward trend in overall prices that started in mid-2011, to such an extent that the economy recently started experiencing deflation. Nevertheless, prices are expected to recover in the second half of this year, in view of a more optimistic outlook for the economy.
The external accounts improved somewhat from 2012, in spite of a decrease in support from the country’s development partners. The
trade deficit (although affected by a sharp drop in the international price of cashew nuts) registe-red a decrease and the current account balance improved considerably. In addition, a recovery in foreign direct investment and other investment categories resulted in the balance of payments returning to a surplus. The external transac-tions balance is projected to remain positive and fairly stable in 2014 compared with 2013, with the increase in the trade deficit expected to be financed by a recovery in grants and new disbursements.
The improvement in the external accounts resulted in an accumulation of foreign exchan-ge reserves, which had clearly declined in 2012, markedly contributing to a decrease in broad money. As a result of this recovery and mode-rate growth in domestic credit, broad money returned to growth in 2013, in the absence of inflationary pressures. This growth in broad money extended into April 2014, although pro-jections point to a new contraction.
Developments in public finances were less posi-tive (particularly revenue collection, mainly due to a decrease in grants and tax revenue). In spite of the fiscal restraint efforts, public deficit wor-sened from 2012, resulting in an accumulation of arrears, having a negative effect on external public debt. Revenue collection is expected to recover considerably in 2014 and thereby fund a significant increase in expenditure (particularly public investment). At the end of the year, the fiscal deficit is expected to increase slightly (0.3 percentage points) from 2013.
Table 27 • Main economic indicators
2010 2011 2012 2013 2014
Est. Est. Est. Est. Proj.
Real GDP (annual % change) 4.5 5.3 -1.5 0.3 2.7
Inflation (end-of-period % change) 5.6 3.4 1.7 -0.1 2.8
Broad money (annual % change) 29.6 39.1 -6.0 14.8 -4.8
Current account (% of GDp) -8.4 -1.4 -9.1 -4.9 -4.9
Fiscal balance (% of GDp) -0.2 -0.6 -2.7 -3.4 -3.7
External public debt (% of GDP) 35.3 30.1 33.0 33.5 −
Sources: BCEAO branch in Guinea-Bissau and International Monetary Fund.

43
Table 28 • Main economic indicators
2009 2010 2011 2012 2013 2014
Est. Est. Est. Proj. Est. Proj. Est.
Output and prices
Nominal GDp Billions of CFA francs 390.5 418.5 465.1 469.0 501.0 480.4 505.6
EUR millions 595.3 638.0 709.0 714.9 763.8 732.4 770.8
Real GDp annual % change 3.4 4.5 5.3 -1.5 3.5 0.3 2.7
Inflation (Consumer Price Index) end-of-period % change -4.5 5.6 3.4 1.7 1.7 -0.1 2.8 -1.9 Jun.
average % change -2.4 2.3 5.0 2.1 2.6 0.7 2.5 -0.5 Jun.
Public finances
total revenue % of GDp 25.0 20.2 19.5 15.1 14.7 11.2 14.2
Total expenditure % of GDp 21.3 20.4 20.1 17.9 14.8 14.5 17.8
Overall balance % of GDp 3.7 -0.2 -0.6 -2.7 -0.1 -3.4 -3.7
Overall balance without grants % of GDp -12.2 -9.8 -8.8 -8.1 -4.5 -6.0 -8.1
Money and credit
Net claims on government annual % change -114.0 n/a 183.3 90.7 -8.4 1.5 -25.8 5.4 Apr.(d)
Credit to the economy annual % change 24.9 56.4 48.3 27.2 14.6 3.6 19.4 -8.9 Apr.(d)
Broad money (M2) annual % change 6.8 29.6 39.1 -6.0 3.1 14.8 -4.8 8.6 Apr.(d)
Interest rates
Deposit (1-year) annual rate 3.0 3.0 3.0 3.0 3.0 3.0
Lending (1-year) annual rate 10.0 11.0 11.0 11.0 11.0 11.0
Balance of payments
Exports f.o.b. annual % change -5.2 15.8 57.8 -41.4 25.5 5.5 8.2
Imports f.o.b. annual % change 7.4 8.5 8.3 -19.1 19.3 -4.4 14.1
Current account % of GDp -5.7 -8.4 -1.4 -9.1 -5.2 -4.9 -4.9
Current account excl. official transf.(a) % of GDp -13.0 -10.8 -5.1 -11.6 -9.0 -5.7 -7.0
External debt
total stock UsD millions 1,048.2 298.2 293.1 302.7 270.3 326.0
% of GDp 126.7 35.3 30.1 33.0 27.0 33.5
% of exports(b) 678.0 174.7 104.9 197.7 123.5 195.2
Debt service % of exports(b) 4.6 5.8 0.3 0.5 1.7 1.0
Exchange rates
Bilateral rate EUR/CFA franc (official market)
average rate 656.0 656.0 656.0 656.0 656.0 656.0 Jun.
Bilateral rate UsD/CFA franc (official market)
average rate 472.2 495.0 477.5 510.5 494.1 479.0 Jun.
Nominal EERI (Index, 100: 2000)(c)
annual % change 1.5 -4.5 5.3 1.2 5.9 -1.5 Jun.(d)
Real EERI (Index, 100: 2000)(c) annual % change -3.8 -4.4 2.6 -0.5 4.1 -2.7 Jun.(d)
Sources: BCEAO branch in Guinea-Bissau, International Monetary Fund and Banco de Portugal calculations.Notes: (a) Official transfers exclude revenue from fishing licences; (b) Exports of goods and services; (c) Effective Exchange Rate Index (EERI), calculated on the basis of official exchange rates applied to the currencies of Guinea-Bissau's four main trading partners over the period from 2005 to 2009; (d) Changes from the previous December.
guinea-Bissau

Banco de Portugal • Economic Developments in Portuguese-speaking African Countries and Timor-Leste • 2013 | 2014 44
Table 29 • Gross domestic productCurrent prices, billions of Cfa francs
2009 2010 2011 2012 2013 2014
Est. Est. Est. Proj.
Primary sector 170.4 188.7 211.4 216.0 223.8 233.7
Agriculture, forestry and fishing 170.4 188.7 211.4 216.0 223.8 233.7
Secondary sector 49.9 53.2 57.2 56.4 59.1 63.1
Industry(a) 46.7 48.5 51.9 51.3 53.6 56.6
Construction 3.2 4.7 5.2 5.1 5.5 6.5
Tertiary sector 150.8 153.1 170.7 171.2 172.8 183.0
Trade, restaurants and hotels 80.1 74.6 83.5 80.8 82.9 87.6
transportation and communication 15.9 16.9 18.9 18.0 19.0 20.1
public administration 40.5 46.3 51.3 54.8 52.6 55.9
Banking, insurance and other services 14.3 15.3 16.9 17.6 18.3 19.3
Gross Domestic product (at factor cost) 371.1 395.0 439.2 443.6 455.6 479.8
Indirect taxes 19.4 23.5 25.9 25.3 24.8 25.8
Gross Domestic product (at market prices) 390.5 418.5 465.1 469.0 480.4 505.6
Consumption 429.3 454.0 458.3 493.2 495.5 526.7
public 54.0 57.5 58.7 61.6 51.4 58.9
private 375.3 396.5 399.6 431.6 444.1 467.8
Investment 24.6 28.1 33.8 27.5 26.6 31.2
public 17.1 18.1 19.4 14.8 13.3 16.6
private 7.5 10.0 14.4 12.7 13.3 14.6
Domestic demand 453.9 482.1 492.1 520.6 522.0 557.9
Exports 73.0 84.5 133.4 78.2 82.5 89.3
Overall demand 526.9 566.6 625.5 598.8 604.5 647.2
Imports 136.5 148.1 160.4 129.8 124.1 141.6
Memo items:
Gross domestic savings -38.9 -35.5 6.8 -24.2 -15.0 -21.1
Nominal GDpmp (UsD millions) 827.0 845.5 974.1 918.6 972.4 1,055.6
GDPmp deflator (annual % change) -2.4 2.6 5.5 2.3 2.1 2.5
Nominal GDPmp (annual % change) 0.9 7.2 11.1 0.8 2.4 5.2
Real GDPmp (annual % change) 3.4 4.5 5.3 -1.5 0.3 2.7
Sources: BCEAO branch in Guinea-Bissau, International Monetary Fund and Banco de Portugal calculations.Notes: (a) Includes electricity and water.

45
Table 30 • Consumer price indexper cent
Monthly change Cumulative change Year-on-year change Average change
[1] [2] [3] [4]
2000 December 16.7 16.7 8.6
2001 December -1.9 -1.9 3.3
2002 December -0.5 -0.5 1.8
2003 December 0.7 0.7 -5.0
2004 December 2.9 2.9 0.9
2005 December 0.3 0.3 3.4
2006 December 3.2 3.2 2.0
2007 December 9.3 9.3 4.6
2008 December 4.6 4.6 7.9
2009 December -4.5 -4.5 -2.4
2010 December 5.6 5.6 2.3
2011 December 3.4 3.4 5.0
2012 December 1.7 1.7 2.1
2013 December -0.1 -0.1 0.7
2012 January 0.2 0.2 2.1 4.8
February 0.1 0.4 3.1 4.7
March -0.3 0.0 2.2 4.5
April 0.9 0.9 2.0 4.1
May 1.4 2.3 2.2 3.7
June 0.5 2.8 1.7 3.3
July -0.3 2.5 1.6 2.8
August 0.2 2.7 2.2 2.7
september 0.4 3.0 2.2 2.5
October -1.3 1.7 2.3 2.4
November 0.3 2.0 2.3 2.3
December -0.3 1.7 1.7 2.1
2013 January 0.1 0.1 1.6 2.1
February 0.3 0.4 1.7 2.0
March 0.0 0.4 2.1 2.0
April -0.4 0.0 0.7 1.9
May 0.4 0.4 -0.2 1.7
June -0.2 0.2 -0.8 1.4
July 0.6 0.7 0.0 1.3
August 0.8 1.6 0.6 1.2
september -0.4 1.2 -0.1 1.0
October 0.6 1.8 1.8 0.9
November -0.5 1.3 1.0 0.8
December -1.4 -0.1 -0.1 0.7
2014 January -0.3 -0.3 -0.5 0.5
February -1.4 -1.7 -2.1 0.2
March -0.4 -2.1 -2.5 -0.2
April 0.8 -1.3 -1.4 -0.4
May 0.5 -0.8 -1.3 -0.4
June -0.8 -1.6 -1.9 -0.5
Sources: BCEAO branch in Guinea-Bissau and Banco de Portugal calculations.Notes: [1] month (n) / month (n-1); [2] month (n) / previous December; [3] month (n) / month (n) of the previous year; [4] last 12 months / previous 12 months.
guinea-Bissau

Banco de Portugal • Economic Developments in Portuguese-speaking African Countries and Timor-Leste • 2013 | 2014 46
Table 31 • Balance of paymentsBillions of Cfa francs
20102011 2012 2013 2014
Est. Est. Proj. Est. Proj.
Current account -35.0 -6.6 -42.5 -26.3 -23.6 -25.0
Excluding official transfers(a) -45.3 -23.9 -54.4 -45.2 -27.4 -35.6trade balance -34.6 -1.0 -25.7 -32.4 -19.9 -29.3
Exports (f.o.b.) 62.7 112.3 67.1 79.4 71.0 77.3Imports (f.o.b.) -97.3 -113.3 -92.8 -111.8 -90.9 -106.6
services -29.0 -26.0 -25.9 -29.6 -21.7 -23.0Income -1.1 -8.7 -16.9 -0.4 -7.5 -4.3
of which: Scheduled interest -0.9 -0.7 -0.3 -0.4 -1.5 -1.8Current transfers 29.7 29.1 26.0 36.2 25.5 31.6
public 15.5 17.3 11.9 18.9 3.8 10.6of which: Balance of payments support 9.4 12.4 11.9 12.0 3.8 10.6
Fishing licences 5.2 - 0.0 0.0 0.0 0.0private 14.2 11.8 14.1 17.3 21.7 21.0
Capital and financial account 49.3 35.7 14.1 24.3 30.9 37.2
Capital account 490.4 27.0 15.9 8.0 8.9 12.3
Capital transfers 490.4 27.0 15.9 - 8.9 12.3of which: Debt relief 454.0 0.0 0.0 - 0.0 0.0
Financial account -441.0 8.7 -1.8 16.3 22.0 24.9
public administration − Medium/long-term loans -450.8 9.8 7.6 4.7 9.1 14.5
of which: Disbursements 4.7 10.2 7.6 5.0 9.2 16.7
Amortisation -455.5 -0.4 0.0 -0.3 -0.1 -2.2
Other assets (net) 9.8 -1.1 -9.3 11.6 12.9 10.4
of which: Foreign direct investment 13.7 11.4 3.5 0.0 7.0 9.0
Other investment − Other sectors -4.0 -12.5 -12.8 11.6 5.1 0.4
Errors and omissions -2.1 -2.3 -4.8 0.0 3.0 0.0
Overall balance 12.2 26.8 -33.2 -2.0 10.3 12.2
Financing -12.2 -26.8 33.2 2.0 -10.3 -12.2Change in official reserves (increase: -)(b) -11.4 -26.8 33.2 2.0 -10.3 -12.2Change in arrears (decrease: -) -0.8 0.0 0.0 0.0 0.0 0.0
Sources: BCEAO branch in Guinea-Bissau, International Monetary Fund and Banco de Portugal calculations.Notes: (a) Revenue from fishing licences is not considered official transfers; (b) Includes the effects of exchange rate fluctuations.

47
Table 32 • Merchandise exportsBy country of destination, as a percentage of total
2005 2006 2007 2008 2009 2010 2011 2012 2005 to 2012
Cabo verde 0.6 0.1 0.0 0.1 0.1 0.1 0.0 0.0 0.1China 0.1 0.0 0.0 0.2 0.2 0.9 0.7 0.7 0.4France 0.0 0.0 0.2 0.3 0.8 1.3 0.6 0.0 0.4The Gambia 0.0 0.0 0.0 0.0 0.0 0.0 0.0 0.0 0.0India 61.5 51.6 62.5 75.5 65.5 57.2 66.4 62.6 63.6Netherlands 0.1 0.0 0.1 0.1 0.4 0.3 0.0 0.1 0.1portugal 1.8 0.5 6.2 1.3 1.5 1.7 0.7 0.1 1.6senegal 0.4 22.5 26.2 17.4 26.9 26.2 16.3 22.4 19.7singapore 14.9 22.8 1.5 2.1 0.0 0.8 6.7 5.0 5.9Other 20.5 2.4 3.3 3.0 4.6 11.3 8.6 9.2 8.0
Sources: BCEAO branch in Guinea-Bissau, International Monetary Fund and Banco de Portugal calculations.
Table 33 • Merchandise importsBy country of origin, as a percentage of total
2005 2006 2007 2008 2009 2010 2011 2012 2005 to 2012
China 2.3 1.6 0.3 2.4 2.6 2.9 2.9 1.3 2.1spain 1.1 0.9 1.7 4.7 4.0 1.3 2.2 1.7 2.2France 4.5 2.6 0.8 3.2 4.1 8.0 4.5 3.4 4.0The Gambia 1.4 7.4 1.9 1.3 0.9 0.8 0.5 1.0 1.7India 0.6 0.3 1.7 0.3 0.3 0.7 0.5 3.6 1.0Japan 0.7 0.7 1.9 1.5 2.9 3.1 2.4 0.6 1.8Netherlands 8.0 6.3 2.1 3.4 6.4 3.9 2.8 3.2 4.3portugal 21.0 16.1 17.1 23.4 24.4 23.6 27.1 25.1 22.7senegal 45.6 44.5 43.3 28.4 25.8 33.5 27.0 30.2 33.8Other 14.9 19.8 29.1 31.4 28.8 22.2 30.1 29.9 26.3
Sources: BCEAO branch in Guinea-Bissau, International Monetary Fund and Banco de Portugal calculations.
Table 34 • External public debt usD millions
2009 2010 2011 2012 2013
Medium and long-term debt 1,047.1 297.1 292.0 301.7 325.0Multilateral creditors 493.2 125.1 113.7 135.0 152.7Bilateral creditors 553.9 171.9 178.2 166.7 172.2
Short-term debt 1.1 1.1 1.1 1.1 1.0Total external debt 1,048.2 298.2 293.1 302.7 326.0
of which: Arrears 571.9 0.0 8.1 7.6 7.9Scheduled medium and long-term debt service 7.0 9.9 0.9 0.8 1.6
principal 5.2 7.7 0.6 0.6 0.6Interest 1.8 2.2 0.3 0.2 1.1
(% of exports of goods and services)Total external debt 678.0 174.7 104.9 197.7 195.2Scheduled medium and long-term debt service 4.6 5.8 0.3 0.5 1.0
principal 3.4 4.5 0.2 0.4 0.3Interest 1.2 1.3 0.1 0.1 0.6
(% of GDp)Total external debt 126.7 35.3 30.1 33.0 33.5
Sources: BCEAO branch in Guinea-Bissau, International Monetary Fund and Banco de Portugal calculations.Notes: Figures from 2009 on reflect the impact of debt relief under the HIPC initiative and the MDRI.
guinea-Bissau

Banco de Portugal • Economic Developments in Portuguese-speaking African Countries and Timor-Leste • 2013 | 2014 48
Table 35 • Government operationsBillions of Cfa francs
2009 2010 2011 2012 2013 2014
Est. Est. Est. Est. Budg. Est. l.e.(a) Budg.
1. total revenue 97.5 84.6 90.7 71.0 73.8 53.6 72.6 71.6
1.1. Current revenue 35.4 44.6 52.6 46.0 51.7 41.2 79.7 49.0
Non-tax revenue 8.8 11.5 12.3 7.1 6.5 5.8 89.2 7.3
of which: Fishing licences 3.0 5.2 - 0.0 0.1 0.0 0.0 0.0
Tax revenue 26.6 33.1 40.3 38.9 45.2 35.4 78.3 41.7
1.2. Grants 62.1 40.0 38.1 25.0 22.1 12.4 56.1 22.6
of which: Projects 33.6 30.6 25.7 15.9 10.1 8.6 85.1 12.0
Budget support 28.5 9.4 12.4 9.1 12.0 3.8 31.7 10.6
2. Total expenditure 83.2 85.5 93.3 83.9 74.1 69.9 94.3 90.1
2.1. Current expenditure 47.2 49.3 56.3 62.2 55.5 51.9 93.5 59.5
Compensation of employees 20.5 20.7 23.6 25.1 25.6 24.2 94.5 25.0
transfers 11.0 10.7 11.8 12.8 11.7 12.9 110.3 14.0
Scheduled debt interest 1.8 0.7 0.4 0.1 0.5 0.0 0.0 0.6
Other expenditure 13.9 17.2 20.5 24.2 17.7 14.8 83.6 19.9
2.2. Capital expenditure 36.0 36.2 37.0 21.7 18.5 18.0 97.3 30.6
3. Current balance: (1.1.) - (2.1.) -11.8 -4.7 -3.7 -16.2 -3.8 -10.7 – -10.5
4. Overall balance excl. grants: (1.) - (2.) - (1.2.) -47.8 -40.9 -40.7 -37.9 -22.4 -28.7 – -41.1
5. Overall balance: (1.) - (2.) (commitment basis)
14.3 -0.9 -2.6 -12.9 -0.3 -16.3 – -18.5
6. Change in arrears -3.6 -7.7 -3.5 2.9 0.0 3.1 0.0
6.1. Domestic -4.9 -7.7 -3.5 2.9 0.0 3.1 0.0
6.2. External 1.3 0.0 0.0 0.0 0.0 0.0 0.0
7. Items in transit, errors and omissions 0.0 -1.6 -6.4 -3.8 0.0 -1.6 0.0
8. Overall balance: (5.) + (6.) + (7.) (cash basis) 10.7 -10.3 -12.5 -13.8 -0.3 -14.8 -18.5
9. Financing -10.7 10.3 12.6 13.8 0.3 14.8 18.5
9.1. Domestic (net) -10.5 7.1 3.5 9.0 -4.4 5.7 4.0
of which: Banking system -10.5 7.1 3.5 9.0 -4.4 5.7 4.0
9.2. External (net) -0.2 3.2 9.1 4.8 4.7 9.1 14.5
of which: Disbursements 1.0 4.7 9.4 5.0 5.0 9.2 16.7
of which: Amortisation -10.7 -455.5 -0.4 -0.2 -0.3 -0.1 -2.2
of which: Debt relief 5.7 454.0 0.0 0.0 0.0 0.0 0.0
10. Financing gap(b) 0.0 0.0 0.0 0.0 0.0 0.0 0.0
Sources: BCEAO branch in Guinea-Bissau, International Monetary Fund and Banco de Portugal calculations.Notes: (a) Level of budget execution: as a percentage of budgeted amounts; (b) Net lending (+)/net borrowing (-).

49
Table 40 • Monetary surveyBillions of Cfa francs
2009 2010 2011 20122013 2013/2012 2014 Apr. 2014/2013 2014
Proj. Est. [1] [2] Apr [1] [2] Proj.
Net foreign assets 80.6 93.3 119.3 84.5 82.1 94.9 12.2 6.3 128.8 35.7 18.1 79.8
Central Bank 61.4 64.4 95.4 65.0 63.0 72.1 10.9 4.4 93.7 30.0 11.6 61.3
Commercial banks 19.2 28.9 23.9 19.5 19.1 22.8 16.6 2.0 35.1 54.0 6.6 18.5
total domestic credit 20.2 38.0 61.7 85.6 93.2 88.3 3.1 1.6 83.5 -5.3 -2.5 95.6
Net claims on government -1.6 4.0 11.2 21.4 19.6 21.7 1.5 0.2 22.9 5.4 0.6 16.1
Credit to the economy 21.8 34.0 50.5 64.2 73.6 66.6 3.6 1.4 60.7 -8.9 -3.2 79.5
Other assets (net) -4.7 -6.7 -7.7 -7.3 -7.5 3.8 – 6.8 -9.3 -347.6 -7.0 2.5
total assets 96.1 124.6 173.3 162.8 167.8 186.9 14.8 203.0 8.6 177.9
Broad money (M2) 96.1 124.6 173.3 162.8 167.8 186.9 14.8 203.0 8.6 177.9
Currency in circulation 57.1 64.1 85.5 83.4 86.3 90.9 9.1 109.3 20.2 91.5
Demand deposits 33.1 49.3 63.4 53.8 58.6 72.3 34.4 71.1 -1.786.4*Quasi-money / time
deposits5.8 11.1 24.3 25.6 22.9 23.7 -7.7 22.6 -4.6
total liabilities 96.1 124.6 173.3 162.8 167.8 186.9 14.8 203.0 8.6 177.9
Sources: BCEAO branch in Guinea-Bissau, BCEAO, International Monetary Fund and Banco de Portugal calculations.Notas: [1] Percentage change from the end of the previous year; [2] Percentage change from the broad money at the end of the previous year (liquidity expansion/contraction factors).*The figure shown corresponds to the amount of demand deposits and quasi-money/time deposits due to lack of broken-down data.
Table 41 • Interest ratesannual rates, per cent
2009 2010 2011 2012 2013
Dec. Dec. Dec. Dec. Dec.
DepositsTime deposits:
Up to 90 days 1.5 1.5 1.5 1.5 1.5
91-180 days 1.80 1.75 1.75 1.75 1.75
181-365 days 3.0 3.0 3.0 3.0 3.0
Credit
Up to 90 days 13.0 13.0 12.0 12.0 12.0
90-180 days 12.0 8.0 10.0 10.0 10.0
181-365 days 10.0 11.0 11.0 11.0 11.0
Overdraft on demand deposits 18.0 18.0 18.0 18.0 18.0
Central Bank operations
Banking system
Discount rate 4.25 4.25 4.25 4.00 3.50
Reserve ratio 3.0 7.0 7.0 5.0 5.0
Memo item:
Inflation (end-of-period % change) -4.5 5.6 3.4 1.7 -0.1
Sources: BCEAO branch in Guinea-Bissau and International Monetary Fund.
guinea-Bissau

Banco de Portugal • Economic Developments in Portuguese-speaking African Countries and Timor-Leste • 2013 | 2014 50
Table 42 • Exchange ratesaverage rates
EERI(a)
Index 100: 2000
EUR/XOF USD/XOF INR/XOF Nominal Real
2000 655.96 711.64 15.87 100.00 100.00
2001 655.96 732.89 15.54 100.74 99.96
2002 655.96 696.87 14.33 103.58 101.89
2003 655.96 581.54 12.48 108.65 99.03
2004 655.96 528.28 11.67 111.19 99.33
2005 655.96 527.57 11.97 110.21 98.97
2006 655.96 523.13 11.56 111.54 98.59
2007 655.96 479.50 11.63 111.32 98.36
2008 655.96 448.19 10.34 115.92 104.27
2009 655.96 472.15 9.76 118.27 103.72
2010 655.96 494.96 10.83 114.07 98.29
2011 655.96 477.45 10.13 116.75 100.05
2012 655.96 510.54 9.57 119.07 99.92
2013 655.96 494.09 8.47 124.15 101.50
2012 January 655.96 508.37 9.93 117.55 99.56
February 655.96 496.08 10.08 116.93 98.84
March 655.96 496.92 9.86 117.84 98.73
April 655.96 498.40 9.62 118.84 100.07
May 655.96 513.07 9.42 119.71 102.46
June 655.96 523.69 9.35 120.02 102.86
July 655.96 533.87 9.63 118.79 100.71
August 655.96 529.04 9.53 119.24 100.25
september 655.96 510.33 9.36 119.95 100.35
October 655.96 505.60 9.53 119.24 97.71
November 655.96 511.39 9.33 120.11 98.75
December 655.96 499.67 9.15 120.91 99.29
2013 January 655.96 493.71 9.10 121.13 100.09
February 655.96 490.98 9.12 121.05 100.13
March 655.96 506.10 9.30 120.25 99.19
April 655.96 504.00 9.27 120.37 99.76
May 655.96 505.08 9.18 120.78 100.46
June 655.96 497.40 8.52 123.94 103.17
July 655.96 501.55 8.39 124.57 101.60
August 655.96 492.86 7.81 127.67 103.99
september 655.96 491.49 7.69 128.36 103.28
October 655.96 481.11 7.81 127.70 102.39
November 655.96 486.16 7.76 127.96 102.31
December 655.96 478.69 7.74 128.10 103.39
2014 January 655.96 481.97 7.76 127.96 101.84
February 655.96 480.24 7.72 128.19 101.22
March 655.96 474.54 7.78 127.85 100.26
April 655.96 474.88 7.87 127.36 100.57
May 655.96 477.68 8.06 126.34 100.40
June 655.96 484.51 8.08 126.22 100.60
Sources: BCEAO branch in Guinea-Bissau, European Central Bank, International Monetary Fund and Banco de Portugal calculations.Notes:(a) Effective Exchange Rate Index (EERI), calculated on the basis of official exchange rates applied to the currencies of Guinea-Bissau's four main trading partners over the period from 2005 to 2009. An increase / decrease in the EERI (nominal or real) corresponds to an appre-ciation / depreciation of the CFA franc.

4. MOzaMBIquEArea: 799,380 Km2
Capital city: Maputo
Population: 23.2 million (2013; source: Mozambique National Institute of Statistics)
Currency: Metical
Growth in Mozambique continued to be high in 2013, with the contribution of large-scale projects, manily through the natural gas sector and coal exports. The considerable current account deficit, although smaller than in 2012, was compensated by foreign direct investment and the State’s external indebtedness. Such inflows allowed foreign exchange reserves to accumulate and, in view of the accommodative stance of monetary policy, in a context of restrained inflation, resulted in an expansion of credit to the economy.

Banco de Portugal • Economic Developments in Portuguese-speaking African Countries and Timor-Leste • 2013 | 2014 52
4.1. Mozambique overviewIn 2013 Mozambique’s economy showed once more a high pace of growth (7.4 per cent), in spi-te of the floods early in the year, standing among the most dynamic economies in Sub-Saharan Africa. During the last decade, real growth in Mozambique has averaged 7.4 per cent, clearly above the 4.8 per cent for the countries, as a whole, of the Southern African Development Community (SADC), of which it is a member.
The country’s macroeconomic stabilisation pro-cess has been continuously supported by the IMF. A three-year programme is in force, signed in June 2013, under the IMF’s Policy Support Instrument (psI).
Although maintaining a high pace of investment, mainly large-scale projects in the natural resour-ces sector, economic activity in 2013 seems to have been spurred by consumption and goods exports, in spite of the resulting increase in imports of capital and consumer goods.
Import growth has boosted public revenue (VAT and taxes on international trade), which have also benefitted from capital gains taxes from the sale of shares in the gas sector. However, in spite of some containment in current expendi-ture and investment (related to project delays), the State’s financial transactions (loans to public enterprises) led to a deterioration of the budget deficit to 5.3 per cent of GDP, which was fully financed by external debt.
Such inflows to the State, together with further foreign direct investment (FDI) growth, have made it possible to finance the current account deficit
(which declined in 2013 to 37.5 per cent of GDP, in view of lower services imports and increased official transfers) and to build up foreign reser-ves, to 4.2 months of imports of goods and services, excluding those relating to large-scale projects.
In the context of an increase in net foreign assets, and considering the moderate behaviour of pri-ces – the inflation rate increased slightly during the year – the central bank continued to ease its monetary policy stance, cutting the rates on its lending and deposit facilities.
Monetary expansion, although slowing down, maintained a high pace in 2013 (16.3 per cent), combining a rise in net foreign assets and growth of credit to the economy, chiefly by households, for the acquisition of durable consumer goods, but also by some business sectors.
Growth is expected to accelerate in 2014 (to 8.3 per cent), based on the activity of the coal sec-tor and investment (FDI and public). The planned increase in public capital expenditure (accommo-dating projects delayed from 2013), expenditure related to the electoral process and new pressu-re from financial operations are expected to lead to a further deterioration of the budget deficit to 12 per cent of GDP. The rise in large-scale pro-jects imports will cause a widening of the current account deficit to 46.8 per cent of GDP. However, strong FDI and higher net indebtedness by the State and other sectors will make it possible not only to finance the current account deficit but also to raise external reserves to 4.4 months of imports.
Table 43 • Main economic indicators
2011 2012 2013 2014
Est. Est. Proj.
Real GDP (annual % change) 7.4 7.1 7.4 8.3
Inflation (end-of-period % change) 5.5 2.2 3.0 6.0
Broad money (annual % change) 7.8 29.4 16.3 18.5
Current account (% of GDp) -23.1 -42.4 -37.5 -46.8
Overall fiscal balance (% of GDP) -4.5 -4.6 -5.3 -12.0
External public debt (% of GDP) 31.8 32.1 36.9 –
Sources: Banco de Moçambique, IMF, Mozambique National Budget Directorate and Mozambique National Institute of Statistics.

53
Such an increase in net external assets and the ongoing buoyancy of credit to the economy are likely to contribute to the acceleration of monetary expansion to 18.5 per cent in 2014. Monetary policy is not expected to change its stance, provided that inflation (which seems to have stabilised) is in line with medium-term objectives.
The main risks associated with the develop-ments of the Mozambique economy are linked
to possible exogenous shocks, such as climate disasters, commodity price changes or falls in global demand for its main exports. Disturbances may also be caused by possible political tensions arising from the elections or fiscal risks stem-ming from public enterprises or public-private partnerships.
Mozambique

Banco de Portugal • Economic Developments in Portuguese-speaking African Countries and Timor-Leste • 2013 | 2014 54
Table 44 • Main economic indicators
2009 2010 2011 2012 2013 2014
Est. Est. Est. Est. Proj. Est. Proj. Est.
Output and prices
Nominal GDp EUR millions 7,579 7,597 9,558 11,627 11,363 11,847 12,896
Real GDp Annual % change 6.5 7.1 7.4 7.1 7.0 7.4 8.3
Inflation (Consumer Price Index) E-o-p % change 3.0 16.6 5.5 2.2 6.1 3.0 6.0 3.0 Jun.
Average % change 4.2 12.7 10.4 2.1 5.5 4.2 4.6 3.5 Jun.
Public finances
total revenue % of GDp 24.4 26.2 28.2 29.7 29.6 31.5 35.3
Total expenditure % of GDp 29.4 30.0 32.7 34.2 36.3 36.7 47.2
Overall balance % of GDp -5.0 -3.8 -4.5 -4.6 -6.7 -5.3 -12.0
Overall balance excl. grants % of GDp -13.5 -12.0 -11.7 -11.0 -11.8 -9.8 -17.7
Money and credit
Net claims on general gov. Annual % change -1.6 -6.5 53.6 99.0 -7,587.3 -23,869.0 -83.9 -80.7 May(d)
Credit to the economy Annual % change 58.6 29.3 6.4 18.3 21.5 30.5 20.7 7.7 May(d)
Broad money (M3) Annual % change 32.6 24.6 7.8 29.4 16.2 16.3 18.5 2.6 May(d)
Interest rates
Deposit (1-year) Annual rate 10.2 12.2 13.4 11.5 9.1 10.0 May
Lending (1-year) Annual rate 19.2 21.7 23.7 21.4 19.8 21.2 May
Balance of payments
Merchandise exports (in UsD)
Annual % change -19.1 8.7 33.6 23.7 2.5 6.9 19.3
Merchandise imports (in UsD)
Annual % change -6.1 2.6 52.8 47.2 -10.0 7.3 16.9
Current account % of GDp -11.0 -10.6 -23.1 -42.4 -37.2 -37.5 -46.8
Current acc. excl. offic. transf.
% of GDp -17.2 -16.4 -29.0 -47.1 – -44.4 –
International reserves Months of imports(b)
4.8 3.3 2.4 2.6 2.7 2.5 2.6
Months of imports(c)
4.2 3.0 3.9 4.4 4.2 4.4
External debt
total stock EUR millions 2,707 2,717 3,040 3,736 4,367
% of GDp 35.7 35.8 31.8 32.1 36.9
% of exports(b) 124.7 121.6 109.7 107.5 122.2
Debt service % of exports(b) 1.6 2.2 1.9 2.2 2.5
Exchange rates
MZM/EUR (official market) Average rate 38.95 45.44 40.28 36.49 39.71 41.62 Jun.
MZM/USD (official market) Average rate 26.71 32.99 29.06 28.23 29.91 30.63 Jun.
MZM/UsD (parallel market) Average rate 29.24 35.65 31.04 29.45 31.50 32.48 Jun.
Nominal EERI (Index, 100: 2000)(a)
% change(d) -30.5 -7.1 35.4 -9.2 6.2 -0.8 Jun.
Real EERI (Index, 100: 2000)(a)
% change(d) -30.9 5.2 36.9 -10.9 5.7 -0.5 Jun.
Sources: Banco de Moçambique, Fundo Monetário Internacional e cálculos do BP.Notas: (a) Effective exchange rate index (EERI), calculated on the basis of official exchange rates applied to the currencies of Mozambique's four main trading partners over the period 2005/09 (appreciation: +; depreciation: -); (b) Prospective imports of goods and services; (c) Imports of goods and services, exclu-ding megaprojects; (d) Change from the previous December.

55
Table 45 • Gross domestic productCurrent prices, MzM millions
2008 2009 2010 2011 2012 2013 2014
Est. Est. Proj.
Primary sector 74,712 84,521 96,920 109,056 115,337 127,720
Agriculture and livestock 71,483 80,538 90,650 102,533 108,476 120,241
Fishing 3,229 3,983 6,270 6,523 6,861 7,479
Secondary sector 52,203 56,560 67,070 73,587 82,995 91,564
Mining and quarrying 4,111 4,489 5,744 8,663 13,333 15,405
Manufacturing 35,390 35,860 40,797 42,909 44,818 47,843
Electricity and water 7,847 10,197 12,369 12,402 13,571 15,100
Construction 4,856 6,014 8,160 9,613 11,273 13,215
Tertiary sector 120,776 132,443 156,381 173,583 192,689 210,001
trade and repairs 28,125 29,567 36,435 39,229 43,605 49,888
Restaurants and hotels 6,872 7,639 9,833 10,661 11,202 12,438
transport and communication 24,422 27,002 32,703 35,818 40,398 43,612
Financial services 7,477 9,374 11,485 14,392 17,212 22,415
Real estate renting 21,278 22,715 25,070 27,128 29,591 32,654
General government 11,078 13,540 16,705 18,860 20,108 21,494
Education 18,424 20,041 22,202 25,345 28,717 28,210
Healthcare and social work 4,191 4,790 5,248 5,997 6,937 7,019
Other -1,090 -2,225 -3,300 -3,847 -5,081 -7,730
Gross Domestic product (at factor costs)
247,690 273,524 320,371 356,226 391,021 429,285
Indirect taxes 20,255 21,654 24,846 28,773 33,239 41,187
Gross Domestic product (market prices)
267,945 295,178 345,217 384,999 424,260 470,472 527,552
Consumption 249,949 277,811 319,534 351,207 387,708 424,335 459,533
public 47,102 54,191 65,270 71,574 85,924 96,027
private 202,847 223,619 254,264 279,634 301,784 328,309
Investment 41,858 45,608 60,853 86,693 75,131 94,000 114,037
Gross Fixed Capital Formation 34,579 42,340 55,325 67,081 64,722 81,974
Changes in inventory 7,279 3,268 5,528 19,612 10,409 12,026
Domestic demand 291,807 323,419 380,387 437,900 462,839 518,335 573,569
Exports of goods and services 77,627 84,564 101,559 111,655 126,764 141,971 165,297
Overall demand 369,434 407,983 481,946 549,555 589,603 660,306 738,867
Imports of goods and services 101,489 112,805 136,729 164,556 165,343 189,834 211,315
Memo items:
Gross domestic savings 17,996 17,367 25,683 33,792 36,552 46,137 68,019
Nominal GDpmp (UsD millions) 11,084 11,052 10,466 13,249 15,030 15,730 17,104
GDPmp deflator (annual % change) 22.0 3.5 9.2 3.8 2.9 3.2 3.5
Nominal GDpmp (annual % change)
29.0 10.2 17.0 11.5 10.2 10.9 12.1
Real GDPmp (annual % change) 5.8 6.5 7.1 7.4 7.1 7.4 8.3
Sources: Banco de Moçambique, IMF and Banco de Portugal calculations.
Mozambique

Banco de Portugal • Economic Developments in Portuguese-speaking African Countries and Timor-Leste • 2013 | 2014 56
Table 46 • Consumer price indexper cent
Monthly change End-of-period change Average change
[1] [2] [3]
2002 December 2.5 9.1 17.3
2003 December 2.8 11.4 11.5
2004 December 1.9 9.3 11.4
2005 December 3.9 13.1 7.0
2006 December 2.2 8.1 13.6
2007 December 3.2 12.1 9.2
2008 December 0.9 11.8 14.5
2009 December 2.1 3.0 4.2
2010 December 3.5 16.6 12.7
2011 December 1.3 5.5 10.4
2012 December 1.0 2.2 2.1
2013 December 0.6 3.0 4.2
2012 January 0.9 4.3 9.3
February -0.5 2.5 8.2
March 0.3 2.7 7.2
April -0.1 2.5 6.4
May -0.4 1.6 5.6
June -0.5 1.6 4.9
July -0.1 1.5 4.4
August -0.1 1.1 3.8
september 0.1 1.2 3.3
October 0.3 1.5 2.8
November 1.4 2.5 2.4
December 1.0 2.2 2.1
2013 January 1.1 2.3 1.9
February 1.4 4.3 2.1
March 0.3 4.3 2.2
April 0.6 5.1 2.4
May -0.4 5.1 2.7
June -0.5 5.2 3.0
July -0.3 4.9 3.3
August -0.5 4.5 3.6
september -0.1 4.3 3.9
October 0.2 4.2 4.1
November 0.6 3.3 4.1
December 0.6 3.0 4.2
2014 January 1.1 3.0 4.3
February 0.7 2.3 4.1
March 1.5 3.5 4.0
April 0.1 3.1 3.9
May -0.4 3.1 3.7
June -0.5 3.0 3.5
Sources: Banco de Moçambique, Mozambique National Institute of Statistics and Banco de Portugal calculations.Notes: [1] month (n) / month (n-1); [2] month (n) / month (n) of the previous year; [3] last 12 months / previous 12 months.

57
Table 47 • Balance of paymentsusD millions
2009 2010 2011 20122013 2014
Prog. Q.1 Est. Proj. Q.1 Est.
Current account -1,220 -1,113 -3,056 -6,371 -5,854 -1,278 -5,892 -8,007 -1,079 -904
Excluding official transfers
-1,901 -1,718 -3,848 -7,084 – -1,629 -6,980 – -1,686 -1,509
trade balance -1,275 -1,179 -2,250 -4,048 -3,163 -859 -4,357 -4,990 -909 -997
Exports (f.o.b.) 2,147 2,333 3,118 3,856 3,950 861 4,123 4,920 763 2,243
of which: Megaprojects 1,311 1,668 2,015 2,219 2,623 – 2,430 3,071 – 1,648
Imports (c.i.f.) -3,422 -3,512 -5,368 -7,903 -7,112 -1,720 -8,480 -9,910 -1,672 -3,240
of which: Megaprojects -791 -900 -1,547 -2,143 -2,494 – -2,319 -3,111 – -883
services -457 -506 -1,482 -3,136 -3,225 -776 -2,717 -3,950 -731 -493
Income -251 -85 -190 -16 -23 -19 -52 -176 -60 -85
of which: Dividends f/ megaproj.
-224 0 -157 0 -17 – -6 -166 – -222
Scheduled interest -20 -30 -35 -40 – -4 -49 – -21 -30
Current transfers 763 657 866 829 557 377 1,234 1,109 621 671
Official transfers 682 605 792 713 – 351 1,087 – 608 605
of which: External grants 687 605 785 538 520 88 475 585 88 605
private transfers 82 52 74 116 – 26 147 – 14 66
Capital and financial account 1,288 1,116 3,364 6,725 5,954 958 6,240 8,407 1,276 1,059
Capital account 422 348 432 456 384 82 486 583 75 351
Financial account 866 768 2,932 6,269 5,571 876 5,754 7,825 1,200 708
FDI (net) 890 790 2,599 5,626 4,719 1,744 5,935 4,883 2,510 790
General gov. borrowing (net)
434 468 531 546 961 77 1,055 1,776 66 381
private sector borrowing (net)
-487 -348 -39 515 -43 -744 -132 902 -1,525 -146
Other transactions (net)(a) 28 -142 -159 -419 -66 -201 -1,105 264 149 -316
Errors and omissions 126 56 17 23 0 -9 49 0 0 -69
Overall account 194 58 322 377 100 -329 396 400 197 87
Financing -194 -58 -322 -377 -100 329 -396 -400 -197 -87
Change in international reserves (net)(a)
-352 -87 -321 -375 -97 335 -393 -397 -197 -84
Use of IMF funds (net)(b) 156 18 -2 -2 -3 -6 -3 -3 -1 -3
Exceptional financing 2 10 0 0 0 0 0 0 0 0
Change in arrears (decrease: - )
0 0 0 0 0 0 0 0 0 0
Financing gap(c) 0 0 0 0 0 0 0 0 0 0
Sources: Banco de Moçambique, IMF and Banco de Portugal calculations.Notes: (a) In 2009, includes the use of an SDR allocation of SDR 108.8 million under investment liabilities of the monetary authorities, resulting in an increase in international reserves; (b) Disbursements in 2009 and 2010 under the Exogenous Shocks Facility arrangement; (c) Net borrowing (-) / net lending (+).
Mozambique

Banco de Portugal • Economic Developments in Portuguese-speaking African Countries and Timor-Leste • 2013 | 2014 58
Table 48 • Merchandise exportsDestinations as a percentage of total exports
2005 2006 2007 2008 2009 2010 2011 2012 2013 2005 to 2013
South Africa 16.2 15.2 17.2 9.2 21.4 21.6 18.7 19.8 19.7 17.9 Belgium 0.1 0.1 0.3 0.5 0.7 0.4 0.6 1.1 1.2 0.6 China 1.9 1.4 1.7 1.6 3.5 3.9 5.4 18.2 2.5 5.2 spain 1.9 1.8 1.5 1.3 1.5 1.7 2.7 1.5 1.8 1.7 United states 2.2 0.3 0.2 0.5 1.9 0.9 0.8 2.5 3.6 1.6 Netherlands 59.7 59.7 61.8 55.5 41.6 51.0 43.5 24.1 27.3 44.1 India 1.5 1.3 0.7 0.8 2.6 1.5 1.8 4.5 16.5 4.4 Malawi 2.8 1.0 0.7 1.4 2.2 1.2 1.5 0.8 1.0 1.3 portugal 1.2 1.2 1.3 0.8 1.5 4.7 1.4 0.5 2.5 1.7 Zimbabwe 2.9 3.2 2.9 2.1 3.4 3.2 2.5 2.4 2.0 2.7 Other 9.6 14.7 11.7 26.2 19.6 10.0 21.1 24.5 22.1 18.8
Sources: Banco de Moçambique, IMF and Banco de Portugal calculations.
Table 49 • Merchandise importsOrigins as a percentage of total imports
2005 2006 2007 2008 2009 2010 2011 2012 2012 2005 to 2013
South Africa 42.9 36.3 32.4 29.1 35.5 51.2 34.0 27.2 25.7 32.6 Australia 0.7 0.1 0.3 0.1 0.6 0.1 1.0 0.5 1.1 0.6 China 2.5 2.6 3.5 3.9 4.6 5.7 7.0 5.3 7.5 5.4 United states 2.6 2.2 2.7 4.0 3.6 0.5 2.8 11.9 2.2 4.4 France 0.9 0.8 0.8 0.6 0.8 0.3 1.2 1.4 0.8 0.9 Netherlands 11.5 15.6 14.5 17.4 13.0 16.5 12.6 6.6 4.9 10.9 India 3.6 3.2 4.4 3.6 6.5 1.1 5.6 2.9 3.7 3.8 Japan 0.8 0.6 3.1 3.2 3.8 5.5 3.5 2.2 2.6 2.9 portugal 3.6 3.3 3.5 2.9 3.8 8.0 4.2 4.0 5.7 4.5 Other 30.9 35.3 34.9 35.2 28.0 11.0 28.2 38.0 45.9 34.1
Sources: Banco de Moçambique, IMF and Banco de Portugal calculations.
Table 50 • External debt usD millions
2007 2008 2009 2010 2011 2012 2013 Est. Est. Est. Est. Est. Est. Est.
Medium or long-term debt 3,424.0 3,581.3 3,947.7 3,743.6 4,214.4 4,829.2 5,798.3 Multilateral creditors 1,543.4 1,672.9 2,229.0 2,436.6 2,505.4 2,926.9 3,383.1 Bilateral creditors 1,880.6 1,908.4 1,718.8 1,307.0 1,709.0 1,902.4 2,415.2
OECD countries 639.6 560.1 216.9 326.7 515.1 520.2 581.5 OpEC countries 159.9 159.9 159.7 158.1 491.8 498.8 500.8 Eastern European countries 107.1 107.2 227.5 148.5 112.3 136.6 190.2 Other countries 974.0 1,081.2 1,114.8 673.7 589.8 746.8 1,142.7
Short-term debt
Total external debt 3,424.0 3,581.3 3,947.7 3,743.6 4,214.4 4,829.2 5,798.3
Scheduled medium/long-term debt service 47.6 69.1 49.2 66.7 72.7 97.0 120.5
principal 41.5 28.7 36.6 37.7 57.0 71.8 Interest 27.6 20.4 30.1 35.0 40.0 48.7
(% of exports of goods and services)Total external debt 136.4 111.5 124.7 121.6 109.7 107.5 122.2 Debt service 1.9 2.2 1.6 2.2 1.9 2.2 2.5
(% of GDp)Total external debt 42.2 32.3 35.7 35.8 31.8 32.1 36.9
Sources: Banco de Moçambique, IMF and Banco de Portugal calculations.

59
Table 51 • Government operations MzM billions
2009 2010 20102013 2014
R.Budg. Q. 1 Est. l.e.(a) R.Budg. Q.1 l.e.(a)
1. total revenue(b) 90.33 108.44 125.81 143.72 27.43 148.08 103.0 185.98 36.02 19.4
1.1. Current revenue 61.63 81.06 98.48 120.49 24.80 126.91 105.3 153.08 31.90 20.8
Non-tax revenue 7.94 12.80 14.02 19.66 3.86 18.76 95.4 20.81 4.93 23.7
Tax revenue 53.69 68.26 84.46 100.83 20.94 108.15 107.3 132.26 26.97 20.4
Income taxes 18.48 24.90 36.80 39.12 7.52 49.39 126.3 59.24 11.94 20.1
Consumption taxes 28.84 33.76 36.91 47.12 10.22 45.20 95.9 56.50 11.68 20.7
Taxes on international trade
5.26 6.73 7.54 9.58 2.40 10.02 104.6 10.84 2.44 22.5
Other taxes 1.10 2.88 3.21 5.02 0.80 3.55 70.6 5.68 0.91 16.1
1.2. Grants 28.34 27.38 27.33 23.23 2.62 21.17 91.1 30.40 4.12 13.5
2. Total expenditure(c) 103.52 125.93 145.25 188.72 28.44 172.86 91.6 249.09 36.91 14.8
2.1. Current expenditure(d) 57.89 70.99 83.80 100.47 21.25 95.47 95.0 121.21 26.79 22.1
Compensation of employees 29.11 35.81 41.59 50.55 12.42 49.51 98.0 58.44 14.37 24.6
Goods and services 10.69 10.99 14.32 19.48 3.63 18.72 96.1 26.46 5.66 21.4
transfers and subsidies 15.42 16.52 18.77 19.42 4.05 18.77 96.7 20.83 4.90 23.5
Interest 2.67 3.50 4.13 5.62 0.98 3.98 70.7 6.07 1.20 19.8
2.2. Capital expenditure 43.70 51.01 53.46 79.98 6.92 63.05 78.8 104.54 8.71 8.3
Domestic financing 20.03 20.41 24.93 34.61 4.63 33.60 97.1 46.26 5.85 12.6
External financing 23.67 30.60 28.53 45.37 2.29 29.45 64.9 58.28 2.86 4.9
2.3. Net lending 1.93 5.93 7.98 8.27 0.18 14.33 173.3 23.35 1.41 6.0
3. Current balance: (1.1-2.1) 3.74 10.07 14.67 20.02 3.55 31.43 – 31.87 5.11 –
4. Overall bal. excl. grants: (1-2-1.2)
-41.53 -44.87 -46.77 -68.23 -3.64 -45.95 – -93.52 -5.00 –
5. Overall balance: (1-2) -13.19 -17.49 -19.44 -45.00 -1.02 -24.77 – -63.12 -0.89 –
6. Financing 13.19 17.49 19.44 45.00 -6.10 24.77 – 63.12 0.89 –
6.1. Domestic (net)(e),(f) -0.05 2.62 3.81 3.57 -6.98 -4.98 -139.2 5.72 -1.73 -30.3
of which: Banking system -0.74 6.55 5.61 – -6.36 -13.97 – – -21.02 –
6.2. External (net) 13.25 14.88 15.63 41.42 0.87 29.75 71.8 57.40 2.62 4.6
Disbursements(e) 14.28 15.92 17.24 – 1.51 32.30 – – 3.28 –
Amortisation -1.03 -1.05 -1.61 – -0.64 -2.55 – – -0.66 –
7. Financing gap(g) 0.00 0.00 0.00 0.00 -7.12 0.00 – 0.00 0.00 –
Sources: Banco de Moçambique, IMF and Banco de Portugal calculations.Notes:(a) Level of budget execution, %; (b) Includes revenue that has not been classified; (c) Includes expenditure that has not been classified; (d) Includes other current expenditure; (e) Includes movements related to a government account set abroad with the proceedings of the Moatize coal mine concession; (f) For 2009, 2010 and 2011, includes privatisation receipts; (g) Net borrowing (-) / net lending (+).
Mozambique

Banco de Portugal • Economic Developments in Portuguese-speaking African Countries and Timor-Leste • 2013 | 2014 60
Table 52 • Monetary surveyMzM billions
2009 2010 2011 2012 2013 2013/2012 2014 2014p/2013 2014
Est. Proj. Est. [1] [2] Proj. [1] [2] Mar. Apr. May
Net foreign assets 63.8 79.9 73.0 95.7 112.3 100.0 4.4 2.3 124.3 24.4 11.3 107.0 108.5 108.7 Central Bank 49.7 57.1 56.9 73.1 81.9 85.7 17.2 6.8 103.1 20.3 8.0 95.6 95.8 95.1
Foreign assets 59.6 68.9 66.9 84.2 – 97.0 15.3 6.9 – – – 108.0 108.0 107.6
Foreign liabilities -10.0 -11.8 -10.0 -11.1 – -11.3 2.4 -0.1 – – – -12.3 -12.2 -12.5
Commercial banks 14.1 22.8 16.1 22.6 30.5 14.3 -36.9 -4.5 21.2 48.8 3.2 11.4 12.7 13.5
Net domestic assets 60.0 80.2 92.6 116.2 136.8 137.6 18.4 11.5 157.3 14.3 9.1 132.5 138.6 138.0 Net claims on gen. gov.
-11.5 -12.2 -5.7 -0.1 -4.5 -14.0 – -7.5 -25.8 83.9 -5.4 -25.5 -21.1 -25.4
Credit granted 28.7 22.9 37.7 45.5 – 67.8 49.2 12.0 – – – 67.4 69.6 67.1
Deposits -38.7 -34.3 -43.0 -45.4 – -81.8 80.0 -19.5 – – – -92.8 -90.6 -92.4
National currency -38.0 -34.0 -42.9 -45.4 – -81.7 80.1 -19.5 – – – -92.8 -90.6 -92.4
Foreign currency -0.7 -0.3 -0.1 0.0 – 0.0 13.0 0.0 – – – 0.0 0.0 0.0
Earmarked funds -1.5 -0.9 -0.3 -0.1 – -0.1 0.2 0.0 – – – -0.1 -0.1 -0.1
Credit to the economy 71.4 92.4 98.3 116.3 141.3 151.7 30.5 19.0 183.1 20.7 14.5 158.0 159.7 163.4
National currency 48.7 65.2 76.5 87.5 111.6 117.3 34.1 16.0 145.2 23.8 12.9 123.9 125.7 128.8
Foreign currency 22.8 27.2 21.8 28.8 29.7 34.4 19.3 3.0 37.9 10.3 1.6 34.2 33.9 34.6
Other items (net) -26.6 -21.8 -25.9 -33.0 -21.2 -18.3 2.5 -25.2 18.8 -1.8 -23.2 -27.0 -24.5
total assets 133.4 143.8 186.0 216.2 216.4 16.3 – 256.5 18.5 – 216.3 220.1 222.2
Broad money (M3) 107.1 133.4 143.8 186.0 216.2 216.4 16.3 16.3 256.5 18.5 18.5 216.3 220.1 222.2
Base money 24.5 31.6 34.3 41.1 48.4 47.5 15.7 3.5 55.6 17.0 3.7 45.3 46.8 48.1
Currency in circulation
13.1 17.4 17.5 19.7 20.2 22.7 15.5 – 27.4 20.5 – 21.4 21.7 23.2
Demand deposits 60.8 73.7 80.1 109.5 123.8 123.3 12.6 – 145.0 17.6 – 122.1 125.7 129.0
Quasi-money 33.2 42.3 46.2 56.8 72.2 70.4 23.9 – 84.2 19.6 – 72.9 72.6 70.0
total liabilities 107.1 133.4 143.8 186.0 216.2 216.4 16.3 – 256.5 18.5 – 216.3 220.1 222.2
Sources: Banco de Moçambique, IMF and Banco de Portugal calculations.Notes: [1] Percentage change from the previous period; [2] Change in per cent of the initial stock of money supply (expansion/contraction determinants).
Table 53 • Interest ratesannual rates, per cent
2008 2009 2010 2011 2012 2013 2014
Dec. Dec. Dec. Dec. Dec. Dec. Mar. Apr. May
Deposits 91-180 days 11.2 8.8 11.5 12.7 10.2 8.5 8.5 8.6 9.3
181-365 days 11.6 10.2 12.2 13.4 11.5 9.1 9.3 9.4 10.0
1-2 years 11.1 9.4 14.3 13.2 9.6 6.1 6.8 6.8 7.8
Crédito Up to 180 days 22.0 18.6 22.0 24.4 20.6 19.8 19.6 19.6 19.8
181-365 days 21.8 19.2 21.7 23.7 21.4 19.8 21.0 21.1 21.2
1-2 years 20.7 18.8 22.6 24.9 21.0 21.1 22.2 22.1 22.2
Reference rates
Standing liquidity provision facility 14.5 11.5 15.5 15.0 9.5 8.3 8.3 8.3 8.3
Treasury bills (91 days) 14.0 9.5 14.7 11.8 2.6 6.6 5.6 6.4 5.3
Unsecured IMM (up to 7 days) 12.4 8.0 13.1 11.7 2.9 3.4 3.2 3.1 3.1
Sources: Banco de Moçambique, IMF and Banco de Portugal calculations.

61
Table 54 • Exchange ratesaverage rates
EUR/MZM USD/MZM ZAR/MZM
EERI(a)
Index, 100: 2000Official Open Op/Of Official Parallel Open Pa/Of Op/Of
(Of) (Op) (%) (Of) (Pa) (Op) (%) (%) Open Nom. Real
2000 13,979.9 14,044.8 0.46 15,140.9 15,995.9 15,254.1 5.65 0.75 2,187.1 100.00 100.00
2001 18,293.7 18,515.4 1.21 20,455.5 21,145.4 20,706.5 3.37 1.23 2,537.1 82.03 87.03
2002 21,896.4 22,370.7 2.17 23,180.4 24,281.3 23,665.4 4.75 2.09 2,373.7 76.88 90.51
2003 26,360.4 26,874.1 1.95 23,340.9 24,248.7 23,782.3 3.89 1.89 3,187.7 60.26 76.18
2004 27,457.0 27,782.7 1.19 22,130.9 23,165.5 22,581.3 4.67 2.04 3,523.4 56.51 78.36
2005 28,337.5 28,576.1 0.84 22,936.3 23,614.4 23,068.4 2.96 0.58 3,617.1 54.19 78.38
2006(b) 32.18 31.38 -2.47 24.98 26.93 26.03 7.82 4.18 3.77 50.60 80.72
2007 35.57 35.02 -1.55 25.56 26.64 25.84 4.24 1.09 3.67 47.95 80.30
2008 35.72 35.49 -0.65 24.17 25.15 24.30 4.05 0.52 2.98 52.18 94.03
2009 38.95 37.25 -4.37 26.71 29.24 27.52 9.47 3.03 3.33 47.33 85.83
2010 45.44 43.63 -3.99 32.99 35.65 33.96 8.09 2.95 4.65 37.13 73.77
2011 40.28 40.46 0.45 29.06 31.04 29.07 6.81 0.03 4.04 42.58 89.93
2012 36.49 36.29 -0.56 28.23 29.45 28.40 4.34 0.61 3.47 48.00 99.52
2013 39.71 39.97 0.65 29.91 31.50 30.10 5.31 0.65 3.13 48.13 100.06
2012 January 35.74 35.08 -1.85 27.18 29.50 27.26 8.54 0.29 3.41 48.57 103.76
February 35.99 35.94 -0.14 27.17 29.05 27.27 6.90 0.38 3.57 47.78 100.96
March 36.85 36.25 -1.63 27.46 28.73 27.64 4.62 0.64 3.64 46.50 97.42
April 36.53 36.51 -0.05 27.76 29.05 27.98 4.65 0.80 3.58 47.43 98.79
May 34.98 35.33 1.00 27.63 28.63 27.88 3.63 0.92 3.42 49.82 103.37
June 34.82 34.95 0.37 27.89 28.60 28.09 2.56 0.70 3.36 50.25 103.80
July 34.68 34.44 -0.69 28.03 28.97 28.21 3.35 0.66 3.42 49.66 101.98
August 35.91 35.37 -1.50 28.53 29.47 28.80 3.29 0.96 3.49 48.15 98.61
september 36.92 36.94 0.05 28.72 29.79 28.79 3.73 0.24 3.49 47.69 97.14
October 37.68 37.51 -0.45 28.91 29.86 29.09 3.29 0.61 3.37 47.75 96.99
November 38.53 38.23 -0.78 29.80 30.45 29.97 2.19 0.56 3.41 46.85 96.60
December 39.24 38.88 -0.92 29.66 31.32 29.81 5.60 0.51 3.46 46.08 95.97
2013 January 39.54 39.88 0.85 29.76 30.98 30.01 4.10 0.84 3.42 46.41 97.55
February 40.06 40.73 1.67 30.00 31.48 30.50 4.93 1.67 3.43 46.15 97.59
March 38.95 39.62 1.71 30.06 31.90 30.57 6.12 1.70 3.33 47.47 99.58
April 39.11 39.70 1.50 30.05 31.78 30.55 5.76 1.66 3.35 47.20 99.36
May 38.91 39.03 0.31 29.98 31.74 30.07 5.87 0.30 3.21 47.94 100.61
June 39.38 39.29 -0.23 29.87 30.84 29.75 3.25 -0.40 2.98 49.18 102.76
July 39.00 39.15 0.37 29.84 31.35 29.95 5.06 0.37 3.02 49.33 101.77
August 39.72 39.85 0.34 29.84 31.51 29.94 5.60 0.34 2.98 49.24 100.97
september 39.84 40.00 0.40 29.86 31.66 29.98 6.03 0.40 3.01 49.00 100.03
October 40.70 40.74 0.09 29.84 31.68 29.87 6.17 0.09 3.02 48.22 98.74
November 40.33 40.50 0.41 29.89 31.49 30.00 5.35 0.38 2.95 49.02 101.15
December 40.99 41.18 0.46 29.92 31.56 30.06 5.48 0.46 2.90 48.93 101.50
2014 January 41.06 41.42 0.88 30.17 32.17 30.44 6.63 0.89 2.79 49.75 104.29
February 41.86 43.21 3.23 30.62 33.14 31.60 8.23 3.21 2.89 48.92 102.54
March 42.15 43.43 3.03 30.50 32.68 31.45 7.15 3.12 2.93 48.44 102.01
April 42.25 43.30 2.48 30.58 32.50 31.34 6.27 2.47 2.97 47.94 100.64
May 42.06 43.05 2.35 30.64 32.55 31.35 6.23 2.33 3.01 47.71 99.85
June 41.62 42.61 2.39 30.63 32.48 31.36 6.04 2.37 2.94 48.54 101.04
Sources: Banco de Moçambique, IMF and Banco de Portugal calculations.Notes:(a) Effective exchange rate index (EERI), calculated on the basis of official exchange rates applied to the currencies of Mozambique's four main trading partners over the period 2005/09 (appreciation: +; depreciation: -); (b) A monetary reform was carried out in July 2006 with a conversion rate of 1 to 1,000.
Mozambique


5. sãO tOMé aND príNCIpEArea: 997 Km2
Capital city: são tomé
Population: 195 thousand (2013; source: ONU)
Currency: Dobra
The Santomean economy continued to grow below expectations in 2013 (albeit still at a robust pace), largely reflecting recurrent difficulties in external financing. In turn, the correction of macroeconomic imbalances has progressed, with inflation reaching new historical lows (particularly benefiting from the dobra’s exchange rate peg to the euro), intensified fiscal consolidation and a further strengthening of the external position – which culminated in a reduc-tion in the relative burden of external debt and the reinforcement of foreign exchange reserves.

Banco de Portugal • Economic Developments in Portuguese-speaking African Countries and Timor-Leste • 2013 | 2014 64
5.1. São Tomé e Príncipe overviewThe persistence of a downward trend in macroeconomic imbalances – which has been broad-based over the past few years, particu--larly as regards inflation, public finances and external accounts – was one of the key ele--ments for the Santomean economy in 2013 and early 2014. However, these favourable developments continued to unfold against a backdrop of persistent pressures and signifi--cant risks, notably difficulties in accessing ex-ternal financing (mostly public, but also pri-vate), which were likely crucial to the main-te-nance of a pace of economic growth below expectations.
External financing shortfalls were most con--spicuously reflected in the public accounts, with grants and loans standing at only 59.1% and 18.5% respectively of the 2013 budget. Consequently, capital expenditure was severely affected (standing at only 41.2% of the budget) – although, in turn, this became crucially ins-trumental to the substantial reduction in the overall fiscal deficit. However, the latter was only possible due to the restraint applied using the fiscal tools more directly under the control of Santomean authorities – despite a marked increase in compensation of employees, which placed a greater burden on other current expen-diture (supplemented by an efficient collection of direct taxes).
Progress in fiscal consolidation had a positive impact on monetary conditions, contributing to
a more subdued expansion in liquidity – which also reflected a slight contraction in credit to the economy (affected by the ongoing deleve-raging and restructuring of the banking sys-tem). In turn, fiscal and monetary restraint, the absence of significant shocks on the supply side, the decline in inflation among the main foreign partners and the exchange rate anchor effect provided by the dobra’s exchange rate peg to the euro (which, as decided by the Santomean authorities, draws on the Economic Cooperation Agreement between portugal and São Tomé and Príncipe) were the key deter-minants upholding the downward trend in inflation which has prevailed over the past few years – reaching a new historical low in April 2014.
The sustainability of the exchange rate regime mainly hinges on a strict conduct of economic policy by the Santomean authorities, but may be gauged through indicators such as the maintenance of foreign reserves at suitable levels. Therefore, the trend reinforcement in the latter since mid-2012 was particularly rele--vant – standing in April 2014 close to the levels reached (for precautionary reasons) when the exchange rate regime was launched, in 2010. That reinforcement and the lower external debt burden are, in fact, the most notable ex-pressions of an improvement in the San-tomean external position in 2013 – clearly re--flected in a further (consecutive) reduction in the main deficits.
Table 55 • Main economic indicators
2010 2011 2012 2013 2014
Est. Est. Est. Proj. Est. Proj.
Real GDP (annual % change) 4.5 4.9 4.0 4.5 4.0 5.0
Inflation (end-of-period % change) 12.9 11.9 10.4 8.0 7.1 6.0
Broad money (annual % change) 25.1 10.5 20.3 12.6 14.0 10.3
Current and capital account (% of GDp) -23.1 -25.4 -23.0 -20.4 -19.0 -18.9
Overall fiscal balance (% of GDP) -10.5 -12.6 -10.8 -13.1 -2.0 -14.6
Domestic primary balance (% of GDp) -4.1 -3.0 -3.3 -3.1 -2.7 -3.0
External public debt (% of GDP) 78.6 74.2 66.1 70.2
Sources: Banco Central de São Tomé e Príncipe, Ministry of Planning and Finance (São Tomé and Príncipe) and IMF.

65
Table 56 • Main economic indicators2009 2010 2011 2012 2013 2014Est. Est. Est. Est. Proj. Est. Proj. Est.
Output and pricesNominal GDp Billions of dobras 3,185 3,719 4,376 5,021 5,780 5,732 6,524
EUR millions 141.5 151.8 178.6 204.9 235.9 234.0 266.3
UsD millions 196.5 200.2 246.5 261.4 309.2 307.9 359.1
Real GDp Annual % change 4.0 4.5 4.9 4.0 4.5 4.0 5.0
Inflation (Consumer Price Index) E-o-p % change 16.1 12.9 11.9 10.4 8.0 7.1 6.0 6.9 May
Average % change 17.0 13.3 14.3 10.6 9.0 8.1 7.1 6.8 May
Public financestotal revenue % of GDp 36.1 39.2 40.3 33.6 38.4 30.5 30.5
Current revenue % of GDp 16.6 19.0 18.0 15.3 16.5 16.6 16.5
Grants % of GDp 19.5 20.2 21.5 17.4 20.6 12.3 14.0
of which: Debt relief % of GDp 1.0 0.9 1.1 0.5 0.6 0.4 0.5
Oil bonuses % of GDp 0.0 0.0 0.8 0.8 1.3 1.6 0.0
Total expenditure % of GDp 54.1 49.7 52.9 44.3 51.5 32.5 45.1
of which: Current expenditure % of GDp 20.2 20.6 19.4 17.4 17.8 18.4 17.9
Capital expenditure % of GDp 32.9 28.5 32.8 26.6 33.2 13.8 26.7
Domestic primary balance(a) % of GDp -8.1 -4.1 -3.0 -3.3 -3.1 -2.7 -3.0Overall balance (commitment basis) % of GDp -18.0 -10.5 -12.6 -10.8 -13.1 -2.0 -14.6
Excl. debt relief and oil bonuses % of GDp -19.0 -11.3 -14.5 -12.1 -15.0 -4.0 -15.1
Overall balance (cash basis) % of GDp -18.1 -12.5 -11.2 -9.1 -13.1 -1.5 -14.6
Money and creditNet credit to central government Annual % change 37.7 78.4 63.5 -459.2 -39.6 -102.7 5.3 -142.3 Apr.
Credit to the economy Annual % change 39.1 40.0 14.7 9.6 7.6 -0.9 22.3 -6.8 Apr.
Broad money Annual % change 8.2 25.1 10.5 20.3 12.6 14.0 10.3 7.7 Apr.
BCstp reference interest rate Annual rate 16.0 15.0 15.0 14.0 14.0 12.0 Jun.
Balance of paymentsExports f.o.b. Annual % change 17.6 18.7 0.5 37.6 -0.2 -14.8 25.9
Imports f.o.b. Annual % change -9.1 14.8 20.3 3.0 0.0 7.7 0.6
trade balance % of GDp -37.9 -42.6 -42.5 -39.8 -33.6 -37.5 -31.4
services balance % of GDp -4.4 -5.5 -5.3 -2.6 -2.7 -2.7 -3.2
Current account % of GDp -40.1 -43.7 -42.9 -37.8 -33.4 -28.3 -31.3
Excluding official transfers % of GDp -42.9 -46.7 -46.8 -41.3 -34.3 -32.7 -31.9
Current and capital account % of GDp 3.3 -23.1 -25.4 -23.0 -20.4 -19.0 -18.9
BCstp net foreign assets EUR millions 50.9 40.7 36.4 43.3 39.8 52.7 55.0 58.0 Apr.
UsD millions 73.1 53.7 46.5 56.7 72.1 79.6 Apr.
External public debtTotal external public debt UsD millions 136 157 183 204 216 215 Mar.
% of GDp 69.2 78.6 74.2 78.2 70.2
External debt service % of exports 30.4 30.0 27.2 26.8 31.2
Exchange ratesBil. rate EUR/stD (official market) Average rate 22,510 24,500 24,500 24,500 24,500 24,500 24,500 24,500 Jun.
Bil. rate UsD/stD (official market) Average rate 16,208 18,574 17,754 19,211 18,618 17,951May
Nominal(b) EERI [appreciation: +] Annual % change -4.0 -6.1 1.5 -1.4 1.0 1.6 MayReal(b) EERI [appreciation: +] Annual % change 9.8 2.1 9.8 4.6 6.8 7.4 May
Sources: Banco Central de São Tomé e Príncipe (BCSTP), Ministry of Planning and Finance (São Tomé and Príncipe), IMF and Banco de Portugal calculations.Notes: (a) Overall balance (commitment basis), excluding grants, oil revenue (signature bonuses and other), debt interest and capital expenditure financed by external sources. (b) Effective exchange rate index (EERI), calculated on the basis of official exchange rates applied to the currencies of the four main trading partners over the period 2005/09.
são tomé and príncipe

Banco de Portugal • Economic Developments in Portuguese-speaking African Countries and Timor-Leste • 2013 | 2014 66
Table 57 • Gross domestic productCurrent prices, billions of dobras
2009 2010 2011 2012 2013 2014Est. Est. Est. Est. Proj. Est. Proj.
Primary sector 584 716 892
Agriculture, livestock, hunting and forestry 371 456 576
Fishing 194 237 290
Mining and quarrying 19 22 26
Secondary sector 550 607 671
Manufacturing 215 246 281
Electricity, gas and water 69 73 74
Construction 266 288 316
Tertiary sector 2,058 2,414 2,843
trade 750 888 1,052
Accommodation and food 43 52 63
transportation, storage and communication 454 488 525
Financial activities 394 462 542
Real estate activ., rental and serv. to enterprises 135 155 179
Public admin., defence and social security 109 128 151
Education 15 18 21
Health and social work 9 11 15
Other activities 149 210 295
FIsIM(a) -281 -366 -478
Indirect taxes 273 349 447
Gross domestic product m.p. 3,185 3,719 4,376 5,021 5,780 5,732 6,524
Consumption 2,985 3,859 4,253 5,449
private 2,476 3,313 3,579 4,630
public 508 546 674 819
Investment 1,548 1,802 2,173 2,652
private 606 710 872 1,116
public 941 1,092 1,301 1,537
Domestic demand 4,532 5,661 6,426 8,101
Exports of goods and services 318 450 512 634 681 602 643
Overall demand 4,850 6,111 6,938 8,782
Imports of goods and services 1,665 2,392 2,563 2,762 3,002 2,903 2,903
Memo items:
GDPmp (real % change) 4.0 4.5 4.9 4.0 4.5 4.0 5.0
GDPmp (nominal % change) 18.1 16.8 17.7 14.8 15.1 14.2 13.8
Nominal GDp (EUR millions; current prices) 141.5 151.8 178.6 204.9 235.9 234.0 266.3
Nominal GDp (UsD millions; current prices) 196.5 200.2 246.5 261.4 309.2 307.9 359.1
Sources: Banco Central de São Tomé e Príncipe, Ministry of Planning and Finance (São Tomé and Príncipe), IMF and Banco de Portugal calculations.Note: (a) Financial intermediation services indirectly measured.

67
Table 58 • Consumer price indexper cent
Monthly change Cumulative change End-of-period change Average change
[1] [2] [3] [4]
2000 December 9.6 9.6 12.2
2001 December 9.4 9.4 9.2
2002 December 9.0 9.0 10.1
2003 December 10.0 10.0 9.8
2004 December 15.2 15.2 13.3
2005 December 17.2 17.2 17.2
2006 December 24.6 24.6 23.1
2007 December 27.6 27.6 18.5
2008 December 24.8 24.8 32.0
2009 December 16.1 16.1 17.0
2010 December 12.9 12.9 13.3
2011 December 11.9 11.9 14.3
2012 December 10.4 10.4 10.6
2013 December 7.1 7.1 8.1
2012 January 0.4 0.4 11.8 14.2
February 0.6 1.0 11.5 14.1
March 0.3 1.3 9.5 13.6
April 0.9 2.2 8.0 12.9
May 1.4 3.6 8.6 12.1
June 2.4 6.1 10.9 11.7
July 0.9 7.0 11.6 11.4
August 0.6 7.6 11.4 11.2
september 0.3 7.9 11.4 11.0
October 0.5 8.4 11.4 10.8
November 0.7 9.1 11.1 10.8
December 1.2 10.4 10.4 10.6
December (proj.) 8.3 9.0
2013 January 0.4 0.4 10.4 10.5
February 0.7 1.1 10.5 10.4
March -0.3 0.8 9.8 10.5
April 1.7 2.5 10.7 10.7
May 0.3 2.8 9.6 10.8
June 0.2 3.0 7.2 10.4
July 0.2 3.2 6.5 10.0
August 0.5 3.7 6.4 9.6
september 0.3 4.0 6.4 9.1
October 0.6 4.6 6.5 8.7
November 1.0 5.6 6.8 8.4
December 1.5 7.1 7.1 8.1
December (proj.) 8.0 9.0
2014 January 0.3 0.3 7.0 7.8
February 0.5 0.8 6.8 7.5
March 0.2 1.0 7.4 7.3
April 0.7 1.7 6.3 7.0
May 0.9 2.6 6.9 6.8
December (proj.) 6.0 7.1
Sources: Banco Central de São Tomé e Príncipe, Ministry of Planning and Finance (São Tomé and Príncipe), IMF and Banco de Portugal calculations.Notes:[1] month (n) / month (n-1). [2] month (n) / previous December. [3] month (n) / month (n) of the previous year. [4] last 12 months / previous 12 months.
são tomé and príncipe

Banco de Portugal • Economic Developments in Portuguese-speaking African Countries and Timor-Leste • 2013 | 2014 68
Table 59 • Balance of paymentsusD millions
2009 20102011 2012 2013 2014
Est. Est. Proj. Est. Proj.
1. Current account -78.8 -87.6 -105.7 -98.8 -103.1 -87.2 -112.3
1.1. trade balance -74.6 -85.3 -104.7 -104.0 -104.0 -115.4 -112.8
Exports (f.o.b.) 9.2 10.9 11.0 15.1 15.1 12.9 16.2
of which: Cocoa 5.4 4.3 5.3 5.3 5.6 5.4 5.1
Re-exports 3.0 5.2 5.1 8.8 9.4 5.9 9.6
Imports (f.o.b.) -83.8 -96.2 -115.7 -119.1 -119.1 -128.3 -129.0
of which: Food -29.0 -25.5 -33.6 -34.7 -34.1 -38.4 -35.6
Capital goods -30.0 -36.0 -40.2 -36.4 -35.5 -38.5 -41.1
Fuel -14.7 -15.2 -26.6 -28.7 -25.9 -33.2 -30.9
1.2. services -8.6 -10.9 -13.0 -6.7 -8.5 -8.2 -11.6
Exports 10.4 13.4 18.4 17.9 19.0 19.5 19.1
of which: Travel and tourism 8.3 11.1 15.6 12.6 14.4 13.3 14.2
Imports -19.0 -24.3 -31.4 -24.6 -27.5 -27.6 -30.8
of which: Freights and insurance -15.4 -19.2 -23.1 -19.3 -20.9 -22.1
1.3. Income -0.3 -0.4 -0.4 -2.2 -2.5 0.7 -1.5
Credit 1.6 1.9 1.9 1.0 4.2 2.1
Debit -1.9 -2.3 -2.3 -3.2 -3.5 -3.6
of which: Scheduled debt interest -1.4 -1.6 -1.7 -1.9 -2.3 -1.9
1.4. Current transfers 4.6 9.0 12.4 14.1 11.9 35.7 13.6
private transfers -0.9 3.0 2.8 4.9 9.0 22.2 11.5
of which: Emigrants' remittances 2.0 6.4 6.9 6.4 23.1 13.2
Official transfers 5.6 6.0 9.6 9.2 2.9 13.5 2.2
2. Capital and financial account 71.4 70.3 110.8 103.6 112.5 101.7 110.3
2.1. Capital account 85.2 41.3 43.0 38.7 40.1 28.7 44.6
Capital transfers 85.2 41.3 43.0 38.7 40.1 28.7 44.6
of which: Debt relief 52.8 0.0 3.1 0.0 0.0 0.0 0.0
2.2. Financial account -13.7 29.0 67.8 64.9 72.4 72.9 65.7
General government – Medium/long-term loans -28.8 12.6 19.9 19.2 27.7 1.9 43.2
of which: Disbursements 28.6 18.2 29.2 26.1 36.3 9.7 47.9
Amortisation -57.4 -5.7 -9.4 -6.9 -8.6 -7.7 -4.7
Other assets (net) 32.6 45.0 40.7 51.2 41.9 46.2 24.7
of which: Foreign direct investment 15.3 50.5 33.9 22.1 28.0 29.5 9.7
of which: Oil signature bonuses 0.0 0.0 2.0 2.0 4.9 5.0 0.0
Short-term capital, errors and omissions -17.6 -28.6 7.2 -5.5 2.8 24.8 -2.2
3. Overall balance: (1) + (2) -7.3 -17.2 5.1 4.7 9.4 14.5 -2.1
4. Financing 7.3 17.2 -5.1 -4.7 -9.4 -14.5 2.1
Change in foreign reserves, excl. NOA(a) (increase: -) 4.4 14.7 -4.6 -4.5 -6.7 -12.4 0.9
National Oil Account (increase: -) 2.4 1.9 -0.5 -0.8 -3.2 -3.2 0.7
Use of IMF resources (net) 0.5 0.6 0.0 0.6 0.5 1.1 0.5
5. Financing gap:(b) (4) + (5) 0.0 0.0 0.0 0.0 0.0 0.0 0.0
Memo items:
Current account (% of GDp) -40.1 -43.7 -42.9 -37.8 -33.4 -28.3 -31.3
Current and capital account (% of GDp) 3.3 -23.1 -25.4 -23.0 -20.4 -19.0 -18.9
Sources: Banco Central de São Tomé e Príncipe (BCSTP), IMF and Banco de Portugal calculations.Notes: In 2014, a number of methodological changes were introduced, which modified the structure and some figures within the balance of payments, including the adoption by BCSTP of new procedures for the compilation of emigrants remittances to banks (so far, with an impact only on 2013 figures). (a) National Oil Account. (b) Net borrowing (-) / net lending (+)

69
Table 60 • Merchandise exportsDestinations, as a percentage of total exports
2004 2005 2006 2007 2008 2009 2010 2011 2012 2013 2014Q1
2004 to 2013
Angola 1.8 4.1 1.1 1.8 0.9 1.1 2.2 2.1 1.4 3.7 2.1 2.0
Belgium 9.5 11.0 14.2 16.8 7.9 18.9 20.2 29.5 13.9 20.7 35.8 17.0
Netherlands 51.7 39.1 26.9 13.3 28.2 26.8 10.9 37.4 38.8 29.1 30.2 29.7
portugal 25.5 38.0 33.1 44.9 49.2 32.3 44.4 13.2 7.7 6.2 1.6 27.7
Other 11.5 7.7 24.6 23.2 13.8 20.8 22.3 17.9 38.2 40.3 30.4 23.6
Total exports 100.0 100.0 100.0 100.0 100.0 100.0 100.0 100.0 100.0 100.0 100.0 100.0
Sources: Banco Central de São Tomé e Príncipe, Ministry of Planning and Finance (São Tomé and Príncipe), IMF and Banco de Portugal calculations.
Table 61 • Merchandise importsOrigins, as a percentage of total imports
2004 2005 2006 2007 2008 2009 2010 2011 2012 2013 2014Q1
2004 to 2013
Angola 16.0 20.3 18.3 20.1 22.9 14.8 12.1 9.6 21.9 24.3 22.5 18.1
Belgium 8.8 6.1 4.6 2.3 1.7 1.9 1.8 1.7 3.3 1.9 1.2 2.8
China 0.1 0.2 0.3 1.7 0.9 1.4 2.4 2.0 1.4 1.6 2.6 1.4
France 0.5 0.3 1.1 0.3 0.2 0.7 5.0 2.4 0.6 0.7 0.5 1.3
Gabon 1.4 0.6 3.5 2.2 3.0 2.7 5.3 2.0 2.1 1.4 1.2 2.5
Japan 6.0 7.4 0.7 0.2 0.8 4.4 1.2 2.5 1.5 1.4 1.8 2.1
Netherlands 1.0 0.3 0.8 1.4 0.1 0.4 0.5 0.3 0.4 0.3 0.2 0.5
portugal 60.4 57.1 63.6 66.2 61.3 56.4 60.9 58.9 55.7 59.8 60.3 59.7
Other 5.8 7.7 7.1 5.6 9.2 17.4 10.8 20.6 13.1 8.6 9.6 11.5
total imports 100.0 100.0 100.0 100.0 100.0 100.0 100.0 100.0 100.0 100.0 100.0 100.0
Sources: Banco Central de São Tomé e Príncipe, Ministry of Planning and Finance (São Tomé and Príncipe), IMF and Banco de Portugal calculations.
são tomé and príncipe

Banco de Portugal • Economic Developments in Portuguese-speaking African Countries and Timor-Leste • 2013 | 2014 70
Table 62 • External public debt usD millions
2009 2010 2011 2012 2013 2014
Est. Est. Est. Q1
1. Medium and long-term debt 122.6 139.7 155.2 166.7 176.2 174.9
of which: Arrears 65.7 69.1 67.7 68.7 70.3 70.6
1.1 Multilateral debt 37.0 38.6 42.1 41.0 43.7 42.1
of which: Arrears 0.0 0.0 0.0 0.0 0.0 0.0
BADEA 4.2 5.1 5.8 5.9 5.8 5.7
AfDB/ADF 2.2 3.2 2.2 2.1 5.5 5.3
EIB 2.1 1.4 0.9 0.9 0.6 0.3
IFAD 5.7 6.5 7.9 8.0 7.7 7.5
IMF 4.4 5.0 4.9 5.5 6.0 6.0
IDA 13.7 13.4 14.9 14.1 14.0 14.0
OpEC 4.7 4.0 5.5 4.5 4.1 3.3
1.2 Bilateral official debt 59.8 75.3 87.3 98.9 107.7 108.0
of which: Arrears 39.9 43.3 41.9 41.9 45.5 45.8
1.2.1 paris Club members 0.2 0.9 0.9 0.9 1.0 1.1
of which: Arrears 0.0 0.0 0.0 0.0 0.0 0.0
Germany 0.0 0.0 0.0 0.0 0.0 0.0
Belgium 0.2 0.9 0.9 0.9 1.0 1.1
spain 0.0 0.0 0.0 0.0 0.0 0.0
France 0.0 0.0 0.0 0.0 0.0 0.0
Russia 0.0 0.0 0.0 0.0 0.0 0.0
1.2.2 Other official creditors 59.6 74.4 86.4 98.0 106.7 107.0
of which: Arrears 39.9 43.3 41.9 41.9 45.5 45.8
Angola 32.0 32.0 32.0 32.0 32.0 32.0
Algeria 1.3 3.1 0.0 0.0 0.0 0.0
China 17.0 17.0 17.3 17.3 18.6 18.8
Former Yugoslavia 8.8 8.8 8.8 8.8 8.8 8.8
portugal 0.4 13.4 28.2 39.8 47.3 47.3
1.3 Commercial debt 25.8 25.8 25.8 26.8 24.8 24.8
of which: Arrears 25.8 25.8 25.8 26.8 24.8 24.8
Italy 25.8 25.8 25.8 25.8 24.3 24.3
MsF 1.0 0.5 0.5
2. Short-term debt 13.4 17.7 27.7 37.7 39.8 39.8
of which: Arrears 3.4 13.4 17.7 17.7 3.4 13.4
Angola 3.4 3.4 3.4 3.4 3.4 3.4
Brazil 0.0 4.3 4.3 4.3 4.3 4.3
Equatorial Guinea 0.0 0.0 0.0 0.0 2.1 2.1
Nigeria 10.0 10.0 20.0 30.0 30.0 30.0
Total external public debt [1 + 2] 136.0 157.4 182.9 204.4 216.0 214.7
of which: Arrears 69.1 82.5 85.4 86.4 73.7 84.0
Memo items:
Scheduled external debt service(% of exports of goods and services)
30.4 30.0 27.2 26.8 31.2
Total external public debt (% of GDP) 69.2 78.6 74.2 78.2 70.2
total arrears (% of GDp) 35.2 41.2 34.7 27.9 23.9
Sources: Banco Central de São Tomé e Príncipe, Ministry of Planning and Finance (São Tomé and Príncipe), IMF and Banco de Portugal calculations.

71
Table 63 • Government operationsBillions of dobras
2009 2010 20112012 2013 2014
Est. Budg. Est. l.e.(a) Budg.
1. total revenue 1,149 1,459 1,765 1,685 2,222 1,746 78.6 1,9881.1. Current revenue 528 707 787 771 954 953 99.8 1,076
Tax revenue 472 647 726 704 878 851 97.0 999Direct taxes 150 181 235 222 250 280 111.9 300Indirect taxes 247 374 355 388 499 460 92.3 569
of which: Customs revenue 168 312 299 334 438 398 90.9 496Other tax revenue 75 91 136 93 129 111 86.0 130
Non-tax revenue 56 60 61 67 77 102 132.4 771.2. Grants 621 752 942 876 1,190 704 59.1 912
project grants 576 699 817 706 964 509 52.7 0Other grants 13 20 77 142 193 173 89.4 881Debt relief-related grants 31 33 49 28 32 22 69.7 31
1.3. Oil signature bonuses 0 0 35 39 78 90 115.6 0
2. Total expenditure 1,724 1,847 2,317 2,226 2,978 1,864 62.6 2,943
2.1. Current expenditure 642 767 851 875 1,030 1,056 102.5 1,171Compensation of employees 252 338 369 419 449 521 116.2 542Goods and services 195 191 234 198 236 216 91.6 229subsidies and transfers 144 193 181 190 287 256 89.0 304public debt interest 16 16 24 30 24 28 119.4 37Other current expenditure 35 29 43 39 34 34 99.1 58
2.2. Capital expenditure 1,048 1,060 1,437 1,336 1,920 791 41.2 1,741With domestic financing 126 87 65 74 99 60 61.3 108With external financing 922 972 1,373 1,262 1,821 730 40.1 1,634
2.3. HICP Initiative-related expenditure 33 21 29 14 28 17 62.3 31
3. Overall balance (commitment basis) [1] - [2] -575 -389 -552 -540 -756 -117 -955
4. Change in arrears [decrease: -] 0 0 59 33 0 -22 0
External arrears (interest) 0 0 0 0 0 0 0Domestic arrears 0 0 59 33 0 -22 0
5. Items in transit, errors and omissions -2 -77 5 51 0 51 0
6. Overall balance (cash basis) [3] + [4] + [5] -577 -466 -488 -456 -756 -89 -955
7. Financing 577 466 488 456 756 89 955
7.1. Domestic financing 182 184 11 -86 0 52 0Net bank credit (excl. NOA)(b) 149 166 11 -86 0 -69 0Non-bank financing 33 17 0 0 121
7.2. External financing 356 246 450 558 800 94 909Direct disbursements to the GSBudget 9 1 1 75 0 0 0Disbursements for projects 388 293 528 532 857 159 18.5 974Scheduled amortisation (incl. relief) -43 -48 -79 -49 -58 -64 -65Bilateral rescheduling 2 0 0 0 0 0 0Change in arrears (capital) 0 0 0 0 0 0 0
7.3. transfer from/to NOA(b) [entered into GSB: +] 39 36 27 -15 -44 -58 45
8. Financing gap [6] + [7] 0 0 0 0 0 0 0
Memo items:Overall balance, commitment basis (% of GDp)
-18.0 -10.5 -12.6 -10.8 -13.1 -2.0 -14.6
excluding debt relief (% of GDP) -19.0 -11.3 -13.7 -11.3 -13.6 -2.4 -15.1excl. debt relief and oil bonuses (% of GDP) -19.0 -11.3 -14.5 -12.1 -15.0 -4.0 -15.1
Domestic primary balance(c) -257 -152 -133 -163 -178 -153 -197(% of GDp) -8.1 -4.1 -3.0 -3.3 -3.1 -2.7 -3.0
Sources: Banco Central de São Tomé e Príncipe, Ministry of Planning and Finance (São Tomé and Príncipe), IMF and Banco de Portugal calculations.Notes: (a) Level of budget execution, per cent. (b) National Oil Account (NOA). (c) Overall balance (commitment basis), excluding grants, oil revenue (signature bonuses and other), debt interest and capital expenditure financed by external sources.
são tomé and príncipe

Banco de Portugal • Economic Developments in Portuguese-speaking African Countries and Timor-Leste • 2013 | 2014 72
Table 64 • Monetary surveyEnd-of-period stocks, billions of dobras
2009 2010 2011 20122013 2013 / 2012 2014
Apr.Apr 2014
/ Dec. 2013 2014
Proj. Est. (A) (B) Est. (A) (B) Proj.
1. Net foreign assets 1,279 1,364 1,263 1,630 1,409 1,648 1.1 0.9 1,812 10.0 7.7 1,947
1.1. Central bank 1,228 998 891 1,062 975 1,292 21.7 12.2 1,420 10.0 6.0 1,347
1.2. Commercial banks 50 367 372 568 434 356 -37.4 -11.3 392 10.1 1.7 600
2. Net domestic assets -145 53 303 254 712 500 96.7 13.0 255 -48.9 -11.4 422
2.1. Net domestic credit 810 1,466 1,728 1,795 1,893 1,651 -8.0 -7.6 1,358 -17.7 -13.6 2,088
2.1.1. Net credit to centr. gov. -280 -60 -22 -123 -172 -250 -102.7 -6.7 -508 -103.0 -12.0 -237
2.1.1.1. Gross loans 158 261 267 236 236 246 4.5 0.6 241 -2.1 -0.2 229
2.1.1.2. Deposits -438 -321 -290 -359 -408 -496 38.2 -7.3 -749 50.9 -11.8 -466
2.1.2. Credit to the economy 1,090 1,526 1,750 1,918 2,065 1,902 -0.9 -0.9 1,866 -1.8 -1.6 2,325
2.2. Other assets and liabilities -955 -1,412 -1,424 -1,541 -1,181 -1,152 25.3 20.7 -1,103 4.2 2.2 -1,666
3. Broad money 1,133 1,417 1,566 1,884 2,121 2,147 14.0 14.0 2,067 -3.7 -3.7 2,369
3.1. Currency in circulation 149 163 177 173 192 187 8.2 162 -13.3 170
3.2. Demand deposits 718 922 955 1,070 1,404 31.2 1,352 -3.7
3.2.1. In national currency 288 399 493 561 644 872 55.5 757 -13.2 823
3.2.2. In foreign currency 431 524 462 510 532 4.5 595 11.8
3.3. Other deposits 266 331 434 641 556 -13.2 553 -0.5
3.3.1. In national currency 116 23 53 184 143 303 64.9 351 15.7 435
3.3.2. In foreign currency 150 308 381 457 253 -44.7 202 -19.9
Sources: Banco Central de São Tomé e Príncipe, IMF and Banco de Portugal calculations.Notes: (A) Percentage changes from the previous December. (B) Changes as a percentage of the initial stock of broad money (expansion / contraction determinants).
Table 65 • Interest ratesannual rates, per cent
2009 2010 2011 2012 2013 2014
Dec. Dec. Dec. Dec. Mar. Jun. Sep. Dec. Mar. Apr.
1. BCstp reference rate 16.0 15.0 15.0 14.0 14.0 14.0 14.0 14.0 14.0 12.0
2. Lending rates
2.1. Credit (91-180 days) 31.2 26.8 26.0 26.0 23.8 23.7 23.3 23.0 22.5 22.6
2.2. Credit (181 days-1 year) 28.7 27.0 26.0 26.0 23.1 23.3 23.4 23.3 22.2 21.8
2.3. Credit (over 1 year) 28.0 26.7 26.5 26.5 26.5 25.1 25.1 25.1 24.9 24.6
3. Deposit rates
3.1. Deposits (up to 90 days) 10.2 11.6 12.2 12.2 7.7 7.7 6.3 7.6 7.8 6.7
3.2. Deposits (91 days-1 year) 11.3 13.2 13.7 13.7 8.2 8.1 7.2 8.0 6.9 6.2
3.3. Deposits (over 1 year) Negotiable 13.9 12.8 12.8 8.0 8.0 8.0 6.3 9.0
Memo item:
Inflation (end-of-period % change) 16.1 12.9 11.9 10.4 9.8 7.2 6.4 7.1 7.4 6.3
Source: Banco Central de São Tomé e Príncipe (BCSTP).Note: Indicative rates (calculated on the basis of raw information provided by banks). The series after 2012 are not comparable with historical data, due to improvements in data compilation.

73
Table 66 • Exchange ratesaverage rates
Euro / Dobra USD / Dobra EERI(a)(b)
Exchange rate Annual change Exchange rate Annual change Nominal Real
2000 7,367 -3.7 7,978 12.0 197.8 140.0
2001 7,901 7.2 8,842 10.8 218.6 133.4
2002 8,586 8.7 9,088 2.8 236.9 131.8
2003 10,568 23.1 9,348 2.9 225.1 115.5
2004 12,306 16.4 9,902 5.9 202.4 106.8
2005 13,123 6.6 10,519 6.2 191.9 111.4
2006 15,630 19.1 12,445 18.3 158.4 107.6
2007 18,558 18.7 13,537 8.8 134.6 103.8
2008 21,602 16.4 14,685 8.5 116.9 113.5
2009 22,510 4.2 16,208 10.4 112.3 124.7
2010 24,500 8.8 18,574 14.6 105.4 127.3
2011 24,500 0.0 17,754 -4.4 107.0 139.8
2012 24,500 0.0 19,211 8.2 105.5 146.1
2013 24,500 0.0 18,618 -3.1 106.5 156.1
2012 January 24,500 0.0 19,153 3.5 105.5 141.6
February 24,500 0.0 18,682 3.2 106.1 142.8
March 24,500 0.0 18,694 5.9 106.1 141.8
April 24,500 0.0 18,758 9.5 106.0 142.5
May 24,500 0.0 19,251 12.0 105.4 143.7
June 24,500 0.0 19,705 14.8 104.9 146.5
July 24,500 0.0 20,048 16.0 104.5 147.1
August 24,500 0.0 19,931 15.7 104.6 147.9
september 24,500 0.0 19,212 7.4 105.5 148.7
October 24,500 0.0 19,030 5.5 105.7 149.0
November 24,500 0.0 19,243 5.9 105.5 149.8
December 24,500 0.0 18,831 0.6 106.0 151.9
2013 January 24,500 0.0 18,858 -1.5 106.4 154.3
February 24,500 0.0 18,451 -1.2 106.6 155.3
March 24,500 0.0 19,030 1.8 105.8 151.7
April 24,500 0.0 18,983 1.2 105.9 154.3
May 24,500 0.0 19,011 -1.3 105.9 154.2
June 24,500 0.0 18,723 -5.0 106.3 154.8
July 24,500 0.0 18,883 -5.8 106.1 155.0
August 24,500 0.0 18,544 -7.0 106.5 156.9
september 24,500 0.0 18,511 -3.6 106.7 156.8
October 24,500 0.0 18,110 -4.8 107.4 158.6
November 24,500 0.0 18,292 -4.9 107.1 159.8
December 24,500 0.0 18,026 -4.3 107.5 162.0
2014 January 24,500 0.0 18,120 -3.9 107.4 163.8
February 24,500 0.0 18,082 -2.0 107.4 164.6
March 24,500 0.0 17,852 -6.2 107.7 163.6
April 24,500 0.0 17,872 -5.9 107.7 164.3
May 24,500 0.0 17,951 -5.6 107.6 165.6
Sources: Banco Central de São Tomé e Príncipe and Banco de Portugal calculations.Notes: (a) Effective exchange rate index (EERI), calculated on the basis of official rates applied to the currencies of the four main trading partners over the period 2005/09. (b) An increase/decrease in the EERI (nominal or real) corresponds to an appreciation / depreciation of the dobra (Index, 100: January 1999).
são tomé and príncipe


6. tIMOr-lEstEArea: 14,954 Km2
Capital city: Dili
Population: 1,212 thousand (2014; source: General Directorate of Statistics)
Currency: Us dollar
Economic activity in Timor-Leste slowed after the high growth rates recorded from 2007 to 2011. This slowdown had a positive impact on inflation – which is now virtually nil – and is mainly the result of a less expansionary fiscal policy. The exploitation of energy resources started to follow a downward path, leading to a decrease in oil revenue. As this revenue, however, remains significant, the value of the Petroleum Fund has continued to increase.

Banco de Portugal • Economic Developments in Portuguese-speaking African Countries and Timor-Leste • 2013 | 2014 76
6.1. Timor-Leste overviewEconomic developments in Timor-Leste have shown a sharp turnaround during the period under analysis from their pattern in previous years: non-oil domestic output slowed down markedly from its growth levels up to 2011, and inflation (which stood at a two-digit level in mid-2013) is currently nil.
The level of economic activity (assessed by the real rate of change in non-oil GDP) grew by 7.8 per cent in 2012 and estimates for 2013 and 2014 are lower (5.4 and 6.6 per cent respecti-vely), in strong contrast with rates between 10 and 15 per cent seen from 2007 to 20111.
This slowdown mainly reflects a decrease in fis-cal stimulus, after a phase of high public invest-ment (specifically in infrastructures for the pro-duction and distribution of electricity in 2011 and 2012). In turn, this new understanding is the combination of two factors: on the one hand, a continuous decrease in oil revenue, on the other, the fact that high public expenditure in previous years led to unsustainable levels of inflation and imports (in view of an inadequate response from the domestic economy).
Oil production (accounting for around three quarters of total output) is already clearly decli-ning, as seen in the negative rates of change in total GDp recorded in 2012 and 2013, and is expected to continue to decline in the following years.
However, in spite of a decrease (already seen in 2013 and expected to be more marked in 2014
and the following years), the amount of oil reve-nue remains above fiscal funding needs. The value of the Petroleum Fund assets therefore continues on a growth path, having amounted to over USD 16.6 billion this past June.
External trade flows remain highly unbalan-ced: imports continued to grow (although not as strongly as in previous years), while exports (mostly coffee) decreased, owing to a decline in the international price of coffee and the fact that coffee plantations were not renewed. This imbalance in the trade balance stems from the fact that oil sales are not accounted for in time as exports, but rather as income from abroad, which is only adjusted with the publication of the National Accounts (with a delay of around two years).
The characteristics of the monetary system are strongly influenced by the dollarisation and the small size of the banking system. Credit has a relatively small role (around 3 per cent of natio-nal income; 10 per cent of non-oil GDP). This is the result of limited productive investment opportunities and deficiencies in the applicable legal framework (specifically in registering pro-perty and granting and executing guarantees). Nevertheless, credit has grown somewhat in the past few years, in contrast with the second half of the previous decade.
The dollarisation clearly marks the country’s exchange rate relationship with its economic partners, resulting in a continued appreciation vis-à-vis the currencies of its main trading part-ners in the past few years.
Table 67 • Main economic indicators
2011 2012 2013 2014
Est. For.
Total GDP (real % change) 7.9 -10.4 -10.7 -10.2
Non-oil GDP (real % change) 14.7 7.8 5.4 6.6
Inflation (e-o-p % change)(a) 17.4 11.7 4.0 0.0
Broad money (rate of change)(a) 10.6 26.2 23.1 -11.5
Current account (% of non-oil GDp) 209 210 160 68
Fiscal balance (% of non-oil GDp) 220 228 141 55
Oil revenue (% of non-oil GDp) 308 312 246 137
petroleum Fund (% of non-oil GDp) 829 927 1077 972
Sources: BCTL, Ministry of Finance (Timor-Leste) and International Monetary Fund.Note: (a) The figure for 2014 corresponds to the change recorded at the end of July.

77
Table 68 • Main economic indicators
2009 2010 2011 20122013 2014
For. Est. For. Est.
Output and prices
Gross domestic income UsD millions 2,556 3,295 4,732 4,690 6,305 4,175 3,737
total GDp UsD millions 3,299 4,215 5,726 5,579 6,129 4,941 4,510
total GDp real % change -6.7 -1.4 7.9 -10.4 -3.2 -10.7 -10.2
Non-oil GDp UsD millions 818 935 1,123 1,270 1,791 1,392 1,609
Non-oil GDp real % change 12.9 9.4 14.7 7.8 8.1 5.4 6.6
Inflation e-o-p % change 1.8 9.2 17.4 11.7 11.0 4.0 1.0 0.0 Jul.
Inflation average % change 0.7 6.8 17.4 11.8 11.4 10.8 2.5 4.0 Jul.
Public finances
total revenue % of non-oil GDp 249 293 343 343 176 248 159
Domestic revenue % of non-oil GDp 8 10 10 11 8 10 10
Oil revenue % of non-oil GDp 207 250 308 312 156 221 138
Other revenue % of non-oil GDp 34 33 25 22 14 15 8
Total expenditure % of non-oil GDp 70 114 123 114 103 107 105
Current expenditure % of non-oil GDp 27 54 45 54 47 53 62
Capital expenditure % of non-oil GDp 43 60 78 60 56 54 43
Overall balance % of non-oil GDp 179 179 220 228 72 141 55
petroleum Fund % of non-oil GDp 657 738 829 927 793 1,077 1,028 1034 Jun.
Money and credit
Net foreign assets(a) UsD millions 443 622 689 1,179 986 1,130 1,108 661 Jun.
rate of change (b) 15.7 40.4 10.8 71.1 -16.4 14.6 -1.9 -40.3 Jun.
months of imports 4.8 5.9 4.6 8.3 6.4 7.3 6.3 3.8 Jun.
Credit to the economy (priv. s.) UsD millions 104 110 133 160 194 182 236 189 Jun.
rate of change(b) 5.1 5.8 20.9 20.3 21.3 -6.2 29.7 -19.9 Jun.
public sector net deposits UsD millions 206 331 413 841 648 651 770 286 Jun.
rate of change(b) -10.4 60.7 24.8 103.6 -22.9 0.5 18.3 -62.9 Jun.
Broad money UsD millions 268 296 326 412 493 507 600 449 Jun.
rate of change(b) 40.3 10.4 10.1 26.4 19.7 2.8 18.3 -25.2 Jun.
Balance of payments
Merchandise exports(c) UsD millions 15 27 29 33 37 18 20
Merchandise imports UsD millions -337 -307 -402 -672 -769 -694 -753
Oil income(d) UsD millions 1,660 2,331 3,461 3,960 3,273 3,427 2,199
Current account UsD millions 1,285 1,678 2,352 2,668 2,105 2,224 1,098
% of non-oil GDp 157 179 209 210 118 160 68
Capital and financial account UsD millions -1,243 -1,505 -2,249 -2,242 -2,299 -2,574 -1,113
% of non-oil GDp -152 -161 -200 -177 -128 -185 -69
Overall balance UsD millions 39 156 55 422 -194 -197 -15
% of non-oil GDp 4.8 16.7 4.9 33.2 -10.8 -14.1 -0.9
Exchange rates
UsD / IDR (Indonesia) average rate 10,412 9,085 8,777 9,384 10,463 11,689 Jul.
UsD / AUD (Australia) average rate 1.28 1.09 0.97 0.97 1.04 1.06 Jul.
Nominal EERI (Index 100, 2001)(e) rate of change(b) -13.5 -5.3 -0.2 1.3 18.4 -3.1 Jul.
Real EERI (Index, 100: 2001)(e) rate of change(b) -13.3 -1.0 13.1 6.6 20.9 -3.7 Jun.
Sources: BCTL, Bank Indonesia, Reserve Bank of Australia, Monetary Authority of Singapore, International Monetary Fund and Banco de Portugal calculations.Notes: (a) Does not include Petroleum Fund assets; (b) Rate of change compared with the previous December; (c) Does not include oil / gas exports; (d) Includes payments to the State by energy companies and income from Petroleum Fund investments; (e) Effective Exchange Rate Index (EERI), calculated on the basis of the exchange rates of the main trading partners of Timor-Leste (appreciation: +; depreciation: -).
timor-leste

Banco de Portugal • Economic Developments in Portuguese-speaking African Countries and Timor-Leste • 2013 | 2014 78
Table 69 • Gross domestic productCurrent prices, usD millions
2008 2009 2010 2011 2012 2013 2014
Est. For.
Agriculture. fishing and forestry 171 173 191 193 236
Mining and quarrying 3,746 2,473 3,281 4,605 4,310
of which: Oil and gas 3,745 2,472 3,281 4,604 4,309
Manufacturing 12 12 11 11 12
Construction 91 139 155 248 239
trade and services 325 364 410 436 479
Trade (whole and retail) 164 183 187 203 222
telecommunications 30 38 45 56 62
Financial activities 4 4 3 8 9
Real estate activities 71 74 84 92 113
Professional. scient.. technical and admin. activities 5 7 25 30 34
Other services 51 58 66 47 39
public administration 94 148 175 216 279
Non-oil Gross Domestic product (at factor costs) 694 837 942 1,105 1,246
Non-oil Gross Domestic product (market prices) 694 818 934 1,123 1,270 1,392 1,609
total GDp (incl. oil production) 4,438 3,290 4,215 5,707 5,545 4,941 4,510
Consumption 1,239 1,416 1,551 1,707 1,995
private consumption 511 569 637 723 906
Government consumption 728 847 914 984 1089
Gross investment 203 490 550 829 831
Gross Fixed Capital Formation 202 489 549 828 798
Changes in inventories 1 1 1 1 33
Domestic demand 1,442 1,906 2,101 2,536 2,826
Exports of goods and services (incl. oil and gas) 4,259 3,066 3,960 5,283 5,187
Overall demand 5,700 4,972 6,061 7,819 8,013
Imports of goods and services 932 1,316 1,461 1,629 1,598
Memo item:
Non-oil GDp (% of total GDp) 16.0 25.0 22.2 19.6 22.8 28.2 35.7
Non-oil GDP (real % change) 14.3 12.9 9.5 14.7 7.8 5.4 6.6
Sources: General Directorate of Statistics (Timor-Leste) (2000/2012 National Accounts), International Monetary Fund and Banco de Portugal calculations.

79
Table 70 • Consumer price indexper cent
Monthly change Year-on-year change Average change
[1] [2] [3]
2002 December 9.5
2003 December 4.2 7.2
2004 December 1.8 3.2
2005 December 0.9 1.1
2006 December 7.3 3.9
2007 December 8.6 10.3
2008 December 7.5 9.0
2009 December 1.8 0.7
2010 December 9.2 6.8
2011 December 17.4 13.5
2012 December 11.7 11.8
2013 December 4.0 10.8
2012 January 1.4 17.7 14.3
February -0.7 12.6 14.4
March 0.7 10.1 14.0
April 0.8 11.0 13.8
May 0.3 11.2 13.6
June 0.2 11.0 13.3
July 0.3 11.1 13.1
August 0.4 11.3 13.0
september 1.1 11.4 12.8
October 1.1 11.5 12.5
November 1.9 11.6 12.2
December 3.8 11.7 11.8
2013 January 1.3 11.2 11.3
February 0.6 12.7 11.3
March 1.0 12.2 11.4
April 0.5 12.6 11.6
May 0.3 12.6 11.7
June 0.3 13.0 11.9
July -0.4 12.0 12.0
August 0.2 11.8 12.0
september -0.1 10.5 11.9
October 0.3 9.7 11.8
November 0.1 7.7 11.4
December -0.1 4.0 10.8
2014 January 0.1 2.8 10.0
February 0.0 2.2 9.1
March 0.1 1.3 8.2
April 0.1 0.9 7.2
May -0.6 0.0 6.1
June -0.3 -0.6 5.0
July 0.2 0.0 4.0
Sources: BCTL, General Directorate of Statistics (Timor-Leste) and Banco de Portugal calculations.Notes: [1] month (n) / month (n-1); [2] month (n) / month (n) of the previous year; [3] last 12 months / previous 12 months.
timor-leste

Banco de Portugal • Economic Developments in Portuguese-speaking African Countries and Timor-Leste • 2013 | 2014 80
Table 71 • Balance of paymentsusD millions
2009 2010 2011 2012 2013 2014
Proj. Est. Proj.
Current account 1,285 1,678 2,352 2,668 2,105 2,224 1,098
trade account -323 -280 -373 -638 -731 -676 -732
Exports(a) 15 27 29 33 37 18 20
of which: Coffee 8 17 12 19 33 16 19
Imports -337 -307 -402 -672 -769 -694 -753
of which: Consumer and intermediate goods -279 -257 -303 -506 -628 -522 -563
Capital goods -56 -50 -99 -166 -141 -171 -189
services -776 -961 -1,385 -998 -1,004 -581 -547
Exports 52 75 79 69 86 45 51
of which: Travel 16 31 24 21 26 29 33
Imports -828 -1,036 -1,464 -1,068 -1,090 -627 -598
Income 1,933 2,435 3,577 3,873 3,394 3,304 2,191
of which: Oil revenue(b) 1,660 2,331 3,461 3,960 3,273 3,427 2,199
Current transfers 451 484 533 432 447 177 186
of which: Official grants 444 445 457 395 290 152 −
Capital and financial account -1,243 -1,505 -2,249 -2,242 -2,299 -2,574 -1,113
Capital account 27 31 26 23 28 20 28
Financial account -1,273 -1,536 -2,275 -2,265 -2,326 -2,594 -1,141
of which: Investment of oil savings -1,330 -1,509 -2,424 -2,465 -2,431 -2,283 -1,492
Foreign direct investment 50 55 14 31 53 31 109
External debt flows 0 0 0 22 44 44 31
Items in transit, errors and omissions 2 -17 -48 -4 0 154 0
Overall balance 39 156 55 422 -194 -197 -15
Financing -39 -156 -55 -422 194 197 15
Change in net foreign assets (increase: -) -39 -156 -55 -422 194 197 15
Memo items: (% of non-oil GDp)
Oil income(b) 203 249 308 312 183 246 137
Current account 157 179 209 210 118 160 68
Capital and financial account -152 -161 -200 -177 -128 -185 -69
Overall balance 4.8 16.7 4.9 33.2 -10.8 -14.1 -0.9
Sources: BCTL, International Monetary Fund and Banco de Portugal calculations.Notes: (a) The value of revenue from oil exports is accounted for as income and therefore is not recorded as merchandise exports; (b) Includes income from Petroleum Fund investments; the forecast for 2014 is calculated by the IMF, differing from the 2014 Overall State Budget.

81
Table 72 • Merchandise exportsDestinations, as a percentage of total exports
2004 2005 2006 2007 2008 2009 2010 2011 2012 2013
United states 47.5 49.1 40.8 45.9 26.2 33.8 43.2 23.3 26.1 36.3
Germany 5.9 20.7 24.2 2.4 26.3 27.9 25.3 45.1 25.4 48.0
singapore 2.2 1.1 7.6 17.6 10.8 3.4 9.0 4.2 36.0 1.7
Indonesia 17.1 5.0 13.6 5.0 16.4 4.9 4.2 3.7 0.9 0.0
portugal 7.8 11.9 2.1 2.6 6.3 8.9 4.3 0.9 0.6 0.9
Australia 12.5 5.5 3.6 7.8 2.1 3.0 4.1 2.3 0.3 3.4
Japan 1.2 1.2 1.4 0.0 5.0 4.7 3.7 5.4 3.8 6.4
Other 5.9 5.4 6.7 18.7 6.9 13.4 6.1 15.1 6.9 3.2
Value of exports (a) 8.0 9.0 9.3 6.6 14.1 14.6 27.1 28.7 33.3 17.7
Sources: BCTL, Ministry of Finance (Timor-Leste) and Banco de Portugal calculations.Note: (a) USD millions.
Table 73 • Merchandise importsOrigins, as a percentage of total imports
2004 2005 2006 2007 2008 2009 2010 2011 2012 2013
Indonesia 53.0 47.0 43.0 22.7 40.9 31.2 32.2 28.8 22.2 26.1
singapore 13.4 14.6 19.4 11.3 16.4 18.1 15.1 6.3 6.8 9.0
China 1.0 1.7 2.5 2.7 2.0 3.9 7.2 17.6 6.5 5.7
Malaysia 0.6 0.8 0.9 0.0 4.4 2.7 1.7 4.0 7.7 11.5
vietnam 4.6 4.5 5.0 1.7 6.7 11.7 4.7 2.2 4.6 5.9
Australia 17.7 13.9 12.5 29.2 13.3 16.0 8.4 4.5 3.5 2.3
Japan 1.1 10.4 2.5 7.4 2.2 2.6 3.4 1.7 3.5 1.6
portugal 1.5 1.6 2.2 0.7 1.2 3.2 2.4 1.4 1.6 1.8
Thailand 1.2 1.1 3.5 0.0 2.0 1.1 1.1 2.4 1.7 1.0
Other 5.9 4.5 8.5 24.3 11.0 9.3 23.8 30.9 41.9 35.2
value of imports (a) 113.5 101.6 87.7 206.1 268.6 295.1 307.4 401.9 671.6 693.5
Sources: BCTL, Ministry of Finance (Timor-Leste) and Banco de Portugal calculations.Note: (a) USD millions.
timor-leste

Banco de Portugal • Economic Developments in Portuguese-speaking African Countries and Timor-Leste • 2013 | 2014 82
Table 74 • Government operationsusD millions
2010 2011 2012 2013 2014
Budg. Est. l.e.(a) Budg.
total revenue 2,744 3,854 4,351 3,148 3,455 110 2,564
Domestic revenue 96 109 138 146 140 96 166
Direct taxes 18 28 37 42 40 95 45
Indirect taxes 32 51 61 64 61 95 75
Other domestic revenue 46 30 39 41 39 97 46
Oil revenue (b) 2,338 3,461 3,960 2,798 3,070 110 2,213
Tax revenue from oil exploration 2,117 3,240 3,559 2,309 2,693 117 1,443
Income from petroleum Fund investments 221 221 401 489 377 77 770
Grants (to infrastructures) 309 284 254 203 245 120 185
Total expenditure 1,070 1,381 1,451 1,851 1,492 81 1,685
Current expenditure 506 509 691 841 739 88 993
Compensation of employees 92 112 131 161 142 88 177
Expenditure on goods and services 246 254 342 442 395 89 480
Current transfers 169 143 219 239 203 85 336
Capital expenditure (c) 564 872 760 1,010 753 75 692
Overall balance 1,675 2,473 2,900 1,297 1,963 151 879
Overall balance (excl. oil revenue) -664 -989 -1,060 -1,501 -1,107 74 -1,334
Financing 664 989 1,060 1,501 1,107 1,334
Change in treasury balances (increase: -) -147 -70 -478 671 190 400
Drawings from the Petroleum Fund (sust. income) 650 657 654 787 730 632
Drawings from the Petroleum Fund (above sust. income) 161 399 841 0 0 271
Indebtedness (disbursements) 0 0 22 44 43 31
Other (including errors and omissions) 0 4 21 -1 144 0
Memo items:
Non-oil GDp (UsD millions) 935 1,123 1,270 1,791 1,392 1,609
Overall balance (% of non-oil GDp) 179 220 228 72 141 55
Overall balance, excl. oil revenue (% of non-oil GDp) -71 -88 -83 -84 -80 -83
petroleum Fund (cumulated, UsD millions) 6,904 9,310 11,775 14,206 14,986 15,639
petroleum Fund (% of non-oil GDp) 738 829 927 793 1,077 972
Sources: BCTL, Ministry of Finance (Timor-Leste), International Monetary Fund and Banco de Portugal calculations.Notes: (a) Level of budget execution, per cent; (b) Includes tax revenue from oil exploration and income from the Petroleum Fund's financial investments; (c) Includes investment projects in infrastructures financed by grants from donors.

83
Tabl
e 75
• M
onet
ary
surv
ey
usD
mill
ions
2009
2010
2011
2012
2013
2013
/201
220
1420
14 Ju
n/20
13
Dec
Dec
Dec
Dec
Dec
[1]
[2]
June
[1]
[2]
Net
fore
ign
asse
ts44
362
268
91,
179
1,13
0-4
.1-1
1.8
661
-41.
5-9
2.7
Fore
ign
asse
ts46
965
075
61,
251
1,14
8-8
.2-2
5.0
763
-33.
5-7
6.0
Banc
o Ce
ntra
l de
tim
or-L
este
250
406
498
884
687
-20.
2-4
7.7
294
-57.
2-7
7.5
Com
mer
cial
ban
ks21
924
425
936
846
225
.422
.746
91.
61.
5
Fore
ign
liabi
litie
s-2
6-2
8-6
8-7
2-1
8-7
5.1
13.2
-103
469.
7-1
6.7
Banc
o Ce
ntra
l de
tim
or-L
este
-12
-14
-12
-12
-0.3
0.0
-12
0.4
0.0
Com
mer
cial
ban
ks-1
6-5
3-6
0-6
.1-8
9.9
13.2
-91
1,38
5.2
-16.
7
Net
dom
estic
ass
ets
-174
-327
-362
-767
-623
-18.
734
.9-2
12-6
6.0
81.2
Net
cla
ims
on g
over
nmen
t-2
06-3
31-4
13-8
41-6
51-2
2.6
46.3
-286
-56.
172
.0
Gro
ss lo
ans
122
60
00
Gov
ernm
ent d
epos
its-2
07-3
53-4
19-8
41-6
51-2
2.6
46.3
-286
-56.
172
.0
Cred
it to
the
priv
ate
sect
or10
411
013
316
018
213
.65.
318
93.
81.
5
Oth
er a
sset
s (n
et)
-72
-105
-83
-86
-155
79.3
-16.
6-1
16-2
5.2
7.7
tota
l ass
ets
268
295
326
412
507
23.1
449
-11.
5
Broa
d m
oney
(M
3)26
829
532
641
250
723
.144
9-1
1.5
Curr
ency
in c
ircul
atio
n (c
oin)
(a)
2.8
3.4
3.9
4.8
6.7
41.3
8.3
23.9
Dem
and
depo
sits
155
138
163
206
279
35.8
247
-11.
5
Tim
e de
posi
ts a
nd o
ther
dep
osits
111
154
160
201
221
9.7
194
-12.
2
Mem
o ite
ms:
petr
oleu
m F
und
asse
ts (U
sD m
illion
s)5,
377
6,90
49,
310
11,7
7514
,986
27.3
16,6
3411
.0
Net
fore
ign
asse
ts (i
n m
onth
s of
impo
rts)
4.8
5.9
4.6
8.5
7.3
3.8
Sour
ces:
BCTL
, Inter
natio
nal M
oneta
ry Fu
nd an
d Ban
co de
Portu
gal c
alcula
tions
.No
tas:[1
] Per
centa
ge ch
ange
from
the p
revio
us pe
riod.
[2] P
erce
ntage
chan
ge fr
om th
e bro
ad m
oney
at th
e end
of th
e pre
vious
perio
d (liq
uidity
expa
nsion
/ co
ntrac
tion f
actor
s).
(a) C
ircula
tion:
this a
ggre
gate
only
includ
es co
ins (c
entav
os, s
ub de
nomi
natio
ns of
the U
SD) i
ssued
by Ba
nco C
entra
l de T
imor
-Leste
, excl
uding
USD
bank
notes
, as t
hese
do no
t cor
resp
ond t
o liab
ilities
of th
e ban
king s
ystem
of Ti
mor-L
este.
timor-leste

Banco de Portugal • Economic Developments in Portuguese-speaking African Countries and Timor-Leste • 2013 | 2014 84
Table 82 • Exchange ratesaverage rates
EERI(a)
USD / AUD USD / IDR EUR / USD Nominal Real
2002 1.84 9,319 0.94 92.92 87.27
2003 1.54 8,574 1.13 84.35 81.25
2004 1.36 8,938 1.24 83.43 79.46
2005 1.31 9,709 1.24 86.59 78.70
2006 1.33 9,167 1.26 82.53 72.17
2007 1.20 9,140 1.37 71.26 69.96
2008 1.20 9,690 1.47 71.42 71.22
2009 1.28 10,412 1.39 75.10 73.75
2010 1.09 9,085 1.33 67.61 68.45
2011 0.97 8,777 1.39 63.93 70.53
2012 0.97 9,384 1.29 65.95 78.81
2013 1.04 10,463 1.33 71.46 91.10
2012 January 0.96 9,109 1.29 65.14 76.87
February 0.93 9,026 1.32 64.27 75.37
March 0.95 9,165 1.32 46.11 54.30
April 0.97 9,176 1.32 46.27 54.80
May 1.00 9,290 1.28 46.91 55.66
June 1.00 9,451 1.25 66.96 79.42
July 0.97 9,442 1.23 66.44 78.50
August 0.95 9,490 1.25 66.20 78.02
september 0.96 9,556 1.29 66.21 78.83
October 0.97 9,598 1.30 66.43 81.82
November 0.96 9,627 1.28 66.38 81.75
December 0.95 9,679 1.31 66.44 81.83
2013 January 0.95 9,723 1.33 67.03 85.29
February 0.97 9,684 1.34 67.70 86.16
March 0.97 9,710 1.30 67.70 87.13
April 0.96 9,723 1.30 67.66 87.68
May 1.01 9,760 1.30 68.56 89.04
June 1.06 9,882 1.32 69.76 90.41
July 1.10 10,073 1.31 70.91 90.12
August 1.11 10,589 1.33 73.07 92.29
september 1.08 11,346 1.33 75.45 95.30
October 1.05 11,367 1.36 74.87 94.61
November 1.07 11,613 1.35 76.15 96.16
December 1.11 12,087 1.37 78.69 98.96
2014 January 1.13 12,180 1.36 79.45 99.46
February 1.12 11,935 1.37 78.27 97.75
March 1.10 11,427 1.38 76.18 94.99
April 1.07 11,436 1.38 75.62 94.51
May 1.07 11,526 1.37 75.92 94.17
June 1.07 11,893 1.36 77.18 95.32
July 1.06 11,689 1.35 76.27
Sources: BCTL, European Central Bank, Bank Indonesia, Reserve Bank of Australia, Monetary Authority of Singapore and Banco de Portugal calculations.Notes: (a) Effective Exchange Rate Index (EERI), calculated on the basis of the exchange rates applied to the currencies of the main trading partners of Timor-Leste (appreciation: +; depreciation: -). Index, 2001 = 100

pOrtugal’s ECONOMIC aND fINaNCIal rElatIONsHIps WItH pOrtuguEsE-spEakINg afrICaN COuNtrIEs aND tIMOr-lEstE


87
OverviewIn 2013 trade in goods between portugal and portuguese-speaking African countries and timor-Leste continued to grow, accounting for 7.9 and 4.9 per cent of Portuguese total exports and imports respectively, while Portuguese gross investment in these countries fell by 78 per cent.
The larger volume of disbursements from con-cessional credit lines boosted official debt of portuguese-speaking African countries to por-tugal, which rose by 3.5 per cent. Angola con-tinues to be the main partner amongst this set
of countries, in terms of exports, imports, gross investment and debt (83, 97, 53 and 41 per cent of the total respectively).
Table 83 • Portuguese banks represented in Portuguese-speaking African countries and Timor-Leste as at July 2014
Country / Bank Form of Representation Country / Bank Form of RepresentationAngola Mozambique
Banco BpI Banco de Fomento Angola Banco BpI(a) Banco Comercial e Investimentos
Banco Comercial português
Banco Millenium Angola Banco Comercial português
Banco Internacional de Moçambique
Banco Espírito santo Banco Espírito santo Angola Banco Espírito santo(a) Moza BancoBanco santander totta(a) Banco Caixa Geral Totta
de AngolaCaixa Geral de Depósitos Banco Comercial e Investimentos
Caixa Geral de Depósitos(a) Banco Caixa Geral Totta de Angola
Montepio Geral Finibanco Angola
Cabo Verde(b) São Tomé and Príncipe
Banco Espírito santo Banco Espírito santo Cabo verde
Caixa Geral de Depósitos(a) Banco Internac. s. tomé e príncipe
BANIF, sGps Banco Cabo-verdiano de Negócios
Caixa Geral de Depósitos Banco Interatlântico Timor-LesteCaixa Geral de Depósitos(a) Banco Comercial do Atlântico Caixa Geral de Depósitos Branch
Source: Banco de Portugal.Notes: (a) Minority stake; (b) Banks with offshore operations: Banco Espírito Santo (branch), Central Mutual Agricultural Credit Bank (branch and CA Finance-Gestão de Ativos) and Montepio Geral (Banco Montepio Geral Cabo Verde).
Portugal's economic and financial relationships with Portuguese-speaking African Countries and Timor-Leste

Banco de Portugal • Economic Developments in Portuguese-speaking African Countries and Timor-Leste • 2013 | 2014 88
Table 84 • Portugal / Portuguese-speaking African countries and Timor-Leste: merchandise imports and exports (Portugal's perspective) Eur millions
Angola Cabo Verde Guinea-Bissau Mozambique S. Tomé and Príncipe Timor-Leste Total
Imp. Exp. Imp. Exp. Imp. Exp. Imp. Exp. Imp. Exp. Imp. Exp. Imp. Exp.
1996 10 305 8 97 4 22 24 40 0 13 45 476 1997 39 394 9 109 2 25 27 43 0 13 79 584 1998 22 368 9 118 2 16 28 61 1 17 62 580 1999 10 277 10 138 0 17 39 67 4 19 64 517 2000 58 371 10 170 1 28 45 69 9 19 123 657 2001 127 504 9 135 3 23 40 63 3 21 182 745 2002 70 570 9 148 3 21 37 54 0 30 1 1 121 823 2003 2 652 9 137 2 17 38 54 0 25 1 5 52 890 2004 2 671 11 140 1 18 26 55 0 24 1 1 41 909 2005 25 803 7 149 1 24 32 65 0 22 1 1 67 1,064 2006 53 1,210 7 190 1 27 29 73 1 28 1 2 92 1,530 2007 369 1,682 7 228 1 35 26 89 0 33 0 1 403 2,067 2008 408 2,260 9 257 1 40 34 91 0 36 1 2 452 2,687 2009 151 2,236 7 223 1 33 43 120 0 36 1 9 204 2,656 2010 563 1,901 7 262 0 43 29 149 0 43 1 7 602 2,404 2011 1,178 2,330 10 254 0 64 42 217 0 47 1 5 1,231 2,916 2012 1,781 2,991 9 216 0 71 16 287 0 46 0 8 1,807 3,619 2013 2,632 3,112 11 203 0 70 63 327 0 50 1 7 2,707 3,770
Source: Statistics Portugal (INE).
Table 85 • Share of trade with Portuguese-speaking African countries and Timor-Leste in portuguese trade per cent
Angola Cabo Verde Guinea-Bissau Mozambique S. Tomé and Príncipe Timor-Leste Total
Imp. Exp. Imp. Exp. Imp. Exp. Imp. Exp. Imp. Exp. Imp. Exp. Imp. Exp.
1996 0.0 1.6 0.0 0.5 0.0 0.1 0.1 0.2 0.0 0.1 0.2 2.5 1997 0.1 1.8 0.0 0.5 0.0 0.1 0.1 0.2 0.0 0.1 0.3 2.7 1998 0.1 1.6 0.0 0.5 0.0 0.1 0.1 0.3 0.0 0.1 0.2 2.5 1999 0.0 1.2 0.0 0.6 0.0 0.1 0.1 0.3 0.0 0.1 0.2 2.2 2000 0.1 1.4 0.0 0.6 0.0 0.1 0.1 0.3 0.0 0.1 0.3 2.4 2001 0.3 1.8 0.0 0.5 0.0 0.1 0.1 0.2 0.0 0.1 0.4 2.7 2002 0.2 2.0 0.0 0.5 0.0 0.1 0.1 0.2 0.0 0.1 0.0 0.0 0.3 2.9 2003 0.0 2.2 0.0 0.5 0.0 0.1 0.1 0.2 0.0 0.1 0.0 0.0 0.1 3.0 2004 0.0 2.2 0.0 0.5 0.0 0.1 0.1 0.2 0.0 0.1 0.0 0.0 0.1 2.9 2005 0.1 2.6 0.0 0.5 0.0 0.1 0.1 0.2 0.0 0.1 0.0 0.0 0.1 3.4 2006 0.1 3.4 0.0 0.5 0.0 0.1 0.1 0.2 0.0 0.1 0.0 0.0 0.2 4.3 2007 0.6 4.4 0.0 0.6 0.0 0.1 0.0 0.2 0.0 0.1 0.0 0.0 0.7 5.4 2008 0.7 5.8 0.0 0.7 0.0 0.1 0.1 0.2 0.0 0.1 0.0 0.0 0.7 6.9 2009 0.3 7.0 0.0 0.7 0.0 0.1 0.1 0.4 0.0 0.1 0.0 0.0 0.4 8.3 2010 1.0 5.1 0.0 0.7 0.0 0.1 0.1 0.4 0.0 0.1 0.0 0.0 1.1 6.4 2011 2.1 5.4 0.0 0.6 0.0 0.1 0.1 0.5 0.0 0.1 0.0 0.0 2.1 6.8 2012 3.3 6.6 0.0 0.5 0.0 0.2 0.0 0.6 0.0 0.1 0.0 0.0 3.3 8.0 2013 4.8 6.5 0.0 0.4 0.0 0.1 0.1 0.7 0.0 0.1 0.0 0.0 4.9 7.9
Sources: Statistics Portugal (INE) and Banco de Portugal calculations.

89
Tabl
e 86
• P
ortu
gal /
Por
tugu
ese-
spea
king
Afr
ican
cou
ntri
es a
nd T
imor
-Les
te: e
xpor
ts b
y gr
oup
of p
rodu
cts
(Por
tuga
l's p
ersp
ectiv
e)
Eur
mill
ions
2012
2013
Ango
laC.
Ver
deG
. Bis
sau
Moz
.S.
Tom
é Ti
mor
-L.
Tota
lAn
gola
C. V
erde
G. B
issa
uM
oz.
S.To
mé
Tim
or-L
.To
tal
Agric
ultu
ral
194.
0730
.54
2.65
8.63
7.95
0.54
244.
3821
7.82
31.5
73.
269.
8010
.36
0.76
273.
56
Food
480.
9729
.46
12.2
721
.85
10.7
71.
1755
6.49
510.
1429
.17
12.5
025
.41
12.1
11.
6559
0.98
Min
eral
fuel
s34
.75
4.59
34.8
53.
171.
220.
0278
.60
30.0
02.
1831
.70
2.21
0.81
66.9
1
Chem
ical
s20
6.65
18.8
71.
1815
.75
3.49
0.04
245.
9922
3.55
19.1
61.
3620
.15
3.68
0.06
267.
95
plas
tics,
rubb
er p
rodu
cts
144.
2911
.36
1.16
12.9
72.
110.
0617
1.95
148.
5510
.60
0.85
14.3
02.
140.
0517
6.49
Leat
her,
leat
her p
rodu
cts
6.71
1.92
0.02
0.83
0.10
0.00
9.58
11.3
32.
840.
020.
980.
110.
0715
.34
Woo
d, c
ork
28.1
34.
000.
263.
200.
210.
0235
.83
34.1
94.
190.
193.
620.
180.
0142
.38
pulp
, pap
er94
.70
7.10
0.43
16.3
00.
671.
5012
0.71
99.2
86.
440.
4615
.81
0.91
1.21
124.
11
Text
ile p
rodu
cts
36.2
32.
970.
514.
240.
420.
1244
.49
42.0
13.
340.
593.
350.
490.
0049
.80
Clot
hing
42.3
72.
630.
673.
210.
720.
0149
.61
47.5
71.
980.
194.
050.
370.
0154
.18
Foot
wea
r14
.74
0.36
0.27
1.83
0.32
0.00
17.5
227
.01
0.30
0.04
2.03
0.32
0.00
29.7
1
Min
eral
s, o
res
109.
9419
.45
4.53
8.68
2.52
0.03
145.
1411
6.88
17.5
76.
399.
522.
520.
1015
2.98
Base
met
als
439.
7622
.33
2.17
32.6
23.
600.
6250
1.10
374.
3721
.83
2.06
40.6
53.
730.
3744
3.02
Mac
hine
ry, e
quip
men
t74
0.10
40.4
85.
5010
8.78
6.67
3.26
904.
8079
2.26
34.3
06.
2412
0.25
8.04
2.38
963.
47
Mot
or v
ehic
les,
oth
er tr
ansp
ort
equi
pmen
t14
7.09
7.04
3.23
23.2
22.
600.
1018
3.27
141.
085.
542.
0528
.43
2.31
0.04
179.
45
Opt
ical
and
pre
cisi
ons
inst
rum
ents
62.5
13.
160.
104.
400.
800.
0170
.98
78.6
33.
150.
185.
240.
400.
0187
.63
Oth
er p
rodu
cts
207.
809.
481.
6816
.94
2.05
0.57
238.
5321
7.43
9.03
2.18
21.0
41.
950.
5125
2.14
Tota
l2,
990.
8021
5.75
71.4
728
6.62
46.2
48.
073,
618.
963,
112.
1120
3.19
70.2
732
6.84
50.4
57.
243,
770.
09
Sour
ce: S
tatist
ics Po
rtuga
l (IN
E).
Portugal's economic and financial relationships with Portuguese-speaking African Countries and Timor-Leste

Banco de Portugal • Economic Developments in Portuguese-speaking African Countries and Timor-Leste • 2013 | 2014 90
Tabl
e 87
• P
ortu
gal /
Por
tugu
ese-
spea
king
Afr
ican
cou
ntri
es a
nd T
imor
-Les
te: i
mpo
rts
by g
roup
of p
rodu
cts
(Por
tuga
l's p
ersp
ectiv
e)
Eur
mill
ions
2012
2013
Ango
laC.
Ver
deG
. Bis
sau
Moz
.S.
Tom
é Ti
mor
-L.
Tota
lAn
gola
C. V
erde
G. B
issa
uM
oz.
S.To
mé
Tim
or-L
.To
tal
Agric
ultu
ral
0.76
0.99
0.02
7.52
0.05
0.22
9.56
0.29
1.38
0.02
10.2
20.
010.
7012
.62
Food
0.07
0.30
0.00
7.63
0.04
0.00
8.04
0.15
0.29
0.00
49.1
40.
0249
.60
Min
eral
fuel
s1,
776.
080.
000.
000.
001,
776.
082,
627.
840.
010.
002,
627.
85
Chem
ical
s0.
000.
010.
000.
030.
000.
050.
020.
000.
000.
000.
000.
02
p las
tics,
rubb
er p
rodu
cts
0.01
0.03
0.01
0.05
0.02
0.10
0.00
0.04
0.00
0.16
Leat
her,
leat
her p
rodu
cts
0.02
0.03
0.02
0.08
0.00
0.01
0.00
0.00
0.02
Woo
d, c
ork
0.34
0.01
0.00
0.02
0.37
0.74
0.00
0.04
0.01
0.78
pulp
, pap
er0.
010.
020.
000.
010.
030.
000.
020.
000.
000.
000.
03
Text
ile p
rodu
cts
0.05
0.04
0.00
0.82
0.91
0.01
0.16
0.00
1.54
0.00
0.07
1.79
Clot
hing
0.01
1.74
0.00
0.01
0.01
1.76
0.01
3.15
0.00
3.15
Foot
wea
r0.
003.
603.
600.
003.
980.
003.
99
Min
eral
s, o
res
0.24
0.02
0.00
0.02
0.28
0.39
0.07
0.00
0.00
0.00
0.46
Base
met
als
0.09
0.22
0.01
0.01
0.00
0.33
0.04
0.29
0.08
1.03
0.00
1.43
Mac
hine
ry, e
quip
men
t1.
421.
740.
010.
050.
010.
003.
231.
081.
380.
030.
640.
010.
023.
16
Mot
or v
ehic
les,
oth
er tr
ansp
ort
equi
pmen
t0.
400.
230.
000.
070.
090.
000.
790.
610.
420.
010.
001.
04
Opt
ical
and
pre
cisi
ons
inst
rum
ents
1.35
0.04
0.00
0.03
0.02
1.44
0.94
0.12
0.00
0.03
0.00
1.10
Oth
er p
rodu
cts
0.03
0.08
0.00
0.20
0.00
0.31
0.22
0.01
0.00
0.05
0.00
0.28
Tota
l1,
780.
889.
110.
0416
.43
0.25
0.23
1,80
6.93
2,63
2.36
11.3
80.
1862
.72
0.04
0.79
2,70
7.48
Sour
ce: S
tatist
ics Po
rtuga
l (IN
E).

91
Table 88 • Current and capital accounts with Portuguese-speaking African countries and Timor-Leste (Portugal's perspective) Eur millions
Current account
Merchandise
Services Income
Current transfers
Balance Capital accountExp. Imp. Bal. Total
of which: Remittances
Emig. Immig.
Angola 2009 2,241.4 151.7 2,089.7 549.1 359.9 112.1 12.3 3,110.9 -4.5
2010 1,904.1 552.8 1,351.3 689.1 510.3 154.8 13.5 2,705.5 -2.8
2011 2,331.4 1,139.3 1,192.1 951.3 874.9 169.6 147.3 12.9 3,187.8 3.8
2012 2,994.7 1,723.9 1,270.8 1,183.1 1,019.7 291.1 270.7 15.4 3,764.7 4.5
2013 3,119.6 2,517.7 601.9 1,240.5 236.7 355.3 304.3 18.8 2,434.5 2.1
Cabo verde 2009 222.6 7.5 215.1 29.2 5.2 -35.9 2.5 20.9 213.7 -1.3
2010 262.4 8.0 254.4 10.0 22.1 -25.9 3.1 12.9 260.6 -1.7
2011 254.1 11.1 243.0 5.5 30.7 -6.6 2.8 13.3 272.6 -1.0
2012 215.8 14.4 201.4 -8.4 42.9 -10.0 2.4 14.1 226.0 2.7
2013 203.3 15.9 187.4 -3.6 12.8 -6.8 3.4 13.1 189.8 -0.2
Guinea-Bissau 2009 33.4 1.4 32.1 3.7 -1.1 -4.5 0.3 5.1 30.2 -1.5
2010 42.7 0.7 42.1 4.3 6.5 -5.5 0.3 4.8 47.4 -2.5
2011 64.3 2.1 62.2 5.5 3.0 -5.3 0.2 4.3 65.3 -1.0
2012 71.5 2.7 68.8 3.4 1.2 -3.9 0.2 2.5 69.5 -0.5
2013 70.3 1.4 68.8 2.8 0.5 0.3 0.5 2.6 72.5 0.0
Mozambique 2009 120.8 46.6 74.2 19.8 46.5 -3.2 2.4 3.2 137.3 -14.2
2010 150.6 32.7 117.9 33.9 60.8 -3.8 2.7 4.5 208.8 -14.6
2011 217.0 45.7 171.3 49.6 72.4 7.3 4.7 5.7 300.6 -14.8
2012 286.7 27.8 258.9 45.2 109.9 -1.5 5.0 8.8 412.4 -17.3
2013 327.2 74.8 252.5 50.5 47.2 -3.5 7.6 10.0 346.7 -18.3
s. tomé and príncipe
2009 35.5 2.0 33.5 6.0 0.8 0.4 0.2 0.4 40.7 -1.4
2010 42.6 1.8 40.8 7.2 0.9 -1.3 0.1 1.3 47.6 -1.3
2011 46.5 1.2 45.3 9.0 1.0 0.0 0.3 0.8 55.3 -1.1
2012 46.2 1.9 44.3 6.8 0.1 -1.3 0.3 1.3 50.0 -1.0
2013 50.4 1.4 49.0 0.7 0.6 0.3 0.7 1.0 50.6 -0.8
timor- Leste 2009 9.3 1.0 8.3 0.7 7.9 -0.9 0.3 0.1 16.0 -1.0
2010 6.7 1.2 5.5 -3.8 16.2 0.1 0.3 0.1 17.9 -0.2
2011 5.2 1.1 4.1 1.1 18.5 -5.0 0.4 0.1 18.7 -0.6
2012 8.1 0.3 7.8 3.1 15.9 -5.3 0.8 0.1 21.5 -0.5
2013 7.3 1.0 6.3 3.2 -2.8 0.7 0.3 0.1 7.4 -0.1
total of portuguese- speaking African countries and timor-Leste
2009 2,663.1 210.2 2,452.9 608.6 419.3 67.9 109.1 42.0 3,548.7 -23.9
2010 2,409.1 597.2 1,811.9 740.8 617.0 118.4 141.5 37.1 3,287.9 -23.1
2011 2,918.4 1,200.4 1,718.0 1,021.9 1,000.4 160.0 155.8 37.0 3,900.2 -14.7
2012 3,623.0 1,770.9 1,852.1 1,233.2 1,189.8 269.1 279.4 42.0 4,544.1 -12.1
2013 3,778.2 2,612.2 1,166.0 1,294.0 295.1 346.3 316.9 45.7 3,101.4 -17.3
Source: Banco de Portugal.
Portugal's economic and financial relationships with Portuguese-speaking African Countries and Timor-Leste

Banco de Portugal • Economic Developments in Portuguese-speaking African Countries and Timor-Leste • 2013 | 2014 92
Table 89 • Portuguese direct investment in Portuguese-speaking African countries and Timor-Leste By sector of activity, Eur millions
2012 2013Inv. Desinv. Inv. Desinv.
Angola Prof., scientific and tech. activ. and administrative and support service activ. 1.8 9.1 2.7 31.8 Information and communication activities 0.5 0.8 0.0 Real estate activities -0.1 2.5 0.2 2.6 Agricultural, animal prod., hunting, forestry, fishing and mining and quarrying 0.4 6.3 -0.1 Trade; repair of motor vehicles; transp. and storage; accomm., food service 230.0 25.0 44.2 24.6 Construction 148.1 362.0 23.4 191.6 Electricity, gas, steam, water, sewerage, waste manag. and remediation activ. 3.3 0.8 0.2 0.4 Manufacturing 0.6 8.4 -0.3 7.3 Monetary intermediation 507.7 60.1 57.5 5.2 Other financial and insurance activities 3.0 3.3 Other activities -3.2 4.8 -1.3 2.3 Total 892.1 479.7 129.6 265.8
Cabo verde Prof., scientific and tech. activ. and administrative and support service activ. 0.3 0.3 0.5 0.3 Information and communication activities 0.2 0.3 Real estate activities 0.0 2.1 0.0 Agricultural, animal prod., hunting, forestry, fishing and mining and quarrying 1.2 Trade; repair of motor vehicles; transp. and storage; accomm., food service 0.0 1.5 0.6 Construction 31.5 40.9 7.9 41.5 Electricity, gas, steam, water, sewerage, waste manag. and remediation activ. 0.1 0.1 0.0 Manufacturing 2.9 0.2 0.6 Monetary intermediation 10.8 0.5 6.0 0.3 Other financial and insurance activities 0.0 Other activities 2.1 0.7 Total 47.9 46.7 16.5 42.0
Guinea-Bissau Prof., scientific and tech. activ. and administrative and support service activ. 0.1 0.1 0.3 Trade; repair of motor vehicles; transp. and storage; accomm., food service 0.0 0.0 Construction 0.1 10.1 -0.3 Manufacturing 0.5 0.3 Monetary intermediation 0.0 Other activities 0.0 0.0 0.2 Total 0.7 10.1 0.2 0.3
Mozambique Prof., scientific and tech. activ. and administrative and support service activ. 3.2 12.1 1.0 6.9 Information and communication activities 0.8 0.8 0.4 Real estate activities 3.9 1.5 1.6 Agricultural, animal prod., hunting, forestry, fishing and mining and quarrying -0.1 0.0 Trade; repair of motor vehicles; transp. and storage; accomm., food service 15.2 29.6 2.1 1.1 Construction 38.2 117.6 27.7 135.9 Electricity, gas, steam, water, sewerage, waste manag. and remediation activ. 0.0 0.0 Manufacturing 7.1 4.3 0.8 Monetary intermediation 89.0 60.3 58.4 Other financial and insurance activities 2.7 0.1 Other activities -6.8 -3.2 -2.6 1.6 Total 153.1 216.4 93.3 148.2
s. tomé and príncipe
Prof., scientific and tech. activ. and administrative and support service activ. 0.9 0.0 0.0 Information and communication activities 0.0 Trade; repair of motor vehicles; transp. and storage; accomm., food service -2.0 0.4 Construction 4.4 5.6 3.6 0.4 Manufacturing 0.0 Monetary intermediation 0.6 0.2 Other activities 0.0 0.0 Total 3.9 5.6 4.2 0.4
timor-Leste Prof., scientific and tech. activ. and administrative and support service activ. 0.0 0.0 Information and communication activities 0.0 Construction 0.0 Manufacturing 0.0 Monetary intermediation 13.4 2.5 Other activities 0.5 0.1 Total 14.0 0.0 2.6 0.0
Total Portuguese-speaking African countries and Timor-Leste 1,111.6 758.5 246.5 456.7
Source: Banco de Portugal. Statistics prepared on the basis of the Survey on Portuguese Investment Abroad.

93
Table 90 • Direct investment of Portuguese-speaking African countries and Timor-Leste in PortugalBy sector of activity, Eur millions
2011 2012Inv. Desinv. Inv. Desinv.
Angola Prof., scientific and tech. activ. and administrative and support service activ. 5.3 0.1 9.2 0.7 Information and communication activities 0.1 2.2 Real estate activities 5.3 0.6 7.6 0.0 Agricultural, animal prod., hunting, forestry, fishing and mining and quarrying 6.3 1.7 Trade; repair of motor vehicles; transp. and storage; accomm., food service 10.2 4.1 2.6 1.0 Construction 11.1 1.7 11.3 0.1 Electricity, gas, steam, water, sewerage, waste manag. and remediation activ. 0.4 Manufacturing 2.7 0.2 0.0 Monetary intermediation 180.3 16.2 42.0 1.2 Other activities 5.2 0.2 5.8 0.6 Total 226.5 22.8 83.1 3.7
Cabo verde Prof., scientific and tech. activ. and administrative and support service activ. 0.1 0.2 0.6 Information and communication activities 0.2 0.4 Real estate activities 0.8 1.7 Agricultural, animal prod., hunting, forestry, fishing and mining and quarrying 0.2 Trade; repair of motor vehicles; transp. and storage; accomm., food service 0.1 Construction 0.6 0.0 Electricity, gas, steam, water, sewerage, waste manag. and remediation activ. 0.0 Monetary intermediation 0.2 Other activities 0.1 0.1 0.7 0.0 Total 2.0 0.1 3.2 0.7
Guinea-Bissau Other activities 0.1 Total 0.1 0.0 0.0 0.0
Mozambique Prof., scientific and tech. activ. and administrative and support service activ. 0.0 0.0 0.0 0.0 Information and communication activities 0.0 Real estate activities 0.3 0.2 0.2 Trade; repair of motor vehicles; transp. and storage; accomm., food service 0.0 0.1 0.1 Construction 0.0 0.0 0.5 3.1 Manufacturing 0.0 0.0 0.0 0.0 Monetary intermediation 0.0 1.6 0.2 0.3 Other activities 0.0 0.1 0.1 0.1 Total 0.4 1.6 1.1 3.7
s. tomé and príncipe
Real estate activities 0.9 Construction 0.1 0.8 Monetary intermediation 0.1 Total 0.0 1.1 0.0 0.8
timor-Leste Prof., scientific and tech. activ. and administrative and support service activ. 0.0 0.0 Other activities 0.0 0.0 Total 0.0 0.0 0.0 0.0
Total Portuguese-speaking African countries and Timor-Leste 229.0 25.6 87.4 8.9
Source: Banco de Portugal. Statistics prepared on the basis of the Survey on Portuguese Investment Abroad.
Portugal's economic and financial relationships with Portuguese-speaking African Countries and Timor-Leste

Banco de Portugal • Economic Developments in Portuguese-speaking African Countries and Timor-Leste • 2013 | 2014 94
Table 91 • Official debt of Portuguese-speaking African countries to PortugalusD millions
Direct debt to the State (1) Medium and long-term State-guaranteed debt (2) Official debt (1)+(2)
Due In arrears Total Due In arrears Total Due In arrears Total
Angola 2009 670 670 686 686 1,356 1,356
2010 642 642 799 799 1,441 1,441
2011 614 614 994 994 1,608 1,608
2012 586 586 984 984 1,570 1,570
2013 558 558 897 897 1,456 1,456
Cabo verde
2009 114 114 55 55 169 169
2010 134 134 133 133 268 268
2011 154 154 202 202 355 355
2012 187 187 318 318 505 505
2013 208 208 451 451 659 659
Guinea- Bissau
2009 81 53 134 81 53 134
2010 74 53 126 74 53 126
2011 70 55 125 70 55 125
2012 70 60 129 70 60 129
2013 71 66 138 71 66 138
Mozambi-que
2009 391 391 45 45 436 436
2010 388 388 135 135 523 523
2011 383 383 680 680 1,063 1,063
2012 376 376 803 803 1,178 1,178
2013 367 367 878 878 1,245 1,245
s. tomé and príncipe
2009 35 35 2 2 37 37
2010 35 35 14 14 49 49
2011 35 35 29 29 64 64
2012 38 38 37 37 75 75
2013 44 44 39 39 83 83
total of portuguese--speaking African countries
2009 1,291 53 1,344 788 788 2,079 53 2,132
2010 1,273 53 1,326 1,081 1,081 2,354 53 2,407
2011 1,256 55 1,310 1,905 1,905 3,161 55 3,215
2012 1,256 60 1,316 2,142 2,142 3,398 60 3,458
2013 1,248 66 1,315 2,265 2,265 3,514 66 3,580
Source: Ministry of Finance - GPEARI.
Notes1. In a recent study based on the use of conjunctural indicators, Banco Central de Timor-Leste presents a less optimistic perspective for this variable: growth of 2.5 per cent in 2013 and 4.0 per cent in 2014.