Economic Development & Classification Systems IB-SL Economics P. Messere.
26
Economic Development & Classification Systems IB-SL IB-SL Economics Economics P. Messere P. Messere
-
date post
22-Dec-2015 -
Category
Documents
-
view
225 -
download
2
Transcript of Economic Development & Classification Systems IB-SL Economics P. Messere.

Economic Development & Classification Systems
IB-SL EconomicsIB-SL Economics
P. MessereP. Messere

Assessing Living Standards
RegionGDP Increase
(% annual average change)
1980-85 1985-90 1990-00
Developed Market Economies 2.5 3.7 2.4
Developing Countries 3 4.5 4.8
E. European countries 3.1 1.5 -2.3
Increase in GDP for World’s regions (1980-2000)
According to the above table, which region has shown the greatest improvement in economic welfare?
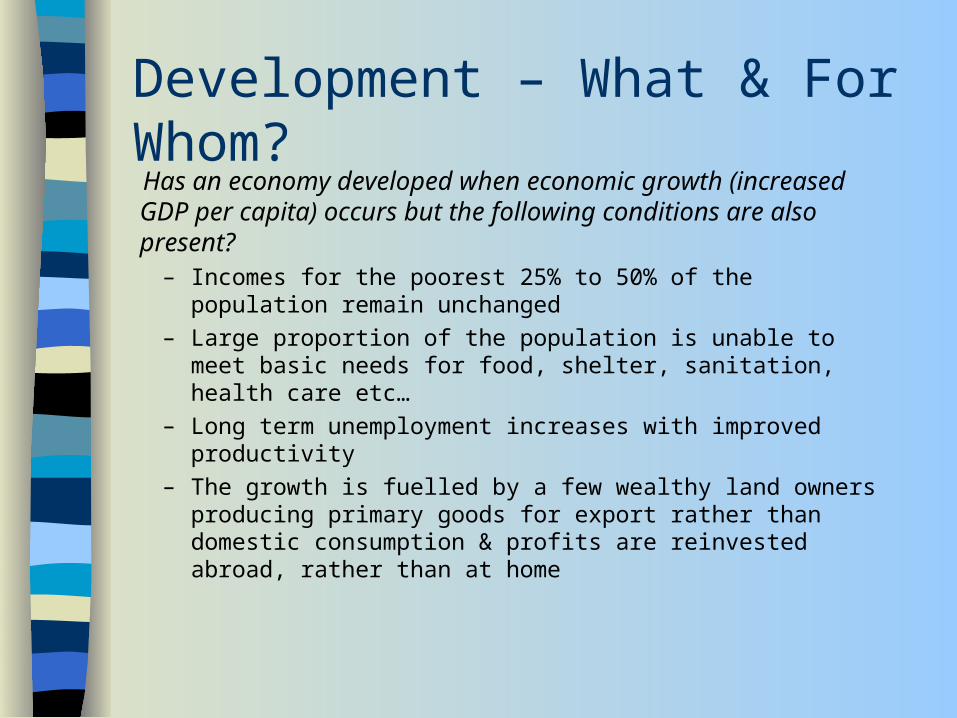
Development – What & For Whom?Has an economy developed when economic growth (increased GDP per capita) occurs but the following conditions are also present?
– Incomes for the poorest 25% to 50% of the population remain unchanged
– Large proportion of the population is unable to meet basic needs for food, shelter, sanitation, health care etc…
– Long term unemployment increases with improved productivity
– The growth is fuelled by a few wealthy land owners producing primary goods for export rather than domestic consumption & profits are reinvested abroad, rather than at home
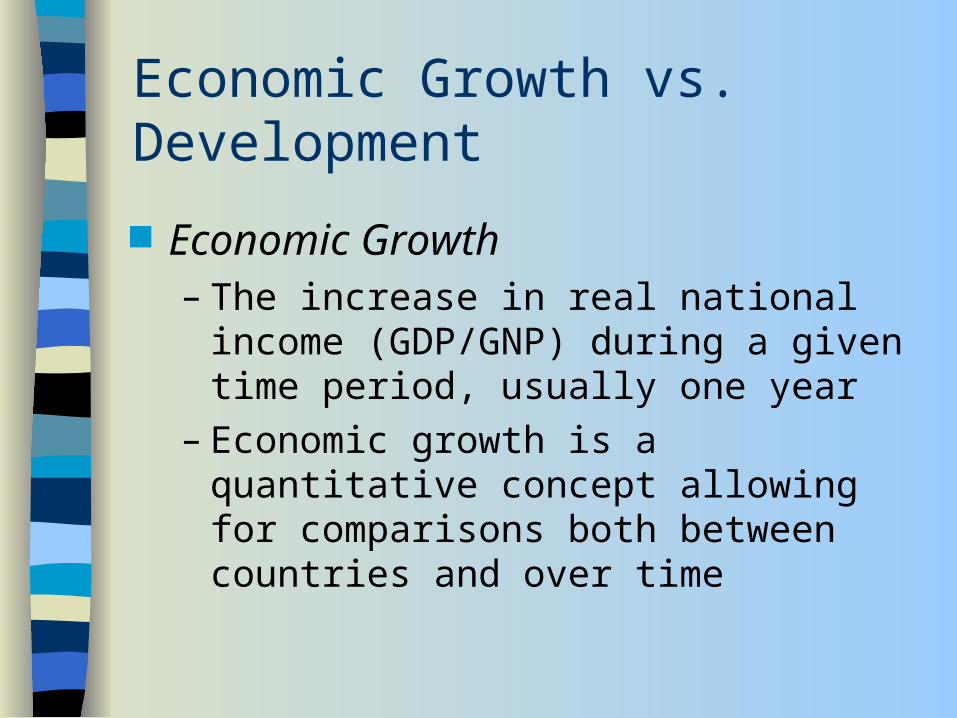
Economic Growth vs. Development
Economic Growth– The increase in real national income
(GDP/GNP) during a given time period, usually one year
– Economic growth is a quantitative concept allowing for comparisons both between countries and over time

Economic Growth vs. Development
Economic Development (Past)– Originally referred to the process of
industrialization (structural transformation of economy primarily dependent on agriculture to one producing manufactured goods) accompanied by increased real per capita GDP/GNP
• Definition proved too narrow for development economists as it did not illustrate true development in terms of increased living standards or quality of life for citizens
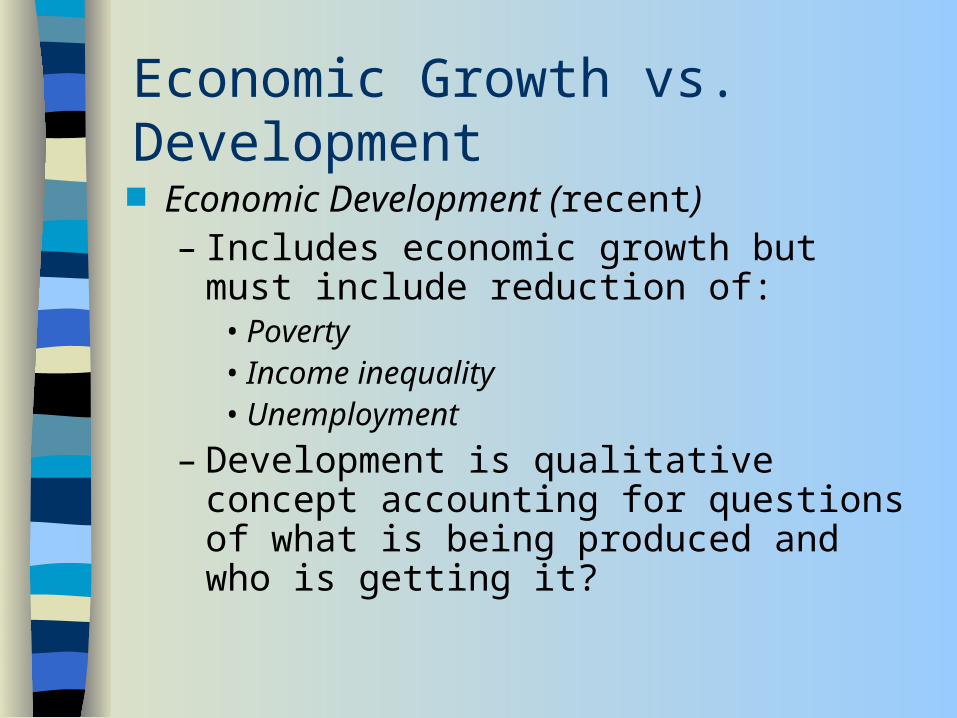
Economic Growth vs. Development
Economic Development (recent)– Includes economic growth but must include
reduction of:• Poverty• Income inequality• Unemployment
– Development is qualitative concept accounting for questions of what is being produced and who is getting it?

Development – Broader Context
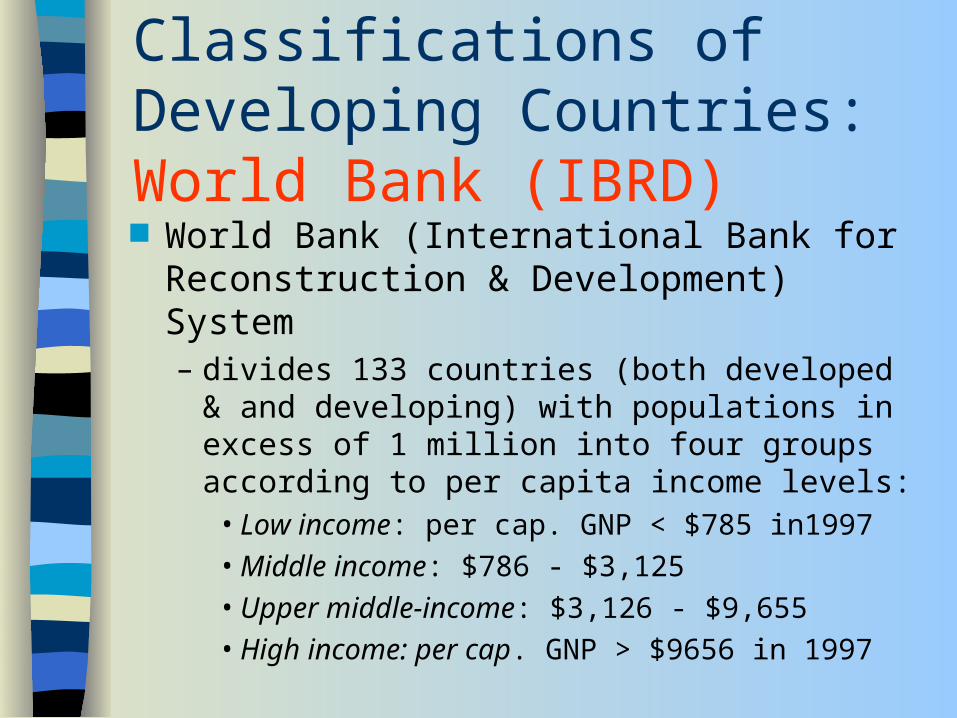
Classifications of Developing Countries: World Bank (IBRD) World Bank (International Bank for
Reconstruction & Development) System– divides 133 countries (both developed & and
developing) with populations in excess of 1 million into four groups according to per capita income levels:
• Low income: per cap. GNP < $785 in1997• Middle income: $786 - $3,125• Upper middle-income: $3,126 - $9,655• High income: per cap. GNP > $9656 in 1997

Classifications of Developing Countries: World Bank (IBRD) World Bank’s System
– first three groups (per cap. GNP to $9655) comprise 107 mostly developing countries
– last group (high income economies) made up of 26 nations; 24 from First World and other two (Kuwait & UAE) classified as developing
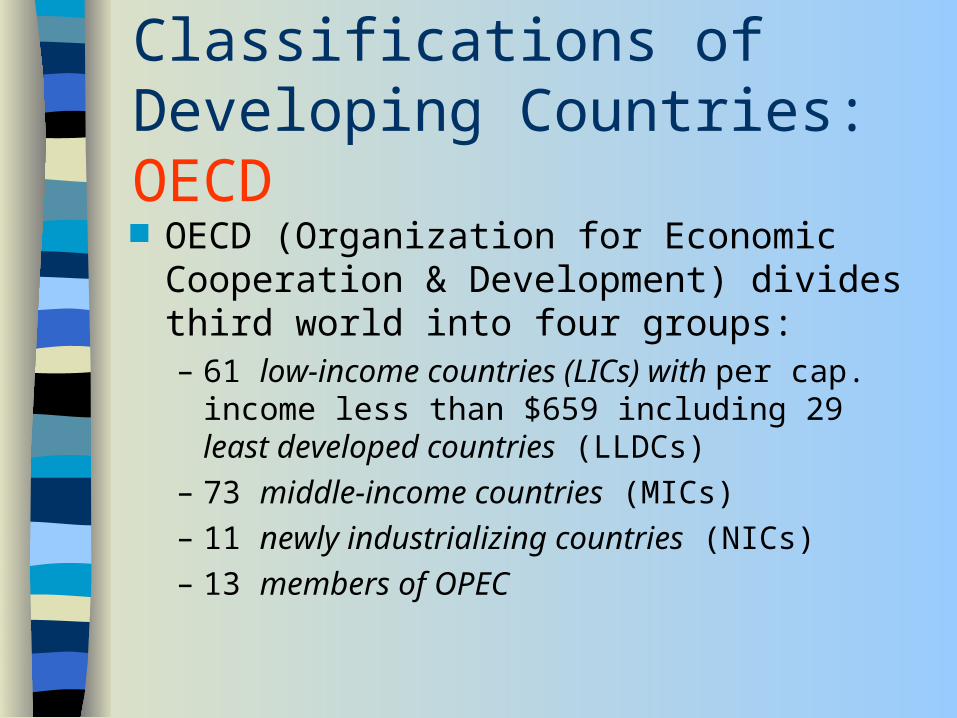
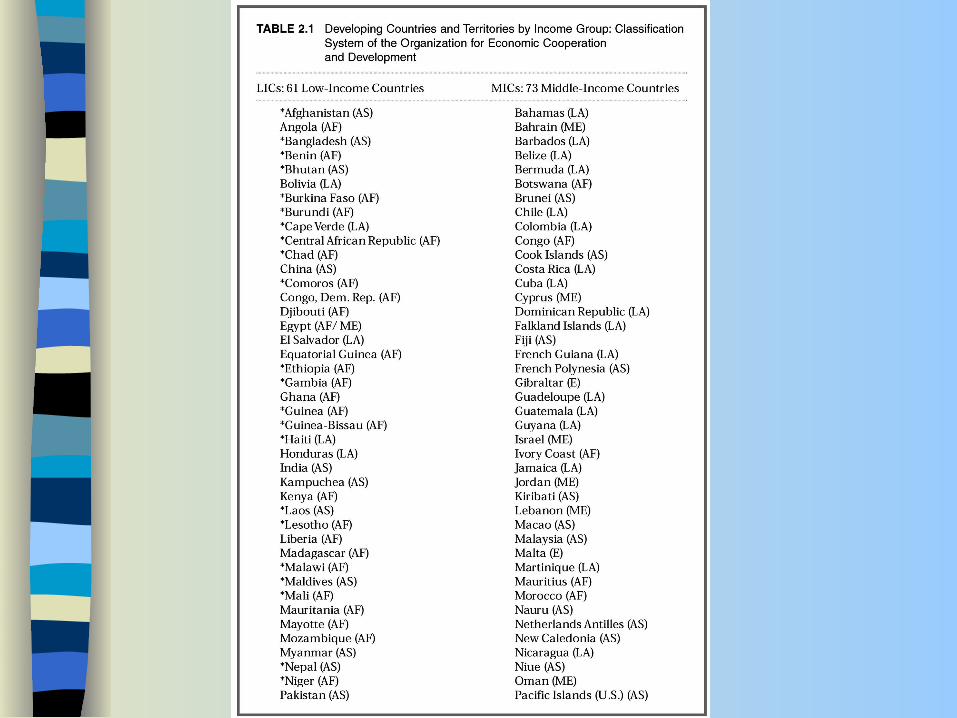
Classifications of Developing Countries: OECD OECD (Organization for Economic
Cooperation & Development) divides third world into four groups:– 61 low-income countries (LICs) with per cap.
income less than $659 including 29 least developed countries (LLDCs)
– 73 middle-income countries (MICs)
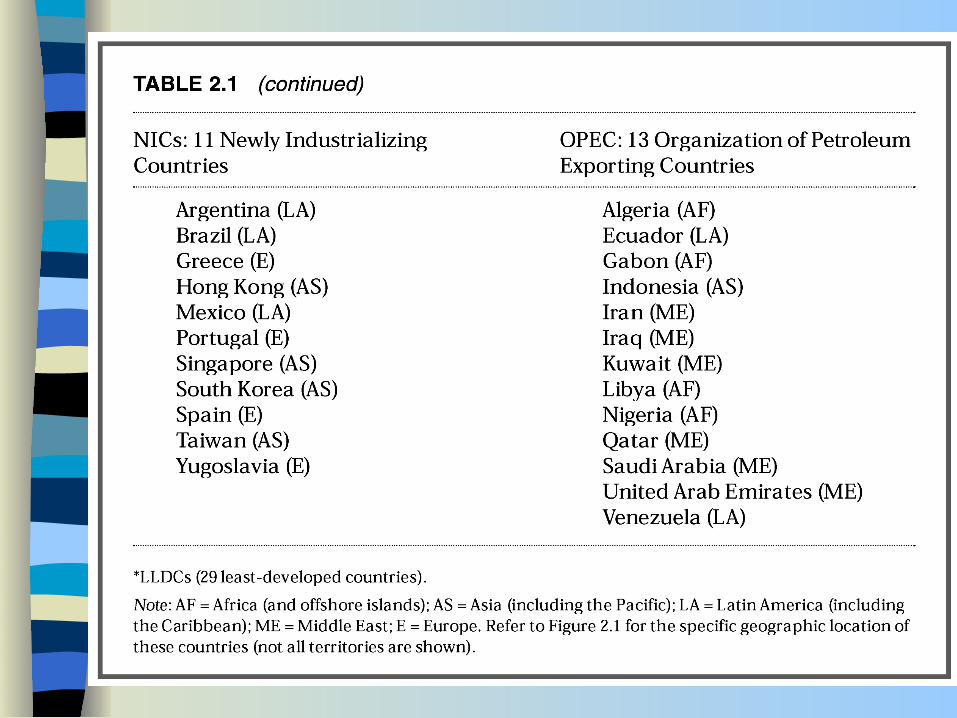
– 11 newly industrializing countries (NICs)
– 13 members of OPEC


Alternative Measures of Development
To overcome problem of using GDP growth as measure of development, economists construct measurements based on relatively quantifiable and identifiable variables showing relative living standards and overall human welfare
– Such common indicators include:• ‘Distance’ between richest 10% and poorest 10% in society• Doctors per 1,000 people & average travel time to hospital• Number of people with access to clean drinking water• Average daily caloric intake per person• Road km & other transportation networks in km per capita• Telephones/computers/internet access per 1,000 inhabitants
Alternative Measures of Development (con’t)
– Additional indicators include:• Infant mortality rates
• Life expectancy
• Percentage spent on public education relative to national budget/GDP
• GDP/GNP adjusted for pollution / environmental damage / non-monetary activities such as barter
• Adjusting income figures showing long-run sustainability by factoring in depreciation of environmental capital eg. natural resources
Composite Indexes
No single indicator can show overall development
Composite indexes created where number of different variables used together and indexed in order to make comparisons possible– Physical Quality of Life Index– United Nations Human Development Index (most
commonly used)– Human Poverty Index
Alternative Measures of Development: PQLI
Physical Quality of Life Index (PQLI)– PQLI uses three indicators (weighted equally)
to form a simple composite index where performance of each country is rated on a scale of 1 (worst) to 100 (best):• life expectancy: 100 = 77 yrs, & 28 yrs. = 1• infant mortality:100 = 9 per 1000 & 1 = 229 per
1000• literacy rates (as per country data)

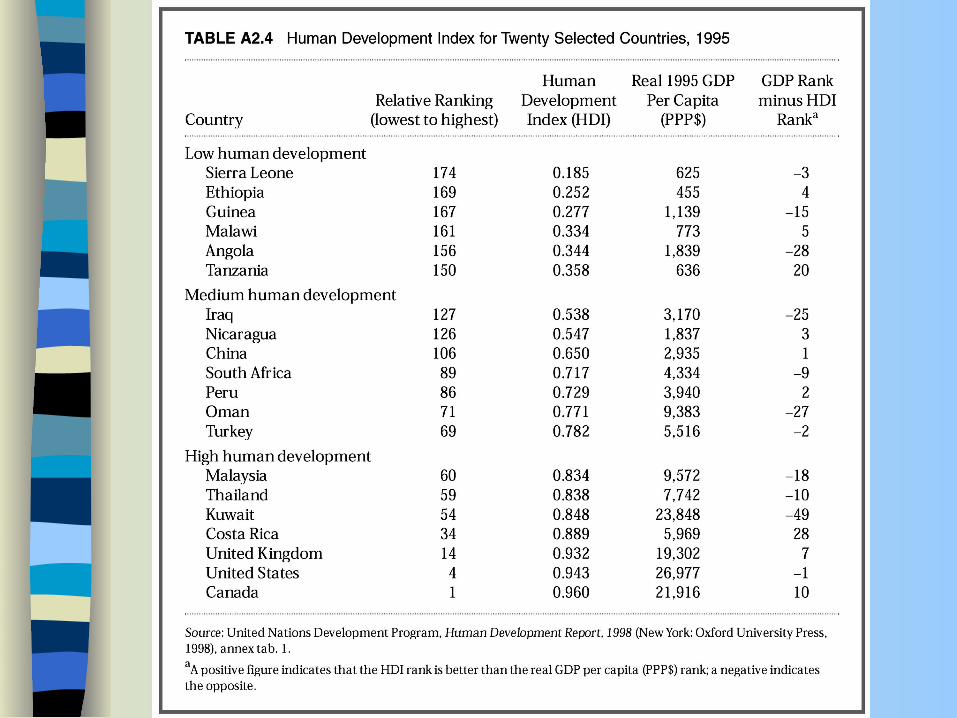
Alternative Measures of Development: United Nations HDI
The United Nations Human Development Index (HDI)– HDI attempts to rank all countries on scale of
0 (lowest human development) to 1 (highest human development) based on three goals:• life expectancy at birth (longevity)• educational attainment (knowledge)• real per capita income (living standard)


The Structural Diversity of Developing Economies Size and income
level


The Structural Diversity of Developing Economies Size and income level Historical background Physical and human resources Ethnic and religious composition Relative importance of public and private
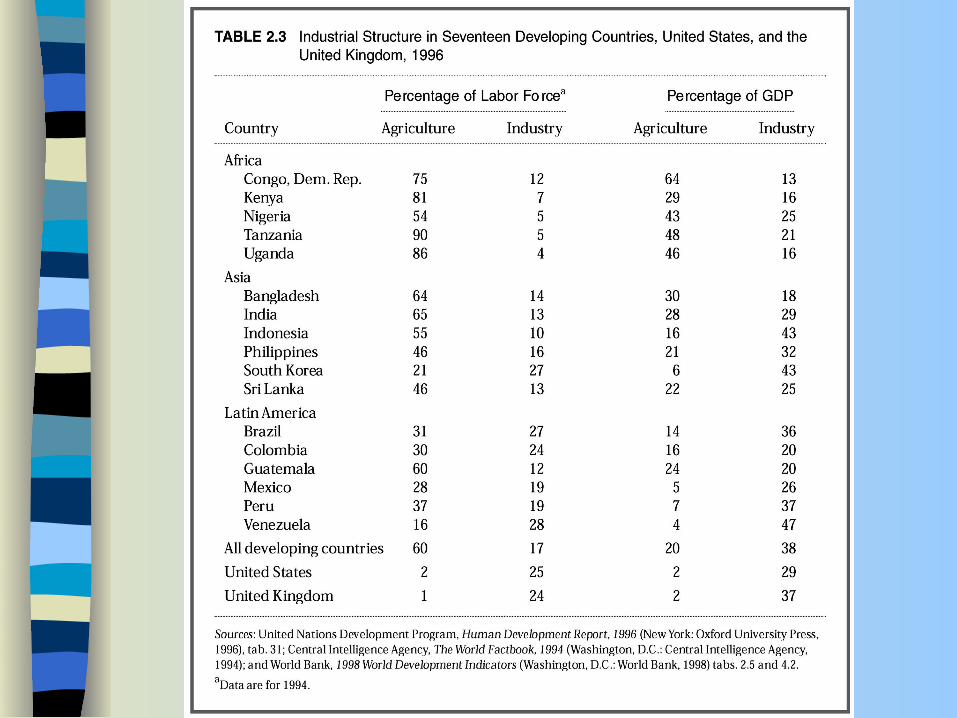
sectors Industrial structure

The Structural Diversity of Developing Economies Size and income
level Historical
background Physical and human
resources Ethnic and religious
composition
Relative importance of public and private sectors
Industrial structure External
dependence Political structure,
power, and interest groups