Economic Data Report - NWDCnwdc.co.za/wp-content/uploads/2016/05/Winter-2016... · NWDC Economic...
21
Compiled by: NWDC Research and Development Unit Q4 2015 2016
Transcript of Economic Data Report - NWDCnwdc.co.za/wp-content/uploads/2016/05/Winter-2016... · NWDC Economic...

Compiled by: NWDC Research and Development Unit
Q4 2015 2016
NWDC Economic Data Report. Qtr 4 of 2015.2016 www.nwdc.co.za Back to Table of Contents
1
TABLE OF CONTENTS
Page
1. INTRODUCTION 2
2. MACRO ECONOMY 2
2.1 The Global Economy 2
2. 2 South African Realities 4
2.2.1 Highlights Q4 2015/2016 4
2.2.2 The following structural transformation in the economy is needed 6
2.2.3 South Africa’s sustainability “hope”: National Development Plan (NDP) 6
2.3 North West Province Economic Overview 7
2.3.1 North West Key Economic Indicators Compared to South Africa 7
2.3.2 North West Location and Infrastructure 11
2.3.3 North West Policy Guidelines 12
3. SOUTH AFRICA’s GLOBAL COMPETITIVENESS 14
4. FOREIGN DIRECT INVESTMENT (FDI) 15
4.1 Global Investment Trends 15
4.2 Africa 15
4.3 South Africa 16
4.4 North West Province 17
5. TRADE 18
6. RECOMMENDATIONS 19
NWDC Economic Data Report. Qtr 4 of 2015.2016 www.nwdc.co.za Back to Table of Contents
2
1. INTRODUCTION The purpose of the Research and Development Unit is to gather, analyse and disseminate verified, reliable and relevant economic data, intelligence and research for the benefit of users to support informed decision making. The performance indicators of the unit are: A Quarterly Economic Data Report as well as A Quarterly Research and Development Activity Report. Economic data or economic statistics may refer to data (quantitative measures) describing an actual economy, past or present. These are typically found in time-series form, that is, covering more than one time period (say the monthly unemployment rate for the last five years) or in cross-sectional data in one time period (say for consumption and income levels for sample households). Data may also be collected from surveys of for example individuals and firms or aggregated to sectors and industries of a single economy or for the international economy. A collection of such data in table form comprises a data set. The purpose of this report is to supply an overview of the economic data and information gathered and shared from a global, South African, African and North West provincial perspective in order to ensure that recent, relevant and reliable economic data supports NWDC and other client and stakeholder decisions and activities. The economic data report will be structured as follows: First a macro-economic overview taking a global perspective in terms of developed and emerging economies moving to South Africa and the North West province. Secondly subjects that have an impact on the economy and relevance to NWDC will be covered including the Global Competitiveness, Foreign Direct Investment and Trade. 2. MACRO ECONOMIC OVERVIEW 2.1 The Global Economy – Subdued Demand and Diminished Prospects
Global growth, currently estimated at 3.1 percent in 2015, is projected at 3.4 percent in 2016 and 3.6 percent in 2017. The pickup in global activity is projected to be more gradual than in the October 2015 World Economic Outlook (WEO), especially in emerging market and developing economies. In advanced economies, a modest and uneven recovery is expected to continue, with a gradual further narrowing of output gaps. The picture for emerging market and developing economies is diverse but in many cases challenging. The slowdown and rebalancing of the Chinese economy, lower commodity prices, and strains in some large emerging market economies will continue to weigh on growth prospects in 2016–17. The projected pickup in growth in the next two years— despite the ongoing slowdown in China—primarily reflects forecasts of a gradual improvement of growth rates in countries currently in economic distress, notably Brazil, Russia, and some countries in the Middle East, though even this projected partial recovery could be frustrated by new economic or political shocks. Risks to the global outlook remain tilted to the downside and relate to ongoing adjustments in the global economy: a generalized slowdown in emerging market economies, China’s rebalancing, lower commodity prices, and the gradual exit from extraordinarily accommodative monetary conditions in the United States. If these key challenges are not successfully managed, global growth could be derailed.

NWDC Economic Data Report. Qtr 4 of 2015.2016 www.nwdc.co.za Back to Table of Contents
3
The World Economic Outlook Projections as per the World Economic Outlook Update October 2015
Year over Year
Estimates Projections Difference from October 2015 WEO (1)
2014 2015 2016 2017 2016 2017
World Output (2) 3.4 3.1 3.4 3.6 -0.2 -0.2
Advanced Economies 1.8 1.9 2.1 2.1 -0.1 -0.1 United States 2.4 2.5 2.6 2.6 -0.2 -0.2 Euro Area 0.9 1.5 1.7 1.7 0.1 0.0
Germany 1.6 1.5 1.7 1.7 0.1 0.2 France 0.2 1.1 1.3 1.5 -0.2 -0.1 Italy -0.4 0.8 1.3 1.2 0.0 0.0 Spain 1.4 3.2 2.7 2.3 0.2 0.1
Japan 0.0 0.6 1.0 0.3 0.0 -0.1 United Kingdom 2.9 2.2 2.2 2.2 0.0 0.0 Canada 2.5 1.2 1.7 2.1 0.0 -0.3 Other Advanced Economies (3) 2.8 2.1 2.4 2.8 -0.3 -0.1 Emerging Market and Developing Economies (4) 4.6 4.0 4.3 4.7 -0.2 -0.2 Commonwealth of Independent States 1.0 -2.8 0.0 1.7 -0.5 -0.3
Russia 0.6 -3.7 -1.0 1.0 -0.4 0.0 Excluding Russia 1.9 -0.7 2.3 3.2 -0.5 -0.8
Emerging and Developing Asia 6.8 6.6 6.3 6.2 -0.1 -0.1 China 7.3 6.9 6.3 6.0 0.0 0.0 India (5) 7.3 7.3 7.5 7.5 0.0 0.0 ASEAN-5 (6) 4.6 4.7 4.8 5.1 -0.1 -0.2
Emerging and Developing Europe 2.8 3.4 3.1 3.4 0.1 0.0 Latin America and the Caribbean 1.3 -0.3 -0.3 1.6 -1.1 -0.7
Brazil 0.1 -3.8 -3.5 0.0 -2.5 -2.3 Mexico 2.3 2.5 2.6 2.9 -0.2 -0.2
Middle East, North America, Afghanistan and Pakistan 2.8 2.5 3.6 3.6 -0.3 -0.5 Saudi Arabia 3.6 3.4 1.2 1.9 -1.0 -1.0
Sub-Saharan Africa 5.0 3.5 4.0 4.7 -0.3 -0.2 Nigeria 6.3 3.0 4.1 4.2 -0.2 -0.3 South Africa 1.5 1.3 0.7 1.8 -0.6 -0.3
Memorandum Low-Income Developing Countries 6.0 4.6 5.6 5.9 -0.2 -0.2 World Growth Based on Market Exchange Rates 2.7 2.5 2.7 3.0 -0.3 -0.2
World Trade Volume (Goods and Services) 3.4 2.6 3.4 4.1 -0.7 -0.5 Imports
Advanced Economies 3.4 4.0 3.7 4.1 -0.5 -0.4 Emerging Markets and Developing Economies 3.7 0.4 3.4 4.3 -1.0 -1.1
Exports Advanced Economies 3.4 3.1 3.4 -0.5 -0.6 Emerging Markets and Developing Economies 2.9 3.9 4.8 -1.1 0.1
Commodity Prices (U.S. dollars) Oil (7) -7.5 -47.1 -17.6 14.9 -15.2 4.8 Nonfuel (average based on World commodity export weights) -4.0 -17.4 -9.5 0.4 -4.4 0.1 Consumer Prices Advanced Economies 1.4 0.3 1.1 1.7 -0.1 0.0 Emerging Markets and Developing Economies (5) 5.1 5.5 5.6 5.9 0.5 1.0 London Interbank Offered Rate (%) On U.S. Dollar Deposits (6 month) 0.3 0.5 1.2 2.2 0.0 0.0

NWDC Economic Data Report. Qtr 4 of 2015.2016 www.nwdc.co.za Back to Table of Contents
4
On Euro Deposit (3 month) 0.2 0.0 -0.3 -0.2 -0.3 -0.3 On Japanese Yen Deposit (6 month) 0.2 0.1 0.1 0.1 0.0 -0.1
Note: Real effective exchange rates are assumed to remain constant at the levels prevailing during November 9–December 7, 2015. Economies are listed on the basis of economic size. The aggregated quarterly data are seasonally adjusted. 1/ Difference based on rounded figures for both the current and October 2015 WEO forecasts. 2/ Countries included in the calculation of quarterly estimates and projections account for approximately 90 percent of world GDP at purchasing power parities. 3/ Excludes the G7 (Canada, France, Germany, Italy, Japan, United Kingdom, United States) and euro area countries. 4/ Countries included in the calculation of quarterly estimates and projections account for approximately 80 percent of the GDP of emerging market and developing economies at purchasing power parities. 5/ For India, data and forecasts are presented on a fiscal year basis and GDP from 2011 onward is based on GDP at market prices with FY2011/12 as a base year. 6/ Indonesia, Malaysia, Philippines, Thailand, Vietnam. 7/ Simple average of prices of U.K. Brent, Dubai Fateh, and West Texas Intermediate crude oil. The average price of oil in U.S. dollars a barrel was $50.92 in 2015; the assumed price based on futures markets (as of December 10, 2015) is $41.97 in 2016 and $48.21 in 2017.
2.2 South African Realities 2.2.1 Highlights Q4 2015/2016
South African Economic Growth Q4 2015/2016
South Africa’s economy grew by 1,3% in 2015, down from 1,5% in 2014 and 2,2% in 2013, according to preliminary estimates of real gross domestic product (GDP) published by Stats SA. Overall economic growth in 2015 was characterised by two of the main industry groups shrinking in size, while the other eight experienced some growth.

NWDC Economic Data Report. Qtr 4 of 2015.2016 www.nwdc.co.za Back to Table of Contents
5
The main contributor to the slowdown in 2015 was agriculture. Severe drought conditions saw the industry contracting by 8,4%, the largest annual fall in agriculture production since 1995. The decrease in 2015 was mainly due to a sharp drop in the production of field crops. The electricity, gas and water supply industry also shrank in size, contracting by 1,0%. Growth in manufacturing was almost flat in 2015, with the industry expanding marginally by 0,1%. Growth figures of less than 2% were recorded for government (+0,9%), personal services (+1,1%), transport2 (+1,4%), trade3 (+1,4%) and construction (+1,9%). The finance industry expanded by 2,8%. As this is the largest industry, comprising 21% of the entire economy, its increase in activity was the main positive contributor to the 1,3% annual rise in GDP. The mining industry recorded the highest growth of all ten industries, expanding by 3,0%. The increase was mainly a result of increased platinum group metal (PGM) production. The low base created in 2014 by the PGM miners’ strike saw PGM production rising by 46,2% in 2015 compared with 2014. Of the four major minerals (i.e. PGMs, iron ore, gold and coal), the PGM group was the only one to record a production increase in 2015. GDP is widely used to measure the size of an economy and its performance over time. In 2015 South Africa’s GDP was almost R4 trillion (that’s 12 zeros). Other quick facts for the fourth quarter of 2015 are:
Real GDP increased by 0,6% quarter-on-quarter, seasonally adjusted and annualised.
The unadjusted real GDP increased by 0,6% year-on-year.
(Source: Statistics SA Q3 2015)

NWDC Economic Data Report. Qtr 4 of 2015.2016 www.nwdc.co.za Back to Table of Contents
6
Key findings: P0141 - Consumer Price Index (CPI), February 2016
The headline CPI (for all urban areas) annual inflation rate in February 2016 was 7,0%.
This rate was 0,8 of a percentage point higher than the corresponding annual rate of 6,2% in January 2016.
On average, prices increased by 1,4% between January 2016 and February 2016.
The table below reflects Statistics South Africa economic indicators in Q4 2015 2016:
INDICATOR for SA MONTH /YEAR % Quarter on Quarter or Year on Year
Population (Mid-year Estimate)
Mid 2014 54mil
GDP Growth 2015 Q4 0.6% QoQ
CPI February 2016 7.0% YoY
PPI January 2016 7.6% YoY
Unemployment 2015 Q4 24,5%
2.2.2 The following structural transformation in the economy is needed
Rise in agricultural sector productivity Stronger links with manufacturing sector Skills development Labour shift from low-productive agricultural sector to higher productive manufacturing sector Worker income increases Poverty levels drop, income distribution improves Country production base broadens Economic diversification into high tech manufacturing and services 2.2.3 South Africa’s sustainability “hope”: National Development Plan (NDP) The NDP is South Africa’s long term plan to 2030 and might be the sustainability ‘hope” of the country. It seeks amongst other things to reduce unemployment by improving manufacturing. The NDP will also result in a change in the risk for labour unrest by reducing it. The New Growth Path, which is a short term plan drawing from the NDP goes into detail with the work that has to be done and sets a target of creating 5 million jobs in 10 years. It identifies inter alia: The mining value chain, with a particular emphasis on mineral beneficiation as well as on increasing the rate of mineral resource extraction as key activities to stimulate growth The following issues must be addressed as per the NDP:
Boost educational levels.

NWDC Economic Data Report. Qtr 4 of 2015.2016 www.nwdc.co.za Back to Table of Contents
7
Promote industries that are labour-absorbing, such as mining, agriculture, construction, hospitality and small businesses.
Grow the more advanced sectors of the economy, such as manufacturing, parts of financial services, telecommunications and businesses services.
Provide a social wage to enable the poorest of South Africa's people to have a decent standard of living and to build their capabilities to get better jobs, higher incomes and a broader range of benefits.
The NDP seeks to place the economy on a production-led trajectory. 2.3 North West Province Economic Overview
2.3.1 North West Key Economic Indicators Compared to South Africa
The table below summarises the key demographic and socio-economic characteristics for the NWP and its four district municipalities’ in context of the South African picture with regards to demographics, development, household infrastructure, labour, income and expenditure, economy, tourism and international trade as per the 2014 IHS Global Insight Indicators. The NW region covers approximately 105 076 square kilometres, comprising 8.6% of the national area. The NWP is not densely populated when compared to the national population density. The NWP houses approximately 7% of the country’s total population.
Key indicators South Africa, North West province and District Municipalities (2014) South Africa North-West Bojanala DM Ngaka Modiri
Molema DM Dr Ruth Segomotsi Mompati DM
Dr Kenneth Kaunda DM
Region area (km²) 1 221 246 105 076 18 370 27 985 44 053 14 668
Total population 53 781 908 3 670 889 1 602 614 866 535 474 823 726 916
Population density (number of people per km²)
44,04 34.94 87.24 30.96 10.78 49.56
Economically Active Population (EAP) as % of total population, official definition
35,986% 31,310% 38,483% 22,786% 20,684% 32,600%
Number of households 15 341 533 1 098 814 526 384 231 248 127 189 213 993
Annual per household income (Rand, current prices)
168 920 135 990 141 920 116 877 101 838 162 355
Annual per capita income (Rand, current prices)
48 187 40 707 46 615 31 191 27 279 47 796
Gini coefficient 0,64 0,61 0,61 0,61 0,59 0,62
Formal Sector Employment
12 109 001 674 221 371 715 111 955 53 451 137 100
Informal Sector Employment
2 305 887 104 566 58 087 18 268 9 107 19 104
Unemployment rate, official definition (%)
25,007% 26,196% 22,953% 30,229% 30,942% 29,308%
Share below the upper poverty line (StatsSA defined)
46,475% 47,403% 39,831% 56,652% 59,106% 45,427%
Poverty gap rate (from 28,378% 28,208% 27,466% 28,796% 28,892% 28,191%

NWDC Economic Data Report. Qtr 4 of 2015.2016 www.nwdc.co.za Back to Table of Contents
8
South Africa North-West Bojanala DM Ngaka Modiri Molema DM
Dr Ruth Segomotsi Mompati DM
Dr Kenneth Kaunda DM
upper poverty line)
Human Development Index (HDI)
0.626 5.578 0.608 0.531 0.500 0.603
Index of buying power 1,000 0,056 0,0272 0,011 0,005 0,0124
Economic Output (R million in current prices)
3 404 494 638 198 968 011 111 514 503 33 302 311 13 011 912 41 139 285
Share of economic output (GVA % of SA in current prices)
100,00 5,84 3,28 0,98 0,38 1,21
Economic Output (R million in constant 2010 prices (R 1000)
2 729 203 315 153 664 276 88 037 300 25 586 875 9 920 398 30 119 703
Share of economic output (GVA % of SA in constant 2010 prices (R 1000))
100,00 5,63 3,23 0,94 0,36 1,10
Average annual growth (Constant 2010 Prices) 2014
1,6% -0,5% -1,4% 1,2% 2,3% -0,2%
Average annual growth (Constant 2010 Prices) 2014 to 2019
2,7% 2,8% 3,4% 2,3% 2,5% 1,8%
Growth in Tourism (using bednights) by origin 2013
5,0% 9,0% 9,1% 7,7% 10,3% 9,3%
Growth in Tourism Spend 2013
5,8% 3,0% 2,7% 3,1% 4,7% 3,1%
International Trade
Exports (R 1000) 1 003 825 998 18 300 516 14 718 510 1 086 254 364 150 2 131 602
Imports (R 1000) 1 072 463 997 5 553 622 2 131 904 441 338 120 572 2 859 808
Total Trade (R 1000) 2 076 289 995 23 854 138 16 850 414 1 527 592 484 722 4 991 410
Trade Balance (R 1000) -68 637 999 12 746 893 12 586 606 644 916 243 578 -728 206
Exports as % of GDP 26,4% 8,1% 11,7% 2,8% 2,4% 4,5%
Total trade as % of GDP 54,7% 10,6% 13,4% 4,0% 3,2% 10,6%
Regional share - Exports 100,0% 1,8% 1,5% 0,1% 0,0% 0,2%
Regional share - Imports 100,0% 0,5% 0,2% 0,0% 0,0% 0,3%
Regional share - Total Trade
100,0% 1,1% 0,8% 0,1% 0,0% 0,2%
(Source: Regional eXplorer 832 (2.5q)
The NW shows improvement in most of the developmental indicators (2009 used as baseline). Most notable is the improvement in the Human Development Index (HDI) currently at 0.58 from 0.52 in 2009. Similar improvements are seen in both the number and percentage of people living in poverty below the upper poverty line (StatsSA defined), currently measured at 47.4% (59.1% in 2009) respectively. Improvements in all measures relating to schooling and education are also reported. The Index of Buying Power has also increased for the NW province. IHS Global Insight’s Index of Buying Power (IBP) indicates that 5% of the country’s spending power is located in the NW. Income levels in the NWP are below the national average (which is to be expected for the more rural areas in South Africa). The unemployment rate is slightly lower than that of the national average, while the percentage of people living in

NWDC Economic Data Report. Qtr 4 of 2015.2016 www.nwdc.co.za Back to Table of Contents
9
SA NW BPDM NMMDM DRSDM DKKDM
2011 3.0% 2.7% 3.3% 2.4% 3.5% 1.1%
2012 2.2% -0.3% 2.0% -1.3% -0.4% -5.6%
2013 2.3% 3.0% 4.1% 1.2% 0.8% 2.0%
2014 1.6% -0.5% -1.4% 1.2% 2.3% -0.2%
1996-2014 2.9% 2.4% 3.4% 2.4% 2.3% 0.5%
2014-2019 2.7% 2.8% 3.4% 2.3% 2.5% 1.8%
-8.0%
-6.0%
-4.0%
-2.0%
0.0%
2.0%
4.0%
6.0%GVA-R Average annual growth (Constant 2010 Prices)
poverty is marginally higher than the national average. The NWP has a share of approximately 10.8% of national employment. The 2014 Gini coefficient indicates that the level of equality is decreasing from 0,602 in 2009 to 0.614 in 2014 for the North West province. This is a trend for South Africa and the District Municipalities as well. With regards to the economy, the Tress index provides insight into the level of concentration (or diversification) within an economic region. A Tress index value of 0 means that all economic sectors in the region contribute equally to GVA, whereas a Tress index of 1 means that only one economic sector makes up the whole GVA of the region. In the table below it is clear that the NW province has become more diversified in its economy from 2009 where it was the 2nd most concentrated economy and in 2014 the 4th most concentrated. This is an indication that the efforts to diversify the economy are paying off and can be contributed to the weaker performance of the mining sector. The NWP is a large and significant local economy in the South African economic context. The area contributes approximately 5.7% to national production with mining, Table: Comparison of the Tress indices of SA, provinces and the NW district Municipalities between
2009 and 2014:
2009 2014
South Africa 39,67 39,44
Western Cape 47,55 46,76
Eastern Cape 54,16 53,67
Northern Cape 41,19 42,68
Free State 34,13 36,65
KwaZulu-Natal 40,98 39,34
Gauteng 49,97 49,68
Mpumalanga 36,57 36,35
Limpopo 49,55 50,03
North-West 51,08 49,29
Bojanala DM 66,03 62,38
Ngaka Modiri Molema DM 47,56 48,93
Dr Ruth Segomotsi Mompati DM 45,88 46,86
Dr Kenneth Kaunda DM 43,42 43,77
The Average Annual growth rate for the North West province has clearly been negatively affected by the labour unrest in the mining sector in 2014 and declined to -0,5 from 3% in 2013. The DRSDM on the contrary has experienced increased growth from 0,8% in 2013 to 2,3% in 2014.

NWDC Economic Data Report. Qtr 4 of 2015.2016 www.nwdc.co.za Back to Table of Contents
10
1997 1998 1999 2000 2001 2002 2003 2004 2005 2006 2007 2008 2009 2010 2011 2012 2013 2014 2015 2016 2017 2018 2019
SA 2.4% 0.4% 2.1% 3.7% 2.4% 3.4% 3.0% 4.4% 5.1% 5.3% 5.4% 3.2% -1.5% 3.0% 3.2% 2.2% 2.2% 1.5% 1.9% 2.3% 2.8% 3.2% 3.3%
NW -0.3% 1.0% -0.4% 1.3% 1.5% 6.0% 5.3% 3.7% 6.8% 4.2% 4.9% 2.1% -2.2% 3.9% 3.0% -0.4% 2.9% -0.4% 2.7% 2.5% 3.0% 3.0% 3.0%
Gauteng 2.7% 0.7% 2.0% 5.1% 2.4% 4.4% 3.0% 4.9% 5.0% 6.0% 5.8% 3.7% -1.5% 3.3% 3.5% 2.4% 2.5% 1.8% 1.8% 2.2% 2.8% 3.2% 3.4%
Mpu 1.9% 0.6% 2.4% 2.9% 1.2% 1.7% 2.7% 4.0% 4.4% 4.2% 4.1% 1.3% -1.3% 2.7% 2.1% 2.1% 1.7% 2.3% 2.3% 2.8% 3.0% 3.2% 3.1%
Limpopo 5.5% 2.0% 1.2% 0.1% 3.4% 2.6% 1.8% 3.0% 3.9% 4.4% 3.7% 1.6% -1.5% 2.8% 2.3% 1.1% 2.4% 1.3% 2.7% 2.8% 3.2% 3.5% 3.6%
-3.0%
-2.0%
-1.0%
0.0%
1.0%
2.0%
3.0%
4.0%
5.0%
6.0%
7.0%
8.0%
%
Gross Domestic Product by Region (GDP-R)
Average annual growth (Constant 2010 Prices) (Source: IHS Global Insight; Regional eXplorer 832 (2.5q))
In the graph below the average annual growth of the North West province is compared with the national
growth figures as well as with Gauteng, Limpopo and Mpumalanga and it is clear that the North West province
growth is more volatile which can be attributed to the heavy reliance on mining.
According to the Regional Economic Review: Current realities in the North West Province, A report from the TRADE (Trade and Development) research niche area of the North West University; March 2014, the provincial economy is structurally unbalanced with the primary and tertiary sectors contributing more towards GDP-R and growing faster than the secondary sector. The situation is further exacerbated by;
limited water and electricity supply,
the poor state of infrastructure,
shortage of skilled labourers and
rigid regulatory and legislative policies. A provincial input-output analysis points to a situation of high economic leakages and a dislocation of supply and demand across a number of industries. This has resulted in input and output activities between industries not operating in tandem, minimising the competitiveness of the province. Employment North West Employment Figures Compared to South Africa (Source: STASSA Q4 2015)
SOUTH AFRICA North West Oct-Dec
2014 Jul-Sept
2015 Oct-Dec
2015 % Change
Q on Q % Change
Y on Y Oct - Dec
2014 Jul-Sept
2015 Oct-Dec
2015 % Change
Q on Q % Change
Y on Y
Population 15-64 yrs 35 643 36 114 36 272 0,4% 1,8% 2 400 2 434 2 445 0,5% 1.9%
Labour Force 20 228 21 246 21 211 -0.2% 4.9% 1 268 1 235 1 273 3.1% 0.4%

NWDC Economic Data Report. Qtr 4 of 2015.2016 www.nwdc.co.za Back to Table of Contents
11
Employed 15 320 15 524 16 018 1.2% 4.6% 948 921 969 5.2% 2.2%
Unemployed 4 909 5 418 5 193 -4.2% 5.8% 320 314 304 -3.2% -5.0%
Not economically active 15 415 14 867 15 061 1.3% -2,3% 1 132 1 198 1 172 -2.2% 3.5%
Discouraged work-seekers 2 403 2 226 2 279 2.3% -5.2% 225 243 241 -0.9% 6.9%
Other 13 012 12 641 12 782 1.1% -1.8% 907 956 931 -2.6% 2.6%
Rates (%)
Unemployment rate 24,3 25,5 24,5 -1.0 0.2 25,2 25,4 23,9 -1.5 -1.5
Employed / population ratio (Absorption) 43,0 43,8 44,2 0.4 1,2 39,5 37,9 39,6 1.7 0.1
Labour force participation rate
56,8 58,8 58,5 -0.3 1,7
52,8 50,8
52,1 1.3 -0.7
North West Employment by Industry Figures Compared to South Africa (Source: STASSA Q4 2015)
SA Oct-Dec 2014
Thousands
SA Oct-Dec 2015
Thousands
SA % Share Contribution Oct-Dec 2015
NW Oct-Dec 2014
Thousands
NW Oct-Dec 2015
Thousands
NW% Share Contribution Oct-Dec 2015
NW as % of SA
Agriculture 742 860 5,37% 42 57 6,19% 6,63%
Mining 427 483 3,02% 150 172 18,68% 34,58%
Manufacturing 1 749 1 738 10,85% 76 80 8,69% 4,29%
Utilities 104 123 0,77% 2 2 1,63% 2,35%
Construction 1 334 1 438 8,98% 56 69 7,49% 4,35%
Trade 3 247 3 280 20,48% 177 168 18,24% 5,49%
Transport 952 900 5,62% 36 46 4,99% 4,15%
Finance 2 039 2 273 14,19% 78 94 10,21% 4,26%
Community and Social Services 3 501 3 624 22,62% 238 200 21,72% 5,10%
Private House Holds 1 219 1 294 8,08% 93 81 8,79% 6,36%
Other 7 4 0,02% 0,00%
TOTAL 15 320 16 018 100,00% 940 921 100,00% 5,82%
2.3.2 North West Location and Infrastructure Location is one of the NWP’s greatest natural advantages. The main Cape Town to Zimbabwe railway line runs through the provincial capital of Mahikeng, linking the NWP to several southern African countries, including Angola, Zambia and Botswana. An extensive road network connects the major commercial centres of the province to the rest of the country via a network of 1 785 km of national roads. The vital east-west corridor links the eastern Africa seaboard at Maputo to the western African seaboard at Walvis Bay, running through the NWP en-route. Its strategic positioning has been further improved with the completion of the Trans Kalahari Corridor through Botswana and Namibia – and these developments bode well for a thriving business and tourism economy. In terms of airports, Mahikeng has an established airport with one of the longest runways in the world and Pilanesberg (near Sun City) also has an international airport, primarily servicing the tourism industry.
Water is considered one of the key limiting factors to development in the NWP. The province is not only depleting its precious water reserves, but suffers from an additional problem – that of pollution of groundwater caused by both natural and human-induced factors including mining and industrial activities, agriculture and domestic use. With regards to electricity, the NWP has a well-developed electricity distribution

NWDC Economic Data Report. Qtr 4 of 2015.2016 www.nwdc.co.za Back to Table of Contents
12
network due to mining activities. The current electricity crisis can also be seen as an opportunity to develop other energy technologies and to invest in renewable energy.
2.3.3 North West Policy Guidelines Given the economic growth forecasts, key demographic and socio-economic characteristics and the current economic and structural realities in the North West, the NWPG has an important role to play in setting the framework for growth and outlining the necessary actions to stimulate growth in areas such as innovation, research and development, skills, education, exports, FDI and entrepreneurship. This also means identifying and supporting business growth in areas where there is the greatest potential, whilst ensuring that the necessary economic infrastructure is in place to capitalise on the existing strengths and opportunities.
With the Focus of the 5th Administration on rebranding, repositioning and renewing (RRR) the VTSDs’ economies as a strategic drive and to further focus on Agriculture, Culture and Tourism (ACT) as key sectors in the province. As the implementing arm of the NW province this approach will be promoted by the NWDC.
It is important to indicate the relative importance of agriculture, culture and tourism in the NWP. Agriculture (both narrow [2.8%] and broad [4.4%]) plays a smaller role than in most of the other provinces (with the exception of Gauteng and Limpopo). Along with most other provinces, except Gauteng, the cultural sector makes up a small part of GVA (2.7%). Culture and Tourism is difficult to isolate as it is spread across various sectors in the economy. The tourism sector contributes more (19%) to provincial GVA than agriculture and culture put together. In the total NWP economy ACT contributed approximately 23% of all value added in 2014.
Detailed sectors Share of provincial GVA Share of provincial employment
Narrow agriculture 2.77% 4.85%
Broad agriculture 4.40% 6.78%
Culture 2.71% 3.60%
Tourism 19.01% 18.82%
In terms of the VTSD focus, the areas / places identified as key role players are indicated in the table below.
Category (VTSD) Local Municipality (LM) District Municipality (DM)
Zeerust Ramotshere Moiloa LM Ngaka Modiri Molema DM
Coligny Ditsobotla LM Ngaka Modiri Molema DM
Delareyville Tswaing LM Ngaka Modiri Molema DM
Ottosdal Tswaing LM Ngaka Modiri Molema DM
Sannieshof Tswaing LM Ngaka Modiri Molema DM
Koster Kgetlengrivier LM Bojanala Platinum DM
Derby Kgetlengrivier LM Bojanala Platinum DM
Swartruggens Kgetlengrivier LM Bojanala Platinum DM
Vryburg (Dorpie) & Huhudi (Township) Naledi LM Dr. Ruth S. Mompati DM
Schweizer-Reneke / Itelegeng (Mamusa) Mamusa LM Dr. Ruth S. Mompati DM
Hartbeesfontein(Dorpie) and Tigane (Township) City of Matlosana Kenneth Kaunda DM
Wolmaransstad / Tsweleleng – Maquassi Hills Maquassi Hills LM Kenneth Kaunda DM
Ventersdorp & Tshing Ventersdorp LM Kenneth Kaunda D
Source: The FEED (2015).ACT

NWDC Economic Data Report. Qtr 4 of 2015.2016 www.nwdc.co.za Back to Table of Contents
13
The Department of Finance, Economy and Enterprise Development (FEED) mapped the following priorities in their 2015 2016 strategic plan to grow the economy of the NWP.
The North West Development Corporation (NWDC) has identified the following key and cross-cutting sectors, based on the renewed focus in the NWP Key economic sectors include:
Agriculture and agro-processing
Culture
Tourism
Mining and mineral beneficiation
Manufacturing
Green economy
ICT Cross-cutting sectors include:
Small and medium enterprise (SME)
International trade
Innovation and R&D
Business process outsourcing (BPO)
Low Agricultural Outputs
Whilst the employment numbers in the sector have increased with accompanying increased output, there’s a need for further upward development for purposes of production, employment figures and agro-processing
Infrastructure Development
The Province needs to provide and maintain a solid economic infrastructure, including a reliable energy consumption grid, transport networks (road, rail, and aviation), and telecommunications
Diversification of Industries
The North West Province has to move with global trends. This calls for a thrust towards diversified local economies to include Arts and Crafts, Film industry, Green Economy industries (e.g. solar energy, waste management, and recycling projects)
Manufacturing vs Export Oriented Market
There is a need to investigate the potential of local beneficiation opportunities (based on the local outputs) and actively promote closer linkages between the local primary sector and manufacturing industries
Aggressive Enterprise Development
SMMEs are regarded as the back bone of many economies in developed and developing countries yet South Africa remains at the bottom of the rankings when it comes to countries that support small businesses to buttress the performance of their economies. To the extent that RSA has poor records on SMME support the implications are that provinces are not doing any better. The SMME strategy covers most of the challenges and plans to overcome them and therefore it suffices to mention Small Business Support as a challenge in this document
Foreign Direct Investment
The North West Province has the potential to attract foreign investment to support the local economies. The potential exists to attract local and foreign private investors to the province by providing a competitive set of incentives that could include both administrative (reducing the time required for development approval, information provision, etc.) and financial incentives disaggregated in terms of economic sectors and the value of investment particularly prioritising beneficiating activities. This can also be done through the formation of Public Private Partnerships (PPPs) to reduce private sectors’ risks and acquire necessary funds for investment

NWDC Economic Data Report. Qtr 4 of 2015.2016 www.nwdc.co.za Back to Table of Contents
14
Based on the information above NWDC will close the gap by focusing on smart specialization. Smart specialization is about placing greater emphasis on innovation and having an innovation-driven development strategy in place that focuses on each area’s strength and competitive advantage. It aims at identifying factors of competitiveness and concentrating resources on key priorities. It also aims to harness area diversity by avoiding uniformity and duplication in investment goals. It combines goal-setting with a dynamic and entrepreneurial discovery process involving key stakeholders from government, business, academia and other knowledge-creating institutions.
3. SOUTH AFRICA’S GLOBAL COMPETITIVENESS The Global Competitiveness Report 2014 – 2015 by the World Economic Forum’s (WEF) assesses the competitiveness landscape of 144 economies, providing insight into the drivers of their productivity and prosperity and measures over 100 indicators. South Africa ranked no 56 in 2014 down from 53 in 2013. Positive rankings include:
Quality of its institutions (36th),
Including intellectual property protection (22nd),
Property rights (20th),
Efficiency of its legal framework in challenging and settling disputes (ninth and 15th, respectively),
Accountability of private institutions (2nd )
Financial market development remained impressive at seventh place, although their data pointed to "more difficulties" in all channels of obtaining finance
Efficient market for goods and services, business sophistication and innovation, benefiting from good scientific research institutions, and strong collaboration between universities and the business sector in innovation were also identified as points supporting competitiveness.
Challenges include: "South Africa’s strong ties to advanced economies, notably the euro area, have made it more vulnerable to the economic slowdown of those economies," the WEF said. These ties were identified as likely contributors to the deterioration of fiscal indicators in South Africa, including macroeconomic environment performance which dropped sharply in this year’s index.
Diversion of public funds,
Perceived wastefulness of government spending,
General lack of public trust in politicians
Health of the workforce — at 132nd as a result of high rates of communicable diseases
Higher education and training,
Labour market efficiency
Labour-employer relations (144th) "Raising education standards and making its labour market more efficient will thus be critical in view of the country’s high unemployment especially youth. THE IMD WORLD COMPETITIVENESS SCOREBOARD The IMD World Competitiveness Scoreboard 2015 by the Institute for Management Development in Zurich (IMD) assesses the competitiveness landscape of 61 economies, providing insight into the drivers of their productivity and prosperity. South Africa ranked no 53 in 2015: Positive rankings include:
Cost-of-living index (1) Office rent (7); Effective personal income-tax rate (2)

NWDC Economic Data Report. Qtr 4 of 2015.2016 www.nwdc.co.za Back to Table of Contents
15
Employer’s social security contribution (3) Total public expenditure on education (3) Secondary school enrolment (7) Stock market capitalisation (3) and Finance and banking regulation (9).
EASE OF DOING BUSINESS (Business Environment/Climate) (COMPARING BUSINESS REGULATIONS FOR DOMESTIC FIRMS IN 189 ECONOMIES World Bank Group Flagship Report 2015 for (2013/2014)) The aggregate ranking on the ease of doing business benchmarks each economy’s performance on the indicators against that of all other economies in the Doing Business sample. While this ranking tells much about the business environment in an economy, it does not tell the whole story. A high ranking does mean that the government has created a regulatory environment conducive to operating a business. Ease of Doing Business Ranking of South Africa
Ease of Doing Business Ranking 43 (Overall)
Protecting Minority Investors 17
Paying Taxes 19
Dealing with Construction Permits 32
Resolving Insolvencies 39
Enforcing Contracts 46
Getting Credit 52
Starting a Business 61
Registering Property 97
Trading Across Borders 100
Getting Electricity 158 (Source: http://www.doingbusiness.org/rankings)
4. FOREIGN DIRECT INVESTMENT (FDI) 4.1 Global Investment Trends
Global foreign direct investment (FDI) slowed by 16% to $1.23-trillion in 2014. The declines were because of the fragility of the global economy, policy uncertainty for investors and elevated geopolitical risks. FDI is viewed as a more stable source of investment into a country’s economy as compared with investment inflows into the bond or stock markets. FDI flows into developing economies flouted this trend, rising by 2% and investment into the African continent remained stable at $54-billion.
4.2 Africa Regional Investment Trends: The declines in the rest of the Southern African subregion were at a more muted 2%. Flows into West Africa shrank by 10% to $12.8-billion, as a result of the Ebola virus outbreak, regional conflicts and falling commodity

NWDC Economic Data Report. Qtr 4 of 2015.2016 www.nwdc.co.za Back to Table of Contents
16
prices affected several countries. Flows to East and Central Africa increased by 11% to $6.8-billion and 33% to $12.1-billion respectively There is a focus shift towards Sustainable Development Goals (SDGs) and an Action Plan for promoting private sector contributions. SDGs are being formulated by the United Nations.
Foreign Direct investment (FDI) into Africa from 2008 to 2013
4.3 South Africa South Africa saw a relatively steep decline. Investment flows into South Africa dropped by 31.2% to $5.8-billion in 2014, down from $8.3-billion in 2013. Mozambique saw a reduction of FDI flows by 21% or $4.9-billion. Several issues over the past year, including chronic power shortages and labour unrest, have weighed down South Africa’s economy, resulting in lacklustre economic growth. Uncertainty has also emerged as the government considers several changes to policy and legislation that private sector economists believe are weighing on investor and business confidence in the country. In May 2015, Annabel Bishop, group economist at Investec, noted that proposed legislation, including the Promotion and Protection of Investment Bill, the Expropriation Bill and a policy proposal on land reform, were “significantly contributing to low business confidence in South Africa”. The Promotion and Protection of Investment Bill The department of trade and industry (DTI) is in the process of cancelling a number of bilateral investment treaties, with the aim of replacing this investment regime with the Promotion and Protection of Investment Bill. DTI has come under a great deal of fire for cancelling a number of investment treaties with trade partners such as Germany. But the UNCTAD report revealed that South Africa is just one of a host of nations that is in
23.2 19.0 16.6
8.5 16.6 15.5
12.5 14.8
12.0
18.6
16.6 14.2
5.0 6.0 9.4
8.5
9.9
8.2
4.4 3.9 4.5 4.8
5.4
6.2
14.2 12.3
4.5 7.6
6.7 13.2
0.0
10.0
20.0
30.0
40.0
50.0
60.0
70.0
2008 2009 2010 2011 2012 2013
Southern Africa East Africa Central Africa West Africa2 North Africa
Foreign Direct Investment (FDI) into Africa 2008 to 2013, USD billion
Sources: Standard Bank, UNCTAD

NWDC Economic Data Report. Qtr 4 of 2015.2016 www.nwdc.co.za Back to Table of Contents
17
the process of reviewing its international investment agreements regime and that there was “growing unease with the current functioning of the global international investment agreement regime”. A number of unforeseen outcomes as a result of international investment agreements had been identified. Experience had shown that these agreements “bite” – namely that their protection provisions “can and have been enforced by arbitral tribunals at sometimes huge costs to the state”, according to the report. International investment agreements can also have implications for numerous other areas at all levels of policymaking in countries, limiting the regulatory space of the contracting parties. Concerns have been raised that these limits on regulatory space “go too far, were not properly understood at the point of entry into or are inadequately balanced by safeguards for governments or by obligations on [multinational enterprises]”. (Source: 2015 World Investment Report by the United Nations Conference on Trade and Development (UNCTAD))
(Source: UNTAD World Investment Report 2015) Between January 2008 and June 2014 a total of 563 FDI projects were recorded in South Africa. These projects represent a total capital investment of ZAR291.04 b which is an average investment of ZAR517.25 m per project. During the period, a total of 110,370 jobs were created. (Source: Prepared by Trade and Investment South Africa (TISA) a division in the dti)
Destination State Projects CAPEX Avg.
CAPEX Jobs Created
Avg. Jobs Created
Companies
Gauteng 247 77370.9 312.9 33665 136 225
Western Cape 89 25686.9 288.3 9626 108 84
Eastern Cape 39 26841.0 688.1 10613 272 29
KwaZulu-Natal 37 22086.0 597.2 9671 261 29
Northern Cape 23 27751.8 1206.7 4149 180 14
Mpumalanga 13 8981.2 690.8 4502 346 12
North West 8 6031.4 753.7 5078 634 8
Limpopo 7 7719.8 1102.8 3318 474 5
Free State 7 11203.9 1600.3 2880 411 7
Not Specified 93 77366.1 831.6 26868 288 91
Total 563 291038.8 517.2 110370 196 442 Notes: 1) ©fDi Intelligence, from the Financial Times Ltd 2014. Data subject to terms and conditions of use. 2) All Capex Figures shown in the table are in ZAR - South African Rand millions. 3) Capex data includes estimated values Financial Times Ltd takes no responsibility for the accuracy or otherwise of this data. 4) Jobs data includes estimated values Financial Times Ltd takes no responsibility for the accuracy or otherwise of this data.
4.4 North West Province The North West Province received 1.42% (8) of all project (563) in South Africa between 2008 and 2014. This represents 2.07% (R 6 billion) of the capital investment and 4.6% (5 078 jobs). North West FDI Projects Detail
# Project Date Investing Company Industry Sector Capital R mil Jobs
1 Apr 2014 Syngenta Food & Tobacco 63.545 57
2 Dec 2011 IGE Resources (International Gold Exploration)
Minerals 379.908 383
3 Apr 2011 Monsanto Food & Tobacco 153.740 127
4 Aug 2010 Xstrata-Merafe Metals 934.739 1218

NWDC Economic Data Report. Qtr 4 of 2015.2016 www.nwdc.co.za Back to Table of Contents
18
5 Aug 2009 Platinum Australia Metals 1950.107 1398
6 Nov 2008 Anglo Platinum Metals 1950.107 1398
7 Jun 2008 Primus Special Projects (Pty) Minerals 379.908 383
8 Jun 2008 Guangzhou Pharmaceuticals Food & Tobacco 219.335 114
It must be noted that the information above was sourced from ©fDi Intelligence, from the Financial Times Ltd 2014 and that the projects above might not represent all the projects and expansions in the North West province as some projects are reported in other provinces as the head office of the investing companies are located there.
5. TRADE Presenting the contents of the report in Johannesburg, Unctad economist Alex Izurieta said that international trade had slowed as a result of weak global demand. He also argued that demand was unlikely to strengthen materially in the near term, owing to a still weak global recovery. Unctad expects global growth of between 2.5% and 3% in 2014. The way to expand trade at global level is through a “robust domestic-demand-led output recovery at national level”, rather than through the current emphasis on the cost of trade. In the report, Unctad outlines a “balanced-growth scenario” premised on: income policies that support growth of demand; growth- enhancing fiscal policies; industrial policies to promote private investment and structural transformation; regulation of finance and capital controls to stabilise global financial markets; and development- orientated trade agreements. Such policy prescriptions mesh with South Africa’s current deliberations on the introduction of a national minimum wage, as well as using public infrastructure investment programmes to stimulate demand for locally made manufacturing inputs. However, there is less alignment in the area of trade policy, where South Africa aims to bolster the competitiveness of its tradeables sectors in a bid to materially increase exports, particularly the export of manufactured products. “It is possible to achieve higher levels of global growth of above 6% to 7% continuously over the next ten years through a coordinated effort to press the accelerator on fiscal support,” Izurieta, who co-authored the report, argues. Such support would be in the form of higher government spending on infrastructure, raising private-sector investments in productive activities and income policies that help bolster wages and, in so doing, create new demand. To support such an outcome, Unctad says developing countries should be allowed sufficient “policy space” to pursue proactive trade and industrial policies as part of the Post-2015 Development Agenda, currently under consideration. It also cautions developing countries not to enter into multilateral and bilateral agreements that will further erode their policy space to protect domestic industries, or to limit government’s ability to maximise the rents they are able to extract from the resources sector. Edited by: Terence Creamer
NWDC Economic Data Report. Qtr 4 of 2015.2016 www.nwdc.co.za Back to Table of Contents
19
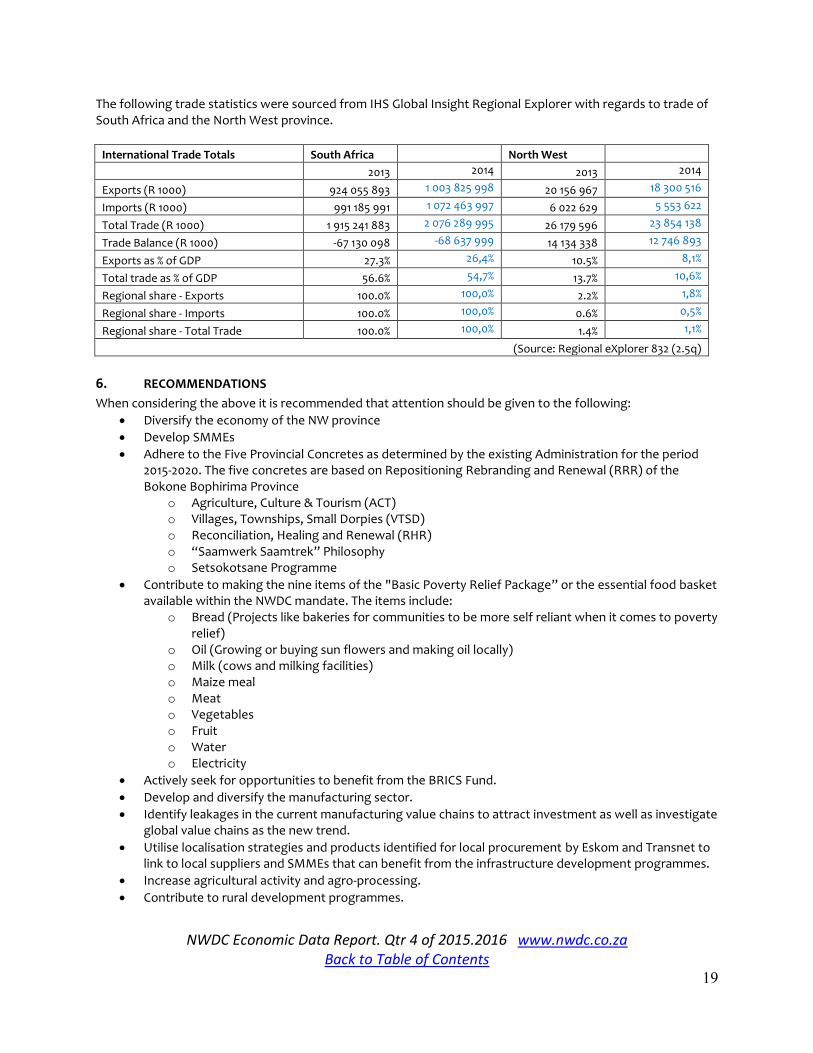
The following trade statistics were sourced from IHS Global Insight Regional Explorer with regards to trade of South Africa and the North West province.
International Trade Totals South Africa North West
2013 2014 2013 2014
Exports (R 1000) 924 055 893 1 003 825 998 20 156 967 18 300 516
Imports (R 1000) 991 185 991 1 072 463 997 6 022 629 5 553 622
Total Trade (R 1000) 1 915 241 883 2 076 289 995 26 179 596 23 854 138
Trade Balance (R 1000) -67 130 098 -68 637 999 14 134 338 12 746 893
Exports as % of GDP 27.3% 26,4% 10.5% 8,1%
Total trade as % of GDP 56.6% 54,7% 13.7% 10,6%
Regional share - Exports 100.0% 100,0% 2.2% 1,8%
Regional share - Imports 100.0% 100,0% 0.6% 0,5%
Regional share - Total Trade 100.0% 100,0% 1.4% 1,1%
(Source: Regional eXplorer 832 (2.5q)
6. RECOMMENDATIONS
When considering the above it is recommended that attention should be given to the following:
Diversify the economy of the NW province
Develop SMMEs
Adhere to the Five Provincial Concretes as determined by the existing Administration for the period 2015-2020. The five concretes are based on Repositioning Rebranding and Renewal (RRR) of the Bokone Bophirima Province
o Agriculture, Culture & Tourism (ACT) o Villages, Townships, Small Dorpies (VTSD) o Reconciliation, Healing and Renewal (RHR) o “Saamwerk Saamtrek” Philosophy o Setsokotsane Programme
Contribute to making the nine items of the "Basic Poverty Relief Package” or the essential food basket available within the NWDC mandate. The items include:
o Bread (Projects like bakeries for communities to be more self reliant when it comes to poverty relief)
o Oil (Growing or buying sun flowers and making oil locally) o Milk (cows and milking facilities) o Maize meal o Meat o Vegetables o Fruit o Water o Electricity
Actively seek for opportunities to benefit from the BRICS Fund.
Develop and diversify the manufacturing sector.
Identify leakages in the current manufacturing value chains to attract investment as well as investigate global value chains as the new trend.
Utilise localisation strategies and products identified for local procurement by Eskom and Transnet to link to local suppliers and SMMEs that can benefit from the infrastructure development programmes.
Increase agricultural activity and agro-processing.
Contribute to rural development programmes.

NWDC Economic Data Report. Qtr 4 of 2015.2016 www.nwdc.co.za Back to Table of Contents
20
Utilise co-operatives to stimulate these economies.
Utilise ICT for communication and training purposes
Include designated groups, youth, women and disabled as beneficiaries of projects.
The unemployed graduates database and other databases can be consulted for possible beneficiaries.
Skilling in line with provincial plans is very important and closer co-operation should be encouraged between tertiary institutions and project drivers to be able to develop appropriate skills.
Report Submitted By Date: 29 March 2016
JA Hoogkamer Manager Research and Development, North West Development Corporation +27 14 594 2570