
Economic Dashboard - City of Toronto€™s – Global Luxury Real Estate White Paper – 2015...
44
toronto.ca/business | toronto.ca/culture Economic Dashboard September 29, 2015 Attachment
Transcript of Economic Dashboard - City of Toronto€™s – Global Luxury Real Estate White Paper – 2015...

toronto.ca/business | toronto.ca/culture
Economic Dashboard September 29, 2015
Attachment

2
Indicator Highlights
Note: Top symbol compares how Toronto’s position has changed; bottom symbol compares Toronto’s performance to Canada
Positive Caution Negative
Geography
Same Month
Last Year
Previous
Month
Most Recent
Month Status
Unemployment Rate Toronto 10.3% 7.2% 7.0%
August 2015 (3 Month Average SA) Canada 7.0% 6.8% 6.8%
Participation Rate Toronto 64.9% 65.8% 65.3% LFSAugust 2015 (3 Month Average SA) Canada 65.9% 65.8% 65.8%
Employment Rate Toronto 58.2% 61.0% 60.7%
August 2015 (3 Month Average SA) Canada 61.3% 61.3% 61.3%
Total Value of Building Permits Toronto $688 million $865 million $485 million
July 2015 (3 Month Average) Canada $9.9 billion $8.9 billion $8.6 billion
High Rise Buildings Under Construction Toronto 122 133 133
September 2015 (skyscraperpage.com)
Office Vacancy Rate Toronto 6.5% 6.2% 6.2%
Q2 2015
Average House Price Toronto $564,359 $618,202 $605,817
July 2015 Canada $404,567 $453,560 $441,464
Business Bankruptcies Toronto CMA 107 136 133
Q2 2015 Canada 1,084 1,088 1,052
Employment Insurance Recipients Toronto 28,070 20,310 26,810
July 2015 Canada 447,260 358,860 472,230
Inflation Rate Toronto CMA 2.6% 1.8% 1.4%August 2015 (Year-to-Year) Canada 2.1% 1.3% 1.3%
Retail Sales Toronto CMA $6.08 billion $6.38 billion $6.46 billion
July 2015 (3 Month Average SA) Canada $42.42 billion $42.88 billion $43.14 billion

3
Real GDP Growth Toronto CMA
Source: Conference Board of Canada (August 7, 2015), Moody’s Analytics (September 9, 2015)
0.0%
0.5%
1.0%
1.5%
2.0%
2.5%
13q1 13q2 13q3 13q4 14q1 14q2 14q3 14q4 15q1 15q2 15q3 15q4 16q1 16q2 16q3 16q4
Moody's Conf Board
Historical Forecast

4
Percent Change in GDP Toronto CMA
Source: Conference Board of Canada (Aug. 7, 2015), Moody’s Analytics (Sept. 9, 2015), Oxford Economics (Jun. 30, 2015)
Moody's
Conference
Board Average Annual Rate 13q1 1.04% 0.50% 0.77% 13q2 2.13% 0.84% 1.49% 13q3 0.44% 0.55% 0.50% 13q4 0.32% 0.72% 0.52% 3.30% 14q1 0.37% 0.52% 0.44% 14q2 0.99% 0.91% 0.95% 14q3 0.79% 1.28% 1.03% 14q4 0.76% 0.75% 0.75% 3.22% 15q1 0.09% 0.31% 0.20% 15q2 0.89% 0.29% 0.59% 15q3 0.88% 1.01% 0.94% 15q4 0.84% 0.55% 0.70% 2.45% 16q1 0.82% 0.74% 0.78% 16q2 0.77% 0.69% 0.73% 16q3 0.74% 0.67% 0.71% 16q4 0.71% 0.67% 0.69% 2.94%

5
Jobs in the City of Toronto Establishment Survey
Source: City Planning Division, Research and Information
1,100
1,150
1,200
1,250
1,300
1,350
1,400
87 88 89 90 91 92 93 94 95 96 97 98 99 00 01 02 03 04 05 06 07 08 09 10 11 12 13 14
(00
0's
)
FTA, Jan 1989
GST, Jan 1991
NAFTA, Jan 1994
DOT Com Bust,2001
SARS, 2003
Global Credit Crisis, 2008
E.U. Debt Crisis, 2011
6
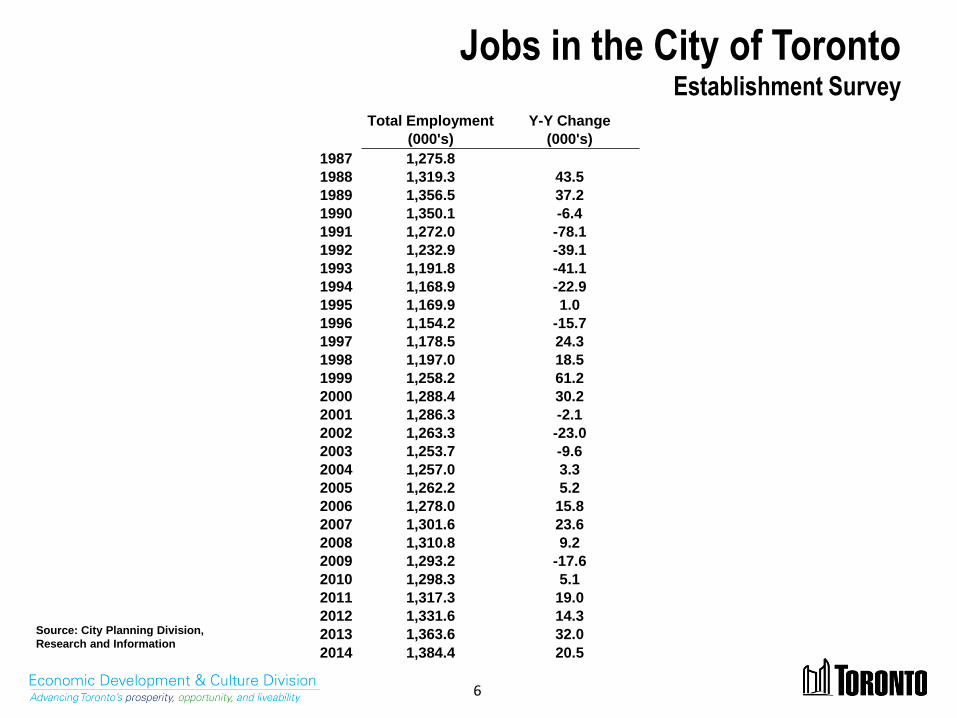
Jobs in the City of Toronto Establishment Survey
Total Employment Y-Y Change
(000's) (000's)
1987 1,275.8
1988 1,319.3 43.5
1989 1,356.5 37.2
1990 1,350.1 -6.4
1991 1,272.0 -78.1
1992 1,232.9 -39.1
1993 1,191.8 -41.1
1994 1,168.9 -22.9
1995 1,169.9 1.0
1996 1,154.2 -15.7
1997 1,178.5 24.3
1998 1,197.0 18.5
1999 1,258.2 61.2
2000 1,288.4 30.2
2001 1,286.3 -2.1
2002 1,263.3 -23.0
2003 1,253.7 -9.6
2004 1,257.0 3.3
2005 1,262.2 5.2
2006 1,278.0 15.8
2007 1,301.6 23.6
2008 1,310.8 9.2
2009 1,293.2 -17.6
2010 1,298.3 5.1
2011 1,317.3 19.0
2012 1,331.6 14.3
2013 1,363.6 32.0
2014 1,384.4 20.5
Source: City Planning Division,
Research and Information

7
Business Climate Toronto Ranks Well Internationally – General Rankings
fDI Magazine – American Cities of the Future – 2015/6 Toronto ranks 6th of the top 10 North American cities for attractiveness for inward investment
Qatar Financial Centre - The Global Financial Centres Index 18 - 2015
Toronto ranks 8th in world and 2nd in North America
Arcadis – Sustainable Cities Index – 2015 Toronto ranks 12th of 50 global cities from 31 countries based on three dimensions of sustainability: social, environmental and economic
Christie’s – Global Luxury Real Estate White Paper – 2015 Toronto ranks 1st of the top 10 cities (out of 80 global markets) as the world’s ‘hottest’ luxury real estate market
Toronto Region Board of Trade – Scorecard on Prosperity - 2015 Toronto ranks 5th of 24 global metropolitan regions
Youthful Cities– The World’s Most Youthful Cities– 2015 Toronto ranks 6th of the top 10 cities(out of 55 global cities) from a youth perspective, based on attributes including entrepreneurship, public space, diversity, digital access, and civic engagement.
Boston Consulting Group – Most Popular Destinations for Job-Seekers – 2014 Toronto ranks 8th out of 25 global cities
Forbes Magazine– The World’s Most Influential Cities – 2014 Toronto ranks 10th of 58 global cities for global influence
KPMG’s Comparative Alternatives Study – Focus on Tax - 2014 Toronto ranks 1st of 51 major international cities for the world’s most tax-competitive major city, ahead of Vancouver (2nd) & Montreal (3rd)
KPMG’s Comparative Alternatives Study – Business Location Costs - 2014 Toronto ranks 2nd of 34 Canadian and US cities with population of 2 million or more for lowest business costs
PricewaterhouseCoopers - Cities of Opportunity - 2014 Toronto ranks 4th of 30 cities globally in current social and economic performance
Aon Hewitt – People Risk Index – 2013 Toronto ranks 3rd of 138 global metropolitan areas for lowest risk in the world for recruiting, employing & relocating employees
Economist Intelligence Unit and CitiGroup – City Competitiveness Index- 2013 Toronto ranks 10th of 120 cities for global competitiveness

8
Business Climate Toronto Ranks Well Internationally – Sectoral Rankings
Ban
kin
g
Qu
ality
of
Lif
e
Ed
ucati
on
Z/Yen Group – Global Financial Centres Index 17 – 2015 Toronto ranks 11th of 82 global financial centres
Grosvenor – International Index of World’s Most Resilient Cities - 2014 Toronto ranks 1st out of 50 global cities for long-term real estate investment
The Economist – Best Place to Live – 2015 Toronto ranks 1st out of 50 global cities for the best place to live based on 6 of its indexes
The Economist – The Safe Cities Index – 2015 Toronto ranks 8th out of 50 global cities for safety (e.g digital security, health security, infrastructure safety and personal safety)
The Economist Intelligence Unit – Liveability Ranking - 2015 Toronto ranks 4th of 140 cities for liveability
Metropolis– The World’s Most Livable Cities - 2015 Toronto ranks 1st out of top 10 global cities for liveability
Mercer Consulting– Quality of Living Ranking Survey - 2015 Toronto ranks 15th out of top 35 North American cities and 15th out of 230 global cities for liveability
Transit Score - A Measure of How Well a Location is Served by Public Transit - 2015
Toronto ranks 1st in Canada and 4th of 70 in Canadian and US cities
QS Best Student Cities – University Ranking - 2015 Toronto ranks 9th of 50 global cities
Times Higher Education – World University Rankings - 2015 University of Toronto ranks 20th of 400 global universities
Shanghai Jiao Tong University – Academic Ranking of World Universities - 2015 University of Toronto ranks 25th of 1000 global universities
Centre for World University Rankings – Global University Ranking - 2015 University of Toronto ranks 32nd of 1000 global universities
QS World University Ranking – University Ranking – 2015/16 University of Toronto ranks 34th of 400 global universities
9
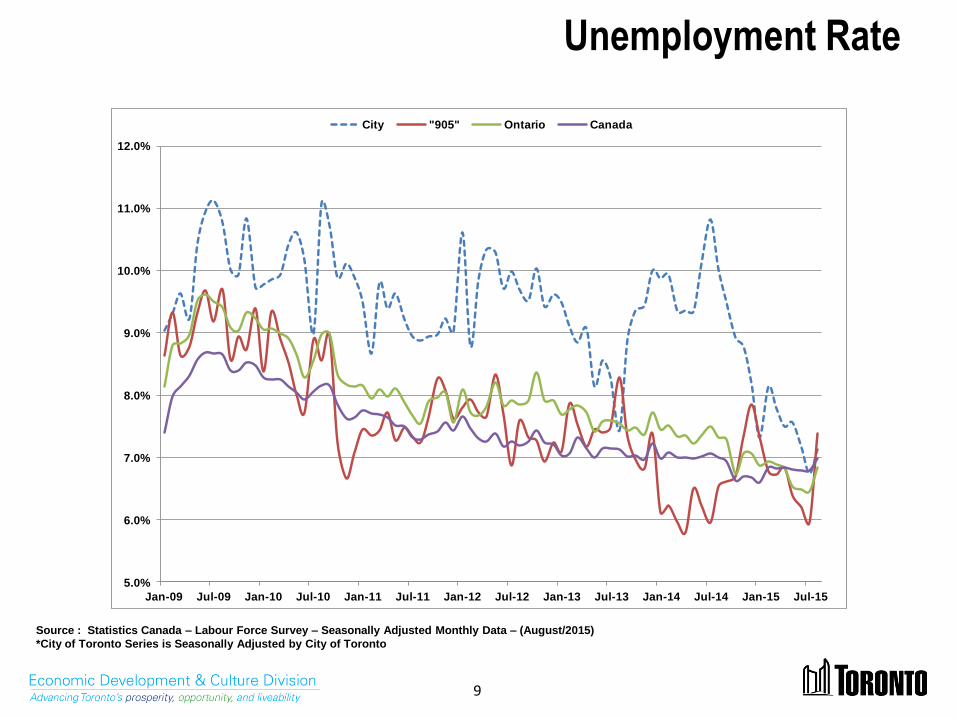
Unemployment Rate
Source : Statistics Canada – Labour Force Survey – Seasonally Adjusted Monthly Data – (August/2015)
*City of Toronto Series is Seasonally Adjusted by City of Toronto
5.0%
6.0%
7.0%
8.0%
9.0%
10.0%
11.0%
12.0%
Jan-09 Jul-09 Jan-10 Jul-10 Jan-11 Jul-11 Jan-12 Jul-12 Jan-13 Jul-13 Jan-14 Jul-14 Jan-15 Jul-15
City "905" Ontario Canada

10
Unemployment Rate
Source : Statistics Canada – Labour Force Survey – Seasonally Adjusted Monthly Data
*City of Toronto Series is Seasonally Adjusted by City of Toronto
City "905" Ontario Canada
Aug-14 10.0% 6.5% 7.3% 7.0%
Sep-14 9.5% 6.6% 7.3% 6.9%
Oct-14 8.9% 6.7% 6.7% 6.6%
Nov-14 8.8% 7.3% 7.0% 6.7%
Dec-14 8.2% 7.8% 7.0% 6.7%
Jan-15 7.3% 7.3% 6.9% 6.6%
Feb-15 8.1% 6.8% 6.9% 6.8%
Mar-15 7.8% 6.7% 6.9% 6.8%
Apr-15 7.5% 6.8% 6.8% 6.8%
May-15 7.6% 6.4% 6.5% 6.8%
Jun-15 7.2% 6.2% 6.5% 6.8%
Jul-15 6.7% 6.0% 6.4% 6.8%
Aug-15 7.1% 7.4% 6.8% 7.0%

11
Participation Rate
Source : Statistics Canada – Labour Force Survey – Seasonally Adjusted Monthly Data – (August/2015)
*City of Toronto Series is Seasonally Adjusted by City of Toronto
62.0%
63.0%
64.0%
65.0%
66.0%
67.0%
68.0%
69.0%
70.0%
71.0%
72.0%
73.0%
74.0%
Jan-09 Jul-09 Jan-10 Jul-10 Jan-11 Jul-11 Jan-12 Jul-12 Jan-13 Jul-13 Jan-14 Jul-14 Jan-15 Jul-15
City "905" Ontario Canada

12
Participation Rate
Source : Statistics Canada – Labour Force Survey – Seasonally Adjusted Monthly Data
*City of Toronto Series is Seasonally Adjusted by City of Toronto
City "905" Ontario Canada
Aug-14 64.7% 68.4% 65.7% 65.8%
Sep-14 64.1% 68.2% 65.7% 65.9%
Oct-14 64.1% 68.7% 65.7% 65.9%
Nov-14 63.5% 69.2% 65.6% 65.8%
Dec-14 63.7% 68.0% 65.4% 65.7%
Jan-15 63.5% 67.7% 65.3% 65.7%
Feb-15 63.9% 68.1% 65.4% 65.8%
Mar-15 64.7% 67.2% 65.3% 65.9%
Apr-15 65.3% 67.1% 65.1% 65.8%
May-15 66.4% 67.8% 65.2% 65.9%
Jun-15 65.8% 68.1% 65.3% 65.8%
Jul-15 65.1% 69.2% 65.2% 65.7%
Aug-15 64.9% 70.7% 65.3% 65.9%

13
Employment Rate Employment / Population age 15+
Source : Statistics Canada – Labour Force Survey – Seasonally Adjusted Monthly Data – (August/2015)
*City of Toronto Series is Seasonally Adjusted by City of Toronto
56.0%
57.0%
58.0%
59.0%
60.0%
61.0%
62.0%
63.0%
64.0%
65.0%
66.0%
67.0%
68.0%
69.0%
Jan-09 Jul-09 Jan-10 Jul-10 Jan-11 Jul-11 Jan-12 Jul-12 Jan-13 Jul-13 Jan-14 Jul-14 Jan-15 Jul-15
City "905" Ontario Canada

14
Employment Rate Employment / Population age 15+
Source : Statistics Canada – Labour Force Survey – Seasonally Adjusted Monthly Data
*City of Toronto Series is Seasonally Adjusted by City of Toronto
City "905" Ontario Canada
Aug-14 58.2% 63.9% 60.9% 61.2%
Sep-14 58.0% 63.7% 60.9% 61.3%
Oct-14 58.4% 64.1% 61.3% 61.5%
Nov-14 57.9% 64.1% 61.0% 61.4%
Dec-14 58.4% 62.6% 60.8% 61.3%
Jan-15 58.9% 62.7% 60.8% 61.4%
Feb-15 58.7% 63.5% 60.9% 61.3%
Mar-15 59.7% 62.7% 60.8% 61.4%
Apr-15 60.4% 62.5% 60.7% 61.3%
May-15 61.4% 63.5% 61.0% 61.4%
Jun-15 61.1% 63.9% 61.0% 61.3%
Jul-15 60.7% 65.1% 61.0% 61.3%
Aug-15 60.3% 65.5% 60.9% 61.3%

15
Unemployment Rate Major Canadian Urban Regions
Source : Statistics Canada – Labour Force Survey – (August/2015)
Seasonally Adjusted 3 Month Moving Averages. CANSIM Table 282-0135
2.0%
3.0%
4.0%
5.0%
6.0%
7.0%
8.0%
9.0%
10.0%
11.0%
Jan-09 Jul-09 Jan-10 Jul-10 Jan-11 Jul-11 Jan-12 Jul-12 Jan-13 Jul-13 Jan-14 Jul-14 Jan-15 Jul-15
Toronto Montreal Ottawa Calgary Edmonton Vancouver

16
Unemployment Rate Major Canadian Urban Regions
Source : Statistics Canada – Labour Force Survey
Seasonally Adjusted 3 Month Moving Averages. CANSIM Table 282-0135
Toronto Montreal Ottawa Calgary Edmonton Vancouver
Aug-14 8.3% 8.7% 6.9% 5.3% 5.3% 5.8%
Sep-14 8.3% 8.5% 6.9% 5.0% 5.4% 6.0%
Oct-14 8.1% 8.3% 6.6% 5.0% 5.3% 6.2%
Nov-14 8.0% 8.3% 6.3% 4.6% 5.2% 6.2%
Dec-14 8.0% 8.1% 6.2% 4.8% 4.8% 6.0%
Jan-15 7.8% 7.8% 6.9% 4.7% 4.8% 5.8%
Feb-15 7.6% 7.5% 7.2% 5.0% 4.8% 5.9%
Mar-15 7.3% 7.5% 7.2% 5.2% 5.3% 6.0%
Apr-15 7.3% 7.7% 6.9% 5.3% 5.8% 6.1%
May-15 7.1% 8.3% 6.6% 5.5% 6.3% 6.2%
Jun-15 6.9% 8.7% 6.5% 5.9% 5.9% 6.1%
Jul-15 6.6% 8.9% 6.4% 6.6% 5.7% 6.0%
Aug-15 6.7% 8.9% 6.5% 6.6% 5.5% 5.7%
17
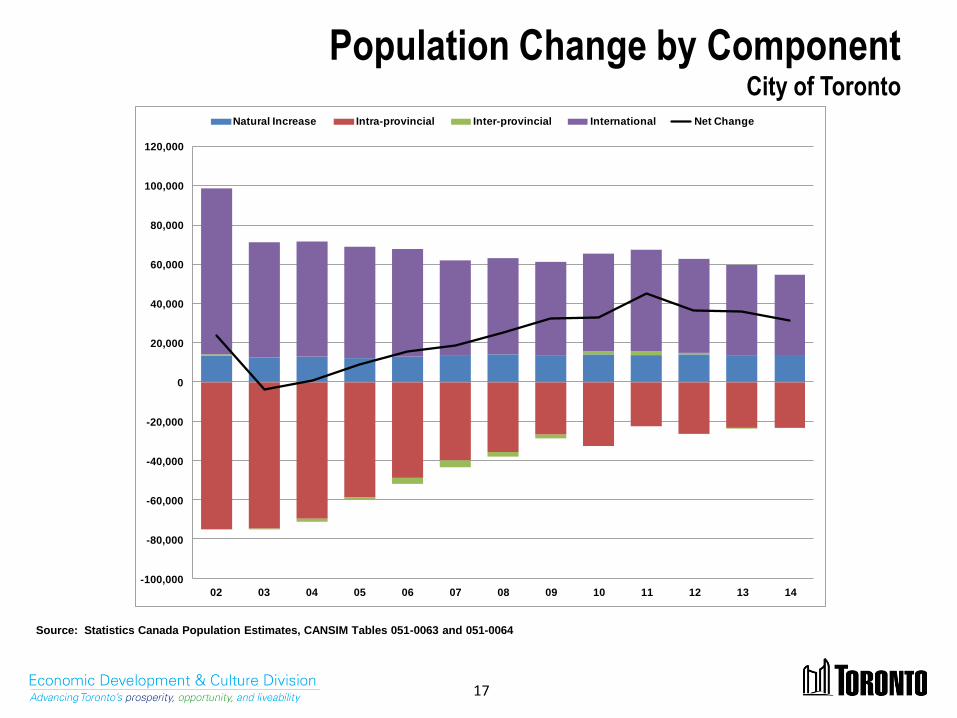
Population Change by Component City of Toronto
Source: Statistics Canada Population Estimates, CANSIM Tables 051-0063 and 051-0064
-100,000
-80,000
-60,000
-40,000
-20,000
0
20,000
40,000
60,000
80,000
100,000
120,000
02 03 04 05 06 07 08 09 10 11 12 13 14
Natural Increase Intra-provincial Inter-provincial International Net Change

18
Intra-Provincial Migration by Age City of Toronto
Source: Statistics Canada Population Estimates, CANSIM Table 051-0063
-14000
-12000
-10000
-8000
-6000
-4000
-2000
0
2000
4000
-1 y
ea
r
0-4
5-9
10
-14
15
-19
20
-24
25
-29
30
-34
35
-39
40
-44
45
-49
50
-54
55
-59
60
-64
65
-69
70
-74
75
-79
80
-84
85
-89
90
+
2003/2004 2013/2014

19
High Rise Buildings Under Construction North American Cities
Source : www.emporis.com - Updated September 14, 2015
114
158
76
32
92
42
2125
53
17
35
9 9
24
133
111
51
35 36
43
2318 18
10
19
107 5
0
20
40
60
80
100
120
140
160
180
September 2015
September 2015

20
Tallest Buildings Under Construction City of Toronto
Source : This list was composed on September14, 2015 from the CTBUH Tall Buildings Database
Building Address Metres Feet Floors Year
1 Number One Bloor 1 Bloor St E 257 844 75 2016
2 Harbour Plaza Residences East 90 Harbour St 233 764 66 2017
3 Ten York 10 York St 224 735 65 2019
4 Harbour Plaza Residences West 1 York St 224 735 62 2017
5 Massey Tower 197 Yonge St 208 683 60 2018
6 88 Scott 88 Scott St 204 669 58 2017
7 YC Condos 460 Yonge Street 199 651 60 2019
8 Bay-Adelaide Centre East Tower 333 Bay St 196 643 44 2016
9 E Condos South 8 Eglinton E 196 642 58 2017
10 EY Tower 100 Adelaide St W 188 617 40 2017
11 CASA II 42 Charles St E 185 605 57 2016
12 Lighthouse Tower Condominium 132 Queens Quay East 182 598 48 2019
13 INDX Condominiums 66 Temperance St 179 587 54 2016
14 One York Street 1 York St 174 569 35 2016
15 Lagos at the Waterfront 2151 Lake Shore Blvd W 168 550 49 2016
16 Karma 9 Grenville Street 166 544 50 2016
17 87 Peter 87 Peter St 154 505 49 -
18 Bisha Hotel & Residences 56 Blue Jay Ways 147 482 41 2016
19 The Britt 955 Bay St 139 456 41 2017
20 Studio2 on Richmond 199 Richmond Street West 131 430 41 2016
21 Cumberland at Yorkville Plaza Cumberland Street & Avenue Road125 409 39 2017
22 E Condos North 8 Eglinton E 123 403 38 2017
23 21 Dundas 21 Dundas St 122 400 39 2016
24 The Madison West 79 Dunfield Avenue 121 397 36 2015
25 Jade Waterfront Condos 2175 Lake Shore Boulevard West112 366 34 2016
26 Minto 30 Roe 30 Roehampton Avenue 111 365 33 2016
27 The Madison East 79 Dunfield Avenue 111 364 33 2015
28 101 Erskine 101 Erskine Ave 106 349 32 -
29 1 Thousand Bay Street 100 Bay Street 104 342 32 2016
30 Exhibit Residences 162 Cumberland St 100 328 32 2015
31 Treviso II Condos Dufferin and Lawrence 93 305 29 2016
32 One Valhalla - Triumph 1 Valhalla Road 86 282 25 2016
33 Thompson Residences 550 Wellington St W 53 175 15 2015
34 Alto 2205 Sheppard Av. East - - 43 2016
35 The Bond 290 Adelaide St W - - 41 2015
36 Avani 1 at Metrogate 2055 Kennedy Rd - - 35 2016
36 Omega on the Park Esther Shiner Blvd and Provost Drive- - 35 -
38 Hotel X Exhibition Place - - 29 2015
39 Blue Diamond Condos at Imperial Plaza 1499 Yonge Street - - 26 2016

21
High Rise Buildings Under Construction North American Cities (Skyscraperpage)
Source : www.skyscraperpage.com - Updated September 14, 2015
0
20
40
60
80
100
120
140
70+ 60-69 50-59 40-49 30-39 20-29 9-19

22
High Rise Buildings Under Construction City of Toronto by number of floors
Source : www.skyscraperpage.com - Updated September 14, 2015
Floors Number of Buildings Total Floors Percent of Total
70+ 1 75 2.0%
60-69 7 439 11.5%
50-59 8 442 11.6%
40-49 17 750 19.7%
30-39 26 890 23.4%
20-29 19 464 12.2%
9-19 55 744 19.6%
Total 133 3,804 100.0%

23
Total Value of Building Permits City and “905” area
Source : Statistics Canada, 3 month moving averages (July/2015)
$0.0
$0.2
$0.4
$0.6
$0.8
$1.0
$1.2
$1.4
$1.6
$1.8
$2.0
Jan-10 Jul-10 Jan-11 Jul-11 Jan-12 Jul-12 Jan-13 Jul-13 Jan-14 Jul-14 Jan-15 Jul-15
Bil
lio
ns
City 905 Municipalities

24
Total Value of Building Permits City and “905” area
Source : Statistics Canada, 3 month moving averages
3MMA 12MMA
Billions $ Billions $
City 905 Municipalities City 905 Municipalities
Jul-14 $0.69 $0.85 $0.66 $0.69
Aug-14 $0.59 $0.75 $0.62 $0.64
Sep-14 $0.69 $0.79 $0.61 $0.69
Oct-14 $0.50 $0.81 $0.60 $0.70
Nov-14 $0.58 $0.90 $0.58 $0.71
Dec-14 $0.58 $0.72 $0.56 $0.70
Jan-15 $0.58 $0.68 $0.57 $0.70
Feb-15 $0.48 $0.55 $0.54 $0.68
Mar-15 $0.43 $0.63 $0.55 $0.72
Apr-15 $0.84 $0.69 $0.63 $0.75
May-15 $0.88 $0.90 $0.64 $0.78
Jun-15 $0.87 $1.01 $0.62 $0.80
Jul-15 $0.49 $1.11 $0.63 $0.82

25
Value of ICI Building Permits City and “905” area
Source : Statistics Canada, 3 month moving averages (July/2015)
$0
$100
$200
$300
$400
$500
$600
$700
$800
$900
Jan-10 Jul-10 Jan-11 Jul-11 Jan-12 Jul-12 Jan-13 Jul-13 Jan-14 Jul-14 Jan-15 Jul-15
Mil
lio
ns
City 905 Municipalities

26
Value of ICI Building Permits City and “905” area
Source : Statistics Canada, 3 month moving averages
3MMA 12MMA
Millions $ Millions $
City 905 Municipalities City 905 Municipalities
Jul-14 $226.2 $263.2 $270.5 $241.9
Aug-14 $196.4 $220.4 $248.1 $212.5
Sep-14 $265.7 $360.4 $261.2 $246.0
Oct-14 $236.8 $389.8 $251.4 $257.5
Nov-14 $242.4 $401.4 $233.0 $264.3
Dec-14 $207.0 $241.7 $206.5 $256.7
Jan-15 $212.1 $185.1 $214.4 $244.3
Feb-15 $227.7 $140.7 $209.0 $245.4
Mar-15 $201.0 $162.2 $209.6 $252.9
Apr-15 $505.7 $184.6 $281.0 $253.4
May-15 $522.4 $247.3 $292.0 $261.0
Jun-15 $527.0 $307.4 $292.3 $263.5
Jul-15 $220.2 $322.9 $290.5 $266.4
27
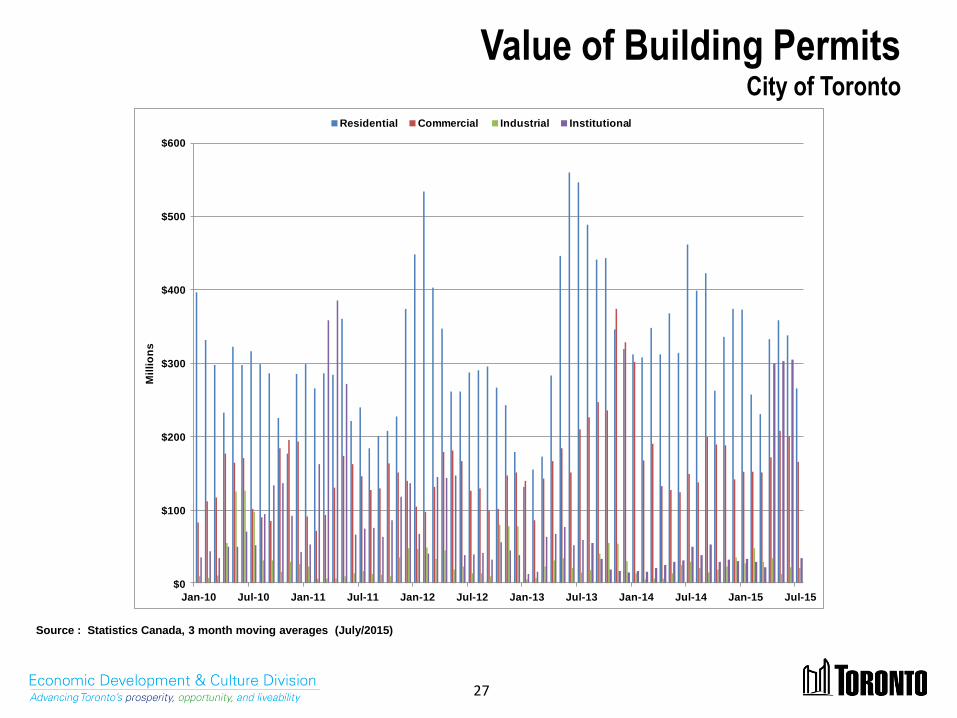
Value of Building Permits City of Toronto
Source : Statistics Canada, 3 month moving averages (July/2015)
$0
$100
$200
$300
$400
$500
$600
Jan-10 Jul-10 Jan-11 Jul-11 Jan-12 Jul-12 Jan-13 Jul-13 Jan-14 Jul-14 Jan-15 Jul-15
Mil
lio
ns
Residential Commercial Industrial Institutional

28
Value of Building Permits City of Toronto
Source : Statistics Canada, 3 month moving averages
Residential Commercial Industrial Institutional Residential Commercial Industrial Institutional
Jul-14 462.1 149.1 28.2 48.9 385.7 217.0 24.5 29.0
Aug-14 398.2 136.9 20.9 38.5 369.9 198.7 23.8 25.6
Sep-14 422.4 199.3 13.9 52.5 350.1 209.9 23.1 28.2
Oct-14 262.4 189.1 18.8 29.0 344.5 203.8 19.5 28.0
Nov-14 335.2 187.4 22.7 32.3 345.1 187.6 16.5 28.9
Dec-14 374.4 141.8 35.4 29.8 356.7 156.3 18.9 31.3
Jan-15 372.5 152.2 27.0 32.9 356.9 163.2 19.0 32.2
Feb-15 256.7 151.3 47.6 28.8 332.4 152.9 24.4 31.7
Mar-15 230.0 150.8 29.0 21.1 338.8 152.6 24.4 32.6
Apr-15 332.4 171.8 34.3 299.6 353.3 158.9 25.4 96.7
May-15 358.2 207.7 12.1 302.7 343.3 170.4 25.8 95.8
Jun-15 338.2 200.0 21.8 305.1 332.0 169.4 26.4 96.5
Jul-15 265.0 165.6 20.2 34.3 341.9 168.7 24.3 97.5
Millions $ Millions $
3MMA 12 MMA

29
Office Vacancy Rate & Occupied Space Toronto Region
Source : Cushman & Wakefield
-1,500,000
-1,000,000
-500,000
0
500,000
1,000,000
1,500,000
2,000,000
4.0%
5.0%
6.0%
7.0%
8.0%
9.0%
10.0%
11.0%
12.0%
13.0%
09q1 10q1 11q1 12q1 13q1 14q1 15q1
Va
ca
nc
y R
ate
(lin
es
)
City of Toronto "905" Municipalities
Ch
an
ge
in O
cc
up
ied
Sp
ac
e (b
ars
)

30
Office Vacancy Rate & Occupied Space Toronto Region
Source : Cushman & Wakefield
Vacancy Rates Occupied Change (sqft)
City of Toronto "905"
Municipalities City of Toronto
"905"
Municipalities
09q1 4.9% 6.5% -540,593 -145,773
09q2 6.3% 7.6% -496,133 -377,490
09q3 6.8% 8.1% 1,616,200 126,429
09q4 7.3% 8.7% 182,200 -70,085
10q1 7.2% 9.7% 84,363 -325,338
10q2 7.3% 9.9% 179,855 274,972
10q3 6.8% 9.9% 721,938 -165,920
10q4 7.0% 9.7% -365,962 226,637
11q1 6.4% 9.6% 544,547 64,008
11q2 6.2% 9.6% 295,276 -36,926
11q3 5.6% 9.2% 710,300 429,508
11q4 5.4% 9.7% 859,740 -101,090
12q1 5.5% 9.4% -185,645 136,145
12q2 5.4% 9.9% 95,035 13,171
12q3 5.4% 9.9% 268,342 453,405
12q4 5.6% 10.2% -364,233 51,801
13q1 5.5% 9.7% 93,657 246,178
13q2 5.3% 10.3% 90,798 -179,920
13q3 5.7% 10.8% -787,573 -169,576
13q4 6.1% 10.6% 1,615,193 277,976
14q1 6.7% 11.3% -882039 -399133
14q2 6.5% 11.0% 163,539 227,349
14q3 6.1% 11.1% 496,578 206,356
14q4 6.1% 11.2% 1,436,571 418,841
15q1 6.2% 11.2% -467,980 396,235
15q2 6.2% 12.1% -110,363 -14,168

31
Office Vacancy Rates City of Toronto
Source : Cushman & Wakefield
3.0%
4.0%
5.0%
6.0%
7.0%
8.0%
9.0%
10.0%
11.0%
12.0%
09q1 09q3 10q1 10q3 11q1 11q3 12q1 12q3 13q1 13q3 14q1 14q3 15q1
Downtown Yonge Core Toronto East Toronto West

32
Office Vacancy Rates City of Toronto
Source : Cushman & Wakefield
Downtown Yonge Core Toronto East Toronto West
09q1 4.4% 6.6% 10.8% 4.0%
09q2 4.9% 7.0% 11.2% 4.2%
09q3 6.0% 7.1% 10.5% 4.6%
09q4 6.6% 7.1% 11.2% 4.9%
10q1 6.8% 6.7% 10.8% 4.4%
10q2 6.6% 7.2% 11.4% 4.9%
10q3 5.7% 7.1% 11.2% 5.4%
10q4 6.0% 7.2% 11.3% 5.8%
11q1 5.3% 6.7% 10.6% 6.0%
11q2 5.1% 5.9% 10.2% 7.4%
11q3 5.0% 5.1% 8.3% 6.4%
11q4 4.7% 4.9% 8.4% 5.9%
12q1 4.9% 4.8% 8.9% 6.0%
12q2 4.5% 5.2% 9.4% 5.8%
12q3 4.3% 5.3% 9.5% 6.2%
12q4 4.4% 5.8% 9.3% 7.1%
13q1 4.4% 5.6% 9.4% 6.4%
13q2 4.1% 5.2% 9.9% 6.1%
13q3 4.6% 5.4% 10.8% 6.0%
13q4 5.0% 6.4% 10.3% 5.7%
14q1 5.8% 6.7% 10.5% 6.0%
14q2 5.5% 6.6% 11.0% 6.1%
14q3 4.9% 6.1% 10.9% 6.3%
14q4 4.8% 6.2% 10.7% 7.3%
15q1 5.1% 6.4% 10.5% 6.8%
15q2 5.1% 6.2% 10.2% 7.4%

33
Quarterly Change in Occupied Office Space Toronto Region
Source : Cushman & Wakefield
-1,500,000
-1,000,000
-500,000
0
500,000
1,000,000
1,500,000
2,000,000
2,500,000
10q1 10q2 10q3 10q4 11q1 11q2 11q3 11q4 12q1 12q2 12q3 12q4 13q1 13q2 13q3 13q4 14q1 14q2 14q3 14q4 15q1 15q2
Downtown Rest of City "905"

34
Quarterly Change in Occupied Office Space Toronto Region
Source: Cushman & Wakefield
Occupied Office Space Change (sqft)
Rest of City
Downtown Midtown North Yonge DVP Core Toronto East Toronto North Toronto West
"905"
Municipalities
Q1 2010 -103,903 69,909 17,577 42,446 23,318 -1,665 36,681 -325,338
Q2 2010 907,575 -139,521 15,651 -90,709 -267,857 -125,930 -119,354 274,972
Q3 2010 596,997 -34,051 56,240 41,060 -35,875 156,984 -59,417 -165,920
Q4 2010 -174,660 11,060 -22,891 4,759 -17,621 -128,673 -37,936 226,637
Q1 2011 451,268 25,450 94,190 -57,156 48,186 -16,825 -566 64,008
Q2 2011 150,167 123,177 77,343 647 53,749 -14,889 -94,918 -36,926
Q3 2011 89,086 106,976 120,454 294,661 23,770 -2,191 77,544 429,508
Q4 2011 834,016 -15,084 52,532 -18,826 -2,438 -13,152 22,692 -101,090
Q1 2012 -123,053 39,684 -17,802 -35,001 -45,243 -1,743 -2,487 136,145
Q2 2012 261,265 -25,198 -70,300 -17,575 -64,748 -18,954 30,545 13,171
Q3 2012 346,852 -23,174 -10,202 -74,619 59,955 1,625 -32,095 453,405
Q4 2012 -220,613 -64,377 -51,144 55,177 -19,634 5,296 -68,938 51,801
Q1 2013 19,290 145,244 -101,310 -13,685 -4,781 764 48,135 246,178
Q2 2013 213,308 -6,764 -6,665 -80,226 -27,167 -11,183 9,495 -179,920
Q3 2013 -541,353 -62,096 14,990 -176,636 -29,005 10,756 -4,229 -169,576
Q4 2013 1,755,679 -129,437 -117,613 -8,575 87,697 -6,113 33,555 277,976
Q1 2014 -553,444 -58,433 -35,301 -188,251 14,920 -39,400 -22,130 -399,133
Q2 2014 225,206 -18,278 41,754 -52,696 -19,715 -1,427 -11,305 227,349
Q3 2014 410,018 41,459 49,609 18,063 -11,195 -7,422 -3,954 206,356
Q4 2014 1,490,333 60,163 -76,990 -16,310 53,868 -235 -74,258 418,841
Q1 2015 -433,680 27,011 -45,089 -7,694 9,688 -26,355 8,139 396,235
Q2 2015 -53,695 -111,198 48,182 436 49,773 -4,463 -38,962 -14,168

35
Industrial Vacancy Rate & Occupied Space Toronto Region
Source : Cushman & Wakefield
-20,000,000
-15,000,000
-10,000,000
-5,000,000
0
5,000,000
10,000,000
15,000,000
0.0%
1.0%
2.0%
3.0%
4.0%
5.0%
6.0%
7.0%
8.0%
9.0%
09q1 10q1 11q1 12q1 13q1 14q1 15q1
City of Toronto 905 Area
Va
ca
nc
yR
ate
(lin
es
)C
ha
ng
e in
Oc
cu
pie
d S
pa
ce
(ba
rs)

36
Industrial Vacancy Rate & Occupied Space Toronto Region
Source : Cushman & Wakefield
City of Toronto "905" Municipalities City of Toronto "905" Municipalities
09q1 5.3% 7.4% -6,849,098 12,398,923
09q2 5.8% 7.8% -2,118,553 -371,004
09q3 5.6% 7.9% 1,665,573 836,616
09q4 5.5% 7.6% 416,959 1,846,871
10q1 4.7% 7.0% 2,175,828 6,436,612
10q2 5.5% 7.5% -1,587,995 -2,445,614
10q3 5.1% 7.5% 1,472,739 3,296,123
10q4 5.2% 6.9% 100,627 -725,771
11q1 5.2% 7.0% -102,911 -547,405
11q2 4.9% 7.0% -1,295,146 -822,732
11q3 5.0% 6.8% -720,923 1,592,612
11q4 4.9% 6.6% -158,014 1,280,666
12q1 5.0% 6.7% 23,038 -345,781
12q2 4.9% 6.7% 80,630 -434,513
12q3 4.8% 6.8% -6,887,145 -7,090,257
12q4 4.9% 6.9% -13,886,850 -19,776,376
13q1 5.1% 6.8% -763,209 2,596,625
13q2 5.1% 6.0% -143,071 3,097,327
13q3 5.5% 6.0% -2,081,651 2,051,150
13q4 4.9% 6.1% 988,530 645,319
14q1 5.0% 6.0% -10,446,138 -13,311,227
14q2 4.7% 5.9% 1,358,984 2,389,516
14q3 4.5% 5.8% -422,123 2,420,479
14q4 4.4% 5.9% -752,481 1,398,701
15q1 4.2% 5.4% -244,033 1,828,627
15q2 3.1% 5.0% 3,382,618 4,456,334
Vacancy Rates Occupied Change (sqft)

37
Housing Starts Toronto CMA
Source : CMHC – Housing Now
0
2000
4000
6000
8000
10000
12000
14000
10q1 10q2 10q3 10q4 11q1 11q2 11q3 11q4 12q1 12q2 12q3 12q4 13q1 13q2 13q3 13q4 14q1 14q2 14q3 14q4 15q1 15q2
City -single/semi/row City - apartments 905 - single/semi/row 905 - apartments

38
Housing Starts Toronto CMA
Source : CMHC – Housing Now
City -
single/semi/row
City -
apartments
905 -
single/semi/row
905 -
apartments
09q1 346 2696 1776 1086
09q2 269 2214 2644 512
09q3 502 2769 2893 548
09q4 313 2810 4337 234
10q1 281 2242 3120 26
10q2 458 3582 3620 302
10q3 418 2686 3893 848
10q4 673 3085 3492 469
11q1 157 3276 2875 2069
11q2 398 5744 4154 946
11q3 469 4409 3813 1456
11q4 705 3814 4917 543
12q1 485 4536 3420 2241
12q2 452 6833 4206 1245
12q3 519 6358 4825 1497
12q4 436 5797 4145 1110
13q1 265 2960 2528 942
13q2 638 3048 3992 904
13q3 677 2887 3294 1376
13q4 444 4699 3560 1333
14q1 235 4266 2589 2589
14q2 437 2331 4104 1686
14q3 531 1626 3237 1227
14q4 422 1823 3236 1179
15q1 237 5257 1773 969
15q2 474 2801 4581 3131
39
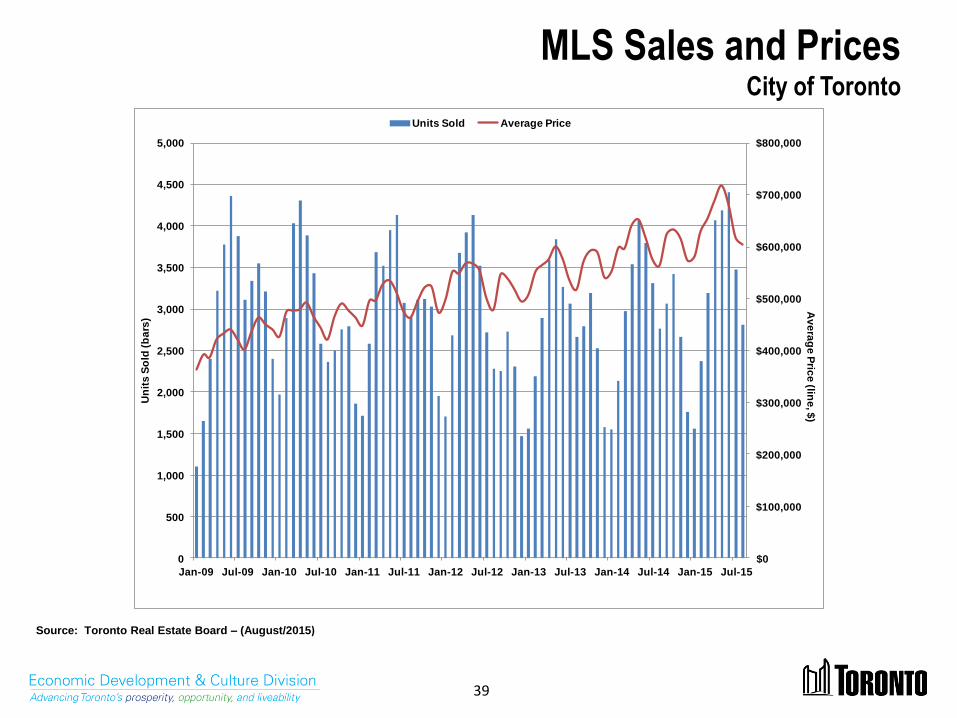
MLS Sales and Prices City of Toronto
Source: Toronto Real Estate Board – (August/2015)
$0
$100,000
$200,000
$300,000
$400,000
$500,000
$600,000
$700,000
$800,000
0
500
1,000
1,500
2,000
2,500
3,000
3,500
4,000
4,500
5,000
Jan-09 Jul-09 Jan-10 Jul-10 Jan-11 Jul-11 Jan-12 Jul-12 Jan-13 Jul-13 Jan-14 Jul-14 Jan-15 Jul-15
Units Sold Average Price
Un
its
So
ld (
ba
rs)
Av
era
ge
Pric
e (lin
e,$
)

40
MLS Sales and Prices City of Toronto
Source: Toronto Real Estate Board
Units Sold Average Price
Aug-13 2,665 $518,145
Sep-13 2,789 $571,410
Oct-13 3,190 $593,807
Nov-13 2,528 $590,366
Dec-13 1,574 $541,771
Jan-14 1,551 $552,395
Feb-14 2,136 $599,414
Mar-14 2,978 $597,401
Apr-14 3,544 $641,666
May-14 4,069 $652,681
Jun-14 3,795 $617,854
Jul-14 3,315 $576,552
Aug-14 2,760 $564,359
Sep-14 3,063 $624,851
Oct-14 3,420 $633,078
Nov-14 2,661 $616,130
Dec-14 1,762 $574,539
Jan-15 1,561 $581,477
Feb-15 2,370 $630,858
Mar-15 3,196 $655,067
Apr-15 4,071 $690,261
May-15 4,189 $718,350
Jun-15 4,406 $682,264
Jul-15 3,480 $618,202
Aug-15 2,807 $605,817
41
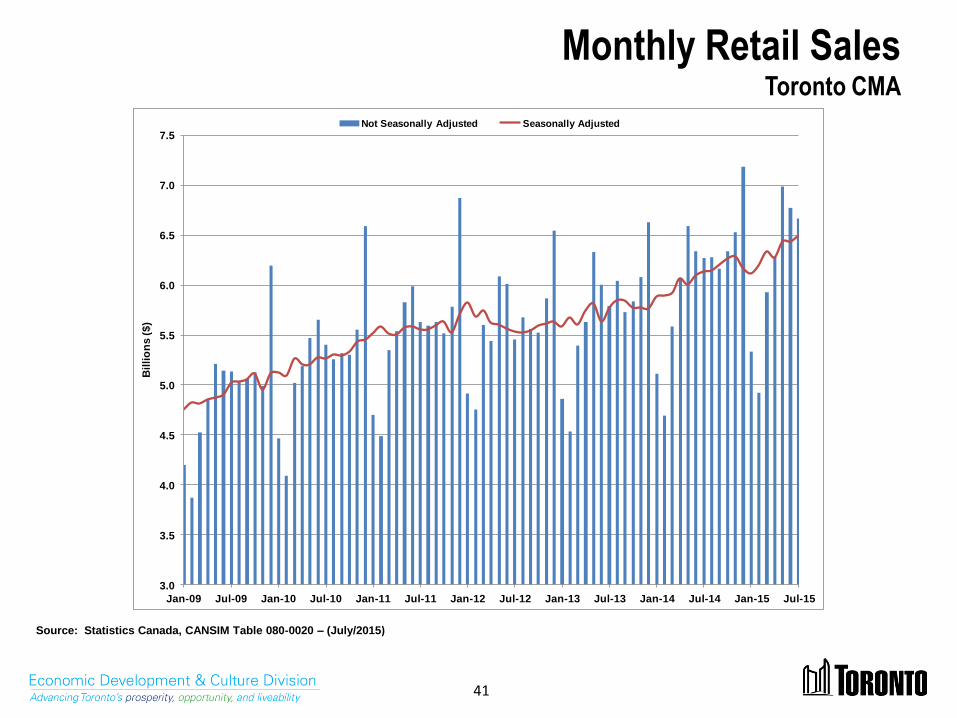
Monthly Retail Sales Toronto CMA
Source: Statistics Canada, CANSIM Table 080-0020 – (July/2015)
3.0
3.5
4.0
4.5
5.0
5.5
6.0
6.5
7.0
7.5
Jan-09 Jul-09 Jan-10 Jul-10 Jan-11 Jul-11 Jan-12 Jul-12 Jan-13 Jul-13 Jan-14 Jul-14 Jan-15 Jul-15
Bil
lio
ns
($
)
Not Seasonally Adjusted Seasonally Adjusted

42
Monthly Retail Sales Toronto CMA
Source: Statistics Canada, CANSIM Table 080-0020
($Billions)
Unadjusted Seasonally Adjusted
Monthly
3 Month
Average Monthly
3 Month
Average
Jul-13 5.79 6.04 5.78 5.74
Aug-13 6.04 5.95 5.85 5.75
Sep-13 5.73 5.85 5.85 5.83
Oct-13 5.84 5.87 5.78 5.83
Nov-13 6.08 5.88 5.77 5.80
Dec-13 6.63 6.18 5.77 5.77
Jan-14 5.12 5.94 5.88 5.81
Feb-14 4.69 5.48 5.89 5.85
Mar-14 5.58 5.13 5.92 5.90
Apr-14 6.07 5.45 6.07 5.96
May-14 6.59 6.08 6.01 6.00
Jun-14 6.34 6.33 6.10 6.06
Jul-14 6.28 6.40 6.14 6.08
Aug-14 6.28 6.30 6.15 6.13
Sep-14 6.16 6.24 6.21 6.16
Oct-14 6.34 6.26 6.27 6.21
Nov-14 6.53 6.35 6.29 6.25
Dec-14 7.18 6.69 6.18 6.24
Jan-15 5.33 6.35 6.11 6.19
Feb-15 4.92 5.81 6.20 6.16
Mar-15 5.93 5.39 6.34 6.22
Apr-15 6.29 5.71 6.28 6.27
May-15 6.99 6.40 6.44 6.35
Jun-15 6.78 6.68 6.44 6.38
Jul-15 6.67 6.81 6.50 6.46

43
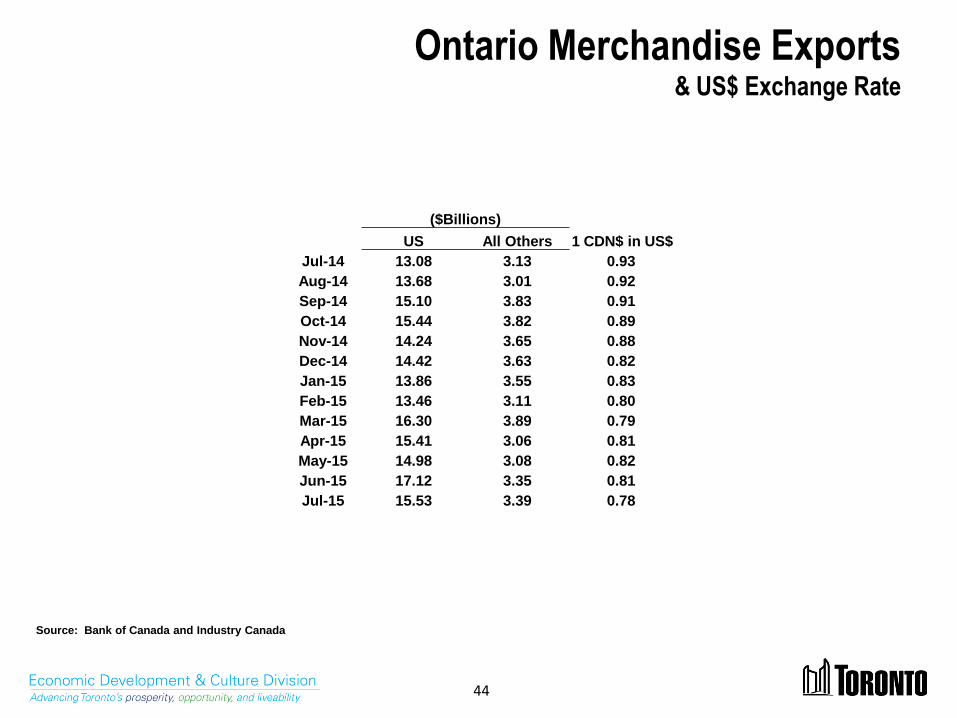
Ontario Merchandise Exports & US$ Exchange Rate
Source: Bank of Canada and Industry Canada (July/2015)
$0.50
$0.60
$0.70
$0.80
$0.90
$1.00
$0
$2
$4
$6
$8
$10
$12
$14
$16
$18
$20
$22
Jan-10 Jul-10 Jan-11 Jul-11 Jan-12 Jul-12 Jan-13 Jul-13 Jan-14 Jul-14 Jan-15 Jul-15
Ex
po
rts
($
Bil
lio
ns
)
United States (U.S.) All Others 1 CDN$ in US$
1 CDN $ in US $
44
Ontario Merchandise Exports & US$ Exchange Rate
Source: Bank of Canada and Industry Canada
($Billions)
US All Others 1 CDN$ in US$
Jul-14 13.08 3.13 0.93
Aug-14 13.68 3.01 0.92
Sep-14 15.10 3.83 0.91
Oct-14 15.44 3.82 0.89
Nov-14 14.24 3.65 0.88
Dec-14 14.42 3.63 0.82
Jan-15 13.86 3.55 0.83
Feb-15 13.46 3.11 0.80
Mar-15 16.30 3.89 0.79
Apr-15 15.41 3.06 0.81
May-15 14.98 3.08 0.82
Jun-15 17.12 3.35 0.81
Jul-15 15.53 3.39 0.78


![GTA Region Investment Attraction - Toronto Global · PDF fileGTA Region Investment Attraction [operating as Toronto Global] Period from Year ended July 27, 2015 March 31, to March](https://static.fdocuments.us/doc/165x107/5aa0646e7f8b9a89178dfc0b/gta-region-investment-attraction-toronto-global-region-investment-attraction-operating.jpg)