Economic Crisis Workshop Causes of the Crisis and the Great Recession.
39
Economic Crisis Workshop Causes of the Crisis and the Great Recession
-
date post
21-Dec-2015 -
Category
Documents
-
view
217 -
download
0
Transcript of Economic Crisis Workshop Causes of the Crisis and the Great Recession.
Economic Crisis Workshop
Causes of the Crisis and the Great Recession
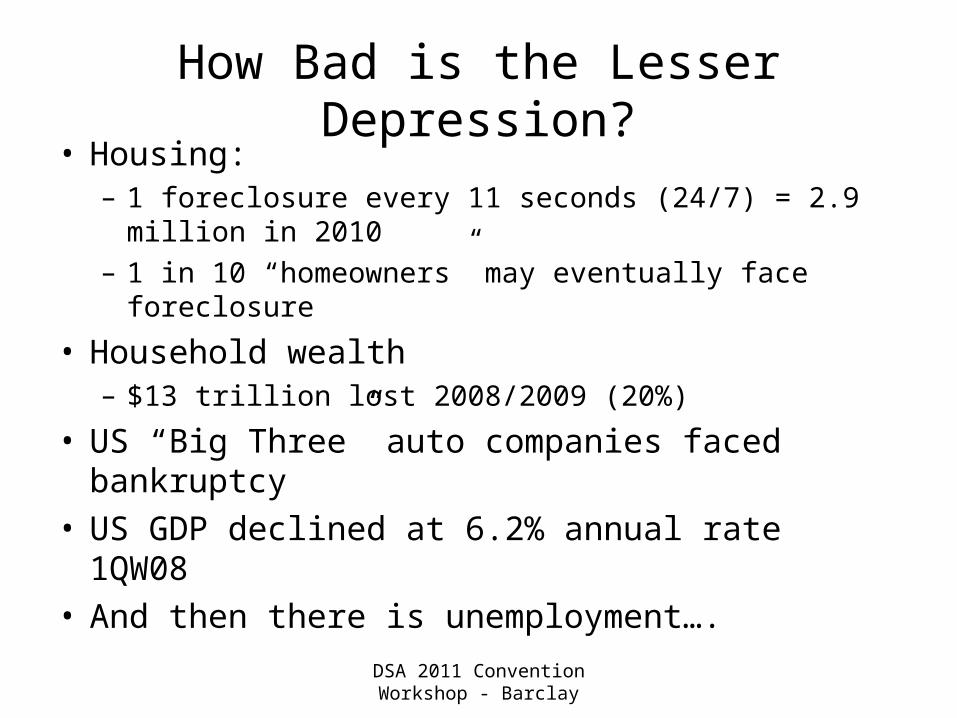
How Bad is the Lesser Depression?• Housing:
– 1 foreclosure every 11 seconds (24/7) = 2.9 million in 2010
– 1 in 10 “homeowners” may eventually face foreclosure
• Household wealth– $13 trillion lost 2008/2009 (20%)
• US “Big Three” auto companies faced bankruptcy
• US GDP declined at 6.2% annual rate 1QW08• And then there is unemployment….
DSA 2011 Convention Workshop - Barclay
DSA 2011 Convention Workshop - Barclay
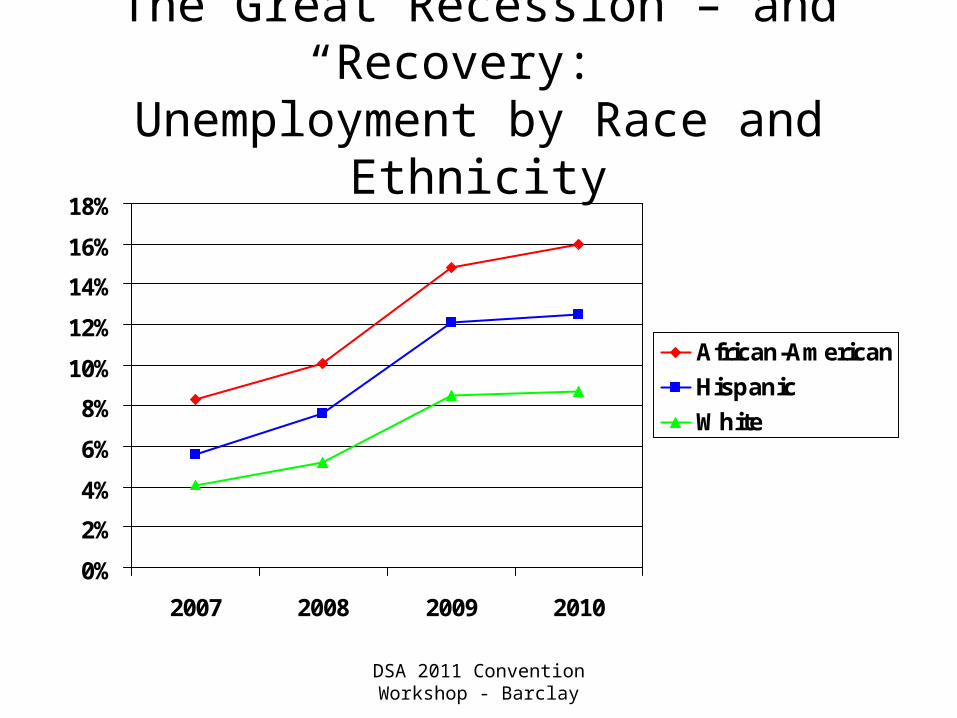
The Great Recession – and “Recovery:” Unemployment by Race and Ethnicity
0%
2%
4%
6%
8%
10%
12%
14%
16%
18%
2007 2008 2009 2010
African-American
Hispanic
White

DSA 2011 Convention Workshop - Barclay
CPEG Economic Crisis Workshop - Barclay
4
Was it just an accident?

DSA 2011 Convention Workshop - Barclay
5
If you remember nothing else from this workshop today…..
• The economic crisis in which we are mired – the worse since the 1930s - was not an unforeseeable accident
• There were a series of policies – political decisions – that led us to where we are
• Taken together, these decisions and policies represent a way of looking at and thinking about the world: neo-liberalism
• However, neo-liberalism has its own narrative of causes– Different narratives suggest very different policy solutions
• This is why accurately understanding the causes of the Long Depression is essential
DSA 2011 Convention Workshop - Barclay
6
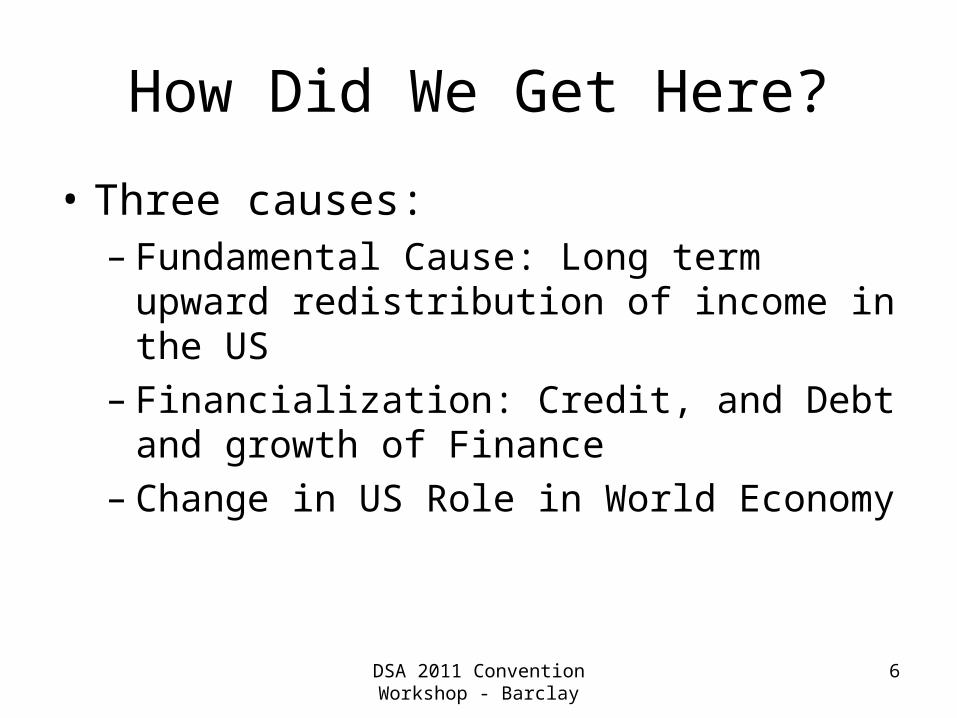
How Did We Get Here?
• Three causes:– Fundamental Cause: Long term upward
redistribution of income in the US – Financialization: Credit, and Debt and growth
of Finance– Change in US Role in World Economy

The First Cause
Growth of Economic Inequality: Class Redistribution of Income
DSA 2011 Convention Workshop - Barclay
8
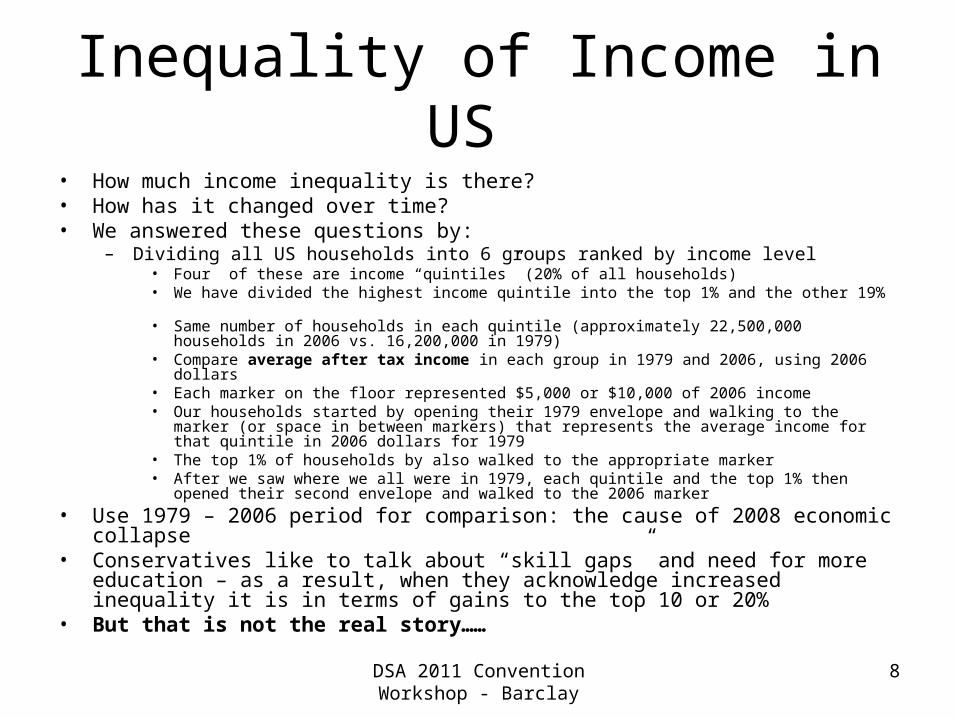
Inequality of Income in US • How much income inequality is there?• How has it changed over time? • We answered these questions by:
– Dividing all US households into 6 groups ranked by income level• Four of these are income “quintiles” (20% of all households)• We have divided the highest income quintile into the top 1% and the other 19% • Same number of households in each quintile (approximately 22,500,000 households in 2006 vs.
16,200,000 in 1979)• Compare average after tax income in each group in 1979 and 2006, using 2006 dollars• Each marker on the floor represented $5,000 or $10,000 of 2006 income • Our households started by opening their 1979 envelope and walking to the marker (or space in
between markers) that represents the average income for that quintile in 2006 dollars for 1979• The top 1% of households by also walked to the appropriate marker • After we saw where we all were in 1979, each quintile and the top 1% then opened their second
envelope and walked to the 2006 marker
• Use 1979 – 2006 period for comparison: the cause of 2008 economic collapse• Conservatives like to talk about “skill gaps” and need for more education – as a
result, when they acknowledge increased inequality it is in terms of gains to the top 10 or 20%
• But that is not the real story……

DSA 2011 Convention Workshop - Barclay
Income Redistribution to the Top 1%, 1950 - 2007
5
7.5
10
12.5
15
17.5
20
22.5
25
19501953
19561959
19621965
19681971
19741977
19801983
19861989
19921995
19982001
20042007
Per
enct
of
To
tal
Inco
me
Top 1% Income Share Next 4% Next 5%What skills or education could cause 1% of the population
to reap such gains?

DSA 2011 Convention Workshop - Barclay
10
Average Income by Quintiles and Top 1%, 1979 and 2006 (2006 $)
$0
$200,000
$400,000
$600,000
$800,000
$1,000,000
$1,200,000
Botton 20%
Next 20%
Middle 20%
Next 20%
80 - 98th percentile
Top 1%
1979
2006
There are some distances that only money can measure
Bill Barclay - Columbus DSA 11-2011
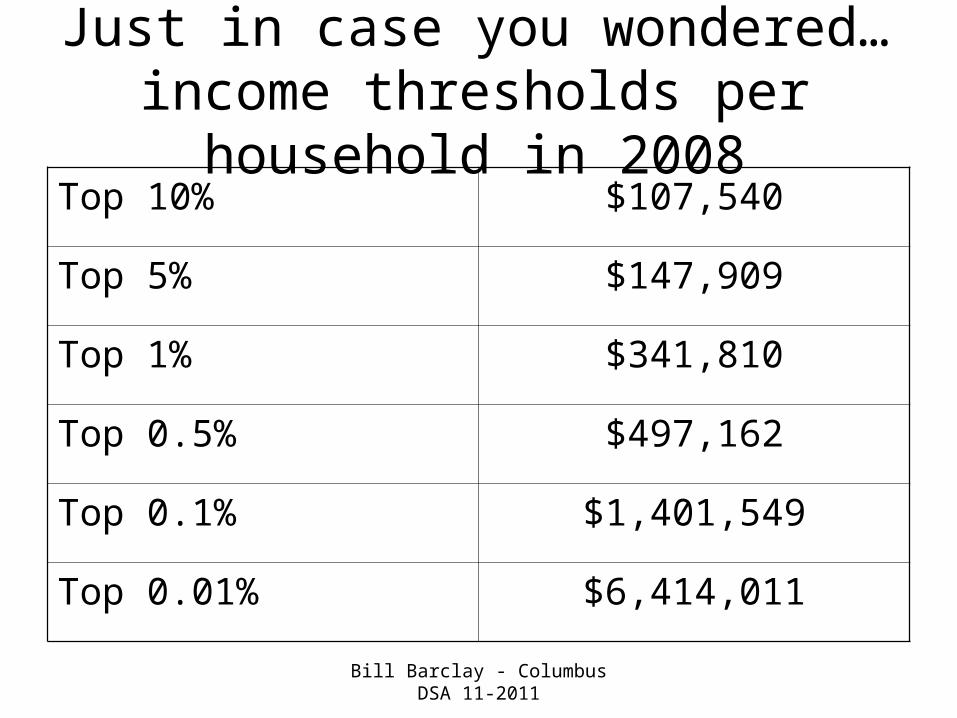
Just in case you wondered…income thresholds per household in 2008
Top 10% $107,540
Top 5% $147,909
Top 1% $341,810
Top 0.5% $497,162
Top 0.1% $1,401,549
Top 0.01% $6,414,011
DSA 2011 Convention Workshop - Barclay
12
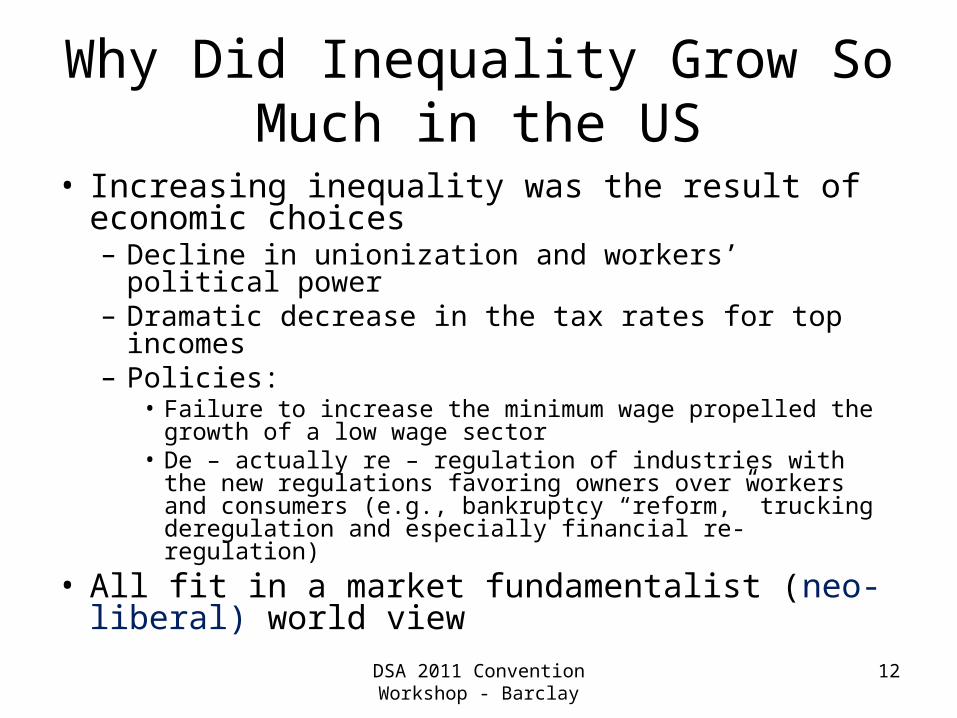
Why Did Inequality Grow So Much in the US
• Increasing inequality was the result of economic choices– Decline in unionization and workers’ political power– Dramatic decrease in the tax rates for top incomes– Policies:
• Failure to increase the minimum wage propelled the growth of a low wage sector
• De – actually re – regulation of industries with the new regulations favoring owners over workers and consumers (e.g., bankruptcy “reform,” trucking deregulation and especially financial re-regulation)
• All fit in a market fundamentalist (neo-liberal) world view

DSA 2011 Convention Workshop - Barclay
13

DSA 2011 Convention Workshop - Barclay
Income Redistribution: Policies
• By 1970s the service sector is growing much faster than the manufacturing
• What kind of employment would people find in the “new economy”– Low wage or high wage?
• The decline of unionization and the lag in US minimum wage drove creation of a large low wage sector– US: 1 in 6 workers make less than 50% of the median wage – US labor markets are “segmented”
• Result: industry, ethnicity, race, gender and wage levels are linked
• Not all advanced capitalist societies have a large low wage sector: – in many Western European countries fewer than 1 in 10 workers
make less than 50% of median wage
DSA 2011 Convention Workshop - Barclay
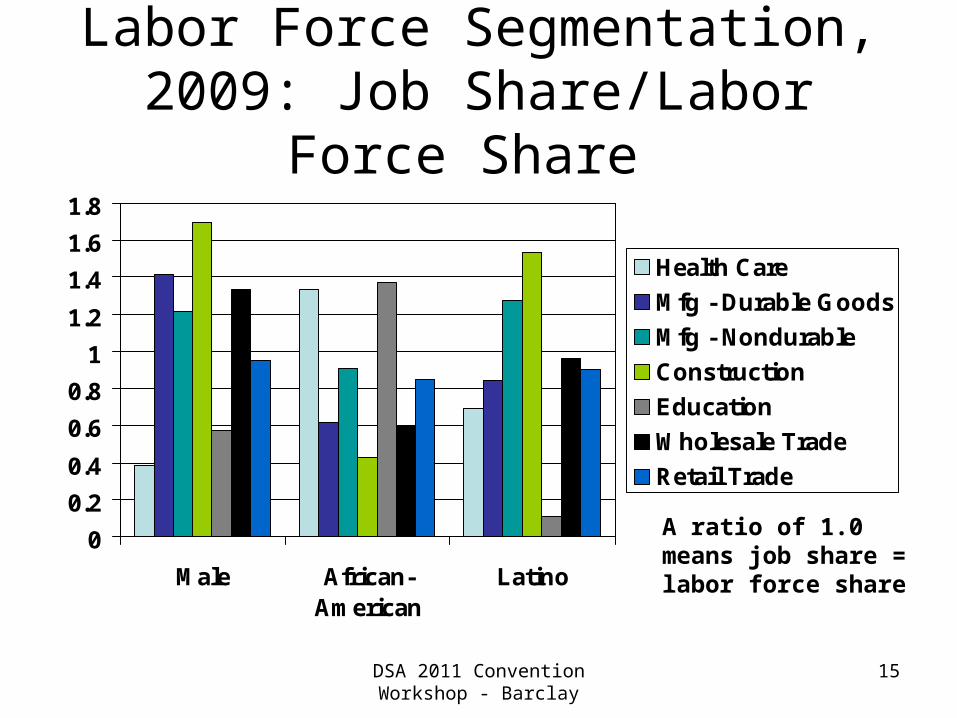
15
Labor Force Segmentation, 2009: Job Share/Labor Force Share
0
0.2
0.4
0.6
0.8
1
1.2
1.4
1.6
1.8
Male African-American
Latino
Health Care
Mfg - Durable Goods
Mfg - Nondurable
Construction
Education
Wholesale Trade
Retail Trade
A ratio of 1.0 means job share = labor force share

DSA 2011 Convention Workshop - Barclay
16
Labor Force Segmentation: Unequal Access to Good Jobs
• Jobs that are generated are not allocated randomly across the different strata of the U.S. labor force– Evident from income distribution (full time wkrs only)
• 2009 white male/white female median income ratio: 1.26• 2009 white male/black male median income ratio: 1.36• 2008 white male/Hispanic male median income ratio: 1.48• 2008 black male/black female median income ratio: 1.07• 2008 Hispanic male/Hispanic female median income ratio:
1.12
– Flows from occupational distribution

DSA 2011 Convention Workshop - Barclay
Percent of Population with Income Less than 50% of Median
(ca 2007/08)
0
5
10
15
20
25
% o
f P
op
ula
tio
n
Denmark Austria Netherlands France Norway Finland Sweden
Switzerland Germany Belgium Ireland Poland New Zealand OECD
United Kingdom Canada Italy Greece Portugal Spain Australia
Korea Japan United States Israel Mexico
DSA 2011 Convention Workshop - Barclay
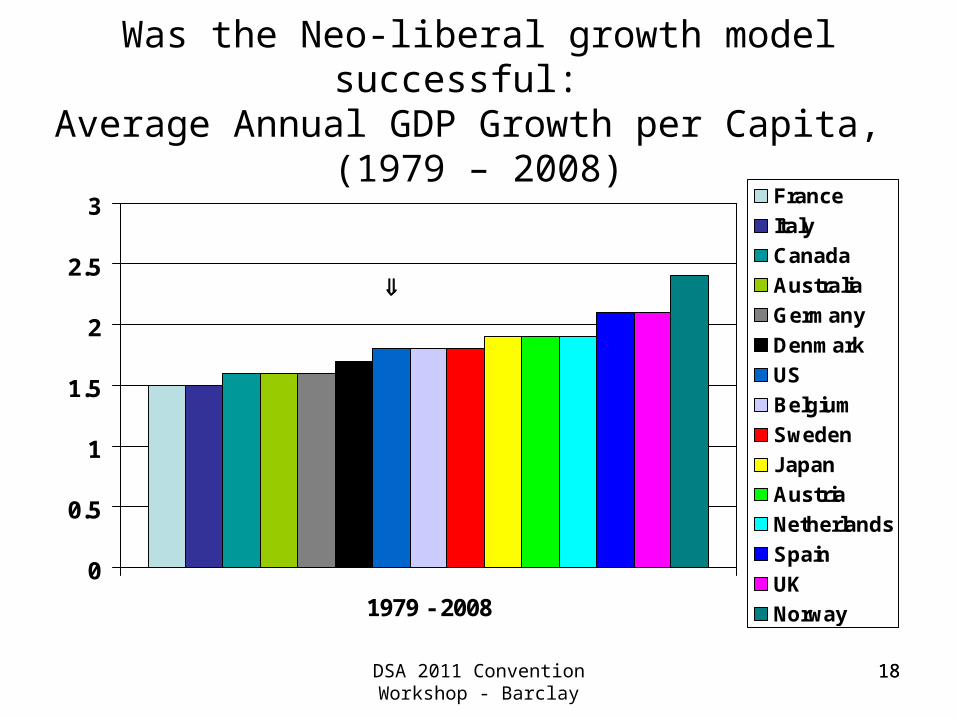
1818
Was the Neo-liberal growth model successful: Average Annual GDP Growth per Capita,
(1979 – 2008)
0
0.5
1
1.5
2
2.5
3
1979 - 2008
France
Italy
Canada
Australia
Germany
Denmark
US
Belgium
Sweden
Japan
Austria
Netherlands
Spain
UK
Norway

The Second Cause
Financialization:
Credit, Debt and the Growth of Finance
DSA 2011 Convention Workshop - Barclay
20
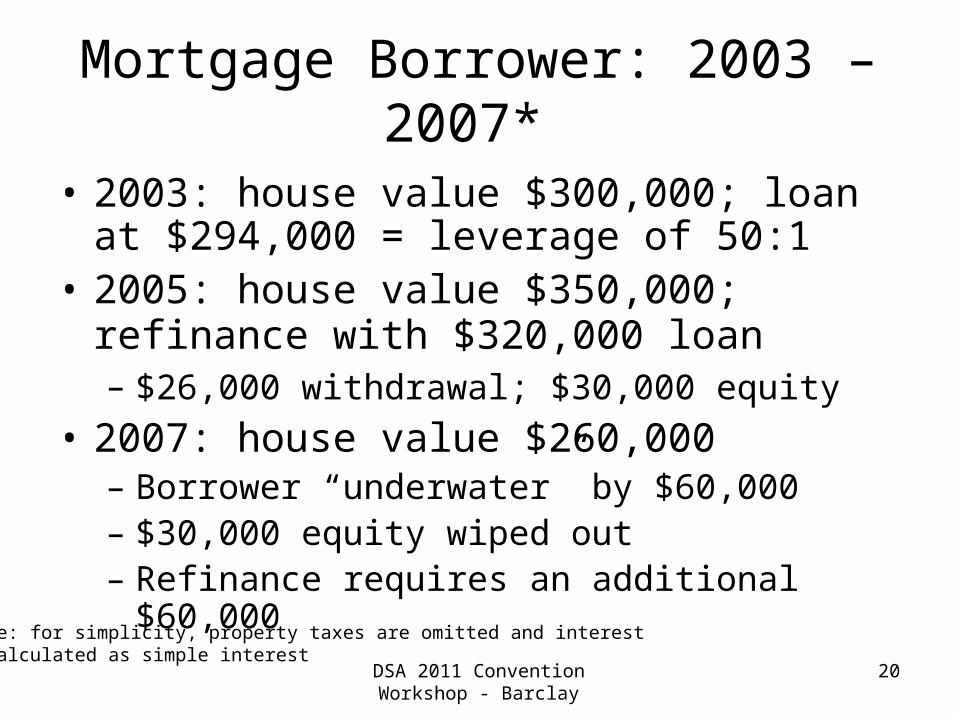
Mortgage Borrower: 2003 – 2007*
• 2003: house value $300,000; loan at $294,000 = leverage of 50:1
• 2005: house value $350,000; refinance with $320,000 loan – $26,000 withdrawal; $30,000 equity
• 2007: house value $260,000– Borrower “underwater” by $60,000– $30,000 equity wiped out– Refinance requires an additional $60,000
*Note: for simplicity, property taxes are omitted and interest is calculated as simple interest
DSA 2011 Convention Workshop - Barclay
21
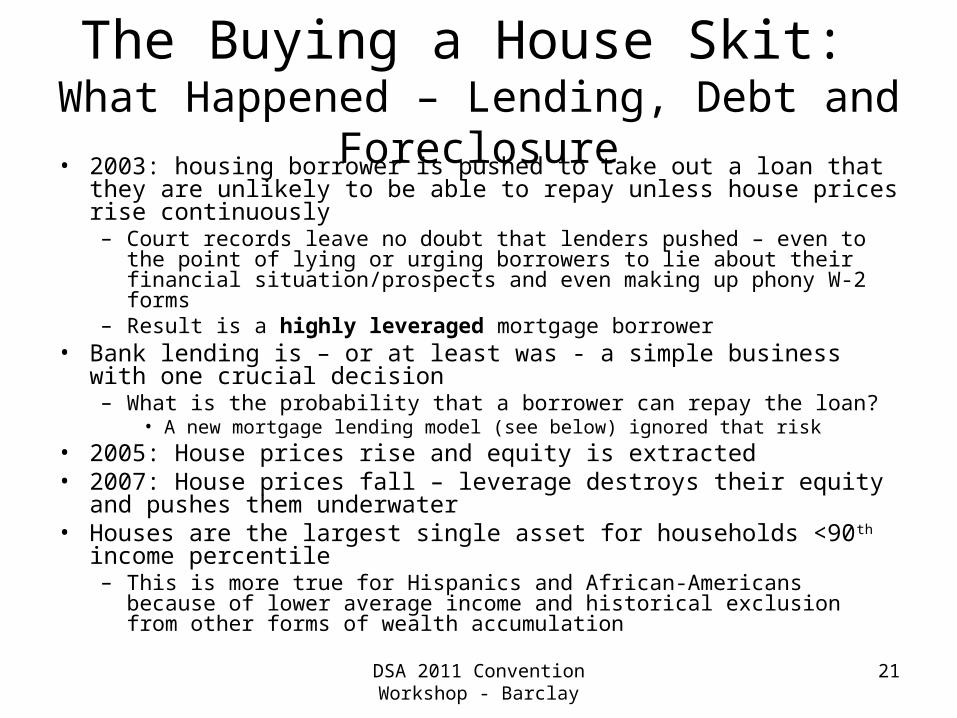
The Buying a House Skit: What Happened – Lending, Debt and Foreclosure
• 2003: housing borrower is pushed to take out a loan that they are unlikely to be able to repay unless house prices rise continuously– Court records leave no doubt that lenders pushed – even to the point of
lying or urging borrowers to lie about their financial situation/prospects and even making up phony W-2 forms
– Result is a highly leveraged mortgage borrower• Bank lending is – or at least was - a simple business with one
crucial decision– What is the probability that a borrower can repay the loan?
• A new mortgage lending model (see below) ignored that risk• 2005: House prices rise and equity is extracted • 2007: House prices fall – leverage destroys their equity and pushes
them underwater• Houses are the largest single asset for households <90th income
percentile – This is more true for Hispanics and African-Americans because of lower
average income and historical exclusion from other forms of wealth accumulation
DSA 2011 Convention Workshop - Barclay
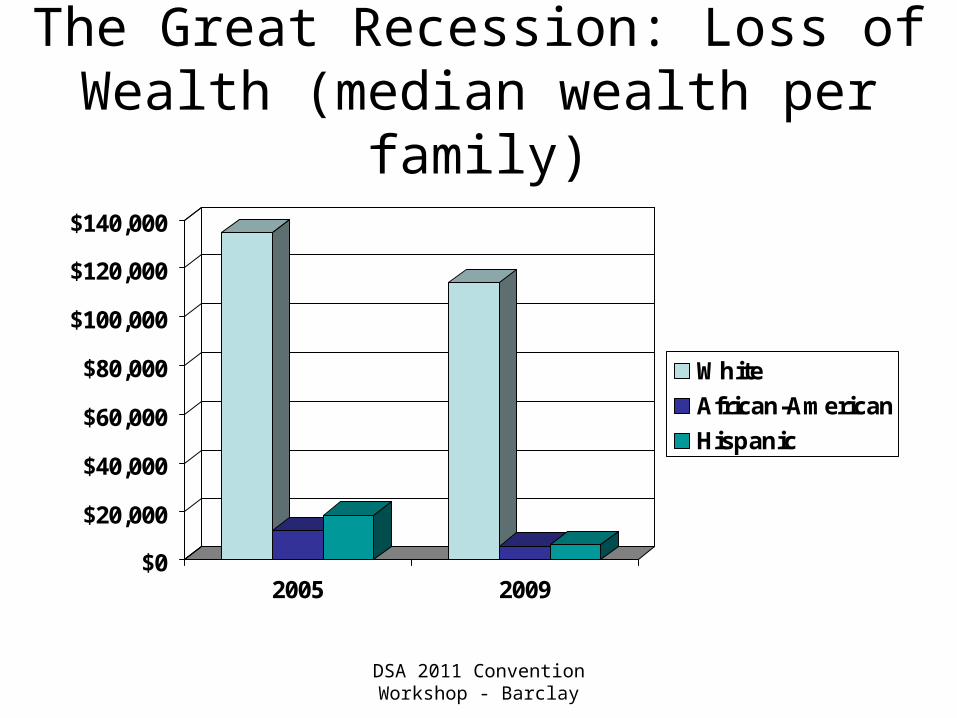
The Great Recession: Loss of Wealth (median wealth per family)
$0
$20,000
$40,000
$60,000
$80,000
$100,000
$120,000
$140,000
2005 2009
White
African-American
Hispanic

DSA 2011 Convention Workshop - Barclay
23
Mortgage Banking Model Changes: I
• Mortgage banking used to be:– Assess the financial standing of the potential home buyer– Make a loan based on income and long term financial outlook
• The 30 year fixed mortgage was a product of the New Deal– Carry the loan in bank’s portfolio – Incentive: risk averse
• Repeal of New Deal Glass-Steagall Act opened door to very different model of banking in mortgage lending area– Review credit score – Make a loan (“initiate” a loan)– Sell (“distribute”) the loan for packaging into mortgage backed securities
(MBS)– “Securitize the loan so packages of mortgages can be sold to other
investors (Mortgage Backed Securities or MBS)– Use the proceeds to make the next loan– Incentive: make as many loans as quickly as possible and get them out
the door – lender has only “pipeline” risk

DSA 2011 Convention Workshop - Barclay
24
Mortgage Banking Model Changes: II• Different banking model brought new entities into mortgage banking – a
“shadow banking” system: – Mortgage brokers, hedge funds, money market funds– Investment banks and SIVs (special investment vehicles)
• Incentive was to make subprime loans rather than prime:– Countrywide Mortgage: prime loans sold to investors had average profit margin of 0.93% vs
subprime average profit margin of 3.64%
• Incentives drove widespread fraud by lenders– Ameriquest – largest US mortgage lender (for a short time!) – TX Ranger’s Stadium, Super
Bowl ads, Rolling Stones 2005 US tour• Brokers developed fraud specialties – creating mortgage histories or doctoring W-2 forms to change income levels and
instructed their employees to tell borrowers to ignore the “Good Faith Estimate” required under federal law • Ameriquest took appraises off their lists if the valuations didn’t meet their needs
– “If they have a house, if the owner has a pulse, we’ll give them a loan” – Russ Jedniak, Guardian S&L CEO
– FAMCO bugged conference rooms to overhear borrowers discussions about what they could afford
– Extensive use of RoBo signers – Washington Mutual (WaMu – “The Power of Yes”) allowed borrowers to apply and be
accepted online
• Who was sold subprime mortgages – disproportionately minority and single parent households
– A new form of redlining – WSJ study found >50% actually qualified for prime mortgages

DSA 2011 Convention Workshop - Barclay
Shadow Banking System• This “shadow banking system” was not subject to existing regulatory
oversight• Who drove the decline in lending standards, the push to increase the
amount of mortgage loans outstanding, securitization and the ratings assigned to MBS?
– Did borrowers, hoping to buy houses, come in and say, “Give one of those exploding 2/28 or 3/27 loans that I can’t afford and, oh by the way, I want to lie about my income?”
• By mid 2000s, most mortgages were not originated by the banking sector that was subject to the Community Reinvestment Act requirements and other regulatory oversight
– Median down payment in 2005: 2%
• In contrast, governmental agencies such as FHA and VA required income documentation and 10% down payment
– Fed could have acted but Greenspan was opposed• Characteristics of “shadow banking system”
– Bonuses based on short term “mark to market” valuations– Mathematical models used to analyze risk of and take positions– Leverage used to enhance returns
• E.g., Bear Sterns and Lehman leverage 30:1 or higher
• Does anybody remember Long Term Capital Management?
25
DSA 2011 Convention Workshop - Barclay
26
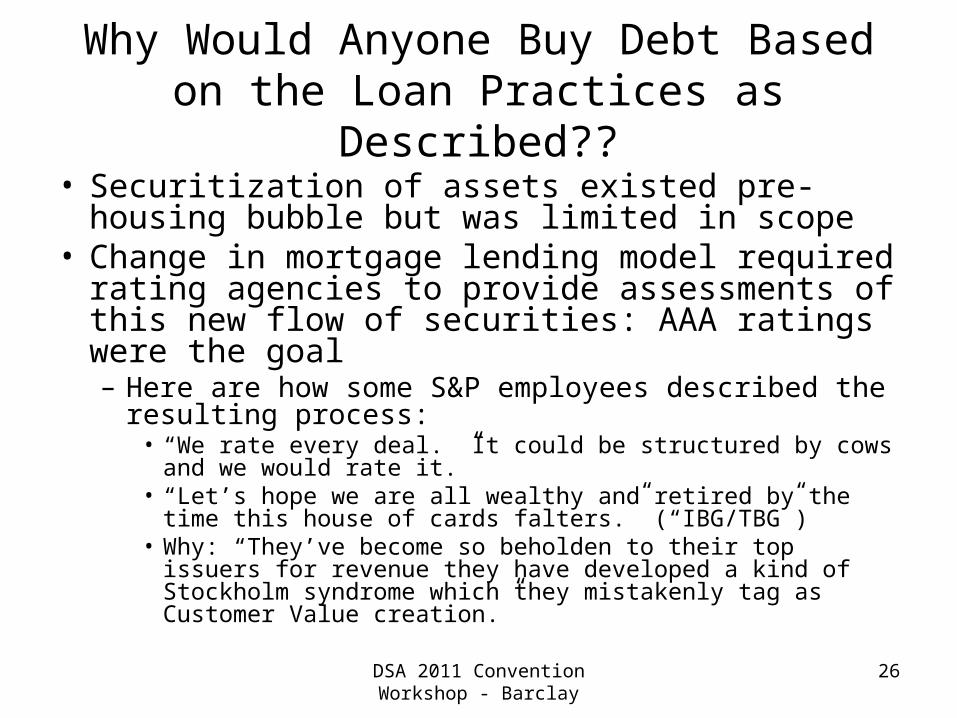
Why Would Anyone Buy Debt Based on the Loan Practices as Described??
• Securitization of assets existed pre-housing bubble but was limited in scope
• Change in mortgage lending model required rating agencies to provide assessments of this new flow of securities: AAA ratings were the goal– Here are how some S&P employees described the
resulting process:• “We rate every deal. It could be structured by cows and we
would rate it.”• “Let’s hope we are all wealthy and retired by the time this
house of cards falters.” (“IBG/TBG”)• Why: “They’ve become so beholden to their top issuers for
revenue they have developed a kind of Stockholm syndrome which they mistakenly tag as Customer Value creation.”
DSA 2011 Convention Workshop - Barclay
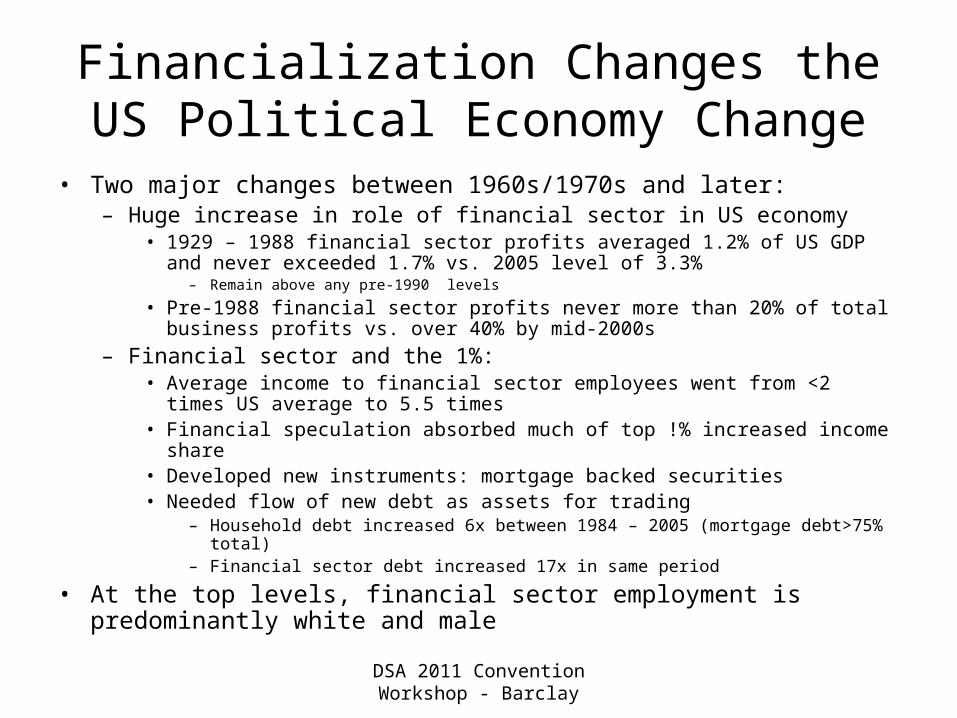
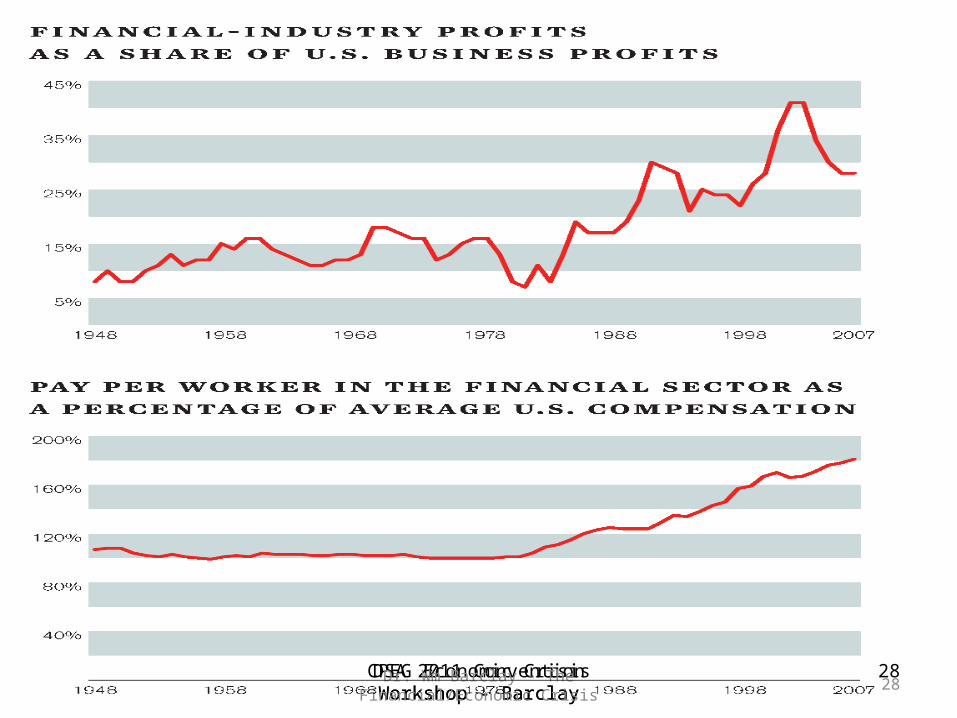
Financialization Changes the US Political Economy Change
• Two major changes between 1960s/1970s and later:– Huge increase in role of financial sector in US economy
• 1929 – 1988 financial sector profits averaged 1.2% of US GDP and never exceeded 1.7% vs. 2005 level of 3.3%
– Remain above any pre-1990 levels
• Pre-1988 financial sector profits never more than 20% of total business profits vs. over 40% by mid-2000s
– Financial sector and the 1%:• Average income to financial sector employees went from <2 times US
average to 5.5 times • Financial speculation absorbed much of top !% increased income share • Developed new instruments: mortgage backed securities• Needed flow of new debt as assets for trading
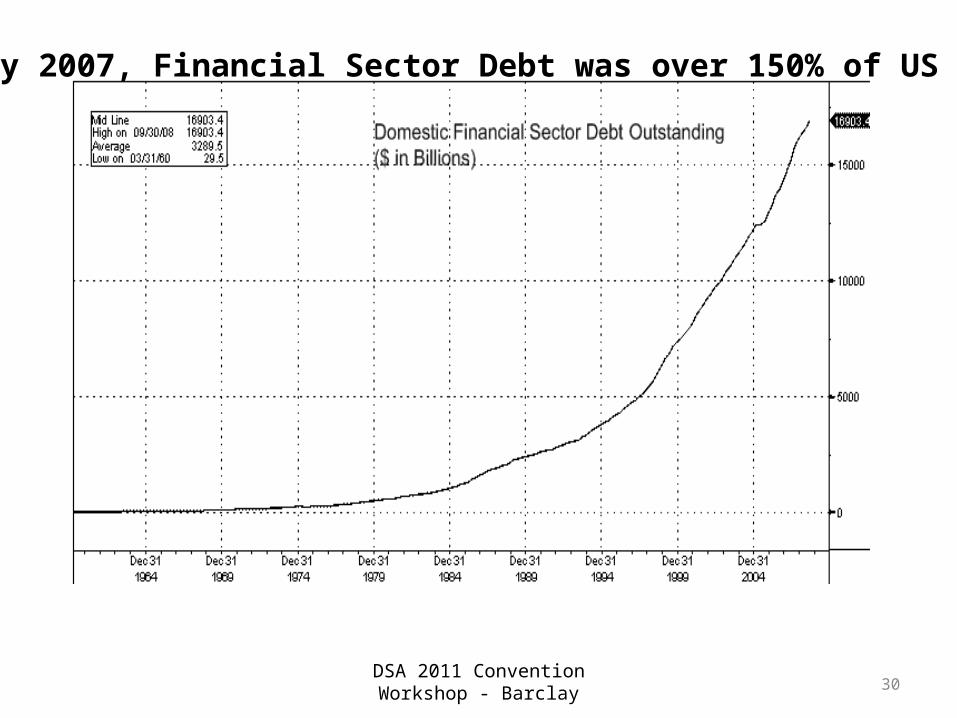
– Household debt increased 6x between 1984 – 2005 (mortgage debt>75% total)– Financial sector debt increased 17x in same period
• At the top levels, financial sector employment is predominantly white and male
DSA 2011 Convention Workshop - Barclay
CPEG Economic Crisis Workshop - Barclay
28Dr. Wm Barclay - The Financial/Economic Crisis
28

DSA 2011 Convention Workshop - Barclay 29
By 2007, household debt was 120% of US GDP
DSA 2011 Convention Workshop - Barclay 30
By 2007, Financial Sector Debt was over 150% of US GDP
CPEG Economic Crisis Workshop - Barclay
31CPEG Economic Crisis Workshop - Barclay
31
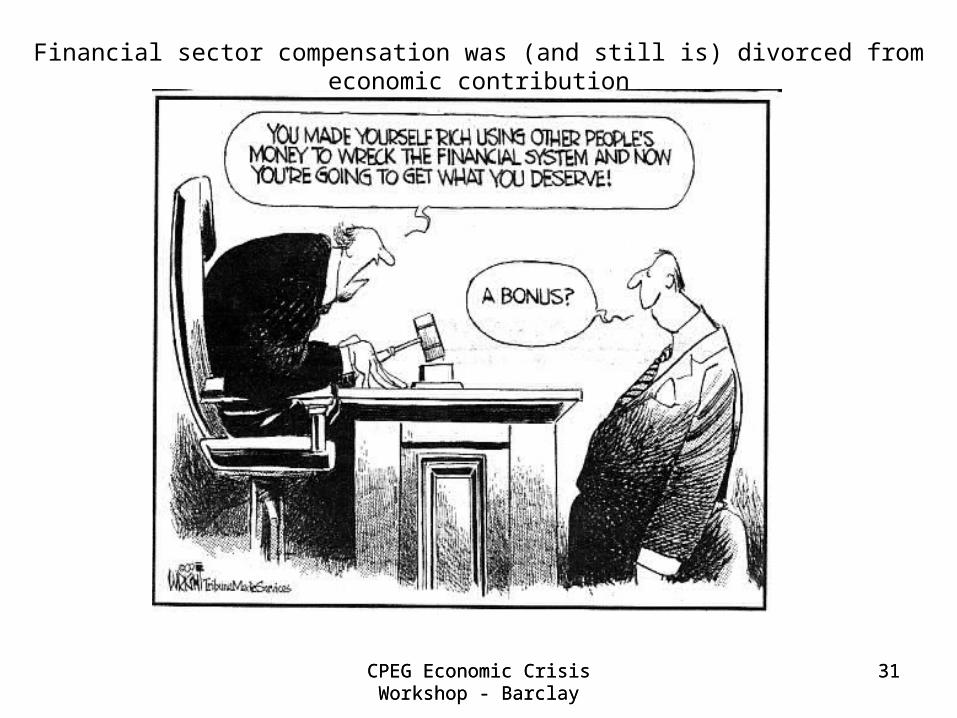
Financial sector compensation was (and still is) divorced from economic contribution

The Third Cause
Changing Role of US in World Political Economy

DSA 2011 Convention Workshop - Barclay
3333
The US in the Global Economy
• For several decades before and after WWII, US was a net exporter as well as the world’s largest creditor nation
• US balance of trade turned negative in 1970s and current account (trade + capital flows) turned negative in 1980s– By mid 2000s the current account deficit had increased to
6% of GDP, a level that is not sustainable
• What was happening? In answering this question we will learn why the economic crisis is not just a US economic crisis.
DSA 2011 Convention Workshop - Barclay
34
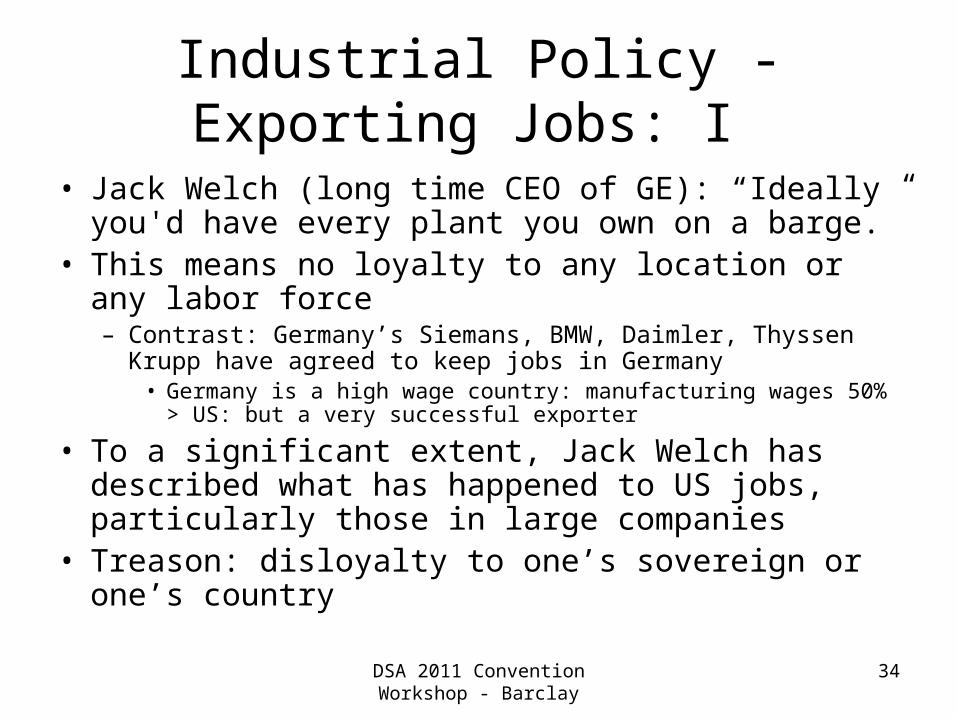
Industrial Policy - Exporting Jobs: I
• Jack Welch (long time CEO of GE): “Ideally you'd have every plant you own on a barge.”
• This means no loyalty to any location or any labor force– Contrast: Germany’s Siemans, BMW, Daimler, Thyssen Krupp
have agreed to keep jobs in Germany• Germany is a high wage country: manufacturing wages 50% > US:
but a very successful exporter
• To a significant extent, Jack Welch has described what has happened to US jobs, particularly those in large companies
• Treason: disloyalty to one’s sovereign or one’s country
DSA 2011 Convention Workshop - Barclay
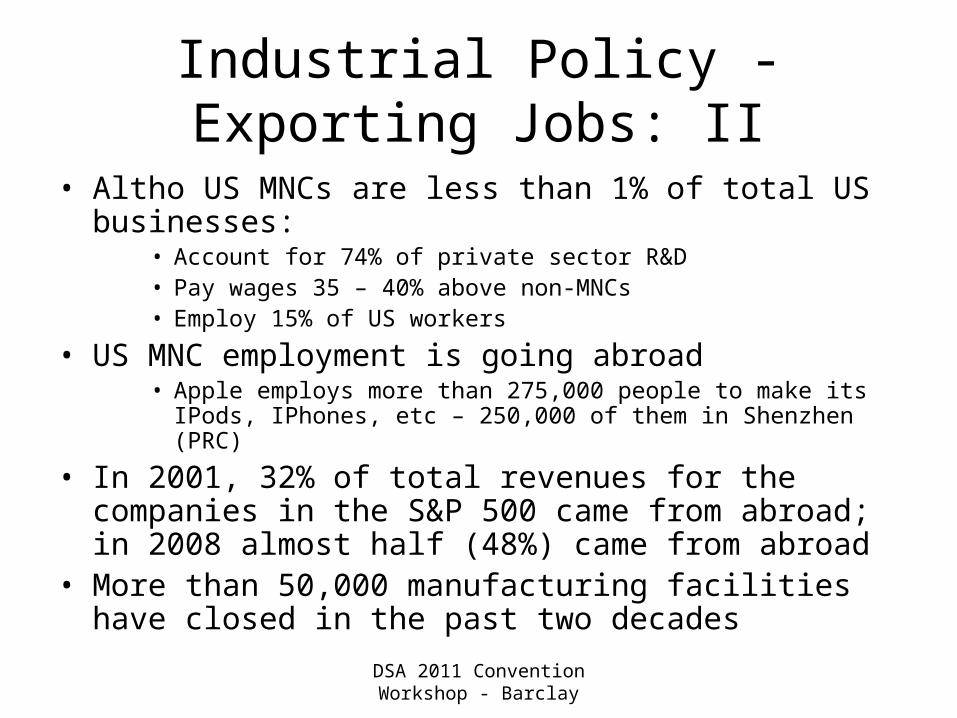
Industrial Policy - Exporting Jobs: II
• Altho US MNCs are less than 1% of total US businesses:• Account for 74% of private sector R&D• Pay wages 35 – 40% above non-MNCs• Employ 15% of US workers
• US MNC employment is going abroad• Apple employs more than 275,000 people to make its IPods,
IPhones, etc – 250,000 of them in Shenzhen (PRC)
• In 2001, 32% of total revenues for the companies in the S&P 500 came from abroad; in 2008 almost half (48%) came from abroad
• More than 50,000 manufacturing facilities have closed in the past two decades
DSA 2011 Convention Workshop - Barclay
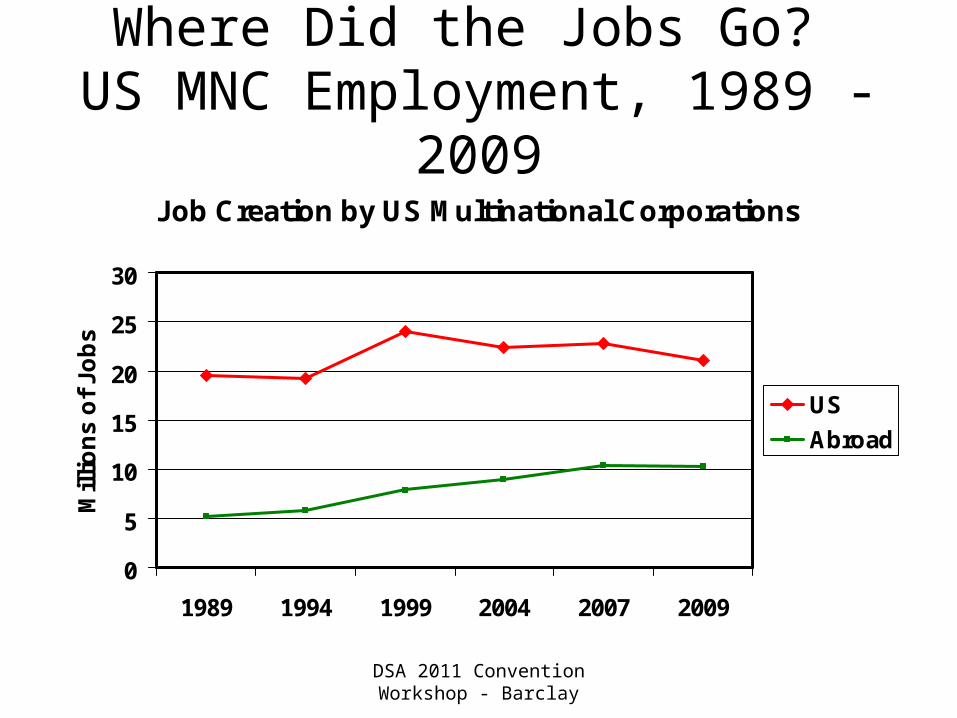
Where Did the Jobs Go? US MNC Employment, 1989 - 2009
Job Creation by US Multinational Corporations
0
5
10
15
20
25
30
1989 1994 1999 2004 2007 2009
Mil
lio
ns
of
Job
s
US
Abroad
DSA 2011 Convention Workshop - Barclay
37
Problems for the US Dollar
• Exporting of jobs/importing of goods = trade deficit – Undercuts the role of the dollar as the world’s reserve
currency • Sustained trade deficits threaten to role of the
dollar as world reserve currency – Foreign central banks have diversified holdings – Some petroleum exports now denominated in other
currencies (oil is the largest by value commodity in world trade)
• Is there something the US could export that would help balance our trade flows?
DSA 2011 Convention Workshop - Barclay
38
Globalizing the Housing Bubble
• Deutsche Bank: 45% of US-originated asset-backed securities owned by non-US investors (2005)– Total amounted to $3 trillion held by non-US individuals and
institutions (1/3 of their total holdings of US assets)– US MBS represented 8% of world total bank loans and securities
• A range of non-US institutions bought this debt - e.g., Norway town, Iceland’s banks, etc
– At year end 2006, European banks alone had over $300 billion of MBS (almost 3.5 times their total profits in that same year)
• Thus the financial impact became of the housing bubble, including its bursting – became world wide– Other countries with similar housing bubbles, e.g., Spain, UK
found themselves hit by both the collapse of the US housing bubble and their own
DSA 2011 Convention Workshop - Barclay
39
Some Suggestions for Reading
• Kevin Phillips - Bad Money: Reckless Finance, Failed Politics, and the Global Crisis of American Capitalism
• Mark Zandi – Financial Shock: A 360º Look at the Subprime Mortgage Implosion
• Charles Morris – The Trillion Dollar Meltdown: Easy Money, High Rollers, and the Great Credit Crash