Economic Crises and The Twin Balance Sheet Problem in India · Economic Crises and The Twin Balance...
41
Economic Crises and The Twin Balance Sheet Problem in India Module 6 Contemporary Themes in India’s Economic Development and the Economic Survey Arvind Subramanian Chief Economic Adviser MINISTRY OF FINANCE GOVERNMENT OF INDIA
Transcript of Economic Crises and The Twin Balance Sheet Problem in India · Economic Crises and The Twin Balance...
Economic Crises and The Twin Balance Sheet Problem in India
Module 6
Contemporary Themes in India’s
Economic Development and the Economic Survey
Arvind Subramanian
Chief Economic Adviser
MINISTRY OF FINANCE
GOVERNMENT OF INDIA

Overview
• Financionomic (Financial-Economic) Crises and Indian
Experience
• Effects of the Twin Balance Sheet Crisis.
• Successful and Unsuccessful Central Banking Experiences.
2

Crises, Crises, Crises: A Rough Time-Line
Early 1980's 1991 1994-95 1997-98 1999 2007 2008 2009-10 2013-14 2016
Latin
American
Debt Crisis
BOP
Crisis
India
Tequila
Crisis
Argentina
Mexico
Asian
Financial
Crisis +
Russia
BrazilEast
Europe
Global
Financial
Crisis
Greece,
Ireland,
Spain,
Iceland
Taper Tantrum
Brazil, India,
Indonesia, South
Africa, Turkey
Tremors
in China
Financionomic (Financial-Economic)
Crises and Indian Experience
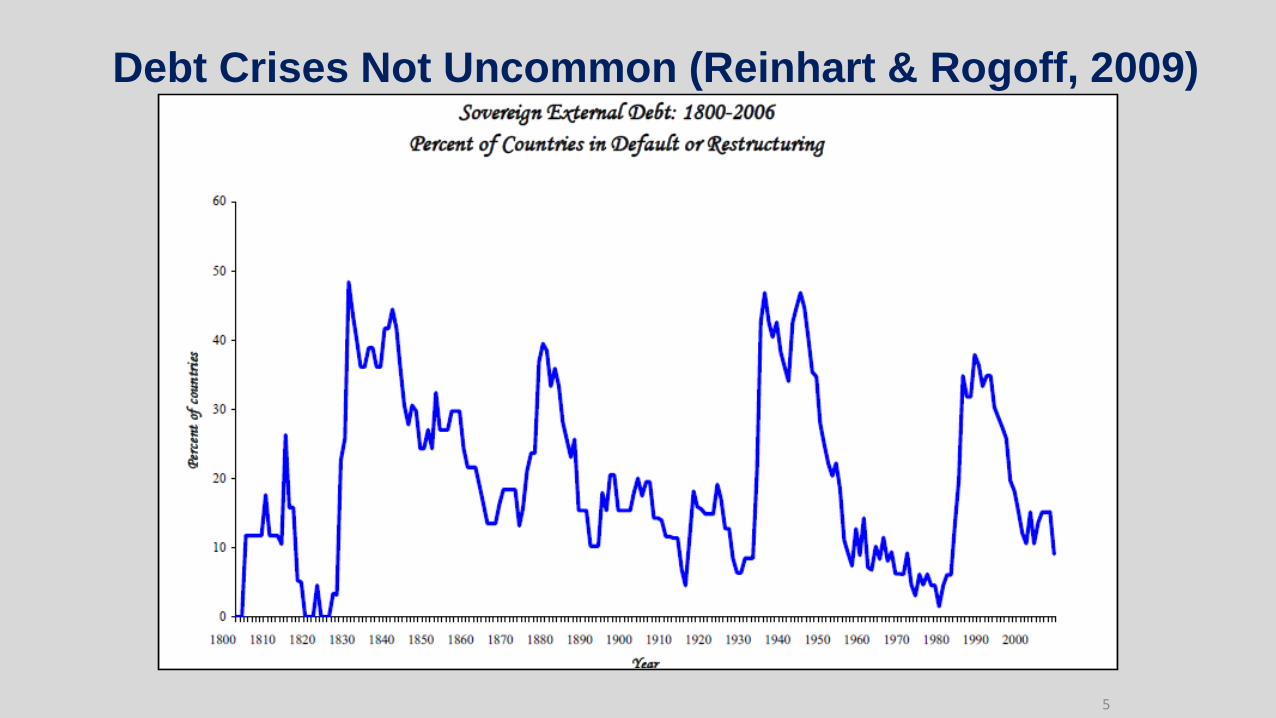
Debt Crises Not Uncommon (Reinhart & Rogoff, 2009)
5

What is a Financionomic Crisis?• Broadly defined as phenomena associated with substantial loss in
value of assets with a sharp negative impact on growth. These
assets can be:
1. Currency (exchange rate)
[Example: Thailand during Asian Financial Crisis late 1990s]
2. Equity
[Example: Argentina ‘Tequila Crisis’, 1994-95, AFC].
3. Real Estate
[Example: Japan late 1980s, USA post-Global Financial Crisis 2008-09].
6

Economic Crises Manifestations
7
Thailand during Asian Financial Crisis Argentina during ‘Tequila’ Crisis
Japan during the Balance Sheet Crisis
1. Bakker, Bas B. & Leslie Lipchitz, 2014, “Conventional and Insidious Macroeconomic Balance-Sheet Crises”, IMF working paper WP/14/160.
2. Dabós, M. and Laura Gómez Mera, 1998, “The Tequila Banking Crisis in Argentina”.
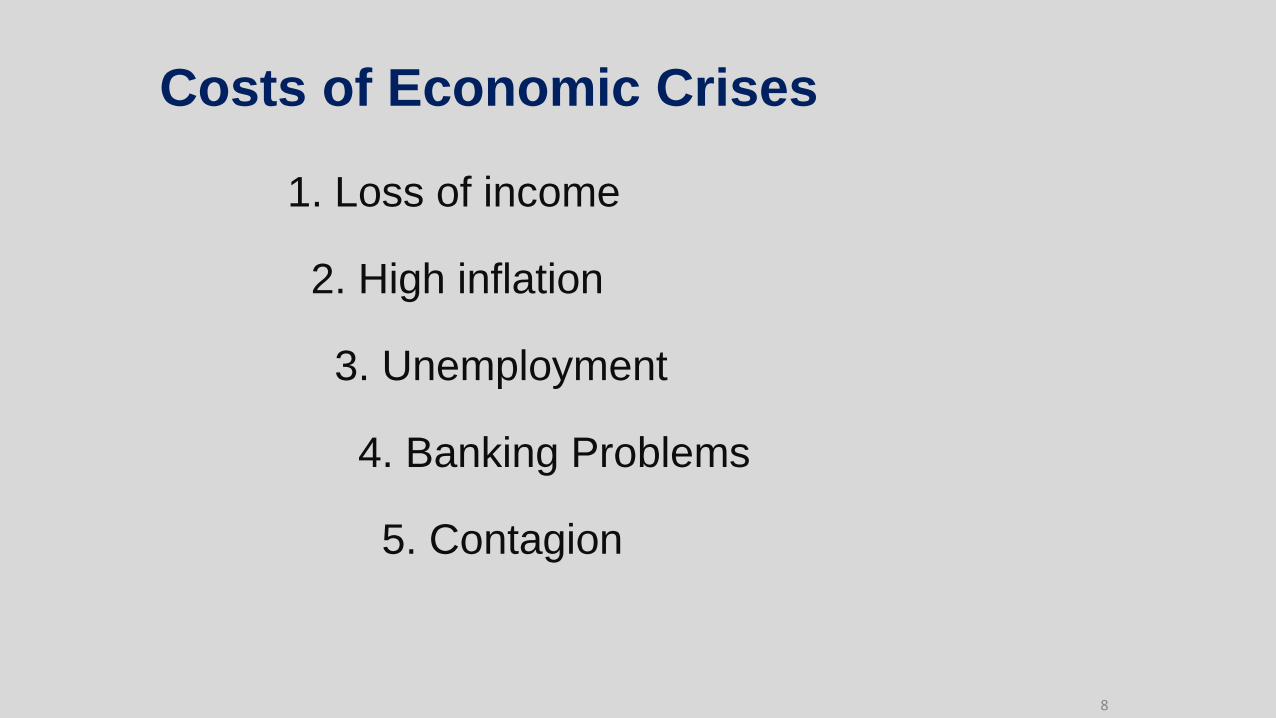
Costs of Economic Crises
1. Loss of income
2. High inflation
3. Unemployment
4. Banking Problems
5. Contagion
8

9
Source: Reuters and the Wall Street Journal
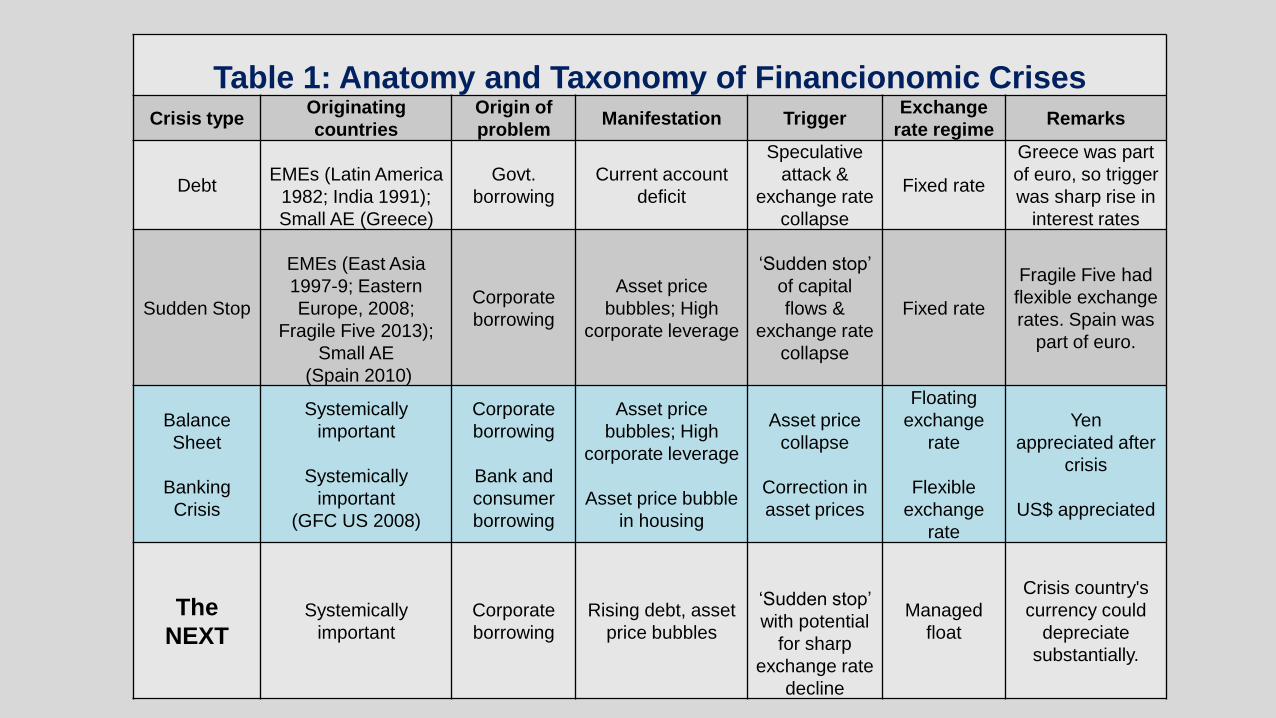
Table 1: Anatomy and Taxonomy of Financionomic CrisesCrisis type
Originating
countries
Origin of
problemManifestation Trigger
Exchange
rate regimeRemarks
DebtEMEs (Latin America
1982; India 1991);
Small AE (Greece)
Govt.
borrowing
Current account
deficit
Speculative
attack &
exchange rate
collapse
Fixed rate
Greece was part
of euro, so trigger
was sharp rise in
interest rates
Sudden Stop
EMEs (East Asia
1997-9; Eastern
Europe, 2008;
Fragile Five 2013);
Small AE
(Spain 2010)
Corporate
borrowing
Asset price
bubbles; High
corporate leverage
‘Sudden stop’
of capital
flows &
exchange rate
collapse
Fixed rate
Fragile Five had
flexible exchange
rates. Spain was
part of euro.
Balance
Sheet
Banking
Crisis
Systemically
important
Systemically
important
(GFC US 2008)
Corporate
borrowing
Bank and
consumer
borrowing
Asset price
bubbles; High
corporate leverage
Asset price bubble
in housing
Asset price
collapse
Correction in
asset prices
Floating
exchange
rate
Flexible
exchange
rate
Yen
appreciated after
crisis
US$ appreciated
The
NEXTSystemically
important
Corporate
borrowing
Rising debt, asset
price bubbles
‘Sudden stop’
with potential
for sharp
exchange rate
decline
Managed
float
Crisis country's
currency could
depreciate
substantially.
6/13/2017 MOOC Module 10: Twin Balance Sheet Problem 11

Historically Periods of High International Capital Mobility Have
Led to Banking Crises (R&R 2009)
12

13
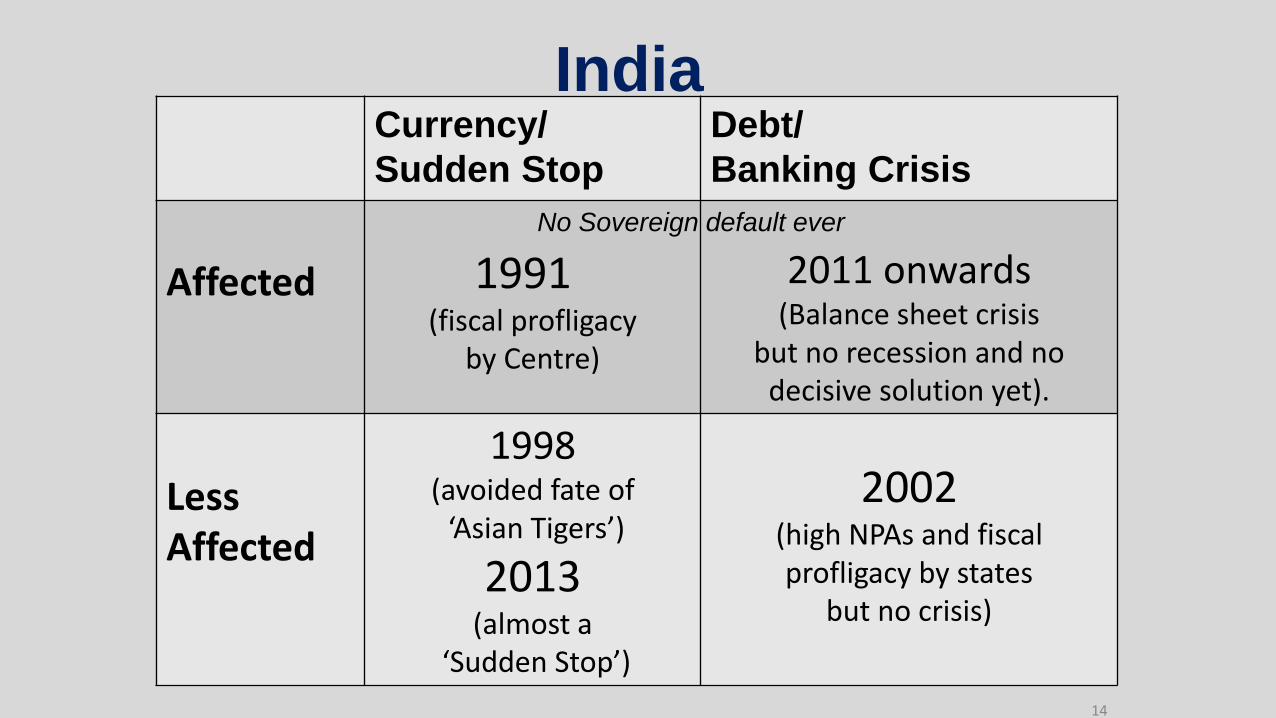
IndiaCurrency/
Sudden Stop
Debt/
Banking Crisis
Affected 1991(fiscal profligacy
by Centre)
2011 onwards (Balance sheet crisis
but no recession and no decisive solution yet).
Less Affected
1998(avoided fate of
‘Asian Tigers’)
2013(almost a
‘Sudden Stop’)
2002(high NPAs and fiscal profligacy by states
but no crisis)
14
No Sovereign default ever

The Twin Balance Sheet Problem in India: Banks and
Corporates Stressed
*:Per cent of debt owed by companies with Interest Coverage Ratio <1 based on sample of 3700 listed companies
(Credit Suisse).
15
India’s Twin Balance Sheet Problem
• Why ‘Twin’?
– Legacy of boom years (2005-2007).
– Private credit boom financed by public sector banks.
– Thus, impaired PSB balance sheets post-GFC
derives from and mirrors damaged corporate
balance sheets
– Twins- corporates and banks (mostly public sector).16

What Happened in India?Boom in Gross Capital Formation (Per cent of GDP)
17
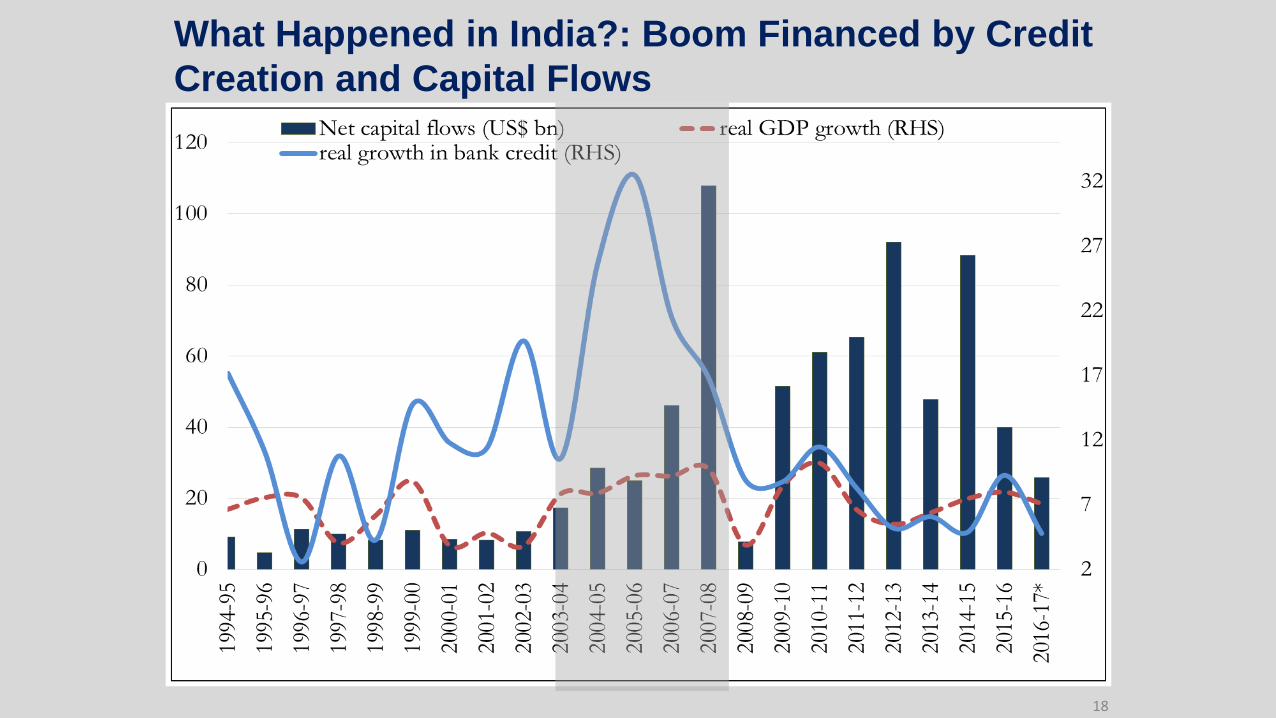
What Happened in India?: Boom Financed by Credit
Creation and Capital Flows
18

19
30
35
40
45
50
55
60
65
70
Mar
-1992
Dec
-1992
Sep
-1993
Jun
-1994
Mar
-1995
Dec
-1995
Sep
-1996
Jun
-1997
Mar
-1998
Dec
-1998
Sep
-1999
Jun
-2000
Mar
-2001
Dec
-2001
Sep
-2002
Jun
-2003
Mar
-2004
Dec
-2004
Sep
-2005
Jun
-2006
Mar
-2007
Dec
-2007
Sep
-2008
Jun
-2009
Mar
-2010
Dec
-2010
Sep
-2011
Jun
-2012
Mar
-2013
Dec
-2013
Sep
-2014
Jun
-2015
Mar
-2016
Dec
-2016
Rupee per US$Market
Determined
Exchange Rate
Sharp Currency Declines Worsened Balance Sheets of Companies with
Foreign Borrowing

In February 2016 as PSB financial results came in
investors fled PSB shares..
0
0.5
1
1.5
2
2.5
3
3.5
4
12-Feb-15 12-Feb-16 12-Feb-15 12-Feb-16
Public Sector Banks HDFC
20
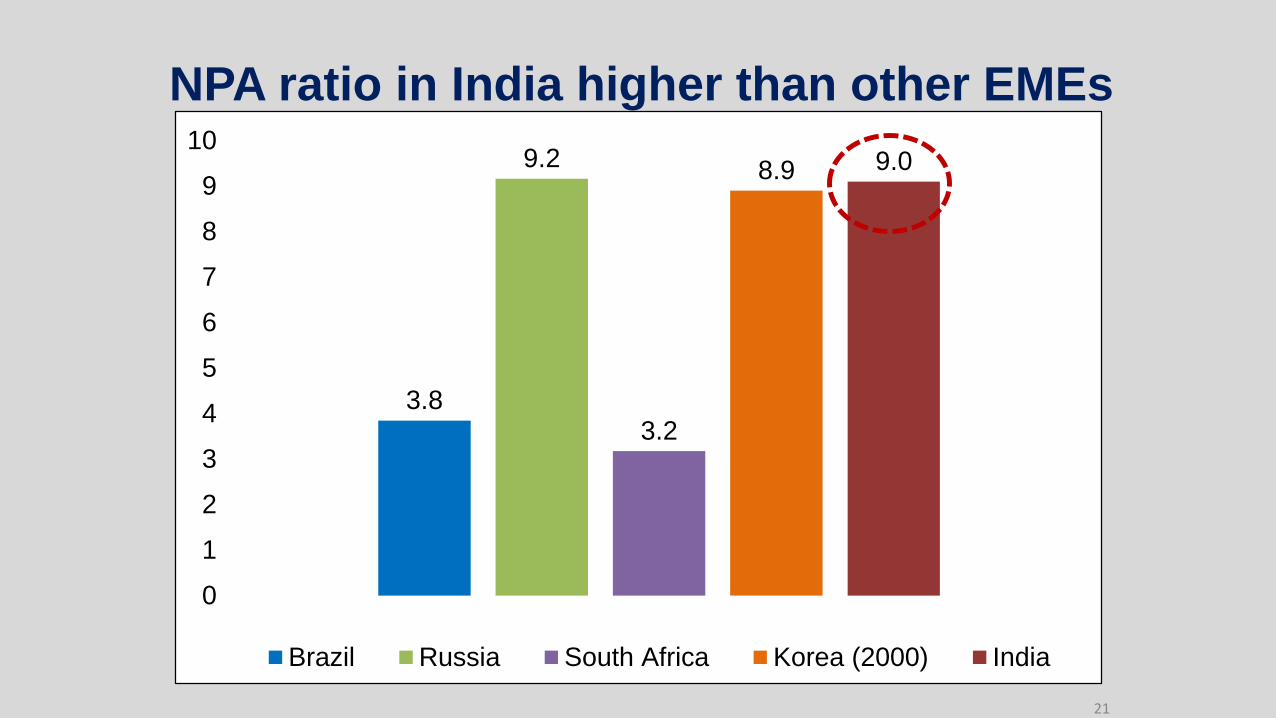
NPA ratio in India higher than other EMEs
3.8
9.2
3.2
8.9 9.0
0
1
2
3
4
5
6
7
8
9
10
Brazil Russia South Africa Korea (2000) India
21

But, not as bad as China’s..
22

Why hasn’t growth suffered in India?
Unique structure of financial system: Public Sector
dominated.
• Increase investment and supply capacity
• No sharp adjustments
• ‘Give time to time’ strategy (that worked in early 2000s)
• Allow companies time to turnaround ( high growth improving
cash flows) by postponing principal payments
• ‘Evergreening’
23

India: Real GDP growth
24
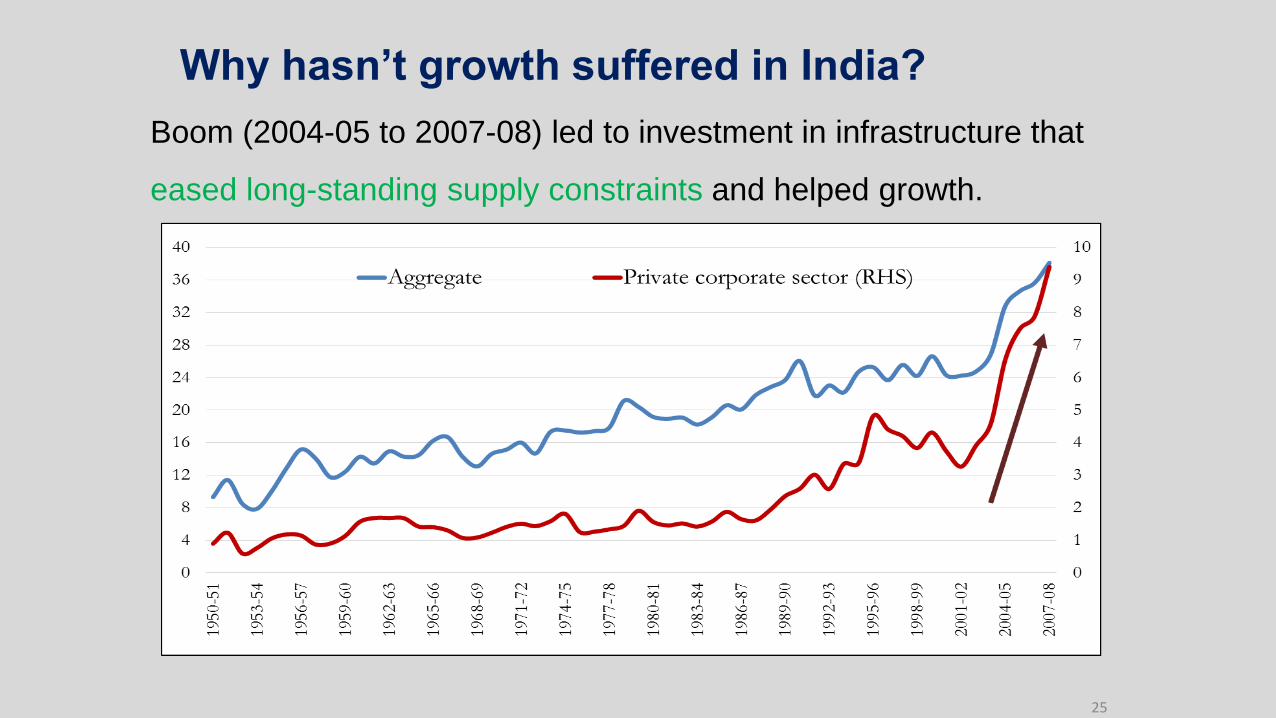
Why hasn’t growth suffered in India?
Boom (2004-05 to 2007-08) led to investment in infrastructure that
eased long-standing supply constraints and helped growth.
25

Strategy so far:
‘Giving Time to Time’ and EvergreeningAbout 6.5 % of loans outstanding of
stressed Companies were
restructured by 2014-15
With little improvements in cash flow
stressed Co.s* have borrowed
significantly to continue operations
454
990
1,372
2,101
2,675
3,572
5,349
6,298
6,689
7,083
7,519
-
1,000
2,000
3,000
4,000
5,000
6,000
7,000
8,000
FY
06
FY
07
FY
08
FY
09
FY
10
FY
11
FY
12
FY
13
FY
14
FY
15
FY
16
Source: Credit Suisse database. * Top 10 stressed Groups. Includes bank debt, bonds, ECBs, and other debt.

27
Picture from CartoonStock, Andrew Toos.
Effects of the Twin Balance
Sheet Crisis

Health of Public Sector Banks in the Red
(Return on Assets)
International Norm
29
Return on Assets is obtained by dividing net profits by average total assets. The dotted
red line indicates the international norm.
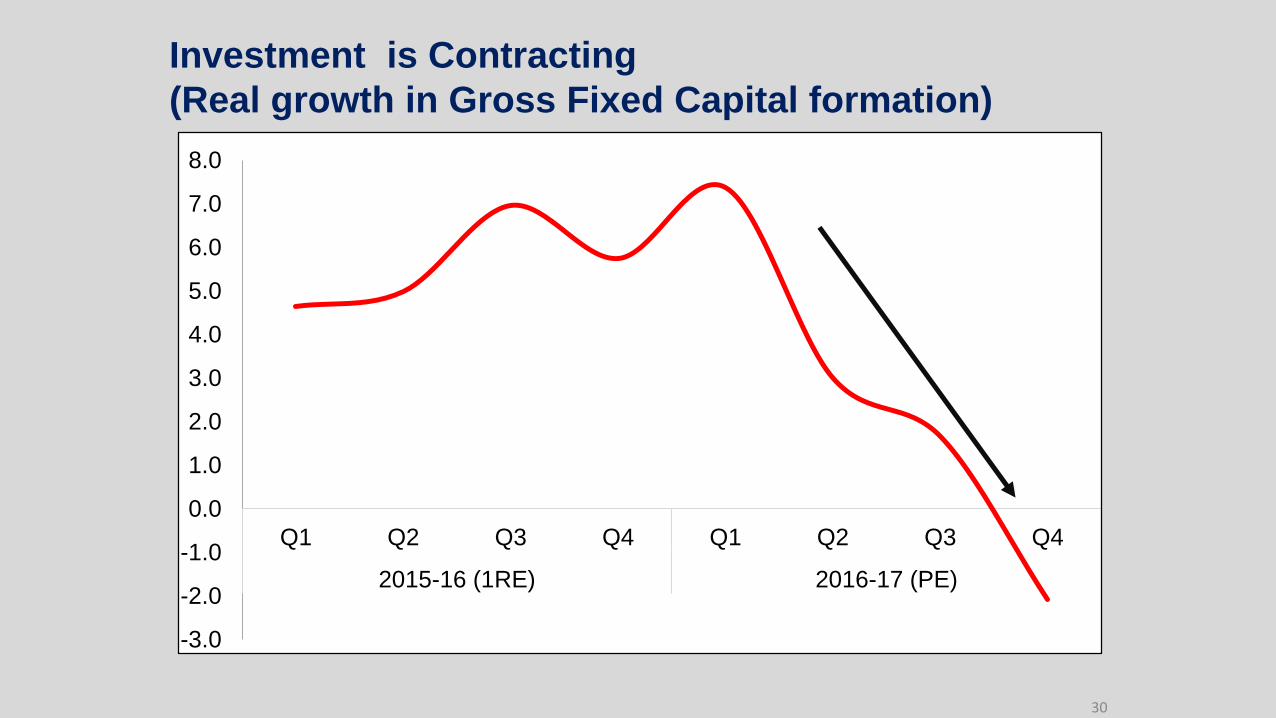
Investment is Contracting
(Real growth in Gross Fixed Capital formation)
30
-3.0
-2.0
-1.0
0.0
1.0
2.0
3.0
4.0
5.0
6.0
7.0
8.0
Q1 Q2 Q3 Q4 Q1 Q2 Q3 Q4
2015-16 (1RE) 2016-17 (PE)
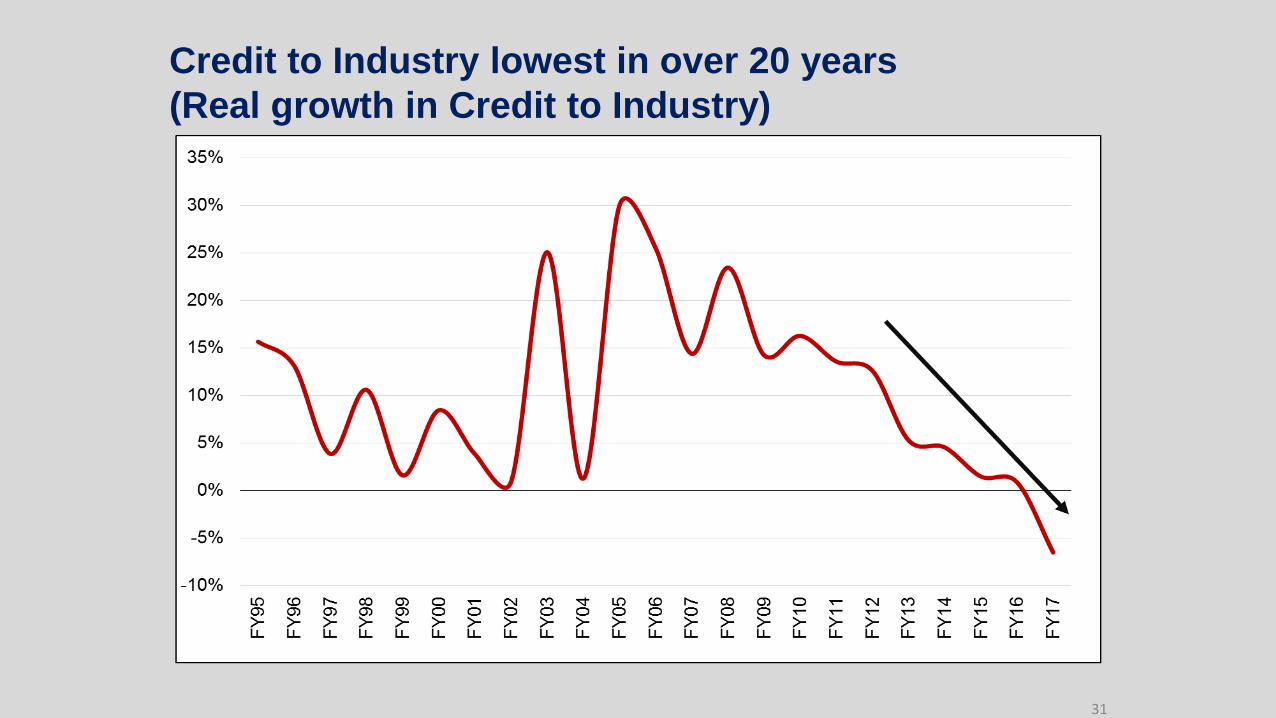
Credit to Industry lowest in over 20 years
(Real growth in Credit to Industry)
31
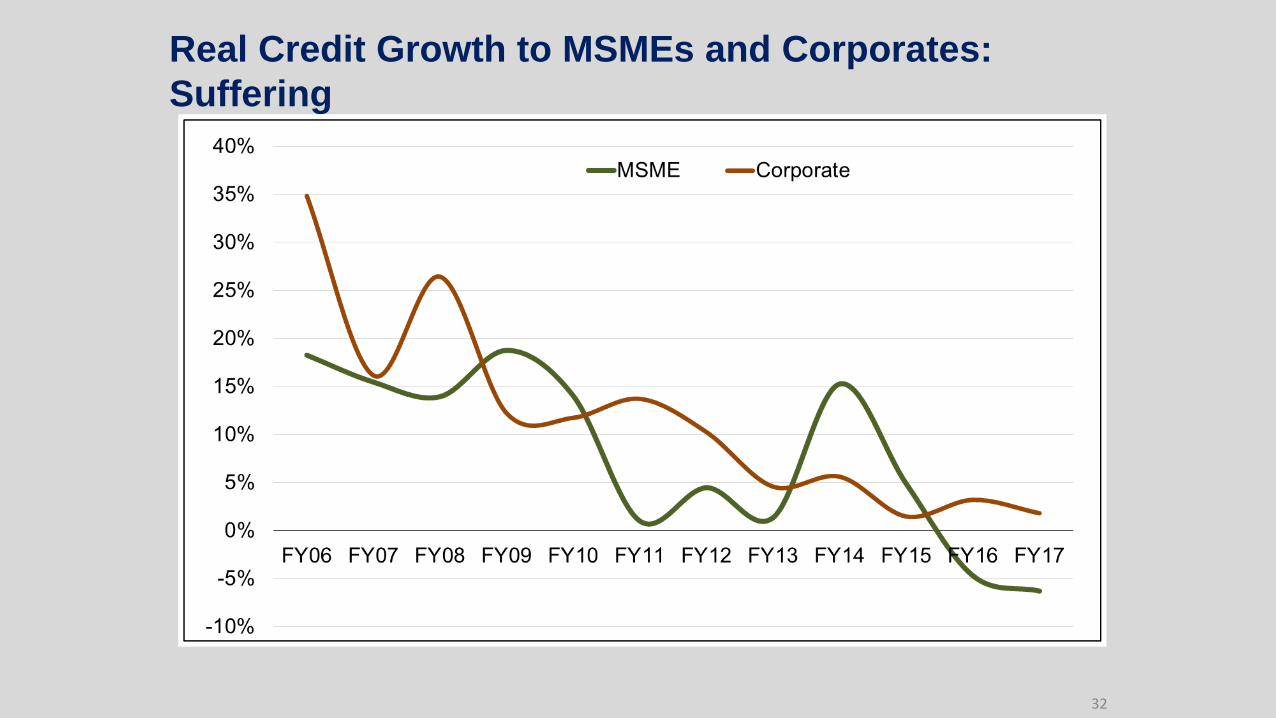
Real Credit Growth to MSMEs and Corporates:
Suffering
32

Monetary Policy Transmission 1A: Interest Rate and Borrowing
Channel, Transmission of Recent Rate Cuts Impeded by Rising NPAs
6.0
6.5
7.0
7.5
8.0
8.5
9.0
9.5
10.0
10.5
Apr.
21,
201
7M
ar.
10
, 20
17
Ja
n.
27
, 20
17
De
c. 1
6, 2
016
Nov. 4
, 20
16
Sep
. 23
, 2
016
Aug
. 12
, 2
016
Ju
l. 1
, 20
16
Ma
y 2
0,
20
16
Apr.
8, 2
016
Fe
b.
19,
20
16
Ja
n.
1,
201
6N
ov. 2
0, 2
015
Oct. 9
, 2
015
Aug
. 28
, 2
015
Ju
l. 1
7, 2
015
Ju
n.
5,
201
5A
pr.
24,
201
5M
ar.
6,
201
5Ja
n.
23
, 20
15
De
c. 1
2, 2
014
Oct. 3
1,
201
4S
ep
. 19
, 2
014
Aug
. 8,
20
14
Ju
n.
27
, 20
14
Ma
y 1
6,
20
14
Apr.
4, 2
014
Fe
b.
21,
20
14
Ja
n.
10
, 20
14
No
v. 2
9, 2
013
Oct. 1
8,
201
3S
ep
. 6,
20
13
Ju
l. 2
6, 2
013
Ju
n.
7,
201
3A
pr.
26,
201
3M
ar.
15
, 20
13
Fe
b.
1, 2
01
3D
ec. 2
1, 2
012
Nov. 9
, 20
12
Sep
. 28
, 2
012
Aug
. 17
, 2
012
Ju
n.
29
, 20
12
Ma
y 1
8,
20
12
Apr.
6, 2
012
Fe
b.
24,
20
12
Ja
n.
13
, 20
12
Dec. 2
, 20
11
Policy Repo Rate
Base Rate Mean
Term Deposit Rate Mean
33

How does India fit in the Balance Sheet Crisis Model?• Similarities with other cases (Japan)
• High NPAs
• Decisive resolution time-consuming.
• Weak (private) investment.
• But unique due to
• Relatively robust growth.
• Moderately high inflation.
• Key: In Japan and India fixing of balance sheets has taken time unlike
in US (after GFC) and Thailand (after AFC). So for the latter recovery
have been quicker.
34

June 2014:
5:25 Flexible
Refinancing
Mar-
14
Dec-14 Mar-16
June 16:
Scheme for
Sustainable
Structuring of
Stressed Assets
August
2014:
Change in
ARC Fee
Structure
June 2015:
SDR
Scheme
October
2015:
AQR
Scheme
May-17
Timeline of RBI/Government Actions
Banking
Regulation
(Amendment)
Ordinance
2017
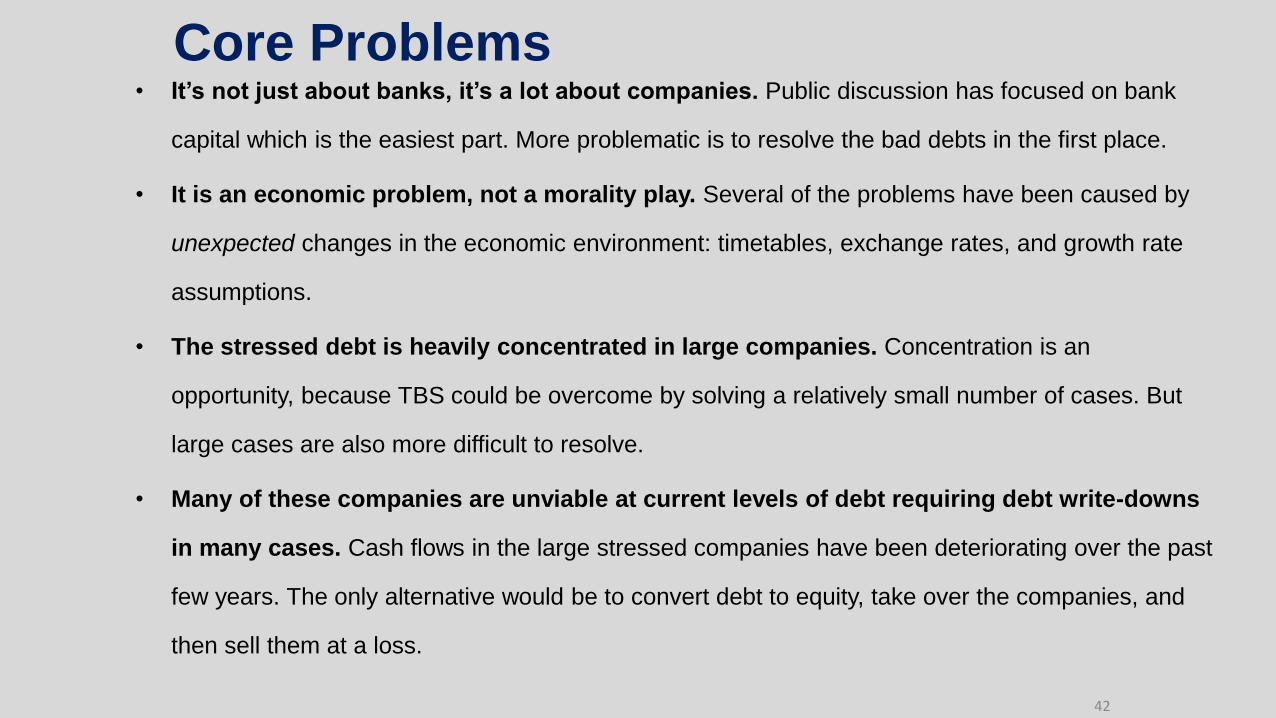
Core Problems• It’s not just about banks, it’s a lot about companies. Public discussion has focused on bank
capital which is the easiest part. More problematic is to resolve the bad debts in the first place.
• It is an economic problem, not a morality play. Several of the problems have been caused by
unexpected changes in the economic environment: timetables, exchange rates, and growth rate
assumptions.
• The stressed debt is heavily concentrated in large companies. Concentration is an
opportunity, because TBS could be overcome by solving a relatively small number of cases. But
large cases are also more difficult to resolve.
• Many of these companies are unviable at current levels of debt requiring debt write-downs
in many cases. Cash flows in the large stressed companies have been deteriorating over the past
few years. The only alternative would be to convert debt to equity, take over the companies, and
then sell them at a loss.
42

Core Problems• Banks are finding it difficult to resolve these cases, despite a proliferation of schemes to
help them. They face severe coordination problems, since large debtors have many creditors. If
PSU banks grant large debt reductions, this could attract the attention of the investigative agencies.
But taking over large companies will be politically difficult, as well.
• Delay is costly. Since banks can’t resolve the big cases, they have simply refinanced the debtors.
But this is costly for the government, because it means the bad debts keep rising, increasing the
ultimate recapitalization bill for the government. Delay is also costly for the economy.
• Progress may require a Public Sector Asset Rehabilitation Agency (PARA). Private ARCs
haven’t proved more successful than banks. But international experience shows that a
professionally run central agency with government backing – while not without its own problems --
can overcome these difficulties.
37

38
Stressed Companies in Difficult Situation
Example: PowerGiven large cost over-runs, break even tariff is well above current merchant rates*
*: Tariffs are in Rs./KwH and on shown in RHS. Costs are in Rs. Million.
0
1
2
3
4
5
6
7
8
9
0
20
40
60
80
100
120
140
160Original Cost per MW (Rs mn) Cost overrun per MW (Rs mn)
Required Tariff (Rs/KwH) (RHS) Current Merchant tariff (Rs/KwH) (RHS)

The 4 Rs for Progress
39
• Recognition
• Resolution
• Recapitalization
• Reform
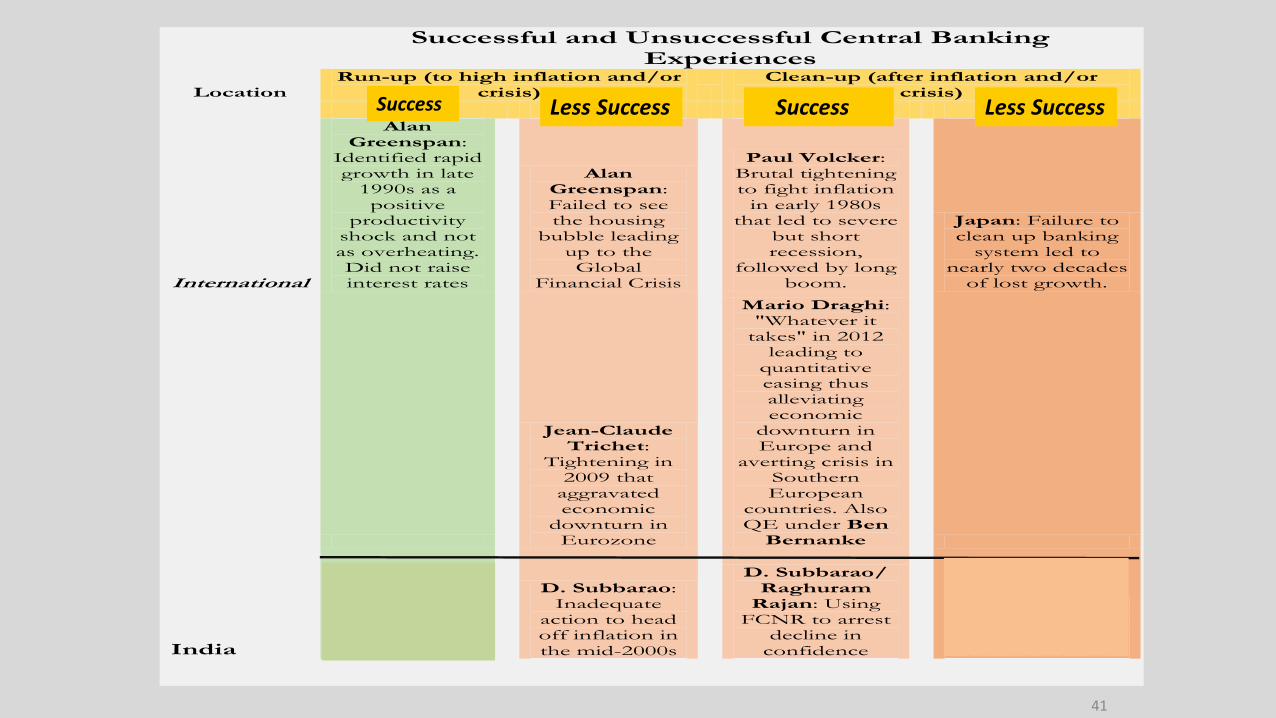
Successful and Unsuccessful Central Banking Experiences
Location Run-up (to high inflation and/or
crisis) Clean-up (after inflation and/or
crisis)
Success Less Success Less Success Failure
International
Alan Greenspan:
Identified rapid growth in late
1990s as a positive
productivity shock and not as overheating. Did not raise interest rates
Alan Greenspan: Failed to see the housing
bubble leading up to the Global
Financial Crisis
Paul Volcker: Brutal tightening to fight inflation
in early 1980s that led to severe
but short recession,
followed by long boom.
Japan: Failure to clean up banking
system led to nearly two decades
of lost growth.
Jean-Claude Trichet:
Tightening in 2009 that
aggravated economic
downturn in Eurozone
Mario Draghi: "Whatever it
takes" in 2012 leading to
quantitative easing thus alleviating economic
downturn in Europe and
averting crisis in Southern European
countries. Also QE under Ben
Bernanke
India
Y.V. Reddy: Anticipating
asset price rise and taking pre-emptive action
D. Subbarao: Inadequate
action to head off inflation in the mid-2000s
D. Subbarao/ Raghuram
Rajan: Using FCNR to arrest
decline in confidence
Post-2011 India: Twin Balance
Sheet challenge still unresolved
41
Less SuccessSuccessLess SuccessSuccess

Recommended Readings*1. Claessens, Stijn and M. Ayhan Kose, 2013, “Financial Crises Explanations,
Types, and Implications”, IMF working paper WP/13/28.
2. Economic Survey 2016-17, Chapter 4.
3. Reinhart, C. M. & K. S. Rogoff, 2008, “This Time is Different: A Panoramic
View of Eight Centuries of Financial Crises”, National Bureau of Economic
Research working paper 13882.
4. Subramanian, A., Josh Felman, Rangeet Ghosh & Zubair Noqvi, 2017,
“Rehab for the Balance Sheet”, The Indian Express.
*: The video clips used in this presentation from the movie ”The Big Short” have been
taken from YouTube.
42