Economic Cost of Climate Change - IEA-ETSAP | … Cost of Climate Change in Europe Outcome of the...
15
2/6/2010 1 CENTER FOR ECONOMIC STUDIES KATHOLIEKE UNIVERSITEIT LEUVEN Economic Cost of Climate Change in Europe Outcome of the PESETA Project Denise Van Regemorter IPTS Seville and KULeuven Belgium Joint TERI ETSAP Workshop Delhi, January 21-22 2010 CENTER FOR ECONOMIC STUDIES KATHOLIEKE UNIVERSITEIT LEUVEN • What are the economic consequences of climate change in Europe? – overall order of magnitude – distribution (space, time, sector) • Related to mitigation and mainly, adaptation policies Question of Interest
Transcript of Economic Cost of Climate Change - IEA-ETSAP | … Cost of Climate Change in Europe Outcome of the...
2/6/2010
1
CENTER FOR ECONOMIC STUDIES
KATHOLIEKE UNIVERSITEIT LEUVEN
Economic Cost of Climate Change
in Europe
Outcome of the PESETA Project
Denise Van Regemorter
IPTS Seville and KULeuven Belgium
Joint TERI ETSAP Workshop
Delhi, January 21-22 2010
CENTER FOR ECONOMIC STUDIES
KATHOLIEKE UNIVERSITEIT LEUVEN
• What are the economic consequences of
climate change in Europe?
– overall order of magnitude
– distribution (space, time, sector)
• Related to mitigation and mainly, adaptation
policies
Question of Interest

2/6/2010
2
CENTER FOR ECONOMIC STUDIES
KATHOLIEKE UNIVERSITEIT LEUVEN
The PESETA Project
• PESETA : Projection of Economic impacts of climate change in Sectors of the European union based on boTtom-up Analyses
• Main purpose: Quantitative, multi-sectoral assessment of the impacts in value of climate change in Europe
To support policymakers
• JRC funded project– largely based on past DG Research-funded projects
(PRUDENCE, DINAS-Coast, cCASHh, NewExt,…)
CENTER FOR ECONOMIC STUDIES
KATHOLIEKE UNIVERSITEIT LEUVEN
Project partners
• Climate scenarios: DMI, CRU
• Five sectoral assessments:
• Agriculture: U. Politécnica de Madrid
• Human health: AEA Technology
• River basin flooding: JRC/IES
• Coastal systems: FEEM/Southampton U.
• Tourism: U. Maastricht-ICIS
• Coordination and integration into CGE model: JRC/IPTS

2/6/2010
3
CENTER FOR ECONOMIC STUDIES
KATHOLIEKE UNIVERSITEIT LEUVEN
• Damage = a Temperature b
• where a and b are parameters
• Main limitations for adaptation insights:
• use results from literature, from different
and possibly inconsistent climate scenarios
• only mean temperature and precipitation
are considered
• lack of geographical resolution
General approach in most literature (top-down)
CENTER FOR ECONOMIC STUDIES
KATHOLIEKE UNIVERSITEIT LEUVEN
The general approach in the
project (bottom up)• Integrated economic impact assessment, with as
starting point physical impact estimates based on– detailed process modelling
• Agriculture, DSSAT crop model
• River basin flooding, LISFLOOD hydrological model
• Coastal systems, DIVA model
– reduced-form exposure-response functions• Tourism
• Human Health
• Sectoral models provide direct effects estimates
• Overall effects (direct + indirect) assessed with a computable general equilibrium model of Europe

2/6/2010
4
CENTER FOR ECONOMIC STUDIES
KATHOLIEKE UNIVERSITEIT LEUVEN
Socioeconomic scenario: GDP, population assumptions
Agriculture
model
Coastal
Systems
model
River
Flooding
model
Tourism
model
Stage 1:
Modeling
future
climate
Physical
impacts
agriculture
Physical
impacts
coasts
Physical
impacts
floods
Physical
impacts
tourism
Stage 2:
Modeling
physical
impacts
Stage 3:
Modeling
economic
impacts
Climate model
General Equilibrium model
Climate data
(T, P, SLR)
Economic
impacts
Valuation
agriculture
impacts
Valuation
coasts
impacts
Valuation
floods
impacts
Valuation
tourism
impacts
Socioeconomic scenario: GDP, population assumptions
Agriculture
model
Coastal
Systems
model
River
Flooding
model
Tourism
model
Agriculture
model
Coastal
Systems
model
River
Flooding
model
Tourism
model
Stage 1:
Modeling
future
climate
Physical
impacts
agriculture
Physical
impacts
coasts
Physical
impacts
floods
Physical
impacts
tourism
Physical
impacts
agriculture
Physical
impacts
coasts
Physical
impacts
floods
Physical
impacts
tourism
Stage 2:
Modeling
physical
impacts
Stage 3:
Modeling
economic
impacts
Climate model
General Equilibrium model
Climate data
(T, P, SLR)
Economic
impacts
Climate model
General Equilibrium model
Climate data
(T, P, SLR)
Economic
impacts
Valuation
agriculture
impacts
Valuation
coasts
impacts
Valuation
floods
impacts
Valuation
tourism
impacts
Valuation
agriculture
impacts
Valuation
coasts
impacts
Valuation
floods
impacts
Valuation
tourism
impacts
Valuation
agriculture
impacts
Valuation
coasts
impacts
Valuation
floods
impacts
Valuation
tourism
impacts
CENTER FOR ECONOMIC STUDIES
KATHOLIEKE UNIVERSITEIT LEUVEN
Selected Climate Scenarios
• 2011-2040 period: A2 IPCC SRES scenario
data from the Rossby Center
• 2071-2100 period: data from PRUDENCE
– A2, B2 IPCC SRES scenarios
– 2 global circulation models, GCMs (HadCM3,
ECHAM4)
– 2 regional climate models, RCMs (HIRHAM,
RCA
2/6/2010
5
CENTER FOR ECONOMIC STUDIES
KATHOLIEKE UNIVERSITEIT LEUVEN
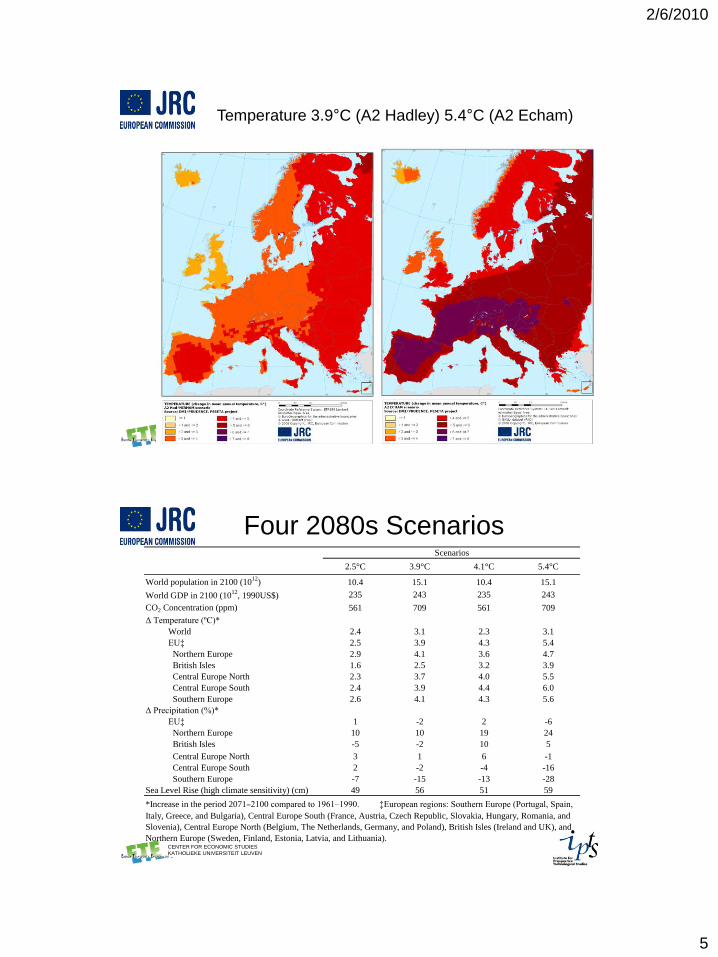
Temperature 3.9°C (A2 Hadley) 5.4°C (A2 Echam)
CENTER FOR ECONOMIC STUDIES
KATHOLIEKE UNIVERSITEIT LEUVEN
2.5°C 3.9°C 4.1°C 5.4°C
World population in 2100 (1012
) 10.4 15.1 10.4 15.1
World GDP in 2100 (1012
, 1990US$) 235 243 235 243
CO2 Concentration (ppm) 561 709 561 709
Δ Temperature (ºC)*
World 2.4 3.1 2.3 3.1
EU‡ 2.5 3.9 4.3 5.4
Northern Europe 2.9 4.1 3.6 4.7
British Isles 1.6 2.5 3.2 3.9
Central Europe North 2.3 3.7 4.0 5.5
Central Europe South 2.4 3.9 4.4 6.0
Southern Europe 2.6 4.1 4.3 5.6
Δ Precipitation (%)*
EU‡ 1 -2 2 -6
Northern Europe 10 10 19 24
British Isles -5 -2 10 5
Central Europe North 3 1 6 -1
Central Europe South 2 -2 -4 -16
Southern Europe -7 -15 -13 -28
Sea Level Rise (high climate sensitivity) (cm) 49 56 51 59
Scenarios
*Increase in the period 2071–2100 compared to 1961–1990. ‡European regions: Southern Europe (Portugal, Spain,
Italy, Greece, and Bulgaria), Central Europe South (France, Austria, Czech Republic, Slovakia, Hungary, Romania, and
Slovenia), Central Europe North (Belgium, The Netherlands, Germany, and Poland), British Isles (Ireland and UK), and
Northern Europe (Sweden, Finland, Estonia, Latvia, and Lithuania).
Four 2080s Scenarios

2/6/2010
6
CENTER FOR ECONOMIC STUDIES
KATHOLIEKE UNIVERSITEIT LEUVEN
Grouping of
countries
CENTER FOR ECONOMIC STUDIES
KATHOLIEKE UNIVERSITEIT LEUVEN
Number of cases considered
Climate Scenarios Impact
Category 2020s 2080s
Variants Total number of cases analysed
Agriculture 1 4 - 5
River
Floods - 4 - 4
Coastal
Systems 1 4
No SLR Low/medium/high SLR
IPCC low/high SLR
Non adaptation/optimal adaptation
72
Tourism - 4 Alternative demand assumptions 12
Human
Health 1 4 Two exposure-response functions 8
2/6/2010
7
CENTER FOR ECONOMIC STUDIES
KATHOLIEKE UNIVERSITEIT LEUVEN
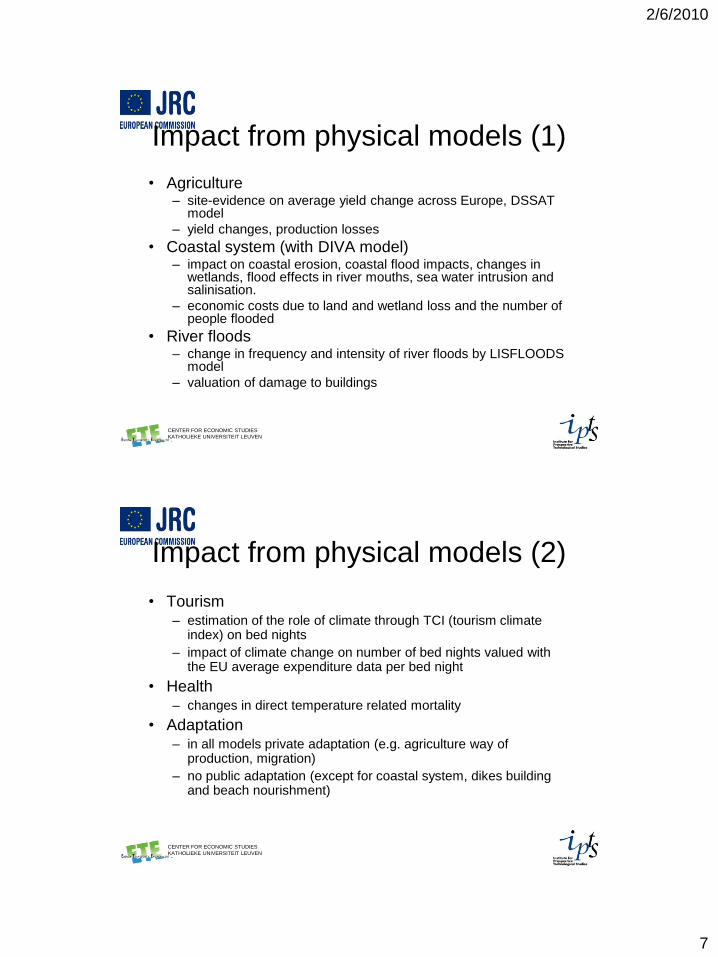
Impact from physical models (1)
• Agriculture– site-evidence on average yield change across Europe, DSSAT
model
– yield changes, production losses
• Coastal system (with DIVA model)– impact on coastal erosion, coastal flood impacts, changes in
wetlands, flood effects in river mouths, sea water intrusion and salinisation.
– economic costs due to land and wetland loss and the number of people flooded
• River floods– change in frequency and intensity of river floods by LISFLOODS
model
– valuation of damage to buildings
CENTER FOR ECONOMIC STUDIES
KATHOLIEKE UNIVERSITEIT LEUVEN
Impact from physical models (2)
• Tourism– estimation of the role of climate through TCI (tourism climate
index) on bed nights
– impact of climate change on number of bed nights valued with the EU average expenditure data per bed night
• Health– changes in direct temperature related mortality
• Adaptation– in all models private adaptation (e.g. agriculture way of
production, migration)
– no public adaptation (except for coastal system, dikes building and beach nourishment)

2/6/2010
8
CENTER FOR ECONOMIC STUDIES
KATHOLIEKE UNIVERSITEIT LEUVEN
Agriculture
Crop yield
changes
(t/Ha),
productio
n losses
and gains
CENTER FOR ECONOMIC STUDIES
KATHOLIEKE UNIVERSITEIT LEUVEN
Agriculture: crop yield changes (%)
compared to 1961-1990
B2 HadAM3h A2 HadAM3h B2 ECHAM4 A2 ECHAM4
2.5°C 3.9°C 4.1°C 5.4°C
Northern Europe 37 39 36 52 62
British Isles -9 -11 15 19 20
Central Europe North -1 -3 2 -8 16
Central Europe South 5 5 3 -3 7
Southern Europe 0 -12 -4 -27 15
EU 3 -2 3 -10 17
2025

2/6/2010
9
CENTER FOR ECONOMIC STUDIES
KATHOLIEKE UNIVERSITEIT LEUVEN
Coastal Systems
people flooded (1000s/year) in main scenarios with
high climate sensitivity, without adaptation
B2 HadAM3h A2 HadAM3h B2 ECHAM4 A2 ECHAM4 A2 ECHAM4
2.5°C 3.9°C 4.1°C 5.4°C high SLR
Northern Europe 20 40 20 56 272
British Isles 70 136 86 207 1,279
Central Europe North 345 450 347 459 2,398
Central Europe South 82 144 85 158 512
Southern Europe 258 456 313 474 1,091
EU 775 1,225 851 1,353 5,552
CENTER FOR ECONOMIC STUDIES
KATHOLIEKE UNIVERSITEIT LEUVEN
River Floods
Change in
economic
damage (red
means a decrease)
2/6/2010
10
CENTER FOR ECONOMIC STUDIES
KATHOLIEKE UNIVERSITEIT LEUVEN
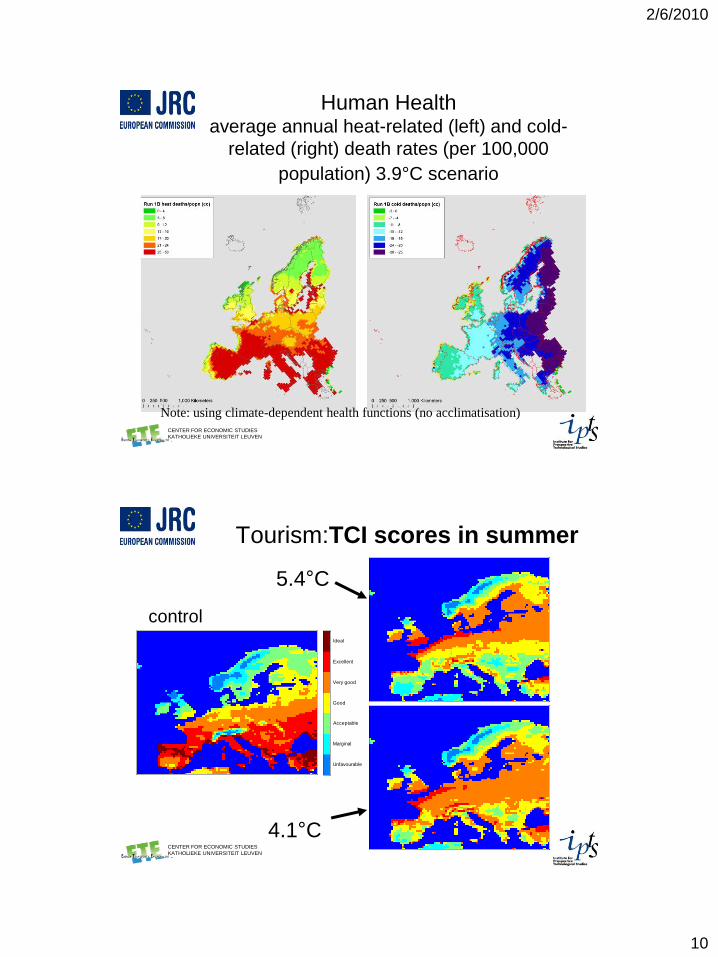
Human Healthaverage annual heat-related (left) and cold-
related (right) death rates (per 100,000
population) 3.9°C scenario
Note: using climate-dependent health functions (no acclimatisation)
CENTER FOR ECONOMIC STUDIES
KATHOLIEKE UNIVERSITEIT LEUVEN
Tourism:TCI scores in summer
Ideal
Excellent
Very good
Good
Acceptable
Marginal
Unfavourable
Ideal
Excellent
Very good
Good
Acceptable
Marginal
Unfavourable
Ideal
Excellent
Very good
Good
Acceptable
Marginal
Unfavourable
control
5.4°C
4.1°C

2/6/2010
11
CENTER FOR ECONOMIC STUDIES
KATHOLIEKE UNIVERSITEIT LEUVEN
Tourism
Change in expenditure receipts (million €)
B2 HadAM3h
2.5ºC
A2 HadAM3h
3.9ºC
B2 ECHAM4
4.1ºC
A2 ECHAM4
5.4ºC
Norhern Europe 443 642 1,888 2,411
British Isles 680 932 3,587 4,546
Central Europe North 634 920 3,291 4,152
Central Europe South 925 1,763 7,673 9,556
Southern Europe -824 -995 -3,080 -5,398
EU 1,858 3,262 13,360 15,268
CENTER FOR ECONOMIC STUDIES
KATHOLIEKE UNIVERSITEIT LEUVEN
• Static analysis: evaluation of the economic effects of future climate change (projected for the 2080s) on the current economy, as of 2010.
• Only market costs included
• Assuming there is no public adaptation, so that priorities for adaptation within the EU can be explored
Integration of sectoral impacts into the
CGE GEM-E3 model
2/6/2010
12
CENTER FOR ECONOMIC STUDIES
KATHOLIEKE UNIVERSITEIT LEUVEN
GEM-E3: a General Equilibrium Model for Energy-Economics-Environment interactions
• GEM-E3: the standard European version covers the 27 EU countries (except Luxemburg, Malta and Cyprus)
• The model has been developed as a multi-national collaboration project, cofunded by the EU Commission, DG Research.
• follows the computable general equilibrium methodology,– demand and supply functions derived from microeconomic
behaviour of economic agents (optimisation of their objective)
– markets clear through prices and prices are such that at equilibrium all agents optimise their behaviour
– covers the entire economic activity within a region
CENTER FOR ECONOMIC STUDIES
KATHOLIEKE UNIVERSITEIT LEUVEN
The GEM-E3 model (2)• simultaneously multinational and specific for each
region, markets clear at country or EU level, where appropriate
• extensive environmental dimension, inclusive its
transfrontier characteristics and possibility of feedback
from the environment on the economy
• wide variety of policy instruments (standards, taxes,
permits, at EU and country level, different allowance
schemes)
• oriented towards medium & long term macroeconomic
implications of policies (general, energy, environment)
• follows a time forward path (dynamic recursive over
time)

2/6/2010
13
CENTER FOR ECONOMIC STUDIES
KATHOLIEKE UNIVERSITEIT LEUVEN
Producers Consumers
Capital
Imports Exports
Revenues InvestmentInvestmentFinancing
Investment
Goods Market Equilibrium
Labour Market Equilibrium
Rate of return
Income flows and Transfers
PRODUCERS GOVERNMENT CONSUMERS FOREIGN
SURPLUS OR DEFICIT OF AGENTS
allocation
Maximising Profits Maximising Utility
ENVIRONMENT
CENTER FOR ECONOMIC STUDIES
KATHOLIEKE UNIVERSITEIT LEUVEN
Modelling of physical impacts
in GEM-E3• Agriculture
– yield changes interpreted as Total Factor Productivity change (no production factors changes)
• River floods– damage to residential buildings (80%) as obliged expenditure by household
– damage to industrial sectors (20%), as production and capital losses
• Coastal system– floods leads to capital losses (and so additional expenditure
– migration cost (for household)
• Tourism– redistribution of tourism within Europe leads to changes in exports
– induces reaction on the supply capacity
• For both river floods and coastal systems, the additional expenditure does not provide any welfare gain: it represents a welfare loss, since households are forced to it due to climate change.

2/6/2010
14
CENTER FOR ECONOMIC STUDIES
KATHOLIEKE UNIVERSITEIT LEUVEN
Annual damage
in terms of GDP changes (million €)
-70000
-60000
-50000
-40000
-30000
-20000
-10000
0
10000
Southern
Europe
Central Europe
South
Central Europe
North
British Isles Northern
Europe
EU
2.5°C
3.9°C
4.1°C
5.4°C
5.4°C, 88 cm SLR
CENTER FOR ECONOMIC STUDIES
KATHOLIEKE UNIVERSITEIT LEUVEN
Annual damage
in terms of Welfare changes (%)
-2.0
-1.5
-1.0
-0.5
0.0
0.5
1.0
Southern
Europe
Central Europe
South
Central Europe
North
British Isles Northern
Europe
EU
2.5°C
3.9°C
4.1°C
5.4°C
5.4°C, 88 cm SLR

2/6/2010
15
CENTER FOR ECONOMIC STUDIES
KATHOLIEKE UNIVERSITEIT LEUVEN
Sectoral decomposition
of welfare changes (%)
-2.0%
-1.5%
-1.0%
-0.5%
0.0%
0.5%
1.0%
2.5
oC
3.9
oC
5.4
oC
5.4
ioC
2.5
oC
3.9
oC
5.4
oC
5.4
ioC
2.5
oC
3.9
oC
5.4
oC
5.4
ioC
2.5
oC
3.9
oC
5.4
oC
5.4
ioC
2.5
oC
3.9
oC
5.4
oC
5.4
ioC
2.5
oC
3.9
oC
5.4
oC
5.4
ioC
Southern Europe Central Europe South Central Europe North British Isles Northern Europe EU
Tourism
River floods
Coastal systems
Agriculture
CENTER FOR ECONOMIC STUDIES
KATHOLIEKE UNIVERSITEIT LEUVEN
Conclusion
• Gives a first insight in impact of climate change in Europe but uncertainty still very great at all steps of the research (sectoral and global level) full results in http://ftp.jrc.es/EURdoc/JRC55391.pdf
• Innovative aspects of the project:– High space-time resolution of climate data (daily, 50 km)
– Use of detailed physical impact models for each impact category
– Integration of all sectoral results in CGE model
• Further research is needed, concerning:– Costs and benefits of adaptation
– Cross-sectoral consistency
– Land use modelling
– Monte Carlo analysis for uncertainty
• FP7 research project (ClimateCost) for extension of these results: better integration and geographic extension


![TIII team: Presentation final event [KULeuven]](https://static.fdocuments.us/doc/165x107/5564612ad8b42aa2398b4ab1/tiii-team-presentation-final-event-kuleuven.jpg)