Economic contribution of the New Zealand wine … contribution of the New Zealand wine sector (2015)...
19
Economic contribution of the New Zealand wine sector (2015)
Transcript of Economic contribution of the New Zealand wine … contribution of the New Zealand wine sector (2015)...

Economic contribution of the New
Zealand wine sector (2015)

SummaryMeasurement 2015 2012
Number of wineries 673 703
Number of grape growers 762 824
Productive hectares 35,859 33,400
Estimated employees 7,580 7,700
Estimated wages $282 million $225 million
Export sales revenue (FOB) $1,536 million $1,202 million
Share of NZ total goods export revenue (%) 3% 3%
Gross output (total revenue) $2,096 million $1,786 million
Estimated excise and HPA levies $179.6 million $178 million
Estimated GST contribution $124 million $135 million
Contribution to national GDP (%) 0.4% 0.3%
Contribution to national GDP ($) $1,092 million $760 million
Number of international wine tourists (visitors)* 551,807 220,000
Spending by wine tourists * $2.8 billion $814 million
2
Source: NZ Winegrowers Annual Report, NZIER, MBIE
* Change in methodology of International visitors survey, results not comparable

3
762 grape growers 673 wineries
Source: NZ Winegrowers Annual Report
Northland: 14
Auckland: 111
Gisborne: 18
Taranaki: 0
Waikato/Bay of Plenty: 12
Hawke's Bay: 75Manawatu-Wanganui: 1
Wellington: 67Tasman/Nelson: 35
Marlborough: 140West Coast: 0
Canterbury: 67
Otago: 127
Southland: 0
Northland: 0
Auckland: 10
Gisborne: 41
Taranaki: 0
Waikato/Bay of Plenty: 0
Hawke's Bay: 74Manawatu-Wanganui: 0
Wellington: 14Tasman/Nelson: 38
Marlborough: 535West Coast: 0
Canterbury: 18
Otago: 32
Southland: 0
Waitaki : 6

More hectares; fewer wineries
4
0
5000
10000
15000
20000
25000
30000
35000
40000
0
100
200
300
400
500
600
700
800
Wineries & grape-producing hectares
Wineries (LHS axis)
Producing hectares (RHS axis)
Source: NZ Winegrowers Annual Report

Wine exports performing strongly
5
60
80
100
120
140
160
180
2008 2009 2010 2011 2012 2013 2014 2015
Ind
ex, 2008 =
100
Wine sector export values vs. economy wide export values and nominal GDP
Wine exports
Exports
GDP
70%
14%
28%
Source: Statistics New Zealand, NZIER

Export volume has doubled since 2008
6
0
50
100
150
200
250
1996 1998 2000 2002 2004 2006 2008 2010 2012 2014
(m of litres)Volume of New Zealand wine sold
Domestic Exports
Source: NZ Winegrowers Annual Report
209m
62m

0% 5% 10% 15% 20% 25%
Hides, skins and leather
Wood pulp
Precious Stones and metals
Wool
Optical, medical and measuring equipment
Cereals, flours
Mineral fuels
Aluminium
Electrical machinery
Casein
Fish
Wine
Mechanical machinery
Fruit
Wood
Meat
Dairy
Share of total exportsDecember year
$1.7b
Wine is 6th largest export commodity in
2015
7
Source: NZIER, Statistics NZ
$11.5b
$6.8b
$3.5b
$2.3b
$1.5b
$1.5b
$1.2b
$1.1b
$1.0b
$0.9b
$0.9b
$0.9b
$0.8b
$0.8b
$0.8b
$0.5b
$0.7b
-20% -15% -10% -5% 0% 5% 10%
Hides, skins and leather
Wood pulp
Precious Stones and metals
Wool
Optical, medical and measuring equipment
Cereals, flours
Mineral fuels
Aluminium
Electrical machinery
Casein
Fish
Wine
Mechanical machinery
Fruit
Wood
Meat
Dairy
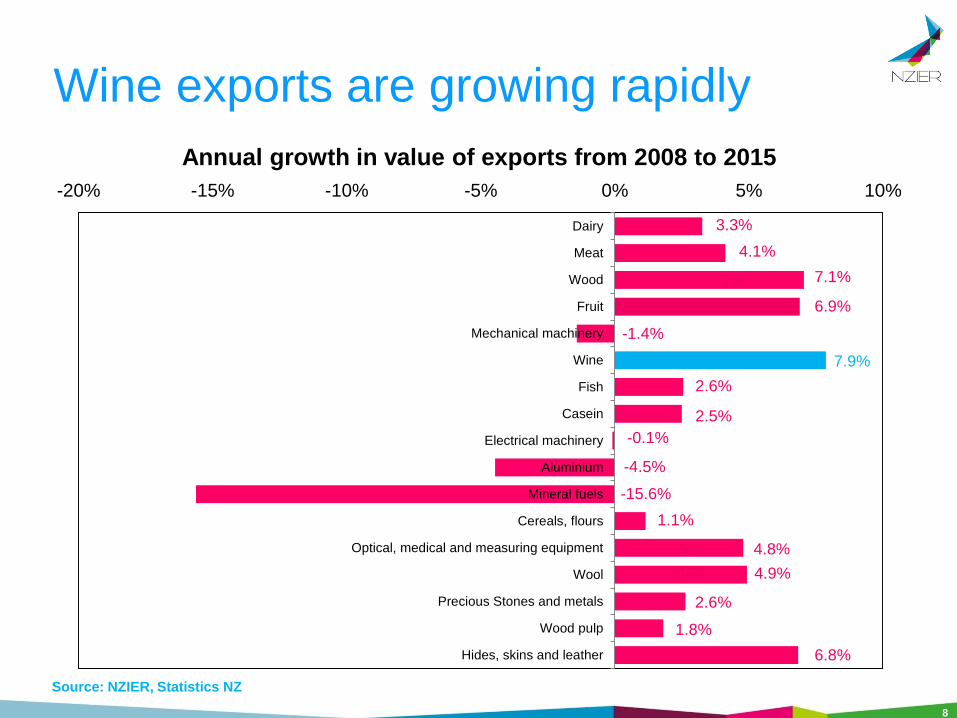
Annual growth in value of exports from 2008 to 2015
7.1%
1.8%
Wine exports are growing rapidly
8
Source: NZIER, Statistics NZ
3.3%
4.1%
7%
-1.4%
7.9%
6.9%
2.6%
2.5%
-0.1%
-4.5%
-15.6%
4.8%
1.1%
5%
4.9%
2.6%
6.8%
5%

$1.3 billion of wine to the EU, US and
Australia
9
0
100
200
300
400
500
600
1996 1998 2000 2002 2004 2006 2008 2010 2012 2014
($m)
Wine export values to NZ's top markets, calendar years
Australia European Union United States of America
$359m
$431m
$522m
Source: NZIER, Statistics NZ

Growth in exports to Asia
10
Source: NZIER, Statistics NZ
$27m
$21m
$20m
$16m
0
5
10
15
20
25
30
35
1996 1998 2000 2002 2004 2006 2008 2010 2012 2014
($m)
Wine export values to Asia, calendar years
China Hong Kong Singapore Japan

11
White87%
Red13%
Wine exports by typeJune 2015 year
25%
28%25%
7%
2% 13%
White wine exports
20%
14%
26%6%
13%
21%
Red wine exports
Source: NZIER, Statistics NZ

The sector pumps $280 million directly
to Kiwi households
12
0
50
100
150
200
250
300
2008 2009 2010 2011 2012 2013 2014 2015
($m)Total salary and wages paid
Grape growing Wine production
Source: NZIER, Statistics NZ

Over 7,500 wine sector jobs are spread
around New Zealand
13
Northland: 50
Auckland: 1440
Gisborne: 400
Taranaki: 0
Bay of Plenty: 100
Waikato: 55
Hawke's Bay: 980Manawatu-Wanganui: 0
Wellington: 325Tasman/Nelson: 360
Marlborough: 2240West Coast: 0
Canterbury: 480
Otago: 760
Southland: 0
Source: Statistics NZ
February 2015

Contributing as much as 10% of local
employment in Marlborough in 2015
14
Northland: 0.1%
Auckland: 0.2%
Gisborne: 2%
Taranaki: 0%
Bay of Plenty: 0.1%
Waikato: 0%
Hawke's Bay: 1.3%Manawatu-Wanganui: 0%
Wellington: 0.1%Tasman/Nelson: 0.8%
Marlborough: 10.1%West Coast: 0%
Canterbury: 0.2%
Otago: 0.7%
Southland: 0%
Source: Statistics NZ
February 2015

GST and excise taxes contribute 1% to
total tax take
15
Source: NZIER, NZ Winegrowers Annual Report
Excise & HPA: $179.6m
GST: $124m
Indirect taxes paid in 2015

20% of international tourists visit a winery
16
0% 10% 20% 30% 40% 50% 60%
Playing golfBungy jumping
SkiingWhalesCasino
Te PapaDolphins
Film locationMaraeWineryGlacier
SealsNational park
Native birdsA beach
Selected activities & locations visited by touristsJune 2015 year
Source: NZIER, MBIE

Wine tourists* stay longer than others in
New Zealand
17
0%
5%
10%
15%
20%
25%
30%
Under 5nights
5 -7nights
8 - 10nights
11 - 13nights
14 - 16nights
17 - 19nights
20 - 29nights
30 ormorenights
Length of stay of international touristsJune 2015 year
All tourists Wine
Source: NZIER, MBIE *A wine tourist is an international visitor who visits a winery

Australians, Americans & Chinese are
the most common visitors to wineries
18
0 5,000 10,000 15,000 20,000 25,000 30,000 35,000 40,000
Canada
Singapore
Thailand
Fiji
Japan
Germany
England
China
USA
Australia
Number of tourists who visited a wineryJune 2015 year
Source: NZIER, MBIE

Wine tourists spend more per visit to
New Zealand
19
$0
$1,000
$2,000
$3,000
$4,000
$5,000
$6,000
All tourists Wine tourists
Average spending per international touristJune 2015 year
Source: NZIER, MBIE