
Economic Challenges - Kentuckyeec.ky.gov/Documents/Economic Challenges Report FINAL with...
40
Transcript of Economic Challenges - Kentuckyeec.ky.gov/Documents/Economic Challenges Report FINAL with...


Economic Challenges Facing Kentucky’s
Electricity Generation
Under Greenhouse Gas Constraints
Commonwealth of Kentucky Energy and Environment Cabinet
December 2013

CONTRIBUTORS
The study was prepared by the following: Energy and Environment Cabinet
University of Kentucky Department of StatisticsUniversity of Kentucky Center for Applied Energy Research
Pacific Northwest National Laboratory
For comments or questions, contact John Lyons, Energy and Environment Cabinet502-564-3350 or [email protected]
Page 1
Economic Challenges Facing Kentucky’s Electricity Generation Under Greenhouse Gas ConstraintsDecember 2013
TABLE OF CONTENTS
Preface ....................................................................................................................................................... 1Introduction ............................................................................................................................................... 3Technology Options to Achieve Potential GHG Reductions ........................................................................ 5NSR/PSD Barriers to Technology Adoption ................................................................................................. 8Risk Exposure ............................................................................................................................................. 9Study Approach and Results ..................................................................................................................... 12 Federal Policy Options ..................................................................................................................... 12 Kentucky-Specific Response/Modeled Policy Options..................................................................... 13 Simulation Results ........................................................................................................................... 13Recommendations.................................................................................................................................... 22Acronyms and Abbreviations .................................................................................................................... 24Appendix A - Future Power Generation Options .....................................................................................A.1Appendix B - Estimated Limits on Power Generation Sources for Kentucky ...........................................B.1Appendix C - Simulation Results ..............................................................................................................C.1
TABLES AND FIGURES
Figure 1: Kentucky Electricity Generation, 1990-2050, Reference Case Without Additional Environmental Regulations ............................................................................................................... 4Figure 2: Levelized Costs and Overnight Capital Costs by Generating Technology ....................................5Figure 3: Carbon Dioxide Avoidance and Levelized Costs by Generating Technology ...............................7Figure 4: Carbon Dioxide Avoidance and Capital Costs by Generating Technology ...................................7Figure 5: EIA Natural Gas Price Forecasts vs. Observed Natural Gas Prices ............................................11Figure 6: Kentucky CO2 Emissions from Electricity Generation, 2000-2050, Reference Case .................14Figure 7: Kentucky’s Electricity Generation, 2035, Reference Case ........................................................ 15Figure 8: Kentucky Electricity Consumption, 1960-2050, Low Carbon Price - Reference Case Comparison .................................................................................................................................... 18Figure 9: Kentucky Electricity Prices, Nuclear Banned, Nuclear Allowed, Diversified Portfolio ..............21Figure A.1: CO2 Emission Rates for Future Candidate Power Generation Technologies ........................A.3Figure A.2: Levelized Cost of Electricity from Table A.1 .........................................................................A.4Table 1: Preliminary Risk Scenario Comparison for Nuclear, CCS (retrofit), and Natural Gas Power Generation .......................................................................................................... 10Table 2: Kentucky Electricity Prices, 2035 ............................................................................................... 16Table 3: Kentucky Electricity Prices, 2050 ............................................................................................... 16Table 4: Kentucky Change in Employment, 2035 .................................................................................... 17Table 5: Change in Employment, 2050 ................................................................................................... 17Table 6: Kentucky CO2 Emissions from Electricity Generation, 2050 ...................................................... 19Table A.1: Data for Power Generation Technology Options ...................................................................A.2Table B.1: Estimates of Existing Kentucky Coal Power Production “Eligible” for CCS Retrofit ...............B.5
Page 1
Economic Challenges Facing Kentucky’s Electricity Generation Under Greenhouse Gas ConstraintsDecember 2013
PREFACE
For the Energy and Environment Cabinet (EEC), which has primacy in administering most federal en-vironmental laws and regulations at the state level, we have to understand the implications of what is arguably one of the most challenging issues to confront us—greenhouse gas (GHG) emissions and their impact on climate change. Efforts to reduce GHG or carbon dioxide (CO2) emissions have moved beyond the point of discussion at the national level, and the United States Supreme Court has ruled that the U.S. Environmental Protection Agency (EPA) has the authority to regulate GHG emissions. Furthermore, while public opinion on climate change has fluctuated over the years, a majority of Americans accept some linkage between GHG emissions and climate change.1 Although public opinion should never be a driver for science-based policy decisions, it is clear that people expect the nation to take action on this issue. And it is. Thus, discussion and consideration of contingency plans to meet such possible future regula-tory frameworks is well advised.
For Kentucky, which is already experiencing the impacts of shifts away from coal and toward natural gas, regula-tory mechanisms to reduce GHG emissions will have significant repercussions. Greenhouse gas emissions from natural gas electric generating units (EGUs) are about half those from existing coal-fired units. Natural gas is also currently more cost competitive than coal from a levelized cost standpoint. With Kentucky’s existing nar-
rowly defined least-cost principle guiding electric generation development, combined with existing and anticipated regulatory constraints, natural gas is becoming the fuel of choice. With this narrowly defined least-cost principle being a primary determining factor for utility business decisions, Kentucky will simply go from relying predominantly on coal for electricity generation to being predominantly dependent on natural gas. Shifting from one single fuel resource to another presents untenable risks for Kentucky’s citizens and for our manufacturing sector. Such a movement toward an all natural gas infrastructure also further erodes our state’s coal mining sector. And finally, and importantly, such a movement does not allow us to address GHG emissions in a more holistic, effective manner.
In essence, near-term decisions are being made that have long-term consequences. And these decisions are driven by policies and principles that need to be examined more broadly given the growing impact that federal policies will have on our state. A holistic approach is one that will encourage electricity generation diversity to protect our economy, to hedge against risk, and to allow the state to take advan-tage of technological advancements relating to coal as they emerge. For example, today, technologies for making our coal generation plants more efficient, meaning fewer emissions per input, are for all intents off the table—they cannot compete cost-effectively with natural gas. We can reduce GHG emissions using coal with advanced technologies—they have a monetary cost, but the longer-term economic and energy security benefits also need to be considered.
It is important that coal continue to be a strong component of Kentucky’s electricity portfolio. And we must understand specific coal-use strategies to reduce GHG emissions. One important strategy is to im-prove boiler efficiency for electricity generation. Moving from conventional pulverized coal (PC) boilers
1 http://www.gallup.com/poll/161645/americans-concerns-global-warming-rise.aspx
Shifting from one single fuel resource to an-other presents untenable risks for Kentucky’s citizens and for our manufacturing sector. Such a movement toward an all natural gas infrastructure also further erodes our state’s coal mining sector.

Page 2
Economic Challenges Facing Kentucky’s Electricity Generation Under Greenhouse Gas ConstraintsDecember 2013
to more efficient, advanced coal technologies—even without carbon capture and sequestration (CCS)—can reduce CO2 emissions per MWh by as much as 25 percent. Further, these efficiency improvements reduce the quantity of CO2 to be separated and sequestered from flue gas, making CCS more feasible at the scale necessary for realistic carbon reduction strategies.
With a narrow least-cost decision criteria, the technologies that might present longer-term affordable, reliable coal-fired generating units that can comply with environmental requirements are not able to be considered. The technologies available today and the technologies that will be available to us in the future need to be considered more comprehensively. In this paper, we analyze the opportunities that enhancements to coal-fired boiler efficiency and other technologies can have on maintaining coal as an important part of Kentucky’s portfolio. Clearly, in a meaningful “all of the above” strategy to meet current energy demand and future energy growth, coal must be included for Kentucky, the nation, and indeed the world. The analyses included in this paper lead to a number of specific findings and some recommendations on multiple paths forward.
Page 3
Economic Challenges Facing Kentucky’s Electricity Generation Under Greenhouse Gas ConstraintsDecember 2013
INTRODUCTION
2 Greenhouse Gas Policy Implications for Kentucky under Section 111(d) of the Clean Air Act, Oct. 22, 2013.3 Kentucky Energy and Environment Cabinet. (2012). The Vulnerability of Kentucky’s Manufacturing Economy to Increasing Elec-tricity Prices. Department for Energy Development and Independence, Frankfort. http://energy.ky.gov/Programs/Documents/Vulnerability%20of%20Kentucky’s%20Manufacturing%20Economy.pdf4 EPA’s proposed rules (CAA, Section 111(b)) for new fossil generation require that new large natural gas-fired turbines meet a limit of 1,000 pounds of CO2 per megawatt-hour, while new small natural gas-fired turbines need to meet a limit of 1,100 pounds of CO2 per megawatt-hour. New coal-fired units would need to meet a limit of 1,100 pounds of CO2 per megawatt-hour, and would have the option to meet a somewhat tighter limit if they choose to average emissions over multiple years, giving those units additional operational flexibility.
The Energy and Environment Cabinet initiated this study in June 2013, a few weeks prior to President Obama’s announcement of his Climate Action Plan. Realizing GHG standards for existing power plants were a matter of when, not if, our intent with the study was multi-purposed. First, we wanted to deter-mine the potential impact of federal GHG policies on Kentucky’s electricity generation portfolio. This part of the study supported another ongoing project that resulted in the EEC’s whitepaper, Greenhouse Gas Policy Implications for Kentucky under Section 111(d) of the Clean Air Act.2 Changes to Kentucky’s electricity generation portfolio, changes already occurring even in the absence of federal GHG standards, will have an impact on electricity prices, with resulting effects on overall employ-ment3 and coal consumption. Therefore, this study also sought to determine the extent of the changes under various possible federal climate policies and to evaluate state-level options for minimizing poten-tial impacts.
A significant driver for the extensive analyses we have conducted arose from a preliminary examination of likely changes to Kentucky’s electricity portfolio given low natural gas prices, existing EPA regulations not related to GHGs, and EPA regulations limiting GHGs for new fossil power plants.4 Namely, in the absence of some type of policy response, Kentucky’s electricity portfolio would
start to shift dramatically from coal-fired generation to natural gas beginning in the 2016 timeframe, as shown in Figure 1. Unless other low-carbon technologies, including technologies to reduce emissions at coal-fired power plants, are given the chance to come on-line, this trend will continue as rules limiting CO2 from existing plants become a reality.
Kentucky’s generation portfolio will shift from reliance on one fuel source—coal—to reliance on another fuel source—natural gas—if certain obstacles leading to a more diverse portfolio are not addressed. This report looks at a range of generation technologies that can lead to reduced GHG emissions, discusses some of the economic risks associated with various technologies, analyzes impacts to electricity genera-tion under different GHG reduction constraints, and makes recommendations for consideration to help ensure Kentucky’s economy can continue to grow with affordable, relatively stable electricity prices.
Also evident is the large upward shift in natural gas generation and away from coal beginning in 2016, which is the effective date for new EPA regulations. This represents a forced retirement of existing coal- fired units, many of which will not have been fully depreciated. In other words, utility ratepayers will
Kentucky’s generation portfolio will shift from reliance on one fuel source—coal—to reliance on another fuel source—natural gas—if certain obstacles leading to a more diverse portfolio are not addressed.

Page 4
Economic Challenges Facing Kentucky’s Electricity Generation Under Greenhouse Gas ConstraintsDecember 2013
Figure 1: Kentucky Electricity Generation, 1990-2050, Reference Case Without Additional Environmental Regulations
Kentucky must be prepared to comply with future GHG rules while maintaining its strength as a manu-facturing state and while minimizing the impact on an already struggling coal mining sector. Price in-creases pose a threat to all utility customers, especially Kentucky’s energy-intensive industries that rely on stable, relatively predictable low-cost electricity. To the extent possible, Kentucky environmental and energy leaders are participating in discussions with the EPA offering suggestions for the development of GHG rules affecting existing power plants that are flexible, account for carbon reductions already un-derway, and that minimize the impact on Kentucky’s ratepayers. The results from this study will help to further inform these discussions. Additionally, these results can help policymakers, utilities, and others within the state understand implications of GHG policies and possible options for least-cost compliance.
still be paying for these coal units even though they will have been taken out of service. This “stranded investment” will continue to be a drag on Kentucky’s economy for some time. Further, the EPA could ex-acerbate this problem if new CO2 emission rules are implemented too aggressively and force additional units out of service prematurely.

Page 5
Economic Challenges Facing Kentucky’s Electricity Generation Under Greenhouse Gas ConstraintsDecember 2013
Technology Options to Achieve Potential GHG Reductions
Kentucky’s least-cost requirement5 for electricity generation technology has traditionally led to coal as the most affordable option for utilities. This has been the case even when expensive capital costs are re-quired to achieve environmental compliance. Today, the least-cost requirement is driving the shift in Ken-tucky’s generation portfolio to natural gas. With the deadline for achieving federal regulations such as the Mercury and Air Toxics Standards (MATS) approaching, many utilities are faced with a choice: install costly upgrades or retire a coal-fired plant before the end of its useful life. In many if not most cases, the lost generation capacity that occurs when a utility retires a coal unit is being replaced with natural gas, which is abundant and forecast to remain inexpensive compared with its historical trends. Greenhouse gas standards will accelerate this trend because natural gas meets the CO2 thresholds for new units while coal without carbon capture and storage does not.
The current low costs for natural gas are also precluding consideration of many other lower-carbon re-sources and technologies. This section looks at some of these technologies from a range of cost stand-points and the degree to which they provide CO2 emission reductions. Appendix A lists the technologies compiled for the current study, along with corresponding data for efficiency, fuel type, emissions, cost, and fuel resource availability. Figure 2 shows a plot of two of the most common comparison metrics for potential new technologies, the levelized-cost of electricity6 and the capital cost in dollars per kW.
5 The Kentucky Public Service Commission applies the principle of least-cost as a normal part of its approval processes. See Case No. 2009-00545, Application of Kentucky Power Company for Approval of Renewable Energy Purchase Agreement for Wind Energy Resources Between Kentucky Power Company and FPL Illinois Wind LLC., Order dated June 28, 2010, at Pages 5-10 and Case No. 2011-00375, Joint Application of Louisville Gas and Electric and Kentucky Utilities Company for a Certificate of Public Convenience and Necessity and Site Compatibility Certificate for the Construction of a Combined Cycle Combustion Turbine at the Cane Run Generating Station and the Purchase of Existing Simple Cycle Combustion Turbine Facilities From Bluegrass Gen-eration Company LLC in Lagrange, Kentucky, Order dated May 3, 2012 at Page 15. 6 The total cost to build and operate a given electricity generating unit per kilowatt-hour of electricity that would be generated over the lifetime of the system.
Figure 2: Levelized Costs and Overnight Capital Costs by Generating Technology
Page 6
Economic Challenges Facing Kentucky’s Electricity Generation Under Greenhouse Gas ConstraintsDecember 2013
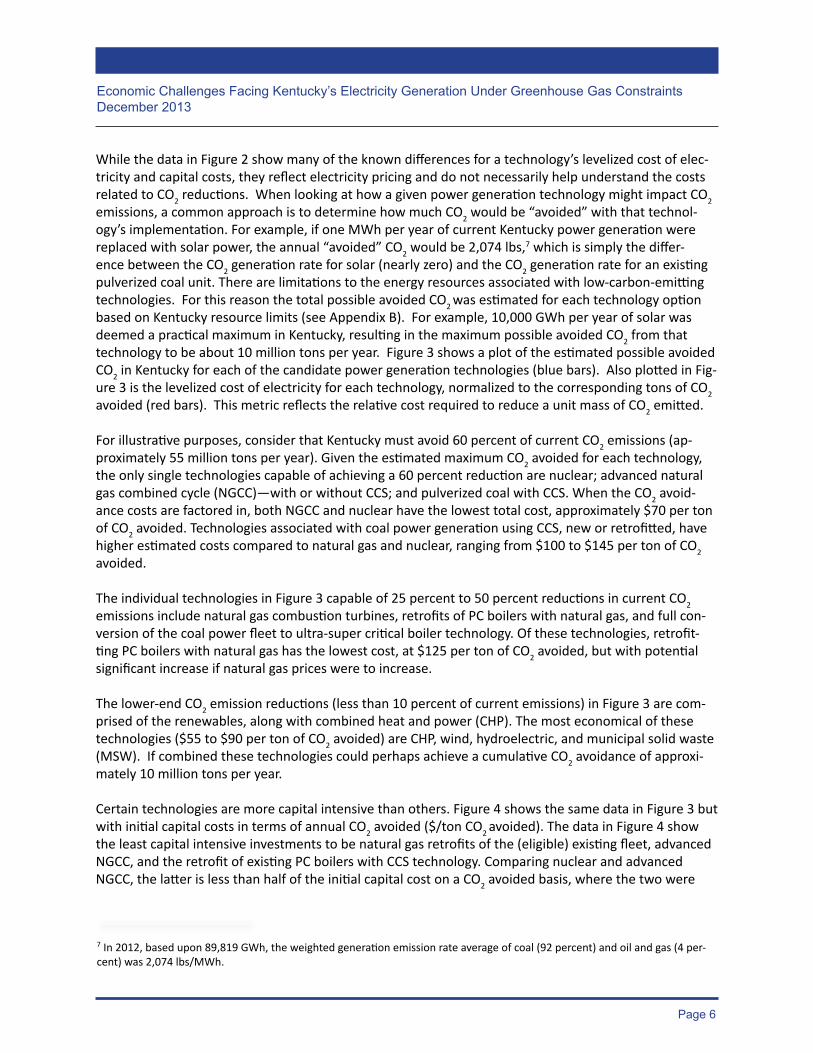
While the data in Figure 2 show many of the known differences for a technology’s levelized cost of elec-tricity and capital costs, they reflect electricity pricing and do not necessarily help understand the costs related to CO2 reductions. When looking at how a given power generation technology might impact CO2 emissions, a common approach is to determine how much CO2 would be “avoided” with that technol-ogy’s implementation. For example, if one MWh per year of current Kentucky power generation were replaced with solar power, the annual “avoided” CO2 would be 2,074 lbs,7 which is simply the differ-ence between the CO2 generation rate for solar (nearly zero) and the CO2 generation rate for an existing pulverized coal unit. There are limitations to the energy resources associated with low-carbon-emitting technologies. For this reason the total possible avoided CO2 was estimated for each technology option based on Kentucky resource limits (see Appendix B). For example, 10,000 GWh per year of solar was deemed a practical maximum in Kentucky, resulting in the maximum possible avoided CO2 from that technology to be about 10 million tons per year. Figure 3 shows a plot of the estimated possible avoided CO2 in Kentucky for each of the candidate power generation technologies (blue bars). Also plotted in Fig-ure 3 is the levelized cost of electricity for each technology, normalized to the corresponding tons of CO2 avoided (red bars). This metric reflects the relative cost required to reduce a unit mass of CO2 emitted.
For illustrative purposes, consider that Kentucky must avoid 60 percent of current CO2 emissions (ap-proximately 55 million tons per year). Given the estimated maximum CO2 avoided for each technology, the only single technologies capable of achieving a 60 percent reduction are nuclear; advanced natural gas combined cycle (NGCC)—with or without CCS; and pulverized coal with CCS. When the CO2 avoid-ance costs are factored in, both NGCC and nuclear have the lowest total cost, approximately $70 per ton of CO2 avoided. Technologies associated with coal power generation using CCS, new or retrofitted, have higher estimated costs compared to natural gas and nuclear, ranging from $100 to $145 per ton of CO2 avoided. The individual technologies in Figure 3 capable of 25 percent to 50 percent reductions in current CO2 emissions include natural gas combustion turbines, retrofits of PC boilers with natural gas, and full con-version of the coal power fleet to ultra-super critical boiler technology. Of these technologies, retrofit-ting PC boilers with natural gas has the lowest cost, at $125 per ton of CO2 avoided, but with potential significant increase if natural gas prices were to increase.
The lower-end CO2 emission reductions (less than 10 percent of current emissions) in Figure 3 are com-prised of the renewables, along with combined heat and power (CHP). The most economical of these technologies ($55 to $90 per ton of CO2 avoided) are CHP, wind, hydroelectric, and municipal solid waste (MSW). If combined these technologies could perhaps achieve a cumulative CO2 avoidance of approxi-mately 10 million tons per year.
Certain technologies are more capital intensive than others. Figure 4 shows the same data in Figure 3 but with initial capital costs in terms of annual CO2 avoided ($/ton CO2 avoided). The data in Figure 4 show the least capital intensive investments to be natural gas retrofits of the (eligible) existing fleet, advanced NGCC, and the retrofit of existing PC boilers with CCS technology. Comparing nuclear and advanced NGCC, the latter is less than half of the initial capital cost on a CO2 avoided basis, where the two were
7 In 2012, based upon 89,819 GWh, the weighted generation emission rate average of coal (92 percent) and oil and gas (4 per-cent) was 2,074 lbs/MWh.

Page 7
Economic Challenges Facing Kentucky’s Electricity Generation Under Greenhouse Gas ConstraintsDecember 2013
Figure 3: Carbon Dioxide Avoidance and Levelized Costs by Generating Technology
much closer based on the levelized costs in Figure 3. This could point out an important economic con-sideration in technology decisions, where upfront capital may be as important, if not more important, than levelized costs. Figures 2 through 4 also show that by itself, the new advanced coal-fired genera-tion technology might not remove a sufficient amount of CO2 depending on the future carbon reduction requirement imposed upon Kentucky, and it is expensive relative to other technology options. However, CCS technology can reduce CO2 emissions and when paired with lesser expensive, low-CO2 emitting tech-nologies, coal can be an option.
Figure 4: Carbon Dioxide Avoidance and Capital Costs by Generating Technology
Page 8
Economic Challenges Facing Kentucky’s Electricity Generation Under Greenhouse Gas ConstraintsDecember 2013
Several insights can be gained on how technologies vary as GHG reduction tools.
• Individual technologies capable of achieving a 60 percent CO2 reduction compared to Kentucky’s existing power generation fleet are limited to nuclear, advanced NGCC (with or without CCS), and pulverized coal with CCS. Of these technologies, at current prices for natural gas, NGCC has the lowest total cost, at $75 per ton of CO2 avoided, and a relatively lower upfront capital cost, but with potential price sensitivity to increasing natural gas costs. Nuclear technology is estimated to have a total cost similar to that of NGCC, but with higher upfront capital costs and potentially higher risks associated with permitting and adoption. Coal power generation with CCS has a higher estimated cost than the other two technologies, but could represent one of the lowest upfront capital cost options if current coal power capacity were retrofitted.
• Retrofitting PC boilers with natural gas could achieve intermediate reductions of up to 30 million tons of CO2 per year for Kentucky (one-third of current total emissions), assuming the “eligible” PC units listed in Appendix B. This option has an estimated levelized cost of $125 per ton of CO2 avoided, but could significantly increase with rising natural gas prices. However, PC boiler retrofits could be achieved for much smaller initial capital investments compared to other technologies, and may allow for conversion back to coal firing if other abatement technologies were brought on line in the future.
• Individual renewable power generation technologies and combined heat and power have more limited ability to reduce Kentucky’s CO2 emissions due to the general limitations of the corre-sponding resources. However, combinations of the most viable of these technologies (CHP, wind, hydroelectric and MSW) could potentially achieve a cumulative CO2 avoidance of 10 million tons per year (one-tenth of current total emissions), and an average levelized cost of $50 to $90 per ton of CO2 avoided.
NSR/PSD Barriers to Technology Adoption
One purpose of this study was to investigate the potential for coal to maintain a substantial role in the production of electricity in Kentucky. This could be accomplished by improving boiler and turbine ef-ficiency, through replacements or new green field construction of coal-fired capacity. The study team met with each of Kentucky’s major electric generating utilities to discuss these issues in the context of environmental compliance. A barrier for utilities to engage in any significant efficiency or technology up-grade has been the EPA’s enforcement of the New Source Review/Prevention of Significant Deterioration (NSR/PSD) rules.8 However, general comments from the utilities indicated that in the current economic and regulatory environment, most utility companies would choose to build an entirely new unit rather than invest in upgrades that would substantially improve boiler efficiency. This is made evident by many utilities’ current actions to comply with existing environmental rules by retiring current coal-fired genera-tion and building new natural gas capacity to maintain the lowest cost portfolio. Even if the EPA were to ease NSR/PSD requirements, with the looming prospect of CO2 regulation, it is not clear whether that would be sufficient to encourage boiler efficiency upgrades. However, the NSR/PSD rules are a barrier to this type of upgrade.
8 http://www.epa.gov/NSR/psd.html

Page 9
Economic Challenges Facing Kentucky’s Electricity Generation Under Greenhouse Gas ConstraintsDecember 2013
Risk Exposure
Economic projections for generation technologies are useful, but they do not tell a complete story. Risks—economic, social, and technological—are also factors in whether a given technology is adopted, or the degree to which it is adopted on a large scale. For illustrative purposes, Table 1 shows a risk com-parison for three of the technologies discussed above: Nuclear, CCS retrofits, and NGCC. The risk scenar-ios are ranked through an index that combines both probability and impact to CO2 emissions reductions. Risk Category I reflects the greatest risk and Category III the least.
The risk comparison is not intended to provide a measure of absolute risk. Rather, it allows a relative ranking of the dominant risk factors associated with a particular technology, normalized across the identified options. While the exact placement of a risk scenario in a given category may be refined with further analyses, the general takeaway from the comparison is that there are significant, different risk elements associated with a given technology. For example, the readiness of small modular (nuclear) reactors (SMRs) as a viable option surfaces as a major risk consideration, along with cost and financing risks for nuclear in general. Liability protection concerns are a major risk consideration for CCS, and po-tential future price volatility is a major risk factor for natural gas. Some of these risks could be mitigated through policy actions, such as lifting the ban on nuclear power in Kentucky.
High natural gas prices also pose risk, as shown in Figure 3. Current EIA reference case natural gas price projections favor advanced NGCC with or without CCS as having cost advantages over both coal and nu-clear technology. Even though nuclear has similar costs in terms of CO2 avoided, its much higher upfront capital costs and higher permitting risks take it out of consideration in the immediate future. Figure 2 also shows the cost differentials when natural gas prices are doubled. With gas prices doubled, pulver-ized coal technologies with CCS become cost competitive in terms of CO2 avoided; however, the upfront capital costs for pulverized coal with CCS still favor natural gas.
Figure 5 depicts the Energy Information Administration (EIA) natural gas price forecasts since 1979 and illustrates that a reliance on stable predictable natural gas prices as the basis for a major shift in generation technology is not without risk. The dark dotted line depicts the actual historical prices and the multiple colored lines represent
the various annual EIA gas price forecasts. As can be seen, natural gas prices have proved difficult to forecast. The graph also illustrates the extent of recent gas price volatility and the risks to Kentucky of converting a large percentage of its electric generation fleet to natural gas if the U.S. returns to the high gas prices of the recent past.
Although this study did not attempt to quantify the impact of these risks, the breadth of risks emphasiz-es the benefits of a balanced power generation portfolio, as opposed to reliance on a single technology or fuel option.
... the breadth of risks emphasizes the bene-fits of a balanced power generation portfolio, as opposed to reliance on a single technology or fuel option.

Page 10
Economic Challenges Facing Kentucky’s Electricity Generation Under Greenhouse Gas ConstraintsDecember 2013
Table 1: Preliminary risk scenario comparison for nuclear, CCS (retrofit), and natural gas power generation. Risk categorization based on the likelihood of the scenario and its relative impact.
Risk Category* Nuclear CCS (Retrofit) Natural Gas
I
Cost advantage of mass manufacturing (SMRs) not realized.
Financing issues encountered with heavy upfront capital costs.
Construction cost/ schedule overruns.
Inadequate liability protection for CO2 storage sites.
Cannot deploy CCS to scale.
Future prices of natural gas could escalate by more than 2 times current rates.
II
Unable to lift current Kentucky ban on nuclear.
Significant delays in (SMR) technology commercialization beyond 2020.
Adoption of nuclear slower than anticipated due to lack of current Kentucky infrastructure.
Major CO2 release or seismic event from CCS site (anywhere) impacts overall industry.
Timeline for commercial viability of CCS delayed.
Financing issues encountered with heavy upfront capital costs.
Grid security compromised due to dependency on limited pipeline capacity.
Financing issues encountered with heavy upfront capital costs if CCS required.
III
Major/visible nuclear disaster impacts overall nuclear market.
No progress on national policy for nuclear waste disposal.
Licensing delays. Future in-state
nuclear accident/ incident.
Inadequate geologic storage capacity for CO2 in Kentucky.
Adoption of CCS limited due to lack of public acceptance.
Capital costs much higher than currently anticipated.
Overall permitting timeline delays implementation.
Grid stability issues encountered due to supply issues with natural gas - no buffer.
Regulatory constraints on production.
* Category I – Potentially unacceptable risk that requires mitigation action, such as legislation. Category II – Significant risks but lower priority than Category I for mitigation measures. Category III – Lower risks, in terms of priority for mitigation investment.

Page 11
Economic Challenges Facing Kentucky’s Electricity Generation Under Greenhouse Gas ConstraintsDecember 2013
Figure 5: EIA Natural Gas Price Forecasts vs. Observed Natural Gas Prices

Page 12
Economic Challenges Facing Kentucky’s Electricity Generation Under Greenhouse Gas ConstraintsDecember 2013
STUDY APPROACH AND RESULTS
The previous section identifies existing and future power technologies that could be employed to reduce CO2 emissions. A more complex forecasting tool is required to assess specific assumed policy actions and the resulting impacts over time. For this study, an electric generation dispatch model was added to the EEC’s existing energy forecasting models to evaluate how potential technology improvements could be made to the generation fleet and how the fleet would evolve over time. The model uses a constrained optimization algorithm to find the least-cost electricity generation portfolio that complies with all envi-ronmental regulations, including specified GHG emission constraints. The analysis incorporates all gen-eration capacity across the state as a hypothetical single fleet and considers compliance strategies over time on a unit-by-unit basis considering three different federally imposed CO2 emission limit regimes or constraints. Four possible responses Kentucky could take to meet the various assumed federal emission constraints were also considered.
The model dispatches all electricity generation units across the state on a constrained least-cost basis while satisfying demand and environmental requirements for electricity in a given year. The ultimate goals are (1) to understand the impact of different federal CO2 policies, and (2) to explore how various Kentucky-specific compliance strategies affect CO2 emissions, electricity prices, and employment.
Federal Policy Options At this time, it can only be surmised how EPA will regulate GHG emissions from modified, reconstructed, and existing power plants. Therefore, the study considered three possible frameworks for regulations: a carbon tax, a rate emissions standard, and a mass emissions standard. For purposes of the study, we used emissions limits that correspond to President Obama’s U.S. goals: a reduction in CO2 of 17 percent by 2020 compared to 2005 levels and a reduction of 80 percent by 2050. The reduction levels in inter-vening years are simply a linear interpolation between 2020 and 2050.
The carbon tax is a dollar amount levied on every ton of CO2 emitted. Three different sets of carbon taxes were evaluated: $10 in 2020 to $20 in 2040; $20 in 2020 to $40 in 2040; and $40 in 2020 to $60 in 2040.
The rate emission analysis takes the form of a statewide fleet annual average, where the actual state limit is the weighted average of coal-, gas-, and oil-fired generation emissions from a 2005 (per the President’s goals) baseline. The first rate regime takes effect in two periods: 1,472 lbs/MWh by 2020 to 1,189 lbs/MWh by 2025, a lesser standard that does not achieve the assumed targets based on the President’s goals. The second rate regime is designed to achieve the President’s CO2 emission goals of 17 percent by 2020 and extending to 80 percent by 2050 and takes effect in two periods: 1,655 lbs/MWh by 2020 to 330 lbs/MWh by 2050.
The mass emission analysis follows the assumed targets by initially requiring a 17 percent reduction in CO2 levels by 2020 extending to an 80 percent reduction by 2050. The limit is based upon a percent-age reduction from the statewide emissions levels during the 2005 baseline period. The premise of this constraint is that once emission limits are set for any given period, the state can employ any generation technology available over time, as long as state emission limits are not breached. The constraint requires a 17 percent reduction from the baseline period by 2020 and a 30 percent reduction by 2030.

Page 13
Economic Challenges Facing Kentucky’s Electricity Generation Under Greenhouse Gas ConstraintsDecember 2013
Kentucky-Specific Response/Modeled Policy Options
The study simulated four possible policy responses Kentucky could take to meet the various assumed federal emission constraints considered.
First, a business as usual (BAU) response is simulated. Here, the model assumes no changes are made to Kentucky’s energy regulatory framework. The model assumes compliance with existing environmental rules as well as compliance with EPA’s rule that limits GHG emissions from new fossil fuel power plants. The BAU case sets the benchmark by which the other three portfolios are evaluated using each of the federal GHG constraints described above. EPA regulations already in place have set utility planning and investment compliance actions in motion. As a result, certain older coal-fired generation units in Kentucky have either been retired or are slated to be retired by 2016. New additional natural gas-fired generation capacity is either being constructed or being considered as replacement for many of the retired units. As existing units are retired, all new fossil generation will adhere to the new proposed CO2 emission limits. For the second response (Flexible Portfolio), the BAU assumptions are relaxed to simulate elimination of the state’s ban on nuclear power. No other federal or state mandate is changed. The model builds the optimal least-cost generation portfolio based on price, with all fuels available with no additional con-straints. In the third response (Balanced Portfolio), the BAU assumptions are relaxed to eliminate the state’s ban on nuclear power and to place a limit on any type of generation source within the portfolio to simulate a more diversified energy mix. In the modeled optimal least-cost portfolio, no single resource (coal, gas, wind, solar, etc.) generates more than 60 percent of total electricity (MWh) in a given year.
In the final response (Coal Portfolio), the BAU assumptions are relaxed to eliminate the state’s ban on nuclear power and, to understand how coal could remain a part of Kentucky’s electricity mix despite carbon regulation, the model is required to meet a certain percentage of demand with coal. The optimal least-cost portfolio must be structured such that at least 40 percent of the electricity (MWh) is generated from coal in a given year. The model first complies with federal environmental rules and then attempts to meet the 40 percent generation requirement. However, in some years, given certain federal carbon policies being modeled, the 40 percent requirement cannot be met. Simulation Results
The full simulation results are in Appendix C. A Scenario Matrix is provided for quick reference of each Policy/Portfolio simulation. Following the Scenario Matrix, a series of snapshot estimation results ma-trices are provided for the years 2025, 2035, and 2050 covering employment, Kentucky gross domestic product (GDP), electricity prices, a variety of emissions including CO2, coal consumption, and percent coal-fired electricity generation. Each of the scenarios is summarized using graphs that depict changes to the metrics listed above over time. Finally, a description of the model itself and assumptions are provided. Twenty-eight scenarios were simulated based on the EIA’s reference case natural gas price. An additional 28 scenarios were simulated based on EIA’s low oil and gas recovery case that led to high natural gas price forecasts. The following are several key findings derived from the simulations.
Page 14
Economic Challenges Facing Kentucky’s Electricity Generation Under Greenhouse Gas ConstraintsDecember 2013
Kentucky’s energy mix is changing even without new regulations on greenhouse gases. Environmental regula-tions unrelated to GHGs coupled with low natural gas price are already forcing retirements of existing coal ca-pacity. Even without new rules limiting GHG emissions,
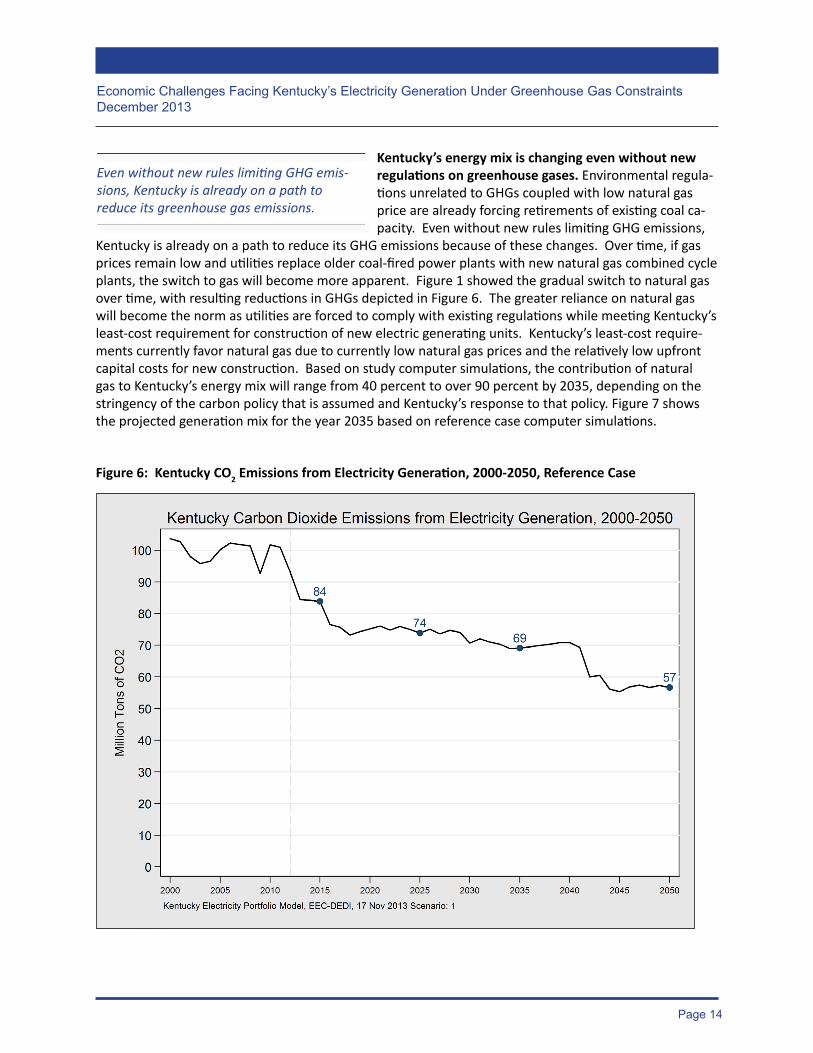
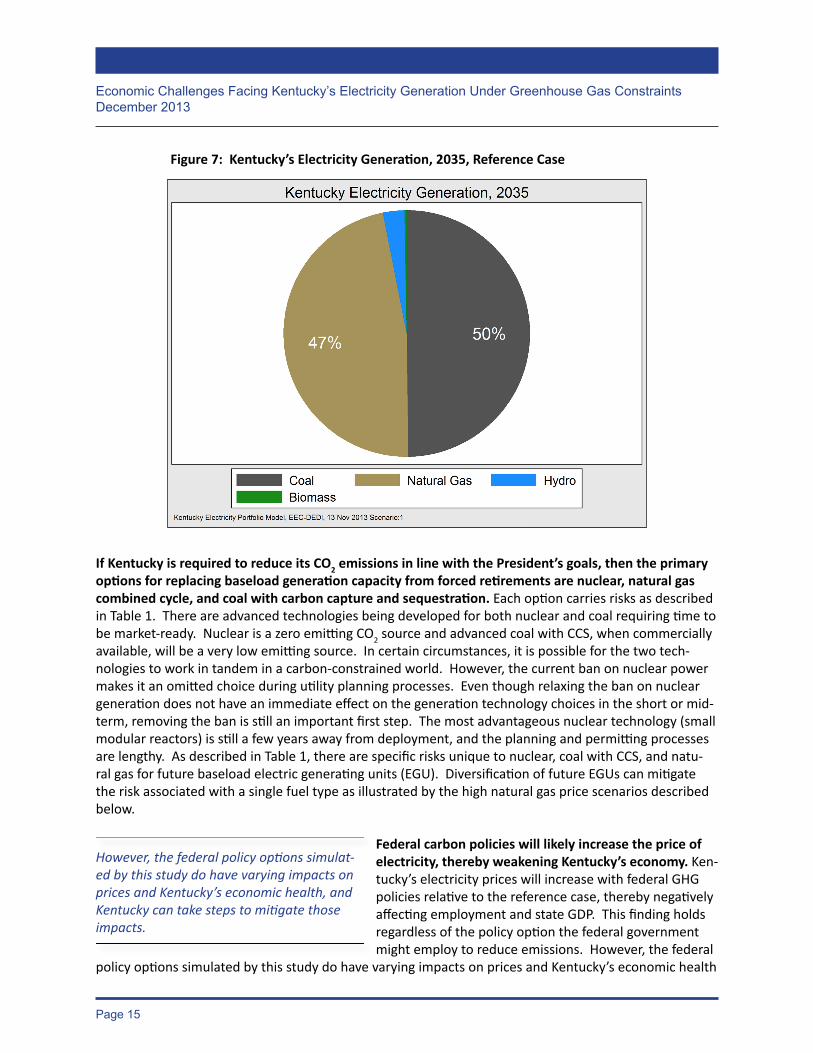
Kentucky is already on a path to reduce its GHG emissions because of these changes. Over time, if gas prices remain low and utilities replace older coal-fired power plants with new natural gas combined cycle plants, the switch to gas will become more apparent. Figure 1 showed the gradual switch to natural gas over time, with resulting reductions in GHGs depicted in Figure 6. The greater reliance on natural gas will become the norm as utilities are forced to comply with existing regulations while meeting Kentucky’s least-cost requirement for construction of new electric generating units. Kentucky’s least-cost require-ments currently favor natural gas due to currently low natural gas prices and the relatively low upfront capital costs for new construction. Based on study computer simulations, the contribution of natural gas to Kentucky’s energy mix will range from 40 percent to over 90 percent by 2035, depending on the stringency of the carbon policy that is assumed and Kentucky’s response to that policy. Figure 7 shows the projected generation mix for the year 2035 based on reference case computer simulations.
Figure 6: Kentucky CO2 Emissions from Electricity Generation, 2000-2050, Reference Case
Even without new rules limiting GHG emis-sions, Kentucky is already on a path to reduce its greenhouse gas emissions.
Page 15
Economic Challenges Facing Kentucky’s Electricity Generation Under Greenhouse Gas ConstraintsDecember 2013
Figure 7: Kentucky’s Electricity Generation, 2035, Reference Case
If Kentucky is required to reduce its CO2 emissions in line with the President’s goals, then the primary options for replacing baseload generation capacity from forced retirements are nuclear, natural gas combined cycle, and coal with carbon capture and sequestration. Each option carries risks as described in Table 1. There are advanced technologies being developed for both nuclear and coal requiring time to be market-ready. Nuclear is a zero emitting CO2 source and advanced coal with CCS, when commercially available, will be a very low emitting source. In certain circumstances, it is possible for the two tech-nologies to work in tandem in a carbon-constrained world. However, the current ban on nuclear power makes it an omitted choice during utility planning processes. Even though relaxing the ban on nuclear generation does not have an immediate effect on the generation technology choices in the short or mid-term, removing the ban is still an important first step. The most advantageous nuclear technology (small modular reactors) is still a few years away from deployment, and the planning and permitting processes are lengthy. As described in Table 1, there are specific risks unique to nuclear, coal with CCS, and natu-ral gas for future baseload electric generating units (EGU). Diversification of future EGUs can mitigate the risk associated with a single fuel type as illustrated by the high natural gas price scenarios described below.
Federal carbon policies will likely increase the price of electricity, thereby weakening Kentucky’s economy. Ken-tucky’s electricity prices will increase with federal GHG policies relative to the reference case, thereby negatively affecting employment and state GDP. This finding holds regardless of the policy option the federal government might employ to reduce emissions. However, the federal
policy options simulated by this study do have varying impacts on prices and Kentucky’s economic health
However, the federal policy options simulat-ed by this study do have varying impacts on prices and Kentucky’s economic health, and Kentucky can take steps to mitigate those impacts.
Page 16
Economic Challenges Facing Kentucky’s Electricity Generation Under Greenhouse Gas ConstraintsDecember 2013
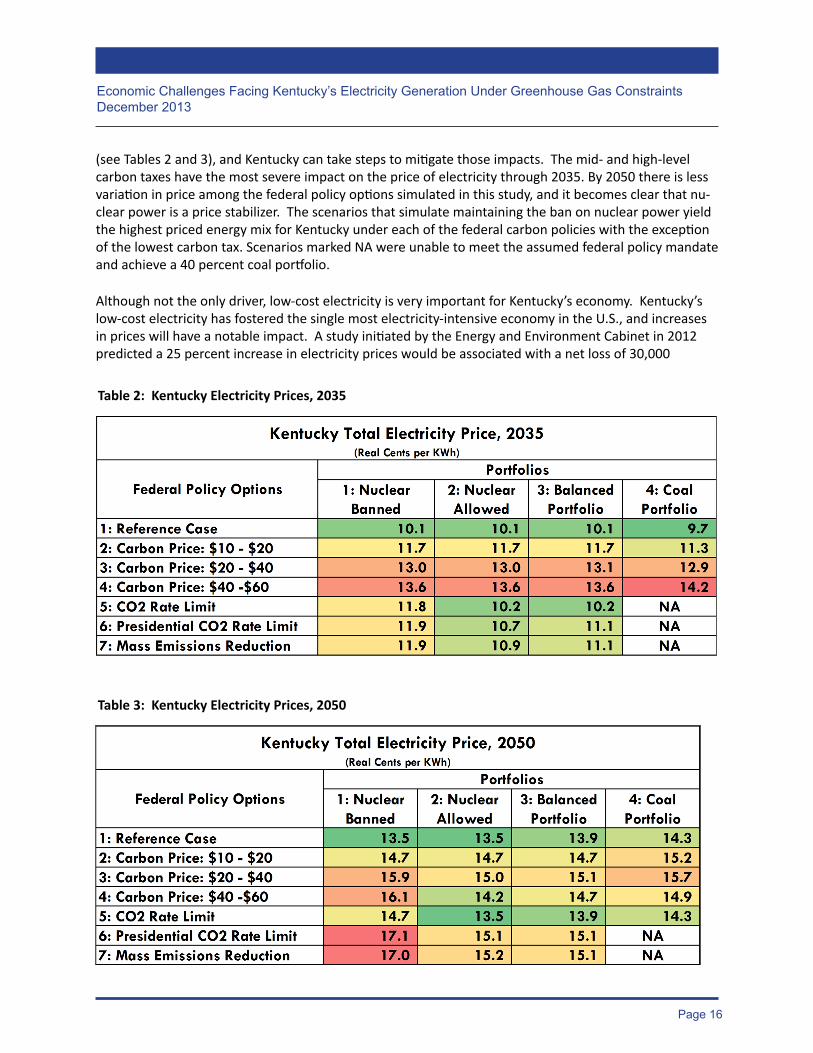
Table 2: Kentucky Electricity Prices, 2035
Table 3: Kentucky Electricity Prices, 2050
Although not the only driver, low-cost electricity is very important for Kentucky’s economy. Kentucky’s low-cost electricity has fostered the single most electricity-intensive economy in the U.S., and increases in prices will have a notable impact. A study initiated by the Energy and Environment Cabinet in 2012 predicted a 25 percent increase in electricity prices would be associated with a net loss of 30,000
(see Tables 2 and 3), and Kentucky can take steps to mitigate those impacts. The mid- and high-level carbon taxes have the most severe impact on the price of electricity through 2035. By 2050 there is less variation in price among the federal policy options simulated in this study, and it becomes clear that nu-clear power is a price stabilizer. The scenarios that simulate maintaining the ban on nuclear power yield the highest priced energy mix for Kentucky under each of the federal carbon policies with the exception of the lowest carbon tax. Scenarios marked NA were unable to meet the assumed federal policy mandate and achieve a 40 percent coal portfolio.
Page 17
Economic Challenges Facing Kentucky’s Electricity Generation Under Greenhouse Gas ConstraintsDecember 2013
9 Kentucky Energy and Environment Cabinet. (2012). The Vulnerability of Kentucky’s Manufacturing Economy to Increasing Elec-tricity Prices. Department for Energy Development and Independence, Frankfort. http://energy.ky.gov/Programs/Documents/Vulnerability%20of%20Kentucky’s%20Manufacturing%20Economy.pdf
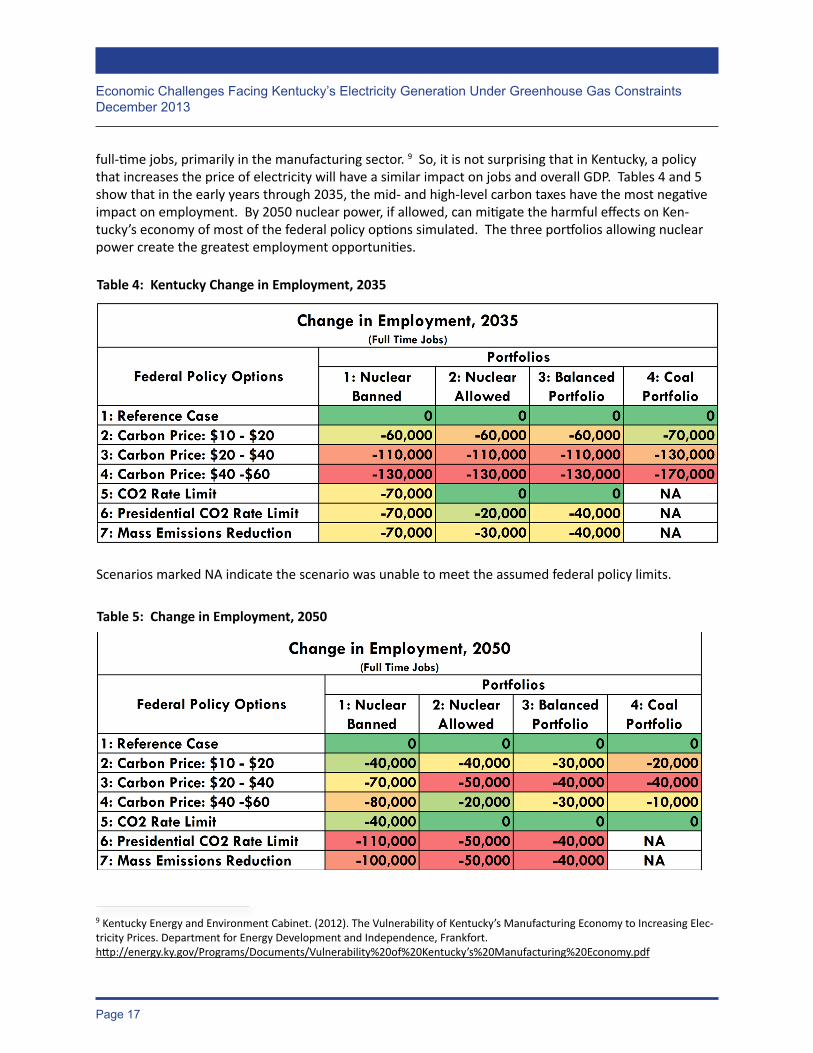
Table 4: Kentucky Change in Employment, 2035
Scenarios marked NA indicate the scenario was unable to meet the assumed federal policy limits.
full-time jobs, primarily in the manufacturing sector. 9 So, it is not surprising that in Kentucky, a policy that increases the price of electricity will have a similar impact on jobs and overall GDP. Tables 4 and 5 show that in the early years through 2035, the mid- and high-level carbon taxes have the most negative impact on employment. By 2050 nuclear power, if allowed, can mitigate the harmful effects on Ken-tucky’s economy of most of the federal policy options simulated. The three portfolios allowing nuclear power create the greatest employment opportunities.
Table 5: Change in Employment, 2050

Page 18
Economic Challenges Facing Kentucky’s Electricity Generation Under Greenhouse Gas ConstraintsDecember 2013
A federal carbon tax would likely have the most extreme impact on Kentucky. The lowest carbon tax slightly reduces carbon emissions by increasing the cost of electricity from carbon-emitting resources. This reduces the overall demand for electricity in each of the sec-tors—residential, commercial, and industrial—as com-
pared to the reference case, as shown in Figure 8. The lowest carbon tax is not high enough to cause a significant shift in Kentucky’s energy mix relative to the reference case; it simply taxes the consumer of carbon-emitting electricity who responds by consuming less electricity. By 2035, the employment loss is similar across all portfolios ranging from approximately 60,000 to 70,000 fewer potential jobs relative to the reference case. Electricity price increases range from about 0.5 to 1.6 cents/kwh greater than in the reference case across the portfolios. By 2025 the low carbon tax can force enough reduction in CO2 emissions to meet the assumed targets, but by 2050 the low carbon tax falls short of the target and only reduces about 1.6 million tons more CO2 emissions than the reference case.
Figure 8: Kentucky Electricity Consumption, 1960-2050, Low Carbon Price - Reference Case Comparison
By 2035, the employment loss is similar across all portfolios ranging from approxi-mately 60,000 to 70,000 fewer potential jobs relative to the reference case.
Page 19
Economic Challenges Facing Kentucky’s Electricity Generation Under Greenhouse Gas ConstraintsDecember 2013
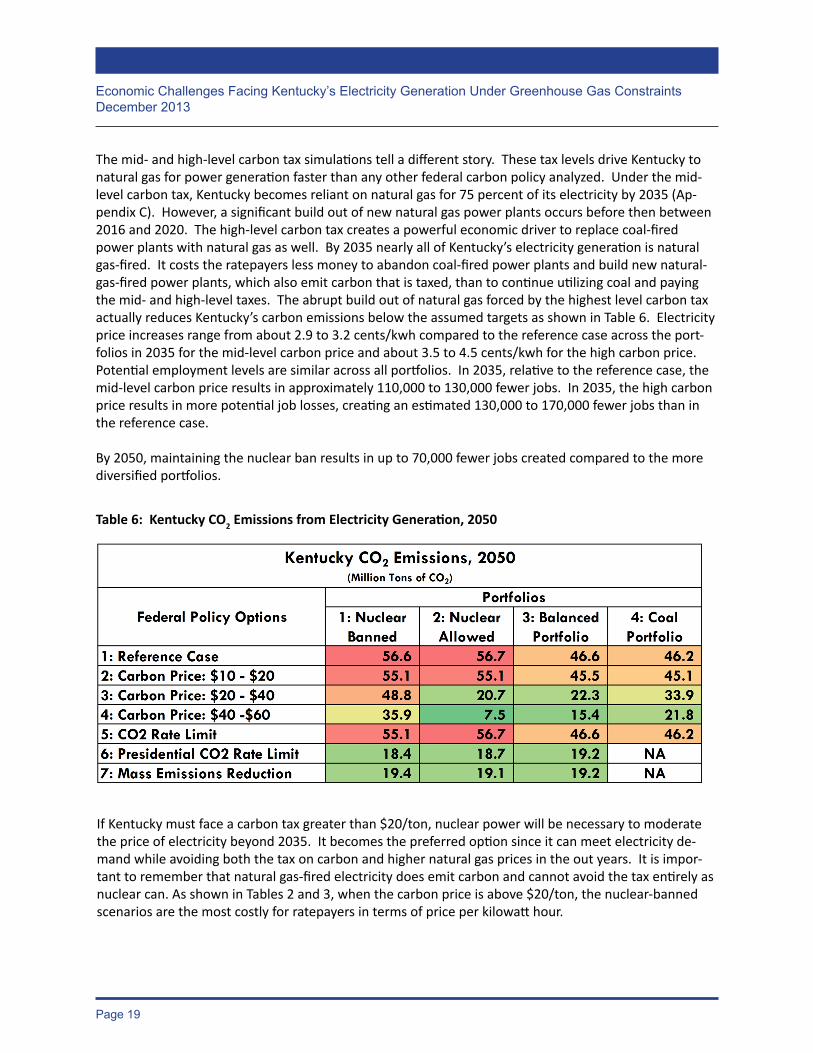
The mid- and high-level carbon tax simulations tell a different story. These tax levels drive Kentucky to natural gas for power generation faster than any other federal carbon policy analyzed. Under the mid-level carbon tax, Kentucky becomes reliant on natural gas for 75 percent of its electricity by 2035 (Ap-pendix C). However, a significant build out of new natural gas power plants occurs before then between 2016 and 2020. The high-level carbon tax creates a powerful economic driver to replace coal-fired power plants with natural gas as well. By 2035 nearly all of Kentucky’s electricity generation is natural gas-fired. It costs the ratepayers less money to abandon coal-fired power plants and build new natural-gas-fired power plants, which also emit carbon that is taxed, than to continue utilizing coal and paying the mid- and high-level taxes. The abrupt build out of natural gas forced by the highest level carbon tax actually reduces Kentucky’s carbon emissions below the assumed targets as shown in Table 6. Electricity price increases range from about 2.9 to 3.2 cents/kwh compared to the reference case across the port-folios in 2035 for the mid-level carbon price and about 3.5 to 4.5 cents/kwh for the high carbon price. Potential employment levels are similar across all portfolios. In 2035, relative to the reference case, the mid-level carbon price results in approximately 110,000 to 130,000 fewer jobs. In 2035, the high carbon price results in more potential job losses, creating an estimated 130,000 to 170,000 fewer jobs than in the reference case.
By 2050, maintaining the nuclear ban results in up to 70,000 fewer jobs created compared to the more diversified portfolios.
Table 6: Kentucky CO2 Emissions from Electricity Generation, 2050
If Kentucky must face a carbon tax greater than $20/ton, nuclear power will be necessary to moderate the price of electricity beyond 2035. It becomes the preferred option since it can meet electricity de-mand while avoiding both the tax on carbon and higher natural gas prices in the out years. It is impor-tant to remember that natural gas-fired electricity does emit carbon and cannot avoid the tax entirely as nuclear can. As shown in Tables 2 and 3, when the carbon price is above $20/ton, the nuclear-banned scenarios are the most costly for ratepayers in terms of price per kilowatt hour.

Page 20
Economic Challenges Facing Kentucky’s Electricity Generation Under Greenhouse Gas ConstraintsDecember 2013
All three carbon tax levels simulated increase the price of electricity and reduce employment relative to the reference case, regardless of the response Kentucky takes to mitigate the impact of the taxes. Tables 2 through 5 demonstrate the carbon tax levels’ worsening impact on price and employment.
By relying on new generating capacity that emits zero carbon emissions such as nuclear power, Ken-tucky can meet carbon regulations while still relying on coal for some of its electricity generation mix. However, the most coal could contribute to Kentucky’s electricity mix under the assumed targets by 2050 would be no more than 40 percent. The impact of maintaining coal in the generation portfolio, assuming the cost inputs described in Appendix A, varies depending on the federal policy option being simulated. In the near term, the coal portfolio is most expensive under a carbon tax option. In 2035, the coal port-folio does not satisfy the federal CO2 limit analyzed.
Rate and mass emission limit regimes produce similar results under flexible statewide compliance portfolios. The EEC’s GHG whitepaper demonstrated how a rigid emissions rate limit, as proposed by the Natural Re-sources Defense Council (NRDC), would be detrimental to Kentucky, especially if credit were not given for emissions reductions already underway. A rigid rate limit as pro-posed by NRDC removes compliance flexibility and, more importantly, would not achieve emissions reductions in
line with assumed federal reduction goals beyond 2025; CO2 emissions would continue to grow, track-ing growth in the state economy. Since, Kentucky’s generation fleet is currently undergoing a shift away from coal-fired EGUs to gas-fired EGUs, the whitepaper advocated for a mass emissions limit. Under this regulatory regime, the state would have the necessary flexibility to take full credit for the CO2 emission reductions that were going to result from the ongoing transformation of Kentucky’s generation fleet. Furthermore, in this study, we did not consider any avoided GHG reductions via energy efficiency, carbon offsets, etc.
This study attempted to compare specific state responses to different federal CO2 regulatory regimes. Applying emission rate limits to specific EGUs would mean shutting down the coal units as soon as limits became effective. Advanced coal combustion, CCS and advanced nuclear technologies are not mature, and additional time is needed for these technologies to be proven and implemented. Therefore, the rate limit was modeled two ways: first, a rate limit structure similar to NRDC’s and second, a rate limit spe-cifically designed to track the mass emissions corresponding to the assumed targets of the President’s goals. The rate limit, as well as the mass emission limit, was applied to the state’s entire generation fleet. As expected, the NRDC structured rate limit failed to produce the requisite CO2 reduction levels beyond 2025, and employment and price levels were similar to the reference case results. The latter rate limit regime and the mass emission regime produced very similar results. By design, CO2 limits were achieved with very similar results for employment and price level changes. Also, as expected, allowing flexibility in the generation portfolio had a beneficial effect on the economy over time by allowing more jobs to be created with lower electricity prices.
A rigid rate limit as proposed by NRDC removes compliance flexibility and, more importantly, would not achieve emissions reductions in line with assumed federal reduction goals beyond 2025; CO2 emissions would continue to grow, tracking growth in the state economy.
Page 21
Economic Challenges Facing Kentucky’s Electricity Generation Under Greenhouse Gas ConstraintsDecember 2013
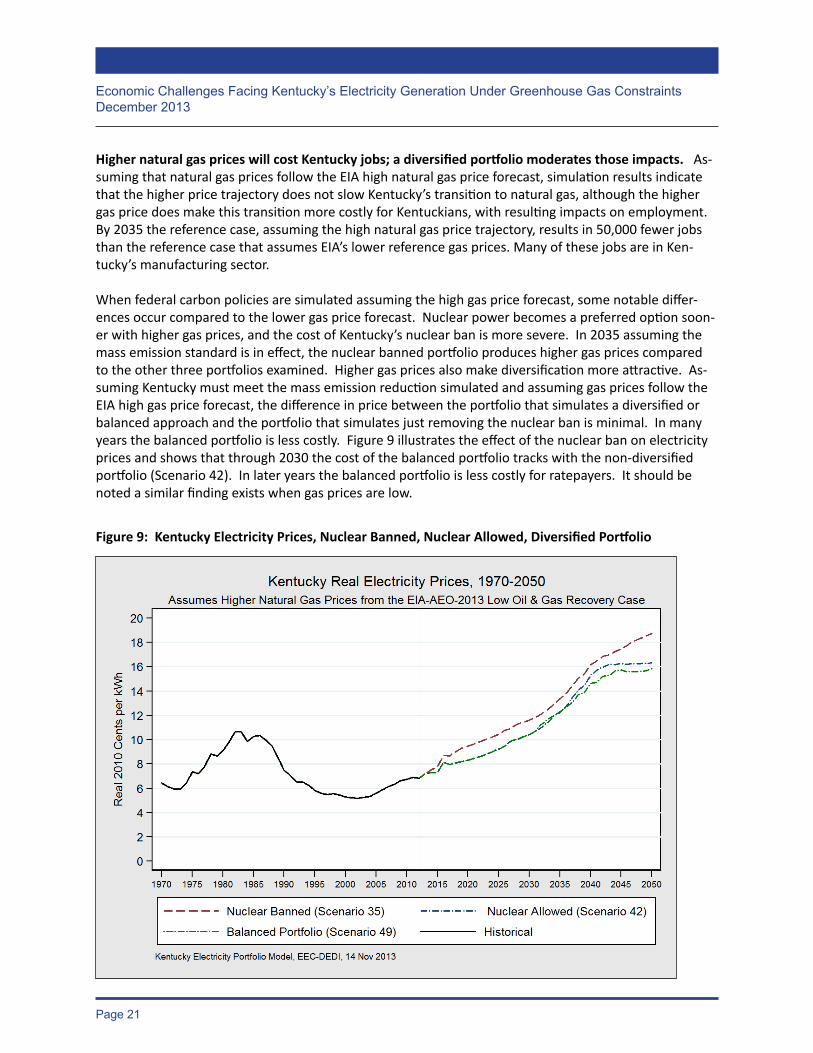
Figure 9: Kentucky Electricity Prices, Nuclear Banned, Nuclear Allowed, Diversified Portfolio
Higher natural gas prices will cost Kentucky jobs; a diversified portfolio moderates those impacts. As-suming that natural gas prices follow the EIA high natural gas price forecast, simulation results indicate that the higher price trajectory does not slow Kentucky’s transition to natural gas, although the higher gas price does make this transition more costly for Kentuckians, with resulting impacts on employment. By 2035 the reference case, assuming the high natural gas price trajectory, results in 50,000 fewer jobs than the reference case that assumes EIA’s lower reference gas prices. Many of these jobs are in Ken-tucky’s manufacturing sector.
When federal carbon policies are simulated assuming the high gas price forecast, some notable differ-ences occur compared to the lower gas price forecast. Nuclear power becomes a preferred option soon-er with higher gas prices, and the cost of Kentucky’s nuclear ban is more severe. In 2035 assuming the mass emission standard is in effect, the nuclear banned portfolio produces higher gas prices compared to the other three portfolios examined. Higher gas prices also make diversification more attractive. As-suming Kentucky must meet the mass emission reduction simulated and assuming gas prices follow the EIA high gas price forecast, the difference in price between the portfolio that simulates a diversified or balanced approach and the portfolio that simulates just removing the nuclear ban is minimal. In many years the balanced portfolio is less costly. Figure 9 illustrates the effect of the nuclear ban on electricity prices and shows that through 2030 the cost of the balanced portfolio tracks with the non-diversified portfolio (Scenario 42). In later years the balanced portfolio is less costly for ratepayers. It should be noted a similar finding exists when gas prices are low.

Page 22
Economic Challenges Facing Kentucky’s Electricity Generation Under Greenhouse Gas ConstraintsDecember 2013
RECOMMENDATIONS Given the uncertainty regarding EPA’s rules for existing EGUs, states must think about potential eco-nomic impacts and consider potential actions to respond. In this paper, we have considered several impacts and diverse mitigation responses for Kentucky. The timing and details that will result from EPA’s proposed regulations when they are issued in June 2014 will undoubtedly affect reactions and responses from individual states, which will be very different and suggest that contingency planning is crucial. Certainly, our thinking and planning will evolve. But based on our current understanding, several recom-mendations relative to Kentucky’s EGU fleet follow.
1. Kentucky must continue to advocate for and find ways to maintain low-priced electricity. If low relative rates are not maintained, there will be reduced employment opportunities for Kentuck-ians, especially in the manufacturing sector.
2. As described in Table 1, there are specific risks unique to nuclear, coal with CCS, and natural gas for future baseload electric generating units, and, for the most part, these risks do not over-lap. Because of these unique risks and since it is impossible to determine which risk factors may ultimately dominate, it is imperative that Kentucky policy makers ensure that there is the
flexibility necessary to diversify Kentucky’s future EGU fleet. Kentucky’s strict requirement that new electric generating facilities be least cost coupled with the cur-rent low price of natural gas strongly favors natural gas as the preferred fuel for future baseload EGU. However, policy makers may want to modify the existing least-cost
framework to prevent Kentucky from relying on natural gas for all new generation capacity as Kentucky’s existing power plant fleet is modified to comply with GHG regulations. It is impor-tant to note that an alternative EGU technology that is not least cost to build and operate today may shelter rate payers from risk and may prove to be a least-cost resource in the future. The avoided risks of alternative EGUs may be well worth the expected added upfront cost to the ratepayers, but strict interpretation of Kentucky’s least-cost requirement for construction of new EGUs will stymie Kentucky’s efforts to diversify its future EGU fleet.
3. To maintain coal as a viable fuel for electricity generation, policies should be considered to en-courage transition to more efficient coal generation technologies in a timely manner. Further, consideration should be given to relaxing the NSR/PSD rule that stymies serious consideration of coal generation efficiency upgrades at existing power plants. Research should continue to address those risks associated with CCS described in Table 1 to bring down the cost of the tech-nology and remove barriers to its implementation.
4. The existing statutory provision in KRS 278.605, which effectively bans the construction of nuclear power plants in Kentucky, should be repealed so that utilities have the option to con-sider developing nuclear power generation in their planning processes. Nuclear power is a zero carbon emitting resource that can enable Kentucky to meet GHG reduction requirements while still utilizing coal, and it can stabilize electricity prices in the long term. By moderating the in-crease in electricity price, nuclear power can protect jobs in a carbon-constrained world. Many
... it is imperative that Kentucky policy makers ensure that there is the flexibility necessary to diversify Kentucky’s future EGU fleet.
Page 23
Economic Challenges Facing Kentucky’s Electricity Generation Under Greenhouse Gas ConstraintsDecember 2013
of the scenarios show nuclear power edged out by low-cost natural gas in the earlier years. However, development of nuclear power has a lengthy lead time and removing the ban can enable it to be a part of the planning process. Furthermore, the risk of a sudden shift to higher future natural gas prices may warrant the construction of nuclear power plants sooner.
5. Kentucky is already on the path to reduce its carbon emissions as a result of combined mar-ket and regulatory forces. Any federal policy that requires further carbon emission reduction should allow Kentucky to use reductions already realized or expected because of power plant
retirements and existing programs in its compliance plan. Further, Kentucky should be given flexibility in how it meets the target so that coal can remain in the energy mix. A mass-emission reduction strategy as compared to a rate-based or carbon tax strategy will provide Kentucky greater flexibility in minimizing the impact on ratepayers and its existing coal fleet.
6. If Kentucky is afforded the responsibility to manage the GHG emissions on a statewide basis, ratepayers will benefit if utilities operating in Kentucky engage in enhanced cooperation and sector-wide planning. Therefore, it is important to afford utilities the opportunity to take ad-vantage of regional differences in planning future compliance strategies. This is especially im-portant if Kentucky must comply with a rate-based standard, which could have uneven econom-ic impacts across the state. To a certain extent, the utilities already cooperate with each other in areas of network planning and operations. Furthermore, the shared ownership of assets is not uncommon in the industry. Enhanced coordination and long-range planning and coordination among utilities may result in better balancing of resources and services overall to Kentucky’s customers and more affordable prices.
A mass-emission reduction strategy as com-pared to a rate-based or carbon tax strategy will provide Kentucky greater flexibility in minimizing the impact on ratepayers and its existing coal fleet.
Page 24
Economic Challenges Facing Kentucky’s Electricity Generation Under Greenhouse Gas ConstraintsDecember 2013
ACRONYMS AND ABBREVIATIONS
B billionBFB biomass fed boilerbtu British thermal unitCC combined cycleCCS carbon capture and storageCHP combined heat and powerCT combustion turbine (simple cycle natural gas power plant)EGU electricity generating unitGDP Gross Domestic ProductGHG greenhouse gasGWh gigawatt hourIGCC integrated gasification combined cycle plantlb poundkwh kilowatt hourMSW municipal solid wasteMW megawattMWh megawatt hourNGCC natural gas combined cycle (power plant)NSR/PSD New Source Review/Prevention of Significant DeteriorationNRDC Natural Resources Defense CouncilO&M operating and maintenance (costs)PC pulverized coalSC supercritical (power plant)SMR small modular (nuclear) reactorUSC ultra-supercritical (power plant)

Page A.1
Economic Challenges Facing Kentucky’s Electricity Generation Under Greenhouse Gas ConstraintsDecember 2013
APPENDIX A - Future Power Generation Options
Defining the future power generation options for Kentucky is a key part of the current regulatory impact assessment. Future technologies could include improvements to current coal power generation units - including CCS, natural gas power generation, and renewables. Table A.1. shows the list of future power generation options assumed for Kentucky. Each of the technologies is accompanied by the necessary data required for modeling predictions. The color coding in the table corresponds to the sources of the various pieces of information (sources listed below the table). The coal technologies in Table A.1 include both supercritical (SC) and ultra-supercritical (USC) power generation. The respective power generation efficiencies of those technologies are 39 percent and 45 percent (HHV). The impacts of CCS (assumed to be amine technology) to these systems is on both the efficiency and capital cost. Second-generation CCS technologies that are currently in earlier stages of research and development are also included in the projections. For natural gas, technology options include combined cycle (CC) and combustion turbine (CT). Fuel cells and natural gas retrofits of PC boilers are also included, along with combined heat and power (CHP). Finally, a variety of renewable (and nuclear) technologies are specified in Table A.1. The listed renew-ables include photovoltaic, nuclear (including small module reactors), wind, hydroelectric, municipal solid waste (MSW), and biomass. Biomass options include both 100 percent biomass power generation and 20 percent co-feeding options with coal.
For each of the technologies in Table A.1 estimates were made for levelized cost of electricity, maximum possible avoided CO2, etc. The supporting assumptions that were necessary for those estimates are shown in Appendix B. Outside of those assumptions, the key assumptions used in generating the esti-mates in Table A.1 are as follows:
1) Nuclear power generation is not prohibited in Kentucky.
2) Fuel prices are constant for the total cost estimates shown, except for the 2X natural gas price representations in several plots.
3) A constant capital charge factor or 0.0965 was used for every technology type, which implies the same depreciation period and interest rates. 4) An average (current) CO2 generation rate of 2,074 lb/MW-h was assumed for Kentucky.
5) The specified lag time (permitting, construction, etc.) in Table A.1 was not taken into account in the cost and emissions comparison estimates. Also, only the current electricity demand values were used. The higher fidelity model is necessary to incorporate these parameters.
6) Only CO2 emissions from biomass and MSW were exempted from CO2 emission totals used in the rollups, as they were not deemed as being from fossil energy sources.

Page A.2
Economic Challenges Facing Kentucky’s Electricity Generation Under Greenhouse Gas ConstraintsDecember 2013
Plan
t Cha
ract
eris
tics
Emis
sion
s (lb
/MM
Btu)
Plan
t Cos
ts (2
012$
)Es
timat
es
Nominal Capacity (MW)
Capacity Factor
Heat Rate (Btu/kWh)
Fuel
CO2 (Total)
CO2 (from biomass & MSW)
Total CO2 Emissions (lb/MW-h)
CO2 from Fossil Sources (lb/MW-h)
Fixed O&M Cost ($/kW-yr)
Variable O&M Cost ($/MWh)
Overnight Capital Cost ($/kW)
Time Until Commerc Available (yrs)
Permitting Time (yrs)
Construction Time (yrs)
Total Lead Time (yrs)
Assumed Fuel Price ($/MMBTU)
Total LEC ($/kW-hr)
Max. Offset to KY Coal Power Generation
Max. Possible CO2 Avoided (M tons/yr)
Total Cost ($/ton CO2 avoided)
Subc
ritic
al P
C Re
trof
it w
ith C
CS65
085
%13
,046
Coal
44.1
057
657
6$2
16.4
$2
1.2
$1,2
67
22
37
2.87
0.10
410
0%62
139
SC P
ulve
rized
Coa
l1,
300
85%
8,80
0Co
al
206
018
1318
13$3
1.18
$4
.47
$2,9
34
03
58
2.87
0.07
210
0%11
550
SC P
ulve
rized
Coa
l with
CCS
1,30
085
%12
,000
Coal
20
.60
247
247
$66.
43
$9.5
1 $4
,724
0
36
92.
870.
114
100%
7512
5U
ltra-
Supe
rcrit
ical
(USC
) PC
550
85%
7,65
4Co
al20
30
1554
1554
$34.
2 $5
.2
$3,0
00
02.
54
6.5
2.87
0.07
110
0%21
271
USC
PC
with
CCS
550
85%
10,2
70Co
al20
020
520
5$4
7.3
$9.2
$5
,130
5
2.5
512
.52.
870.
111
100%
7711
9U
SC P
C w
ith O
xy-C
CS55
085
%10
,353
Coal
130
135
135
$45.
55
$7.1
0 $4
,770
5
2.5
512
.52.
870.
105
100%
8010
8U
SC P
C w
ith O
xy (n
o CC
S)55
085
%9,
093
Coal
203
018
4618
46$4
5.55
$7
.10
$4,7
70
52.
55
12.5
2.87
0.10
110
0%9
886
USC
PC
with
Gen
2 C
CS55
085
%8,
962
Coal
200
179
179
$41.
3 $8
.0
$4,4
70
102.
55
17.5
2.87
0.09
710
0%78
103
IGCC
600
85%
8,70
0Co
al
206
017
9217
92$6
2.3
$7.2
$4
,400
0
2.5
46.
52.
870.
098
100%
1269
2IG
CC w
ith C
CS52
083
%10
,700
Coal
20
.60
220
220
$72.
8 $8
.5
$6,5
99
02.
55
7.5
2.87
0.13
710
0%77
148
NG
Retr
ofit
of P
C Bo
iler
250
87%
9,35
5Ga
s11
70
1095
1095
$25.
0 $3
.6
$250
0
11
25.
450.
061
78%
3212
5Co
mbi
ned
Heat
& P
ower
1087
%6,
007
Gas
610
364
364
$7.5
$6
.1
$2,2
78
01.
51
2.5
5.45
0.06
98.
0%6
80Ad
vanc
ed C
T21
030
%9,
750
Gas
117
011
4111
41$7
.0
$10.
4 $6
76
02
13
5.45
0.09
110
0%39
195
Adva
nced
NGC
C 40
087
%6,
430
Gas
117
075
275
2$1
5.4
$3.3
$1
,023
0
1.5
23.
55.
450.
053
100%
5581
Adva
nced
NGC
C w
ith C
CS
340
87%
7,52
5Ga
s 12
090
90$3
1.8
$6.8
$2
,095
0
23
55.
450.
078
100%
8279
Fuel
Cel
ls10
90%
9,50
0Ga
s 13
00
1235
1235
$0.0
$4
3.0
$7,1
08
01
12
5.45
0.18
210
0%35
433
PC re
trof
it w
ith 2
0% B
iom
ass
650
85%
10,6
00Co
-feed
206
3621
8418
02$4
0.0
$6.4
$2
13
01
12
3.24
0.04
94.
4%0
359
Biom
ass B
FB50
78%
13,5
00Bi
omas
s 19
519
526
330
$105
.6
$5.3
$4
,114
0
1.5
23.
54.
000.
133
4.4%
412
8M
unic
ipal
Sol
id W
aste
2785
%13
,500
MSW
115
115
1551
0$9
0.5
($10
.0)
$3,7
84
02
35
0.00
0.05
11.
0%1
49Ph
otov
olta
ic15
025
%N
/A
Sola
r 0
00
0$2
4.7
$0.0
$3
,873
0
11
20.
000.
182
12.0
%10
175
Smal
l Mod
ular
(Nuc
lear
) Rea
ctor
s18
090
%N
/AU
rani
um0
00
0$9
3.3
$2.1
$5
,000
4
23
90.
720.
075
100%
8672
Conv
entio
nal N
ucle
ar2,
234
90%
10,4
52U
rani
um
00
00
$93.
3 $2
.1
$5,5
30
04
711
0.72
0.08
910
0%86
86W
ind
3034
%N
/A
Win
d 0
00
0$3
9.6
$0.0
$2
,513
0
11
20.
000.
095
5.0%
491
Hydr
oele
ctric
10
52%
N/A
Hy
dro
00
00
$14.
1 $0
.0
$2,9
36
02
46
0.00
0.06
52.
3%2
63
U.S.
Ene
rgy
Info
rmat
ion
Adm
inist
ratio
n (E
IA),
Upda
ted
Capi
tal C
ost E
stim
ates
for U
tility
Sca
le E
lect
ricity
Gen
erat
ing
Plan
ts, A
pril
2013
[all
unhi
ghlig
hted
dat
a in
bla
ck fo
nt]
Higm
an, C
hrist
ophe
r; va
n de
r Bur
gt, M
aart
en (2
008)
. Gas
ifica
tion
(2nd
Edi
tion)
, Tab
le 9
.3. E
lsevi
er.
Leve
lized
Cos
t of N
ew G
ener
atio
n Re
sour
ces i
n th
e An
nual
Ene
rgy
Out
look
201
3, U
.S. E
nerg
y In
form
atio
n Ad
min
istra
tion
(EIA
), Ja
nuar
y 20
13.
Pulv
erize
d Co
al O
xyco
mbu
stio
n Po
wer
Pla
nts -
Vol
ume
1: B
itum
inou
s Coa
l to
Elec
trici
ty, D
OE/
NETL
-200
7/12
91, R
evisi
on 2
, Aug
ust 2
008
Assu
mes
1/2
the
para
sitic
ener
gy fo
r am
ine
base
line
carb
on c
aptu
reCr
aig
Wel
ling,
US
Dept
. Ene
rgy
Offi
ce o
f Nuc
lear
Ene
rgy,
Dec
. 201
0.
Tech
nolo
gy C
hara
cter
izatio
n: G
as T
urbi
nes,
Prep
ared
by
Ener
gy a
nd E
nviro
nmen
tal A
naly
sis fo
r EPA
Clim
ate
Prot
ectio
n Pa
rtne
rshi
p Di
visio
n, W
ashi
ngto
n DC
, Dec
. 200
8.
Feas
ibili
ty a
nd c
ost o
f con
vert
ing
coal
fire
d ut
ility
boi
lers
to n
atur
al g
as. M
IT E
L 86
-009
, Dec
. 198
6. 3
-5%
effi
cien
cy d
rop
for N
G su
bstit
utio
n. B
&V
pape
r: +2
00 b
tu/k
Wh
incr
ease
to su
bcrit
ical c
ycle
. M
ale
JL, e
t.al.
"Log
istics
, Cos
ts, a
nd G
HG Im
pact
s of U
tility
-Sca
le C
o-fir
ing
with
20%
Bio
mas
s." P
NNL-
SA-9
4835
, U.S
. Dep
artm
ent o
f Ene
rgy.
Skon
e TJ
, et.a
l. Ro
le o
f Alte
rnat
ive
Ener
gy S
ourc
es: P
ulve
rized
Coa
l and
Bio
mas
s Co-
firin
g, T
echn
olog
y As
sess
men
t, Au
gust
30,
201
2, D
OE/
NETL
-201
2/15
37, U
.S. D
epar
tmen
t of E
nerg
y.
Estim
ates
from
PNN
L (v
ario
us so
urce
s).
“Ren
ewab
le E
nerg
y O
ppor
tuni
ties a
t For
t Cam
pbel
l, Te
nnes
see/
Kent
ucky
,” JR
Han
d , e
t. al
., Pa
cific
Nor
thw
est N
atio
nal L
abor
ator
y, fo
r the
U.S
. DO
E, P
NNL-
2022
3.“I
s It B
ette
r To
Burn
or B
ury
Was
te fo
r Cle
an E
lect
ricity
Gen
erat
ion?
,” P
. Ozg
en K
apla
n, e
t. al
., U.
S. E
PA,
Envi
ron.
Sci
. Tec
hnol
. 200
9, 4
3, 1
711–
1717
."T
he C
ost o
f Tra
nsm
issio
n fo
r Win
d En
ergy
: A R
evie
w o
f Tra
nsm
issio
n Pl
anni
ng S
tudi
es,”
Mill
s, et
. al..
LBN
L-14
71E,
Feb
ruar
y 20
09. $
2,21
3/kW
from
EIA
repo
rt p
lus $
300/
kW o
f MIS
O tr
ansm
issio
n up
grad
e.
Tabl
e A.
1: D
ata
for P
ower
Gen
erati
on T
echn
olog
y O
ption
s

Page A.3
Economic Challenges Facing Kentucky’s Electricity Generation Under Greenhouse Gas ConstraintsDecember 2013
The following plot shows the CO2 generation rates for each of the potential power generation technolo-gies in Table A.1. Technologies using coal and natural gas include options with carbon capture and storage (CCS). The renewable technologies, nuclear, and municipal solid waste plants have near zero CO2 emissions.
Figure A.1: CO2 Emission Rates for Future Candidate Power Generation Technologies
The next plot shows the levelized cost of electricity for the technologies in Table A.1 along with the cost sensitivity of a 2X increase in natural gas price. Here the initial price of natural gas was assumed to be $5.45 per million Btu.

Page A.4
Economic Challenges Facing Kentucky’s Electricity Generation Under Greenhouse Gas ConstraintsDecember 2013
Figure A.2: Levelized Cost of Electricity from Table A.1 - with 2X increase in natural gas price represented.
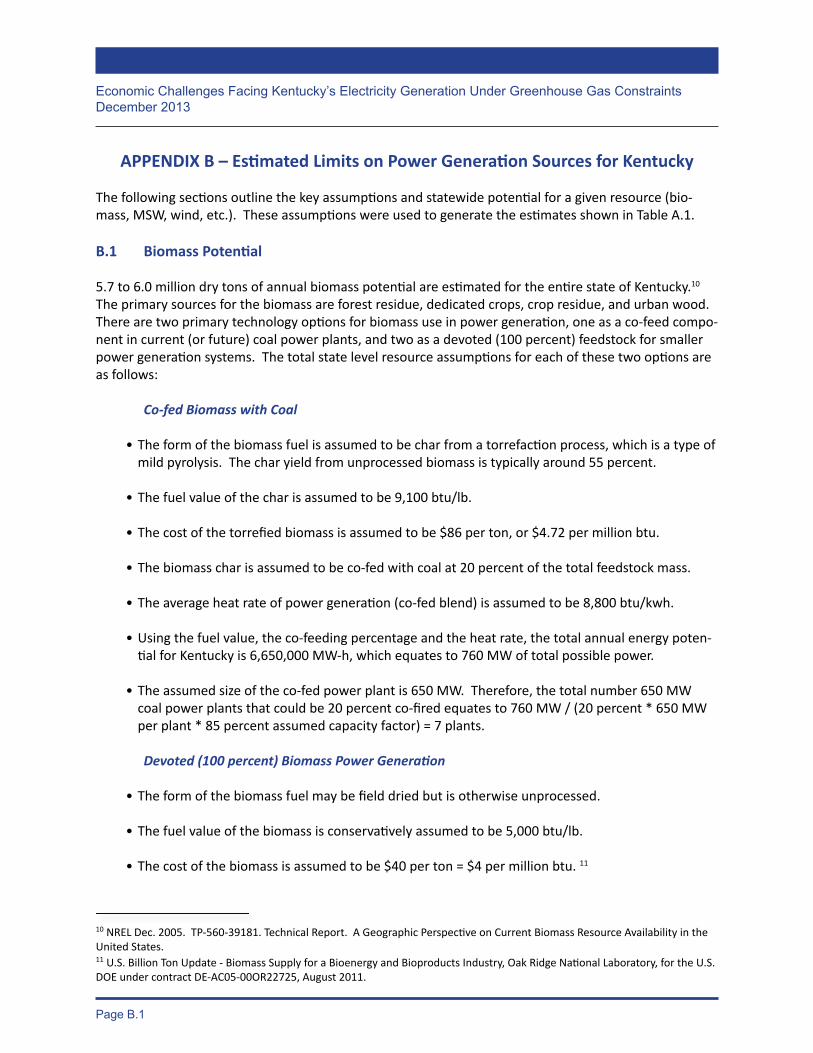
Page B.1
Economic Challenges Facing Kentucky’s Electricity Generation Under Greenhouse Gas ConstraintsDecember 2013
APPENDIX B – Estimated Limits on Power Generation Sources for Kentucky
The following sections outline the key assumptions and statewide potential for a given resource (bio-mass, MSW, wind, etc.). These assumptions were used to generate the estimates shown in Table A.1.
B.1 Biomass Potential
5.7 to 6.0 million dry tons of annual biomass potential are estimated for the entire state of Kentucky.10 The primary sources for the biomass are forest residue, dedicated crops, crop residue, and urban wood. There are two primary technology options for biomass use in power generation, one as a co-feed compo-nent in current (or future) coal power plants, and two as a devoted (100 percent) feedstock for smaller power generation systems. The total state level resource assumptions for each of these two options are as follows: Co-fed Biomass with Coal
• The form of the biomass fuel is assumed to be char from a torrefaction process, which is a type of mild pyrolysis. The char yield from unprocessed biomass is typically around 55 percent.
• The fuel value of the char is assumed to be 9,100 btu/lb.
• The cost of the torrefied biomass is assumed to be $86 per ton, or $4.72 per million btu.
• The biomass char is assumed to be co-fed with coal at 20 percent of the total feedstock mass.
• The average heat rate of power generation (co-fed blend) is assumed to be 8,800 btu/kwh.
• Using the fuel value, the co-feeding percentage and the heat rate, the total annual energy poten-tial for Kentucky is 6,650,000 MW-h, which equates to 760 MW of total possible power.
• The assumed size of the co-fed power plant is 650 MW. Therefore, the total number 650 MW coal power plants that could be 20 percent co-fired equates to 760 MW / (20 percent * 650 MW per plant * 85 percent assumed capacity factor) = 7 plants.
Devoted (100 percent) Biomass Power Generation
• The form of the biomass fuel may be field dried but is otherwise unprocessed.
• The fuel value of the biomass is conservatively assumed to be 5,000 btu/lb.
• The cost of the biomass is assumed to be $40 per ton = $4 per million btu. 11
10 NREL Dec. 2005. TP-560-39181. Technical Report. A Geographic Perspective on Current Biomass Resource Availability in the United States.11 U.S. Billion Ton Update - Biomass Supply for a Bioenergy and Bioproducts Industry, Oak Ridge National Laboratory, for the U.S. DOE under contract DE-AC05-00OR22725, August 2011.

Page B.2
Economic Challenges Facing Kentucky’s Electricity Generation Under Greenhouse Gas ConstraintsDecember 2013
• The average heat rate of power generation is assumed to be 13,500 btu/kwh.
• Using the fuel value, the co-feeding percentage, and the heat rate, the total annual energy poten-tial for Kentucky is 4,300,000 MW-h, which equates to 490 MW of total possible power.
• The assumed size of a devoted biomass power plant is 50 MW. Therefore, the total number 50 MW coal power plants equates to 490 MW / (50 MW per plant * 85 percent assumed capacity factor) = 11 plants. Hybrid Examples
• If fractions of the total biomass are to be used for co-fed and devoted scenarios, simply multi-ply the corresponding energy potential by that fraction. For example, 75 percent co-fed and 25 percent devoted and would result in 75 percent * 6,650,000 MW-h/yr = 5,000,000 MW-h/yr for co-fed applications and 25 percent * 4,300,000 MW-h/yr = 1,075,000 MW-h/yr for devoted ap-plications.
B.2 Municipal Solid Waste Potential
Municipal Solid Waste (MSW) enters Kentucky landfills at a rate of 4.2 million tons per year and approxi-mately one-third is estimated to be recoverable.12 The energy content of recoverable MSW is approxi-mately 11 million Btu per ton (5,500 Btu/lb), heavily weighted towards biogenic resources such as paper, paperboard, and yard debris.13 Power production from MSW can be achieved by either combustion or gasification-based systems, with typical heat rates of 18,000 and 13,600 Btu/kwh, respectively.14 The assumptions for potential future MSW power production are as follows:
• Using the above parameters, and the lower of the two heat rates, the total annual energy poten-tial for Kentucky is 1,100,000 MW-h, which equates to approximately 130 MW of total possible power.
• The assumed sizes of the combustion and gasification-based MSW power production units are 20 and 27 MW, respectively. Therefore, the total number 20 MW MSW power plants possible in Ken-tucky equates to 130 MW / (20 MW per plant * 85 percent assumed capacity factor) = 8 plants.
• MSW fuel costs are rolled into the Variable O&M. Therefore, tipping fees received by the power producer result in an overall negative Variable O&M.
12 “Is It Better To Burn or Bury Waste for Clean Electricity Generation?” P. Ozgen Kaplan, et. al., U.S. EPA, Environ. Sci. Technol. 2009, 43, 1711–1717.13 “Renewable Energy Opportunities at Fort Campbell, Tennessee/Kentucky,” JR Hand, PNNL-20223.14 U.S. EIA, Updated Capital Cost Estimates for Utility Scale Electricity Generating Plants, April 2013

Page B.3
Economic Challenges Facing Kentucky’s Electricity Generation Under Greenhouse Gas ConstraintsDecember 2013
B.3 Hydroelectric Capacity
Total developable hydroelectric capacity in Kentucky is estimated at 439 MW, with the Meldahl project already under construction at 110 MW.15 This results in approximately 300 MW of remaining hydroelec-tric capacity for the state. Hydroelectric opportunities in the 0 to 10 MW size range sum up to a total of 107 MW, with an average size of 2.6 MW. Opportunities in the 0 to 50 MW range sum to a total of 297 MW, with an average size of 6 MW. Therefore, an average size of no more than 10 MW was assumed in the analysis for an individual future unit.
B.4 Wind Power
A national wind power assessment showed 1,900 GWh of possible in-state wind generation potential for Kentucky at 100-meters.16 This total is reduced to 173 GWh for wind generation potential at 80 meters. The corresponding power production of these two options (at 30 percent capacity factor) is 700 MW and 61 MW, respectively. A Synapse study identified up to 2,000 GWh of out-of-state wind that may be avail-able for Kentucky use.17 Based on these two assessments an in-state maximum of 1,900 GWh (700 MW at a 30 percent capacity factor) and 2,000 GWh of maximum out-of-state wind capacity were assumed. These values equate to a corresponding (current) coal power displacement potential of 5 percent. Future wind power imported to Kentucky is assumed to come from Indiana, with transmission into western Kentucky via existing MISO lines. The overnight capital cost of imported wind is assumed to be $2,213 per kW. This includes costs for a substation to increase voltage from the collection system at 34.5 kV to interconnected transmission system high voltage at 115 kV.18 The capital cost estimate does not include MISO upgrades necessary for transmission to Kentucky. Upgrades are not likely necessary for small amounts of wind transmission (<100 MW). For significant wind transmission a capital adder should be applied. A transmission cost adder estimate of approximately $300/kW is given in one study and is the assumed value for the current assessment.19
B.5 Potential for Solar Power Generation via Photovoltaic Technology Several sources were studied to determine the extent of potential Kentucky solar resources using photo-voltaic power generation.20,21,22 The referenced studies spanned from large scale (>10 MW) installations to small (0.1 MW) distributed generation systems, with projections out to 2025. The estimates of pos-sible electric energy from solar ranged from 1,200 to 17,000 GWh per year, or 1.4 to 13 GW of poten-tially displaced power for the state. Based on this range a value of 10,000 GWh per year, or 8.0 GW at an assumed capacity factor, was assumed to be the state solar resource maximum for the current study. This value has a corresponding (current) coal power displacement potential of 12 percent.
15 http://hydropower.inel.gov/resourceassessment/app_a/index_states.shtml?ky16 http://www.windpoweringamerica.gov/wind_resource_maps.asp?stateab=ky. Accessed 10/29/2013. 17 Synapse. KY REPS/EE Potential Impacts. January 2012.18 Appendix B, page 21-1 of EIA April 2013 report19 “The Cost of Transmission for Wind Energy: A Review of Transmission Planning Studies,” Andrew Mills, Ryan Wiser, and Kevin Porter. LBNL-1471E, February 2009.20 Potential Impacts of a Renewable and Energy Efficiency Portfolio Standard in Kentucky. Synapse Jan. 12, 2012. 21 The Opportunities for Distributed Renewable Energy in Kentucky. Downstream Strategies, LLC. June 18, 2012.22 Intelligent Energy Choices for Kentucky’s Future. Governor Steven L. Beshear. Nov. 2008.
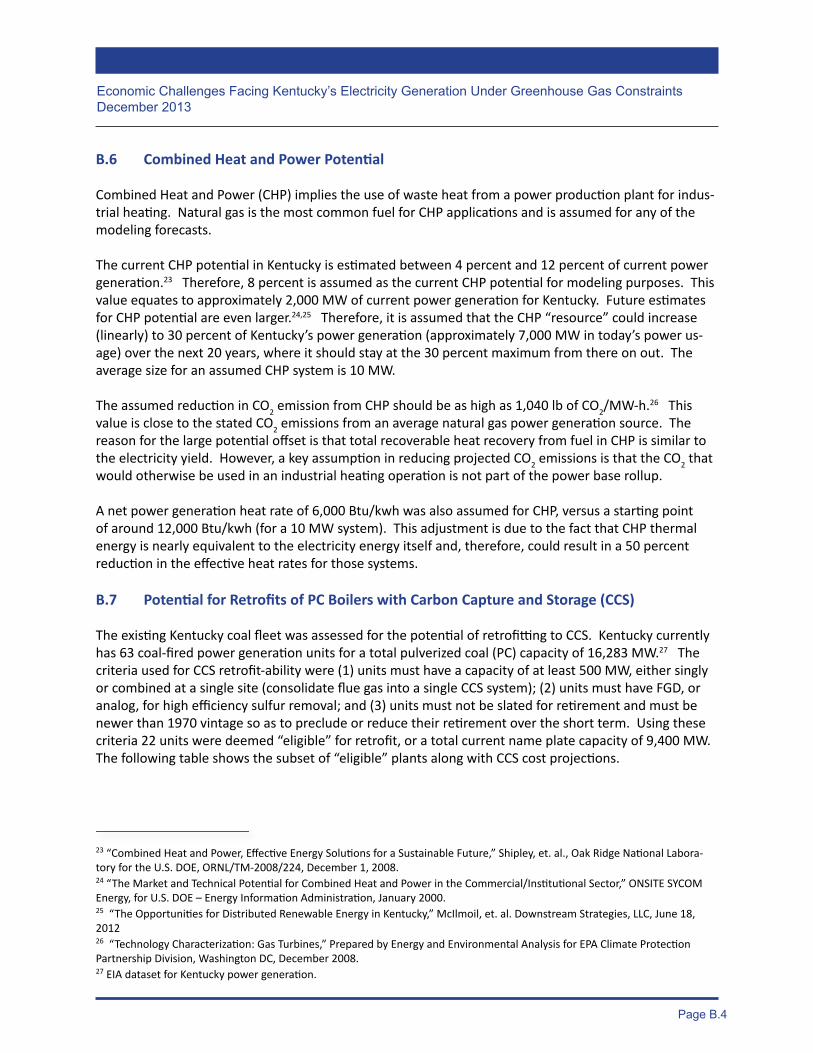
Page B.4
Economic Challenges Facing Kentucky’s Electricity Generation Under Greenhouse Gas ConstraintsDecember 2013
B.6 Combined Heat and Power Potential
Combined Heat and Power (CHP) implies the use of waste heat from a power production plant for indus-trial heating. Natural gas is the most common fuel for CHP applications and is assumed for any of the modeling forecasts.
The current CHP potential in Kentucky is estimated between 4 percent and 12 percent of current power generation.23 Therefore, 8 percent is assumed as the current CHP potential for modeling purposes. This value equates to approximately 2,000 MW of current power generation for Kentucky. Future estimates for CHP potential are even larger.24,25 Therefore, it is assumed that the CHP “resource” could increase (linearly) to 30 percent of Kentucky’s power generation (approximately 7,000 MW in today’s power us-age) over the next 20 years, where it should stay at the 30 percent maximum from there on out. The average size for an assumed CHP system is 10 MW. The assumed reduction in CO2 emission from CHP should be as high as 1,040 lb of CO2/MW-h.26 This value is close to the stated CO2 emissions from an average natural gas power generation source. The reason for the large potential offset is that total recoverable heat recovery from fuel in CHP is similar to the electricity yield. However, a key assumption in reducing projected CO2 emissions is that the CO2 that would otherwise be used in an industrial heating operation is not part of the power base rollup.
A net power generation heat rate of 6,000 Btu/kwh was also assumed for CHP, versus a starting point of around 12,000 Btu/kwh (for a 10 MW system). This adjustment is due to the fact that CHP thermal energy is nearly equivalent to the electricity energy itself and, therefore, could result in a 50 percent reduction in the effective heat rates for those systems.
B.7 Potential for Retrofits of PC Boilers with Carbon Capture and Storage (CCS)
The existing Kentucky coal fleet was assessed for the potential of retrofitting to CCS. Kentucky currently has 63 coal-fired power generation units for a total pulverized coal (PC) capacity of 16,283 MW.27 The criteria used for CCS retrofit-ability were (1) units must have a capacity of at least 500 MW, either singly or combined at a single site (consolidate flue gas into a single CCS system); (2) units must have FGD, or analog, for high efficiency sulfur removal; and (3) units must not be slated for retirement and must be newer than 1970 vintage so as to preclude or reduce their retirement over the short term. Using these criteria 22 units were deemed “eligible” for retrofit, or a total current name plate capacity of 9,400 MW. The following table shows the subset of “eligible” plants along with CCS cost projections.
23 “Combined Heat and Power, Effective Energy Solutions for a Sustainable Future,” Shipley, et. al., Oak Ridge National Labora-tory for the U.S. DOE, ORNL/TM-2008/224, December 1, 2008.24 “The Market and Technical Potential for Combined Heat and Power in the Commercial/Institutional Sector,” ONSITE SYCOM Energy, for U.S. DOE – Energy Information Administration, January 2000.25 “The Opportunities for Distributed Renewable Energy in Kentucky,” McIlmoil, et. al. Downstream Strategies, LLC, June 18, 201226 “Technology Characterization: Gas Turbines,” Prepared by Energy and Environmental Analysis for EPA Climate Protection Partnership Division, Washington DC, December 2008.27 EIA dataset for Kentucky power generation.
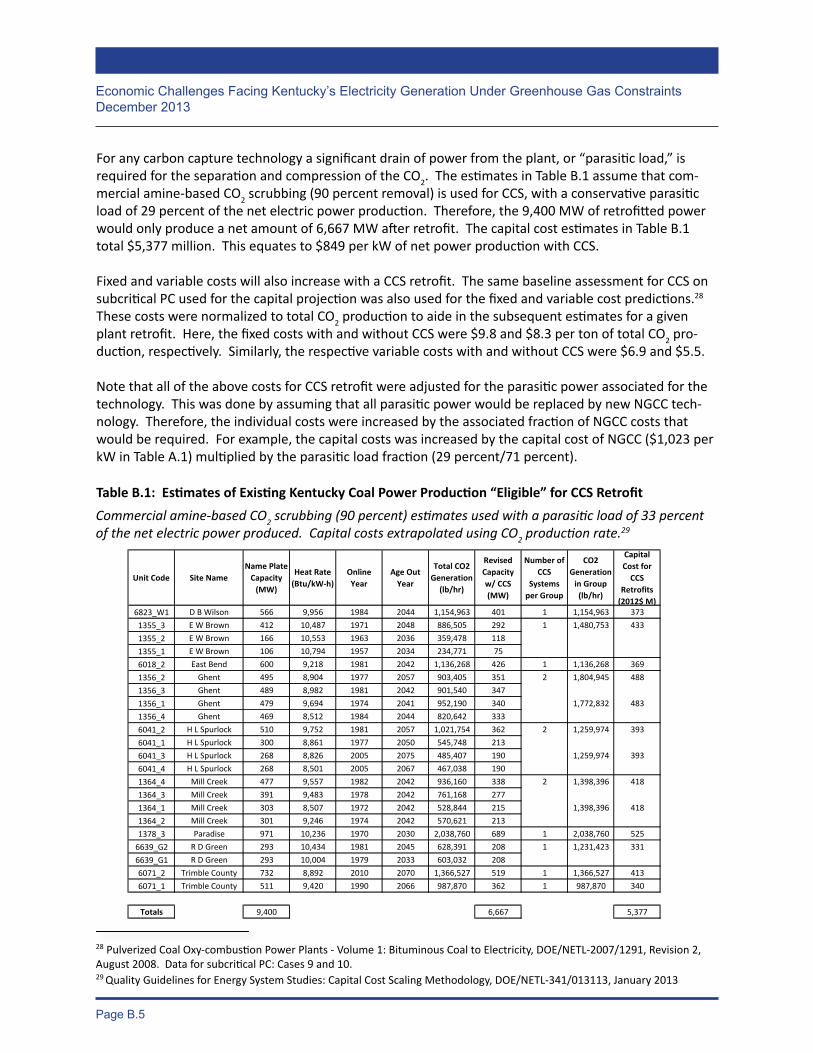
Page B.5
Economic Challenges Facing Kentucky’s Electricity Generation Under Greenhouse Gas ConstraintsDecember 2013
For any carbon capture technology a significant drain of power from the plant, or “parasitic load,” is required for the separation and compression of the CO2. The estimates in Table B.1 assume that com-mercial amine-based CO2 scrubbing (90 percent removal) is used for CCS, with a conservative parasitic load of 29 percent of the net electric power production. Therefore, the 9,400 MW of retrofitted power would only produce a net amount of 6,667 MW after retrofit. The capital cost estimates in Table B.1 total $5,377 million. This equates to $849 per kW of net power production with CCS.
Fixed and variable costs will also increase with a CCS retrofit. The same baseline assessment for CCS on subcritical PC used for the capital projection was also used for the fixed and variable cost predictions.28 These costs were normalized to total CO2 production to aide in the subsequent estimates for a given plant retrofit. Here, the fixed costs with and without CCS were $9.8 and $8.3 per ton of total CO2 pro-duction, respectively. Similarly, the respective variable costs with and without CCS were $6.9 and $5.5. Note that all of the above costs for CCS retrofit were adjusted for the parasitic power associated for the technology. This was done by assuming that all parasitic power would be replaced by new NGCC tech-nology. Therefore, the individual costs were increased by the associated fraction of NGCC costs that would be required. For example, the capital costs was increased by the capital cost of NGCC ($1,023 per kW in Table A.1) multiplied by the parasitic load fraction (29 percent/71 percent).
28 Pulverized Coal Oxy-combustion Power Plants - Volume 1: Bituminous Coal to Electricity, DOE/NETL-2007/1291, Revision 2, August 2008. Data for subcritical PC: Cases 9 and 10.29 Quality Guidelines for Energy System Studies: Capital Cost Scaling Methodology, DOE/NETL-341/013113, January 2013
Table B.1: Estimates of Existing Kentucky Coal Power Production “Eligible” for CCS RetrofitCommercial amine-based CO2 scrubbing (90 percent) estimates used with a parasitic load of 33 percent of the net electric power produced. Capital costs extrapolated using CO2 production rate.29
Unit Code Site NameName Plate
Capacity (MW)
Heat Rate (Btu/kW-h)
Online Year
Age Out Year
Total CO2 Generation
(lb/hr)
Revised Capacity w/ CCS (MW)
Number of CCS
Systems per Group
CO2 Generation
in Group (lb/hr)
Capital Cost for
CCS Retrofits
(2012$ M)6823_W1 D B Wilson 566 9,956 1984 2044 1,154,963 401 1 1,154,963 3731355_3 E W Brown 412 10,487 1971 2048 886,505 292 1 1,480,753 4331355_2 E W Brown 166 10,553 1963 2036 359,478 1181355_1 E W Brown 106 10,794 1957 2034 234,771 756018_2 East Bend 600 9,218 1981 2042 1,136,268 426 1 1,136,268 3691356_2 Ghent 495 8,904 1977 2057 903,405 351 2 1,804,945 4881356_3 Ghent 489 8,982 1981 2042 901,540 3471356_1 Ghent 479 9,694 1974 2041 952,190 340 1,772,832 4831356_4 Ghent 469 8,512 1984 2044 820,642 3336041_2 H L Spurlock 510 9,752 1981 2057 1,021,754 362 2 1,259,974 3936041_1 H L Spurlock 300 8,861 1977 2050 545,748 2136041_3 H L Spurlock 268 8,826 2005 2075 485,407 190 1,259,974 3936041_4 H L Spurlock 268 8,501 2005 2067 467,038 1901364_4 Mill Creek 477 9,557 1982 2042 936,160 338 2 1,398,396 4181364_3 Mill Creek 391 9,483 1978 2042 761,168 2771364_1 Mill Creek 303 8,507 1972 2042 528,844 215 1,398,396 4181364_2 Mill Creek 301 9,246 1974 2042 570,621 2131378_3 Paradise 971 10,236 1970 2030 2,038,760 689 1 2,038,760 525
6639_G2 R D Green 293 10,434 1981 2045 628,391 208 1 1,231,423 3316639_G1 R D Green 293 10,004 1979 2033 603,032 2086071_2 Trimble County 732 8,892 2010 2070 1,366,527 519 1 1,366,527 4136071_1 Trimble County 511 9,420 1990 2066 987,870 362 1 987,870 340
Totals 9,400 6,667 5,377

Page B.6
Economic Challenges Facing Kentucky’s Electricity Generation Under Greenhouse Gas ConstraintsDecember 2013
B.8 Potential for Natural Gas Power Generation
Conversion of existing capacity to natural gas-fired technologies could proceed under several different mechanisms including retrofit of pulverized coal (PC) fired furnaces to support natural gas combustion (fuel switching); replacement of existing capacity with natural gas combined cycle (NGCC) units; and/or replacement of existing PC produced energy to higher percentages of combined heat and power (CHP). All are considered technically viable and relevant. The intent of this section is to describe the potential impacts under each of these scenarios when considered discretely; it does not however attempt to op-timize a portfolio of generating options based on natural gas. The following is predicated on the natural gas fuel price as provided in EIA fuel price projections through 2040. Retrofit of Existing Pulverized Coal Furnaces to Natural Gas Combustion
The retrofit of PC furnaces to natural gas combustion can be a relatively simple process if the existing furnace and balance of plant can support the fuel switch. It can also be complex, and is inherently site specific. Traditionally, retrofit of PC furnaces to natural gas combustion has not been executed due to the lower efficiency steam cycle (when compared to a NGCC) and wide variation in natural gas fuel pric-ing compared to coal. Of the existing PC capacity in Kentucky, approximately 80 percent of the fleet could fire natural gas. Re-moved from consideration were furnaces that would be difficult to repower without a technology switch such as stoker boilers and fluidized bed boilers. Plants that were declared as retired, or to be retired within the next three years, were also eliminated. EIA (2012) indicated that of the 89,820 GWh produced in Kentucky, approximately 92 percent (82,566 GWh) was generated by coal-fired facilities. On an energy basis, replacing that electricity with retrofit PC furnaces operating at an average heat rate of 10,186 30 btu/kwh, would require the conversion of ap-proximately 9,200 MWs31 ; an approximate capital outlay of $2.3 billion; and annual non-fuel operating expenses (fixed and variable) of approximately $500 million per year. From an infrastructure standpoint, natural gas consumption for converted PC plants alone could consume almost 17 percent of the entire natural gas pipeline capacity entering the state of Kentucky32; the capital required for expansion of distri-bution is not captured in the analysis, nor is the estimated cost for actual transmission of gas.
Transition to Natural Gas Combined Cycle
The transition away from coal-fired capacity to natural gas combined cycle is already happening through-out the United States. For similar reasons as discussed earlier, such as higher efficiency power produc-tion when compared to coal-fired capacity and historically low fuel prices, existing NGCC units are experi-encing much higher utilization rates (capacity factors), and new build capacity is quickly expanding as well.
30 Fleet average of the PC furnaces considered eligible for NG retrofit.31 Assumes conversion can happen within two years. Costs are representative of 2016 which is the first year that furnaces could be transitioned.32 Accessed at http://www.eia.gov/pub/oil_gas/natural_gas/analysis_publications/ngpipeline/usage.html

Page B.7
Economic Challenges Facing Kentucky’s Electricity Generation Under Greenhouse Gas ConstraintsDecember 2013
Analysis of NGCC started with the same baseline energy production data from EIA for 2012. In addition to considering full replacement of coal-fired capacity, power production from existing natural gas-fired capacity was also included to understand the total demand for fuel, and the potential impact to natural gas pipeline infrastructure.
On an energy basis, replacing the currently produced electricity from pulverized coal would require the greenfield development of approximately 11,400 MW33; a capital outlay of $11.7 billion, and annual non-fuel operating expenses (fixed and variable) of $450 million per year. Natural gas consumption for new NGCC plants constructed to replace PC capacity would consume approximately 13 percent of the entire natural gas pipeline capacity entering the state of Kentucky.
33 Assumes conversion can happen within four years. Costs are representative of 2017 which is the first year that NGCC could be commissioned based on scheduled permitting and construction lead times.