
Economic benefits of reducing aviation taxes in Latin ... · SEO Amsterdam Economics carries out...
140
Economic benefits of reducing aviation taxes in Latin America and the Caribbean
Transcript of Economic benefits of reducing aviation taxes in Latin ... · SEO Amsterdam Economics carries out...

Economic benefits of reducing aviation taxes in Latin America and the Caribbean


Roetersstraat 29 - 1018 WB Amsterdam - T (+31) 20 525 1630 - F (+31) 020 525 1686 - www.seo.nl - [email protected]
ABN-AMRO IBAN: NL14ABNA0411744356 BIC: ABNANL2A - ING: IBAN: NL96INGB0004641100 BIC: INGBNL2A KvK Amsterdam 41197444 - BTW NL 003023965 B
Amsterdam, 20 April 2016 Commissioned by IATA
Economic benefits of reducing aviation taxes in Latin America and the Caribbean
Guillaume Burghouwt Thijs Boonekamp
Joost Zuidberg Valentijn van Spijker

“The science of knowing” SEO Amsterdam Economics carries out independent applied economic research on behalf of national and international clients – both public institutions and private sector clients. Our research aims to make a major contribution to the decision-making processes of our clients. Originally founded by, and still affiliated with, the University of Amsterdam, SEO Amsterdam Economics is now an independent research group but retains a strong academic component. Operating on a nonprofit basis, SEO continually invests in the intellectual capital of its staff by granting them time to pursue continuing education, publish in academic journals, and participate in academic networks and conferences. As a result, our staff is fully up to date on the latest economic theories and econometric techniques.
SEO-report nr. 2016-13
Copyright © 2015 SEO Amsterdam. All rights reserved. Data from this report may be used in articles, studies and syllabi, provided that the source is clearly and accurately mentioned. Data in this report may not be used for commercial purposes without prior permission of the author(s). Permission can be obtained by contacting: [email protected].

ECONOMIC BENEFITS OF REDUCING AVIATION TAXES IN LATIN AMERICA AND THE CARIBBEAN i
SEO AMSTERDAM ECONOMICS
Executive summary
Connectivity is key to competitiveness Aviation plays a crucial role in today’s globalized society. The connectivity by air it generates is a key element for the competitive position of countries in Latin America and the Caribbean, its regions and cities. A superior connectivity performance minimizes travel costs for passengers, businesses and shippers. It generates agglomeration economies, stimulates productivity, trade, R&D and foreign direct investment. Furthermore, airports and civil airspace users support many jobs in the economies of Latin America and the Caribbean. Almost 4.9 million jobs and 153 billion USD of GDP are currently directly or indirectly related to aviation in Latin America and the Caribbean. As a result, there is an increased understanding among policy makers about the potential benefits of connectivity to the economy.
Figure 1.1 Virtuous circle of connectivity growth and economic growth
The overall connectivity performance of countries in Latin America and the Caribbean has improved substantially over the past decade. Total direct, non-stop connectivity and indirect connectivity (via other hubs) increased by 23 percent between 2004 and 2014. For the many islands and peripheral cities in the region, connectivity by air is essential for their economies and social well-being.
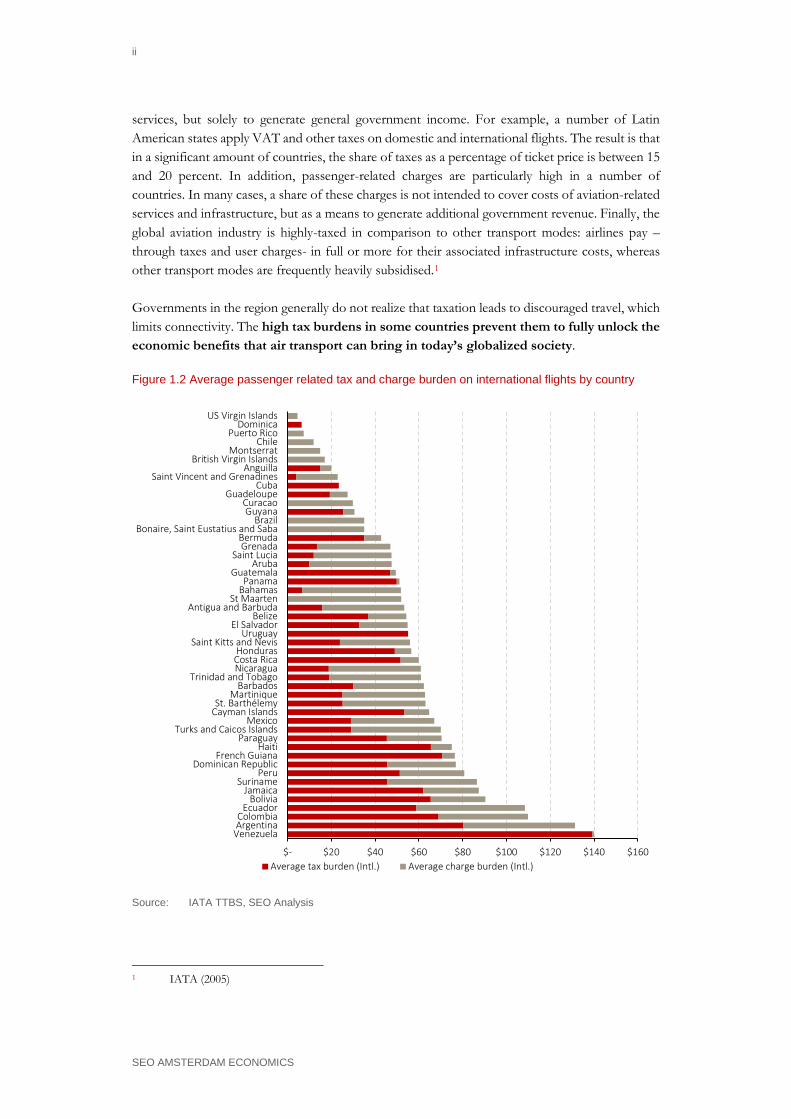
High tax burden limits the potential economic benefits of connectivity growth However, despite the connectivity growth and the economic value attached to it, many governments in the region view air transport as a luxury for the wealthy, rather than a catalyst for economic growth. As a result, aviation has been an easy target for taxation as Figure 1.2 shows. Such taxes are not intended to cover the cost of the use of aviation system infrastructure and
ii
SEO AMSTERDAM ECONOMICS
services, but solely to generate general government income. For example, a number of Latin American states apply VAT and other taxes on domestic and international flights. The result is that in a significant amount of countries, the share of taxes as a percentage of ticket price is between 15 and 20 percent. In addition, passenger-related charges are particularly high in a number of countries. In many cases, a share of these charges is not intended to cover costs of aviation-related services and infrastructure, but as a means to generate additional government revenue. Finally, the global aviation industry is highly-taxed in comparison to other transport modes: airlines pay –through taxes and user charges- in full or more for their associated infrastructure costs, whereas other transport modes are frequently heavily subsidised.1 Governments in the region generally do not realize that taxation leads to discouraged travel, which limits connectivity. The high tax burdens in some countries prevent them to fully unlock the economic benefits that air transport can bring in today’s globalized society.
Figure 1.2 Average passenger related tax and charge burden on international flights by country
Source: IATA TTBS, SEO Analysis
1 IATA (2005)
$- $20 $40 $60 $80 $100 $120 $140 $160
VenezuelaArgentinaColombia
EcuadorBolivia
JamaicaSuriname
PeruDominican Republic
French GuianaHaiti
ParaguayTurks and Caicos Islands
MexicoCayman IslandsSt. Barthélemy
MartiniqueBarbados
Trinidad and TobagoNicaraguaCosta RicaHonduras
Saint Kitts and NevisUruguay
El SalvadorBelize
Antigua and BarbudaSt Maarten
BahamasPanama
GuatemalaAruba
Saint LuciaGrenada
BermudaBonaire, Saint Eustatius and Saba
BrazilGuyana
CuracaoGuadeloupe
CubaSaint Vincent and Grenadines
AnguillaBritish Virgin Islands
MontserratChile
Puerto RicoDominica
US Virgin Islands
Average tax burden (Intl.) Average charge burden (Intl.)
EXECUTIVE SUMMARY iii
SEO AMSTERDAM ECONOMICS
Objectives of this study IATA commissioned SEO Amsterdam Economics to prepare a study to independently quantify the economic benefits of reducing aviation taxes in Latin America and the Caribbean. The study provides evidence on the substantial economic benefits that a removal of aviation taxes and a reduction of passenger-based charges can bring to the economies of Latin America and the Caribbean for consumers and businesses. The study also shows that significant potential benefits of connectivity growth will be foregone for consumers and businesses if taxes remain at their current levels. This study uses two different approaches to assess the economic impacts: • the consumer benefit approach focuses on the welfare benefits of tax reduction for
consumers (both private consumers and businesses) in the form of travel cost reductions and connectivity improvements, as well the additional benefits for the wider economy. A generalized travel cost model is used to estimate the consumer benefits. The approach is in line with the best-practice in the appraisal of infrastructure investments and policy measures in transport economics2.
• the macro-economic approach mainly refers to GDP and jobs. Econometric estimations have been used to estimate GDP and job impacts.
Although there is some overlap between both approaches, they are different approaches, of which the results cannot be added up. We estimate both the immediate impacts as well as the potential long-term economic impacts of reducing aviation taxes (up to 2035). We distinguish between two different scenarios.3 1. ‘Tax Removal’ scenario: all aviation taxes are reduced to zero. 2. ‘Tax Removal and Charges Reduction scenario: all aviation taxes are removed and
passenger-based charges are reduced to a reasonably lower level per sub-region.
Key results
Removing aviation taxes drives efficiency and connectivity growth to the benefit of the consumer Removing aviation taxes and reducing passenger-based charges could deliver businesses and individual consumers in Latin America and the Caribbean 5.8 to 7.9 billion USD of immediate direct consumer benefits, compared to a ‘do nothing scenario’. These direct consumer benefits ‘ripple’ through the rest of the economy and create wider economic benefits. We estimate the additional wider economic benefits at 1.0 to 1.5 billion USD, depending on the scenario.
2 We note that this study quantifies the consumer and wider economic benefits of tax
removal and charges reduction. The estimation of environmental externalities and the opportunity costs of a tax/ charges reduction (i.e. the impact of tax revenue spending in the wider economy) is outside the scope of this study).
3 Data on taxes and charges were derived from IATA’s Ticket Tax Box Service (TTBS)
iv
SEO AMSTERDAM ECONOMICS
Reducing aviation taxes has longer-term benefits for passenger demand, connectivity growth and the economy. We estimate that direct consumer benefits accumulate to 13.5 to 18.5 billion USD in 2035, creating an additional 1.5 billion to 2.2 billion USD of additional wider economic benefits, in the ‘Tax Removal’ scenario and ‘Tax Removal and Charges Reduction’ scenario respectively. The ‘Tax Removal’ scenario represents a total present (discounted) benefit of 122 billion USD over the period 2014-2035. The total present (discounted) benefits of the ‘Tax Removal and Charges Reduction’ scenario amounts to 170 billion USD over the same period. Total benefits (consumer benefits and wider economic benefits) consist of: • Lower fares as airlines are expected to pass on tax reductions to passengers in the long term; • Connectivity growth (more routes, more frequencies), resulting in more flexibility for
passengers and shorter travel times; • Wider economic benefits, created by agglomeration and productivity impacts, but also
additional jobs created in the economy. Depending on the scenario, immediate consumer benefits per passenger range between 50 and 66 USD per passenger. Benefits are higher for business (65-84 USD) than for leisure (46-61 USD) passengers.
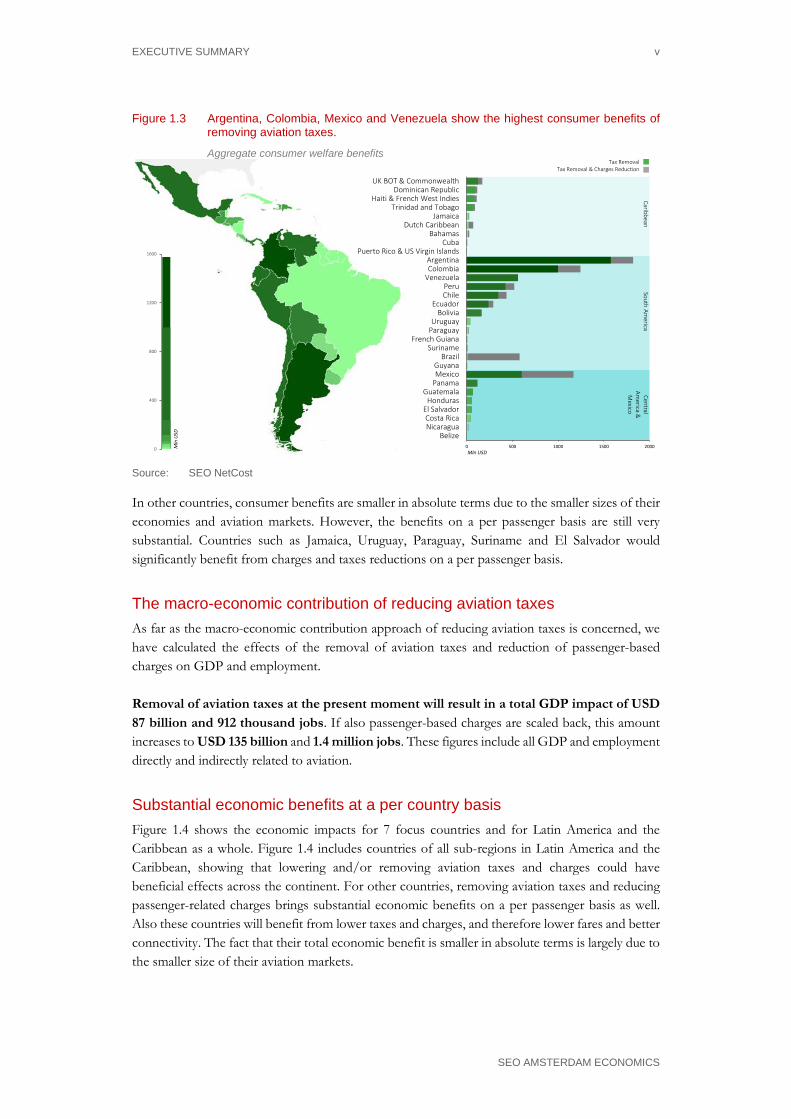
Consumer benefits per country Consumer benefits differ substantially by country. This is due to differences in the absolute amount of the taxes and charges reductions, but also due to differences in the size of the national aviation markets and forecasted future growth. The figure below shows the immediate direct consumer benefits of the scenarios ‘Tax Removal’ and ‘Tax Removal and Charges Reduction’ reduction at a per country basis. As far as the ‘Tax Removal’ scenario is concerned, consumer benefits are largest for Argentina, Colombia and Mexico. In countries that do not currently have aviation taxes (e.g. Brazil) or with small aviation markets, benefits are absent or very limited. In the scenario ‘Tax Removal and Charges Reduction’, benefits are largest for the same three countries.
EXECUTIVE SUMMARY v
SEO AMSTERDAM ECONOMICS
Figure 1.3 Argentina, Colombia, Mexico and Venezuela show the highest consumer benefits of removing aviation taxes.
Aggregate consumer welfare benefits
0 500 1000 1500 2000
BelizeNicaraguaCosta Rica
El SalvadorHonduras
GuatemalaPanamaMexicoGuyana
BrazilSuriname
French GuianaParaguayUruguay
BoliviaEcuador
ChilePeru
VenezuelaColombiaArgentina
Puerto Rico & US Virgin IslandsCuba
BahamasDutch Caribbean
JamaicaTrinidad and Tobago
Haiti & French West IndiesDominican Republic
UK BOT & Commonwealth
0
400
800
1200
1600
Mln USD
Mln
USD
Tax RemovalTax Removal & Charges Reduction
CentralAm
erica &M
exico
South America
Caribbean
Source: SEO NetCost
In other countries, consumer benefits are smaller in absolute terms due to the smaller sizes of their economies and aviation markets. However, the benefits on a per passenger basis are still very substantial. Countries such as Jamaica, Uruguay, Paraguay, Suriname and El Salvador would significantly benefit from charges and taxes reductions on a per passenger basis.
The macro-economic contribution of reducing aviation taxes As far as the macro-economic contribution approach of reducing aviation taxes is concerned, we have calculated the effects of the removal of aviation taxes and reduction of passenger-based charges on GDP and employment. Removal of aviation taxes at the present moment will result in a total GDP impact of USD 87 billion and 912 thousand jobs. If also passenger-based charges are scaled back, this amount increases to USD 135 billion and 1.4 million jobs. These figures include all GDP and employment directly and indirectly related to aviation.
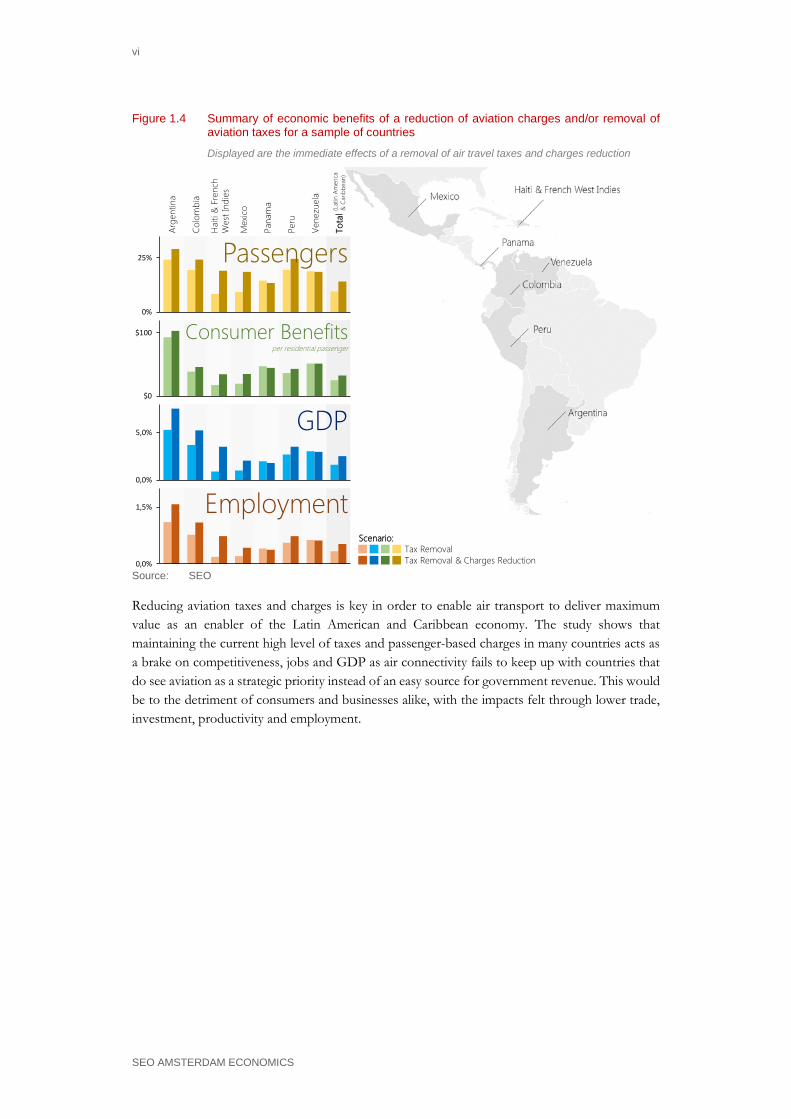
Substantial economic benefits at a per country basis Figure 1.4 shows the economic impacts for 7 focus countries and for Latin America and the Caribbean as a whole. Figure 1.4 includes countries of all sub-regions in Latin America and the Caribbean, showing that lowering and/or removing aviation taxes and charges could have beneficial effects across the continent. For other countries, removing aviation taxes and reducing passenger-related charges brings substantial economic benefits on a per passenger basis as well. Also these countries will benefit from lower taxes and charges, and therefore lower fares and better connectivity. The fact that their total economic benefit is smaller in absolute terms is largely due to the smaller size of their aviation markets.
vi
SEO AMSTERDAM ECONOMICS
Figure 1.4 Summary of economic benefits of a reduction of aviation charges and/or removal of aviation taxes for a sample of countries
Displayed are the immediate effects of a removal of air travel taxes and charges reduction
00%
25%
0$0
$100
00,0%
5,0%
00,0%
1,5%
Passengers
Consumer Benefitsper residential passenger
GDP
Employment
Arge
ntin
a
Colo
mbi
a
Hai
ti&
Fre
nch
Wes
tInd
ies
Mex
ico
Pana
ma
Peru
Vene
zuel
a
Tota
l(Lat
in A
mer
ica
& C
arib
bean
)
Tax RemovalTax Removal & Charges Reduction
Scenario:
Source: SEO
Reducing aviation taxes and charges is key in order to enable air transport to deliver maximum value as an enabler of the Latin American and Caribbean economy. The study shows that maintaining the current high level of taxes and passenger-based charges in many countries acts as a brake on competitiveness, jobs and GDP as air connectivity fails to keep up with countries that do see aviation as a strategic priority instead of an easy source for government revenue. This would be to the detriment of consumers and businesses alike, with the impacts felt through lower trade, investment, productivity and employment.

ECONOMIC BENEFITS OF REDUCING AVIATION TAXES IN LATIN AMERICA AND THE CARIBBEAN
SEO AMSTERDAM ECONOMICS
Table of contents
Executive summary.............................................................................................................. i Connectivity is key to competitiveness ........................................................................................... i
High tax burden limits the potential economic benefits of connectivity growth .................... i
Objectives of this study ................................................................................................................... iii
Key results .......................................................................................................................................... iii
Table of contents................................................................................................................. 7
1 Introduction ............................................................................................................... 1
2 How aviation connectivity supports economic growth and competitiveness .......... 3 2.1 Connectivity by air is key to competitiveness and growth ............................................. 3
2.2 Connectivity in Latin America: substantial opportunities for growth .......................... 6
2.3 Aviation taxes limit full economic potential of aviation connectivity .......................... 9
3 How aviation taxes limit connectivity and economic growth ................................. 11 3.1 Aviation taxes ....................................................................................................................... 11
3.2 The different impacts of aviation taxes ........................................................................... 12
3.3 Aviation tax case studies: Latin America ......................................................................... 16
3.4 Aviation tax case studies: Europe ..................................................................................... 17
3.5 Conclusions .......................................................................................................................... 22
4 Taxes and charges in Latin America and the Caribbean.........................................23
5 Scope and scenario definition ..................................................................................27 5.1 Scope ..................................................................................................................................... 27
5.2 Scenario definition............................................................................................................... 28
5.3 Immediate impact on passengers and movements ........................................................ 33
5.4 Future impact on passengers and movements ............................................................... 35
6 Calculating the economic benefits of reducing aviation taxes: two approaches .................................................................................................................................39 6.1 Two approaches to assess the economic benefits of aviation tax reduction ............. 39
6.2 Consumer benefit approach .............................................................................................. 39
6.3 Macro-economic approach ................................................................................................ 40
6.4 Differences between the two approaches ....................................................................... 41
7 Consumer benefits of reducing aviation taxes .........................................................45

viii
SEO AMSTERDAM ECONOMICS
7.1 Methodology ........................................................................................................................ 45
7.2 Overall benefits in Latin America and the Caribbean ................................................... 50
7.3 Consumer benefits up to 2035 .......................................................................................... 53
7.4 Cumulative benefits up to 2035 ........................................................................................ 55
8 Macro-economic contribution of reducing aviation taxes .......................................57 8.1 Methodology ........................................................................................................................ 57
8.2 Macro-economic contribution of reducing aviation taxes............................................ 58
8.3 Decomposition of GDP impacts into productivity and employment growth .......... 62
8.4 Wider catalytic impacts ....................................................................................................... 63
9 Economic benefits in Central America and Mexico ................................................67 9.1 Consumer benefits .............................................................................................................. 67
9.2 Macro-economic impacts ................................................................................................... 71
10 Economic benefits in the Caribbean .......................................................................75 10.1 Consumer benefits .............................................................................................................. 75
10.2 Macro-economic impacts ................................................................................................... 78
11 Economic benefits in South America ......................................................................83 11.1 Consumer benefits .............................................................................................................. 83
11.2 Macro-economic impacts ................................................................................................... 86
12 Conclusions ............................................................................................................. 91
Literature ............................................................................................................................93
ECONOMIC BENEFITS OF REDUCING AVIATION TAXES IN LATIN AMERICA AND THE CARIBBEAN 1
SEO AMSTERDAM ECONOMICS
1 Introduction
Growth in aviation connectivity strengthens competitiveness and delivers economic growth opportunities. However, in many countries in Latin America and the Caribbean, aviation taxes limit the full economic potential of aviation connectivity growth. This study provides insight into the economic benefits of removing aviation taxes and reducing passenger-based charges in Latin America and the Caribbean. Air transport in Latin America and the Caribbean supports 4.9 million jobs and contributes $ 153 billion USD to regional GDP.4 Aviation facilitates global contacts, mobility and trade. It generates agglomeration economies, stimulates productivity, trade, R&D and foreign direct investment. All in all, the aviation industry contributes significantly to the economy in Latin America and the Caribbean. Despite its economic value, many governments in the region view air transport as a luxury for the wealthy, rather than a catalyst for economic growth. As a result, aviation is an easy target for taxation. Such taxes are not intended to cover the cost of the use of aviation system infrastructure and services, but merely to generate general government income, without accounting for the negative impacts that constraining aviation demand/ connectivity has on economic growth and productivity. For example, some Latin American states apply VAT and other taxes on domestic and international flights. Brazilian airlines currently pay some of the highest fuel charges in the world, 17 percent above the global average. Ecuador is looking into a similar pricing model that could raise fuel costs there by as much as 30 percent. Panama plans to raise air navigation charges 97 percent and Peru levies a 16 percent VAT on air traffic control charges.5 These kind of taxes deviate from global standards, and are often in conflict with the Chicago Convention and ICAO rules.6 Governments in the region may not fully realize that taxation leads to discouraged travel, which limits connectivity. The high tax burdens in some countries could prevent them to fully unlock the economic benefits that air transport can bring in today’s globalized society. Against this background, this study provides insight into the economic benefits of reducing aviation taxes. More specifically, it answers the following questions: • What is the current economic impact of the removal of aviation taxes and reduction of passenger-based
charges in Latin America and the Caribbean? • What will be the future consumer and economic benefits of the removal of aviation taxes and reduction of
passenger-based charges for countries in Latin America and the Caribbean?
4 IATA News Brief: LatAM Growth Delivers Economic and Social Benefits. 7 June 2015. 5 IATA Press Release No.: 53. Enabling Aviation to Drive Growth in Latin America. 16 November 2015. 6 ICAO’s Policies on Taxation in the Field of International Air Transport. Doc. 8632. Third Edition, 2000.

ECONOMIC BENEFITS OF REDUCING AVIATION TAXES IN LATIN AMERICA AND THE CARIBBEAN 3
SEO AMSTERDAM ECONOMICS
2 How aviation connectivity supports economic growth and competitiveness
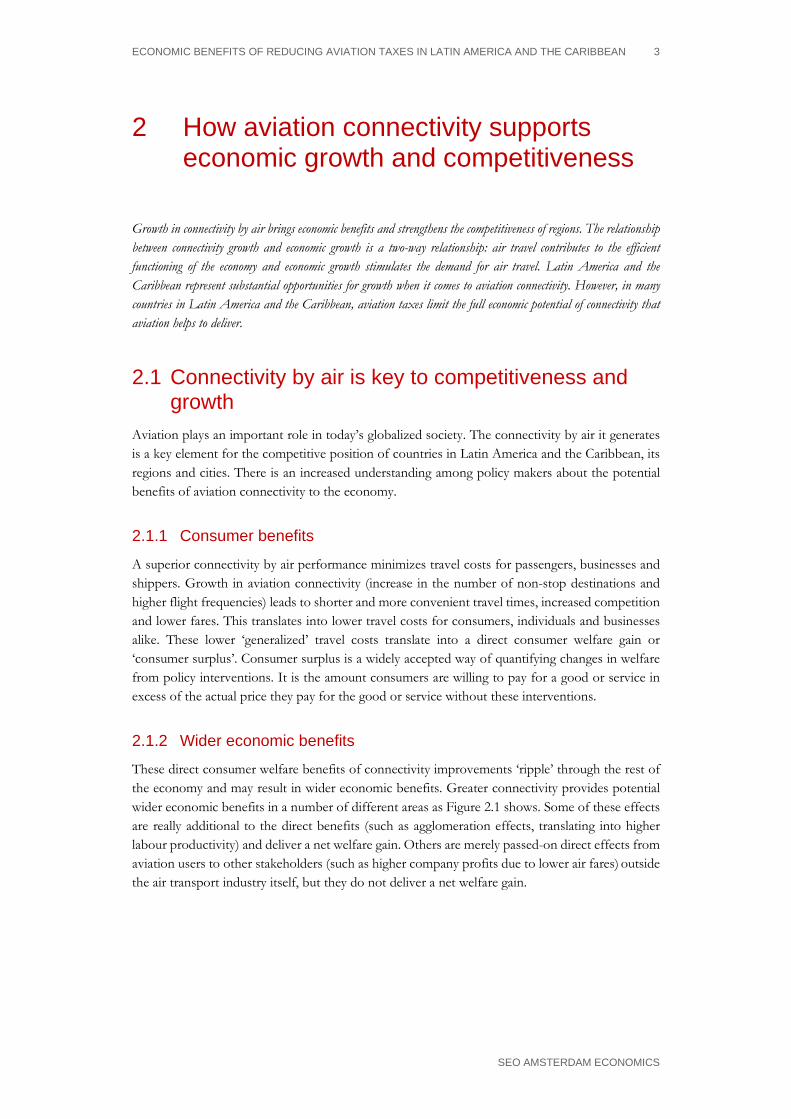
Growth in connectivity by air brings economic benefits and strengthens the competitiveness of regions. The relationship between connectivity growth and economic growth is a two-way relationship: air travel contributes to the efficient functioning of the economy and economic growth stimulates the demand for air travel. Latin America and the Caribbean represent substantial opportunities for growth when it comes to aviation connectivity. However, in many countries in Latin America and the Caribbean, aviation taxes limit the full economic potential of connectivity that aviation helps to deliver.
2.1 Connectivity by air is key to competitiveness and growth
Aviation plays an important role in today’s globalized society. The connectivity by air it generates is a key element for the competitive position of countries in Latin America and the Caribbean, its regions and cities. There is an increased understanding among policy makers about the potential benefits of aviation connectivity to the economy.
2.1.1 Consumer benefits
A superior connectivity by air performance minimizes travel costs for passengers, businesses and shippers. Growth in aviation connectivity (increase in the number of non-stop destinations and higher flight frequencies) leads to shorter and more convenient travel times, increased competition and lower fares. This translates into lower travel costs for consumers, individuals and businesses alike. These lower ‘generalized’ travel costs translate into a direct consumer welfare gain or ‘consumer surplus’. Consumer surplus is a widely accepted way of quantifying changes in welfare from policy interventions. It is the amount consumers are willing to pay for a good or service in excess of the actual price they pay for the good or service without these interventions.
2.1.2 Wider economic benefits
These direct consumer welfare benefits of connectivity improvements ‘ripple’ through the rest of the economy and may result in wider economic benefits. Greater connectivity provides potential wider economic benefits in a number of different areas as Figure 2.1 shows. Some of these effects are really additional to the direct benefits (such as agglomeration effects, translating into higher labour productivity) and deliver a net welfare gain. Others are merely passed-on direct effects from aviation users to other stakeholders (such as higher company profits due to lower air fares) outside the air transport industry itself, but they do not deliver a net welfare gain.

4 CHAPTER 2
SEO AMSTERDAM ECONOMICS
Figure 2.1 Aviation connectivity growth results in consumer benefits and wider economic benefits
Source: SEO
Larger customer base An improvement in connectivity levels means lower costs for businesses to access a larger customer base for their products or services. This is in particular important for high-tech and knowledge-based sectors, as well as suppliers of time sensitive goods (IATA 2007). Even in a world with alternative forms of long-distance communication, face-to-face meetings with business partners remain an important part of doing business.
Higher productivity By expanding the customer base, air transport allows companies to exploit economies of scale and to reduce unit costs. By exposing domestic companies to increased foreign competition, it also helps to drive efficiency improvements among domestic firms in order to remain competitive. Connectivity growth can also result in a concentration of economic activities in airport regions, where companies then start to benefit from each other’s presence in terms of a pooled labour market and knowledge spill overs (the so-called agglomeration effects).
Improved efficiency of the supply chain Many industries rely on air transport to operate ‘just-in-time’ production. Air transport provides them with the flexibility needed to reduce costs by minimizing the need to hold stocks of supplies. The growth of air transport has contributed to the globalization and unbundling of supply chains, which have led to improved efficiency.
Enabling foreign direct investment Access to extensive air transport links allows domestic firms to identify and manage investments in foreign-based assets and encourages foreign firms to invest in the domestic economy.
Innovation Improved air links foster effective networking and collaboration between companies and researchers in different parts of the world. Access to a greater number of markets and exposure to foreign competition also stimulate R&D spending by companies, given the increased size of the potential market for future sales.
Greater connectivity
More competitionHigher frequencies More direct routes
Shorter travel times Lower faresMore flexibility
Lower travel costs
Access to largercustomer base
Labour productivitygains
Improved efficiency in supply chain
Enabling foreigndirect investment
Innovation/ Research and Development
Consumer welfare gains for existing +
new demand
Direct
consumer
benefits
Wider
economic
effects
Benefits of im
provedconnectivity
HOW AVIATION CONNECTIVITY SUPPORTS ECONOMIC GROWTH AND COMPETITIVENESS 5
SEO AMSTERDAM ECONOMICS
There is increasing evidence on the wider economic benefits of connectivity growth, both additional and non-additional. The box below provides an overview of a number of studies considering the wider economic benefits of aviation growth. Empirical evidence on the wider economic benefits of connectivity growth • Headquarters. Research of the University of Barcelona finds that a 10 percent growth in the number of
intercontinental flights results in a 4 percent growth in the number of headquarters in European metropolitan areas (Bel & Fageda 2008), controlling for causality via a simultaneous equation system.
• Productivity. According to InterVISTAS (2015) a 10 percent growth in connectivity by air is associated with a 0.5 percent growth in GDP/capita at the national level in Europe. IATA (2007) finds that a 10 percent growth in connectivity, relative to GDP, can increase long-term productivity in terms of GDP per hour worked by 0.07 percent.
• Foreign Direct Investment. Opening of new routes to Italian regions is associated with increases in Foreign Direct Investments in the years after the route opening (Bannò & Redondi 2014). For the UK, a 10 percent increase in seat capacity is associated with a 1.9 percent increase in FDI outflows and 4.7 percent FDI inflows (PWC 2014).
• Trade. Belenkiy & Riker (2012) find that each additional business trip in the United States increases U.S. commodity exports to the visited country by almost 37,000 USD. For the UK, a 10 percent increase in seat capacity is associated with a 1.7 percent increase in UK goods imports and a 3.3 percent in goods exports (PWC 2014).
• Tourism. For the UK, a 10 percent increase in seat capacity results in a 4 percent increase in inbound tourists and a 3 percent increase in outbound tourists (PWC 2014).
• Innovation. According to the work of Hovhannisyan & Keller (2014), a 10 percent increase in business travel leads to an increase in patenting by about 0.2 percent, based on research in 37 industries in 34 countries, covering outward business travel from the United States. Baruffaldi (2015) finds that firms located in German regions where airline liberalization induced a higher level of interregional knowledge integration, innovative productivity increased significantly.
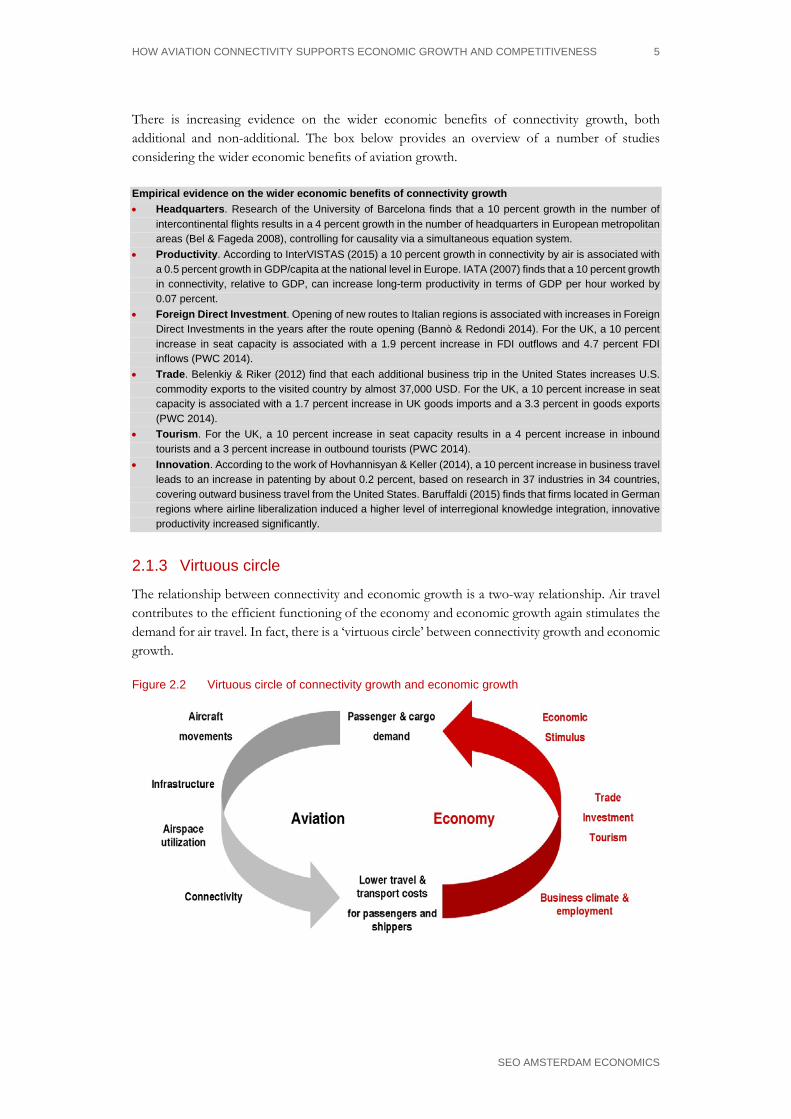
2.1.3 Virtuous circle
The relationship between connectivity and economic growth is a two-way relationship. Air travel contributes to the efficient functioning of the economy and economic growth again stimulates the demand for air travel. In fact, there is a ‘virtuous circle’ between connectivity growth and economic growth.
Figure 2.2 Virtuous circle of connectivity growth and economic growth
6 CHAPTER 2
SEO AMSTERDAM ECONOMICS
2.1.4 Jobs and GDP
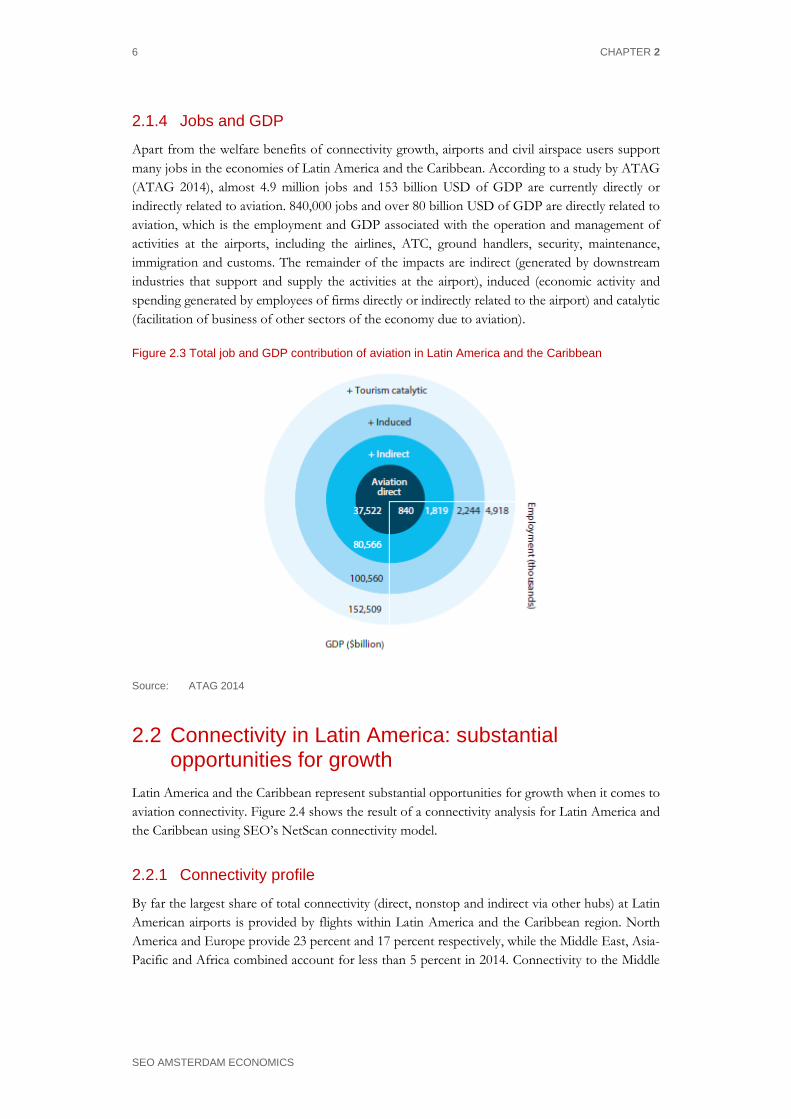
Apart from the welfare benefits of connectivity growth, airports and civil airspace users support many jobs in the economies of Latin America and the Caribbean. According to a study by ATAG (ATAG 2014), almost 4.9 million jobs and 153 billion USD of GDP are currently directly or indirectly related to aviation. 840,000 jobs and over 80 billion USD of GDP are directly related to aviation, which is the employment and GDP associated with the operation and management of activities at the airports, including the airlines, ATC, ground handlers, security, maintenance, immigration and customs. The remainder of the impacts are indirect (generated by downstream industries that support and supply the activities at the airport), induced (economic activity and spending generated by employees of firms directly or indirectly related to the airport) and catalytic (facilitation of business of other sectors of the economy due to aviation).
Figure 2.3 Total job and GDP contribution of aviation in Latin America and the Caribbean
Source: ATAG 2014
2.2 Connectivity in Latin America: substantial opportunities for growth
Latin America and the Caribbean represent substantial opportunities for growth when it comes to aviation connectivity. Figure 2.4 shows the result of a connectivity analysis for Latin America and the Caribbean using SEO’s NetScan connectivity model.
2.2.1 Connectivity profile
By far the largest share of total connectivity (direct, nonstop and indirect via other hubs) at Latin American airports is provided by flights within Latin America and the Caribbean region. North America and Europe provide 23 percent and 17 percent respectively, while the Middle East, Asia-Pacific and Africa combined account for less than 5 percent in 2014. Connectivity to the Middle

HOW AVIATION CONNECTIVITY SUPPORTS ECONOMIC GROWTH AND COMPETITIVENESS 7
SEO AMSTERDAM ECONOMICS
East tripled in the period between 2004 and 2014, while Asia-Pacific and Africa more than doubled. Connectivity within Latin America and the Caribbean and connectivity to Europe increased by 28 percent and 23 percent respectively, while North America grew with just 4 percent, making it the slowest grower of all the world regions.
Figure 2.4 Direct, indirect and airport connectivity growth at airports in Latin America and the Caribbean by world destination region, 2004-2014
28%
108%
119%
201%
4%
22%
23%
Latin America & Caribbean
Africa
Asia-Pacific
Middle East
North America
Europe
Total
Connectivity growth 2004-2014 by destination region
Latin America & Caribbean
57%
Africa0%
Asia-Pacific2%
Middle East1%
North America23%
Europe17%
Share in total connectivity by destination region 2014
Source: SEO NetScan Note: Connectivity is defined as the number of direct and indirect connections, weighted for the quality of
those connections. See for example Burghouwt et al. (2009).
2.2.2 Connectivity per capita
Unsurprisingly, when looking at connectivity per capita, the countries with a strong tourism industry and small population come out on top (Figure 2.5). Belize, the Dutch Caribbean, the Bahamas and UK British Overseas Territories & Commonwealth all had figures close to or above 3 connectivity units (CNUs)7 per thousand inhabitants. Furthermore, Puerto Rico & US Virgin Islands, Panama, Trinidad and Tobago, French Guiana, Costa Rica, Jamaica and Suriname were all at least 50 percent above the continental average of 0.24 CNUs per thousand inhabitants. From the larger countries, Chile shows particularly high connectivity per capita levels with 0.31 CNUs per thousand inhabitants. The countries with relatively low levels of connectivity per capita in 2014 were Nicaragua, Venezuela, French Guiana, Guatemala and Paraguay all with less than 0.1 CNUs per thousand inhabitants.
7 Connectivity is defined as the number of direct and indirect connections, weighted for the quality of those
connections in terms of detour and transfer time. See for example Burghouwt et al. (2009).

8 CHAPTER 2
SEO AMSTERDAM ECONOMICS
Figure 2.5 Connectivity per capita is particularly high in the small islands of the Caribbean
Total direct and indirect connectivity per 1000 inhabitants in 2014 by country
CNUs per 1000 inhabitants0 0,5 1 1,5 2
ParaguayGuatemalaVenezuelaNicaragua
CubaHaiti & French West Indies
GuyanaHonduras
PeruArgentina
EcuadorMexicoBolivia
El SalvadorBrazil
Dominican RepublicColombiaUruguay
ChileSuriname
JamaicaCosta Rica
French GuianaTrinidad and Tobago
PanamaPuerto Rico & US Virgin Islands
UK BOT & CommonwealthBahamas
Dutch CaribbeanBelize
0
0,5
1
1,5
2
CNU
spe
r 100
0 in
habi
tant
s
12,2
2,96
8,18
12,09
4,85
Regional Average
Source: SEO NetScan Note: Connectivity is defined as the number of direct and indirect connections, weighted for the quality of
those connections. Connectivity is expressed in CNUs (Connectivity Units). See for example Burghouwt et al. (2009).
2.2.3 Changes in connectivity performance
Figure 2.6 displays the development in total connectivity in Latin America and the Caribbean between 2004 and 2014. Within the region, Bolivia, Panama and Colombia showed by far the highest aviation connectivity growth figures, with 185 percent, 144 percent and 107 percent respectively. Other countries that outperformed the regional average of 23 percent include Peru, Ecuador, El Salvador, the Dominican Republic, Brazil, Argentina and Belize. However, 13 out of the 31 analyzed territories show a decline in connectivity. Perhaps most alarming is the case of Venezuela, where connectivity decreased more than 35 percent in only ten years. A reason for the sharp decline is the strong decline in economic growth, partly driven by the contraction in international oil prices and a strongly expansive monetary policy, which drove up inflation. Instead of viewing aviation as a strategic asset, the government apparently considers aviation as a source of revenue, resulting in high unit taxes and further declines in aviation connectivity.

HOW AVIATION CONNECTIVITY SUPPORTS ECONOMIC GROWTH AND COMPETITIVENESS 9
SEO AMSTERDAM ECONOMICS
Figure 2.6 Connectivity growth particularly high in Bolivia, Colombia and Panama
Total direct and indirect connectivity growth 2004-2014 by country
-100% 0% 100% 200%
UK BOT & CommonwealthVenezuela
BahamasPuerto Rico & US Virgin Islands
French GuianaDutch Caribbean
HondurasJamaicaMexico
GuatemalaTrinidad and Tobago
Haiti & French West IndiesNicaraguaCosta Rica
CubaGuyana
ParaguayUruguay
ChileSuriname
BelizeArgentina
BrazilDominican Republic
El SalvadorEcuador
PeruColombia
PanamaBolivia
Connectivity growth 2004-2014 (CNUs)-100%
-50%
0%
50%
100%
150%
200%
Conn
ectiv
ity g
row
th 2
004-
2014
(CN
Us)
Regional Average
Source: SEO NetScan Note: Connectivity is defined as the number of direct and indirect connections, weighted for the quality of
those connections. Connectivity is expressed in CNUs (Connectivity Units). See for example Burghouwt et al. (2009).
2.3 Aviation taxes limit full economic potential of aviation connectivity
However, in many countries in Latin America and the Caribbean, aviation taxes limit the full economic potential of connectivity that aviation helps to deliver. Although a full analysis of the explanation of connectivity growth differentials in Latin America and the Caribbean is outside the scope of this study, the modest overall 2004-2014 connectivity growth is likely to have been influenced by the often burdensome aviation taxation regimes in various countries. Despite its economic value, many governments in the region view air transport as a luxury for the wealthy, rather than a catalyst for economic growth. As a result, aviation is an easy target for taxation. Such taxes are not intended to cover the cost of the use of aviation system infrastructure and services, but solely to generate general government income. Governments in the region generally do not consider that taxation leads to discouraged travel, which limits connectivity. In addition, passenger-related charges are particularly high in a number of countries. In many cases, a share of these charges is not intended to cover costs of aviation-related services and infrastructure, but as a means to generate additional government revenue. They are in fact ‘hidden taxes’. The high tax burdens in a number of countries in the region will prevent them from fully unlocking the economic benefits that air transport can bring in today’s globalized society. In the next chapter, we first discuss how aviation taxes work out on the economy and then highlight a number of experiences with aviation taxes throughout the world. We then survey the current

10 CHAPTER 2
SEO AMSTERDAM ECONOMICS
aviation taxes in Latin America and the Caribbean and derive an average tax rate per country in Chapter 4.

ECONOMIC BENEFITS OF REDUCING AVIATION TAXES IN LATIN AMERICA AND THE CARIBBEAN 11
SEO AMSTERDAM ECONOMICS
3 How aviation taxes limit connectivity and economic growth
Many countries in Latin America and the Caribbean levy aviation taxes. Studies on the impact of aviation taxes often show that the net economic impact of such taxes for the national economy is negative. First of all, government revenues from the tax are much lower than expected due to passenger demand reductions and the decrease in other government revenue streams, which are indirectly related to aviation (VAT, profit-based taxes). Secondly, the costs for the broader economy are often higher relative to the income generated for the government. A number of case studies highlights the impacts of aviation taxes in various countries.
3.1 Aviation taxes Many countries in Latin America and the Caribbean levy aviation taxes. In most cases, air travel taxes are rates per departing passenger, differentiated by distance category and travel class. For passengers travelling longer distances and passengers travelling in premium classes, airlines may pay a higher air travel tax. The same holds for domestic versus international passengers. Transfer and transit passengers are mostly exempted from paying taxes, given their high (cross-) price elasticity and footlooseness. Taxes can be either a flat rate per flight and travel category or a percentage of the ticket price, differentiated by category. As we will see in Chapter 4, this is also the case in Latin America and the Caribbean. In practice, taxes and charges cannot always be clearly distinguished. Some countries may not have official aviation taxes, but only passenger-based charges, which are higher than the underlying costs they are intended to cover. In such cases, the charge may party be a ‘real’ charge and partly a ‘hidden’ tax. The existence of the ‘hidden’ taxes is the reason that in this study we also consider a scenario in which passenger-based charges in Latin America and the Caribbean are reduced. In order to create social acceptance, air travel taxes are often labelled as environmental measures to reduce carbon emissions. They may also be presented as charges to cover airport (service) expense, but may actually be (partly) a ‘hidden’ tax when the amounts collected are well above the underlying costs. In other words, air travel taxes are often revenue-raising measures to finance the general funds of the central government, justified by other arguments. Finally, we note that from a global perspective the aviation industry is highly-taxed in comparison to other transport modes: airlines pay –through taxes and user charges- in full or more for their associated infrastructure costs, whereas other transport modes are frequently heavily subsidised.8
8 IATA (2005)

12 CHAPTER 3
SEO AMSTERDAM ECONOMICS
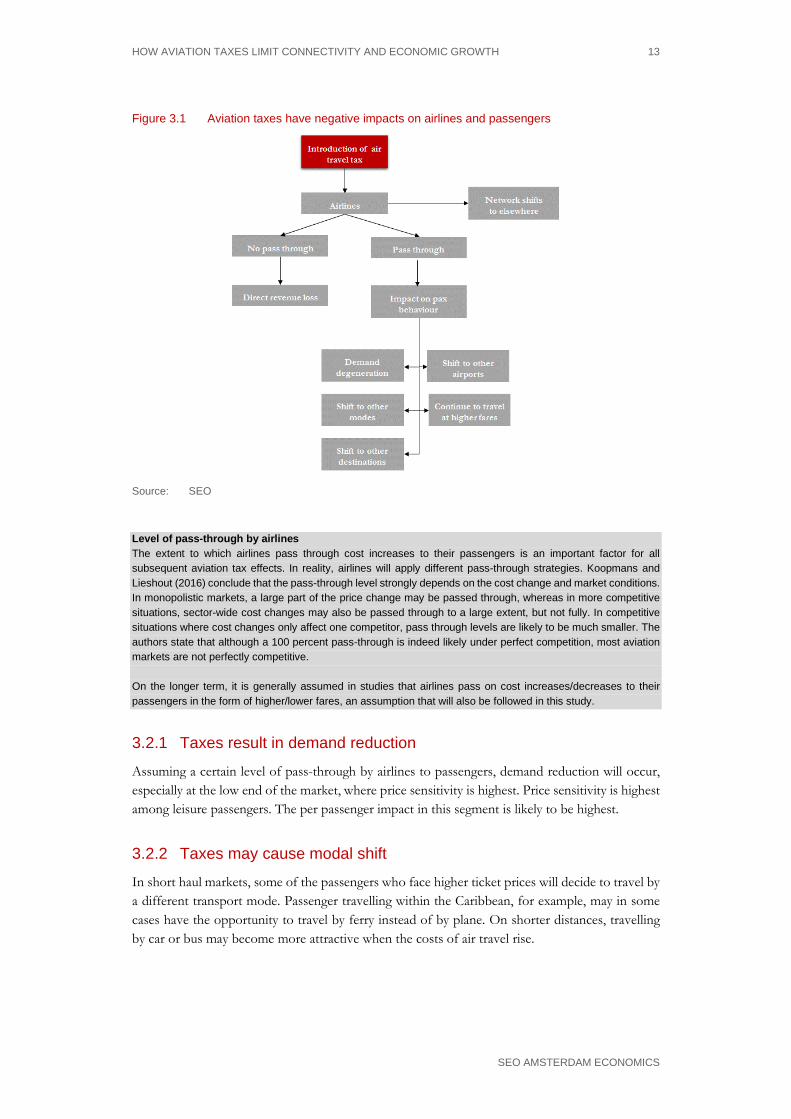
3.2 The different impacts of aviation taxes What is the impact of the introduction of an aviation tax? In general, the effects of aviation taxes can be broken down into a number of elements: 1. The tax collecting authority will impose an air travel tax, whereby airlines bear full
responsibility for levying, collecting and remitting the tax. Overall, this results in an increase in the cost of air travel.
2. The airline may decide to ‘absorb’ the tax and reduce the market price of air travel to ensure the total price paid by passengers remains the same. As a result, airline profits decrease.
3. Lower profits can induce airlines to adjust their networks, for example by cutting frequencies or cancelling routes altogether. Lower profit expectations may also lead to foregone connectivity opportunities: airlines do not start new routes or do not increase frequencies due to the higher cost levels.
4. In the longer term, it is generally assumed that airlines will pass on higher costs to the airline passengers, influencing passenger behaviour. Passenger can for example choose to: • Cancel their travel plans (market degeneration); • Choose to travel with another travel mode (car, train, ferry); • Travel from another (foreign) airport; • Travel to another (tourist) destination; • Continue to travel as they did before, but at a higher cost.
5. In general, taxation leads to demand reduction, resulting in fewer passengers. In addition, fewer passengers and revenues may also force airlines to decrease frequencies, cancel routes altogether and grow their network at other airports. Tax introductions can therefore induce connectivity losses and foregone growth opportunities.
6. Finally, the introduction of air travel taxes has consequences for the government, travellers and aviation-related sectors in the economy: • Tax income for the government; • Unemployment increases, related to the reduction in traffic, leading to higher
unemployment expenses for governments; • Less government revenues from VAT and profit-based taxes; • Higher costs (in time and money) for travellers, constituting a negative welfare impact; • Negative impacts for aviation-related businesses, such as the tourism industry.
HOW AVIATION TAXES LIMIT CONNECTIVITY AND ECONOMIC GROWTH 13
SEO AMSTERDAM ECONOMICS
Figure 3.1 Aviation taxes have negative impacts on airlines and passengers
Source: SEO
Level of pass-through by airlines The extent to which airlines pass through cost increases to their passengers is an important factor for all subsequent aviation tax effects. In reality, airlines will apply different pass-through strategies. Koopmans and Lieshout (2016) conclude that the pass-through level strongly depends on the cost change and market conditions. In monopolistic markets, a large part of the price change may be passed through, whereas in more competitive situations, sector-wide cost changes may also be passed through to a large extent, but not fully. In competitive situations where cost changes only affect one competitor, pass through levels are likely to be much smaller. The authors state that although a 100 percent pass-through is indeed likely under perfect competition, most aviation markets are not perfectly competitive. On the longer term, it is generally assumed in studies that airlines pass on cost increases/decreases to their passengers in the form of higher/lower fares, an assumption that will also be followed in this study.
3.2.1 Taxes result in demand reduction
Assuming a certain level of pass-through by airlines to passengers, demand reduction will occur, especially at the low end of the market, where price sensitivity is highest. Price sensitivity is highest among leisure passengers. The per passenger impact in this segment is likely to be highest.
3.2.2 Taxes may cause modal shift
In short haul markets, some of the passengers who face higher ticket prices will decide to travel by a different transport mode. Passenger travelling within the Caribbean, for example, may in some cases have the opportunity to travel by ferry instead of by plane. On shorter distances, travelling by car or bus may become more attractive when the costs of air travel rise.

14 CHAPTER 3
SEO AMSTERDAM ECONOMICS
3.2.3 Taxes may lead to increased use of foreign airports
Air travel taxes may induce demand shifts to foreign airports. Such passenger ‘leakage’ effects can be very profound in countries that face competition from border airports in neighbouring countries. As a result of the introduction of the Dutch air travel tax for example, almost one million passengers moved from Dutch airports to border airports in Germany and Belgium, such as Weeze, Düsseldorf and Brussels. However, in case of island airports and airports located at considerable distance from foreign airports, such ‘leakage’ is less likely. Because of the geography in Latin America and the Caribbean and the spatial distribution of airports, traffic ‘leakage’ to foreign airports is not a factor of major importance. Figure 3.2 shows that from the 471 airports in Latin America that had scheduled service in 2014, 104 of them could be classified as medium/large airports with more than 500,000 seats per annum. Only 33 of them had another medium/large airports with a 150km radius, of which 2 were foreign airports. Yet, the overlap in the networks of these 2 airports is limited. This means that foreign airport demand leakage is not a factor of substantial importance in the region under consideration.
Figure 3.2 Demand ‘leakage’ to foreign airports due to taxation not a factor of major importance in Latin America
471
104
33
2
Total airports in Latin America
Airports with seat capacity higher than 500,000 seats per year in 2014 (‘big’ airports)
‘Big’ airports with other ‘big’airports within a 150km radius
‘Big’ airports where competing ‘big’airport is from a different country
IGU (Brazil)1,117,191 seats (2014)
IGR (Argentina)530,998 seat (2014)
Source: OAG; analysis SEO
Hub airports In most cases, air travel taxes do not apply to transfer passengers. If they are introduced in the transfer segment at hub airports and passed through by airlines to their passengers, impacts on passenger demand are generally very substantial: the number of travel options in many transfer markets is large, passengers are very price sensitive and cross-price elasticities are often -3 or lower.
HOW AVIATION TAXES LIMIT CONNECTIVITY AND ECONOMIC GROWTH 15
SEO AMSTERDAM ECONOMICS
3.2.4 Destination shift and loss of tourism market share
In typical tourism markets such as the Caribbean, the relevant market often does not constitute the narrow passenger market but the broader holiday market. Hence, price increases due to the introduction or changes in aviation taxes may lead to substitution of one tourism destination by another. Studies have revealed that tourism competitiveness is sensitive to price changes (see e.g. Dwyer & Forsyth 2011)
3.2.5 Network changes
As a result of the introduction of taxes, airlines may adjust their networks. In particular with regard to the airports served and the level of service (frequency). Low-cost carriers in particular, being footloose, are able to move operations from airports that face the air travel tax to airports abroad without the tax very quickly. Obviously, large network carriers are more captive: they are tied to their respective hub airports and will not be able to move (a substantial part of) their network to other airports. In addition, airlines will try to adapt to demand changes as a result of price changes. This implies that airlines may cut back frequencies at routes that face substantially declining traffic numbers or profit levels, resulting from the introduction of an air travel tax.
3.2.6 Second order impacts of network adjustments
Network changes can induce second order impacts. When airlines cut back on their route network as a result of taxes, connectivity at the affected airports decreases. This will affect passenger behaviour and may induce additional decreases in passenger numbers, on top of the first order impacts of passenger demand.
3.2.7 Impact on the economy
Going back to our discussion on the economic value of connectivity, implementation or increases in aviation taxes will have a range of different impacts. Increasing or implementing aviation taxes will: • Increase airfares for passengers when airlines pass through cost increases to their customers.
These higher travel costs constitute a direct consumer welfare loss, which ‘ripples’ through the rest of the economy;
• Higher cost for air travel will lead to demand degeneration: less people travel. In addition, demand reductions may also force airlines to close routes or reduce frequencies, leading to lower connectivity levels. Lower connectivity levels in itself will increase travel time cost for passengers, additional passenger demand losses and additional consumer welfare losses;
• Lower traffic throughput and lower connectivity may have macro-economic consequences at the country and regional levels. This includes reductions in (regional) employment, reductions in the economic contribution of aviation to GDP and a less attractive business climate (foreign direct investment, tourism, trade, R&D). In addition, labour productivity may be negatively affected;
• Decrease in government revenues from sources such as VAT and corporation tax and an increase in government expenditure on items such as social security.
16 CHAPTER 3
SEO AMSTERDAM ECONOMICS
Net economic impact of taxes often negative A number of studies on the impact of aviation taxes show that the net economic impact of such taxes for the national economy is often negative. First of all, government revenues from the tax are much lower than expected due to passenger demand reductions and the decrease in other government revenue streams, which are indirectly related to aviation (VAT, profit tax). Secondly, the costs for the broader economy are often higher than the income generated for the government.
3.3 Aviation tax case studies: Latin America Well-researched experiences with aviation taxes in various countries show that aviation taxes have a substantial downward impact on passenger numbers, constrain connectivity growth and result in foregone economic benefits to the country in which the tax is applied.
3.3.1 Impact of proposed international transfer passenger charge in Peru
In 2013, the Peruvian government announced that it might allow Lima Airport Partner to introduce a charge on transfer passengers, as to finance airport expansion. According to IATA (2013b), the charge would entail a $ 31 one-way charge and a $ 62 return charge. This would constitute a 5 percent increase on an average return trip via Peru. IATA estimated the impact of such a transfer passenger charge on Jorge Chávez Airport in Lima, one of the major connecting points in Latin America. The transfer market is generally very price sensitive and footloose, as many close substitutes exist and a large part of the market consists of price sensitive (leisure/VFR) passengers. Hence, substantial impacts on transfer passenger demand are to be expected. IATA (2013b) estimated the decrease in transfer passenger demand in the range of 15-20 percent, assuming a transfer price elasticity of -3 to -4. This equals a fall of 190,000 to 200,000 in international transfer passengers. The fall in transfer passengers could make the various routes from the airport unprofitable for airlines to operate, forcing their closure. This would negatively affect Peru’s connectivity to international markets. IATA estimated the resulting GDP decrease for Peru at $ -17 to $ -23 million, the resulting jobs losses at -1,168 to -1,558 jobs and the reduction in annual contribution to public finances to $ -14 to $ -18 million. The latter would cut the expected revenues of the charge by half.
3.3.2 Impact of proposed tax on foreign visitors to Chile
An aviation tax proposal for Chile was introduced. The tax proposal entailed a tax on foreign visitors of $ 20 per arrival. IATA (2013c) estimated that the tax would result in a drop of 22,000 foreign visitor arrivals by air, or a reduction of 2 percent. The reduction was estimated to result in $ 37 million GDP reduction, a reduction of 1,000 jobs and a reduction in annual contribution to public finances of $ 8 million. The tax proposal was eventually dropped in 2013. The negative economic impacts associated with the proposed tax in Chile proved to outweigh the benefits from a government revenue perspective and was ultimately not implemented.
HOW AVIATION TAXES LIMIT CONNECTIVITY AND ECONOMIC GROWTH 17
SEO AMSTERDAM ECONOMICS
3.4 Aviation tax case studies: Europe
3.4.1 UK Air Passenger Duty
The UK Air Passenger Duty (ADP) has been in place since 1994 (KiM 2011) as a flat rate per passenger of £ 5 and £ 10 depending on the class of seat purchased. Since 1994, the structure of the tax has been reformed and the APD has increased. As of 1 April 2015, the APD was between £ 13 and £ 142 per passenger, depending on distance band and class of travel. A study by PWC (2015)9 found that abolition of the tax would generate a positive stimulus to the UK economy of 0.5 percent in the first year. PWC expects the economy to be £ 18 GBP billion larger than would be the case with the APD. Over time, the benefits of the APD abolition dissipate but still generate a 0.1 percent long-term gain on GDP. APD abolition would also generate 61,000 additional jobs between 2015 and 2020. PWC also estimated that the indirect tax benefits of APD abolition (due to income tax, corporation tax etc.) would outweigh the decreased APD income for the government. A study by Oxford Economics (2012) for the World Travel and Tourism Council reports that abolition of the APD at that time would result in an increase of up to £ 4.2 billion in GDP and the creation of 91,000 jobs.
3.4.2 Dutch air passenger tax
On 1 July 2008, the Dutch government implemented the air passenger tax at Dutch airports, as one of the instruments for ‘greening’ the tax system. The tax entailed a fee of € 11.25 for departing passengers from Dutch airports to European destinations and a fee of € 45 for departing passengers from Dutch airports to intercontinental destinations (SEO 2009). Transfer passengers were exempted from the air passenger tax. Tax revenue would not be used for the aviation industry itself. The air passenger tax had been subject to an impact assessment, which indicated that the number of air passengers would drop by 8 percent to 10 percent (Significance & SEO 2007). When the tax was actually implemented, the number of passengers from Dutch airports did indeed decrease. The impact was further accentuated by the global economic crisis. As part of the economic recovery plan of the Dutch government, the air passenger tax was set to zero as per 1 July 2009, and abolished on 1 January 2010. Immediately following the introduction of the tax, the number of passengers departing from Amsterdam Airport Schiphol decreased, whereas the number of transfer passengers continued to increase. The decrease cannot be fully attributed to the tax, as the economic crisis started around the same time, which also had a downward impact on the number of passengers. In addition, already before the introduction, Dutch air passengers had started to increasingly use German and Belgian airports because of the supply of low-cost flights at border airports such as Dusseldorf Weeze and Charleroi. A conservative estimate by the KiM Netherlands Institute for Transport
9 The PWC 2015 study is an update of its 2013 study.
18 CHAPTER 3
SEO AMSTERDAM ECONOMICS
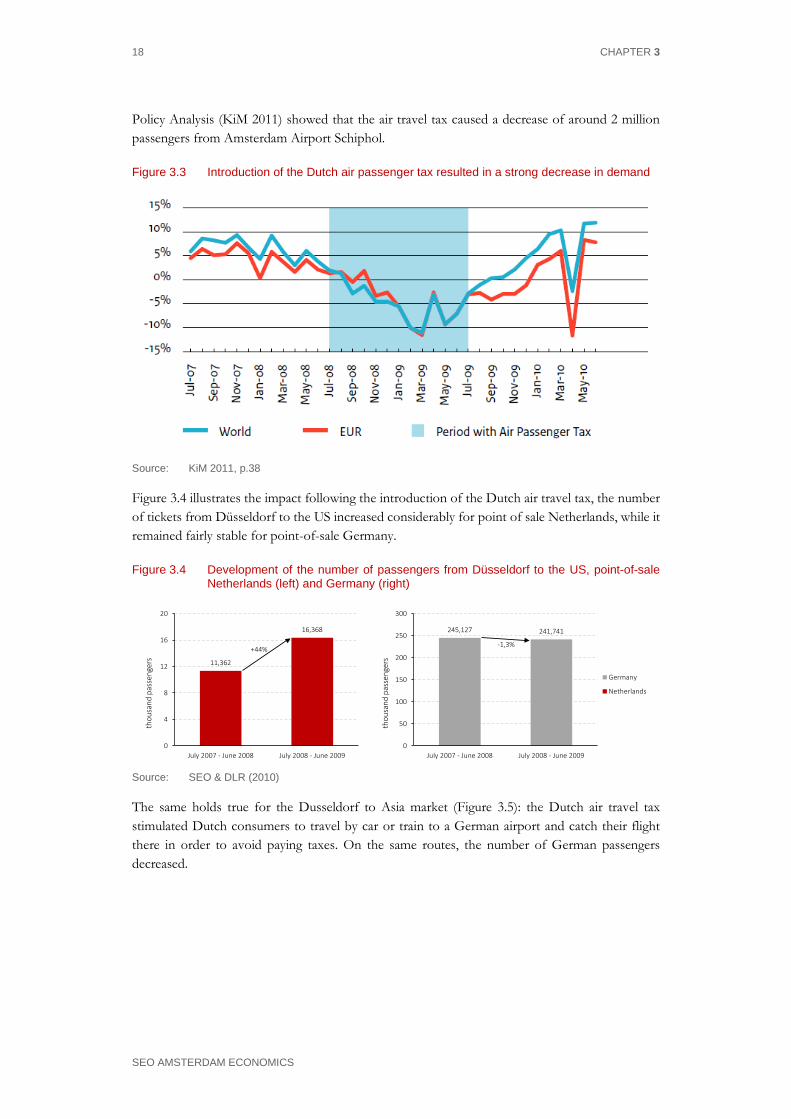
Policy Analysis (KiM 2011) showed that the air travel tax caused a decrease of around 2 million passengers from Amsterdam Airport Schiphol.
Figure 3.3 Introduction of the Dutch air passenger tax resulted in a strong decrease in demand
Source: KiM 2011, p.38
Figure 3.4 illustrates the impact following the introduction of the Dutch air travel tax, the number of tickets from Düsseldorf to the US increased considerably for point of sale Netherlands, while it remained fairly stable for point-of-sale Germany.
Figure 3.4 Development of the number of passengers from Düsseldorf to the US, point-of-sale Netherlands (left) and Germany (right)
11,362
16,368
0
4
8
12
16
20
July 2007 - June 2008 July 2008 - June 2009
thou
sand
pass
enge
rs
245,127 241,741
0
50
100
150
200
250
300
July 2007 - June 2008 July 2008 - June 2009
thou
sand
pass
enge
rs
Germany
Netherlands
+44%-1,3%
Source: SEO & DLR (2010)
The same holds true for the Dusseldorf to Asia market (Figure 3.5): the Dutch air travel tax stimulated Dutch consumers to travel by car or train to a German airport and catch their flight there in order to avoid paying taxes. On the same routes, the number of German passengers decreased.

HOW AVIATION TAXES LIMIT CONNECTIVITY AND ECONOMIC GROWTH 19
SEO AMSTERDAM ECONOMICS
Figure 3.5 Development of the number of passengers from Düsseldorf to Asia, point-of-sale Netherlands (left) and Germany (right)
33,116
42,795
0
10
20
30
40
50
July 2007 - June 2008 July 2008 - June 2009
thou
sand
pass
enge
rs
164,594
123,693
0
40
80
120
160
200
July 2007 - June 2008 July 2008 - June 2009
thou
sand
pass
enge
rs
Germany
Netherlands
+29,2%
-24,9%
Source: SEO & DLR (2010)
The KiM-study highlights the fact that the negative impact of an air travel tax is not only due to the resulting increase in airlines’ air fares impacting passenger behaviour, but also due to the publicity given to the tax. The huge publicity the tourism and airline industry raised to highlight the potential negative economic effects of the air passenger tax, substantially increased awareness of Dutch consumers to use foreign airports where the air travel tax was not applicable. In addition, KiM reports that –although the air passenger tax has been abolished - it has had structural effects on passenger behaviour: once passengers have a good experience using foreign airport, they are more likely to use them again in the future.
Economic impact of the Dutch air passenger tax The Dutch government aimed to generate € 350 million annually with the introduction of the air passenger tax. The tax was estimated to result in a loss of 8-10 percent of passenger demand, which was considered to be acceptable, taking into account the air travel growth in the years before the introduction. However, the reality was different. A study on the economic impact of the Dutch air passenger tax (SEO 2009) showed that the tax resulted in: • € 90 million lower aeronautical and non-aeronautical revenues for Dutch airports; • A revenue decrease of € 940 million for airlines using Dutch airports; • € 83 million lower revenues from inbound tourism to the Netherlands; • € 120-€ 300 million lower revenues for travel agents/organization regarding outbound leisure
traffic; • In sum, the study estimated a loss of revenue for different stakeholders of € 1.2 to € 1.3 billion
euro. At the same time, the revenue for the Dutch government was much lower than expected: • Due to the decrease in air travel demand from Dutch airports, revenues accounted for € 260
million instead of € 350 million; • Lower employment levels in the short term, resulting in social security expenses of € 100 to
€ 200 million. Finally, the air passenger tax substantially affected the competitive position of Amsterdam Airport Schiphol in comparison to its European competitors in terms of visit costs, as the figure below shows.

20 CHAPTER 3
SEO AMSTERDAM ECONOMICS
Figure 3.6 Visit costs at a selection of large European airports, including the impact of the Dutch air passenger tax
Source: SEO (2009)
3.4.3 German air travel tax
The German federal government decided to implement an air travel tax for passengers departing from German airports as of 1 January 2011, the ‘Luftverkehrssteuer’, regardless of the nationality of the carrier (Steppler 2011). Initially, the tax was € 8 for European flights and € 25 for flights between 2,500 and 6,000 kilometres and € 45 for flights of more than 6,000 kilometres. The tax applied to local origin-destination passengers, but not to transfer passengers or freight shipments. A study on the potential impact of the German air travel tax (SEO & DLR 2010) revealed that the tax would reduce the number of passengers by 5 million, of which 1.8 million would depart from non-German airports. Using input-output modelling, job losses in Germany were estimated at 13,000. The study also estimated that half of the gross income for the government of € 1 billion would be lost as a result of high unemployment compensations, lower taxes on profits and turnover. IATA (2014) estimated that the immediate annual impact of removing the German air travel tax would amount to € 1.2 billion GDP increase, 19,800 jobs and € 1,552 million of consumer benefits to travellers. Intraplan (2012) found that the German air travel tax resulted in a decrease of 1.8 million passengers in 2011, € 740 million lower airline revenues, € 170 million lower airport revenues and € 230 million lower tourism revenues. In contrast to the Dutch air passenger tax and despite substantial opposition, the German air travel tax is still in place.

HOW AVIATION TAXES LIMIT CONNECTIVITY AND ECONOMIC GROWTH 21
SEO AMSTERDAM ECONOMICS
3.4.4 Austrian Air Transport Levy
Austria, following the German model, decided to implement an air passenger tax as of 1 April 2011 (Air Transport Levy). Every aircraft owner is required to pay an air transport levy to the competent tax office in Austria for passengers departing from Austrian airports, unless an exemption from liability for the Levy applies. For example, an exemption applies to transit and transfer passengers. The Levy entails € 7 for short haul flights, € 15 for medium haul flights and € 35 for long haul flights.10 An evaluation of the impact of the Austrian Air Transport Levy commissioned by the Austrian Finance Ministry BMF concluded that the number of passengers travelling from Austrian airports was 30.000 lower than would have been the case without the tax. The study concludes that it is unlikely, given the limited passenger decrease, that the tax has had a large negative impact on the Austrian economy (IHS 2012). Aviation and tourism stakeholders11 heavily criticized the IHS study, commissioned by the collecting agent of the Levy.12 In addition, they point to the study by Oxford Economics (2012), which estimates that abolishing the Levy would result in 1.1 million additional passengers for Austria, 3,360 additional jobs and € 96.5 million additional GDP contribution.
3.4.5 Irish air travel tax
The Irish government introduced the Air Travel Tax (ATT) on 30 March 2009. The tax applied to all flights out of Ireland. Initially, the ATT entailed a tax of € 10 per passenger on all flights from Irish airports to airports, which were situated more than 300 kilometres from Dublin. For shorter flights, a rate of € 2 applied. Transfer passengers were excluded from the tax. From March 2011 on, the ATT was changed into a flat rate of € 3. After heavy opposition by airlines and tourism industry, the tax was eventually abolished in April 2014. A study on the impacts of the initially introduced € 10/€ 2 tax (SEO 2009c) revealed that the Irish government expected the total revenue from the ATT to be around € 130 million per annum. However, due to reduction in aviation demand and shifts in supply, this was calculated to range between € 124 million and € 188 million due to the reduction in aviation demand between 0.5 and 1.2 million departing passengers. In addition, in the first year after the introduction of the tax, airlines, airports and the tourist sector faced revenue losses ranging between € 210 and € 465 million, depending on the elasticities assumed. Furthermore, the study estimated a direct loss of jobs of 2,000- 3,000 jobs at airports, airlines and the tourism industry. Finally, the study highlights the fact that the consequences of the ATT would also result in a reduction of other government revenue sources, most notably the revenues from personal income tax (and higher unemployment costs), revenues from corporate tax and revenues from sales tax. The study provides a rough estimate of the decreased government revenues of € 50 million.
10 Federal Act Introducing and Air Transport Levy (Air Transport Levy Act). 11 https://www.wko.at/Content.Node/branchen/w/TransportVerkehr/AutobusLuftfahrtSchifffahrt/
Abschaffung-der-Flugabgabe.pdf 12 Amongst other things, the stakeholders point out that wrong numbers were used and results have been
wrongly interpreted.
22 CHAPTER 3
SEO AMSTERDAM ECONOMICS
A calculation of the impact of the revised Irish ATT (€ 3/€ 3) by IATA (2013) reports an annual increase in international and domestic passenger volumes of the abolishment of the ATT of 0.9 percent and 8.2 percent respectively, generating an additional GDP contribution of € 94 million and over 1,000 jobs.
3.5 Conclusions The connectivity aviation helps to deliver is essential for countries to compete successfully in today’s globalized economy. However, in many countries in Latin America and the Caribbean, the aviation tax regime limits the extent to which the full economic potential of connectivity can be exploited. The case studies provide examples of how aviation taxes can result in foregone economic growth opportunities and negatively affect consumer welfare. In the next chapter, an analysis of the average tax burden in Latin America and the Caribbean will be provided, as a starting point for our further analysis.

ECONOMIC BENEFITS OF REDUCING AVIATION TAXES IN LATIN AMERICA AND THE CARIBBEAN 23
SEO AMSTERDAM ECONOMICS
4 Taxes and charges in Latin America and the Caribbean
A wide variety of ticket taxes and charges are levied on air passengers in Latin America and the Caribbean. In some countries, passengers are charged for the use of airport facilities, services or security measures, while in other countries a departure tax or sales tax applies. Some of these taxes may be used to cover airport costs or for future airport development, whereas some charges are likely to be much higher than the actual costs of its stated purpose. As such, the distinction between a tax and a charge is rather hybrid. This chapter describes how taxes and charges are defined in this study, and an average tax and passenger-based charges burden is derived for each Latin American and Caribbean country. In Latin America and the Caribbean, passengers are confronted with a wide variety of different taxes and charges. This analysis focuses on either passenger-based charges or air travel taxes. The latter includes all taxes passengers ought to pay over the base fare, such as airport tax, tourism tax, transportation tax, VAT or sales tax. There is a large grey area in defining which of these are taxes, and which are justifiable charges in terms of cost recovery. Charges are levied on facilities used by passengers, such as Passenger Service Charge (PSC) and security fees. In some countries, these charges are very high relative to the facility or service they are charged for, which indicates that part of the charge may actually be a tax. Given the fact that there is not always a clear distinction between taxes and passenger-based charges, we have included both in the analysis. A distinction is made between taxes and charges in order to derive an ‘average tax burden’ as well as an ‘average tax and charges burden’ for each country. The ‘average tax and charges burden’ is defined as the sum of additional taxes and charges levied on a per passenger basis, either by the airport or the government. The ‘average tax burden’ focuses on actual taxes only. All taxes and charges are obtained from IATA’s Ticket Tax Box Service (TTBS). This data contains the majority of taxes and charges at the airport level. As a general rule, the classification of a tax or a charge depends on three high level criteria, which are: 1. The description and stated purpose of the tax or charge; 2. The government agency the tax or charge was ultimately remitted to; 3. The length of time the tax or charge has been in existence relative to its stated purpose.
4.1.1 Calculation of the average tax (and charges) burden per country
Using IATA’s TTBS, we calculate an average tax (and charges) burden per country for the year 2014, the baseline year for our analysis. Separate tax and charges burdens are derived for domestic and international passengers, as the taxes and charges tend to be significantly higher for international passengers. If the amount of the tax or charge changes throughout the year, we calculate an average amount based on the number of effective days. In order to provide comparable

24 CHAPTER 4
SEO AMSTERDAM ECONOMICS
results, all charges are converted to US dollars if they are listed in another currency. We use average exchange rates for 2014, as provided by www.oanda.com (see Appendix A). All taxes and charges are provided at the airport level. A weighted average level of taxes and charges is calculated at the country level. The airport’s taxes and charges are weighted according to their share in domestic and international traffic. As an example, Table 4.1 shows all taxes and charges levied by the two major airports in Ecuador, together comprising of 98 percent of international traffic and 73 percent of domestic traffic. The
average international airport tax is calculated by: 52.27∗54%+25.75∗44%98%
= $40.40. The weighted
average of the other taxes and charges are calculated similarly.
Table 4.1 A weighted average tax at country level has been derived based on the passenger share of each airport (Ecuador used as an example)
Shar
e of
intl.
pa
ssen
gers
Shar
e of
dom
estic
pa
ssen
gers
Airp
ort A
uxili
ary
Faci
litie
s Tax
Airp
ort T
ax (I
ntl.)
Airp
ort T
ax (D
om.)
Airp
ort T
ax II
(Int
l.)
Gov
t. Tr
ansp
orta
tion
Tax
(Dom
.) G
ovt.
Tran
spor
tatio
n Ta
x (In
tl.)
Secu
rity
fee
(Dom
.)
Secu
rity
fee
(Intl.
)
Tour
ism
fee
Domestic (D) / International (I) I I I I D I D I D I I
Charge (C)/ Tax (T) C C C T T T C C T
Quito (UIO) 54% 42% $5 $52.27 $14.44 $40.80 12% 12% $3 $3 $5
Guayaquil (GYE) 44% 31% $5 $25.75 $5.15 $28.27 12% 12% $1.53 $5.65 $5
Weighted average taxes
and charges 98% 73% $5.00 $40.40 $10.48 $35.19 12% 12% $2.37 $4.19 $5.00
Source: IATA TTBS, elaboration SEO
The next step is to add up all the charges and taxes at the country level. We distinguish between fixed fees and taxes charged as a share of the ticket price13. There is a large dispersion in the level of taxes and charges per country, and there is also a large difference between the distribution of these costs between taxes and charges. For example, Brazil only has a fixed embarkation charge and no additional taxes. It is possible that these charges are higher than the actual cost level per passenger and therefore a part of this charge could be considered as a tax. On the contrary, in Uruguay only taxes are levied, in the form of a ‘departure tax’ of $ 41 and a 7.5 percent ‘ticket sales tax’. In order to derive an average taxes and charges burden for each country, the taxes levied as a percentage of the ticket price need to be translated into a fixed amount. For this purpose, we derived an average airfare for each country.14 The level of the airfare differs between countries for various reasons. If a country has a relatively large number of long-haul flights compared to other 13 A list of all taxes and charges per country is given in Appendix B. 14 These airfares are derived from the SEO NetCost price model, which estimates airfares as a function of
the trip distance, competition level and other route characteristics. The fares denote the costs of a one-way trip, including all taxes and charges.

TAXES AND CHARGES IN LATIN AMERICA AND THE CARIBBEAN 25
SEO AMSTERDAM ECONOMICS
countries in Latin-America, the average fare will be higher. This is the main reason for the higher average fares for Brazil and Argentina. Besides a shorter average stage length, other reasons for lower fares are more competition and a relatively high share of low cost carrier traffic.15 We derived an ‘average tax burden’ and an ‘average tax and charges burden’ for each country, based on the estimated average airfares and the listed taxes and charges. The taxes charged as a share of the ticket price are mostly calculated over the base fares, excluding other charges. However, the fares resulting from the NetCost model are airfares including all taxes and fees. Therefore, the other taxes and charges need to be subtracted from the average airfare. Using domestic travel in Ecuador as an example, the average costs of the 12 percent transportation tax is given by:
𝑇𝑇𝑇𝑇𝑇𝑇𝑇𝑇𝑇𝑇𝑇𝑇. 𝑡𝑡𝑇𝑇𝑡𝑡𝑒𝑒𝑒𝑒𝑒𝑒𝑒𝑒𝑒𝑒𝑒𝑒𝑒𝑒 =87− 10.48− 2.37
1.12∗ 0.12 = $7.94
As a result, the total taxes and charges burden for domestic travel in Ecuador is given by $12.86 +$7.94 = $20.80. The same calculation method has been applied to all other countries.16 Figure 4.1 shows the results of the overall taxes and charges burden for domestic travel. Figure 4.2. shows the ‘average tax and charges burden’ for international travel.
Figure 4.1 Domestic taxes and charges are relatively high in Mexico and Chile
Source: IATA TTBS, SEO analysis Note: Countries not listed in the figures have no charges for domestic flights
15 Another factor that might drive up airfares is a relatively high share of business traffic. 16 Note that due to data limitations, the calculation does not account for VAT/sales tax on taxable ticket taxes
or charges for the purpose of this analysis.
$- $5 $10 $15 $20 $25 $30
MexicoChilePeru
EcuadorVenezuelaArgentinaColombiaBahamas
BoliviaHaiti
Trinidad and TobagoJamaica
GuatemalaHonduras
BrazilParaguayUruguay
Bonaire, Saint Eustatius and SabaPanama
Saint Kitts and NevisPuerto Rico
US Virgin Islands
Average tax burden (Dom.) Average charge burden (Dom.)
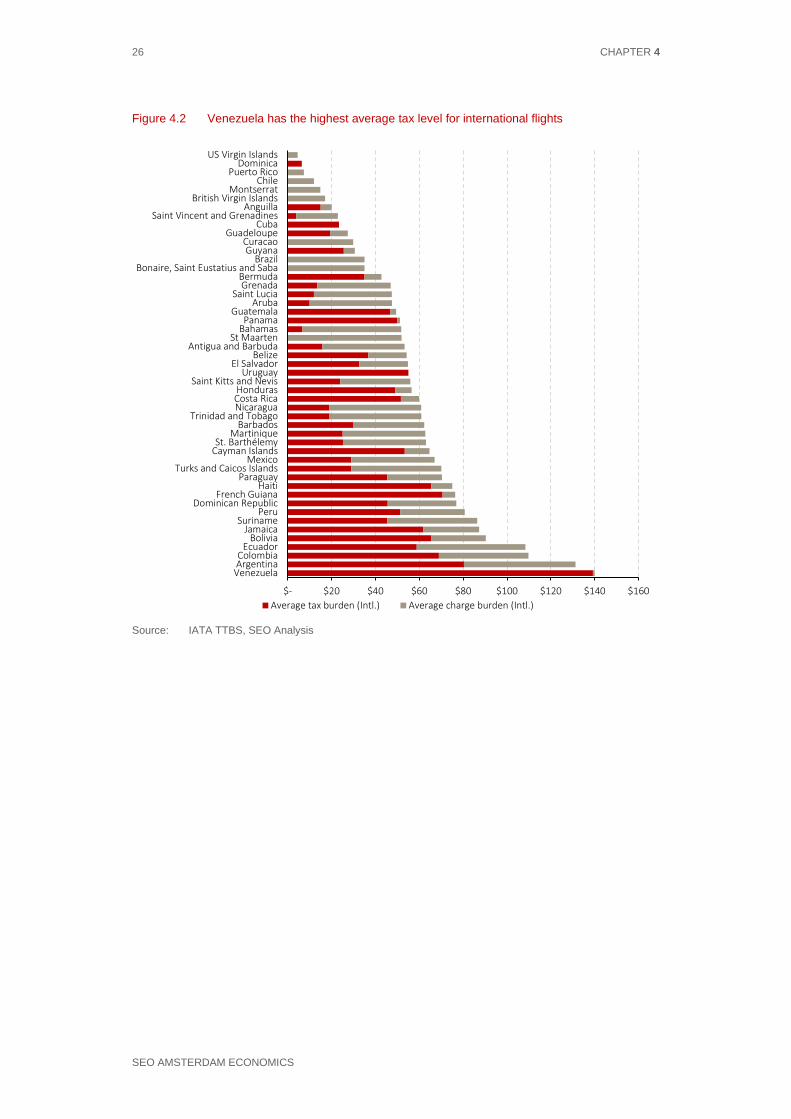
26 CHAPTER 4
SEO AMSTERDAM ECONOMICS
Figure 4.2 Venezuela has the highest average tax level for international flights
Source: IATA TTBS, SEO Analysis
$- $20 $40 $60 $80 $100 $120 $140 $160
VenezuelaArgentinaColombia
EcuadorBolivia
JamaicaSuriname
PeruDominican Republic
French GuianaHaiti
ParaguayTurks and Caicos Islands
MexicoCayman IslandsSt. Barthélemy
MartiniqueBarbados
Trinidad and TobagoNicaraguaCosta RicaHonduras
Saint Kitts and NevisUruguay
El SalvadorBelize
Antigua and BarbudaSt Maarten
BahamasPanama
GuatemalaAruba
Saint LuciaGrenada
BermudaBonaire, Saint Eustatius and Saba
BrazilGuyana
CuracaoGuadeloupe
CubaSaint Vincent and Grenadines
AnguillaBritish Virgin Islands
MontserratChile
Puerto RicoDominica
US Virgin Islands
Average tax burden (Intl.) Average charge burden (Intl.)
ECONOMIC BENEFITS OF REDUCING AVIATION TAXES IN LATIN AMERICA AND THE CARIBBEAN 27
SEO AMSTERDAM ECONOMICS
5 Scope and scenario definition
Removal of aviation taxes and reduction of charges will lead to an increase in air passengers, and as a result stimulate connectivity by air. In addition, tax removal and charges reduction will enable stronger growth of air connectivity in future years and more passengers will benefit from lower air fares. In this chapter, we define two scenarios which have been used to estimate the economic benefits of reducing aviation taxes and passenger-based charges in Latin America. In this chapter we set out the geographical scope and time dimension of this study. In addition, we discuss the two scenarios for which the consumer benefits and macro-economic impacts in Latin America and the Caribbean have been estimated. The final part of the chapter presents the air passengers and movement forecasts in the two different scenarios.
5.1 Scope
5.1.1 Geographical scope
The economic benefits of reducing aviation taxes have been estimated for Latin America and the Caribbean. Results are reported at the country level – with some of the Caribbean countries grouped together – as well as for three main sub-regions (see Figure 5.1): • Central America and Mexico • Caribbean • South America For the Caribbean, we have aggregated results from 29 countries and territories into 9 regions, because the Caribbean region consists of a large number of very small markets. Appendix C provides a full list of countries, Caribbean country groups and sub-regions as used throughout this study.

28 CHAPTER 5
SEO AMSTERDAM ECONOMICS
Figure 5.1 Results are reported for three different sub-regions
Sub-region
Caribbean
Central America and Mexico
South America
(24)
(8)
(13)
Source: SEO
5.1.2 Time dimension
The economic benefits of reducing air travel taxes have been estimated for three different time horizons: 1. Immediate impacts: Economic impacts in case of an immediate tax removal. They represent
the impacts of a hypothetical tax removal in 2014, which is the base year of the analysis. 2. Future impacts: Economic impacts in case taxes are removed in one of the horizon years
2020, 2025 and 2035. 3. Cumulative impacts: Cumulative economic impacts of the removal of taxes now up to 2035.
They represent a gradual decrease of taxes from the actual tax level in 2014 to a removal of taxes in 2020.
At the end of this section, estimates are provided for the immediate impact of tax removal on passenger numbers and aircraft movements. In addition, forecasts until 2035 are provided for the baseline and the two scenarios.
5.2 Scenario definition This study investigates the potential economic benefits of removing aviation taxes and reducing passenger-based charges for the Latin American and Caribbean economies. Results are presented for two different scenarios: one in which all taxes are removed to zero and the other where -in addition- passenger based charges are reduced.

SCOPE AND SCENARIO DEFINITION 29
SEO AMSTERDAM ECONOMICS
We define the following scenarios: 1. ‘Tax Removal’ scenario: all aviation taxes are reduced to zero. 2. ‘Tax Removal and Charges Reduction’ scenario: all aviation taxes are reduced to zero. In
addition, all passenger based charges are reduced to the level of the 25th percentile in the sub-region.
Impacts for each scenario will be in comparison to a ‘Baseline’ scenario, in which taxes and charges remain at current levels. The first scenario measures the economic benefits of abolishing aviation taxes in Latin America. The distinction between a tax and a charge is a grey area, as discussed in chapter 4. The second scenario captures the impact of a reduction of these hybrid charges. This is modelled as a reduction to the 25th percentile rather than a full removal of these charges. As a part of these charges are legitimate in terms of cost recovery, a full removal of all charges is not realistic. In the following subsections, we show the implications of these scenarios for the level of taxes and charges in each country.
5.2.1 ‘Tax Removal’ scenario
In the ‘Tax Removal’ scenario, all taxes are abolished. For some countries, this does not lead to any changes as there are no effective taxes. In South America, Brazil only levies an embarkation charge, but no taxes. In Chile, no taxes are levied on international passengers (see Figure 5.4). In the Caribbean region there are ample countries without taxes on international travel (see Figure 5.3).
Figure 5.2 In Central America and Mexico domestic taxes are highest in Honduras and international taxes are highest in Costa Rica
$0 $3 $6 $9 $12
Costa Rica
Belize
El Salvador
Nicaragua
Mexico
Panama
Guatemala
Honduras
$0 $15 $30 $45 $60
Nicaragua
Mexico
El Salvador
Belize
Guatemala
Honduras
Panama
Costa Rica
Domestic International
Source: IATA TTBS, elaboration SEO
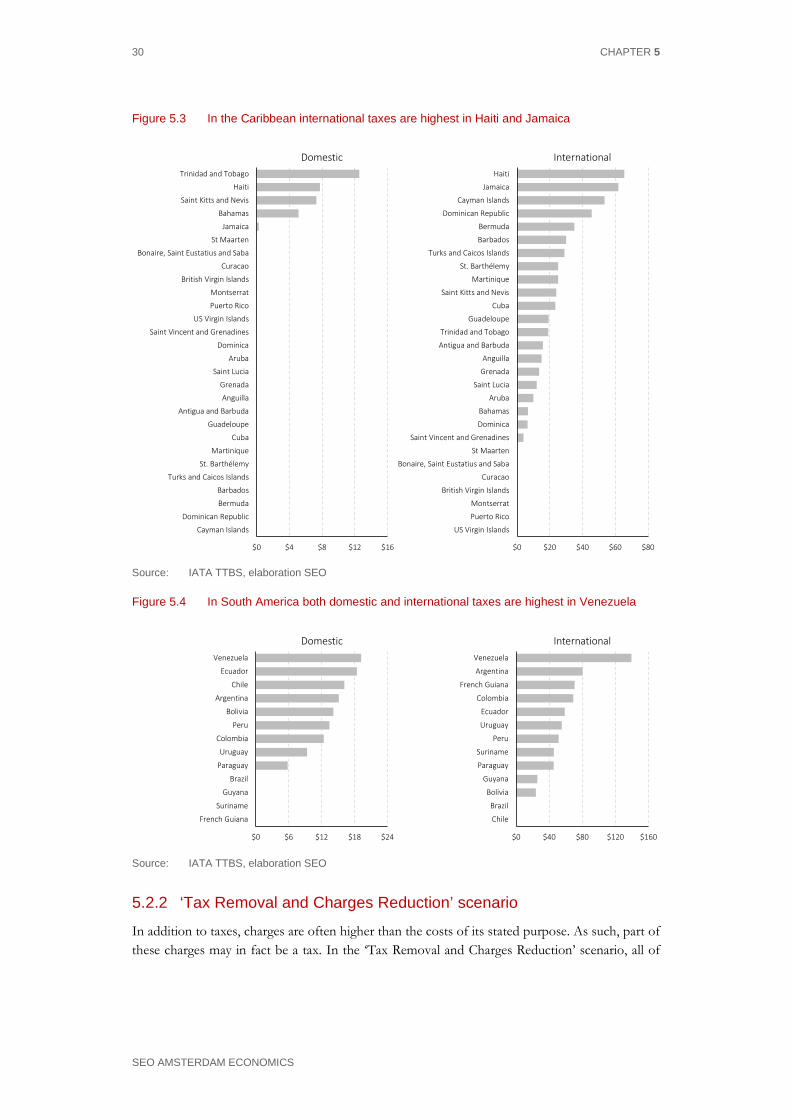
30 CHAPTER 5
SEO AMSTERDAM ECONOMICS
Figure 5.3 In the Caribbean international taxes are highest in Haiti and Jamaica
$0 $4 $8 $12 $16
Cayman Islands
Dominican Republic
Bermuda
Barbados
Turks and Caicos Islands
St. Barthélemy
Martinique
Cuba
Guadeloupe
Antigua and Barbuda
Anguilla
Grenada
Saint Lucia
Aruba
Dominica
Saint Vincent and Grenadines
US Virgin Islands
Puerto Rico
Montserrat
British Virgin Islands
Curacao
Bonaire, Saint Eustatius and Saba
St Maarten
Jamaica
Bahamas
Saint Kitts and Nevis
Haiti
Trinidad and Tobago
$0 $20 $40 $60 $80
US Virgin Islands
Puerto Rico
Montserrat
British Virgin Islands
Curacao
Bonaire, Saint Eustatius and Saba
St Maarten
Saint Vincent and Grenadines
Dominica
Bahamas
Aruba
Saint Lucia
Grenada
Anguilla
Antigua and Barbuda
Trinidad and Tobago
Guadeloupe
Cuba
Saint Kitts and Nevis
Martinique
St. Barthélemy
Turks and Caicos Islands
Barbados
Bermuda
Dominican Republic
Cayman Islands
Jamaica
Haiti
Domestic International
Source: IATA TTBS, elaboration SEO
Figure 5.4 In South America both domestic and international taxes are highest in Venezuela
$0 $6 $12 $18 $24
French Guiana
Suriname
Guyana
Brazil
Paraguay
Uruguay
Colombia
Peru
Bolivia
Argentina
Chile
Ecuador
Venezuela
$0 $40 $80 $120 $160
Chile
Brazil
Bolivia
Guyana
Paraguay
Suriname
Peru
Uruguay
Ecuador
Colombia
French Guiana
Argentina
Venezuela
Domestic International
Source: IATA TTBS, elaboration SEO
5.2.2 ‘Tax Removal and Charges Reduction’ scenario
In addition to taxes, charges are often higher than the costs of its stated purpose. As such, part of these charges may in fact be a tax. In the ‘Tax Removal and Charges Reduction’ scenario, all of

SCOPE AND SCENARIO DEFINITION 31
SEO AMSTERDAM ECONOMICS
these passenger-based charges are reduced to the level of the lowest 25th percentile of the sub-region. The ‘Tax Removal and Charges Reduction’ scenario captures three different aspects. Firstly, we have been very conservative in defining levies as a tax: where there was any doubt, levies were coded as a charge. Secondly, some levies are hybrids of which a part goes into general government revenues. Even if the full charge goes into airport revenues, some airports might operate inefficiently leading to excessively high charges. For domestic travel in Central America and the Caribbean, all charges are removed in this scenario, since there are numerous countries which have no charges for domestic traffic (see Figure 5.5 and Figure 5.6). For South America, the 25th percentile level yields a charge of $ 2.12 per flight, leading to a charges decrease between $ 9.55/82 percent (Chile) and $ 0.26/11 percent (Ecuador) (see Figure 5.7). For international travel, charges for Central America, the Caribbean and South America are reduced to respectively $ 6.28, $ 9.21 and $ 5.78. This leads to a respective maximum charges decrease of $ 35.72/85 percent (Nicaragua), $ 42.70/84 percent (St Maarten) and $ 60.71/91 percent (Bolivia).
Figure 5.5 In the Central America and Mexico, domestic charges are set to $ 0 and international charges to $ 6.28 per departure
$6,28
0 11 22 33 44
$0 $10 $20 $30 $40
Panama
Guatemala
Honduras
Costa Rica
Belize
El Salvador
Mexico
Nicaragua
Threshold Unchanged New Old
$0 $6 $12 $18 $24
Nicaragua
El Salvador
Belize
Costa Rica
Honduras
Panama
Guatemala
Mexico
Domestic International
Source: IATA TTBS, elaboration SEO

32 CHAPTER 5
SEO AMSTERDAM ECONOMICS
Figure 5.6 In the Caribbean, domestic charges are set to $ 0 and international charges are reduced to $ 9.21 per departure
$9,21
0 20 40 60
$0 $15 $30 $45 $60
Dominica
Cuba
US Virgin Islands
Anguilla
Puerto Rico
Bermuda
Guadeloupe
Haiti
Cayman Islands
Montserrat
British Virgin Islands
Saint Vincent and Grenadines
Jamaica
Curacao
Dominican Republic
Saint Kitts and Nevis
Barbados
Grenada
Bonaire, Saint Eustatius and Saba
Saint Lucia
Aruba
Antigua and Barbuda
Martinique
St. Barthélemy
Turks and Caicos Islands
Trinidad and Tobago
Bahamas
St Maarten
Threshold Unchanged New Old
$0 $4 $8 $12 $16
St Maarten
Trinidad and Tobago
Turks and Caicos Islands
St. Barthélemy
Martinique
Aruba
Antigua and Barbuda
Saint Lucia
Grenada
Barbados
Saint Kitts and Nevis
Dominican Republic
Curacao
Saint Vincent and Grenadines
British Virgin Islands
Montserrat
Cayman Islands
Guadeloupe
Bermuda
Anguilla
Dominica
Cuba
US Virgin Islands
Haiti
Puerto Rico
Bonaire, Saint Eustatius and Saba
Jamaica
Bahamas
Domestic International
Source: IATA TTBS, elaboration SEO
Figure 5.7 In the South America, domestic charges are set to $ 2.12 and international charges to $ 5.78 per departure
$5,78
0
$0 $15 $30 $45 $60
Uruguay
Venezuela
Guyana
French Guiana
Chile
Bolivia
Paraguay
Peru
Brazil
Colombia
Suriname
Ecuador
Argentina
Threshold Unchanged New Old
$2,12
0
$0 $3 $6 $9 $12
Suriname
French Guiana
Guyana
Uruguay
Venezuela
Bolivia
Ecuador
Paraguay
Argentina
Colombia
Peru
Brazil
Chile
Domestic International
Source: IATA TTBS, elaboration SEO
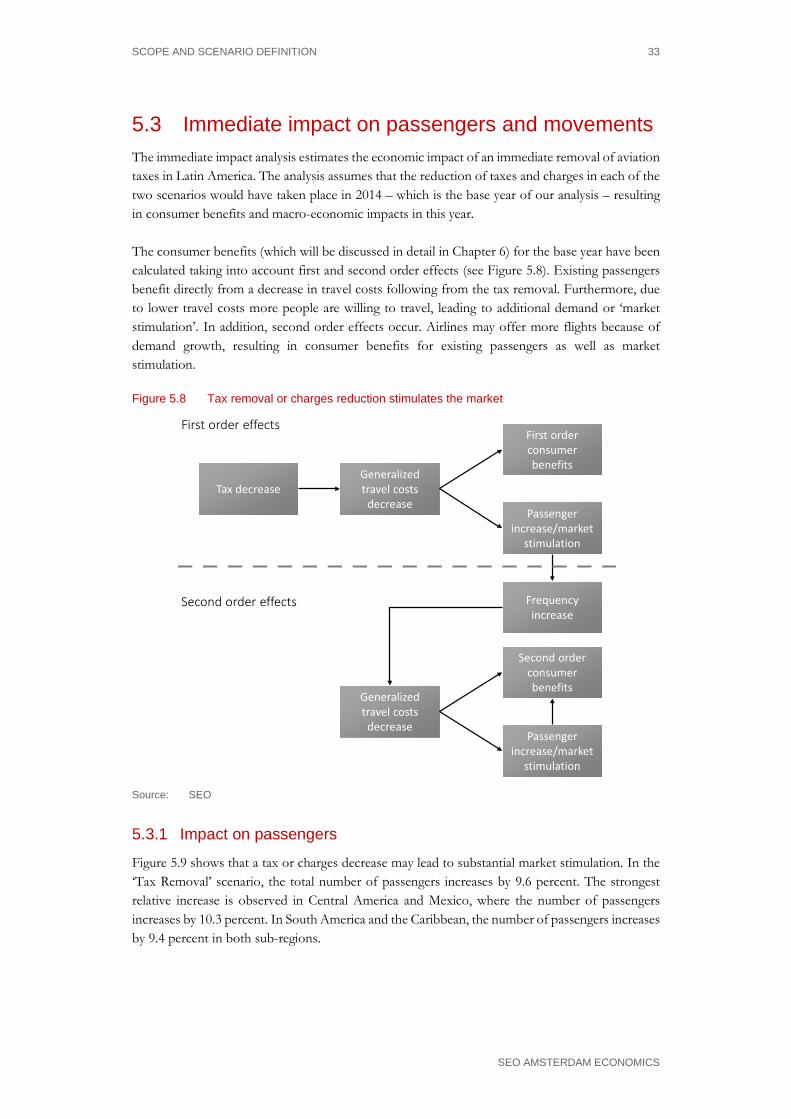
SCOPE AND SCENARIO DEFINITION 33
SEO AMSTERDAM ECONOMICS
5.3 Immediate impact on passengers and movements The immediate impact analysis estimates the economic impact of an immediate removal of aviation taxes in Latin America. The analysis assumes that the reduction of taxes and charges in each of the two scenarios would have taken place in 2014 – which is the base year of our analysis – resulting in consumer benefits and macro-economic impacts in this year. The consumer benefits (which will be discussed in detail in Chapter 6) for the base year have been calculated taking into account first and second order effects (see Figure 5.8). Existing passengers benefit directly from a decrease in travel costs following from the tax removal. Furthermore, due to lower travel costs more people are willing to travel, leading to additional demand or ‘market stimulation’. In addition, second order effects occur. Airlines may offer more flights because of demand growth, resulting in consumer benefits for existing passengers as well as market stimulation.
Figure 5.8 Tax removal or charges reduction stimulates the market
Tax decreaseGeneralized travel costs
decreasePassenger
increase/market stimulation
Frequency increase
First order consumer benefits
Generalized travel costs
decreasePassenger
increase/market stimulation
Second order consumer benefits
First order effects
Second order effects
Source: SEO
5.3.1 Impact on passengers
Figure 5.9 shows that a tax or charges decrease may lead to substantial market stimulation. In the ‘Tax Removal’ scenario, the total number of passengers increases by 9.6 percent. The strongest relative increase is observed in Central America and Mexico, where the number of passengers increases by 10.3 percent. In South America and the Caribbean, the number of passengers increases by 9.4 percent in both sub-regions.
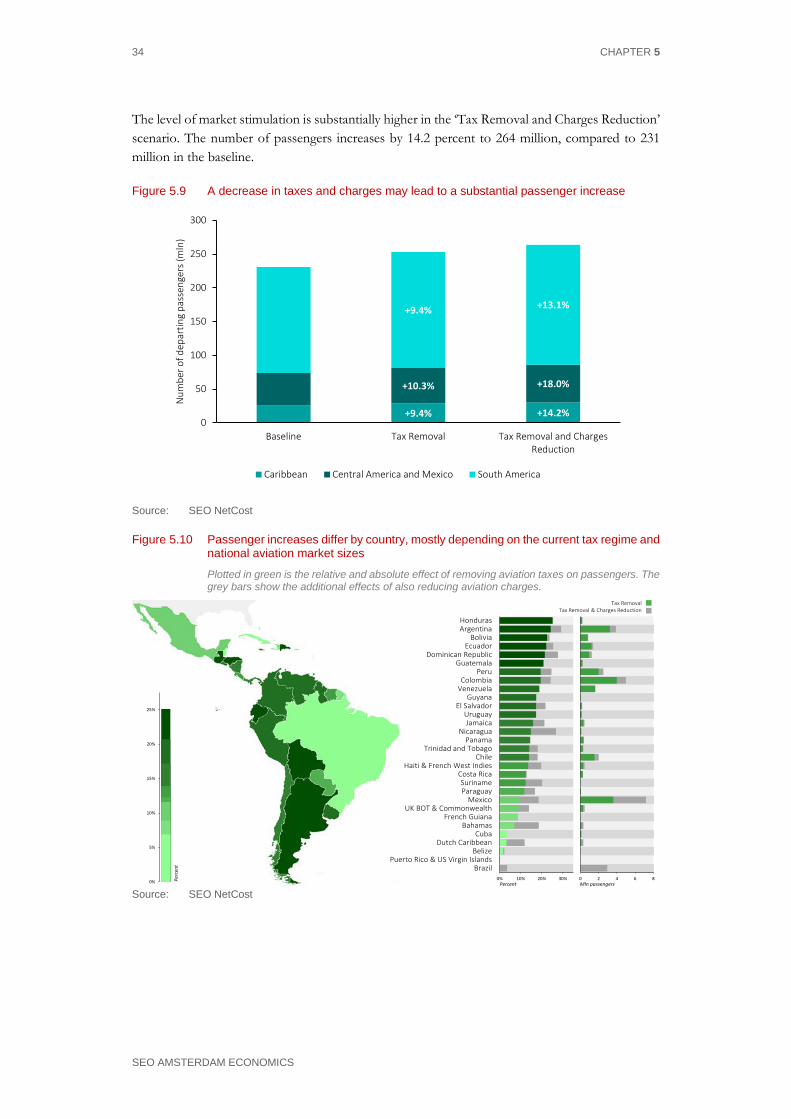
34 CHAPTER 5
SEO AMSTERDAM ECONOMICS
The level of market stimulation is substantially higher in the ‘Tax Removal and Charges Reduction’ scenario. The number of passengers increases by 14.2 percent to 264 million, compared to 231 million in the baseline.
Figure 5.9 A decrease in taxes and charges may lead to a substantial passenger increase
Source: SEO NetCost
Figure 5.10 Passenger increases differ by country, mostly depending on the current tax regime and national aviation market sizes
Plotted in green is the relative and absolute effect of removing aviation taxes on passengers. The grey bars show the additional effects of also reducing aviation charges.
0 2000000 4000000 6000000 8000000
0 2 4 6 8
Brazil
Puerto Rico & US Virgin Islands
Belize
Dutch Caribbean
Cuba
Bahamas
French Guiana
UK BOT & Commonwealth
Mexico
Paraguay
Suriname
Costa Rica
Haiti & French West Indies
Chile
Trinidad and Tobago
Panama
Nicaragua
Jamaica
Uruguay
El Salvador
Guyana
Venezuela
Colombia
Peru
Guatemala
Dominican Republic
Ecuador
Bolivia
Argentina
Honduras
0 0,2
0% 10% 20% 30%
BrazilPuerto Rico & US Virgin Islands
BelizeDutch Caribbean
CubaBahamas
French GuianaUK BOT & Commonwealth
MexicoParaguaySuriname
Costa RicaHaiti & French West Indies
ChileTrinidad and Tobago
PanamaNicaragua
JamaicaUruguay
El SalvadorGuyana
VenezuelaColombia
PeruGuatemala
Dominican RepublicEcuador
BoliviaArgentinaHonduras
0%
5%
10%
15%
20%
25%
Percent Mln passengers
Perc
ent
Tax RemovalTax Removal & Charges Reduction
Source: SEO NetCost
+9.4% +14.2%
+10.3% +18.0%
+9.4% +13.1%
0
50
100
150
200
250
300
Baseline Tax Removal Tax Removal and ChargesReduction
Num
ber o
f dep
artin
g pa
ssen
gers
(mln
)
Caribbean Central America and Mexico South America

SCOPE AND SCENARIO DEFINITION 35
SEO AMSTERDAM ECONOMICS
5.3.2 Impact on aircraft movements
Airlines may react to a demand increase by offering more flights. As shown in Figure 5.11, the flight frequency increases from 3.6 million flights in the baseline to 3.9 million in the ‘Tax Removal’ scenario, and to 4.1 million in ‘Tax Removal and Charges Reduction’ scenario.
Figure 5.11 More flights will be operated due to higher demand following a decrease in the cost of air travel
Source: SEO NetCost
5.4 Future impact on passengers and movements In addition to the analysis where taxes are removed at the present moment, we estimate the economic benefits if taxes or charges were reduced or abolished by 2020, 2025 or 2035. In order to estimate these welfare impacts, we extrapolate the aviation network of Latin American and Caribbean countries to the horizon years. For the network extrapolation two sources were used. For the passenger growth forecast for Latin America and the Caribbean, we used country-level growth forecasts provided by IATA and Oxford Economics. For the extrapolation of the aviation networks outside Latin America and the Caribbean, we used regional forecasts from Boeing’s Current Market Outlook (Boeing 2015). The latter network extrapolation is required because our model takes into account indirect connections, which includes flight legs that do not originate in Latin America. The IATA/Oxford Economics forecast distinguishes between international and domestic routes. Because the growth forecasts tend to differ between these two types of traffic, we use different growth rates for domestic and international flights. Both the IATA/Oxford Economics and Boeing forecasts are passenger forecasts. However, the growth rate of the number of flights will be smaller than the passenger growth rate because of the expected growth in average aircraft size. By means of a historical analysis of worldwide OAG data
+7.6% +15.8%
+7.9% +13.6%
+8.4% +11.6%
0
500
1000
1500
2000
2500
3000
3500
4000
4500
Baseline Tax Removal Tax Removal and ChargesReduction
Num
ber o
f airc
raft
dep
artu
res (
thou
sand
s)
Caribbean Central America South America

36 CHAPTER 5
SEO AMSTERDAM ECONOMICS
since 1990, we have estimated the average aircraft size growth rate at 1.25 percent per year. We assume that the growth rate of the number of flights is 1.25 percent lower than the average passenger growth.
5.4.1 Passenger forecast
Figure 5.12 shows the passenger forecast for Latin America and the Caribbean in the ‘Baseline’ scenario as well as in the two scenarios. In 2035, 548 million passengers are expected to depart from the Latin American and Caribbean airports in the ‘Tax Removal’ scenario. In the ‘Tax Removal and Charges Reduction’ scenario, the total number of passengers is expected to increase by 15 percent to 629 million in 2035.
Figure 5.12 In 2035 over 80 million additional passengers will be served due to lower aviation taxes and charges
Source: IATA/Oxford Economics; Boeing (2015); SEO NetCost
5.4.2 Aircraft movements forecast
Figure 5.13 shows the projected increase in the number of flights departing from all Latin American and Caribbean airports in the two scenarios. In the ‘Tax Removal and Charges Reduction’ scenario in 2035, the total number of aircraft movements is expected to be 8.1 million, an increase of 13 percent compared to the baseline. The increase in aircraft movements is smaller than the passenger increase, due to the fact that airlines can also serve more passengers through larger aircraft or higher load factors. In both scenarios the number of passengers per movement increases from 64 in 2014 to 77 in 2035.
200
250
300
350
400
450
500
550
600
650
Num
ber o
f dep
artin
g pa
ssen
gers
(mln
)
Baseline Tax Removal Tax and Removal and Charges Reduction
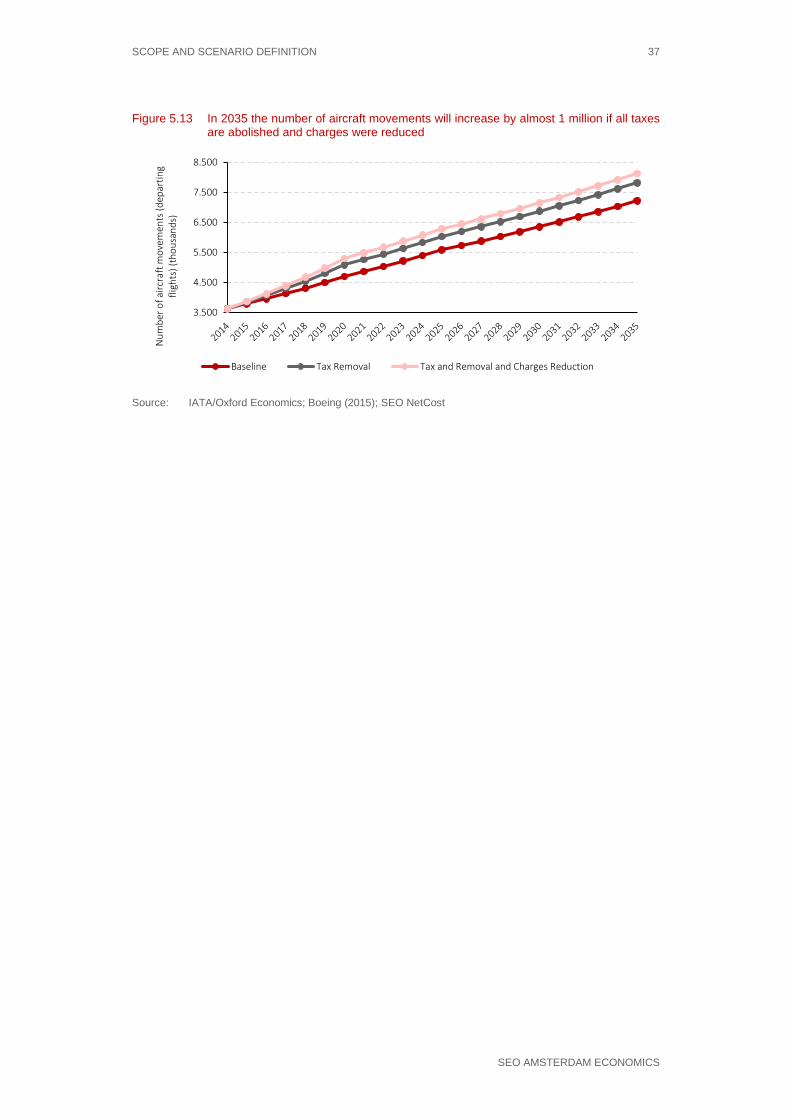
SCOPE AND SCENARIO DEFINITION 37
SEO AMSTERDAM ECONOMICS
Figure 5.13 In 2035 the number of aircraft movements will increase by almost 1 million if all taxes are abolished and charges were reduced
Source: IATA/Oxford Economics; Boeing (2015); SEO NetCost
3.500
4.500
5.500
6.500
7.500
8.500N
umbe
r of a
ircra
ft m
ovem
ents
(dep
artin
g fli
ghts
) (th
ousa
nds)
Baseline Tax Removal Tax and Removal and Charges Reduction

ECONOMIC BENEFITS OF REDUCING AVIATION TAXES IN LATIN AMERICA AND THE CARIBBEAN 39
SEO AMSTERDAM ECONOMICS
6 Calculating the economic benefits of reducing aviation taxes: two approaches
To assess the economic benefits of removing aviation taxes in Latin America and the Caribbean, we use two different approaches. The first is the consumer benefit approach. The approach focuses primarily on consumer benefits as a result of travel cost savings, as well as the wider economic benefits associated with these savings. The second is the macro-economic approach. The approach calculates the macro-economic contribution of additional aviation activity in terms of GDP and employment growth.
6.1 Two approaches to assess the economic benefits of aviation tax reduction
We use two different approaches to assess the economic benefits of reducing aviation taxes up to 2035. The first is the consumer benefit approach. The approach takes into account the impacts of reducing aviation taxes that are valued by society. This includes the money and time saved by air travellers because of less money spent on air fares, but also because of more frequencies and direct flights. In addition, it includes the additional benefits to the wider economy. The second is the macro-economic approach. The approach calculates the economic contribution of additional aviation activity in terms of GDP and employment growth. In this chapter, we explain both approaches and highlight the differences between the two. Why do we use two approaches side by side? On the one hand, the consumer benefit approach is in line with the best-practice in the appraisal of infrastructure investments and policy measures in transport economics. Amongst other things, the consumer benefit approach quantifies a number of elements that are valued by society (such as the value of time savings for leisure travellers), which are not included in the macro-economic approach. Furthermore, the macro-economic approach measures the gross impacts, without adjusting for labour costs and capital costs, while the consumer benefit approach aims to measure the net welfare impacts. As a result, the macro-economic approach tends to result in much higher numbers than the consumer benefit approach. On the other hand, the macro-economic approach provides easy to understand estimates regarding the additional macro-economic output resulting from a growth in air transport, using well-known indicators such as GDP and number of jobs. Although there is some overlap between both approaches (for example, cost savings for business travellers are reflected in GDP growth), they are different approaches, of which the results cannot be added up and must not be directly compared.
6.2 Consumer benefit approach The consumer benefit approach takes the perspective of consumer welfare benefits of tax reduction. The economic welfare benefit is the total benefit to society from a certain policy

40 CHAPTER 6
SEO AMSTERDAM ECONOMICS
intervention or economic transaction. In our case, we calculate firstly the consumer welfare benefits as well as the wider economic benefits of reducing aviation taxes at the present moment, in comparison to a scenario in which those taxes would not be removed. Secondly, we estimate the consumer benefits and wider economic benefits of aviation tax reductions up to 2035, in comparison to a scenario in which those taxes would still be present. We distinguish between different benefits: • Consumer benefits (‘consumer surplus’ for both business and leisure trips).
Reducing aviation taxes brings benefits to the passenger. These benefits include lower air fares (in case of full pass through) and benefits from better connectivity (more frequencies and more direct flight destinations). These lower ‘generalized’ travel costs translate into a direct consumer welfare benefit or consumer surplus. Consumer surplus is a widely accepted way of quantifying changes in welfare from policy interventions. It is the amount consumers are willing to pay for a good or service in excess of the actual price they pay for the good or service without these interventions.
• Impact for suppliers of aviation services (producer surplus). We assume that airlines will pass on any tax reductions to consumers in the long run, as they operate in a competitive market and profitability margins in the Latin American airline industry are low. Hence, airlines will benefit from additional passenger demand, which may generate a ‘normal economic profit’, but do not generate excess profits because of a reduction of aviation taxes. The same holds true for other stakeholders in the aviation value chain.
• Wider economic benefits. Important sources of additional wider economic benefits are agglomeration effects. Connectivity growth in an airport region may lead to higher density of activities in that region. Concentration of economic activity in itself can reduce (spatial) market imperfections and result in higher productivity measured in GDP/capita, for example because of knowledge spill overs, a pooled labour market and consumption variety. In the case of Latin America, aviation growth also results in job creation, reducing the high unemployment levels. Also the additional job creation constitutes a welfare gain.
Scope of the consumer benefit approach We note that this study quantifies the consumer and wider economic benefits of tax removal and charges reduction. The estimation of environmental externalities and the opportunity costs of a tax/charges reduction (i.e. the impacts of aviation tax revenue spending changes on the wider economy) is outside the scope of this study.
6.3 Macro-economic approach In the macro-economic approach we estimate the impacts of an increase in air travel on total GDP and employment. For this purpose, we have carried out a panel data analysis with time-lag variables. Using the elasticities from this analysis, we estimate the macro-economic impact of growth in air passengers and connectivity. Within the macro-economic approach, we also consider the catalytic impacts of air transport growth. Catalytic impacts capture the extent to which the growth in air transport boosts performance in other industries. For example, air transport growth may impact tourism, investment and innovation. These effects are the direct result from people and companies using air transport

CALCULATING THE ECONOMIC BENEFITS OF REDUCING AVIATION TAXES: TWO APPROACHES 41
SEO AMSTERDAM ECONOMICS
for private or business purposes. These effects all contribute to the total GDP impact of air travel. As such, the catalytic impacts are a specification of the total GDP impact and not additional impacts.
6.4 Differences between the two approaches The welfare benefits as addressed in section 6.2 are only partly captured in macro-economic output measures such as GDP. For instance, the fact that airfares for leisure passengers are reduced because of lower aviation taxes will not result in higher GDP. However, lower ticket prices for business passengers may result in lower cost levels for companies and therefore in a higher GDP. Another difference between the consumer benefit and economic contribution approach is the fact that the welfare approach estimates the impacts for residents and companies in Latin America and the Caribbean. The macro-economic approach also takes into account the impact of non-Latin American companies located in the region. Finally, the macro-economic approach tends to measure the gross impacts, without adjusting for labour costs and capital costs. Aviation growth due to reduced aviation taxes may lead to more jobs in a certain region. Generally, employing people entails costs, not only to their employers but also to society. The size of these costs depends on the type of jobs and on the labour market situation. If unemployed people fill the jobs, the labour costs are partly compensated by reduced unemployment benefits. If the jobs will be filled in by employees coming from other industries or from outside their own region, the costs consist of production lost in these other industries or regions. In this case, employment impacts are distributional effects rather than a net job growth effect. However, employees may be more productive in their new job, creating net welfare benefits.
Differences between the two approaches As mentioned above, the two approaches are different. Therefore, the resulting figures cannot be combined nor added up. Below we summarize the three main differences: • Benefits for leisure travellers are not included in the GDP approach; • Different geographical coverage: the welfare approach estimates the impacts of Latin American and
Caribbean residents and companies, whereas the economic contribution approach also takes into account the impact of non-Latin American/Caribbean companies located in Latin America/ Caribbean;
• Net versus gross impacts: the welfare approach estimates the net impacts on welfare, taking into account not only the benefits but also the costs of capital and cost of employing labour.
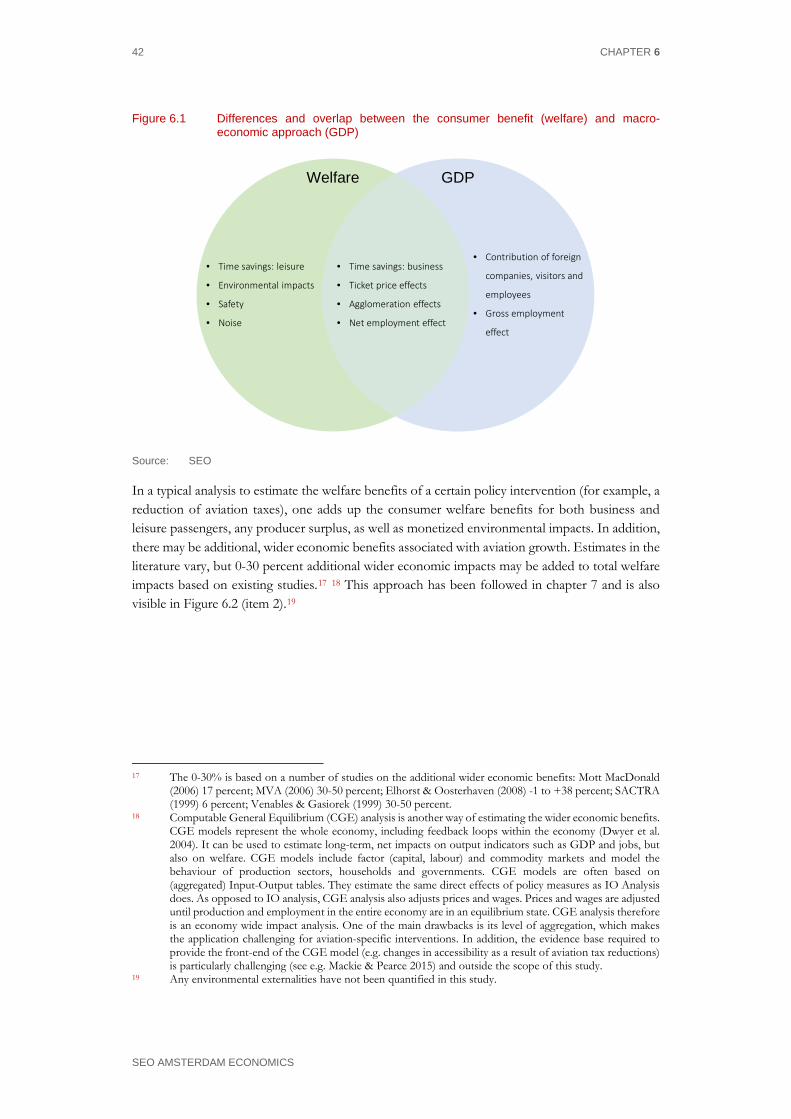
42 CHAPTER 6
SEO AMSTERDAM ECONOMICS
Figure 6.1 Differences and overlap between the consumer benefit (welfare) and macro-economic approach (GDP)
Welfare GDP
• Time savings: leisure
• Environmental impacts
• Safety
• Noise
• Time savings: business
• Ticket price effects
• Agglomeration effects
• Net employment effect
• Contribution of foreign
companies, visitors and
employees
• Gross employment
effect
Source: SEO
In a typical analysis to estimate the welfare benefits of a certain policy intervention (for example, a reduction of aviation taxes), one adds up the consumer welfare benefits for both business and leisure passengers, any producer surplus, as well as monetized environmental impacts. In addition, there may be additional, wider economic benefits associated with aviation growth. Estimates in the literature vary, but 0-30 percent additional wider economic impacts may be added to total welfare impacts based on existing studies.17 18 This approach has been followed in chapter 7 and is also visible in Figure 6.2 (item 2).19
17 The 0-30% is based on a number of studies on the additional wider economic benefits: Mott MacDonald
(2006) 17 percent; MVA (2006) 30-50 percent; Elhorst & Oosterhaven (2008) -1 to +38 percent; SACTRA (1999) 6 percent; Venables & Gasiorek (1999) 30-50 percent.
18 Computable General Equilibrium (CGE) analysis is another way of estimating the wider economic benefits. CGE models represent the whole economy, including feedback loops within the economy (Dwyer et al. 2004). It can be used to estimate long-term, net impacts on output indicators such as GDP and jobs, but also on welfare. CGE models include factor (capital, labour) and commodity markets and model the behaviour of production sectors, households and governments. CGE models are often based on (aggregated) Input-Output tables. They estimate the same direct effects of policy measures as IO Analysis does. As opposed to IO analysis, CGE analysis also adjusts prices and wages. Prices and wages are adjusted until production and employment in the entire economy are in an equilibrium state. CGE analysis therefore is an economy wide impact analysis. One of the main drawbacks is its level of aggregation, which makes the application challenging for aviation-specific interventions. In addition, the evidence base required to provide the front-end of the CGE model (e.g. changes in accessibility as a result of aviation tax reductions) is particularly challenging (see e.g. Mackie & Pearce 2015) and outside the scope of this study.
19 Any environmental externalities have not been quantified in this study.

CALCULATING THE ECONOMIC BENEFITS OF REDUCING AVIATION TAXES: TWO APPROACHES 43
SEO AMSTERDAM ECONOMICS
Figure 6.2 Relationship between GDP and welfare measurement units
Consumer welfare benefits
Benefits for business passengers
Benefits for leisure passengers
Welfare GDP
Lower travel costs
Attracts economic activity
Higher production/productivity
Additional Gross Domestic Product (GDP)
Contribution of foreigncompanies, visitors and
employees to GDP
Minus Additional capital costs-
Additional Net Domestic Product (NDP)=
Minus Additional labour costs-
Additional ‘profit’=
Additional employment due to additional aviation activity
Overall welfare impact
Benefits for leisure passengers Additional Profit+
Producer surplus
Consumer benefits Producer surplus+ wider economic benefits+ +
Environmental externalities
Environmental externalities
+
+
1
2
Source: SEO
In chapter 8, we estimate the impacts on GDP and employment using the macro-economic approach. As Figure 6.2 points out, estimating the impact on an output measure such as GDP is essentially a different thing. Part of the welfare benefits (producer surplus and benefits for business passengers) go into the GDP equation, but not the benefits for leisure passengers. GDP impacts are also affected by the contribution of foreign companies and visitors to Latin American and Caribbean GDP as a result of better connectivity. Figure 6.2 shows that the GDP impact cannot be simply added to estimated welfare impacts. This would result in double counting and would neglect the fact that additional GDP is associated with additional labour costs and capital costs.20 Calculated GDP impacts therefore tend to be much larger than welfare impacts. If we would like to bring GDP impacts in line with welfare impacts, GDP impacts needs to be reduced to the real ‘additional GDP profit’, after correcting for capital and labour costs (approach 1 in Figure 6.2). The additional profit can be added to the benefits for leisure passengers and any monetized environmental impacts, which together constitute the total welfare impact. From the discussion follows first of all that approach (1) in Figure 6.2 is generally very cumbersome. Hence, it is easier to measure welfare impacts following approach (2). Secondly, unadjusted GDP and welfare impacts are related but measure different things.
20 See also Forsyth (2013), p.24-25; Forsyth (2014)

44 CHAPTER 6
SEO AMSTERDAM ECONOMICS
In chapter 7, we discuss the estimation of consumer benefits/welfare impacts following the consumer approach. In chapter 8, we discuss the macro-economic impacts on GDP and employment following the macro-economic approach. The GDP effects calculated are the unadjusted GDP impacts, not corrected for labour and capital costs.
ECONOMIC BENEFITS OF REDUCING AVIATION TAXES IN LATIN AMERICA AND THE CARIBBEAN 45
SEO AMSTERDAM ECONOMICS
7 Consumer benefits of reducing aviation taxes
Removal of aviation taxes brings substantial consumer benefits to residents of Latin America and the Caribbean. In 2035, consumer benefits add up to $ 13 billion. If also passenger based charges are reduced, these benefits will increase to $ 19 billion. Additional to these direct benefits, wider economic welfare benefits arise through agglomeration effects and additional employment. Total consumer and wider economic benefits add up to $ 15-$ 21 billion in 2035, depending on the scenario. Total present value over the period 2014-2035 cumulates to $ 122 to $ 170 billion, depending on the scenario.
7.1 Methodology
7.1.1 Consumer benefits
Consumer surplus is a widely accepted way of quantifying changes in welfare from policy interventions. In short, consumer surplus is a concept of monetized welfare. It is the amount consumers are willing to pay for these policy interventions in excess of the actual price they pay for the service without these interventions. In the context of connectivity and air travel, consumer surplus relates to the change in welfare as a result of a change in the generalized travel costs. The generalized travel costs include direct costs (such as ticket prices) and a valuation of travel time. To estimate the economic benefits of a removal of aviation taxes, the change in consumer surplus/ consumer benefits can be calculated as a result of a change in generalized travel costs. With SEO’s NetCost generalized travel cost model, we calculate the consumer surplus in the different scenarios and future years. We call these gains ‘consumer benefits’. The NetCost generalized travel cost model The NetCost model measures the quality of airline networks, looking at both direct and indirect (transfer) connections. The model translates airline network data (origin, destination, frequency and travel time) into indicators expressing the attractiveness of specific connections (and airlines) for the user. For each relevant connection, direct as well as indirect, the model determines the generalized travel costs, being a representation of all inconveniences the traveller is confronted with for that specific connection. Generalized travel costs include not only airfares, but also the perceived costs of travel time and waiting time for the next flight (‘schedule delay’). These costs are translated into an indicator, expressing the perceived value for the consumer (passenger). Using these generalized travel costs, NetCost is able to estimate market shares of routes, airlines and airports in each individual OD market. The model is a useful tool in forecasting, particularly if network scenarios need to be considered. Generalized travel costs, passenger numbers and any market (de)generation can be translated into consumer welfare estimates (consumer surplus) of a network scenario compared to a reference situation. We refer to Appendix D for a description of the NetCost model.
Origin of passengers We estimate the consumer benefits of a decrease in aviation taxes and charges in Latin America and the Caribbean for residents of each country separately. There are two channels through which these benefits accrue. In the first place, all originating, resident passengers benefit from a tax
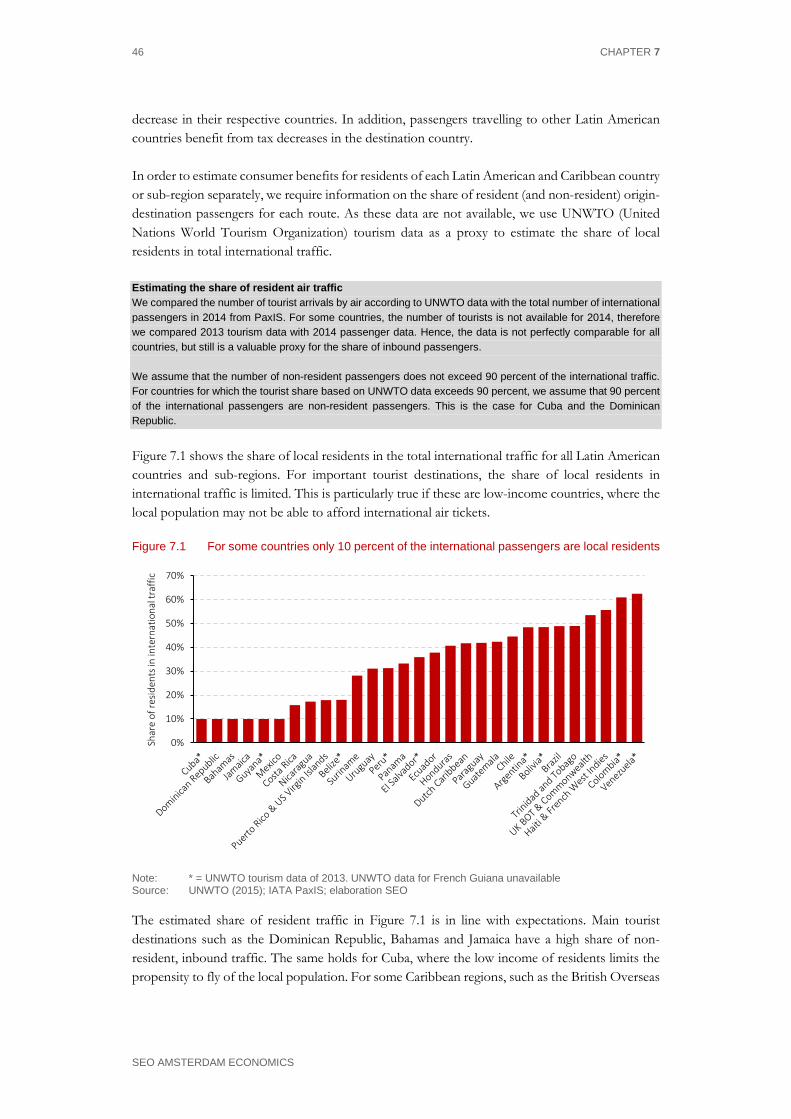
46 CHAPTER 7
SEO AMSTERDAM ECONOMICS
decrease in their respective countries. In addition, passengers travelling to other Latin American countries benefit from tax decreases in the destination country. In order to estimate consumer benefits for residents of each Latin American and Caribbean country or sub-region separately, we require information on the share of resident (and non-resident) origin-destination passengers for each route. As these data are not available, we use UNWTO (United Nations World Tourism Organization) tourism data as a proxy to estimate the share of local residents in total international traffic. Estimating the share of resident air traffic We compared the number of tourist arrivals by air according to UNWTO data with the total number of international passengers in 2014 from PaxIS. For some countries, the number of tourists is not available for 2014, therefore we compared 2013 tourism data with 2014 passenger data. Hence, the data is not perfectly comparable for all countries, but still is a valuable proxy for the share of inbound passengers. We assume that the number of non-resident passengers does not exceed 90 percent of the international traffic. For countries for which the tourist share based on UNWTO data exceeds 90 percent, we assume that 90 percent of the international passengers are non-resident passengers. This is the case for Cuba and the Dominican Republic. Figure 7.1 shows the share of local residents in the total international traffic for all Latin American countries and sub-regions. For important tourist destinations, the share of local residents in international traffic is limited. This is particularly true if these are low-income countries, where the local population may not be able to afford international air tickets.
Figure 7.1 For some countries only 10 percent of the international passengers are local residents
Note: * = UNWTO tourism data of 2013. UNWTO data for French Guiana unavailable Source: UNWTO (2015); IATA PaxIS; elaboration SEO
The estimated share of resident traffic in Figure 7.1 is in line with expectations. Main tourist destinations such as the Dominican Republic, Bahamas and Jamaica have a high share of non-resident, inbound traffic. The same holds for Cuba, where the low income of residents limits the propensity to fly of the local population. For some Caribbean regions, such as the British Overseas
0%
10%
20%
30%
40%
50%
60%
70%
Shar
e of
resi
dent
s in
inte
rnat
iona
l tra
ffic
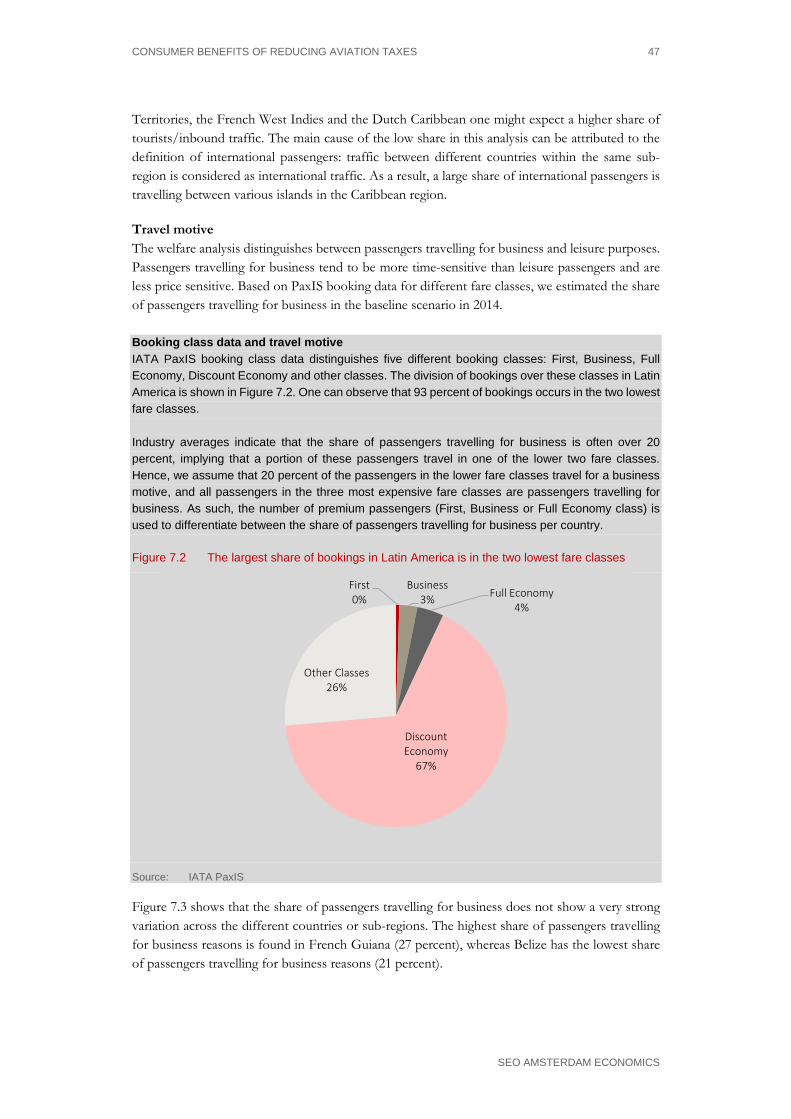
CONSUMER BENEFITS OF REDUCING AVIATION TAXES 47
SEO AMSTERDAM ECONOMICS
Territories, the French West Indies and the Dutch Caribbean one might expect a higher share of tourists/inbound traffic. The main cause of the low share in this analysis can be attributed to the definition of international passengers: traffic between different countries within the same sub-region is considered as international traffic. As a result, a large share of international passengers is travelling between various islands in the Caribbean region.
Travel motive The welfare analysis distinguishes between passengers travelling for business and leisure purposes. Passengers travelling for business tend to be more time-sensitive than leisure passengers and are less price sensitive. Based on PaxIS booking data for different fare classes, we estimated the share of passengers travelling for business in the baseline scenario in 2014. Booking class data and travel motive IATA PaxIS booking class data distinguishes five different booking classes: First, Business, Full Economy, Discount Economy and other classes. The division of bookings over these classes in Latin America is shown in Figure 7.2. One can observe that 93 percent of bookings occurs in the two lowest fare classes. Industry averages indicate that the share of passengers travelling for business is often over 20 percent, implying that a portion of these passengers travel in one of the lower two fare classes. Hence, we assume that 20 percent of the passengers in the lower fare classes travel for a business motive, and all passengers in the three most expensive fare classes are passengers travelling for business. As such, the number of premium passengers (First, Business or Full Economy class) is used to differentiate between the share of passengers travelling for business per country.
Figure 7.2 The largest share of bookings in Latin America is in the two lowest fare classes
Source: IATA PaxIS
Figure 7.3 shows that the share of passengers travelling for business does not show a very strong variation across the different countries or sub-regions. The highest share of passengers travelling for business reasons is found in French Guiana (27 percent), whereas Belize has the lowest share of passengers travelling for business reasons (21 percent).
First0%
Business3% Full Economy
4%
Discount Economy
67%
Other Classes26%

48 CHAPTER 7
SEO AMSTERDAM ECONOMICS
Figure 7.3 The share of passengers travelling for business fluctuates between 21 and 27 percent
Source: IATA PaxIS; elaboration SEO
We assume the business/leisure share remains constant over time for the ‘Baseline’ scenario. Due to the higher price sensitivity of leisure passengers, the latter type of passengers increases relatively more. As a result, the share of leisure passengers increases due to the decrease in taxes or charges in the scenarios.
7.1.2 Wider economic benefits
Direct consumer benefits may generate wider benefits for the economy. The direct user benefits for air passengers caused by a decrease in aviation taxes will to a large extent be passed on to other sectors of the economy. As a result, businesses and households that do not use aviation may still benefit from an aviation tax decrease, for example because companies pass on lower transport costs to end users via lower prices. Companies may also benefit from higher profits and as a result, will invest more. Hence, direct user benefits may have wider economic (or indirect) impacts outside the aviation industry itself. However, not all these wider benefits are additional benefits. When there are no market imperfections and no cross-border impacts, total welfare benefits will be equal to the direct benefits. In this case, there are no additional wider economic impacts.
Agglomeration effects There may be additional wider economic benefits in case of market imperfections.21 Important sources of additional wider economic effects are the agglomeration effects. Connectivity growth in an airport region may lead to a higher density of activities in that region. Concentration of economic activities in itself can reduce (spatial) market imperfections and result in higher productivity
21 As Vickerman (2007) puts it, by the additional wider economic benefits “[..] we mean all economic benefits
which are not captured in the direct user benefits of the type which are normally analysed in a well-constructed transport cost-benefit analysis after allowing for environmental and other directly imposed external costs”.
15%
20%
25%
30%Sh
are
of b
usin
ess p
asse
nger
s

CONSUMER BENEFITS OF REDUCING AVIATION TAXES 49
SEO AMSTERDAM ECONOMICS
measured in GDP/capita, for example because of knowledge spill-overs, a pooled labour market and consumption variety. The empirical evidence on the additional wider economic benefits of aviation growth is scarce.22,23 In this study, we rely on the guidelines by the CPB Netherlands Bureau for Economic Policy analysis that additional wider effects are between 0-30 percent of the impacts of aviation users (Elhorst et al. 2004)24. We use 15 percent of the users travelling on a business motive, as business travel and not leisure travel is likely to generate additional welfare impacts elsewhere in the economy.
Employment effects In addition to these agglomeration effects, other wider economic benefits may arise due to an increase in employment. If an increase in connectivity leads to additional job creation, the welfare benefit of each job is equal to the average tax burden per job (difference between the employer’s cost of labour and the employees net income). This follows from labour supply theory, in which (at the margin) unemployed people valuate their leisure time equal to the net wage level. When these people become employed, their productivity is (at least) equal to their wage costs. Hence, the consumer welfare benefits per job are approximately equal to their wage costs minus their net wage. Another way job creation might occur is through a shift from informal employment to registered employment. In Latin America a significant share of the population is currently working in informal activities. As no tax is paid over informal labour, net and gross wages are equal. In case of a transition from informal to formal labour, productivity increases while the worker’s net wage remains (approximately) equal. As such, the welfare gains again equal the difference between gross and net income. The difference in gross and net wages is estimated by using the tax burden on income, profits and capital gains as a percentage of GDP. This data is obtained from two sources, being the Worldbank and CEPALSTAT, where we used the former data source if available and the latter otherwise.25 Using this data, we estimate the welfare impact per additional job by:
𝐺𝐺𝐺𝐺𝐺𝐺𝑗𝑗𝑗𝑗𝑗𝑗
∗𝑡𝑡𝑇𝑇𝑡𝑡𝐺𝐺𝐺𝐺𝐺𝐺
=𝑡𝑡𝑇𝑇𝑡𝑡𝑗𝑗𝑗𝑗𝑗𝑗
22 As Forsyth (2013, p.15) puts it: “[..] there is an externality present. There is a problem of measuring how
large this externality is”. According to a review of studies on investments in transport infrastructure, Rouwendal (2012) concludes that there are indications that additional indirect effects can be substantial (positive but also negative) in case of imperfect competition but that “[..] the question about the importance of additional indirect effects is still open and it is therefore unclear what level of generality can be attached to them” (Rouwendal 2012, p.5)
23 Some researchers (Forsyth 2013) therefore argue that a combination of a welfare/CBA approach with Computable General Equilibrium modelling could be a way to overcome the lack of insight into the wider economic benefits of aviation connectivity growth. Yet, such exercises are cumbersome, data-demanding and generally outside the scope of project evaluations.
24 The 0-30 percent guideline is based on a number of studies on the additional wider economic benefits: Mott MacDonald (2006) 17 percent; MVA (2006) 30-50 percent; Elhorst & Oosterhaven (2008) -1 to +38 percent; SACTRA (1999) 6 perent; Venables & Gasiorek (1999) 30-50 percent.
25 For some countries no data on the average tax burden is available. For the Bahamas, Puerto Rico/US Virgin Islands and UK BOT a 0% tax burden is used due to low/zero income tax level. For Guyana we applied the average income tax burden for South America, and for Trinidad and Tobago the average income tax burden of the Caribbean.

50 CHAPTER 7
SEO AMSTERDAM ECONOMICS
Increases in the number of jobs in each scenario are derived from our employment estimations in Chapter 8. As Latin American countries are generally far from full employment, it is reasonable to assume that estimated job gains are real additional jobs and not redistributions within the economy.
Tourism revenues A decrease of aviation taxes leads to an increase in incoming tourists. This leads to a significant economic contribution, particularly in economies with a strong focus on tourism. However, we should prevent double counting with employment impacts. Increased tourism revenues lead to additional job creation, for which the welfare impacts are calculated using the methodology described above. Welfare impacts additional to these employment impacts could arise if excess profits are made in the tourism industry, which are higher than in other sectors. We are not able to check whether these excess profits exist in the tourism sector. In the event that these profits exist, it is unknown whether these lead to welfare impacts in the respective country, as they might “leak away” to other countries (e.g. via large international hotel chains). To be on the conservative side, we assume that there are no additional welfare impacts through an increase in tourism expenditure over and above the agglomeration benefits and employment benefits described above.
7.1.3 Scope
We note that this study quantifies the consumer and wider economic benefits of tax removal and charges reduction. The estimation of environmental externalities and the opportunity costs of a tax/charges reduction (i.e. the impacts of tax revenue spending in the wider economy) is outside the scope of this study.
7.2 Overall benefits in Latin America and the Caribbean
7.2.1 Immediate tax removal and charges reduction
This section presents the estimated consumer welfare impacts in the event that taxes and charges are decreased immediately.26 In Chapter 5, we have shown that a removal of taxes or reduction of charges results in a significant increase in passengers in Latin America. Both existing passengers and new passengers benefit from a cost reduction and frequency increase.
‘Tax Removal’ scenario The immediate aggregate consumer benefits for Latin America and the Caribbean add up to $ 5.8 billion if all taxes were abolished immediately (see Table 7.1). The largest share of total consumer benefits (73 percent) is generated by leisure passengers. However, per passenger benefits are higher for passengers travelling for business than for leisure passengers ($ 65 for business versus $ 46 for leisure). Because air fares for business passengers are generally higher, higher price reductions follow from the removal of taxes in case these taxes are a percentage of the ticket price. In addition,
26 Modelled as a tax removal and charges decrease in the base year 2014

CONSUMER BENEFITS OF REDUCING AVIATION TAXES 51
SEO AMSTERDAM ECONOMICS
business passengers are more time sensitive. Therefore, these passengers benefit relatively more from travel time decreases resulting from increased flight frequencies.
Table 7.1 In the ‘Tax Removal’ scenario total consumer benefits add up to $ 5.7 billion
Business Leisure Total
‘Tax Removal’ scenario
Number of passengers residing in Latin America (thousands) 24,281 90,554 114,835
Total consumer benefits (mln USD) 1,578 4,175 5,752
Benefits per passenger (USD) $65 $46 $50
Source: SEO NetCost
‘Tax Removal and Charges Reduction’ scenario If, in addition, the passenger based charges were reduced, total consumer benefits accrue to $ 7.9 billion (see Table 7.2). Again, the largest share of welfare benefits are generated by leisure passengers, consisting of 74 percent of the total consumer welfare benefits. Per passenger benefits are $ 84 for business passengers and $ 61 for leisure passengers.
Table 7.2 In the ‘Tax Removal and Charges Reduction’ scenario total consumer benefits add up to $ 7.9 billion
Business Leisure Total
‘Tax Removal and charges reduction’ scenario
Number of passengers residing in Latin America (thousands) 24,519 95,166 119,685
Total consumer benefits (mln USD) 2,048 5,816 7,864
Benefits per passenger (USD) $84 $61 $66
Source: SEO NetCost
Figure 7.4 Total consumer benefits, if taxes were removed immediately, differ by country
Total consumer welfare benefits in both scenarios
0 500000000 1E+09 1,5E+09 2E+09
0 500 1000 1500 2000
Puerto Rico & US Virgin IslandsBelize
GuyanaBrazil
SurinameFrench Guiana
CubaNicaraguaBahamasParaguay
Dutch CaribbeanJamaica
UruguayCosta Rica
El SalvadorHonduras
Trinidad and TobagoGuatemala
Haiti & French West IndiesDominican Republic
PanamaUK BOT & Commonwealth
BoliviaEcuador
ChilePeru
VenezuelaMexico
ColombiaArgentina
0
400
800
1200
1600
Mln USD
Mln
USD
Tax RemovalTax Removal & Charges Reduction
Source: SEO NetCost

52 CHAPTER 7
SEO AMSTERDAM ECONOMICS
Figure 7.4 shows the total direct consumer benefits per country. These benefits strongly differ by country. Differences are caused by the current level of taxes in the country as well as by the size of the aviation markets. Figure 7.5 gives the per passenger impacts. Chapters 9, 10 and 11 elaborate on the consumer benefits per sub-region and country for Central America and Mexico, the Caribbean and South America.
Figure 7.5 Total consumer welfare benefits per residential passenger fluctuate between $ 0 and $ 186 if taxes were removed immediately
Effects of both scenarios on welfare per residential passenger 0 50 100 150 200 250
0 50 100 150 200 250
Puerto Rico & US Virgin IslandsBrazilBelize
Dutch CaribbeanCuba
BahamasMexico
ChileHaiti & French West IndiesUK BOT & Commonwealth
Trinidad and TobagoParaguay
BoliviaJamaica
Costa RicaPeru
EcuadorColombia
French GuianaNicaraguaSuriname
PanamaEl SalvadorVenezuela
UruguayGuatemala
HondurasDominican Republic
GuyanaArgentina
0
25
50
75
100
USD
USD
Tax RemovalTax Removal & Charges Reduction
Source: SEO NetCost
7.2.2 Total benefits
In addition to the consumer benefits, wider economic benefits may accrue through agglomeration effects and an increase in employment. These add up to $ 237 million in the ‘Tax Removal’ scenario, and to $ 306 million in the ‘Tax Removal and Charges Reduction’ scenario. The benefits through additional employment are estimated by the number of additional jobs multiplied by the average income tax burden per country. These add up to $ 769 million in the first scenario, and $ 1.24 billion in the second scenario.
Table 7.3 Total consumer benefits and wider economic benefits add up to $ 9.4 billion if all taxes are removed and passenger based charges are reduced
Total benefits (USD bln) Tax Removal Tax Removal and Charges Reduction
Direct consumer benefits 5.8 7.9
Agglomeration/productivity 0.2 0.3
Employment effects 0.8 1.2
Total 6.8 9.4
Source: SEO NetCost
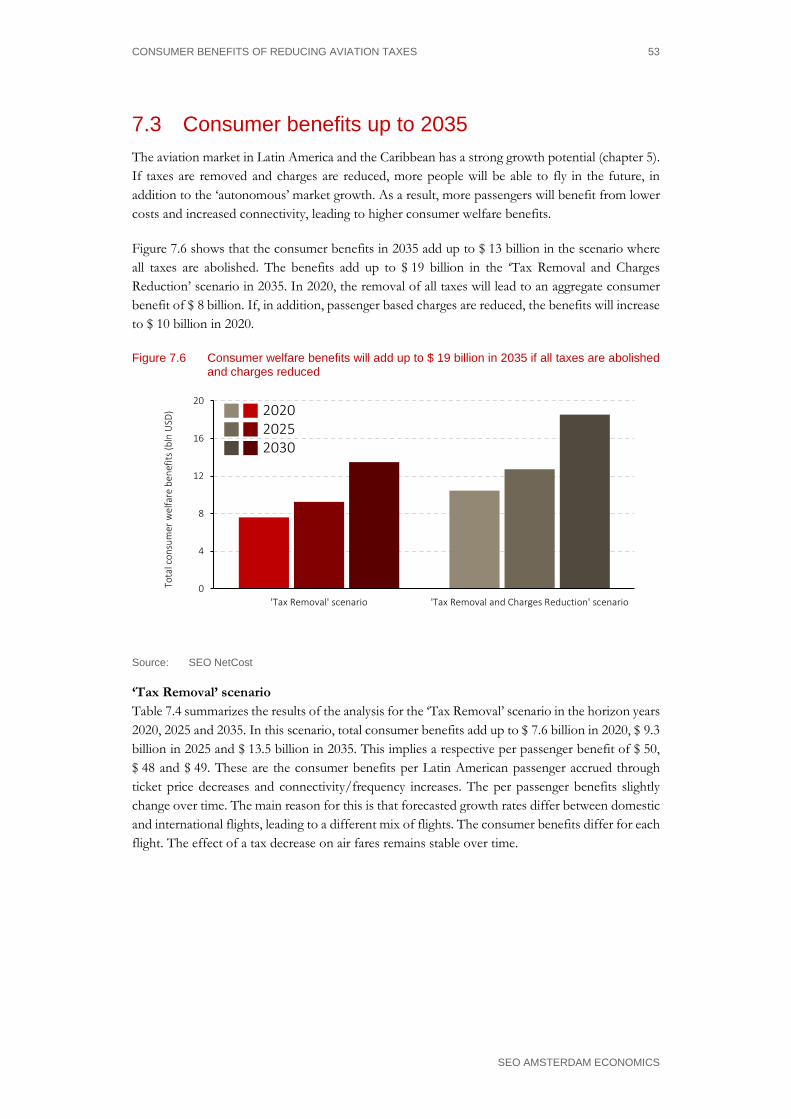
CONSUMER BENEFITS OF REDUCING AVIATION TAXES 53
SEO AMSTERDAM ECONOMICS
7.3 Consumer benefits up to 2035 The aviation market in Latin America and the Caribbean has a strong growth potential (chapter 5). If taxes are removed and charges are reduced, more people will be able to fly in the future, in addition to the ‘autonomous’ market growth. As a result, more passengers will benefit from lower costs and increased connectivity, leading to higher consumer welfare benefits.
Figure 7.6 shows that the consumer benefits in 2035 add up to $ 13 billion in the scenario where all taxes are abolished. The benefits add up to $ 19 billion in the ‘Tax Removal and Charges Reduction’ scenario in 2035. In 2020, the removal of all taxes will lead to an aggregate consumer benefit of $ 8 billion. If, in addition, passenger based charges are reduced, the benefits will increase to $ 10 billion in 2020.
Figure 7.6 Consumer welfare benefits will add up to $ 19 billion in 2035 if all taxes are abolished and charges reduced
0
4
8
12
16
20
'Tax Removal' scenario 'Tax Removal and Charges Reduction' scenario
Tota
l con
sum
er w
elfa
re b
enef
its (b
lnU
SD) 2020
20252030
Source: SEO NetCost
‘Tax Removal’ scenario Table 7.4 summarizes the results of the analysis for the ‘Tax Removal’ scenario in the horizon years 2020, 2025 and 2035. In this scenario, total consumer benefits add up to $ 7.6 billion in 2020, $ 9.3 billion in 2025 and $ 13.5 billion in 2035. This implies a respective per passenger benefit of $ 50, $ 48 and $ 49. These are the consumer benefits per Latin American passenger accrued through ticket price decreases and connectivity/frequency increases. The per passenger benefits slightly change over time. The main reason for this is that forecasted growth rates differ between domestic and international flights, leading to a different mix of flights. The consumer benefits differ for each flight. The effect of a tax decrease on air fares remains stable over time.

54 CHAPTER 7
SEO AMSTERDAM ECONOMICS
Table 7.4 Consumer benefits in the ‘Tax Removal’ scenario add up to $ 13 billion in 2035
2020 2025 2035
'Tax Removal' scenario Business Leisure Total Business Leisure Total Business Leisure Total
Total passengers residing in Latin America (mln) 33 121 154 40 151 191 59 219 277
Total benefits (mln USD) 2,094 5,525 7,619 2,547 6,711 9,258 3,723 9,770 13,493
Per passenger benefits $64 $46 $50 $63 $45 $48 $64 $45 $49
Source: SEO NetCost
‘Tax Removal and Charges Reduction’ If all passenger based charges are reduced to the level of the 25th percentile in the sub-region – the ‘Tax Removal and Charges Reduction’ scenario – consumer welfare benefits will accrue to $ 10.4 billion in 2020, $ 12.7 billion in 2025 and $ 18.5 billion in 2035 (see Table 7.5). Around 74 percent of these benefits are generated by leisure passengers. Per passenger benefits are higher for business passengers due to higher average air fares, adding up to $ 83 in 2020 and $ 82 in 2035. One can observe that the passenger increase in the ‘Tax Removal and Charges Reduction’ scenario with respect to the first scenario is mainly caused by an increase in leisure passengers. Because passengers with a leisure motive are more price sensitive, a decrease in airfares leads to stronger market stimulation in the leisure segment.
Table 7.5 In the ‘Tax Removal and Charges Reduction’ scenario consumer benefits add up to $ 19 billion or $ 64 per passenger
2020 2025 2035
'Tax Removal and Charges Reduction’ scenario
Business Leisure Total Business Leisure Total Business Leisure Total
Total passengers residing in Latin America (mln) 33 128 161 41 159 199 59 230 289
Total benefits (mln USD) 2,728 7,729 10,457 3,323 9,401 12,725 4,853 13,685 18,537
Per passenger benefits $83 $61 $65 $81 $59 $64 $82 $59 $64
Source: SEO NetCost
7.3.1 Total benefits
Total consumer benefits and wider economic benefits accumulate to $ 15 billion in the ‘Tax Removal’ scenario and to $ 21 billion in the ‘Tax Removal and Charges Reduction’ scenario in 2035. In addition to the consumer benefits, wider economic benefits are generated through agglomeration and productivity effects and additional job creation. Wider economic benefits through agglomeration and productivity effects are estimated at 15 percent of the consumer welfare benefits for business passengers. In 2035, these add up to $ 0.6 billion in the ‘Tax Removal’ scenario, and to $ 0.7 billion in the ‘Tax and Charges Removal’ scenario. Wider economic benefits through additional employment27 are also expected to increase over time. As we do not have forecasts for employment in future years at our disposal, we assume that the 27 Based on the employment estimates in chapter 8.

CONSUMER BENEFITS OF REDUCING AVIATION TAXES 55
SEO AMSTERDAM ECONOMICS
number of employees increases by the same rate as the population growth forecast (derived from the World Bank). In 2035, the consumer benefits from additional employment adds up to $ 0.9 billion in the ‘Tax Removal’ scenario and $ 1.5 billion in the ‘Tax Removal and Charges Reduction’ scenario.
Table 7.6 Consumer benefits and wider economic benefits of a removal of passenger based taxes and charges increase over time
'Tax Removal' 'Tax Removal and Charges Reduction'
Impacts (USD billion, undiscounted) 2020 2025 2035 2020 2025 2035
Consumer benefits 7.6 9.3 13.5 10.5 12.7 18.5
Agglomeration/productivity 0.3 0.4 0.6 0.4 0.5 0.7
Employment effects 0.8 0.9 0.9 1.3 1.4 1.5
Total 8.8 10.5 15.0 12.2 14.6 20.7
Source: SEO analysis
7.4 Cumulative benefits up to 2035 Cumulative agglomeration and productivity impacts add up to $ 4 billion in the ‘Tax Removal’ scenario and $ 6 million in the ‘Tax Removal and Charges Reduction’ scenario. Cumulative benefits from additional employment are estimated at $ 10-$ 16 billion in the two scenarios. This results in cumulative total benefits of $ 122 billion in the ‘Tax Removal’ scenario, and $ 170 billion in the ‘Tax Removal and Charges Reduction’ scenario (see Table 7.7). The total cumulative benefits have been discounted to present day values using a discount rate of 4.4 percent28. For the calculation of the cumulative consumer benefits, we assume that taxes (and charges, depending on the scenario) will gradually decline to zero until 2020. As such, the benefits are 0 in 2014, and equal to the values in the horizon years as presented in this chapter. Figure 7.7 shows the cumulative discounted benefits until 2035. Between 2014 and 2020 the benefits increase each year, due to the gradual decrease in taxes and charges. By 2035, the cumulative direct benefits add up to $ 122 billion in the ‘Tax Removal’ scenario and $ 170 billion in the ‘Tax Removal and Charges Reduction’ scenario.
Table 7.7 Cumulative benefits (consumer benefits and wider economic benefits) add up to $ 170 billion over the period 2014-2035
Impacts (USD billion, discounted) 'Tax Removal' 'Tax Removal and Charges Reduction'
2014-2035 2014-2035
Consumer benefits 108 148
Agglomeration/productivity 4 6
Employment effects 10 16
Total 122 170
Source: SEO analysis
28 This discount rate is derived from Lopez (2008), who estimates the social discount rates for nine Latin
America countries in four scenarios. The 4.4 percent discount rate follows from the average of the two intermediate scenarios.

56 CHAPTER 7
SEO AMSTERDAM ECONOMICS
Figure 7.7 Total cumulative benefits (consumer benefits and wider economic benefits) add up to $ 122 billion-$ 170 billion in the two scenarios
Source: SEO analysis
0
20
40
60
80
100
120
140
160
180Cu
mul
ativ
e di
scou
nted
wel
fare
impa
cts (
bln
USD
)
'Tax Removal' 'Tax Removal and Charges Reduction'
ECONOMIC BENEFITS OF REDUCING AVIATION TAXES IN LATIN AMERICA AND THE CARIBBEAN 57
SEO AMSTERDAM ECONOMICS
8 Macro-economic contribution of reducing aviation taxes
Removal of aviation taxes in Latin America and the Caribbean may potentially generate a GDP increase of $ 87 billion. If also passenger-based charges are reduced, we estimate the GDP benefit at $ 135 billion. In addition, we estimate the employment effects of the removal of aviation taxes at 912 thousand jobs, and 1.4 million jobs in case passenger-based charges are scaled back as well. In this chapter, we discuss the changes in the economic contribution resulting from a removal of taxes and reduction of passenger-based charges, using the macro-economic approach. More specifically, we estimate the macro impact on GDP and employment. Furthermore, we consider the catalytic economic impact in terms of tourism, R&D/innovation, trade and investment.
8.1 Methodology A fixed-effects panel data model has been used to estimate the macro-economic impacts on GDP at the country level. Panel data models allow for comparing the effects of change in air transport on the economy. The model analyses effects within countries over time, rather than analysing effects between different countries. We use time-lag variables to correct for causality issues in the model. It is widely acknowledged that there is a two-way correspondence between air travel and economic growth. The relationship is bi-directional. To isolate the causal effect of air travel on GDP growth, we estimate the impact of a change in air passengers in the year t-1 on the change in total GDP in year t. It is unlikely that GDP growth in a certain year impacts the growth in air travel in an earlier point in time. Hence, we estimate the effect of a change in air passengers or connectivity in a certain year on the change in the dependent economic variable in the year thereafter. Log-values of the dependent variables and connectivity figures are used in our model. Therefore, the resulting coefficients can be interpreted as elasticities. For example, in a regression with GDP as the dependent variable, a coefficient of 0.1 for passenger numbers implies that a 10 percent increase in passengers in one year results in a 1 percent increase in GDP in the subsequent year. The total GDP effect gives an indication of aggregate economic growth resulting from connectivity growth. The total GDP impact induced by connectivity growth can result from an increase in productivity and economic output, as well as through additional employment associated with aviation growth. We have applied the estimated GDP and employment coefficients to forecast a net increase in GDP or employment figures using 2012 data – which is the most recent data available. To estimate the impact of aviation on GDP and employment, we used international connectivity as an independent variable. This yielded more robust and statistically significant results than using

58 CHAPTER 8
SEO AMSTERDAM ECONOMICS
total – domestic and international – connectivity as an independent variable29. Although this analysis focuses on the relationship between international connectivity and economic growth, this does not imply that domestic connectivity does not contribute to this growth. Domestic connectivity is of major importance in connecting main economic centres of the country. Furthermore, domestic connections are important for airlines to operate hub-and-spoke networks in order to profitably operate a large international network. In this chapter the impacts of decreasing aviation taxes and charges on GDP, employment and wider catalytic impacts are described. The regression results used for this analysis are shown in Appendix J. The use of econometric analysis to estimate macro-economic impacts There are different techniques for measuring the economic impact of airports. A frequently applied method is input-output analysis (I/O), which uses exogenously determined multipliers. It distinguishes between direct, indirect, induced and catalytic impact of air transport. The direct impact entails the employment and GDP associated with the operation and management of activities at the airports, including the airlines, ATC, ground handlers, security, maintenance, immigration and customs. The remainder of the impacts are indirect (generated by downstream industries that support and supply the activities at the airport), induced (economic activity and spending generated by employees of firms directly or indirectly related to the airport) and catalytic (facilitation of business of other sectors of the economy due to aviation). The disadvantage of I/O is that it (partially) neglects the role of transport infrastructure as an intermediate good that leads to an increase of productivity and to cost savings at the downstream level (Malina & Wollersheim 2007), as well as labour market effects. As such, I/O based methodologies produce gross impacts, or the additional economic activity associated with aviation growth, but not the long-term, net impacts. In this study, we use an econometric approach. One of the benefits of econometric analysis over I/O is that the former method is better able to measure the net impacts30: it estimates the impact on economic output for the entire economy, instead of estimating the impacts on economic activities associated directly or indirectly with aviation. The challenges for the econometric approach are on the other hand the requirement of long time series of reliable data and the treatment of causality/endogeneity. In addition, the econometric approach uses elasticities based on historical relationships. Hence, the econometric approach assumes stability of the relationships as found in the past, which may not necessarily be the case. In this chapter, we present the GDP and employment impacts based on econometric analysis. For a detailed description of the methodology and regression results, we refer to Appendix J.
8.2 Macro-economic contribution of reducing aviation taxes
This section presents the macro-economic impact of the removal of aviation taxes. Removal of aviation taxes and passenger-based charges results in a stronger increase in passenger demand for Latin America and the Caribbean than the baseline. This is partly the result of lower airfares, which are passed through to the passengers, and partly due to rising connectivity levels, which bring down the time travel costs for passengers and again stimulate demand. 29 A possible explanation is the fact that domestic connectivity shows much stronger fluctuations year-on-
year, particularly for carriers operating small aircraft with a high frequency to connect rural areas to the main economic centres. Due to the low quality of landside infrastructure in numerous countries, domestic air connections are often the only travel alternative. In addition, there is a strong difference between countries in the supply of domestic connectivity. Some countries have no domestic connections, while for other countries domestic connectivity comprises the lion’s share of the total connectivity.
30 An approach that was also put forward by Button and Yuan (2011).

MACRO-ECONOMIC CONTRIBUTION OF REDUCING AVIATION TAXES 59
SEO AMSTERDAM ECONOMICS
Using 2014 as base year in the ‘Tax Removal’ scenario, direct connectivity increases by 293 thousand or 8 percent. Focusing on international flights alone, this results in 124 thousand or a 12 percent increase in departures (see Figure 8.1). These numbers translate to an increase of 10 and 12 percent in total and international passengers respectively. In the ‘Tax Removal and Charges Reduction’ scenario the total amount of international flights and passengers will be respectively 19 and 17 percent higher than the baseline.
Figure 8.1 Removal of aviation taxes induces a 12 percent increase in international departures (direct connectivity) in Latin America and the Caribbean.
Source: SEO analysis
From the results of our panel data regression it follows that a 1 percent increase in direct international connectivity (approximately equivalent to direct flights) leads to a 0.13 percent increase in total net GDP at the country level.31 Using this elasticity, we estimate that the 12 percent increase in international connectivity in the ‘Tax Removal’ scenario would lead to a 1.6 percent increase in total net GDP (see Figure 8.2). In the ‘Tax Removal and Charges Reduction’ scenario, the international connectivity increase with respect to the baseline is 19 percent. Using the same elasticities, this leads to a 2.5 percent GDP increase compared to the baseline. Besides impacts on GDP, our panel data analysis also finds a significant effect for international connectivity on employment. During the period studied (between 2002 and 2012) a one percent increase in international connectivity has resulted in a 0.03 percent increase in employment at the country level. Relating this to the projected increase in international connectivity caused by the ‘Tax Removal’ scenario this leads to a 0.34 percent increase in employment on average. In the ‘Tax Removal and Charges Reduction’ scenario, employment increases by 0.53 percent.
31 These results are in similar ranges as those of other studies. For example, PWC (2015) finds that a 1 percent
growth in passengers results in a 0.1 percent GDP growth using econometric analysis. Poort (2000) using a three-stage least squares regression finds that a 1% growth in passenger enplanements leads to a 0.17 percent GDP growth in Europe. For employment, Bilotkach (2015) reports that a 1% growth in passengers leads to a 0.013 percent growth in employment in US metropolitan areas, using a panel data approach.
12% 19%
0%
20%
40%
60%
80%
100%
120%
0
0,2
0,4
0,6
0,8
1
1,2
Baseline Tax Removal Tax Removal andCharges Reduction
Dire
ct in
tern
atio
nal f
light
s (m
ln)

60 CHAPTER 8
SEO AMSTERDAM ECONOMICS
Figure 8.2 The impacts of ‘Tax Removal’ and ‘Tax Removal and Charges Reduction’ on GDP are 1.6 and 2.5 percent respectively for Latin America and the Caribbean.
Source: SEO analysis
8.2.1 Impact on GDP
Figure 8.3 shows the estimated GDP contribution per country. Total GDP in Latin America increases by $ 87 billion in the ‘Tax Removal’ scenario. This amount increases to $ 135 billion in the ‘Tax Removal and Charges Reduction’ scenario. This amount includes net direct, indirect, induced and catalytic GDP benefits. The largest benefits – in absolute terms – of the ‘Tax Removal’ scenario are realized in Argentina and Colombia, together accounting for 52 percent of the total GDP effect in the region. These countries both have relatively high aviation taxes, as well as a large share of the total GDP in Latin America. These two factors combined lead to large GDP impacts in both countries. Brazil, not levying any taxes on aviation passengers to remove, experiences no effect on its connectivity or GDP in the ‘Tax Removal’ scenario. In the ‘Tax Removal and Charges Reduction’ scenario Brazil would experience a 0.4 percent increase in GDP, resulting in over $ 10 billion based on 2012 GDP levels. In this second scenario, Argentina continues being the largest benefiter, both in terms of relative and absolute growth.
0% 1% 2% 3%
GDP
Employment
% increase
Tax Removal Tax Removal and Charges Reduction

MACRO-ECONOMIC CONTRIBUTION OF REDUCING AVIATION TAXES 61
SEO AMSTERDAM ECONOMICS
Figure 8.3 Aviation taxes removal leads potentially to a GDP increase of $ 32 billion in Argentina
Absolute and relative effects of both scenarios on GDP 0 5E+10
0 15 30 45
Brazil
Chile
Puerto Rico & US Virgin Islands
Dutch Caribbean
French Guiana
Belize
Guyana
Bahamas
Suriname
Haiti & French West Indies
UK BOT & Commonwealth
Nicaragua
Cuba
Jamaica
Trinidad and Tobago
Paraguay
El Salvador
Honduras
Panama
Costa Rica
Bolivia
Uruguay
Guatemala
Dominican Republic
Ecuador
Peru
Venezuela
Mexico
Colombia
Argentina
0 0,05
0% 2% 4% 6% 8%
BrazilChile
Puerto Rico & US Virgin IslandsDutch Caribbean
French GuianaBelize
GuyanaBahamasSuriname
Haiti & French West IndiesUK BOT & Commonwealth
NicaraguaCuba
JamaicaTrinidad and Tobago
ParaguayEl Salvador
HondurasPanama
Costa RicaBolivia
UruguayGuatemala
Dominican RepublicEcuador
PeruVenezuela
MexicoColombiaArgentina
0
6
12
18
24
30
Percent Bln USDBln
USD
Tax RemovalTax Removal & Charges Reduction
Source: SEO analysis based on World Bank data
8.2.2 Net impact on employment
The projection for total increase in net employment for the ‘Tax Removal’ is over 900 thousand jobs in Latin America and the Caribbean as a whole. We estimate that Argentina and Colombia will experience the highest absolute employment increase, with 198 thousand and 168 thousand jobs, respectively. In relative terms, Argentina shows by far the highest job impact with 1.1 percent, followed by Bolivia, Honduras and Colombia all close to 0.8 percent. Again, those countries with the highest aviation taxes stand to benefit the most, while countries such as Brazil and Chile show no effect at all since their taxes are already at the minimum level.
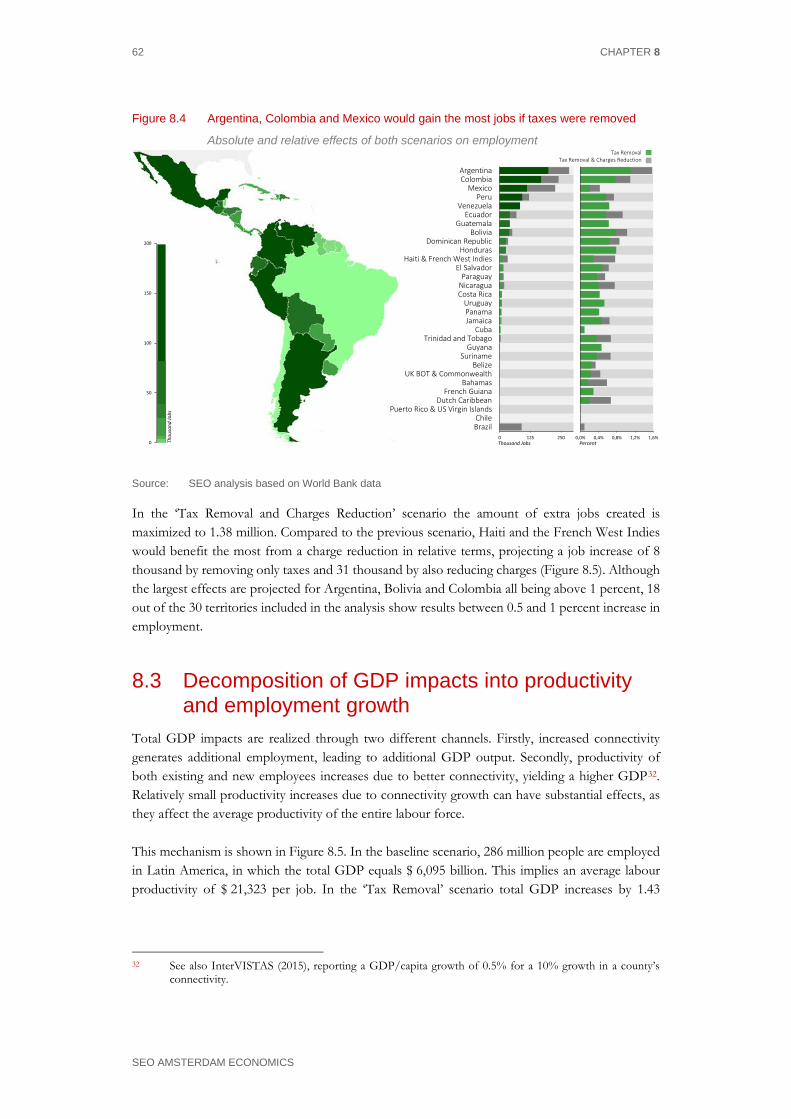
62 CHAPTER 8
SEO AMSTERDAM ECONOMICS
Figure 8.4 Argentina, Colombia and Mexico would gain the most jobs if taxes were removed
Absolute and relative effects of both scenarios on employment 0 0,01
0,0% 0,4% 0,8% 1,2% 1,6%
Brazil
Chile
Puerto Rico & US Virgin Islands
Dutch Caribbean
French Guiana
Bahamas
UK BOT & Commonwealth
Belize
Suriname
Guyana
Trinidad and Tobago
Cuba
Jamaica
Panama
Uruguay
Costa Rica
Nicaragua
Paraguay
El Salvador
Haiti & French West Indies
Honduras
Dominican Republic
Bolivia
Guatemala
Ecuador
Venezuela
Peru
Mexico
Colombia
Argentina
0 100000 200000 300000
0 125 250
BrazilChile
Puerto Rico & US Virgin IslandsDutch Caribbean
French GuianaBahamas
UK BOT & CommonwealthBelize
SurinameGuyana
Trinidad and TobagoCuba
JamaicaPanamaUruguay
Costa RicaNicaraguaParaguay
El SalvadorHaiti & French West Indies
HondurasDominican Republic
BoliviaGuatemala
EcuadorVenezuela
PeruMexico
ColombiaArgentina
0
50
100
150
200
Thousand Jobs PercentThou
sand
Jobs
Tax RemovalTax Removal & Charges Reduction
Source: SEO analysis based on World Bank data
In the ‘Tax Removal and Charges Reduction’ scenario the amount of extra jobs created is maximized to 1.38 million. Compared to the previous scenario, Haiti and the French West Indies would benefit the most from a charge reduction in relative terms, projecting a job increase of 8 thousand by removing only taxes and 31 thousand by also reducing charges (Figure 8.5). Although the largest effects are projected for Argentina, Bolivia and Colombia all being above 1 percent, 18 out of the 30 territories included in the analysis show results between 0.5 and 1 percent increase in employment.
8.3 Decomposition of GDP impacts into productivity and employment growth
Total GDP impacts are realized through two different channels. Firstly, increased connectivity generates additional employment, leading to additional GDP output. Secondly, productivity of both existing and new employees increases due to better connectivity, yielding a higher GDP32. Relatively small productivity increases due to connectivity growth can have substantial effects, as they affect the average productivity of the entire labour force. This mechanism is shown in Figure 8.5. In the baseline scenario, 286 million people are employed in Latin America, in which the total GDP equals $ 6,095 billion. This implies an average labour productivity of $ 21,323 per job. In the ‘Tax Removal’ scenario total GDP increases by 1.43
32 See also InterVISTAS (2015), reporting a GDP/capita growth of 0.5% for a 10% growth in a county’s
connectivity.

MACRO-ECONOMIC CONTRIBUTION OF REDUCING AVIATION TAXES 63
SEO AMSTERDAM ECONOMICS
percent.33 Based on the results of the employment regression, this results in an increase of 912 thousand jobs (a 0.32 percent increase). Combining the results of employment and GDP increase, we find that productivity increases by $ 237 per job, a 1.11 percent increase. The 912 thousand new employees all contribute $ 21,561 to the economy, leading to a GDP impact of $ 19.6 billion. In addition, the productivity of the existing 286 million working people increases by $ 237. This yields a GDP impact of $ 67.8 billion. These two components together add up to a total GDP impact of $ 87 billion in the ‘Tax Removal’ scenario. In case of the ‘Tax Removal and Charges Reduction’ scenario, employment increases by 1.4 million (0.54 percent increase). The total GDP increase in this scenario amounts to $ 135 billion, an increase of 2.6 percent. Combining these results, a productivity increase of $ 367 per job can be derived, representing a 1.72 percent increase. The existing employees (286 million) become more productive, yielding a GDP impact of $ 105 billion. The 1.4 million additional employees contribute an additional $ 30 billion to GDP. Appendix J provides a decomposition of the GDP impacts in productivity and employment growth per country.
Figure 8.5 GDP growth is realized through new employment as well as through productivity increase of the current labour force
367 USDper employee
237 USDper employee
1.392.112additional jobs
911.662additional jobs
0 500000 1000000 150
0 50 100 150 200 250 300 350 4
135 bln USD
87 blnUSD
00 20 40 60 80 100 120 140
0,0% 0,5% 1,0% 1,5% 2,0% 2,5%
Tax Removal &Charges Reduction
Tax Removal
GDP impact
Productivity78%
Productivity78%
Employment22%
Employment22%
GDP growththrough:
Productivity &employment impact
Source: SEO
8.4 Wider catalytic impacts Next to the macro-economic effects on employment and GDP, air connectivity appears to be an important driver of tourism, trade and innovation. We estimated the impacts of connectivity on FDI, R&D expenditure and tourism. Only for tourism, a strongly significant and positive relationship was found: a 10 percent increase in international connectivity leads to a 2.2 percent increase in the number of inbound tourists.
33 The relative increase of GDP and employment reported in Figure 8.5 differs from those reported in Figure
8.2. The former results are those obtained by adding up the GDP increase at country level, the latter results denote the average GDP increase of all countries.

64 CHAPTER 8
SEO AMSTERDAM ECONOMICS
8.4.1 Impact on tourism
A strong and positive impact was found for international connectivity growth on tourism. A 10 percent increase in international connectivity yields a 2.2 percent increase in the number of tourists. Many countries in Latin America and the Caribbean in particular are important tourist destinations. An increase in connectivity leads to shorter travel times, increasing the attractiveness of the country as a tourist destination. In addition, ticket prices may decrease as a result of increased connectivity due to a higher supply of seat capacity or an increase in competition. Based on the cumulative relative increase in international connectivity, we find that a removal of taxes (‘Tax Removal’ scenario) leads to a 2.7 percent increase in the number of inbound tourists (Figure 8.6). If, in addition, passenger based taxes are also reduced (‘Tax Removal and Charges Reduction’ scenario), the number of tourists increases by 4.3 percent.
Figure 8.6 Abolishing all taxes and reducing charges leads to a 4.3 percent increase in the number of inbound tourists
Source: SEO
In 2013, there were a total number of 95.7 million inbound tourists in all Latin American countries. Abolishing all taxes is estimated to result in an increase of 2.5 million tourists. If, in addition charges were reduced, over 4 million additional tourists are welcomed. Based on average spending per tourist, this results in an increase in revenue from tourists of $ 1.48 billion in the ‘Tax Removal’ scenario and $ 2.15 billion in the ‘Tax Removal and Charges Reduction’ scenario.
8.4.2 Impact on Foreign Direct Investments and R&D expenditure
Access to extensive air transport links allows domestic firms to identify and manage investments in foreign-based assets and encourages foreign firms to invest in the domestic economy. Opening of new routes to Italian regions is associated with increases in Foreign Direct Investments in the years after the route opening (Bannò & Redondi 2014). For the UK, a 10 percent increase in offered seat capacity is associated with a 1.9 percent in FDI outflows and 4.7 percent FDI inflows (PWC 2014). No significant correspondence was found between connectivity growth and the level of inward foreign direct investments as a share of GDP. Possibly inward FDI is more influenced by economic development in the creditor’s country than in the country they want to invest in. It is conceivable that, when the Latin American and Caribbean economies move up the economic value chain, the link between connectivity and FDI will become more significant. Improved air links foster effective networking and collaboration between companies and researchers in different parts of the world. Access to a greater number of markets and exposure to
0% 1% 2% 3% 4% 5%
Tax Removal
Tax Removal and Charges Reduction
% increase in the number of inbound tourists

MACRO-ECONOMIC CONTRIBUTION OF REDUCING AVIATION TAXES 65
SEO AMSTERDAM ECONOMICS
foreign competition also stimulate R&D spending by companies, given the increased size of the potential market for future sales. According to the work of Hovhannisyan & Keller (2014), a 10 percent increase in business travel leads to an increase in patenting by about 0.2 percent, based on research in 37 industries in 34 countries, covering outward business travel from the United States. Baruffaldi (2015) finds that firms located in German regions where airline liberalization induced a higher level of interregional knowledge integration, innovative productivity increased significantly. For Latin America and the Caribbean, we do not find a significant relationship between connectivity growth and R&D expenditure. It is possible that air travel more strongly induces R&D expenditure in more developed economies. It is likely when the Latin American and Caribbean economies move up the economic value chain, the role of aviation in fostering R&D will become more pronounced.

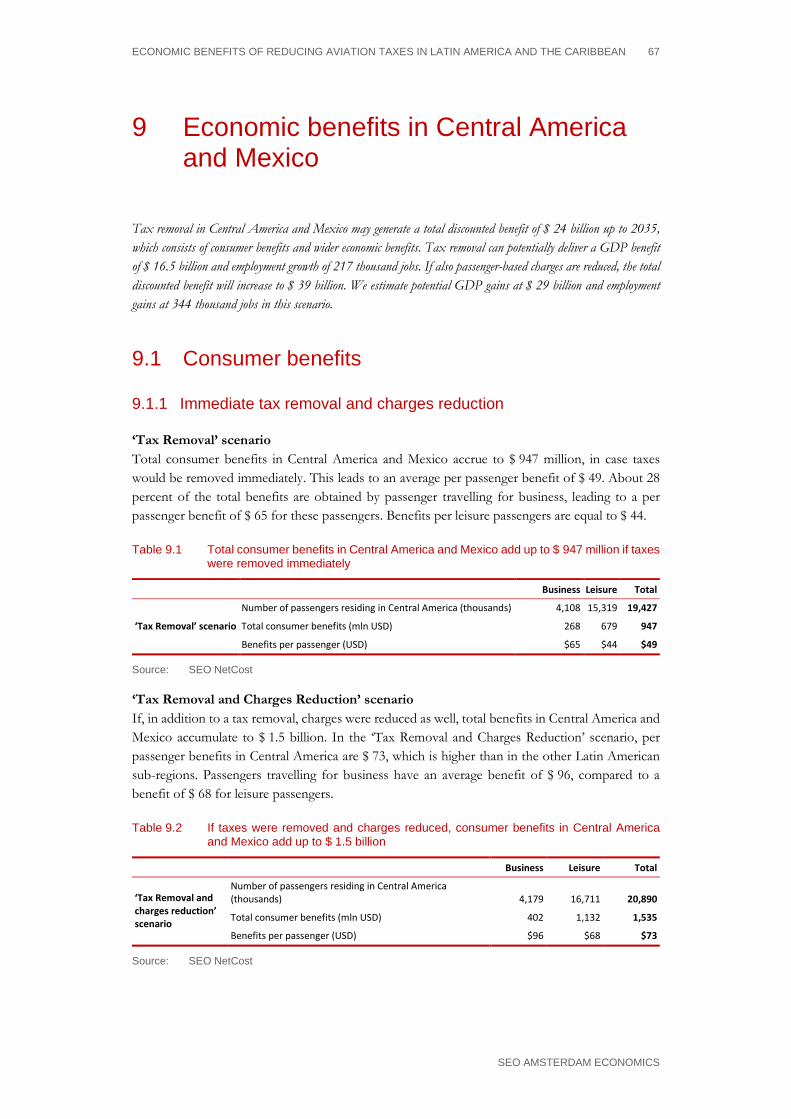
ECONOMIC BENEFITS OF REDUCING AVIATION TAXES IN LATIN AMERICA AND THE CARIBBEAN 67
SEO AMSTERDAM ECONOMICS
9 Economic benefits in Central America and Mexico
Tax removal in Central America and Mexico may generate a total discounted benefit of $ 24 billion up to 2035, which consists of consumer benefits and wider economic benefits. Tax removal can potentially deliver a GDP benefit of $ 16.5 billion and employment growth of 217 thousand jobs. If also passenger-based charges are reduced, the total discounted benefit will increase to $ 39 billion. We estimate potential GDP gains at $ 29 billion and employment gains at 344 thousand jobs in this scenario.
9.1 Consumer benefits
9.1.1 Immediate tax removal and charges reduction
‘Tax Removal’ scenario Total consumer benefits in Central America and Mexico accrue to $ 947 million, in case taxes would be removed immediately. This leads to an average per passenger benefit of $ 49. About 28 percent of the total benefits are obtained by passenger travelling for business, leading to a per passenger benefit of $ 65 for these passengers. Benefits per leisure passengers are equal to $ 44.
Table 9.1 Total consumer benefits in Central America and Mexico add up to $ 947 million if taxes were removed immediately
Business Leisure Total
‘Tax Removal’ scenario
Number of passengers residing in Central America (thousands) 4,108 15,319 19,427
Total consumer benefits (mln USD) 268 679 947
Benefits per passenger (USD) $65 $44 $49
Source: SEO NetCost
‘Tax Removal and Charges Reduction’ scenario If, in addition to a tax removal, charges were reduced as well, total benefits in Central America and Mexico accumulate to $ 1.5 billion. In the ‘Tax Removal and Charges Reduction’ scenario, per passenger benefits in Central America are $ 73, which is higher than in the other Latin American sub-regions. Passengers travelling for business have an average benefit of $ 96, compared to a benefit of $ 68 for leisure passengers.
Table 9.2 If taxes were removed and charges reduced, consumer benefits in Central America and Mexico add up to $ 1.5 billion
Business Leisure Total
‘Tax Removal and charges reduction’ scenario
Number of passengers residing in Central America (thousands) 4,179 16,711 20,890
Total consumer benefits (mln USD) 402 1,132 1,535
Benefits per passenger (USD) $96 $68 $73
Source: SEO NetCost
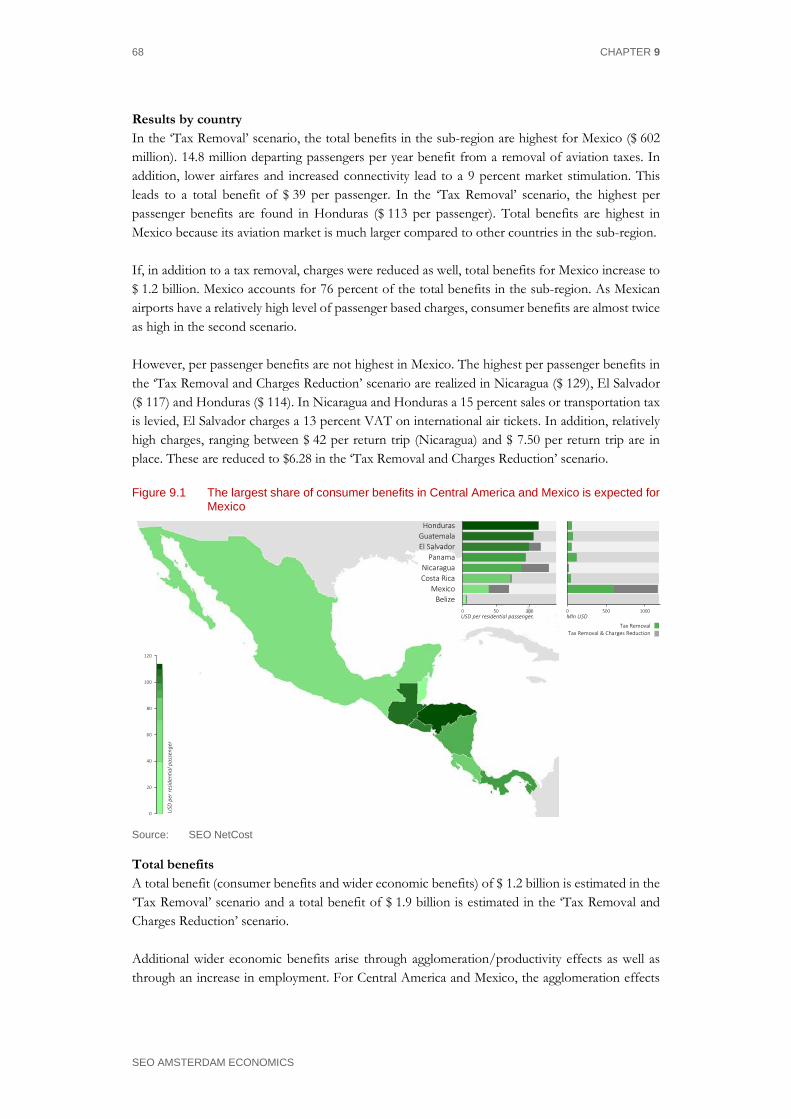
68 CHAPTER 9
SEO AMSTERDAM ECONOMICS
Results by country In the ‘Tax Removal’ scenario, the total benefits in the sub-region are highest for Mexico ($ 602 million). 14.8 million departing passengers per year benefit from a removal of aviation taxes. In addition, lower airfares and increased connectivity lead to a 9 percent market stimulation. This leads to a total benefit of $ 39 per passenger. In the ‘Tax Removal’ scenario, the highest per passenger benefits are found in Honduras ($ 113 per passenger). Total benefits are highest in Mexico because its aviation market is much larger compared to other countries in the sub-region. If, in addition to a tax removal, charges were reduced as well, total benefits for Mexico increase to $ 1.2 billion. Mexico accounts for 76 percent of the total benefits in the sub-region. As Mexican airports have a relatively high level of passenger based charges, consumer benefits are almost twice as high in the second scenario. However, per passenger benefits are not highest in Mexico. The highest per passenger benefits in the ‘Tax Removal and Charges Reduction’ scenario are realized in Nicaragua ($ 129), El Salvador ($ 117) and Honduras ($ 114). In Nicaragua and Honduras a 15 percent sales or transportation tax is levied, El Salvador charges a 13 percent VAT on international air tickets. In addition, relatively high charges, ranging between $ 42 per return trip (Nicaragua) and $ 7.50 per return trip are in place. These are reduced to $6.28 in the ‘Tax Removal and Charges Reduction’ scenario.
Figure 9.1 The largest share of consumer benefits in Central America and Mexico is expected for Mexico
0
20
40
60
80
100
120
0 50 100
BelizeMexico
Costa RicaNicaragua
PanamaEl SalvadorGuatemala
Honduras
0 500 1000
USD
per
resid
entia
l pas
seng
er
USD per residential passenger Mln USD
Tax RemovalTax Removal & Charges Reduction
Source: SEO NetCost
Total benefits A total benefit (consumer benefits and wider economic benefits) of $ 1.2 billion is estimated in the ‘Tax Removal’ scenario and a total benefit of $ 1.9 billion is estimated in the ‘Tax Removal and Charges Reduction’ scenario. Additional wider economic benefits arise through agglomeration/productivity effects as well as through an increase in employment. For Central America and Mexico, the agglomeration effects

ECONOMIC BENEFITS IN CENTRAL AMERICA AND MEXICO 69
SEO AMSTERDAM ECONOMICS
add up to $ 40 million in the ‘Tax Removal’ scenario and $ 60 million in the ‘Tax Removal and Charges Reduction’ scenario. Furthermore, 217 and 341 thousand jobs are created in both scenarios, leading to an additional benefit of $ 173-$ 311 million.
Table 9.3 Tax removal benefits in Central America and Mexico are estimated at $ 1.2 billion
Total benefits (mln USD) Tax Removal Tax Removal and Charges Reduction
Direct consumer benefits 947 1,535
Agglomeration/productivity 40 60
Employment effects 173 311
Total 1,160 1,906
Source: SEO
9.1.2 Consumer benefits up to 2035
‘Tax Removal’ scenario In the ‘Tax Removal’ scenario, the number of passengers residing in Central America and Mexico is expected to increase from 29 million in 2020 to 58 million in 2035. Total consumer benefits in Central America and Mexico add up to $ 1.4 billion in 2020, and accumulate to $ 2.8 billion by 2035. Per passenger benefits remain constant at $ 48 over the years, as the level of tax reduction is assumed to be identical now and in future years.
Table 9.4 In 2035, tax removal in Central America and Mexico results in total consumer benefits of $ 2.8 billion
2020 2025 2035
'Tax Removal' scenario Business Leisure Total Business Leisure Total Business Leisure Total
Total passengers residing in Centr. Am & Mex (mln) 6 23 29 8 29 37 12 46 58
Total benefits (mln USD) 397 1,005 1,402 498 1,259 1,757 781 1,971 2,752
Per passenger benefits $64 $44 $48 $64 $43 $48 $64 $43 $48
Source: SEO NetCost
‘Tax Removal and Charges Reduction’ scenario In the ‘Tax Removal and Charges Reduction’ scenario, direct consumer benefits accrue to $ 2.3 billion in 2020 and $ 4.5 billion in 2035, implying a per passenger benefit of around $ 72. The per passenger benefit in 2035 is slightly lower than in earlier years, which is caused by changes in traffic mix, between which the consumer benefits per passenger differ.
Table 9.5 Removal of taxes and reduction of charges yields direct consumer benefits of $ 4.5 billion in Central America and Mexico in 2035
2020 2025 2035
'Tax Removal and Charges Reduction’ scenario Business Leisure Total Business Leisure Total Business Leisure Total
Total passengers residing in Centr. Am & Mex (mln) 6 25 31 8 32 40 12 50 62
Total benefits (mln USD) 597 1,679 2,276 747 2,097 2,844 1,171 3,287 4,459
Per passenger benefits $95 $67 $72 $94 $66 $72 $94 $66 $72
Source: SEO NetCost

70 CHAPTER 9
SEO AMSTERDAM ECONOMICS
Total consumer and wider economic benefits The total consumer and wider economic benefits in Central America and Mexico in 2035 accumulate to $ 3.1 billion in the ‘Tax Removal’ scenario. In the ‘Tax Removal and Charges Reduction’ scenario, total benefits add up to $ 5.0 billion. The agglomeration effects increase over time as the number of business passengers increases. In the ‘Tax Removal’ scenario, these effects increase from $ 60 million in 2020 to $ 117 million in 2035 and from $ 90 million in 2020 to $ 176 million in 2035 in the ‘Tax Removal and Charges Reduction’ scenario. Benefits from additional employment are also expected to increase over time. In 2035, these impacts accrue to $ 213 million in the ‘Tax Removal’ scenario and to $ 383 million in the ‘Tax Removal and Charges Reduction’ scenario.
Table 9.6 Total consumer and wider economic benefits in Central America and Mexico range between $ 3.1 billion and $ 5.0 billion, depending on the scenario
'Tax Removal' 'Tax Removal and Charges Reduction'
Impacts (USD million, undiscounted) 2020 2025 2035 2020 2025 2035
Consumer benefits 1,402 1,757 2,752 2,276 2,844 4,459
Agglomeration/productivity 60 75 117 90 112 176
Employment effects 186 196 213 335 353 383
Total 1,647 2,028 3,082 2,701 3,309 5,017
Source: SEO NetCost
9.1.3 Cumulative impacts up to 2035
In the ‘Tax Removal’ scenario, the discounted cumulative impacts add up to $ 24 billion over the period 2014-2035. The greatest share of these impacts are generated through direct consumer benefits. Wider economic benefits through agglomeration effects sum up to $ 0.9 billion, whereas additional employment leads to a benefit of $ 2.2 billion. In the ‘Tax Removal and Charges Reduction’ scenario, the results are higher, adding up to a total benefit of $ 39 billion for the period 2014-2035.
Table 9.7 Cumulative benefits until 2035 in Central America and Mexico add up to $ 39 billion in the ‘Tax Removal and Charges Reduction’ scenario
Impacts (USD billion, discounted) 'Tax Removal' 'Tax Removal and Charges Reduction'
2014-2035 2014-2035
Consumer benefits 20.8 33.7
Agglomeration/productivity 0.9 1.3
Employment effects 2.2 4.0
Total 24 39
Source: SEO NetCost

ECONOMIC BENEFITS IN CENTRAL AMERICA AND MEXICO 71
SEO AMSTERDAM ECONOMICS
9.2 Macro-economic impacts
9.2.1 Impacts on GDP
We estimate that the ‘Tax Removal’ scenario could generate around $ 17 billion of GDP in Central America and Mexico. If passenger-based charges are reduced as well, this amount will increase to $ 29 billion.
Figure 9.2 The relative impacts of removing aviation taxes on GDP are largest in Honduras
0
2
4
6
8
10
12
14
0 10 20
BelizeNicaragua
El SalvadorHonduras
PanamaCosta Rica
GuatemalaMexico
0,0% 1,5% 3,0%
Bln
USD
Bln USD PercentTax Removal
Tax Removal & Charges Reduction
Source: SEO
In absolute terms, the GDP effects of removing aviation taxes are highest in Mexico due to the size of its economy compared to other Central American countries, with an estimated increase of $ 12 billion. However, Honduras shows the greatest benefit from tax removal in relative terms, with a GDP effect of 3.7 percent, followed by Guatemala with 3.0 percent and El Salvador with 2.3 percent. In Mexico and Belize, the countries with the lowest relative impacts, the removal of aviation taxes would still result in a GDP increase of 1 and 1.1 percent respectively (Figure 9.2). Reducing aviation charges on top of a removal of taxes is estimated to result in a significant GDP effect for some countries in the sub-region. The largest relative increase can be found in Nicaragua and Mexico, with a GDP increase of $ 378 million and $ 24 billion, respectively. Given the already low aviation charges in Guatemala, Honduras, Costa Rica and Panama, the effect of this scenario is limited for these countries (Figure 9.3).
9.2.2 Impacts on employment
Employment in Central America and Mexico could benefit significantly from a removal of aviation taxes and a reduction of charges. Within the whole sub-region, we estimate an increase of 217 thousand jobs in the ‘Tax Removal’ scenario. Similarly, the introduction of the ‘Tax Removal and Charges Reduction’ scenario could lead to an employment increase of 344 thousand jobs.

72 CHAPTER 9
SEO AMSTERDAM ECONOMICS
Figure 9.3 The ‘Tax Removal and Charges Reduction’ scenario would generate the highest increase in employment in Honduras and Nicaragua
0
20
40
60
80
100
120
0 100 200
BelizePanama
Costa RicaNicaragua
El SalvadorHonduras
GuatemalaMexico
0,0% 0,2% 0,4% 0,6% 0,8%
Thou
sand
s jo
bs
Thousand jobs PercentTax Removal
Tax Removal & Charges Reduction
Source: SEO
The absolute effect of the ‘Tax Removal’ scenario is largest in Mexico, with a net increase of over 110 thousands jobs, which is equivalent to a 0.2 percent increase. Mexico is followed by Guatemala and Honduras, where the increase in jobs results in 41 thousand and 25 thousand, respectively. In relative terms, these two countries show the largest employment effect with 0.8 and 0.6 percent growth, respectively. The implementation of the ‘Tax Removal and Charges Reduction’ scenario would result in higher employment effects in all countries except Guatemala, Honduras, Costa Rica and Panama. Due to the high aviation charges levied in Nicaragua, the employment effect almost doubles in this scenario to 19 thousand extra jobs. Mexico and El Salvador could benefit from a significant amount of additional employment by lowering their aviation charges, with 226 thousand and 16 thousand jobs, respectively (Figure 9.3).
9.2.3 Impacts on tourism
In our model, the reduction of airplane tickets would have significant positive effects of tourism for Central American countries and Mexico. We estimate an effect of more than 800 thousand tourist for the region in the ‘Tax Removal’ scenario, a number which rises to almost 1.3 million in the ‘Tax Removal and Charges Reduction’ scenario. Figure 9.4 shows the predicted effects on tourism for each individual country.

ECONOMIC BENEFITS IN CENTRAL AMERICA AND MEXICO 73
SEO AMSTERDAM ECONOMICS
Figure 9.4 Honduras and Guatemala would experience the highest relative increase in tourism
0
100
200
300
400
Thou
sand
tour
ists
0 250 500 750
BelizeNicaragua
El SalvadorHonduras
PanamaCosta Rica
GuatemalaMexico
0% 2% 4% 6%Thousand tourists Percent
Tax RemovalTax Removal & Charges Reduction
Source: SEO
As can be seen (figure 9.4), all countries show a relative increase close to or above 2 percent in the ‘Tax Removal’ scenario. We predict the highest relative growth for Honduras and Guatemala, with an increase of 6.2 and 5 percent or 54 thousand and 100 thousand tourists, respectively. If, additionally to removing aviation taxes, aviation charges are reduced as per the ‘Tax Removal and Charges Reduction’ scenario, the estimated effect on tourism for certain countries would increase further. For Mexico and Nicaragua, the effect would more than double, reaching 3.4 percent and 6 percent respectively; and, with that, the latter country’s effect comes close to that experienced in Honduras, the best performing country in the list. Further, the implementation of this second scenario would lead to higher increases in tourism in El Salvador and Belize, reaching 5 percent and 2.7 percent, respectively (figure 9.4). .


ECONOMIC BENEFITS OF REDUCING AVIATION TAXES IN LATIN AMERICA AND THE CARIBBEAN 75
SEO AMSTERDAM ECONOMICS
10 Economic benefits in the Caribbean
Tax removal in the Caribbean may generate a total discounted benefit of $ 8 billion up to 2035, which includes consumer and wider economic benefits. Tax removal can potentially deliver a GDP benefit of $ 3.2 billion and employment growth of 51 thousand jobs. If also passenger-based charges are reduced, the total discounted benefit will increase to $ 12 billion. We estimate potential GDP gains at $ 4.9 billion and employment gains at 85 thousand jobs.
10.1 Consumer benefits
10.1.1 Immediate tax removal and charges reduction
‘Tax Removal’ scenario Removal of aviation taxes in the Caribbean is estimated to result in a total consumer benefit of $ 426 million. Based on a total of 8.8 million residential passengers in the Caribbean, this implies a per passenger benefit of $ 48 per return trip. Benefits for passengers travelling for business are on average $ 60 per return trip, compared to $ 45 per trip for leisure passengers.
Table 10.1 Consumer benefits of an immediate removal of taxes accumulates to $ 426 million in the Caribbean
Business Leisure Total
‘Tax Removal’ scenario Number of passengers residing in the Caribbean (thousands) 1,926 6,951 8,877
Consumer benefits (mln USD) 116 310 426
Benefits per passenger (USD) $60 $45 $48
Source: SEO NetCost
‘Tax Removal and Charges Reduction’ scenario If, in addition, passenger-based charges were reduced, direct consumer benefits accrue to $ 624 million. This leads to an increase of $ 19 to the per passenger benefit with respect to the first scenario. Per passenger benefits are on average $ 83 for passengers travelling for business and $ 63 for leisure passengers.
Table 10.2 An immediate removal of taxes and reduction of charges leads to a consumer benefit of $ 624 million in the Caribbean
Business Leisure Total
‘Tax Removal and charges reduction’ scenario
Number of passengers residing in the Caribbean (thousands) 1,946 7,348 9,295
Consumer benefits (mln USD) 162 462 624
Benefits per passenger (USD) $83 $63 $67
Source: SEO NetCost
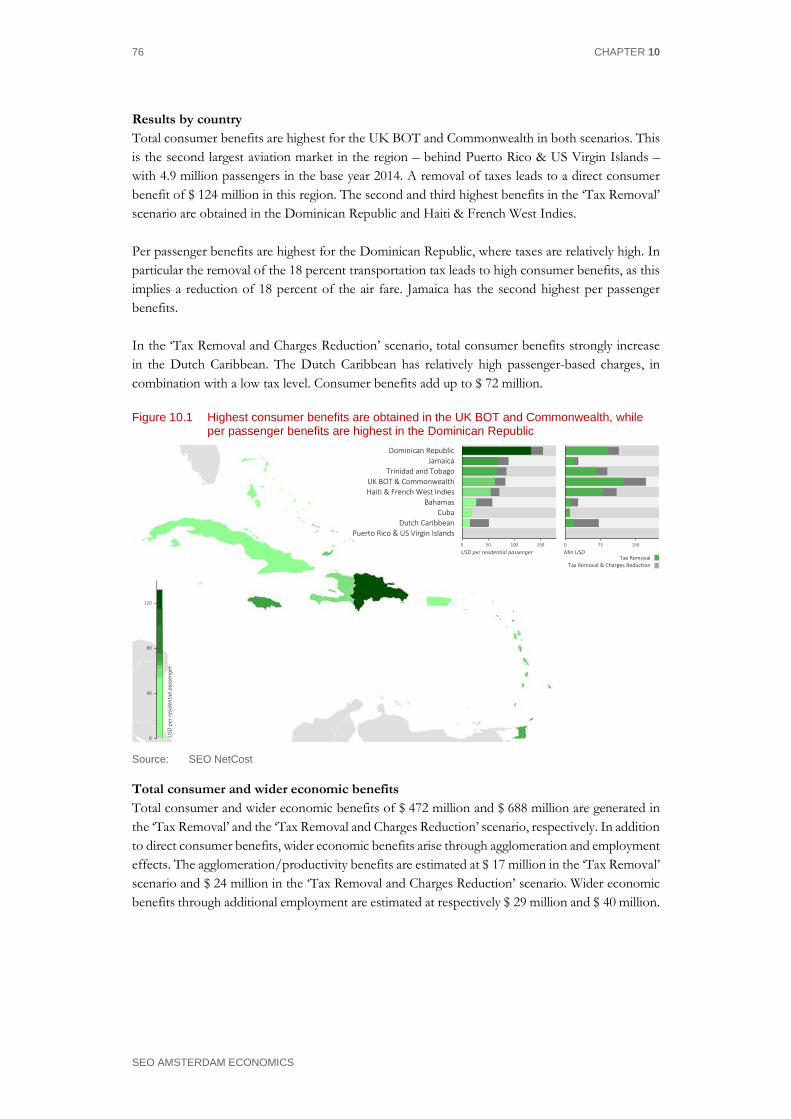
76 CHAPTER 10
SEO AMSTERDAM ECONOMICS
Results by country Total consumer benefits are highest for the UK BOT and Commonwealth in both scenarios. This is the second largest aviation market in the region – behind Puerto Rico & US Virgin Islands – with 4.9 million passengers in the base year 2014. A removal of taxes leads to a direct consumer benefit of $ 124 million in this region. The second and third highest benefits in the ‘Tax Removal’ scenario are obtained in the Dominican Republic and Haiti & French West Indies. Per passenger benefits are highest for the Dominican Republic, where taxes are relatively high. In particular the removal of the 18 percent transportation tax leads to high consumer benefits, as this implies a reduction of 18 percent of the air fare. Jamaica has the second highest per passenger benefits. In the ‘Tax Removal and Charges Reduction’ scenario, total consumer benefits strongly increase in the Dutch Caribbean. The Dutch Caribbean has relatively high passenger-based charges, in combination with a low tax level. Consumer benefits add up to $ 72 million.
Figure 10.1 Highest consumer benefits are obtained in the UK BOT and Commonwealth, while per passenger benefits are highest in the Dominican Republic
0
40
80
120
USD
per
resid
entia
l pas
seng
er
0 50 100 150
Puerto Rico & US Virgin IslandsDutch Caribbean
CubaBahamas
Haiti & French West IndiesUK BOT & Commonwealth
Trinidad and TobagoJamaica
Dominican Republic
0 75 150
USD per residential passenger Mln USDTax Removal
Tax Removal & Charges Reduction
Source: SEO NetCost
Total consumer and wider economic benefits Total consumer and wider economic benefits of $ 472 million and $ 688 million are generated in the ‘Tax Removal’ and the ‘Tax Removal and Charges Reduction’ scenario, respectively. In addition to direct consumer benefits, wider economic benefits arise through agglomeration and employment effects. The agglomeration/productivity benefits are estimated at $ 17 million in the ‘Tax Removal’ scenario and $ 24 million in the ‘Tax Removal and Charges Reduction’ scenario. Wider economic benefits through additional employment are estimated at respectively $ 29 million and $ 40 million.
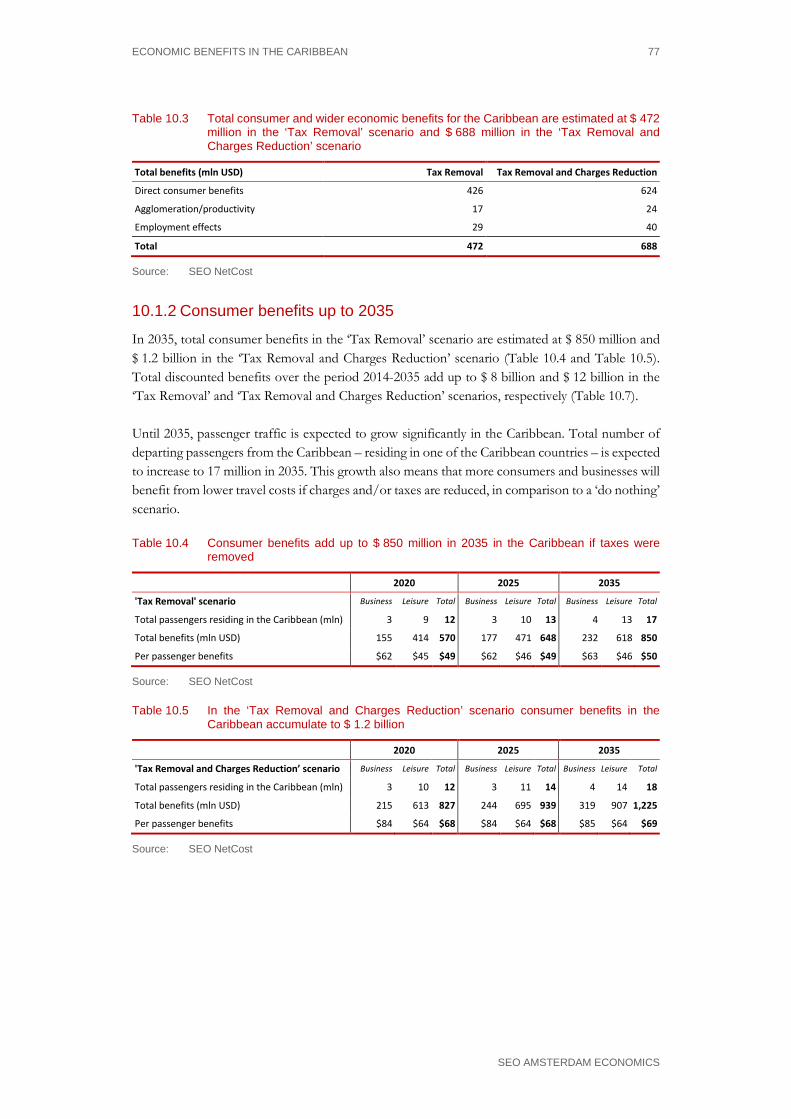
ECONOMIC BENEFITS IN THE CARIBBEAN 77
SEO AMSTERDAM ECONOMICS
Table 10.3 Total consumer and wider economic benefits for the Caribbean are estimated at $ 472 million in the ‘Tax Removal’ scenario and $ 688 million in the ‘Tax Removal and Charges Reduction’ scenario
Total benefits (mln USD) Tax Removal Tax Removal and Charges Reduction
Direct consumer benefits 426 624
Agglomeration/productivity 17 24
Employment effects 29 40
Total 472 688
Source: SEO NetCost
10.1.2 Consumer benefits up to 2035
In 2035, total consumer benefits in the ‘Tax Removal’ scenario are estimated at $ 850 million and $ 1.2 billion in the ‘Tax Removal and Charges Reduction’ scenario (Table 10.4 and Table 10.5). Total discounted benefits over the period 2014-2035 add up to $ 8 billion and $ 12 billion in the ‘Tax Removal’ and ‘Tax Removal and Charges Reduction’ scenarios, respectively (Table 10.7). Until 2035, passenger traffic is expected to grow significantly in the Caribbean. Total number of departing passengers from the Caribbean – residing in one of the Caribbean countries – is expected to increase to 17 million in 2035. This growth also means that more consumers and businesses will benefit from lower travel costs if charges and/or taxes are reduced, in comparison to a ‘do nothing’ scenario.
Table 10.4 Consumer benefits add up to $ 850 million in 2035 in the Caribbean if taxes were removed
2020 2025 2035
'Tax Removal' scenario Business Leisure Total Business Leisure Total Business Leisure Total
Total passengers residing in the Caribbean (mln) 3 9 12 3 10 13 4 13 17
Total benefits (mln USD) 155 414 570 177 471 648 232 618 850
Per passenger benefits $62 $45 $49 $62 $46 $49 $63 $46 $50
Source: SEO NetCost
Table 10.5 In the ‘Tax Removal and Charges Reduction’ scenario consumer benefits in the Caribbean accumulate to $ 1.2 billion
2020 2025 2035
'Tax Removal and Charges Reduction’ scenario Business Leisure Total Business Leisure Total Business Leisure Total
Total passengers residing in the Caribbean (mln) 3 10 12 3 11 14 4 14 18
Total benefits (mln USD) 215 613 827 244 695 939 319 907 1,225
Per passenger benefits $84 $64 $68 $84 $64 $68 $85 $64 $69
Source: SEO NetCost

78 CHAPTER 10
SEO AMSTERDAM ECONOMICS
Table 10.6 Agglomeration/productivity and employment benefits result in an additional 8 percent of benefits, on top of consumer benefits, in the ‘Tax Removal’ scenario
'Tax Removal' 'Tax and Charges Removal'
Impacts (USD million, undiscounted) 2020 2025 2035 2020 2025 2035
Consumer benefits 570 648 850 827 939 1,225
Agglomeration/productivity 23 27 35 32 37 48
Employment effects 30 31 32 42 44 46
Total 623 705 917 901 1,019 1,318
Source: SEO NetCost
Table 10.7 Cumulative, discounted benefits in the ‘Tax Removal’ scenario add up to $ 8 billion over the period 2014-2035
Impacts (USD billion, discounted) 'Tax Removal' 'Tax Removal and Charges Reduction'
2014-2035 2014-2035
Consumer benefits 7.5 10.8
Agglomeration/productivity 0.3 0.4
Employment effects 0.3 0.5
Total 8 12
Source : SEO NetCost
There are substantial differences in benefits between the individual countries in the Caribbean. The differences between the countries depend mainly on the future sizes of the aviation markets of the individual countries as well as their taxes and charges regimes. The differences between the various countries in 2035 are in line with those for the immediate consumer welfare benefits (section 10.1.1) and have been reported in detail in Appendix H.
10.2 Macro-economic impacts
10.2.1 Impacts on GDP
Using the results from the panel data analysis (see Chapter 8), we have estimated the GDP and employment impacts for the different economies in the Caribbean. We estimate the total, immediate GDP increase in South America in the ‘Tax Removal’ scenario, using 2012 GDP figures, at $ 3.2 billion, in comparison to the baseline. This represents a 1.6 percent GDP increase. This number rises to $ 4.7 billion and 2.3 percent in the ‘Tax Removal and Charges Reduction’ scenario (Appendix I). Removal of aviation taxes and passenger-based charges results in a stronger increase in passenger demand for the Caribbean, in comparison to the baseline. This is partly the result of lower airfares, which are passed through to the passengers, and partly due to rising connectivity levels, which bring down the time travel costs for passengers and again stimulate demand.

ECONOMIC BENEFITS IN THE CARIBBEAN 79
SEO AMSTERDAM ECONOMICS
Figure 10.2 Relative GDP increase in the ‘Tax Removal’ scenario highest in Dominican Republic, Trinidad and Tobago and Jamaica
0
0,4
0,8
1,2
1,6
2
Bln
USD
0 1 2 3
Puerto Rico & US Virgin IslandsDutch Caribbean
BahamasHaiti & French West IndiesUK BOT & Commonwealth
CubaJamaica
Trinidad and TobagoDominican Republic
0,0% 2,0% 4,0%
Bln USD Percent Tax RemovalTax Removal & Charges Reduction
Source: SEO
As Figure 10.2 shows, largest absolute GDP impacts are estimated for the Dominican Republic, Trinidad and Tobago and Jamaica in the ‘Tax Removal’ scenario. In the ‘Tax Removal and Charges Reduction’ scenario, the same three countries gain most GDP in absolute terms. In relative terms, also Haiti & French West Indies, Dutch Caribbean and the Bahamas will potentially benefit from strong relative GDP growth. Impacts in Puerto Rico & US Virgin Islands are very limited in both scenarios. These countries currently have a very low level of taxes and charges.
10.2.2 Impacts on employment
In terms of employment impacts, we estimate the potential job impact of a removal of taxes in the Caribbean at 51 thousand jobs in the ‘Tax Removal’ scenario and 82 thousand jobs in the ‘Tax Removal and Charges Reduction’ scenario (Appendix I).

80 CHAPTER 10
SEO AMSTERDAM ECONOMICS
Figure 10.3 Dominican Republic, Haiti & French West Indies, and Jamaica benefit most from employment in growth in absolute terms if taxes are removed
0
5
10
15
20
25
30
Thou
sand
s jo
bs
0 10 20 30
Puerto Rico & US Virgin IslandsDutch Caribbean
BahamasUK BOT & Commonwealth
Trinidad and TobagoCuba
JamaicaHaiti & French West Indies
Dominican Republic
0,0% 0,2% 0,4% 0,6% 0,8%Thousand jobs Percent
Tax RemovalTax Removal & Charges Reduction
Source: SEO
There are substantial differences between the various economies. Differences are rather similar to those concerning the GDP impacts. We estimate the potential employment growth to be largest in absolute terms in the Dominican Republic, Haiti & French West Indies and Jamaica in both scenarios. When taxes are removed, in relative terms growth rates are also substantial in Trinidad and Tobago, UK BOT and Commonwealth and the Dutch Caribbean.
10.2.3 Impacts on tourism
In the Caribbean, the ‘Tax Removal’ scenario is estimated to have a significant positive effect on tourism, resulting in 675 thousand extra tourist for the whole region. If, additionally, charges are reduced in accordance with the ‘Tax Removal and Charges Reduction’ scenario, our estimation increases to almost 1.3 million additional tourists. Figure 10.4 displays the effects of both scenarios on tourism for each individual country or group of countries in the region. In absolute terms, we expect the increase in the amount of tourist due to the removal of aviation taxes to be highest in the Dominican Republic with almost 260 thousand, followed by Jamaica with 124 thousand (figure 10.4). This is also the case in relative terms, with a 5.1 and 3.8 percent increase, respectively. For both the UK BOT & Commonwealth and the Bahamas we estimate an increase of more than 80 thousand tourists, or 1.8 and 1.3 percent, respectively. Also, tourism numbers in Trinidad and Tobago, Haiti & the French West Indies and the Dutch Caribbean are expected increase significantly in the ‘Tax Removal’ scenario with 2.9 percent, 2.4 percent and 1.6 percent, respectively. In Cuba, where aviation taxes are comparatively low, and in Puerto Rico & the US Virgin Islands where none are levied at all the effects are expected to be small or negligible.

ECONOMIC BENEFITS IN THE CARIBBEAN 81
SEO AMSTERDAM ECONOMICS
Figure 10.4 The impact on tourism is by far the highest in the Dominican Republic
0
50
100
150
200
250
300
Thou
sand
tour
ists
0 125 250 375
Puerto Rico & US Virgin IslandsTrinidad and Tobago
CubaDutch Caribbean
Haiti & French West IndiesBahamas
UK BOT & CommonwealthJamaica
Dominican Republic
0% 3% 6%
Thousand tourists Percent Tax RemovalTax Removal & Charges Reduction
Source: SEO
With the exception of Cuba and Puerto Rico & the US Virgin Islands the expected effects increase further in the ‘Tax Removal and Charges Reduction’ scenario (figure 10.4). In Haiti & the French West Indies, the Dutch Caribbean and the Bahamas this increment is the largest, all increasing with more that 3 percent with respect to the estimated results in the previous scenario.

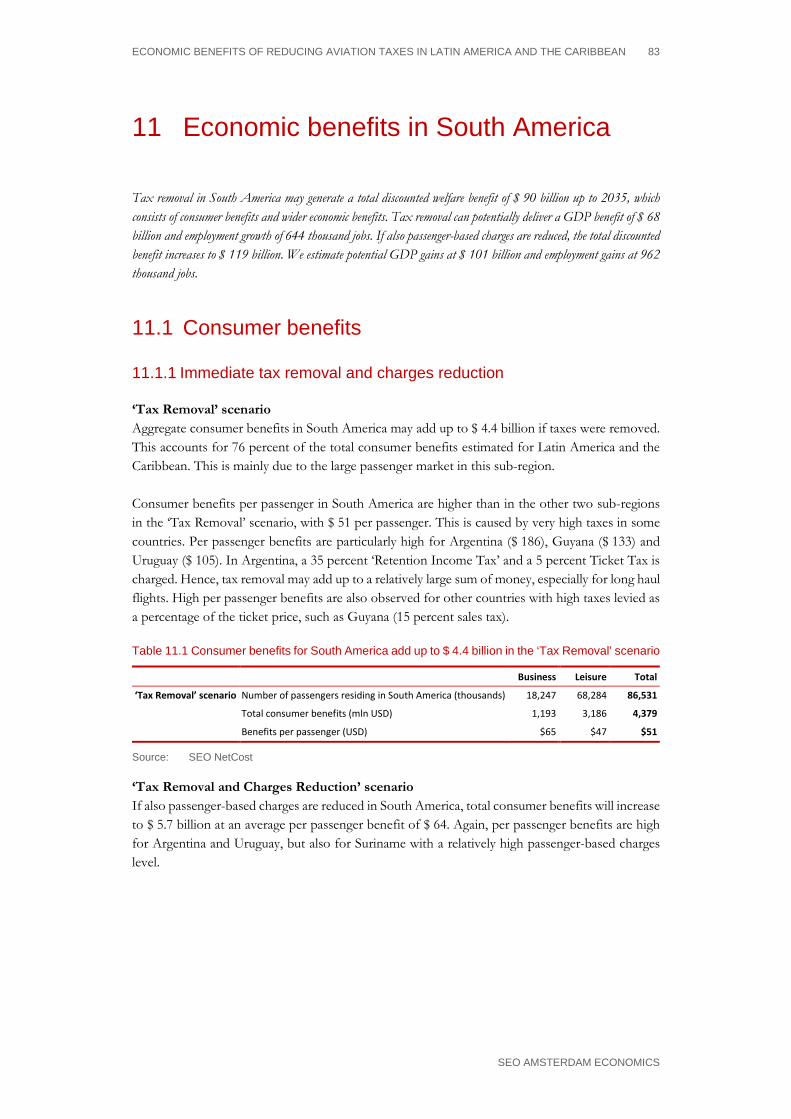
ECONOMIC BENEFITS OF REDUCING AVIATION TAXES IN LATIN AMERICA AND THE CARIBBEAN 83
SEO AMSTERDAM ECONOMICS
11 Economic benefits in South America
Tax removal in South America may generate a total discounted welfare benefit of $ 90 billion up to 2035, which consists of consumer benefits and wider economic benefits. Tax removal can potentially deliver a GDP benefit of $ 68 billion and employment growth of 644 thousand jobs. If also passenger-based charges are reduced, the total discounted benefit increases to $ 119 billion. We estimate potential GDP gains at $ 101 billion and employment gains at 962 thousand jobs.
11.1 Consumer benefits
11.1.1 Immediate tax removal and charges reduction
‘Tax Removal’ scenario Aggregate consumer benefits in South America may add up to $ 4.4 billion if taxes were removed. This accounts for 76 percent of the total consumer benefits estimated for Latin America and the Caribbean. This is mainly due to the large passenger market in this sub-region. Consumer benefits per passenger in South America are higher than in the other two sub-regions in the ‘Tax Removal’ scenario, with $ 51 per passenger. This is caused by very high taxes in some countries. Per passenger benefits are particularly high for Argentina ($ 186), Guyana ($ 133) and Uruguay ($ 105). In Argentina, a 35 percent ‘Retention Income Tax’ and a 5 percent Ticket Tax is charged. Hence, tax removal may add up to a relatively large sum of money, especially for long haul flights. High per passenger benefits are also observed for other countries with high taxes levied as a percentage of the ticket price, such as Guyana (15 percent sales tax).
Table 11.1 Consumer benefits for South America add up to $ 4.4 billion in the ‘Tax Removal’ scenario
Business Leisure Total
‘Tax Removal’ scenario Number of passengers residing in South America (thousands) 18,247 68,284 86,531
Total consumer benefits (mln USD) 1,193 3,186 4,379
Benefits per passenger (USD) $65 $47 $51
Source: SEO NetCost
‘Tax Removal and Charges Reduction’ scenario If also passenger-based charges are reduced in South America, total consumer benefits will increase to $ 5.7 billion at an average per passenger benefit of $ 64. Again, per passenger benefits are high for Argentina and Uruguay, but also for Suriname with a relatively high passenger-based charges level.
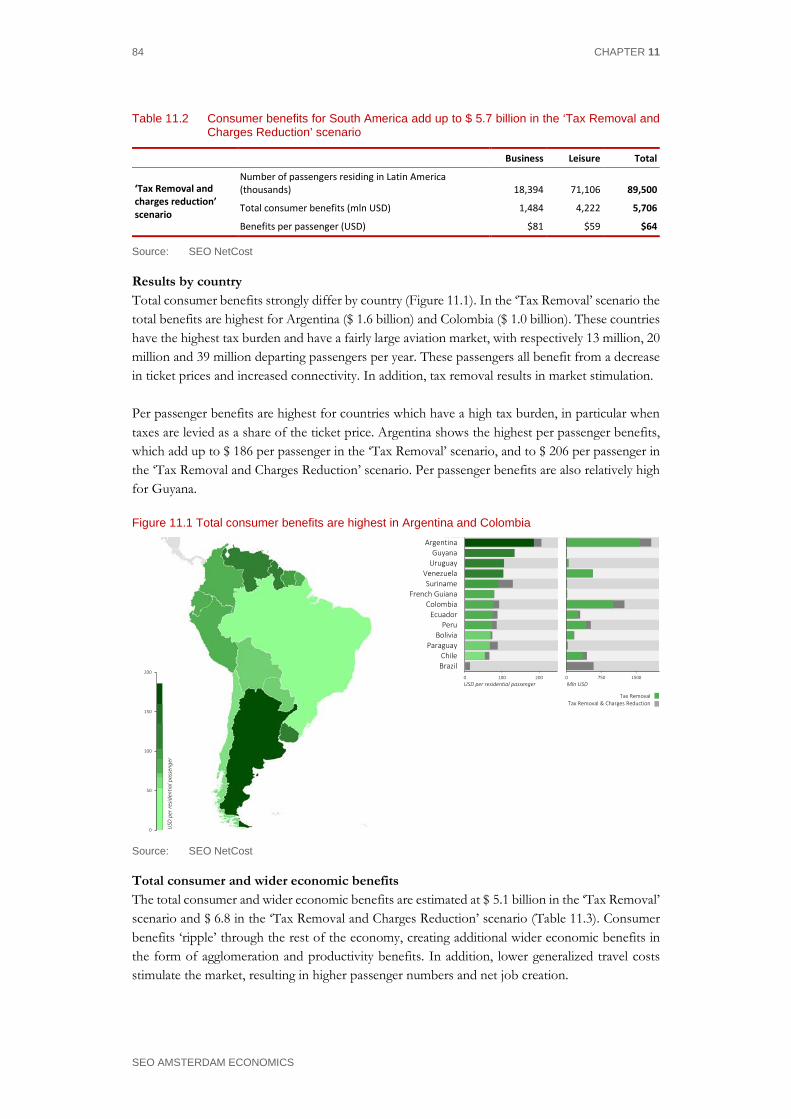
84 CHAPTER 11
SEO AMSTERDAM ECONOMICS
Table 11.2 Consumer benefits for South America add up to $ 5.7 billion in the ‘Tax Removal and Charges Reduction’ scenario
Business Leisure Total
‘Tax Removal and charges reduction’ scenario
Number of passengers residing in Latin America (thousands) 18,394 71,106 89,500
Total consumer benefits (mln USD) 1,484 4,222 5,706
Benefits per passenger (USD) $81 $59 $64
Source: SEO NetCost
Results by country Total consumer benefits strongly differ by country (Figure 11.1). In the ‘Tax Removal’ scenario the total benefits are highest for Argentina ($ 1.6 billion) and Colombia ($ 1.0 billion). These countries have the highest tax burden and have a fairly large aviation market, with respectively 13 million, 20 million and 39 million departing passengers per year. These passengers all benefit from a decrease in ticket prices and increased connectivity. In addition, tax removal results in market stimulation. Per passenger benefits are highest for countries which have a high tax burden, in particular when taxes are levied as a share of the ticket price. Argentina shows the highest per passenger benefits, which add up to $ 186 per passenger in the ‘Tax Removal’ scenario, and to $ 206 per passenger in the ‘Tax Removal and Charges Reduction’ scenario. Per passenger benefits are also relatively high for Guyana.
Figure 11.1 Total consumer benefits are highest in Argentina and Colombia
0
50
100
150
200
USD
per
resid
entia
l pas
seng
er
0 100 200
BrazilChile
ParaguayBolivia
PeruEcuador
ColombiaFrench Guiana
SurinameVenezuela
UruguayGuyana
Argentina
0 750 1500USD per residential passenger Mln USD
Tax RemovalTax Removal & Charges Reduction
Source: SEO NetCost
Total consumer and wider economic benefits The total consumer and wider economic benefits are estimated at $ 5.1 billion in the ‘Tax Removal’ scenario and $ 6.8 in the ‘Tax Removal and Charges Reduction’ scenario (Table 11.3). Consumer benefits ‘ripple’ through the rest of the economy, creating additional wider economic benefits in the form of agglomeration and productivity benefits. In addition, lower generalized travel costs stimulate the market, resulting in higher passenger numbers and net job creation.

ECONOMIC BENEFITS IN SOUTH AMERICA 85
SEO AMSTERDAM ECONOMICS
Table 11.3 Total consumer and wider economic benefits for South America are estimated at $ 5.1 billion in the ‘Tax Removal’ scenario and $ 6.8 billion in the ‘Tax Removal and Charges Reduction’ scenario
Total benefits (mln USD) Tax Removal Tax Removal and Charges Reduction
Direct consumer benefits 4,379 5,706
Agglomeration/productivity 179 223
Employment effects 568 890
Total 5,126 6,819
Source: SEO NetCost
11.1.2 Consumer benefits up to 2035
For 2035, total consumer benefits in the ‘Tax Removal’ scenario are estimated at $ 9.9 billion and $ 12.9 billion in the ‘Tax Removal and Charges Reduction’ scenario (Table 11.4 and Table 11.5). Total discounted benefits over the period 2014-2035 add up to $ 90 billion and $ 119 billion in the ‘Tax Removal’ and ‘Tax Removal and Charges Reduction’ scenarios respectively (Table 11.7). Until 2035, passenger traffic is expected to grow significantly in South America. The total number of departing passengers from South America – residing in one of the South American countries – is expected to increase to 202 million in 2035 in the ‘Tax Removal’ scenario. This growth also means that more consumers and businesses will benefit from lower travel costs if charges and/or taxes are reduced, in comparison to a ‘do nothing’ scenario (‘Baseline’).
Table 11.4 Consumer benefits accumulate to almost $ 10 billion in 2035 in the ‘Tax Removal’ scenario
2020 2025 2035
'Tax Removal' scenario Business Leisure Total Business Leisure Total Business Leisure Total
Total passengers residing in South America (mln) 24 89 113 30 111 141 43 160 202
Total benefits (mln USD) 1,542 4,105 5,647 1,872 4,981 6,853 2,710 7,181 9,892
Per passenger benefits $65 $46 $50 $63 $45 $49 $64 $45 $49
Source: SEO NetCost
Table 11.5 Consumer benefits increase to $ 13 billion in 2035 in the ‘Tax Removal and Charges Reduction’ scenario
2020 2025 2035
'Tax Removal and Charges Reduction’ scenario Business Leisure Total Business Leisure Total Business Leisure Total
Total passengers residing in South America (mln) 24 93 117 30 116 146 43 166 209
Total benefits (mln USD) 1,917 5,437 7,354 2,333 6,609 8,942 3,363 9,491 12,854
Per passenger benefits $80 $59 $63 $78 $57 $61 $78 $57 $61
Source: SEO NetCost
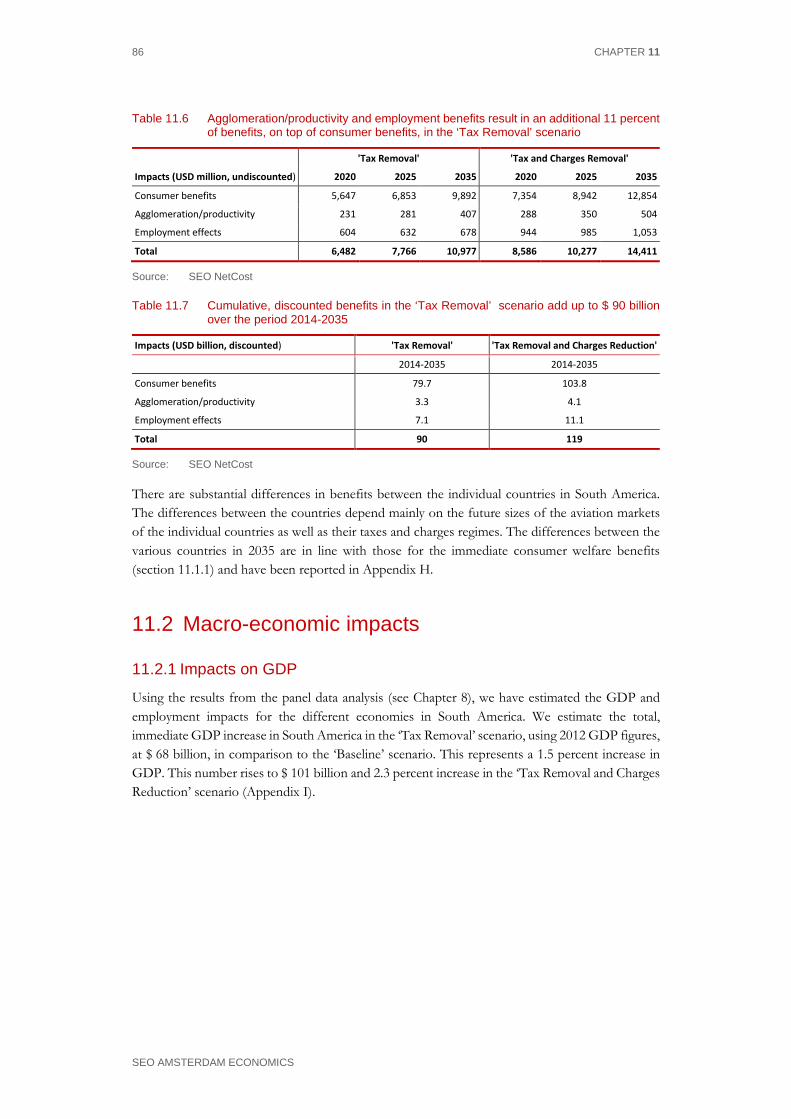
86 CHAPTER 11
SEO AMSTERDAM ECONOMICS
Table 11.6 Agglomeration/productivity and employment benefits result in an additional 11 percent of benefits, on top of consumer benefits, in the ‘Tax Removal’ scenario
'Tax Removal' 'Tax and Charges Removal'
Impacts (USD million, undiscounted) 2020 2025 2035 2020 2025 2035
Consumer benefits 5,647 6,853 9,892 7,354 8,942 12,854
Agglomeration/productivity 231 281 407 288 350 504
Employment effects 604 632 678 944 985 1,053
Total 6,482 7,766 10,977 8,586 10,277 14,411
Source: SEO NetCost
Table 11.7 Cumulative, discounted benefits in the ‘Tax Removal’ scenario add up to $ 90 billion over the period 2014-2035
Impacts (USD billion, discounted) 'Tax Removal' 'Tax Removal and Charges Reduction'
2014-2035 2014-2035
Consumer benefits 79.7 103.8
Agglomeration/productivity 3.3 4.1
Employment effects 7.1 11.1
Total 90 119
Source: SEO NetCost
There are substantial differences in benefits between the individual countries in South America. The differences between the countries depend mainly on the future sizes of the aviation markets of the individual countries as well as their taxes and charges regimes. The differences between the various countries in 2035 are in line with those for the immediate consumer welfare benefits (section 11.1.1) and have been reported in Appendix H.
11.2 Macro-economic impacts
11.2.1 Impacts on GDP
Using the results from the panel data analysis (see Chapter 8), we have estimated the GDP and employment impacts for the different economies in South America. We estimate the total, immediate GDP increase in South America in the ‘Tax Removal’ scenario, using 2012 GDP figures, at $ 68 billion, in comparison to the ‘Baseline’ scenario. This represents a 1.5 percent increase in GDP. This number rises to $ 101 billion and 2.3 percent increase in the ‘Tax Removal and Charges Reduction’ scenario (Appendix I).

ECONOMIC BENEFITS IN SOUTH AMERICA 87
SEO AMSTERDAM ECONOMICS
Figure 11.2 Relative GDP increase in the ‘Tax Removal’ scenario highest in Argentina, Bolivia and Colombia
0
10
20
30
Bln
USD
0 15 30 45
BrazilChile
French GuianaGuyana
SurinameParaguay
BoliviaUruguayEcuador
PeruVenezuelaColombiaArgentina
0,0% 2,5% 5,0% 7,5%Bln USD Percent
Tax RemovalTax Removal & Charges Reduction
Source: SEO
As Figure 11.2 shows, largest absolute GDP impacts are estimated for Argentina, Colombia and Venezuela in the ‘Tax Removal’ scenario, while in relative terms, also Bolivia, Ecuador, Uruguay and Guyana benefit substantially. In the ‘Tax Removal and Charges Reduction’ scenario, Argentina, Colombia and Venezuela gain most in terms of GDP. In relative terms, also Peru, Ecuador, Bolivia, Paraguay and Suriname may potentially benefit from strong relative GDP growth. Impacts in Chile and Brazil are very limited in the ‘Tax Reduction’ scenario. For Brazil, this is related to the absence of taxes. Therefore, only effects are observed when charges are reduced. Chile only has domestic taxes and very low passenger based charges, resulting in very limited impacts.
11.2.2 Impacts on employment
In terms of employment impacts, we estimate the potential, immediate job contribution of a removal of taxes in South America at 644 thousand jobs in the ‘Tax Removal’ scenario and 962 thousand jobs in the ‘Tax Removal and Charges Reduction’ scenario (Appendix I). As the South American economies have high structural unemployment, a large informal sector, relatively low labour productivity and a –on average- low penetration of aviation in the economy, the per passenger job effects are higher than would be the case in Europe or North America. Hence, aviation growth may provide a strong opportunity for job growth in the South American economies. There are again substantial differences between the various economies. Differences are rather similar to those concerning the GDP impacts. We estimate the potential employment growth to be largest in absolute terms in Argentina, Colombia, Peru and Venezuela in both scenarios. When taxes are removed, in relative terms growth rates are also substantial in Bolivia, Ecuador, Uruguay and Guyana. In the ‘Tax Removal and Charges Reduction’ scenario, also Suriname shows high relative growth rates.
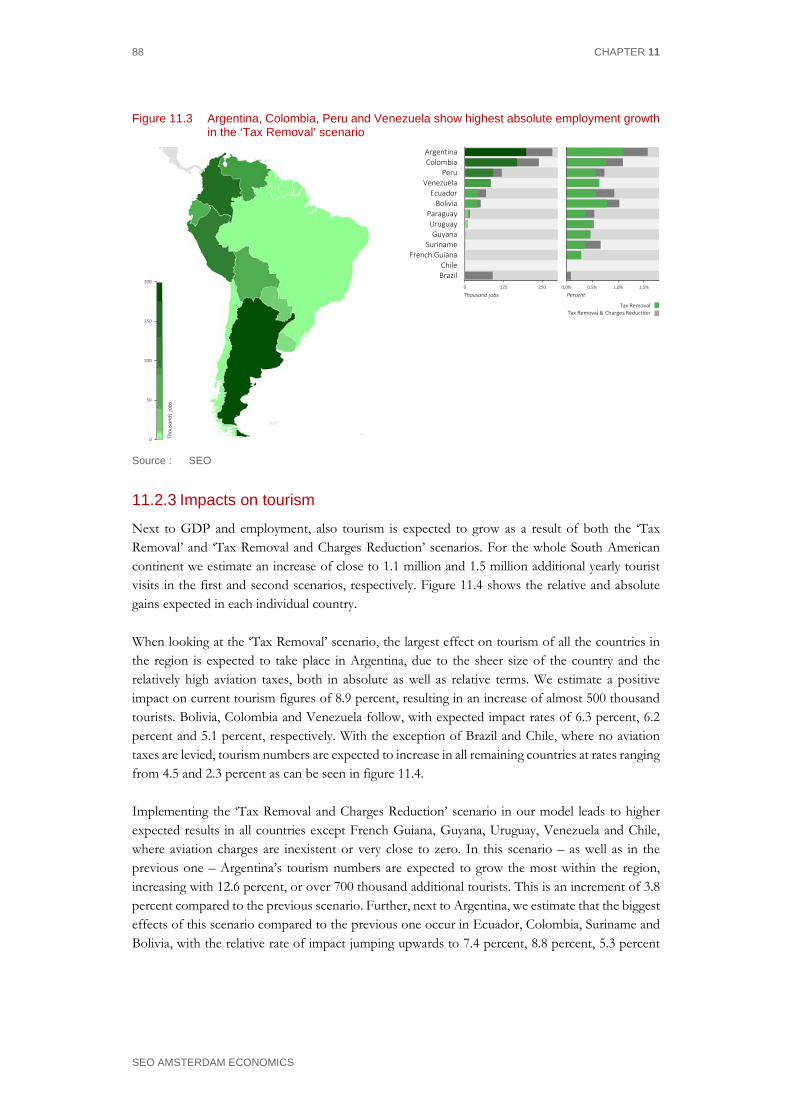
88 CHAPTER 11
SEO AMSTERDAM ECONOMICS
Figure 11.3 Argentina, Colombia, Peru and Venezuela show highest absolute employment growth in the ‘Tax Removal’ scenario
0
50
100
150
200
Thou
sand
s jo
bs
0 125 250
BrazilChile
French GuianaSuriname
GuyanaUruguay
ParaguayBolivia
EcuadorVenezuela
PeruColombiaArgentina
0,0% 0,5% 1,0% 1,5%
Thousand jobs Percent
Tax RemovalTax Removal & Charges Reduction
Source : SEO
11.2.3 Impacts on tourism
Next to GDP and employment, also tourism is expected to grow as a result of both the ‘Tax Removal’ and ‘Tax Removal and Charges Reduction’ scenarios. For the whole South American continent we estimate an increase of close to 1.1 million and 1.5 million additional yearly tourist visits in the first and second scenarios, respectively. Figure 11.4 shows the relative and absolute gains expected in each individual country. When looking at the ‘Tax Removal’ scenario, the largest effect on tourism of all the countries in the region is expected to take place in Argentina, due to the sheer size of the country and the relatively high aviation taxes, both in absolute as well as relative terms. We estimate a positive impact on current tourism figures of 8.9 percent, resulting in an increase of almost 500 thousand tourists. Bolivia, Colombia and Venezuela follow, with expected impact rates of 6.3 percent, 6.2 percent and 5.1 percent, respectively. With the exception of Brazil and Chile, where no aviation taxes are levied, tourism numbers are expected to increase in all remaining countries at rates ranging from 4.5 and 2.3 percent as can be seen in figure 11.4. Implementing the ‘Tax Removal and Charges Reduction’ scenario in our model leads to higher expected results in all countries except French Guiana, Guyana, Uruguay, Venezuela and Chile, where aviation charges are inexistent or very close to zero. In this scenario – as well as in the previous one – Argentina’s tourism numbers are expected to grow the most within the region, increasing with 12.6 percent, or over 700 thousand additional tourists. This is an increment of 3.8 percent compared to the previous scenario. Further, next to Argentina, we estimate that the biggest effects of this scenario compared to the previous one occur in Ecuador, Colombia, Suriname and Bolivia, with the relative rate of impact jumping upwards to 7.4 percent, 8.8 percent, 5.3 percent

ECONOMIC BENEFITS IN SOUTH AMERICA 89
SEO AMSTERDAM ECONOMICS
and 8.2 percent, respectively. Finally, tourism figures in Paraguay and Peru are expected to increase with 1.4 percent each compared to the ‘Tax Removal’ scenario (figure 11.4).
Figure 11.4 Relative increase in tourism highest in Argentina, Colombia, Bolivia and Venezuela in the ‘Tax Removal’ scenario
0
100
200
300
400
500
Thou
sand
tou
rists
0 250 500 750
BrazilChile
French GuianaSuriname
GuyanaParaguay
VenezuelaBolivia
EcuadorColombiaUruguay
PeruArgentina
0% 5% 10%Thousand tourists Percent
Tax RemovalTax Removal & Charges Reduction
Source : SEO


ECONOMIC BENEFITS OF REDUCING AVIATION TAXES IN LATIN AMERICA AND THE CARIBBEAN 91
SEO AMSTERDAM ECONOMICS
12 Conclusions
Aviation plays an important role in today’s globalized society. The connectivity by air it generates is a key element for the competitive position of countries in Latin America and the Caribbean, its regions and cities in an international context. A superior connectivity performance minimizes travel costs for passengers, businesses and shippers/ exporters. It generates agglomeration economies, stimulates productivity and tourism. Furthermore, airports and civil airspace users support many jobs in the economies of Latin America and the Caribbean. The analysis presented in this report provides evidence on the substantial economic benefits that reduction of aviation taxes can bring to the economies of Latin America and the Caribbean. The study also shows that significant potential benefits of connectivity growth will be foregone for consumers and businesses if taxes remain at their current levels. The total present value of benefits from the removal of aviation taxes in Latin America and the Caribbean was estimated at $ 122 billion up to 2035, compared to a ‘do nothing’ scenario. These include direct consumer benefits as well as wider economic benefits If also passenger-related charges are reduced, the present value will increase to $ 170 billion. The estimated benefits are driven by lower fares, increase in connectivity, shorter travel times, demand growth and wider economic benefits, including job growth and productivity benefits. The removal of aviation taxes can potentially deliver an additional GDP contribution of $ 87 billion. If charges are also reduced, this amount will increase to $ 135 billion. In the Latin American and Caribbean economies, overall penetration of air travel into society is still relatively low compared to North America and Europe. In addition, structural unemployment is high, the economy is characterized by a large share of informal jobs and high transport costs tend to be an impediment to growth. Within this context, removal of aviation taxes and a reduction in charges can be a strong stimulus to economic growth and competitiveness in today’s global society. On the other hand, if taxes remain in place as they are today, the substantial foregone economic benefits may limit the competitiveness of the Latin American and Caribbean economies, when compared to countries that see air transport as a catalyst for economic growth.


ECONOMIC BENEFITS OF REDUCING AVIATION TAXES IN LATIN AMERICA AND THE CARIBBEAN 93
SEO AMSTERDAM ECONOMICS
Literature
Allroggen, F., Wittman, M., & Malina, R. (2015). How Air Transport Connects The World: A New Metric of Air Connectivity and Its Evolution Between 1990 And 2012. MIT International Center for Air Transportation. ICAT-2015-01.
ATAG (2014). Aviation benefits beyond borders. April 2014. Bannò, M., & Redondi, R. (2014). Air connectivity and foreign direct investments: economic effects
of the introduction of new routes. European Transport Research Review, 6(4), 355-363. Baruffaldi, S. H. (2015). Three essays on the role of proximity in science and innovation (Doctoral
dissertation, École Polytechnique Fédérale de Lausanne). Bel, G., & Fageda, X. (2008). Getting there fast: globalization, intercontinental flights and
location of headquarters. Journal of Economic Geography, 8(4), 471-495. Belenkiy, M., & Riker, D. (2012). Face-to-face exports the role of business travel in trade
promotion. Journal of travel research, 51(5), 632-639. Boeing (2015). Current Market Outlook 2015-2034. Boeing Commercial Airplanes, Seattle. Burghouwt, G., de Wit, J., Veldhuis, J., & Matsumoto, H. (2009). Air network performance and
hub competitive position: Evaluation of primary airports in East and South-East Asia. Journal of Airport Management, 3(4), 384-400.
CE Delft (2008). Handbook on estimation of external costs in the transport sector. Produced
within the study Internalisation Measures and Policies for All external Cost of Transport (IMPACT). Version 1.1. Delft, February 2008.
Elhorst, J.P. and Oosterhaven, J. (2008). Integral cost-benefit analysis of Maglev projects under
market imperfections. Journal of Transport and Land Use 1(1), 65-87. HEATCO (2004). Economic values for key impacts valued in the Stated Preference surveys.
SWECO Groner – Norway. Heemskerk, L. and J. Veldhuis (2006a). Measuring Airline Network Quality: Analytical Framework.
ATRS Conference paper. Heemskerk, L. and J. Veldhuis (2006b). Measuring Airline Network Quality: Applications and
Results. ATRS Conference paper. Hovhannisyan, N., & Keller, W. (2010). International business travel: an engine of innovation?.
Journal of Economic Growth, 20(1), 75-104. IATA (2005). Aviation taxes and charges. A comparison of the level of the taxation, subsidies and
94 CHAPTER 12
SEO AMSTERDAM ECONOMICS
charges for aviation and for other transport modes in Germany, France and the United Kingdom.
IATA (2007). Aviation Economic Benefits. Report prepared by InterVISTAS Consulting Inc. IATA (2013). The economic benefits of abolish the air travel tax in Ireland. IATA Economic
Briefing June 2013. IATA (2013b). The economic impact of an international transfer passenger charge in Peru. IATA
Economic Briefing March 2013. IATA (2013c). The impact of a tax on foreign visitors to Chile. IATA Economic Briefing January
2013. IATA (2014). Impact of air travel tax on Germany economy. IATA Economic Briefing March
2014. IHS (2012). Evaluierung der Flugabgabe. Studie im Auftrag des BMF. September 2012. InterVISTAS (2015). Economic impact European airports. A critical catalyst to economic
growth. Prepared for ACI Europe, January 2015. Intraplan Consult (2012). Untersuchung zur verkehrlichen und volkswirtschaftlichen Wirkung des
Luftverkehrsteuer. Im autrag des Bundesverbands des Deutschen Luftverkehrswirtschaft. KiM (2011). Effects of the air passenger tax. Behavioral responses of passengers, airlines and
airports. KiM Netherlands Institute for Transport Policy Analysis. February 2011. Koopmans, C. and R. Lieshout (2015). Airline cost changes: to what extent are they passed through
to the passenger? Journal of Air Transport Management (53), 1-11. Lieshout, R., and Matsumoto, H. (2012). New international services and the competitiveness of
Tokyo International Airport. Journal of Transport Geography (22), 53-64. Lopez, H. (2008). The Social Discount Rate: Estimates for Nine Latin American Countries. The
World Bank. Latin America and the Caribbean Region. Mackie, P. and B. Pearce (2015). A note from Expert Advisors on key issues considering the Airports Commission Economic case. May 2015. Mott MacDonald (2006). PRISM input to Eddington study. M6 hard shoulder running test. Impact
on the economy. March 2006. Oxford Economics (2012). The economic impact of changing the Air Transport Levy in Austria. PWC (2014). Airports Commission. 2. Economy: wider impacts assessment. November 2014.
CONCLUSIONS 95
SEO AMSTERDAM ECONOMICS
PWC (2015). The economic impact of Air Passenger Duty. Analytical update. May 2015. SACTRA (1999). Transport and the economy: full report. SEO (2009a). Implicaties van de invoering van de ticket tax. Research commissioned by ANVR
and NBTC. SEO reportnr. 2009-09 (in Dutch). SEO (2009b). Benchmark for airport charges and governmental taxes. SEO reportnr. 2008-24A.
Significance /SEO Economisch Onderzoek, Augustus 2007: Effecten van verschillende heffingsvarianten op de Nederlandse luchtvaart (in Dutch).
SEO (2009c). Implications of the Irish Air Travel Tax. Study commissioned by Aer Lingus, Ryanair
and Cityjet. SEO reportnr. 2009-77. SEO & DLR (2010). Studie zur geplanten Luftverkehrsabgabe der Budnesregierung. Im auftrag
des Ministeriums für Wirtschaft, Verkehr, Landwirtschaft und Weinbau in Rheinland-Pfalz. SEO reportnr. 2010-47 (in German).
Significance & SEO (2007). Effecten van verschillende heffingsvarianten op de Nederlandse
luchtvaart. Leiden: Significance (in Dutch). Steppler (2011). German air travel tax and other duties: a new European trend? The Air & Space
Lawyer 24(1). Veldhuis, J. and Lieshout, R. (2009). Estimating the Attractiveness of Airlines and Airports on a
Route Base Level. Working Paper, SEO Economic Research. Venables, A.J. and Gasiorek, M. (1999). The welfare implications of transport investments in the
presence of market failure. Report to the standing advisory committee on trunk road assessment. Department of the Environment, Transport and the Regions: London.
Vickerman, R. (2007). Recent evolution of research into the wider economic benefits of transport
infrastructure investments. OECD/ITF Discussion paper no. 2007-9. World Tourism Organization (2015), Compendium of Tourism Statistics dataset [Electronic],
UNWTO, Madrid, data updated on 23/09/2015. Zuidberg, J. (2015). The implications of air travel taxes. Journal of Airport Management 10(1), 64-
72.


ECONOMIC BENEFITS OF REDUCING AVIATION TAXES IN LATIN AMERICA AND THE CARIBBEAN 97
SEO AMSTERDAM ECONOMICS
Appendix A Exchange rates
Table A. 1 Average exchange rates in 2014
Country Currency Exchange rate (USD / x)
Argentina ARS 0.1231
Bolivia BOB 0.1478
Brazil BRL 0.4264
French overseas departments EUR 1.3271
Chile CLP 0.0018
Colombia COP 0.0005
Venezuela VEF 0.1590
Venezuela VEB 0.0002
Guatemala GTQ 0.1316
Mexico MXN 0.0751
Bahamas BSD 1.0052
Barbados BBD 0.5000
Cayman Islands KYD 1.2216
Curacao ANG 0.5618
Haiti HTG 0.0229
Jamaica JMD 0.0091
Trinidad and Tobago TTD 0.1592
Grenada, Montserrat, Saint Lucia XCD 0.3720
Source: www.oanda.com


ECONOMIC BENEFITS OF REDUCING AVIATION TAXES IN LATIN AMERICA AND THE CARIBBEAN 99
SEO AMSTERDAM ECONOMICS
Appendix B Tax and charges burden per country
Table B. 1 Taxes, charges and average airfares per country
Domestic International
Tota
l tax
es (f
ixed
fe
es)
Tota
l tax
es (%
of
ticke
t pric
e)
Tota
l Cha
rges
Tota
l cha
rges
(%
of ti
cket
pric
e)
One
way
fare
(U
SD)
Tota
l tax
es (f
ixed
fe
es)
Tota
l tax
es (%
of
ticke
t pric
e)
Tota
l Cha
rges
Tota
l cha
rges
(%
of ti
cket
pric
e)
One
way
fare
(U
SD)
Anguilla $ - - $ - - $15.00 - $5.00 - $89
Antigua and Barbuda $ - 10% $ - - $ - 10% $37.50 - $211
Argentina $ - 15% $4.49 - $120 $10.00 40% $50.92 - $307
Aruba $ - - $ - - $10.00 - $37.50 - $173
Bahamas $ - 8% $12.27 - $86 $ - 8% $45.08 - $141
Barbados $ - 18% $ - - $ - 18% $32.20 - $234
Belize $ - - $ - - $84 $36.75 - $17.49 - $195
Bermuda $ - - $ - - $35.00 - $7.75 - $187
Bolivia $ - 19% $2.03 - $92 $41.53 15% $24.96 - $250
Bonaire, Saint Eustatius and Saba $ - - $9.00 - $94 $ - - $35.00 - $168
Brazil $ - - $9.85 - $103 $ - - $34.98 - $369
British Virgin Islands $ - - $ - - $91 $ - - $17.00 - $84
Cayman Islands $ - - $ - - $97 $53.38 - $11.25 - $160
Chile $ - 19% $11.67 - $113 $ - - $11.93 - $287
Colombia $ - 16% $6.54 - $96 $51.26 16% $40.86 - $220
Costa Rica $ - - $ - - $79 $44.00 5% $8.30 - $212
Cuba $ - - $ - - $98 $23.39 - $ - - $260
Curacao $ - - $10.11 - $ - - $29.83 - $196
Dominica $ - - $ - - $ - 8% $ - - $92
Dominican Republic $ - 18% $ - - $20.00 18% $31.30 - $219
Ecuador $10.48 12% $2.37 - $87 $40.19 12% $49.58 - $263
El Salvador $ - - $ - - $15.00 13% $22.13 - $191
French Guiana $24.28 - $5.78 - $70.59 - $5.78 - $315
Grenada $ - - $ - - $13.44 - $33.54 - $188
Guadeloupe $6.61 - $5.78 - $19.31 - $8.09 - $240
Guatemala $ - 12% $2.63 - $87 $30.00 12% $2.63 - $189
Guyana $ - 15% $5.00 - $ - 15% $5.00 - $201
Haiti $ - 10% $5.50 - $90 $57.82 10% $9.58 - $151
Honduras $ - 15% $ - - $83 $32.22 15% $7.50 - $169
Jamaica $0.27 - $12.20 - $82 $61.89 - $25.40 - $189
Martinique $19.08 - $5.78 - $25.06 - $37.71 - $260
Mexico $ - 10% $20.62 - $103 $22.99 4% $38.02 - $216
Montserrat $ - - $ - - $ - - $14.88 - $95
Nicaragua $ - 15% $ - - $ - 15% $42.00 - $186

100 APPENDIX B
SEO AMSTERDAM ECONOMICS
Panama $ - 7% $ - - $116 $40.00 7% $1.25 - $192
Paraguay $5.80 - $4.00 - $104 $41.80 3% $25.00 - $211
Peru $ - 18% $7.95 - $96 $15.00 18% $29.43 - $282
Puerto Rico $ - - $6.90 - $80 $ - - $7.34 - $159
Saint Kitts and Nevis $ - 10% $ - - $80 $15.00 10% $32.00 - $145
Saint Lucia $ - - $ - - $ - 8% $35.53 - $207
Saint Vincent and Grenadines $ - 5% $ - - $ - 5% $19.00 - $101
St. Barthélemy $22.00 - $15.91 - $ - - $51.91 - $166
St Maarten $19.08 - $9.99 - $25.15 - $37.86 - $91
Suriname $ - 8% $ - - $25.00 8% $41.00 - $342
Trinidad and Tobago $ - 15% $ - - $96 $ - 15% $41.85 - $188
Turks and Caicos Islands $ - - $ - - $86 $29.00 - $41.00 - $166
Uruguay $2.00 8% $ - - $107 $40.50 8% $ - - $249
US Virgin Islands $ - - $4.50 - $87 $ - - $4.50 - $171
Venezuela $13.69 8% $0.00 1% $88 $134.73 6% $0.00 1% $214
Source: IATA TTBS, SEO NetCost

ECONOMIC BENEFITS OF REDUCING AVIATION TAXES IN LATIN AMERICA AND THE CARIBBEAN 101
SEO AMSTERDAM ECONOMICS
Appendix C Regional classification
Table C. 1 Regional classification
Country Country group (Caribbean) Sub-region
Anguilla, Leeward Islands UK BOT & Commonwealth Caribbean
Antigua and Barbuda, Leeward Islands UK BOT & Commonwealth Caribbean
Argentina South America
Aruba Dutch Caribbean Caribbean
Bahamas Bahamas Caribbean
Barbados UK BOT & Commonwealth Caribbean
Belize Central America
Bermuda UK BOT & Commonwealth Caribbean
Bolivia South America
Bonaire, Saint Eustatius and Saba Dutch Caribbean Caribbean
Brazil South America
Cayman Islands UK BOT & Commonwealth Caribbean
Chile South America
Colombia South America
Costa Rica Central America
Cuba Cuba Caribbean
Curacao Dutch Caribbean Caribbean
Dominica UK BOT & Commonwealth Caribbean
Dominican Republic Dominican Republic Caribbean
Ecuador South America
El Salvador Central America
French Guiana South America
Grenada, Windward Islands UK BOT & Commonwealth Caribbean
Guadeloupe Haiti & French West Indies Caribbean
Guatemala Central America
Guyana South America
Haiti Haiti & French West Indies Caribbean
Honduras Central America
Jamaica Jamaica Caribbean
Martinique Haiti & French West Indies Caribbean
Mexico Central America
Montserrat, Leeward Islands UK BOT & Commonwealth Caribbean
Nicaragua Central America
Panama Central America
Paraguay South America
Peru South America
Puerto Rico Puerto Rico & US Virgin Islands Caribbean
Puerto Rico & US Virgin Islands Central America
Saint Barthelemy Haiti & French West Indies Caribbean
Saint Kitts and Nevis, Leeward Islands UK BOT & Commonwealth Caribbean
Saint Lucia UK BOT & Commonwealth Caribbean

102 APPENDIX C
SEO AMSTERDAM ECONOMICS
Saint Martin Haiti & French West Indies Caribbean
St Maarten (Dutch Part) Dutch Caribbean Caribbean
St Vincent and the Grenadines UK BOT & Commonwealth Caribbean
Suriname South America
Trinidad and Tobago Trinidad and Tobago Caribbean
Turks and Caicos Islands UK BOT & Commonwealth Caribbean
Uruguay South America
Venezuela South America
Virgin Islands, British UK BOT & Commonwealth Caribbean
Virgin Islands, US Puerto Rico & US Virgin Islands Caribbean

ECONOMIC BENEFITS OF REDUCING AVIATION TAXES IN LATIN AMERICA AND THE CARIBBEAN 103
SEO AMSTERDAM ECONOMICS
Appendix D NetCost model
The SEO NetCost model has been used to calculate consumer benefits. The model uses OAG schedule data for all direct and indirect alternatives to determine generalized costs and market shares for individual markets. The NetCost model was first presented in Heemskerk and Veldhuis (2006a, 2006b) and further developed by Veldhuis and Lieshout (2009)34. NetCost has been used to compute generalized travel costs in the three different scenarios. NetCost allows to compute the average decrease in travel costs per passenger and welfare impacts. Welfare effects are determined using a four-step approach: 1. Construct airline networks in the ‘Baseline’ and in both scenarios for 2025 and 2035, based on
OAG schedule data and passenger growth forecasts; 2. Determine generalized travel costs and consumer utility in each scenario using the NetCost
model; 3. Using price elasticities for business and leisure, estimate the change in passengers and flight
frequency between the baseline and reference scenario following a decrease in generalized travel costs;
4. An increase in flight frequency in the previous step leads again to a decrease in generalized travel costs. Step 3 is re-iterated to determine the additional demand stimulation following the increase in flight frequency.
Construction of future airline networks Using the passenger forecasts as described in Chapter 5, the 2014 airline network has been extrapolated to the horizon years. For each airport, we forecasted a network for 2025 and 2035. The 2014 networks have been extrapolated by increasing the seat capacity offered in 2014 in line with annual passenger growth rates in the respective scenarios, taking into account aircraft size growth figures for each scenario. The NetCost model also requires a ‘beyond-network’ for the horizon years to incorporate indirect travel alternatives to final destinations. This ‘beyond-network’ consists of all destinations that can be reached from Latin America and the Caribbean with a connection at an intermediate hub airport (transfer connections). Direct and indirect travel alternatives are used to determine the competition level in each individual origin-destination market, which is an input variable for the air fare model. For the extrapolation of the beyond network, growth figures from airports outside the region are also required. For these airports we apply growth figures as published by Boeing (2015).
Calculating generalized travel costs and consumer value Generalized travel costs comprise of a fare, time and frequency component ( Figure D. 1). Time costs are calculated using Values of Travel Time for each Latin American country for business and leisure passengers (see Appendix A), multiplied by the travel time of the respective route alternative. For indirect connections an average transfer time of 2.5 hours is assumed.
34 See also Lieshout & Matsumoto (2012)

104 APPENDIX D
SEO AMSTERDAM ECONOMICS
The frequency component denotes costs resulting from schedule delay. Schedule delay is the difference between the departure time preferred by the passenger and the actual departure time. Schedule delay decreases when the flight frequency increases. The costs associated with schedule delay equal the schedule delay (in hours) time multiplied by the Value of Waiting Time for the next flight. By calibration of the model we found that market shares were represented best by using a Value of Waiting Time of $0 for leisure passengers and of $5 for business passengers. The NetCost fare model determines the airfare for an individual route alternative based on travel time, competition level, carrier type and connection type. One-way air fares in US Dollars are estimated using Ordinary Least Squares (OLS) on passenger booking data. After the generalized travel costs (GC) are calculated, a utility function is used to determine the Consumer Value (CV), having as base the frequency (f). A cost sensitivity parameter α is included. After calibrating the model, we find that α = 0.01 for business passengers and α = 0.015 for leisure passengers are the most appropriate values. The consumer value for route alternative i (𝐶𝐶𝑉𝑉𝑖𝑖) is given by:
𝐶𝐶𝑉𝑉𝑖𝑖 = 𝑓𝑓 ⋅ 𝑒𝑒−𝛼𝛼⋅𝐺𝐺𝐶𝐶𝑖𝑖 Market shares of route alternatives are estimated using these consumer values. The market share of a route alternative i is given by:
𝑀𝑀𝑆𝑆𝑖𝑖 =𝐶𝐶𝑉𝑉𝑖𝑖∑ 𝐶𝐶𝑉𝑉𝑗𝑗𝑗𝑗
Figure D. 1 The NetCost model is used to determine Generalized Travel Costs for each trip
Source: SEO
Measuring consumer welfare benefits Consumer benefits in the two scenarios in comparison to the baseline have been estimated at the origin-destination market level. In each OD-market, the average price decrease following a tax or charge reduction is known, both for passengers traveling for business and for leisure. Using a price elasticity of -0.5 for business passengers and -1.5 for leisure passengers, we can compute the average increase in passengers in the two scenario with respect to the baseline in the respective OD-market.

NETCOST MODEL 105
SEO AMSTERDAM ECONOMICS
The change in business and leisure passengers following a tax reduction is given by:
Δ𝑇𝑇𝑇𝑇𝑡𝑡𝑏𝑏𝑒𝑒𝑏𝑏 = �𝐺𝐺𝐶𝐶𝑏𝑏𝑒𝑒𝑏𝑏𝑆𝑆𝐶𝐶𝑆𝑆𝑆𝑆
𝐺𝐺𝐶𝐶𝑏𝑏𝑒𝑒𝑏𝑏𝐵𝐵𝐵𝐵𝑆𝑆𝑆𝑆�−0.5
Δ𝑇𝑇𝑇𝑇𝑡𝑡𝑙𝑙𝑒𝑒𝑖𝑖𝑏𝑏 = �𝐺𝐺𝐶𝐶𝑙𝑙𝑒𝑒𝑖𝑖𝑏𝑏𝑆𝑆𝐶𝐶𝑆𝑆𝑆𝑆
𝐺𝐺𝐶𝐶𝑙𝑙𝑒𝑒𝑖𝑖𝑏𝑏𝐵𝐵𝐵𝐵𝑆𝑆𝑆𝑆�
−1.5
Where 𝐺𝐺𝐶𝐶𝑚𝑚𝑆𝑆 denotes the generalized travel costs per OD market in scenario 𝑆𝑆 for a passenger with travel motive 𝑚𝑚. An increase in passengers following a tax or charge decrease also results in an increase in flight frequency, which in turn leads to lower generalized costs. Therefore, this step is re-iterated, to include the second-order effects of an increase in the number of flights. The difference in generalized travel costs between the two scenarios gives the welfare gain per passenger in each market. We compute the total consumer welfare benefit for each OD market by applying the so-called ‘rule of half’: the welfare gain per passenger is multiplied by the number of OD-passengers in the respective market in the baseline scenario. The number of new passengers – which do not travel in the baseline scenario but do travel in the less constrained scenario – is multiplied by half of the welfare gain per passenger.


ECONOMIC BENEFITS OF REDUCING AVIATION TAXES IN LATIN AMERICA AND THE CARIBBEAN 107
SEO AMSTERDAM ECONOMICS
Appendix E Values of Time
We estimate the values of time for leisure and business passengers following the guidelines in the ‘Handbook on estimation of external costs in the transport sector’ (CE Delft, 2008), which was commissioned by the European Commission:
𝑉𝑉𝑇𝑇𝑉𝑉𝑉𝑉𝑒𝑒 𝑗𝑗𝑓𝑓 𝑇𝑇𝑇𝑇𝑚𝑚𝑒𝑒 𝑒𝑒𝑒𝑒𝑒𝑒𝑐𝑐𝑐𝑐𝑒𝑒𝑐𝑐,𝑚𝑚𝑒𝑒𝑐𝑐𝑖𝑖𝑚𝑚𝑒𝑒 = 𝑉𝑉𝑇𝑇𝑉𝑉𝑉𝑉𝑒𝑒 𝑗𝑗𝑓𝑓 𝑇𝑇𝑇𝑇𝑚𝑚𝑒𝑒 𝑆𝑆𝐸𝐸,𝑚𝑚𝑒𝑒𝑐𝑐𝑖𝑖𝑚𝑚𝑒𝑒 × �𝐺𝐺𝐺𝐺𝐺𝐺 𝑝𝑝𝑒𝑒𝑒𝑒 𝑒𝑒𝑒𝑒𝑝𝑝𝑖𝑖𝑐𝑐𝑒𝑒 𝑖𝑖𝑐𝑐 𝐺𝐺𝐺𝐺𝐺𝐺 𝑐𝑐𝑐𝑐𝑐𝑐𝑐𝑐𝑐𝑐𝑐𝑐𝑐𝑐
𝐺𝐺𝐺𝐺𝐺𝐺 𝑝𝑝𝑒𝑒𝑒𝑒 𝑒𝑒𝑒𝑒𝑝𝑝𝑖𝑖𝑐𝑐𝑒𝑒 𝑖𝑖𝑐𝑐 𝐺𝐺𝐺𝐺𝐺𝐺 𝐸𝐸𝐸𝐸�1.0
This formula takes the average 𝑉𝑉𝑇𝑇𝑉𝑉𝑉𝑉𝑒𝑒 𝑗𝑗𝑓𝑓 𝑇𝑇𝑇𝑇𝑚𝑚𝑒𝑒 𝑆𝑆𝐸𝐸,𝑚𝑚𝑒𝑒𝑐𝑐𝑖𝑖𝑚𝑚𝑒𝑒 in all EU Member States for both travel motives and corrects it for the relative size of a country’s GDP per capita in purchasing-power-parities (PPPs) (𝐺𝐺𝐺𝐺𝐺𝐺 𝑇𝑇𝑒𝑒𝑇𝑇 𝑐𝑐𝑇𝑇𝑇𝑇𝑇𝑇𝑡𝑡𝑇𝑇 𝑇𝑇𝑇𝑇 𝐺𝐺𝐺𝐺𝐺𝐺 𝑒𝑒𝑒𝑒𝑒𝑒𝑐𝑐𝑐𝑐𝑒𝑒𝑐𝑐) compared to the EU average (𝐺𝐺𝐺𝐺𝐺𝐺 𝑇𝑇𝑒𝑒𝑇𝑇 𝑐𝑐𝑇𝑇𝑇𝑇𝑇𝑇𝑡𝑡𝑇𝑇 𝑇𝑇𝑇𝑇 𝐺𝐺𝐺𝐺𝐺𝐺 𝑆𝑆𝐸𝐸). The average value of time in the EU is given by HEATCO (2004) for both business and leisure passengers. These valuations were also converted to current levels using Eurostat consumer price indices. The GDP per capita values (in PPPs) for individual countries and for the EU as a whole are given by IMF’s World Economic Outlook Database.


ECONOMIC BENEFITS OF REDUCING AVIATION TAXES IN LATIN AMERICA AND THE CARIBBEAN 109
SEO AMSTERDAM ECONOMICS
Appendix F Discounting
Comparing costs and benefits occurring at different points in time is not simply a matter of adding or subtracting. It is generally believed that the further a benefit or cost is pushed into the future, the less it is worth today. This consideration needs to be incorporated into calculations of net benefits. The process of reducing the value of benefits or costs occurring in the future is called discounting. This is generally done by multiplying costs or benefits by a fractional number depending on how far in the future they occur. Discounted values from each year of a project’s life are added up to calculate the project’s net present value. Costs or benefits occurring further in the future are discounted more heavily while those occurring closer to the present are discounted less heavily. Most countries (and the EU) have a proscribed discount rate, in order to prevent comparisons between policy options being obscured by the impact of different discount rates. The discount rate is usually based on a rate of interest. Over the last decades discount rates used in SCBA have generally declined. The discount rate in the UK was reduced from 6 to 3.5 percent in 2003. Germany reduced its social discount rate from 4 to 3 percent in 2004 and France reduced its rate from 8 to 4 percent in 2005. This reflects falling interest rates, as most countries use the rate at which they borrow money as the basis for calculating discount rates (Koopmans & Rietveld 2013). The European Commission and Eurocontrol (2013c) recommend using a social discount rate of 4 percent. Many environmental effects, especially climate change impacts, occur in the very long run. Over such long periods of time, much is uncertain about the impacts, but also about the appropriate discount rate (Koopmans & Rietveld 2013). Weitzman (2009) indicates that long-term climate risks are very hard to assess, but they are potentially so large that they might have a stronger impact than discounting using standard discount rates. Weitzman (1998) also shows that in case of uncertainty about the discount rate, the lowest rate is the most appropriate. Some countries apply discount rates that decrease over time, which corresponds to incorporating increased risk. In the United Kingdom the rate falls steady from 3.5 percent in the first 30 years to 1 percent for effects that occur more than 300 years into the future (HM Treasury 2011). According to the EU, “such a reducing rate better reflects individuals' perceptions, uncertainties about the economy in the future and the concerns that constant-rate discounting shifts unfair burdens of social cost onto future generations”. The US Environmental Agency recommends that for intergenerational discounting, a rate of 2–3 percent is used (Zhuang et al. 2007). CE Delft (2011) uses a 3 percent discount rate for CO2-emissions. We apply a discount rate of 4.4 percent. This discount rate is derived from Lopez (2008), which estimates the social discount rates for nine Latin America countries in four scenarios. The 4.4 percent discount rate follows from the average of the two intermediate scenarios.


ECONOMIC BENEFITS OF REDUCING AVIATION TAXES IN LATIN AMERICA AND THE CARIBBEAN 111
SEO AMSTERDAM ECONOMICS
Appendix G Movements and passenger forecast per country
Total departing flights (thousands) 2014 2020 2025 2035
baseline Tax Removal Tax Removal and Charges Reduction
baseline Tax Removal Tax Removal and Charges Reduction
baseline Tax Removal Tax Removal and Charges Reduction
baseline Tax Removal Tax Removal and Charges Reduction
Argentina 154 173 188 158 178 194 160 181 197 178 202 221
Bahamas 69 70 73 94 96 99 111 113 117 140 143 148
Belize 210 210 210 346 346 346 490 490 490 662 662 663
Bolivia 82 87 99 112 119 136 146 155 177 254 270 309
Brazil 1,174 1,174 1,174 1,402 1,402 1,402 1,651 1,651 1,651 2,033 2,033 2,033
Chile 126 134 143 166 176 188 188 199 213 221 234 250
Colombia 252 271 300 354 380 420 444 476 526 576 617 683
Costa Rica 70 72 74 131 134 137 178 180 184 249 253 257
Cuba 22 22 22 23 23 24 24 25 25 28 29 29
Dominican Republic 43 48 53 53 60 66 59 66 72 74 82 90
Dutch Caribbean 67 69 72 70 72 75 70 72 75 72 74 77
Ecuador 70 75 85 93 101 114 117 126 142 155 167 189
El Salvador 23 25 27 31 34 36 36 39 42 46 51 54
French Guiana 2 2 2 2 3 3 3 3 3 3 3 3
Guatemala 17 19 21 24 27 29 28 32 35 39 44 48
Guyana 5 6 6 6 6 6 6 7 7 8 9 9
Haiti & French West Indies 57 59 63 76 80 85 80 84 89 90 94 100
Honduras 30 35 37 56 64 68 80 91 97 135 153 163
Jamaica 22 23 25 27 29 32 30 32 35 36 38 41
Mexico 564 588 612 761 795 827 880 918 956 1,201 1,255 1,306
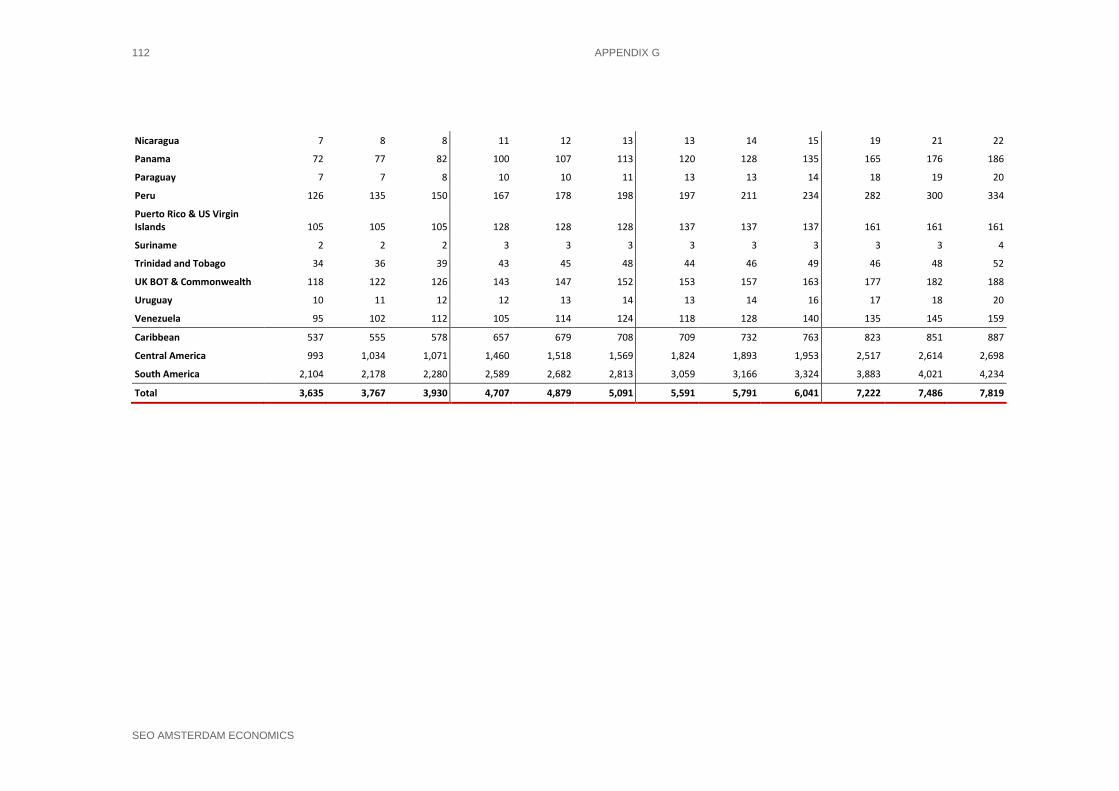
112 APPENDIX G
SEO AMSTERDAM ECONOMICS
Nicaragua 7 8 8 11 12 13 13 14 15 19 21 22
Panama 72 77 82 100 107 113 120 128 135 165 176 186
Paraguay 7 7 8 10 10 11 13 13 14 18 19 20
Peru 126 135 150 167 178 198 197 211 234 282 300 334
Puerto Rico & US Virgin Islands 105 105 105 128 128 128 137 137 137 161 161 161
Suriname 2 2 2 3 3 3 3 3 3 3 3 4
Trinidad and Tobago 34 36 39 43 45 48 44 46 49 46 48 52
UK BOT & Commonwealth 118 122 126 143 147 152 153 157 163 177 182 188
Uruguay 10 11 12 12 13 14 13 14 16 17 18 20
Venezuela 95 102 112 105 114 124 118 128 140 135 145 159
Caribbean 537 555 578 657 679 708 709 732 763 823 851 887
Central America 993 1,034 1,071 1,460 1,518 1,569 1,824 1,893 1,953 2,517 2,614 2,698
South America 2,104 2,178 2,280 2,589 2,682 2,813 3,059 3,166 3,324 3,883 4,021 4,234
Total 3,635 3,767 3,930 4,707 4,879 5,091 5,591 5,791 6,041 7,222 7,486 7,819

MOVEMENTS AND PASSENGER FORECAST PER COUNTRY 113
SEO AMSTERDAM ECONOMICS
2014 (immediate impact analysis) Total departing pax (thousands)
baseline Tax Removal Tax Removal and Charges Reduction
Pax Business Pax Leisure Pax Total Pax Business Pax Leisure Pax Total
% change (w.r.t. baseline)
Pax Business Pax Leisure Pax Total % change (w.r.t. baseline)
Argentina 2,974 10,392 13,366 3,207 13,396 16,604 24% 3,234 14,023 17,257 29%
Bahamas 412 1,386 1,798 422 1,501 1,923 7% 433 1,699 2,132 19%
Belize 201 752 952 202 767 968 2% 202 772 974 2%
Bolivia 950 2,637 3,587 1,020 3,374 4,394 22% 1,022 3,417 4,439 24%
Brazil 18,055 63,985 82,040 18,055 63,985 82,040 0% 18,211 66,776 84,986 4%
Chile 2,845 8,292 11,137 2,977 9,713 12,690 14% 3,001 10,145 13,146 18%
Colombia 4,463 16,100 20,563 4,743 19,814 24,557 19% 4,787 20,757 25,544 24%
Costa Rica 532 1,660 2,192 550 1,914 2,464 12% 551 1,923 2,474 13%
Cuba 585 2,087 2,672 590 2,174 2,763 3% 590 2,173 2,763 3%
Dominican Republic 1,032 3,510 4,542 1,101 4,412 5,514 21% 1,115 4,685 5,800 28%
Dutch Caribbean 624 2,126 2,750 629 2,209 2,838 3% 640 2,435 3,075 12%
Ecuador 1,218 4,291 5,508 1,294 5,432 6,726 22% 1,302 5,605 6,907 25%
El Salvador 220 690 910 233 835 1,068 17% 235 873 1,108 22%
French Guiana 56 154 210 57 171 228 9% 57 171 228 9%
Guatemala 253 802 1,055 269 1,006 1,275 21% 269 1,006 1,275 21%
Guyana 53 157 211 57 191 247 17% 57 191 247 17%
Haiti & French West Indies 514 1,834 2,348 531 2,133 2,665 13% 538 2,277 2,815 20%
Honduras 184 623 807 198 810 1,008 25% 198 813 1,011 25%
Jamaica 476 1,623 2,100 495 1,938 2,433 16% 500 2,045 2,546 21%
Mexico 8,636 30,141 38,777 8,896 33,484 42,380 9% 9,071 36,896 45,967 19%
Nicaragua 114 348 462 120 410 531 15% 123 462 586 27%
Panama 632 1,836 2,468 660 2,166 2,826 14% 659 2,166 2,825 14%
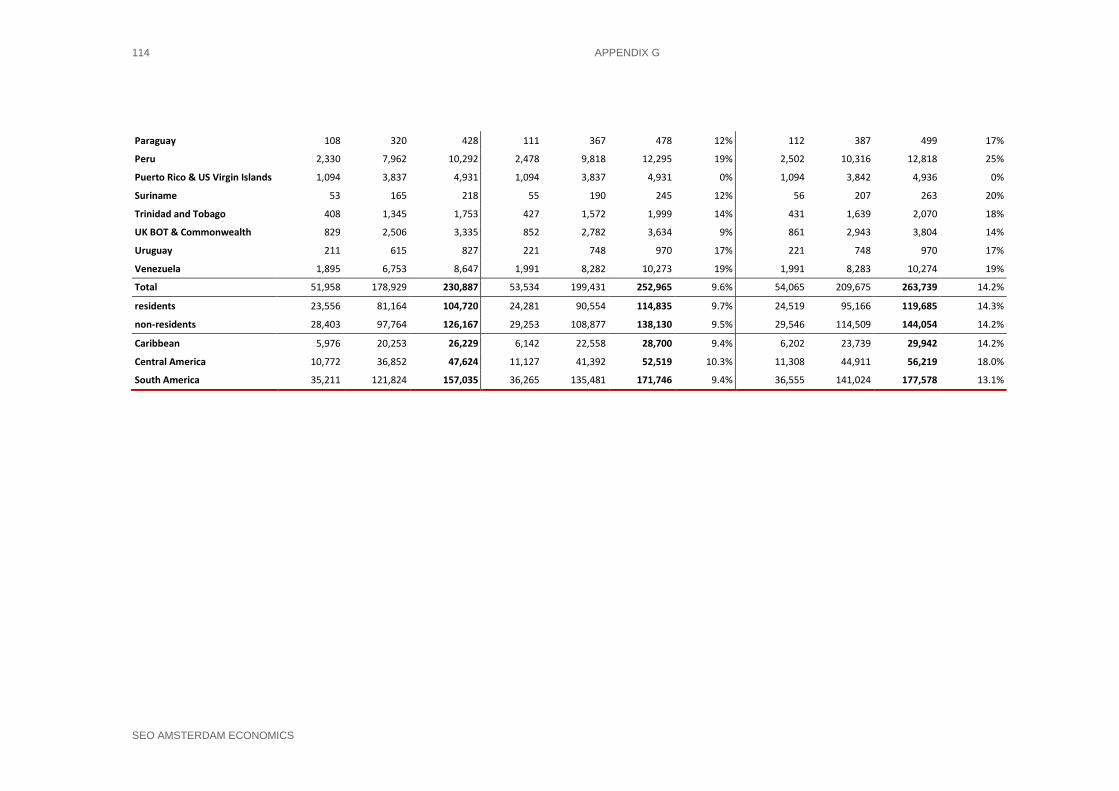
114 APPENDIX G
SEO AMSTERDAM ECONOMICS
Paraguay 108 320 428 111 367 478 12% 112 387 499 17%
Peru 2,330 7,962 10,292 2,478 9,818 12,295 19% 2,502 10,316 12,818 25%
Puerto Rico & US Virgin Islands 1,094 3,837 4,931 1,094 3,837 4,931 0% 1,094 3,842 4,936 0%
Suriname 53 165 218 55 190 245 12% 56 207 263 20%
Trinidad and Tobago 408 1,345 1,753 427 1,572 1,999 14% 431 1,639 2,070 18%
UK BOT & Commonwealth 829 2,506 3,335 852 2,782 3,634 9% 861 2,943 3,804 14%
Uruguay 211 615 827 221 748 970 17% 221 748 970 17%
Venezuela 1,895 6,753 8,647 1,991 8,282 10,273 19% 1,991 8,283 10,274 19%
Total 51,958 178,929 230,887 53,534 199,431 252,965 9.6% 54,065 209,675 263,739 14.2%
residents 23,556 81,164 104,720 24,281 90,554 114,835 9.7% 24,519 95,166 119,685 14.3%
non-residents 28,403 97,764 126,167 29,253 108,877 138,130 9.5% 29,546 114,509 144,054 14.2%
Caribbean 5,976 20,253 26,229 6,142 22,558 28,700 9.4% 6,202 23,739 29,942 14.2%
Central America 10,772 36,852 47,624 11,127 41,392 52,519 10.3% 11,308 44,911 56,219 18.0%
South America 35,211 121,824 157,035 36,265 135,481 171,746 9.4% 36,555 141,024 177,578 13.1%
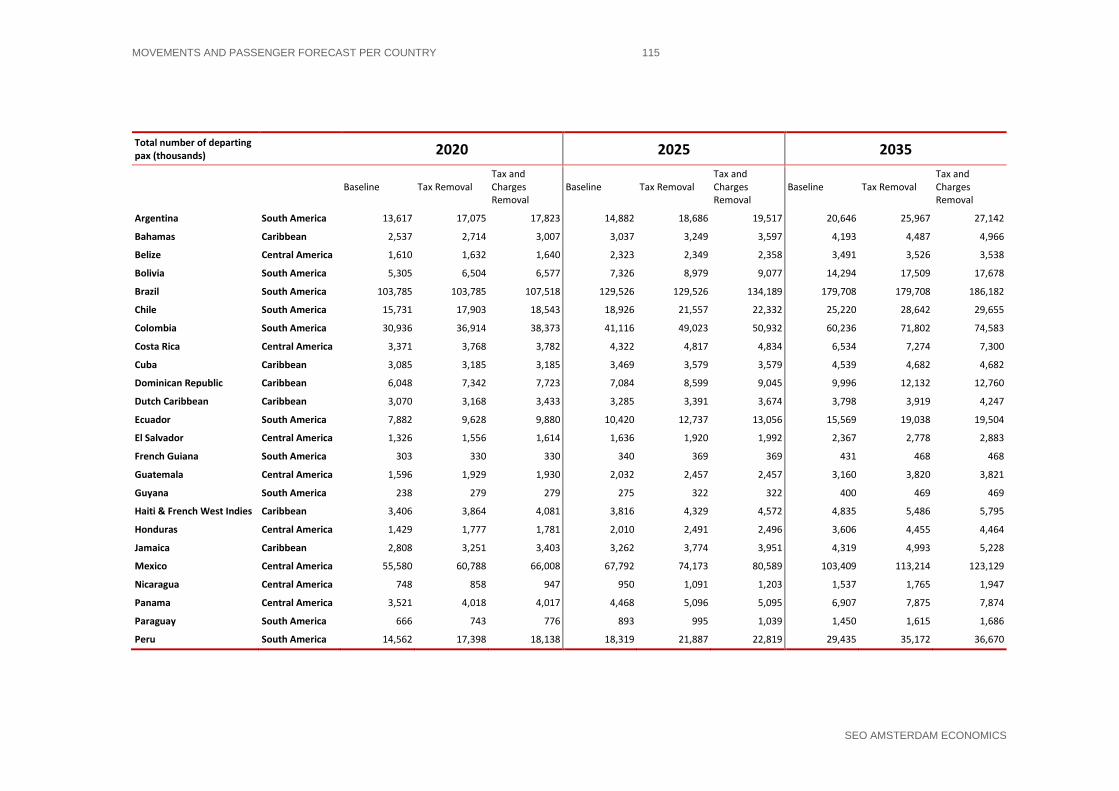
MOVEMENTS AND PASSENGER FORECAST PER COUNTRY 115
SEO AMSTERDAM ECONOMICS
Total number of departing pax (thousands) 2020 2025 2035
Baseline Tax Removal Tax and Charges Removal
Baseline Tax Removal Tax and Charges Removal
Baseline Tax Removal Tax and Charges Removal
Argentina South America 13,617 17,075 17,823 14,882 18,686 19,517 20,646 25,967 27,142
Bahamas Caribbean 2,537 2,714 3,007 3,037 3,249 3,597 4,193 4,487 4,966
Belize Central America 1,610 1,632 1,640 2,323 2,349 2,358 3,491 3,526 3,538
Bolivia South America 5,305 6,504 6,577 7,326 8,979 9,077 14,294 17,509 17,678
Brazil South America 103,785 103,785 107,518 129,526 129,526 134,189 179,708 179,708 186,182
Chile South America 15,731 17,903 18,543 18,926 21,557 22,332 25,220 28,642 29,655
Colombia South America 30,936 36,914 38,373 41,116 49,023 50,932 60,236 71,802 74,583
Costa Rica Central America 3,371 3,768 3,782 4,322 4,817 4,834 6,534 7,274 7,300
Cuba Caribbean 3,085 3,185 3,185 3,469 3,579 3,579 4,539 4,682 4,682
Dominican Republic Caribbean 6,048 7,342 7,723 7,084 8,599 9,045 9,996 12,132 12,760
Dutch Caribbean Caribbean 3,070 3,168 3,433 3,285 3,391 3,674 3,798 3,919 4,247
Ecuador South America 7,882 9,628 9,880 10,420 12,737 13,056 15,569 19,038 19,504
El Salvador Central America 1,326 1,556 1,614 1,636 1,920 1,992 2,367 2,778 2,883
French Guiana South America 303 330 330 340 369 369 431 468 468
Guatemala Central America 1,596 1,929 1,930 2,032 2,457 2,457 3,160 3,820 3,821
Guyana South America 238 279 279 275 322 322 400 469 469
Haiti & French West Indies Caribbean 3,406 3,864 4,081 3,816 4,329 4,572 4,835 5,486 5,795
Honduras Central America 1,429 1,777 1,781 2,010 2,491 2,496 3,606 4,455 4,464
Jamaica Caribbean 2,808 3,251 3,403 3,262 3,774 3,951 4,319 4,993 5,228
Mexico Central America 55,580 60,788 66,008 67,792 74,173 80,589 103,409 113,214 123,129
Nicaragua Central America 748 858 947 950 1,091 1,203 1,537 1,765 1,947
Panama Central America 3,521 4,018 4,017 4,468 5,096 5,095 6,907 7,875 7,874
Paraguay South America 666 743 776 893 995 1,039 1,450 1,615 1,686
Peru South America 14,562 17,398 18,138 18,319 21,887 22,819 29,435 35,172 36,670
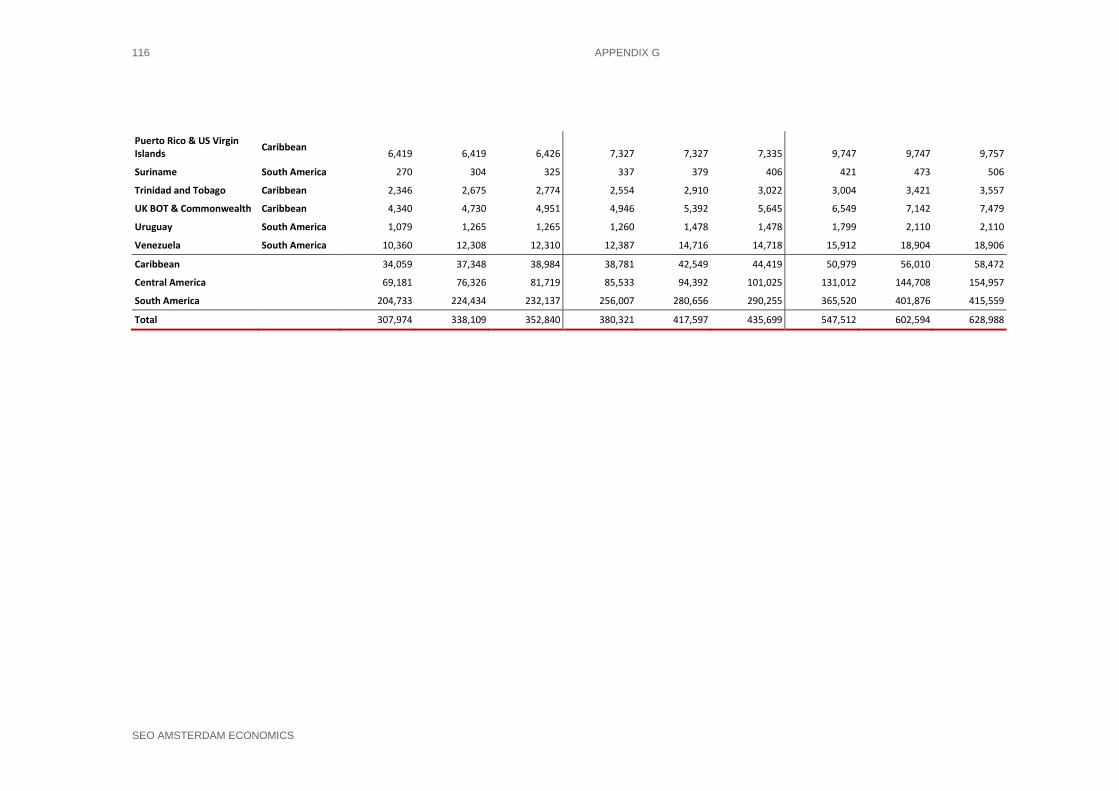
116 APPENDIX G
SEO AMSTERDAM ECONOMICS
Puerto Rico & US Virgin Islands Caribbean 6,419 6,419 6,426 7,327 7,327 7,335 9,747 9,747 9,757
Suriname South America 270 304 325 337 379 406 421 473 506
Trinidad and Tobago Caribbean 2,346 2,675 2,774 2,554 2,910 3,022 3,004 3,421 3,557
UK BOT & Commonwealth Caribbean 4,340 4,730 4,951 4,946 5,392 5,645 6,549 7,142 7,479
Uruguay South America 1,079 1,265 1,265 1,260 1,478 1,478 1,799 2,110 2,110
Venezuela South America 10,360 12,308 12,310 12,387 14,716 14,718 15,912 18,904 18,906
Caribbean 34,059 37,348 38,984 38,781 42,549 44,419 50,979 56,010 58,472
Central America 69,181 76,326 81,719 85,533 94,392 101,025 131,012 144,708 154,957
South America 204,733 224,434 232,137 256,007 280,656 290,255 365,520 401,876 415,559
Total 307,974 338,109 352,840 380,321 417,597 435,699 547,512 602,594 628,988

ECONOMIC BENEFITS OF REDUCING AVIATION TAXES IN LATIN AMERICA AND THE CARIBBEAN 117
SEO AMSTERDAM ECONOMICS
Appendix H Consumer benefits per country
2014 2020 2025 2035
Total consumer benefit (mln USD)
Benefit per passenger (USD)
Total consumer benefit (mln USD)
Benefit per passenger (USD)
Total consumer benefit (mln USD)
Benefit per passenger (USD)
Total consumer benefit (mln USD)
Benefit per passenger (USD)
Scenario TR TRCR TR TRCR TR TRCR TR TRCR TR TRCR TR TRCR TR TRCR TR TRCR
Argentina 1,575 1,820 186 206 1,760 2,043 201 224 1,949 2,264 204 226 2,747 3,193 206 229
Bahamas 12 28 27 58 17 40 27 57 21 49 26 56 29 69 26 55
Belize 2 3 5 6 3 4 4 5 3 4 3 4 4 6 3 4
Bolivia 154 166 69 74 234 254 71 76 320 346 70 75 603 649 68 73
Brazil 6 579 0 14 6 704 0 13 6 864 0 13 8 1,187 0 13
Chile 344 436 54 66 482 610 54 65 584 739 54 66 760 963 53 65
Colombia 998 1,244 77 92 1,455 1,809 75 90 1,878 2,331 73 87 2,723 3,379 73 86
Costa Rica 44 45 71 74 63 66 65 67 79 82 62 64 118 122 61 62
Cuba 10 10 17 18 11 11 16 16 12 12 15 15 16 16 15 15
Dominican Republic 92 115 132 155 123 152 132 155 144 179 132 155 203 252 132 155
Dutch Caribbean 20 72 15 51 22 80 15 51 23 86 15 51 27 99 15 51
Ecuador 238 290 74 88 338 410 73 87 442 532 72 85 656 787 72 84
El Salvador 46 57 99 117 67 82 99 117 83 102 99 117 120 147 99 117
French Guiana 9 9 79 79 13 13 79 79 15 15 79 79 18 18 79 79
Guatemala 69 69 106 106 105 105 106 106 133 134 106 106 207 207 106 106
Guyana 6 6 133 134 7 7 133 134 8 8 133 134 11 12 133 134
Haiti & French West Indies 80 110 55 71 115 158 54 71 129 177 54 71 164 225 54 71
Honduras 56 56 113 114 94 95 108 109 128 130 105 106 224 226 103 103
Jamaica 21 28 70 89 28 37 69 88 32 43 67 87 42 57 66 86
Mexico 602 1,168 39 69 890 1,732 39 69 1,102 2,149 39 69 1,726 3,373 38 68
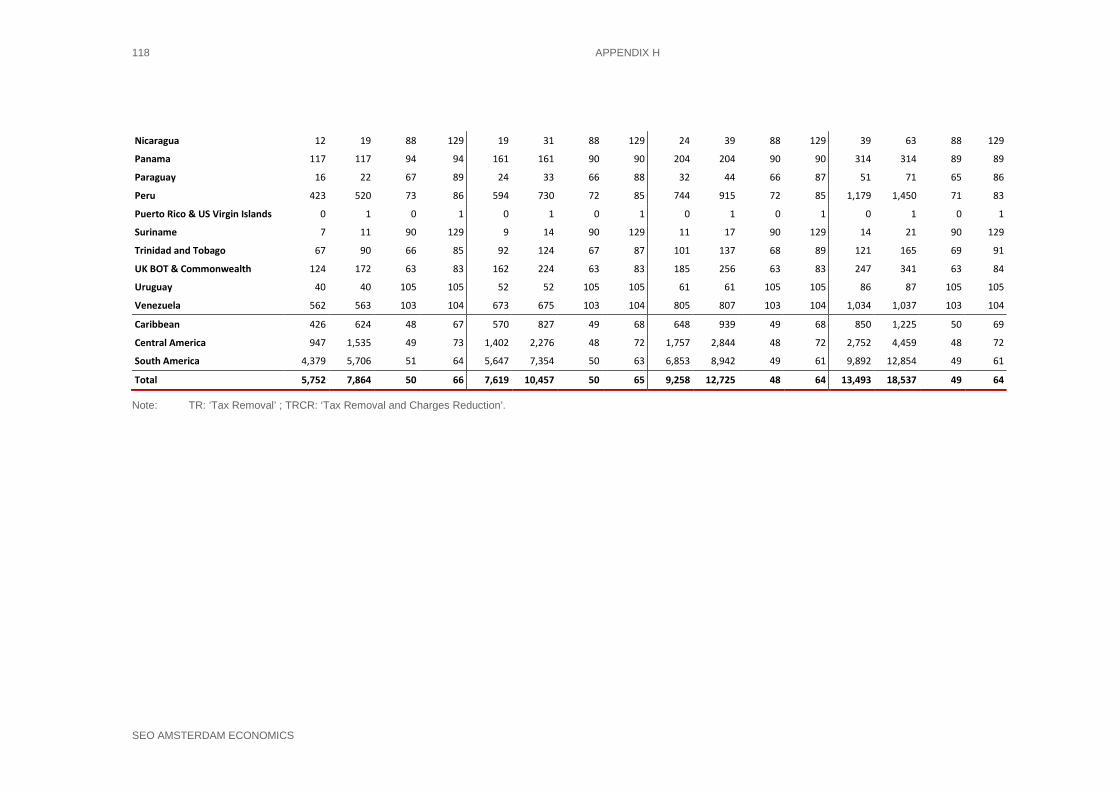
118 APPENDIX H
SEO AMSTERDAM ECONOMICS
Nicaragua 12 19 88 129 19 31 88 129 24 39 88 129 39 63 88 129
Panama 117 117 94 94 161 161 90 90 204 204 90 90 314 314 89 89
Paraguay 16 22 67 89 24 33 66 88 32 44 66 87 51 71 65 86
Peru 423 520 73 86 594 730 72 85 744 915 72 85 1,179 1,450 71 83
Puerto Rico & US Virgin Islands 0 1 0 1 0 1 0 1 0 1 0 1 0 1 0 1
Suriname 7 11 90 129 9 14 90 129 11 17 90 129 14 21 90 129
Trinidad and Tobago 67 90 66 85 92 124 67 87 101 137 68 89 121 165 69 91
UK BOT & Commonwealth 124 172 63 83 162 224 63 83 185 256 63 83 247 341 63 84
Uruguay 40 40 105 105 52 52 105 105 61 61 105 105 86 87 105 105
Venezuela 562 563 103 104 673 675 103 104 805 807 103 104 1,034 1,037 103 104
Caribbean 426 624 48 67 570 827 49 68 648 939 49 68 850 1,225 50 69
Central America 947 1,535 49 73 1,402 2,276 48 72 1,757 2,844 48 72 2,752 4,459 48 72
South America 4,379 5,706 51 64 5,647 7,354 50 63 6,853 8,942 49 61 9,892 12,854 49 61
Total 5,752 7,864 50 66 7,619 10,457 50 65 9,258 12,725 48 64 13,493 18,537 49 64
Note: TR: ‘Tax Removal’ ; TRCR: ‘Tax Removal and Charges Reduction’.
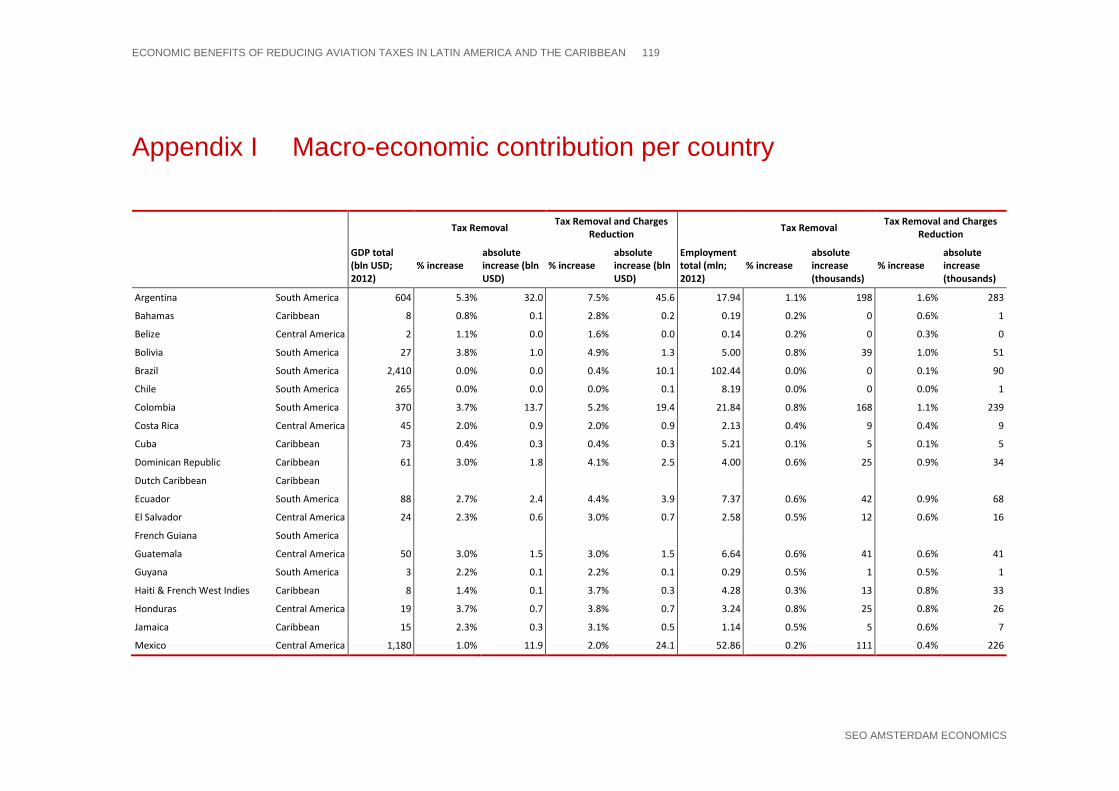
ECONOMIC BENEFITS OF REDUCING AVIATION TAXES IN LATIN AMERICA AND THE CARIBBEAN 119
SEO AMSTERDAM ECONOMICS
Appendix I Macro-economic contribution per country
Tax Removal Tax Removal and Charges Reduction Tax Removal Tax Removal and Charges
Reduction
GDP total (bln USD; 2012)
% increase absolute increase (bln USD)
% increase absolute increase (bln USD)
Employment total (mln; 2012)
% increase absolute increase (thousands)
% increase absolute increase (thousands)
Argentina South America 604 5.3% 32.0 7.5% 45.6 17.94 1.1% 198 1.6% 283
Bahamas Caribbean 8 0.8% 0.1 2.8% 0.2 0.19 0.2% 0 0.6% 1
Belize Central America 2 1.1% 0.0 1.6% 0.0 0.14 0.2% 0 0.3% 0
Bolivia South America 27 3.8% 1.0 4.9% 1.3 5.00 0.8% 39 1.0% 51
Brazil South America 2,410 0.0% 0.0 0.4% 10.1 102.44 0.0% 0 0.1% 90
Chile South America 265 0.0% 0.0 0.0% 0.1 8.19 0.0% 0 0.0% 1
Colombia South America 370 3.7% 13.7 5.2% 19.4 21.84 0.8% 168 1.1% 239
Costa Rica Central America 45 2.0% 0.9 2.0% 0.9 2.13 0.4% 9 0.4% 9
Cuba Caribbean 73 0.4% 0.3 0.4% 0.3 5.21 0.1% 5 0.1% 5
Dominican Republic Caribbean 61 3.0% 1.8 4.1% 2.5 4.00 0.6% 25 0.9% 34
Dutch Caribbean Caribbean
Ecuador South America 88 2.7% 2.4 4.4% 3.9 7.37 0.6% 42 0.9% 68
El Salvador Central America 24 2.3% 0.6 3.0% 0.7 2.58 0.5% 12 0.6% 16
French Guiana South America
Guatemala Central America 50 3.0% 1.5 3.0% 1.5 6.64 0.6% 41 0.6% 41
Guyana South America 3 2.2% 0.1 2.2% 0.1 0.29 0.5% 1 0.5% 1
Haiti & French West Indies Caribbean 8 1.4% 0.1 3.7% 0.3 4.28 0.3% 13 0.8% 33
Honduras Central America 19 3.7% 0.7 3.8% 0.7 3.24 0.8% 25 0.8% 26
Jamaica Caribbean 15 2.3% 0.3 3.1% 0.5 1.14 0.5% 5 0.6% 7
Mexico Central America 1,180 1.0% 11.9 2.0% 24.1 52.86 0.2% 111 0.4% 226

120 APPENDIX I
SEO AMSTERDAM ECONOMICS
Nicaragua Central America 11 1.9% 0.2 3.6% 0.4 2.52 0.4% 10 0.8% 19
Panama Central America 38 2.0% 0.8 2.0% 0.8 1.76 0.4% 7 0.4% 7
Paraguay South America 25 1.7% 0.4 2.6% 0.6 3.06 0.4% 11 0.5% 17
Peru South America 193 2.7% 5.2 3.5% 6.8 16.26 0.6% 92 0.7% 120
Puerto Rico & US Virgin Islands Central America 101 0.0% 0.0 0.0% 0.0 1.05 0.0% 0 0.0% 0
Suriname South America 5 1.7% 0.1 3.2% 0.2 0.20 0.4% 1 0.7% 1
Trinidad and Tobago Caribbean 25 1.7% 0.4 3.2% 0.8 0.66 0.4% 2 0.7% 4
UK BOT & Commonwealth Caribbean 15 1.1% 0.2 2.1% 0.3 0.14 0.2% 0 0.4% 1
Uruguay South America 51 2.5% 1.3 2.5% 1.3 1.64 0.5% 9 0.5% 9
Venezuela South America 381 3.0% 11.6 3.0% 11.6 13.07 0.6% 83 0.6% 83
Caribbean 204 1.6% 3.2 2.4% 4.9 16 0.3% 51 0.5% 85
Central America 1,469 1.1% 16.5 2.0% 29.1 73 0.3% 217 0.5% 344
South America 4,422 1.5% 67.7 2.3% 101.0 197 0.3% 644 0.5% 962
TOTAL 6,095 1.4% 87.4 2.2% 135.0 286 0.3% 912 0.5% 1392
Source: World Bank; elaboration SEO

ECONOMIC BENEFITS OF REDUCING AVIATION TAXES IN LATIN AMERICA AND THE CARIBBEAN 121
SEO AMSTERDAM ECONOMICS
Appendix J Decomposition of GDP impacts into productivity and employment growth
Tax Removal Tax Removal and Charges Reduction
Employment increase (USD mln)
productivity increase (USD mln)
Employment increase (USD mln)
productivity increase (USD mln)
Argentina 6,951 25,018 10,076 35,506
Bahamas 13 51 49 180
Belize 4 14 5 20
Bolivia 220 802 288 1,041
Brazil 0 0 2,120 8,001
Chile 0 0 25 95
Colombia 2,934 10,724 4,216 15,182
Costa Rica 188 699 196 727
Cuba 66 251 66 251
Dominican Republic 392 1,443 537 1,954
Dutch Caribbean Ecuador 508 1,874 842 3,056
El Salvador 117 433 152 558
French Guiana Guatemala 322 1,186 322 1,186
Guyana 13 50 13 50
Haiti & French West Indies 24 88 62 228
Honduras 147 538 150 548
Jamaica 71 262 96 354
Mexico 2,506 9,401 5,120 19,013
Nicaragua 42 158 81 297
Panama 159 591 159 591
Paraguay 90 337 136 502
Peru 1,110 4,094 1,459 5,339
Puerto Rico & US Virgin Islands 0 0 0 0
Suriname 18 67 34 124
Trinidad and Tobago 89 332 169 619
UK BOT & Commonwealth 34 128 69 254
Uruguay 277 1,024 277 1,024
Venezuela 2,474 9,097 2,474 9,101
Caribbean 690 2,555 1,048 3,841
Central America 3,486 13,020 6,185 22,940
South America 14,595 53,088 21,962 79,020
Total 18,771 68,663 29,195 105,801


ECONOMIC BENEFITS OF REDUCING AVIATION TAXES IN LATIN AMERICA AND THE CARIBBEAN 123
SEO AMSTERDAM ECONOMICS
Appendix K Regression results
Data used In order to provide estimates for the macro-economic impact of air transport growth, macro-economic data and air transport data were collected for the period 2001-2014, for all Latin American countries for which data were available. The macro-economic data are obtained from various sources, including CEPALSTAT, World Bank, WTO (World Trade Organization) and UNWTO (United Nations World Tourism Organization). Data on air connectivity were obtained from the SEO NetScan model, whereas passenger number were extracted from IATA PaxIS.
We provide estimates for the effect of a change in air connectivity on employment and GDP. In addition, we are interested in the wider catalytic impacts of improved connectivity and passenger growth: • Tourism. Access to air transport is important for the development of inbound tourism.
Inbound tourists generate value added effects, income effects and employment effects. Tourism is measured by the number of inbound tourist, as derived from UNWTO data;
• Investment. It is assumed that air transport, due to its reducing effect on transport costs, increases the likelihood of FDI exchange between connected regions. FDI leads to increases in local demand for labour, for instance to build up new production capacity and to increase the production of goods and services. Investment is measured by the net inflows of FDI, as a percentage of GDP. Data are derived from the World Bank;
• Innovation. Improvements in international mobility enhance the exchange, development and diffusion of innovative ideas, of technical progress and of product and process innovations. In this study, we measure innovation as the amount of total R&D expenditure as a percentage of GDP. Data are derived from the World Bank.
Model To estimate the impact of an increase in air passengers on GDP, employment and other socio-economic variables we apply a fixed effects panel data model. This model is designed to explain the effect of changes of independent variables over time on changes in the dependent variable. We have estimated a specific constant for each airport, which represents the overall economic strength around the region in which the airport is located. The model we use for our analysis is given by:
𝑦𝑦𝑖𝑖𝑐𝑐 = 𝛼𝛼 + 𝛽𝛽′𝑡𝑡𝑖𝑖𝑐𝑐−1 + 𝛾𝛾′𝑧𝑧𝑖𝑖𝑐𝑐 + 𝑉𝑉𝑖𝑖 + 𝜖𝜖
(C.1)
Where 𝛼𝛼 is the regression constant. The independent variables contain both airport-related and other socio-economic control variables which are not related to the airport. 𝛽𝛽 and 𝛾𝛾 denote the vectors of the regression coefficients for these respective variable types. 𝑉𝑉𝑖𝑖 is a specific constant for airport 𝑇𝑇, which captures the effect of all time-invariant factors influencing the economy around the respective airport.
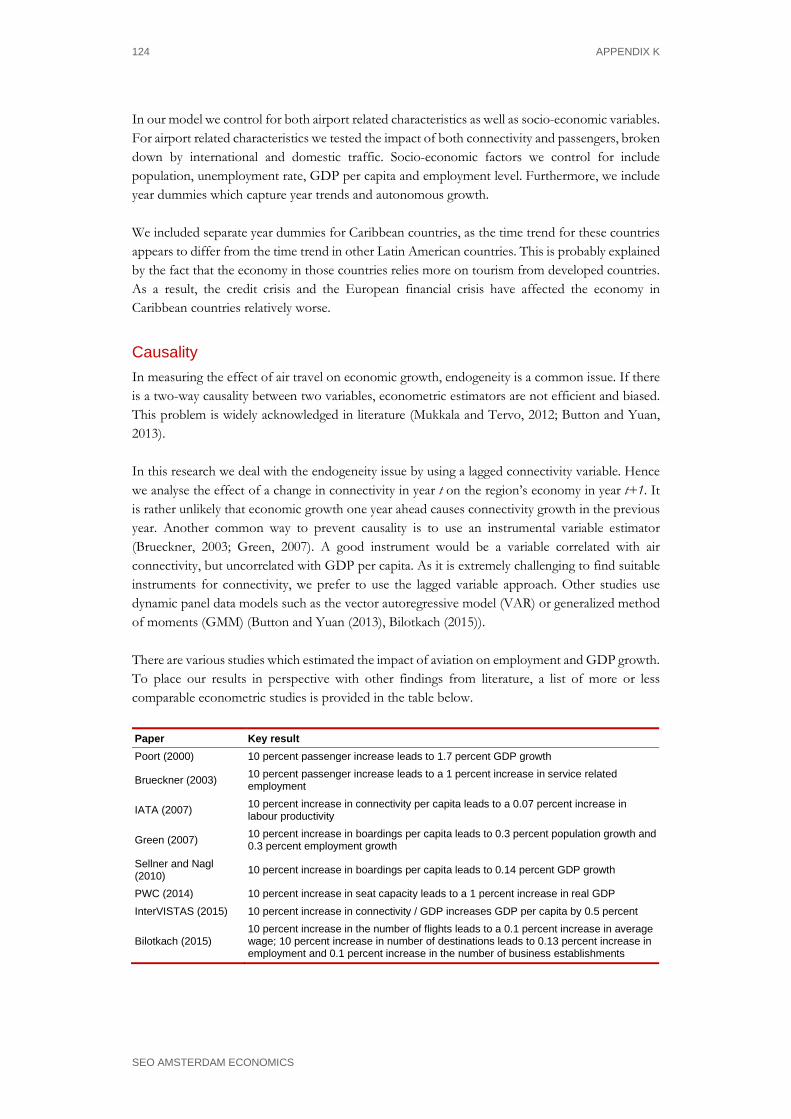
124 APPENDIX K
SEO AMSTERDAM ECONOMICS
In our model we control for both airport related characteristics as well as socio-economic variables. For airport related characteristics we tested the impact of both connectivity and passengers, broken down by international and domestic traffic. Socio-economic factors we control for include population, unemployment rate, GDP per capita and employment level. Furthermore, we include year dummies which capture year trends and autonomous growth. We included separate year dummies for Caribbean countries, as the time trend for these countries appears to differ from the time trend in other Latin American countries. This is probably explained by the fact that the economy in those countries relies more on tourism from developed countries. As a result, the credit crisis and the European financial crisis have affected the economy in Caribbean countries relatively worse.
Causality In measuring the effect of air travel on economic growth, endogeneity is a common issue. If there is a two-way causality between two variables, econometric estimators are not efficient and biased. This problem is widely acknowledged in literature (Mukkala and Tervo, 2012; Button and Yuan, 2013). In this research we deal with the endogeneity issue by using a lagged connectivity variable. Hence we analyse the effect of a change in connectivity in year t on the region’s economy in year t+1. It is rather unlikely that economic growth one year ahead causes connectivity growth in the previous year. Another common way to prevent causality is to use an instrumental variable estimator (Brueckner, 2003; Green, 2007). A good instrument would be a variable correlated with air connectivity, but uncorrelated with GDP per capita. As it is extremely challenging to find suitable instruments for connectivity, we prefer to use the lagged variable approach. Other studies use dynamic panel data models such as the vector autoregressive model (VAR) or generalized method of moments (GMM) (Button and Yuan (2013), Bilotkach (2015)). There are various studies which estimated the impact of aviation on employment and GDP growth. To place our results in perspective with other findings from literature, a list of more or less comparable econometric studies is provided in the table below. Paper Key result Poort (2000) 10 percent passenger increase leads to 1.7 percent GDP growth
Brueckner (2003) 10 percent passenger increase leads to a 1 percent increase in service related employment
IATA (2007) 10 percent increase in connectivity per capita leads to a 0.07 percent increase in labour productivity
Green (2007) 10 percent increase in boardings per capita leads to 0.3 percent population growth and 0.3 percent employment growth
Sellner and Nagl (2010) 10 percent increase in boardings per capita leads to 0.14 percent GDP growth
PWC (2014) 10 percent increase in seat capacity leads to a 1 percent increase in real GDP InterVISTAS (2015) 10 percent increase in connectivity / GDP increases GDP per capita by 0.5 percent
Bilotkach (2015) 10 percent increase in the number of flights leads to a 0.1 percent increase in average wage; 10 percent increase in number of destinations leads to 0.13 percent increase in employment and 0.1 percent increase in the number of business establishments

REGRESSION RESULTS 125
SEO AMSTERDAM ECONOMICS
Results Table K.1 shows the regression results of connectivity on GDP and employment. Our results indicate that a 10 percent increase in international connectivity leads to a 1.33 percent increase in total GDP and a 0.28 percent increase in net employment. These results are in the same order of magnitude as the studies mentioned above. Interestingly, international connectivity yielded more robust and statistically significant results than using total connectivity as a dependent variable. In the models used in this study we included international and domestic connectivity separately in the regression. The coefficients for domestic connectivity are insignificant, while there is a strongly significant and positive correspondence between international connectivity and GDP/employment. As control variables for the regression of connectivity on GDP we used the unemployment rate, population and international trade (imports). As expected, changes in the unemployment rate have strong significant impact on GDP growth. The effect of population growth on GDP growth is insignificant. At country level population growth is mostly caused by births, which do not directly impact productivity or economic growth. Level of trade has a strong impact on GDP. Surprisingly the value of import shows a more significant correspondence than the value of exports or total trade value. This might be explained by the fact that a large share of exports is formed by products from the primary sectors, which might be more dependent on other factors such as weather conditions. The year effects for Caribbean countries support the hypothesis that countries in this region have been affected more strongly by the European financial crisis. The coefficients are negative and significant in the years 2009, 2010 and 2011, indicating that the GDP growth was relatively lower in Caribbean countries in these years. For employment these effects are not pronounced into significant effects for the year dummies.

126 APPENDIX K
SEO AMSTERDAM ECONOMICS
Table K.1 Macro-economic impacts
GDP Employment
Aviation variables (1 year lag)
Direct cnx (international) (log; t-1) 0.1332** 0.0278**
Direct cnx (domestic) (log; t-1) -0.0135 -0.0004
Control variables
Unemployment rate -0.0256***
Population (log) -1.0719 1.1145***
Trade (value of imports; log) 0.3539*** 0.0314**
GDP per capita (log) 0.0033
year effects (2002 = reference)
2003 0.0510* -0.0001
2004 0.1061* 0.0103
2005 0.1536* 0.0199
2006 0.2786** 0.0272*
2007 0.3617** 0.0410**
2008 0.4303** 0.0425*
2009 0.5498*** 0.0492**
2010 0.6309*** 0.0531*
2011 0.6633*** 0.0555*
2012 0.7102** 0.0604*
year dummies x Caribbean countries
car_2003 -0.0638 0.008
car_2004 -0.0813 0.0069
car_2005 -0.0212 0.0074
car_2006 -0.1146 0.0157
car_2007 -0.1204 0.0121
car_2008 -0.1678 0.0133
car_2009 -0.1858* 0.0082
car_2010 -0.2458** 0.0011
car_2011 -0.2706** -0.0061
car_2012 -0.2584* -0.0087
Constant 31.8857* -3.6108*
Number of observations 297 297
Number of countries 27 27
R² (within) 0.9343 0.9496
Legend: * : p < 0.1; ** : p < 0.05; *** : p < 0.01 Source: SEO analysis
Table K.2 shows the regression results estimating the impacts of connectivity on FDI, R&D expenditure and tourism. Only for tourism a strongly significant and positive relationship was found: a 10 percent increase in international connectivity leads to a 3.5 percent increase in the number of inbound tourists. No significant correspondence could be found between connectivity growth and the level of inward foreign direct investments as a share of GDP. In fact, no significance was found for any of the dependent variables. This means that impacts of macro-economic developments on inward

REGRESSION RESULTS 127
SEO AMSTERDAM ECONOMICS
FDI strongly differ between different Latin American countries. Possibly inward FDI is more influenced by economic development in the creditor’s country than in the country they want to invest. The impact of connectivity on R&D expenditure does not show a convincing positive correspondence either. Although at the 10 percent confidence level a positive relationship is found between domestic connectivity and R&D expenditure, the sign and magnitude of the coefficient for international connectivity casts too much doubt to base conclusions on these results. If total domestic and international connectivity is used as an independent variable instead, no significant relationship is found. It is possible that the low number of available data points increases the difficulty in finding statistically significant relationships. Not surprisingly a strongly positive impact was found for international connectivity growth on tourism. A 10 percent increase in international connectivity yields a 2.2 percent increase in the number of tourists. Many countries in Latin America and the Caribbean in particular are important tourist destinations. An increase in connectivity leads to shorter travel times, increasing the attractiveness of the country as a tourist destination. In addition, ticket prices might decrease as a result of increased connectivity due to a higher supply of seat capacity or an increase in competition.
Table K.2 Wider catalytic impacts
Inward FDI R&D expenditure Tourism
Direct cnx (international) (log; t-1) -0.5762 -0.0729 0.2230***
Direct cnx (domestic) (log; t-1) -0.0246 0.0241* -0.0474**
Population (log) -0.0779 0.8522 3.3270***
Unemployment rate 0.0562 0.0109 0.0058
GDP per capita (log) -0.9857 0.2268*** 0.1013
year effects
2003 -0.2766 -0.0242 0.0538*
2004 0.6825 -0.0529* 0.1222***
2005 1.6175 -0.0798* 0.1767***
2006 2.1432 -0.1366** 0.1781**
2007 2.57 -0.1671** 0.2032**
2008 3.429 -0.1581** 0.1406
2009 1.4442 -0.1513** 0.1605**
2010 1.9108 -0.1879** 0.1701*
2011 2.8738 -0.2432** 0.1816*
2012 3.4395 -0.2499*** 0.2006*
Constant 14.6854 -15.269 -46.9086***
N 286 138 308
Number of countries 26 20 28
R² (within) 0.1754 0.3001 0.7218
Legend: * : p < 0.1; ** : p < 0.05; *** : p < 0.01 Source: SEO analysis