ECONOMIC AND SOCIAL RESEARCH … AND SOCIAL RESEARCH FOUNDATION (ESRF) Potential Impacts of FDI on...
26
ECONOMIC AND SOCIAL RESEARCH FOUNDATION (ESRF) Potential Impacts of FDI on Economic Development in Tanzania Prepared by: Mr. George Kabelwa Email: [email protected] A paper prepared for a Policy Dialogue for Accelerating Growth and Poverty Reduction in Tanzania, held at the Conference Hall, ESRF, on May 25 th , 2006
Transcript of ECONOMIC AND SOCIAL RESEARCH … AND SOCIAL RESEARCH FOUNDATION (ESRF) Potential Impacts of FDI on...

ECONOMIC AND SOCIAL RESEARCH FOUNDATION (ESRF)
Potential Impacts of FDI on Economic Development in Tanzania
Prepared by:
Mr. George Kabelwa Email: [email protected]
A paper prepared for a Policy Dialogue for Accelerating Growth and Poverty Reduction in Tanzania, held at the Conference Hall, ESRF, on
May 25th, 2006

1
1. INTRODUCTION ________________________________________________________________________
1.1. Background of the Study
Over the past decade there has been a renewed interest in the globalization process. This reflected into the emergence of new forces of globalization. One of recently identified important forces of globalization has been private foreign direct investment (FDI)1. FDI inflows in the past decade have increased significantly worldwide. For example, in 2000 global private FDI inflows reached US$1.1 trillion compared to US$159 billion in 1991 (Bora, B., 2002)2. Compared to international trade in goods and services, in 2002, the world stock of FDI generated sales by foreign affiliates of an estimated $18 trillion, against world exports of $8 trillion (World Investment Report, 2003).
This rapid growth and performance of FDI has generated a number of policy issues regarding benefits and costs to the economies of both home and host countries. At the macroeconomic level, FDI is believed to bring new capital for investment, contributing to the balance of payments, adding to the country’s capital stock, and potentially adding to future economic growth. FDI is also cited as a more stable type of capital flow, and thus is arguably more appropriate and development-friendly for low-income countries than portfolio flows. There is also some evidence that foreign investment can contribute to raising exports and integrating into global economic networks. At the microeconomic level there are also a range of purported benefits, especially higher productivity through new investment in physical and human capital, increased employment, enhanced management, and the transfer of technology. Foreign investment also is thought to have important spillover effects on local firms through supply and distribution chains, trading, and outsourcing (see among many, e.g., Blomström and Kokko, 1997 and 1998; Markusen and Venables, 1997). However, there are various costs associated with FDI as well. Among the costs include those related to countries competing for FDI; market failures in the investment process and the possible divergences between foreign companies and national interests. For example, promotion of FDI has been very expensive as developing countries often make major concessions in terms of special incentives to foreign investors in order to compete for foreign investment with other countries. These incentives include among others lower income taxes or income tax holidays, import duty exemptions, and subsidies for infrastructure. Market failures such as information and coordination failures in the international investment process; infant industry considerations in the development of local enterprises, which can lead inward FDI to crowd out these enterprises; static nature of advantages transferred by FDI where domestic capabilities are low and do not improve
1 Foreign direct investment is net inflows of investment to acquire a lasting management interest (10 percent or more of voting stock) in an enterprise operating in an economy other than that of the investor. It is the sum of equity capital, reinvestment of earnings, other long-term capital, and short-term capital as shown in the balance of payments. 2 However, for three consecutive years that followed, the global FDI flows declined and reached US$ 560 billion in 2003 – the lowest figure since 1998. The main reason was the decline in FDI flows to developed countries (World Investment Report, 2004).
2
over time, or where FDI is not sufficient enough to raise the relevant capabilities; and weak bargaining and regulatory capabilities on the part of host government, resulting in the unequal distribution of benefits or abuse of market power by the foreign companies, are also a major concern for developing countries. It is noteworthy that the complexity of the FDI package also means that there may be trade-offs between different benefits and objectives. For instance, countries may have to choose between investments that offer short as opposed to long-term benefits; the former may lead to static gains but not necessarily to dynamic ones. A large inflow of FDI can add to foreign exchange and investment resources in a host economy, but it may lead to a crowding out of local firms or create exchange rate problems. The desire to generate employment may lead governments to favor labor-intensive, low-technology investments, while that to promote technology development may favor more sophisticated investors. Similarly, the desire to upgrade technology may call for heavy reliance on technology transfer by the foreign firms, while the desire to promote local innovation and deepening may require more emphases on arm’s length transfers to indigenous firms. There can be many such trade-offs, and there is no universal answer to how they should be made. As noted, there is no ‘ideal’ policy on FDI that applies to all countries at all times. 1.2. Objective of the Study The overall objective of this paper is to raise public awareness on the potential impacts of FDI on economic development in Tanzania, particularly its implications to the ongoing efforts to poverty reduction. Specifically, the purpose of the paper is to stimulate discussion by investigating the following key questions:
• Whether the distribution of FDI in the economy by sector, region and country of origin can provide any policy challenge to the government
• Whether FDI has impacted on to the Tanzania’s economic development through such variables like capital formation, employment generation, international trade, technology transfer, fiscal revenue etc;
• What policy challenges will make FDI work for the Tanzania’s economic development
1.3. Methodology of the Study Due to the fact that economic effects of FDI are very difficult, if not impossible, to measure accurately and FDI represents a complex package of attributes that vary over time and from one host country to another, the analysis of the effects of FDI has resorted to one of two general approaches. The first is econometric analysis of the relationships between inward FDI and various measures of economic performance. The second is a qualitative analysis of particular aspects of FDI contribution. This study adopts the latter approach. Data collection involved in-depth review of secondary information in the form of academic articles, grey material, press coverage and outputs from other applied research processes and government statistics.

3
1.4. Organization of the Study After the introduction in Section 1, the remainder of this paper is structured as follows: Section 2 of the paper presents a discussion on the performance of FDI in the Tanzania’s economy since independence and on how the distribution of FDI has been in support of the Tanzania’s economic interests. Section 3 addresses the potential impacts of FDI on economic development. In this section various contributions of FDI in the Tanzania’s economic development, such as the contribution of FDI in capital formation, employment, international trade, technology transfer, and government revenue are discussed. Section 3 discusses policy challenges that will make FDI work for Tanzania’s economic development. Finally, section 5 presents a summary of key conclusions.

4
2. OVERVIEW OF FDI PERFORMANCE AND ITS IMPLICATIONS ON ECONOMIC DEVELOPMENT
________________________________________________________________________ 2.1. Historical Overview of FDI Performance FDI Performance Prior to Reforms
When Tanzania attained independence in 1961, political power was restored but like many other African countries during these periods, the command of the economy remained in the hands of foreign and a few Tanzanian investors. This became a source of differences in political opinions and dissatisfaction that eventually gave the post-independence government the impetus to announce the Arusha Declaration in 1967. The Declaration was an important strategy to ensure that Tanzanian investors would be able to take command of the economy. With the Declaration, the Government of Tanzania arrogated to itself an extensive role in the economy and began the imposition of a wide range of economic control. The most important mechanisms were:
• Central control of investment planning with restrictive codes on private and foreign investment.
• Administrative allocation of foreign exchange through import licensing. • Price controls administered by the National Price Commission. • Regulated/ controlled interest rates and credit rationing according to the annual
financial plan. • Restrictions on wholesale trade for some import and domestic commodities to
specific parastatal organizations.
With the Arusha Declaration, the government enacted a number of acts and directives that directly or indirectly discouraged the development of the private (both foreign and domestic) investment. Among other things these acts nationalized the "commanding heights" of the economy, prohibited private ownership of small industrial enterprises in villages and cracked down on "economic saboteurs" (entrepreneurs who had started small-scale enterprises in the face of the prohibitions). The result was an institutional and policy environment that was hostile (or at least ambiguous) toward the private sector.
As a result of this policy environment, Tanzania during the pre-reforms period attracted very little FDI as compared to the neighbouring countries like Kenya. For example during this period, FDI inflows in Tanzania averaged about USD4.4 million as compared to the Kenya’s USD 32 million. In fact, among the three East African countries Kenya had an established role as the leading destination of FDI before 1990 because of her non-restrictive policies towards the foreign investors. From 1970 until 1990 the East African countries received some USD757 million of total inflows, 90 percent of which went to Kenya, nearly 10 percent went to Tanzania, while Uganda hardly received any at all (UNCTAD, 2002). The policies towards public investment however proved a failure as many state controlled investments following a recognition of the fact that the state owned enterprises were becoming an unbearable burden to the government which, at the same time did not have enough resources to continue running them.

5
Figure 1: Trend of FDI Inflows in Tanzania and Kenya During 1970-90 Period
-20
0
20
40
60
80
100
1970
1972
1974
1976
1978
1980
1982
1984
1986
1988
1990
Year
Mill
ion
USD
Kenya United Republic of Tanzania
Source: UNCTAD, Geneva
FDI Performance during the Reforms Period Because of poor performance of the economy in the early 1980s, the Government adopted the Economic Recovery Program (ERP), which called for the deliberate and systematic removal of regulatory controls, structures and operational guidelines in the administration and pricing systems in the economy. Thus the ERP policy package was bound to have an impact on private investment. The package aimed at improving the balance of payments; reduce inflation, and improve fiscal and monetary policies supplemented by a real devaluation. As a result Tanzania has of recent provided a unique investments climate with sound macroeconomic fundamentals. This positive trend of economic stability provides confidence to foreign investors who are in a better position to predict future returns of their investments and who in turn bring in the required technological capability important for economic development takeoff. This is also the case on the side of the Government as more investment leads to improved economic growth. The introduction of the first market-oriented investment code in June 1990 was a deliberate effort to attract both local and foreign private investors by opening up the economy. Due to a poor response in investment from the private investors in the early 1990s, the Government amended the code in 1997, when the more modernized Tanzania Investment Act 1997 was enacted shortly after the launching of the New Investment Policy of Tanzania in 1996. The Tanzania Investment Act 1997 provides the basic investment framework for Tanzania, with new and modern legislations reflecting the world economic conditions in general and Tanzania’s conditions in particular.

6
As a result of these commendable government efforts FDI inflows in the country rose from USD 12 million in 1992 to USD 260.2 million in 2004 after reaching a peak of USD 516.7 million in 1999 (See Table 1 below). The upsurge was attributable to changes in both domestic as well as foreign economic environment and the adoption of a more dynamic and pragmatic approach appropriate for FDI attraction. The acceleration of inflows between 1992 and 1999 improved considerably Tanzania’s FDI performance relative to that of other countries, including neighboring countries with which Tanzania may compete for certain kinds of FDI. Its share of FDI inflows into least developed countries (LDCs) doubled from 2.7 percent in 1991-1995 to 5.3 percent in 1996-1999 and the share of inflows into sub-Saharan Africa more than doubled, from 1.5 to 3.3 percent in the same period. After 1999, although growing in absolute terms, inflows into Tanzania started declining as the country lost some of the position it achieved in the mid-1990s. A major contributing factor that has accelerated the flow of FDI into Tanzania has been the remarkable performance of the Tanzania Investment Centre. As a predecessor of the Investment Promotion Centre (IPC) that had performed as regulatory agency, the TIC has within a short period transformed itself to a modern investment facilitation centre that operates as an efficient one stop shop for investors. Through the TIC the government has managed to create an investor friendly environment that has greatly overcome many of the constraints that existed in 1996. Tanzania has put in place a number of proactive measures to facilitate the business that foreign investors undertake in the country. These include the promotion efforts and investment incentives of foreign direct investors, reducing corruption and improving administrative efficiency, after-investment services and the provision of social amenities. The business environment for foreign investors has been improved through initiatives such as the reduction in bureaucratic “red tape” and state interference in private business, improvement in investment facilitation and the establishment of investment promotion agencies. The government's privatization programme since the nineties has also been a contributing factor to increased interest from foreign investors. The government's trade liberalization policy and relaxation of control over foreign exchange transactions was reinforced by legislative reform through the Public Corporations Act, 1992 (PCA), which aimed to promote the private sector in the economy as well as encourage Tanzanians to own businesses in privatized state-owned enterprises.
Table 1: FDI Inflows in Tanzania, 1990 – 2004
Year 1992 1993 1994 1995 1996 1997 1998 1999 2000 2001 2002 2003 2004
USD Million
12 20 50 150 148.5 157.8 172.2 516.7 463.4 327.4 240.4 247.8 260.2
Source: Economic Survey (Various Issues)

7
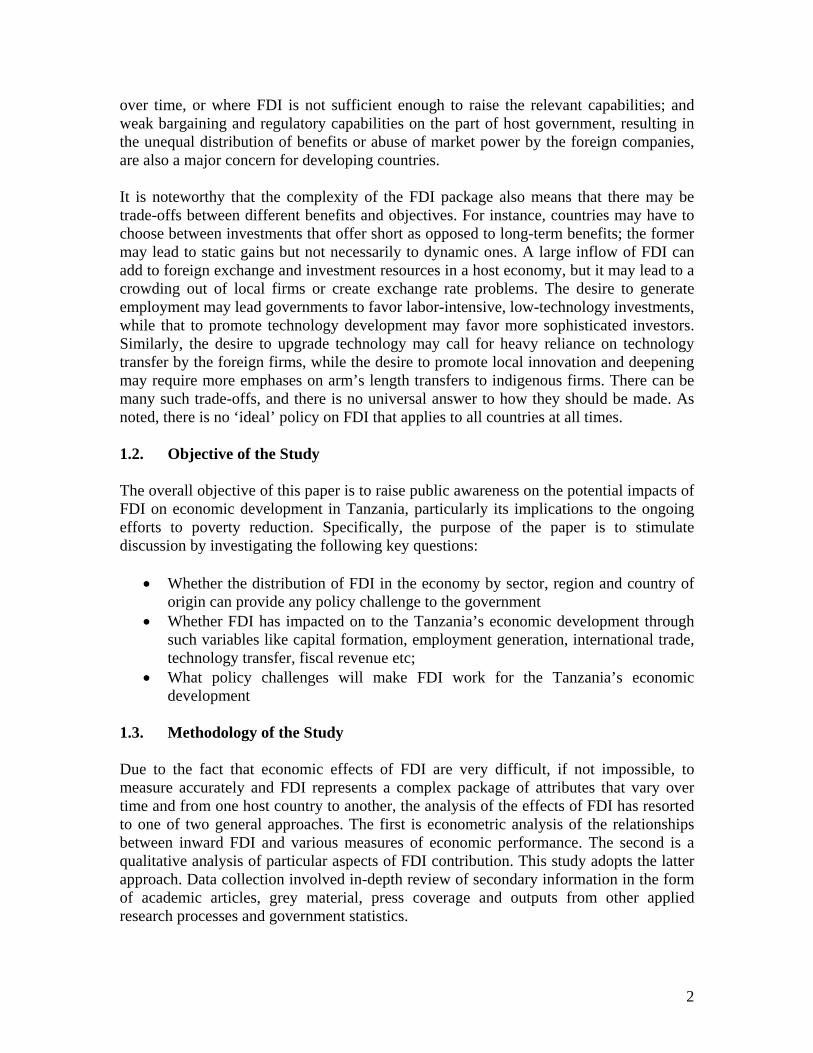
2.2. Distribution of FDI in the Tanzania’s Economy Due to the difficulties of estimating FDI, there is no recent data on FDI. The latest investment report published by the Bank of Tanzania in collaboration with Tanzania Investment Center and Bureau of Statistic (i.e., Tanzania Investment Report, 2004) has the latest data on FDI ending in the year 2001. In order to obtain the realistic picture of FDI distribution this paper relies on FDI stock rather than FDI flows due to high fluctuations characterizing the FDI flows. According to the Tanzania Investment Report (2004), FDI holds the largest share of the foreign private capital flows, which also include foreign portfolio investment and long and short term loans. In 2001, for example FDI stock contributed about 88.6 percent of foreign private capital stock. This shows that FDI is an important foreign investment in the Tanzania’s economy. As regards FDI components, direct equity investment forms an important component of FDI in Tanzania contributing about 76.3 percent of FDI stock in 2001. Sectoral Distribution of FDI The largest sector for FDI is believed to be the manufacturing sector with about 33.5 percent of total FDI stock by 2001, while the second largest sector for FDI is believed to be mining with about 28 percent of total FDI stock by the same year. Much of the FDI in the manufacturing sector went to food and beverages, while in the mining sector, the largest single sub-sector in terms of FDI has been the gold mining industry. Tanzania’s ability to attract mineral explorations and investment has been highly dependent on the country’s abundance of mineral resources. However, during 1990s this was boosted by the revised, investor-friendly investment and mining code introduced in 1998, which was well received by international investors. There has been a dramatic growth in the mining sector since the 1990s. In 1998, Tanzania was the leading country in Africa in terms of the number of exploration activities above traditional mining countries of South Africa and Ghana. While there is a high concentration of FDI into the manufacturing and mining sector, it should be noted that agriculture is the backbone of the Tanzania’s economy contributing about 50 percent of Gross Domestic Product (GDP). However, the sector contributes only about 6.7 percent of the total FDI stock. This is a challenge for the government to attract foreign investors who may have competitive advantage in the sector. Tanzania can attract foreign investors in the following areas: cattle breeding, fruit production and canning, fruit juice production, flower production, cattle and game ranches and timber production. Attraction of FDI in the agro-processing industries can also be a key in the development of the agriculture sector. The government has made commendable efforts to pursue macroeconomic policies that will motivate investment in agriculture by small and large-scale commercial farmers through creation of enabling environment and provision of proactive support to private
8
operators, farmers organizations and other stakeholders and by ensuring a strong regulatory mechanism. There have been substantial improvements in road infrastructure through TANROADS whereby roads connecting major regional centers and to neighboring countries have been improved to tarmac level. Also TIC in collaboration with the Ministry of Lands and Human Settlement Development has been mandated to establish land bank for investors. In this regard, 4.0 million acres of land have been identified and modalities for ownership are underway. The Land (Amendment) Act (2004) has also been amended to allow land to be used as capital for investment.
Figure 2: Sectoral Distribution of FDI Stock, 2001 (percent)
Transport & Storage, 1.2 Communication,
6.3
Real estate and other business
services, 1.2
Trade, 2.5
Finance & Insurance, 4.8
Community, social and other
personal services, 1.7
Tourism, Accommodation & Catering, 8.1
Agriculture, 6.7
Utilities, 3.4Construction, 2.7
Manufacturing, 33.5
Mining, 28
Source: Tanzania Investment Report, 2004
Regional Distribution of FDI Figure 3 below shows that FDI stock is concentrated in the Dar es Salaam region with about 49.5 percent of FDI stock by 2001. Most of foreign investments are located in Dar es Salaam simply because it is the country’s business and financial hub, and has a relatively well-developed infrastructure that supports a wide range of economic activities. Mwanza and Shinyanga regions are also among top recipients of FDI mainly because they are endowed with abundant natural resources, especially minerals. In addition, Mwanza has the biggest fishing industries and resources which have attracted foreign investors. Arusha has also attracted substantial amount of FDI flows due to its commercial and tourist activities. The region’s favorable weather has created an added advantage for a wide variety of agricultural activities. However, with this kind of distribution, a very small section of the country has benefited directly from the improved performance of FDI inflows. There is need for the government to earmark potential areas of investment and improve social and economic infrastructure in the regions with less FDI inflows.

9
Figure 3: Regional Distribution of FDI Flows, 2001
Iringa, 1.7Others, 3.4
Morogoro, 4.5
Arusha, 9.4
Shinyanga, 12.7Mwanza, 14.2
Zanzibar, 4.6
Dar es Salaam, 49.5
Source: Tanzania Investment Report, 2004
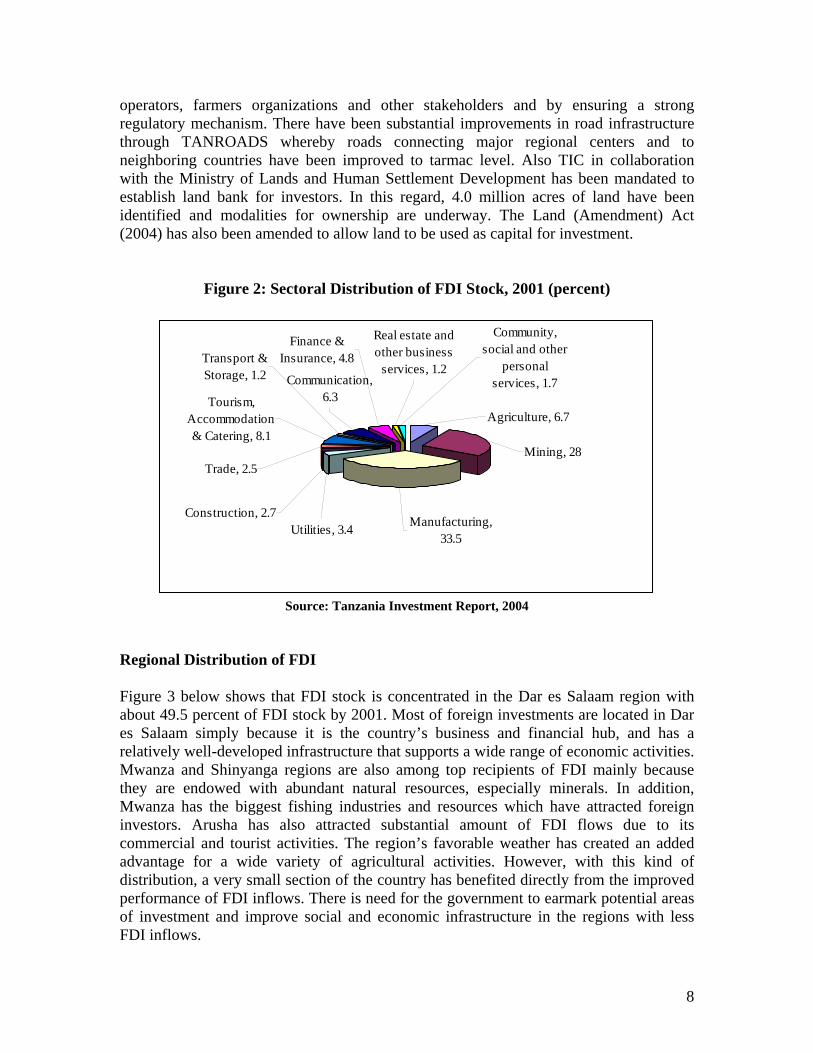
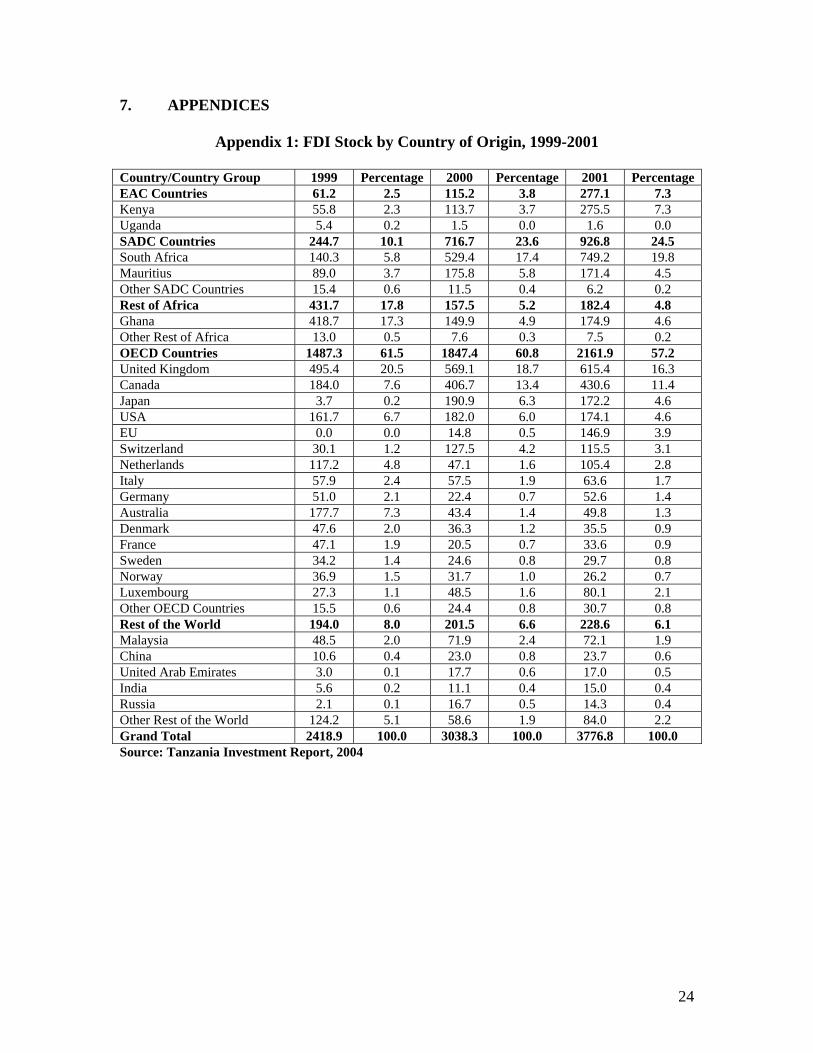
FDI Distribution by Regional Groupings and Country of Origin The distribution of FDI stock by regional groupings shows that OECD countries were dominant with about 57.2 percent of total FDI stock in the country by 2001. However, much of this FDI stock from the OECD countries originated from the United Kingdom and Canada. SADC countries were the second largest registering about 24.5 percent of total FDI stock by 2001. Almost three-quarters of the FDI originating from the SADC countries come from South Africa. This is mainly because of the surge of the South African investment into Tanzania in 2000 and 2001 especially in the mining, manufacturing and telecommunication sectors. FDI from the East African region rank third with about 7.3 percent of FDI stock, mostly coming from Kenya. As far as the rest of Africa is concerned another African country with a significant stock of FDI in Tanzania is Ghana, with about 4.6 percent of total FDI stock. However, unlike other top African countries in terms of FDI in Tanzania, investment from Ghana is characterized by a single investment, i.e., M/S Ashanti Goldfields. Note also that investment especially from Kenya and South Africa reflects investment overflows from other countries or multinational companies.
10
Figure 4: FDI Stock by Regional Groupings, 2001
Rest of the World, 6.1
EAC Countries, 7.3
SADC Countries, 24.5
Rest of Africa, 4.8
OECD Countries, 57.2
Source: Tanzania Investment Report, 2004
11
3. POTENTIAL IMPACTS OF FDI IN TANZANIA’S ECONOMIC DEVELOPMENT
________________________________________________________________________ 3.1. How Does FDI Positively Impact the Host Country Economic Development Foreign direct investment comprises a bundle of assets some proprietary to the investor and other not. The proprietary assets are what are termed the ‘ownership advantages’ of foreign investors. These give foreign investors an edge over other firms (local and foreign) and allow them to overcome the transactions costs of operating across national boundaries. The non-proprietary assets – finance, capital goods, intermediate inputs and the like- can be obtained from the market by any firm, though large foreign companies may have privileged access to some markets. Proprietary assets reside in the firms that create them. They can be copied or reproduced by others, but the cost can be very high (particularly in developing countries and where advanced technologies are involved). Foreign firms are reluctant to sell their most valuable proprietary assets to unrelated firms that can become competitors or ‘leak’ them to others. These advantages mean that foreign firms can provide assets to host developing countries that other firms cannot – if the host country can induce them to transfer their advantages in appropriate forms. The assets FDI comprises are: Capital. FDI brings in investible financial resources to capital scarce countries. The inflows are more stable, and are easier to service, than commercial debt or portfolio investment. In distinction to other sources of capital, foreign companies invest in long-term projects, taking risks and repatriating profits only when the projects yield returns. Technology. Developing countries tend to lag in the use of technology. Many of the technologies deployed even in mature industries may be outdated. More importantly, the efficiency with which they use given technologies is often relatively low. Even if part of their productivity gap is compensated for by lower wages, technical inefficiency and obsolescence affect the quality of their products and handicap their ability to cope with new market demands. Foreign companies can bring modern technologies (many not available without FDI) and raise the efficiency with which technologies are used. They adapt technologies to local conditions, drawing on their experiences in other developing countries. They may, in some cases, set up local R&D facilities. They can upgrade technologies as innovations emerge and consumption patterns change. They can stimulate technical efficiency in local firms, both suppliers and competitors by providing assistance, acting as role models and intensifying competition. Skills and management. Foreign companies possess advanced skills and can transfer these to host countries by bringing in experts and by setting up training facilities (the need for training in often not recognize by local firms). They also possess new, presumably among the best management techniques, whose transfer to host countries offers enormous competitive benefits. Where affiliates are integrated into foreign
12
companies’ networks, they can develop capabilities to service the regional or global system in specific tasks or products. Market access. Foreign companies can provide access to export markets, both for existing activities (that switch from domestic to international markets) and for new activities. More important is the fact that they are by definition the only way to enter the international production systems that increasingly dominate trade in sophisticated and high-tech products. Exports activity in turn offers many important benefits: technical information, realization of scale economies, competitive stimulus and market intelligence. Environment. Foreign companies often possess advance environmental technologies and can use them in all countries in which they operated. Competition. Foreign companies can improve competition. This can increase the welfare of consumers through the improvement of product quality, the availability of additional products in the market, the expansion of the product market and reduced prices of products. However, small producers in the host countries may suffer if they fail to cope with the competitive prices. In this case, foreign companies can crowd out local investors. Employment Generation. Foreign companies can become important employers through the generation of new jobs in their new projects (i.e., Greenfield investment). However, one expected outcome of privatisation is the rationalisation of work force of the previous parastatals. Therefore, the net employment effect of foreign investment to a particular economy has to be analysed with some care. Revenue. Foreign companies may also contribute to fiscal revenue through their operation. For the foreign companies involved in the acquisition of the former state-owned companies through the privatization process they can, for example, generate a lot of revenue through the sale of the privatized companies. However, on the other hand the revenue impact is still ambiguous as the governments lose a lot of revenue through fiscal incentives extended to the foreign companies. 3.2. Some Case Experiences of the Impact of FDI on the Tanzania’s Economic
Development Capital Formation: In Tanzania FDI has significantly contributed to capital formation despite the fact the large share of capital formation is held by the domestic investment. Using the official statistics, between 1999 and 2004, FDI averaged about 5 percent of GDP. Its contribution to the Gross Fixed Capital Formation (GFCF) averaged about 25.7 during the same period.
Technology: Technology from FDI generally may take the following forms: (a) technology-embodying products such as machinery, equipment and tools; (b) technical skills such as management and organizational expertise, marketing, quality control and other production related skills; and (c) process-related technologies such as proprietary. Note that, form (c) is very rare in Tanzania (UNCTAD, 2000). According to the

13
literature, there are four channels through which these packages of technology transferred by FDI can be diffused in the host country. These include: (a) FDI establishing linkages with domestic enterprises – as suppliers (backward linkage) or users (forward linkage).(b) skills transfer through training, learning-by-doing, learning-by-interacting, and job-mobility, (c) demonstration effects as local firms copy or adapt new technologies, market channels and management techniques introduced by foreign investors. This can take place in activities that involve processing or manufacturing and also services (d) strategic technology partnership between a foreign investor and a domestic partner in areas such as R&D; and know-how, design and technical specifications and R&D capability.
Tanzania Breweries can provide a good example of how an FDI can transfer technology through backward linkage. For example, with backward linkage the Tanzania Breweries initiated a comprehensive programme of local sourcing. In the context of this strategic development therefore, Tanzania Breweries identified a number of inputs to the production of beer that could be sourced locally from the primary inputs (barley) to other intermediate inputs in the packaging process. It is approximated that Tanzania’s Breweries sources about 30 percent of its barley requirement from domestic sources. For this purpose it has set up a maltings plant in Moshi to systemize the purchase of barley from over 500 farmers in the region. In 2000, approximately US$ 2.4 million were paid to farmers for the crop, representing the single largest source of direct income for farmers in the region. In the near future, TB plans to meet the entire barley requirement from local sources (increasing from 6,000 to 26,000 tones) through further investment in research and development of the crop to improve yields and deepening of the present linkages with the farming community.
Another important backward linkages established by TB is the sourcing of locally manufactured glass beer bottles. The supplier, KIOO Glass Ltd, an MNE affiliate, has established close technical collaboration with TB so as to meet production quality requirements38. Another supplier in Tanzania for TB is Carnaud Metal Box, manufacturer of metal crown corks. This supplier is also a long established foreign affiliate and was the first supplier to enter into a technical collaboration with TB after privatisation in 1993. In addition, TB sources plastic crates and shrink-to-fit packaging from Simba Plastics and is currently sourcing some of its bottle label requirements from Tanzania Printers, a local printing company (labels). TB has also established strong backward links with Showerlux Ltd, manufacturer of industrial chemicals. Around 36 per cent of TB’s inputs are sourced locally and plans are underway to increase this percentage to 50 per cent in the next 3 to 5 years (Portelli and Narula, 2004).
Demonstration effects – another channel of technology transfer – occur when local firms copy or adapt new technologies, market channels and management techniques introduced by foreign investors. This often happens to services and manufacturing companies. Companies with high market shares, such as the Tanzania Breweries, may lead to other small companies which do not want to lose business to be forced to copy these big companies’ management and marketing techniques. It is noteworthy that demonstration effects are often related to competition (Blomström, 1986).
Skills and management: Tanzania Cigarette Company (TCC) gives a good example of the importance to human resource training and development. For TCC, the human capital
14
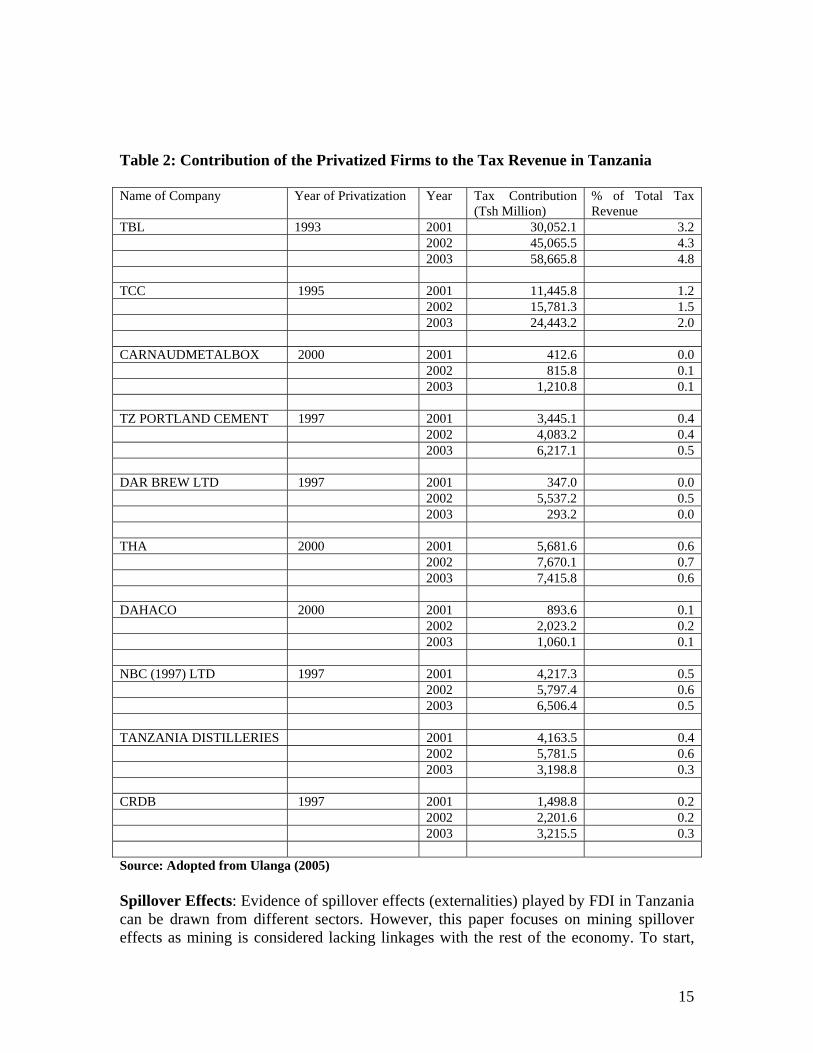
component was vital in the achieving various forms of upgrading and benefiting from the forms of technology transfer from the parent company. In the immediate aftermath of privatisation, staff complement downsizing was undertaken35. The workforce was reduced from 1300 (750 on the production floor) to 730 (300) over four years. The main downsizing was undertaken in the production floor, as a result of extensive automation of plant and equipment which led to a drastic decrease in manual jobs. There are only 3 expatriates in the company who are employed in key executive and technical roles. Locals are employed in key management positions (such as technical, administrative and sales and marketing positions) as a result of the extensive capabilities and host country experience they possess. TCC has now put in place extensive internal and external training programs. TCC is one of the main employers in the host country, and seeks and retains the best young graduates in Tanzania, providing them with career advancement opportunities as well as external training and secondments to other plants around the world. TCC set up an on-site training centre late 1997 to spearhead this strategy. The initial post-privatization training mainly focused on generic training to enhance employee awareness of organizational change, professionalism and life skills. Substantial changes to the work ethic inherited from parastatal period was required. The continuing training initiatives addressed employees’ individual development needs and increase effectiveness, particularly of those employees at the production floor without basic skills but who were deemed to be trainable. Other training programs have been aimed at broadening managers’ international exposure within the parent network and the training centre in St. Petersburg, Russia. For example, a system of secondment of TCC personnel to sister affiliates has picked momentum in recent years and a number of local personnel from middle management upwards have already benefited. These training programs are emphasized for the development of senior management, i.e. supervisory and technical staff. A threshold level of capability for production floor workers was important as the company has been modernizing its plant and equipment. For example, suppliers provide training on specific machinery prior to commissioning so that when the actual machinery is installed in the Dar es Salaam plant, it can be utilised immediately without undue work stoppages. Normally, employees short term ad-hoc training courses with direct relevance to on-the-job specific tasks. Revenue generation: Government revenue contribution is also very important for economic development. Table 2 below shows the contribution of 10 privatized industries (to foreign investors) in tax revenue in Tanzania between 2001 and 2003. According to the Table the privatized companies contributed about 6.7, 9.1 and 9.2 percent of total tax revenue in 2001, 2002 and 2003 respectively. However, there have been some policy conflicts between revenue generation and FDI attraction through tax incentives. Tax incentives can cost the government a lot of money. For example, if you consider the companies which have privatized in 2000, such as Carnaud Metal Box, and DAHACO, a three year tax holiday given to the companies, could have cost the country loss of about 0.2 and 0.4 percent of total tax revenue during the 2001-2003
15
Table 2: Contribution of the Privatized Firms to the Tax Revenue in Tanzania Name of Company Year of Privatization Year Tax Contribution
(Tsh Million) % of Total Tax Revenue
TBL 1993 2001 30,052.1 3.2 2002 45,065.5 4.3 2003 58,665.8 4.8 TCC 1995 2001 11,445.8 1.2 2002 15,781.3 1.5 2003 24,443.2 2.0 CARNAUDMETALBOX 2000 2001 412.6 0.0 2002 815.8 0.1 2003 1,210.8 0.1 TZ PORTLAND CEMENT 1997 2001 3,445.1 0.4 2002 4,083.2 0.4 2003 6,217.1 0.5 DAR BREW LTD 1997 2001 347.0 0.0 2002 5,537.2 0.5 2003 293.2 0.0 THA 2000 2001 5,681.6 0.6 2002 7,670.1 0.7 2003 7,415.8 0.6 DAHACO 2000 2001 893.6 0.1 2002 2,023.2 0.2 2003 1,060.1 0.1 NBC (1997) LTD 1997 2001 4,217.3 0.5 2002 5,797.4 0.6 2003 6,506.4 0.5 TANZANIA DISTILLERIES 2001 4,163.5 0.4 2002 5,781.5 0.6 2003 3,198.8 0.3 CRDB 1997 2001 1,498.8 0.2 2002 2,201.6 0.2 2003 3,215.5 0.3 Source: Adopted from Ulanga (2005) Spillover Effects: Evidence of spillover effects (externalities) played by FDI in Tanzania can be drawn from different sectors. However, this paper focuses on mining spillover effects as mining is considered lacking linkages with the rest of the economy. To start,

16
the Kahama Mining Corporation Ltd (KMCL) at Bulyanhulu made it possible for people living around the area to reap some social and economical benefits. For example, KMCL initiated a USD 5.48 million housing loan scheme to construct over 800 modern houses at subsidized costs in Bulyanhulu ward. According to KMCL, the scheme will change the bad housing situation in the area. This scheme follows a water supply project through a 47km long pipeline and a 130km extension of the national grid from Shinyanga to the mine. The mine needs only a quarter of the 150 MVA per year. The rest is made available for the surrounding community’s domestic and economic use. A USD3.4 million water project avils clean water throughout the day to over 30,000 people in the surrounding villages. According to KMCL, agricultural and small/micro business development, roads, schools and clinics have also received substantial attention and resources from the company. The Ashanti Gold Mining Company (AGMC) has also produced some positive externalities in Tanzania. The company has used about 1.6 billion shillings for various development projects in Geita district, Mwanza region since it started operation in the area in 2000. For example it has completed upgrading a 76-kilometre road. It has financed the construction of water wells; the building of dispensaries, the rehabilitation of the designated district hospital, as well as building a dozen of classroom in six primary schools. Geita Gold Mine (GGM) has produced similar externalities to AGMC in Geita District. GGM donated computers with hi-tech software to the University of Dar es Salaam’s Geology Department, and supported orphans of AIDS victims. The Equal Opportunities Trust Fund has benefited from the mine’s philanthropy with 16 million shillings. It has also established a micro-finance credit scheme with financing base of 40 million shillings. GGM has contracted most of its jobs to local companies, with over 90 local firms regularly doing business with the company in different operation.
17
4. FDI PROMOTION AND TANZANIA’S ECONOMIC DEVELOPMENT ________________________________________________________________________ According to te Velde (2002), there are 10 policy challenges that offer sufficient or even necessary guidelines for Sub-Saharan African countries wanting to attract FDI. Rather, it is a checklist for those countries in need of appropriate policies to make FDI work for development. This study reflects on these 10 policy challenges for the case of Tanzania. The ten policy challenges to make FDI work for development include 1. Determine whether and how FDI fits in with development objectives 2. Think in terms of quality, not quantity 3. Prepare well 4. Reduce conflict and corruption 5. Provide appropriate infrastructure and appropriate skills 6. Implement FDI policies consistently and actively 7. Understand the pros and cons of international investment agreements 8. Facilitate trade 9. Provide a transparent and appropriate incentive and regulatory framework 10. Promote linkages within available means 1. Determine whether and how FDI fits in with development objectives FDI is not a solution to all development problems. However, in order to find solutions to development issues, it is important to realize that FDI is different from local investment, external aid flows, or portfolio inflows. The existence of such differences requires that a country examines how FDI fits in with development objectives. For instance, while FDI can lead to capital intensive projects that embody state-of-the-art technology with regards to the extraction of resources, FDI in the garments and textiles industry is likely to lead to employment intensive, but technologically less-advanced production processes. Tanzania has categorized various sectors for investment promotion into priority and lead sectors. It is therefore interesting to know whether there are no policy conflicts. 2. Think in terms of quality, not quantity According to UNCTAD, Africa, (excluding South Africa), has been marginalized’ in the global economy in terms of FDI performance. However, there are various reasons why a low share in total FDI flows should be of little concern to policy makers. For instance, the stock of FDI (accumulated inflows), which is arguably a better measure of the ‘port to new ideas and technologies’ than flows, scaled by the market size (which is low for SSA countries), is higher for SSA than for the developing (or developed) world as a whole. On this measure, Angola, Equatorial Guinea, Lesotho and Liberia received more FDI than e.g. Singapore. Furthermore, the key is not quantity, but quality of FDI: what can FDI do for a country’s development objectives.
18
3. Prepare well There is macro-evidence that FDI is associated with faster economic growth in developing countries (and SSA), but it is not clear whether this is due to a composition effect, with foreign companies locating in high-value added sectors, or due to foreign companies transferring skills and superior techniques to a local economy, or both. Importantly, the existing evidence also suggests that the impact of FDI on development is a process characterised by informational market failures requiring policy interventions. Competition, education or technology policy is required to raise the capacity of the local economy to absorb positive spillovers and mitigate negative aspects. A link clearly exists between FDI, trade and domestic policies. 4. Reduce conflict and corruption Research suggests that conflict and corruption deter foreign investment (e.g. Wei, 2000). For a firm, paying bribes is like paying a tax, but then the firm is faced with more uncertainty. In general, African countries score low. However, certainty in future operations is required for FDI in activities such as manufacturing and services. In particular, FDI in manufacturing (garments, assembly operations) can often choose between locations, and the ‘footloose’ investor is likely to choose a country with less corruption and conflict to avoid taking too much risk. Corruption and conflict are important elements of political risk assessments, which in turn determine investor perceptions of the business climate in a country. With only limited available information, such perceptions are difficult to change and are sometimes applied to countries or regions with a good economic business climate in practice. With few natural resources and lots of corruption and conflict, countries may not appear on an investor’s shortlist. Tanzania has made commendable efforts to promote good governance and fight against corruption have been carried out at three levels: (i) Creation of Legal framework to promote good government and fight against corruption; (ii) National Anti- Corruption Strategy and Action Plans (NACSAP); and (iii) Building coalition among stakeholders to combat the scourge and encouraging civil society to speak out. 5. Provide appropriate infrastructure and skills Research shows that infrastructure and skills are important determinants of FDI (Wheeler and Mody, 1992, and Noorbaksch, 2001). Surveys show that a low level of appropriate skills is one of the main barriers to investing in Africa. In addition, if there is no proper infrastructure, investors have to build their own in order to produce, transport, sell or export their products. At the same time, infrastructure and skills help to absorb the positive effects from FDI (e.g. Borensztein et al, 1998). With a more skilled workforce and a better infrastructure (ports, roads water pipelines, electricity and telecommunications), local firms can more easily capture knowledge spillovers, for instance through becoming local suppliers.

19
6. Implement FDI policies consistently and actively A simple change in the law to allow foreign ownership in certain industries may do little to attract foreign investors. If a country really wants to attract FDI, a change in law needs to be followed by a consistent and active implementation of a range of FDI policies. This involves the setting-up of an effective and aggressive Investment Promotion Agency (IPA) that targets particular firms and industries that fit in with the FDI strategy. There are concerns that many African IPAs are not the one-stop centres that investors like to see. Obtaining permits is difficult and takes a long time. African IPAs often lack the funds for consistent implementation of FDI promotion policy. Many also appear to lack a targeted and long-term focus that is required to attract TNCs. Others do not have sufficient power to decide on relevant issues. In addition to a consistent implementation of FDI promotion efforts, it is also important that government policy in other fields (e.g. policy related to education, technology, competition or privatisation) is implemented consistently without engaging in policy reversals. Policy reversals often create an uncertain and business-unfriendly world. The successful countries of today have in the past gone through periods (sometimes over 5 years) when their investment strategies did not pay off. It is useful to define an FDI strategy, and stand by the implementation of policies to achieve this strategy until better strategies arise. 7. Understand the pros and cons of international investment agreements The past decade has seen rapid changes in the international regulatory framework for FDI in Africa. Almost all African countries have signed Bilateral Investment Treaties with other countries aimed at protecting and promoting FDI and clarifying the terms under which FDI can take place between partner countries. By 1999, African countries had signed 335 BITs, most of which were signed in the last decade. The conclusion of double taxation treaties, avoiding companies to pay taxes twice, has also risen sharply, but appears to be concentrated in countries such as Egypt, Mauritius, South Africa and Tunisia.
Table 3: Bilateral Investment Treaties and Double Taxation Treaties (Cummulative Number)
Kenya Uganda Tanzania BITs DTTs BITs DTTs BITs DTTs 1992 1 9 3 5 3 8 1993 1 9 3 5 3 8 1994 1 9 3 5 4 8 1995 1 9 4 5 4 9 1996 3 10 4 5 4 9 1997 3 11 5 5 5 9 1998 3 11 6 5 6 9 1999 3 11 6 6 7 9 2000 3 11 8 9 7 9 2001 4 11 9 9 10 9 2002 4 11 11 9 10 9 Source: UNCTAD Website

20
8. Facilitate trade Foreign investors are usually more trade intensive than local firms. TNC affiliates may depend on capital goods imported from their parents’ network, they may export natural resources overseas or they may use cheap labour to produce competitive products for export. For these reasons, TNCs are relatively sensitive to conditions that facilitate trade: ports, customs regulation, tariffs, roads. In order to facilitate FDI inflows in the presence of a weak infrastructure, African governments have set up export processing zones (EPZ). EPZs offer special tax incentives, streamlined customs procedures, low tariffs and specialised infrastructure. However, with the exception of Mauritius, African EPZs have failed to make a significant impact on economic development. EPZs elsewhere have been more successful. Costa Rica, Singapore and Malaysia have used EPZs as a first set up the ladder to diversify from garments into more complicated manufacturing operations. Tanzania has also established the EPZs in the textile sector. The main hindrances of the textile sector from benefiting from this initiative include the failure to export, infrastructural problems and cost factors to compete with the world market. Already three factories earmarked for EPZs have been registered. They are Urafiki Textile Mill, Ubungo Millennium, and the NIDA’s factory, which is located at Tabata, also in Dar es Salaam. 9. Provide a transparent and appropriate incentive and regulatory framework Governments have offered various incentives schemes to attract investors, ranging from corporate tax holidays, exemptions for taxes and import/export duties, to offering pure grants. TNCs in the natural resources industry hope to repatriate large sums of profits without paying taxes, and are sometimes prevented from disclosing taxes paid. However, tax experts indicate that many TNCs are interested in predictable tax regimes, especially in low-income countries, rather than unpredictable tax rates. Of course, corporate taxes should not be too high from a business perspective. On the other hand, governments can improve the regulatory framework by removing unnecessary regulations (some, such as environmental regulations, may still be necessary). There is still a wide difference in regulations between countries, and investor roadmaps show the extent to which some of these regulations are unnecessary. In Ghana and Uganda it can take one or two years to establish a business and become operational, 18 months to three years in Tanzania and Mozambique, six months to one year in Namibia, but only six months in Malaysia. This sends the wrong signal to other potential investors. 10. Promote linkages within available means Linkages between TNCs and SMEs (small and medium sized enterprises) can bring positive effects for SMEs directly through employment and indirectly through technology

21
and skill transfer and access to export markets and finance. However, linkages in many African countries appear to be underdeveloped. Linkages in African countries can be underdeveloped for various reasons. Most TNCs in Africa locate in sectors with relatively low linkage possibilities (natural resources and textiles), while Asian and Latin American countries have also attracted linkage intensive TNCs (electronics and automobile industry). In addition, linkage creation depends on TNC strategies and level of development of the host country. TNCs are willing to source locally when reliable, good quality and cheap products are available. Sometimes TNCs are willing to assist in the development of local suppliers. However, there is also a role for government policy.

22
5. CONCLUSION ________________________________________________________________________ This paper has attempted to establish the potential impact of FDI on economic development. However, the analysis was just based on the few examples of case studies. For Tanzania to understand the impact of these investments on the economy, as well as monitoring the operations of foreign investors data availability is very important. Later in the paper, the study highlighted some key challenges t policymakers necessary for FDI to play a role in achieving country’s development objectives. An active policy is required to attract FDI and to make FDI work for development. Many of the challenges in the paper may also be seen as part of a general development agenda that fosters domestic private investment.
23
6. REFERENCES (Not yet complete) Blomström, (1986). Bora, B., (2002). Borensztein, (1998) Noorbaksch, 2001) Portelli and Narula, 2004). Tanzania Investment Report, 2004 UNCTAD, (2002) Wei, 2000 Wheeler and Mody, (1992) World Investment Report, 2003
24
7. APPENDICES
Appendix 1: FDI Stock by Country of Origin, 1999-2001
Country/Country Group 1999 Percentage 2000 Percentage 2001 Percentage EAC Countries 61.2 2.5 115.2 3.8 277.1 7.3 Kenya 55.8 2.3 113.7 3.7 275.5 7.3 Uganda 5.4 0.2 1.5 0.0 1.6 0.0 SADC Countries 244.7 10.1 716.7 23.6 926.8 24.5 South Africa 140.3 5.8 529.4 17.4 749.2 19.8 Mauritius 89.0 3.7 175.8 5.8 171.4 4.5 Other SADC Countries 15.4 0.6 11.5 0.4 6.2 0.2 Rest of Africa 431.7 17.8 157.5 5.2 182.4 4.8 Ghana 418.7 17.3 149.9 4.9 174.9 4.6 Other Rest of Africa 13.0 0.5 7.6 0.3 7.5 0.2 OECD Countries 1487.3 61.5 1847.4 60.8 2161.9 57.2 United Kingdom 495.4 20.5 569.1 18.7 615.4 16.3 Canada 184.0 7.6 406.7 13.4 430.6 11.4 Japan 3.7 0.2 190.9 6.3 172.2 4.6 USA 161.7 6.7 182.0 6.0 174.1 4.6 EU 0.0 0.0 14.8 0.5 146.9 3.9 Switzerland 30.1 1.2 127.5 4.2 115.5 3.1 Netherlands 117.2 4.8 47.1 1.6 105.4 2.8 Italy 57.9 2.4 57.5 1.9 63.6 1.7 Germany 51.0 2.1 22.4 0.7 52.6 1.4 Australia 177.7 7.3 43.4 1.4 49.8 1.3 Denmark 47.6 2.0 36.3 1.2 35.5 0.9 France 47.1 1.9 20.5 0.7 33.6 0.9 Sweden 34.2 1.4 24.6 0.8 29.7 0.8 Norway 36.9 1.5 31.7 1.0 26.2 0.7 Luxembourg 27.3 1.1 48.5 1.6 80.1 2.1 Other OECD Countries 15.5 0.6 24.4 0.8 30.7 0.8 Rest of the World 194.0 8.0 201.5 6.6 228.6 6.1 Malaysia 48.5 2.0 71.9 2.4 72.1 1.9 China 10.6 0.4 23.0 0.8 23.7 0.6 United Arab Emirates 3.0 0.1 17.7 0.6 17.0 0.5 India 5.6 0.2 11.1 0.4 15.0 0.4 Russia 2.1 0.1 16.7 0.5 14.3 0.4 Other Rest of the World 124.2 5.1 58.6 1.9 84.0 2.2 Grand Total 2418.9 100.0 3038.3 100.0 3776.8 100.0 Source: Tanzania Investment Report, 2004

25
Appendix 2: FDI Potential in Tanzania: Strength and Weakness Strength Weakness Country level • Stable political environment • Significant growth potential • Market reform and liberalization process • Foreign exchange liberalization, exchange rates
and foreign exchange allocation • Competitive corporate tax rate
• Low purchasing power and large informal sector • Infrastructural weaknesses: transport, utilities
(availability, cost and service quality) • Education (primary, secondary, tertiary) • Regulations: taxation, land and labor laws,
business licensing and registration, import/export procedures; bureaucracy and petty corruption
Sector and industry levels • Manufacturing: privatized manufacturing
enterprises • Mining: extensive and accessible deposits of a
range of minerals, including gold; attractive incentives; strong FDI inflows;
• Agriculture: abundant agricultural resources; privatization of former nationalized estates; early diversification efforts promising
• Tourism: rapid growth and potential for varied tourism products
• Other sectors: energy resources, especially natural gas and coal
• Manufacturing: small size, low capacity
utilization, unfavorable industrial structure • Mining: illegal mining; environmental pollution;
poor infrastructure to develop potential in south of country; falling gold price; exports and currency appreciation
• Agriculture: weather; problems stemming from socialist strategies of the past: output, quality, little processing; tariff problems and smuggling; marketing systems; land ownership
• Tourism: infrastructure (roads and telecoms; service infrastructure; hotel accommodation; water supply); unrest in Zanzibar; marketing
Firm level • Effective, wide-ranging privatization • Commitment of long established TNCs • Entry of second-tier investors • Interest of South Africa
• “Difficult” privatizations remaining, including
utilities • Suspicions of Asian and South African investors • Large informal sector • Low level of linkages between TNCs and the
economy; backward linkages with suppliers very weak
Source: UNCTAD (2002)