Renewable Fuel Standard: Potential Economic and Environmental
Upload
lensesCategory
view
165download
0
Implemented by the ACPGroup of States Secretariat
Funded bythe EU
The Learning Network on Sustainable energy systems is funded by the European-ACP-EU Edulink II
Economic and Environmental Evaluation of
Renewable Energy Systems
Shadreck M. Situmbeko
Industrial Design and Technology, University of Botswana,
Gaborone, Botswana;
Freddie L. Inambao PhD
Professor, Mechanical Engineering, University of KwaZulu-Natal;
Durban, South Africa
• Economic and Environmental Evaluation of Renewable Energy
Systems
• Shadreck Situmbeko/ University of Botswana
Presentation Outline
ABSTRACT
1. INTRODUCTION
2. METHODOLOGY2.1. Economic Analysis2.2. Environmental Analysis2.3. Social Analysis
3. CASE STUDY: 10 kW SOLAR THERMAL POWER PLANT3.1. Description3.2 Calculations3.3 Results
4. DISCUSSIONS AND CONCLUSIONS
• Economic and Environmental Evaluation of Renewable Energy
Systems
• Shadreck Situmbeko/ University of Botswana
1. INTRODUCTION
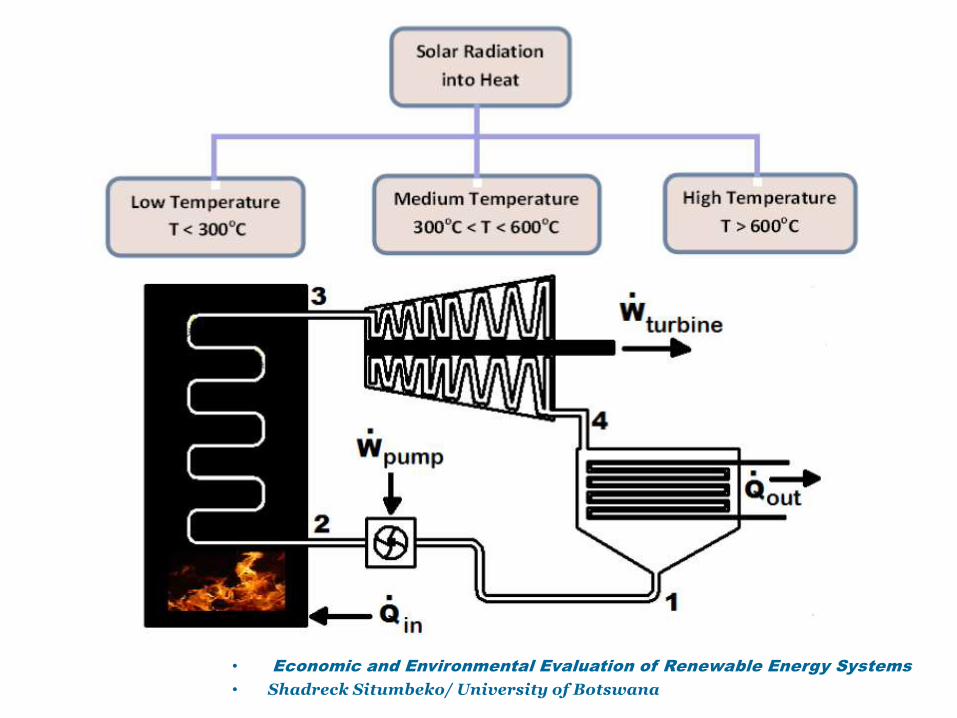
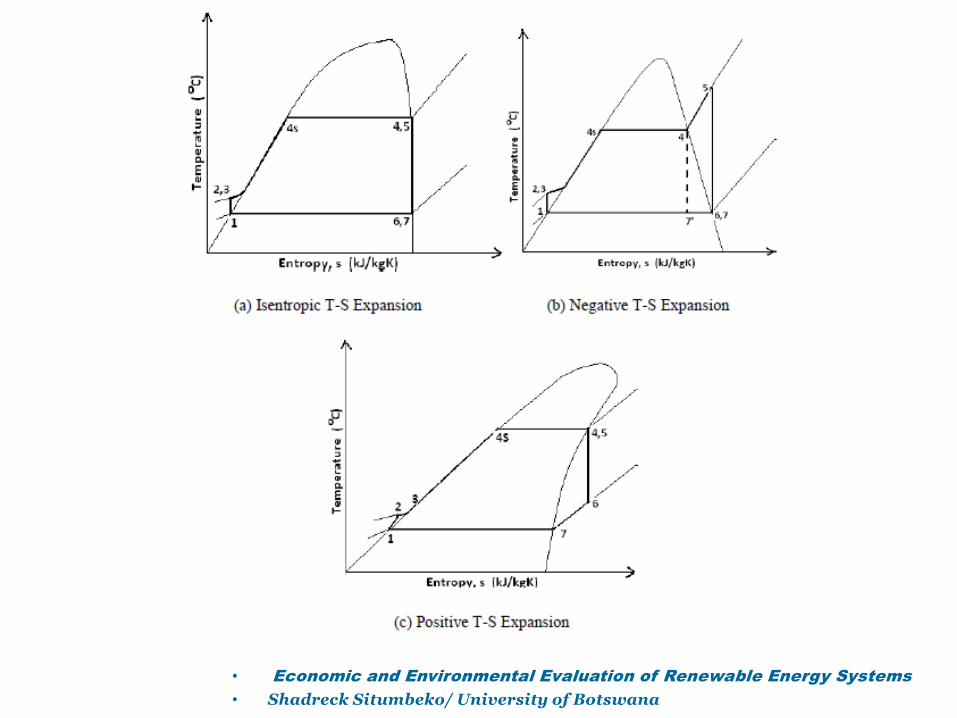
• research to evaluate the feasibility of low temperaturesolar thermal energy conversion system based on theorganic Rankine cycle (ORC) as a viable means of generatingclean and environmentally sustainable electricity.
• study conducted at University of KwaZulu-Natal (UKZN),Durban, South Africa.
• Findings presented in two sections:– economic analysis and;– environmental analysis.– social analysis not considered at this stage
• Economic and Environmental Evaluation of Renewable Energy Systems
• Shadreck Situmbeko/ University of Botswana
• Economic and Environmental Evaluation of Renewable Energy Systems
• Shadreck Situmbeko/ University of Botswana
• Economic and Environmental Evaluation of Renewable Energy Systems
• Shadreck Situmbeko/ University of Botswana
2. METHODOLOGY : Economic Analysis
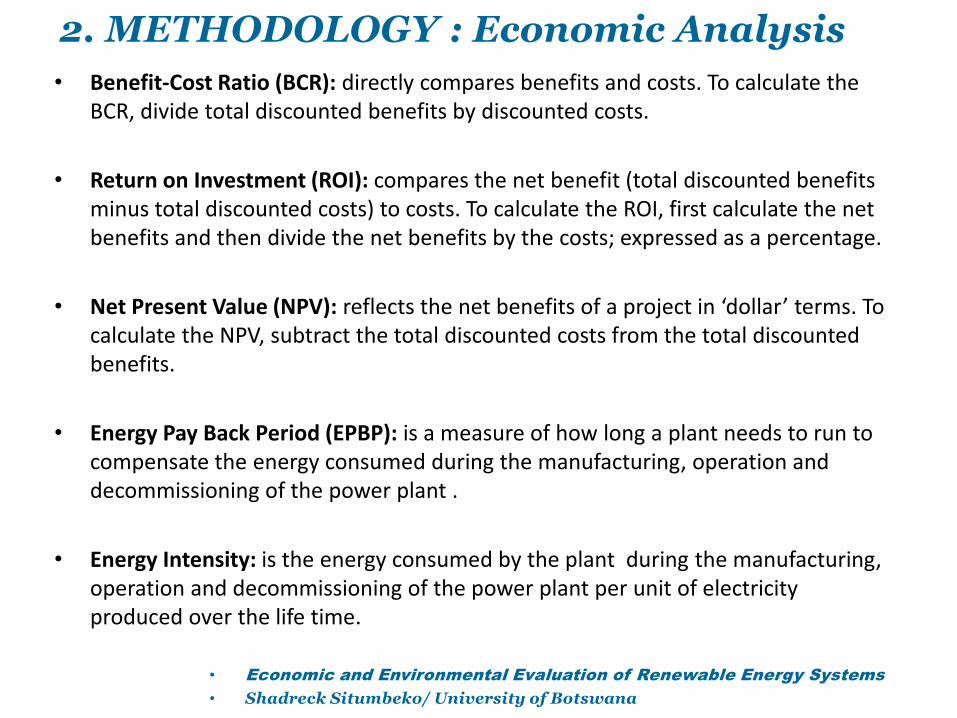
• Benefit-Cost Ratio (BCR): directly compares benefits and costs. To calculate the BCR, divide total discounted benefits by discounted costs.
• Return on Investment (ROI): compares the net benefit (total discounted benefits minus total discounted costs) to costs. To calculate the ROI, first calculate the net benefits and then divide the net benefits by the costs; expressed as a percentage.
• Net Present Value (NPV): reflects the net benefits of a project in ‘dollar’ terms. To calculate the NPV, subtract the total discounted costs from the total discounted benefits.
• Energy Pay Back Period (EPBP): is a measure of how long a plant needs to run to compensate the energy consumed during the manufacturing, operation and decommissioning of the power plant .
• Energy Intensity: is the energy consumed by the plant during the manufacturing, operation and decommissioning of the power plant per unit of electricity produced over the life time.

• Economic and Environmental Evaluation of Renewable Energy
Systems
• Shadreck Situmbeko/ University of Botswana
2. METHODOLOGY : Environmental Analysis
• Economic and Environmental Evaluation of Renewable Energy
Systems
• Shadreck Situmbeko/ University of Botswana
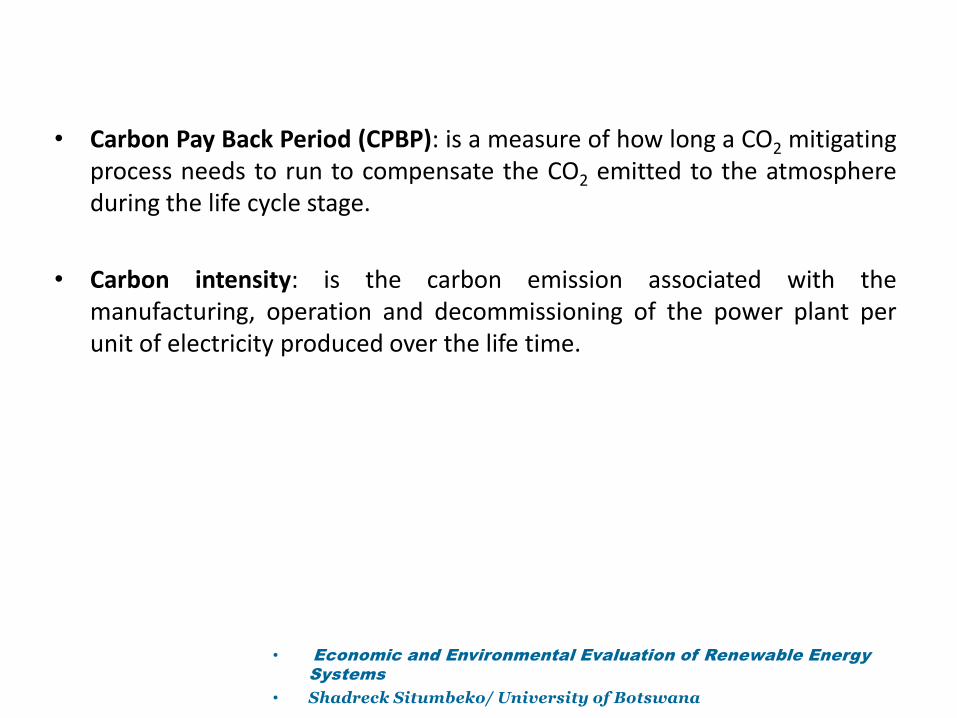
• Carbon Pay Back Period (CPBP): is a measure of how long a CO2 mitigatingprocess needs to run to compensate the CO2 emitted to the atmosphereduring the life cycle stage.
• Carbon intensity: is the carbon emission associated with themanufacturing, operation and decommissioning of the power plant perunit of electricity produced over the life time.
• Economic and Environmental Evaluation of Renewable Energy
Systems
• Shadreck Situmbeko/ University of Botswana
2. METHODOLOGY : Social Analysis
• This is not considered in this study.
• Most researchers on this topic base its analyses onthe energy model set of indicators and these arepoverty and equity; where
– energy poverty is measured in terms of ‘access to use ofmodern and clean energy’ and
– equity in terms of ‘access to useful energy’.
• Economic and Environmental Evaluation of Renewable Energy
Systems
• Shadreck Situmbeko/ University of Botswana
3. CASE STUDY : Description
10 kW SOLAR THERMAL POWER PLANT
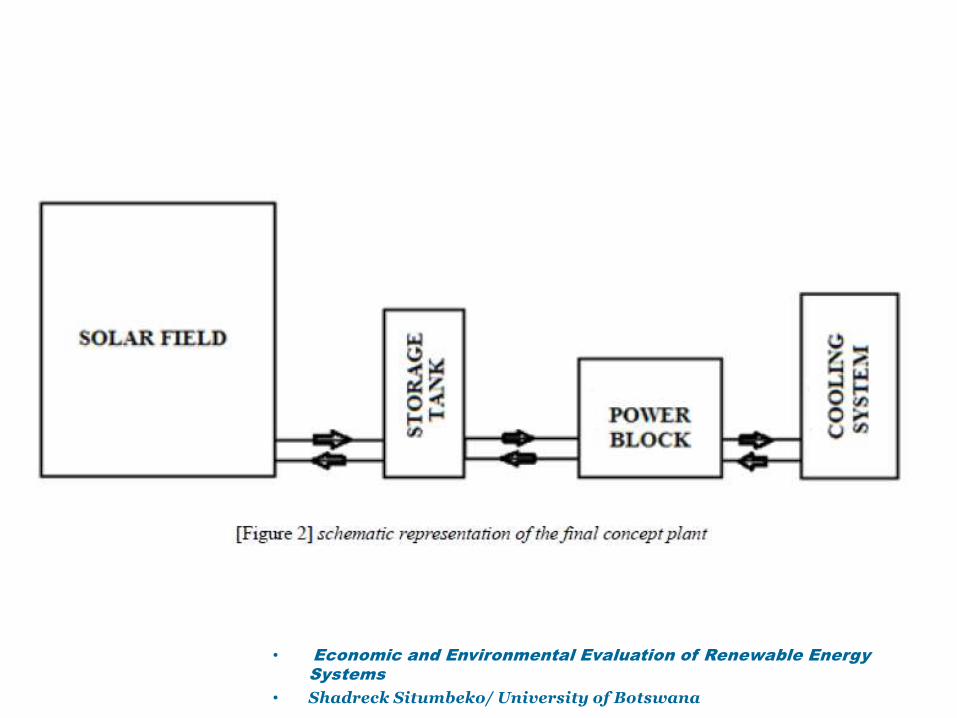
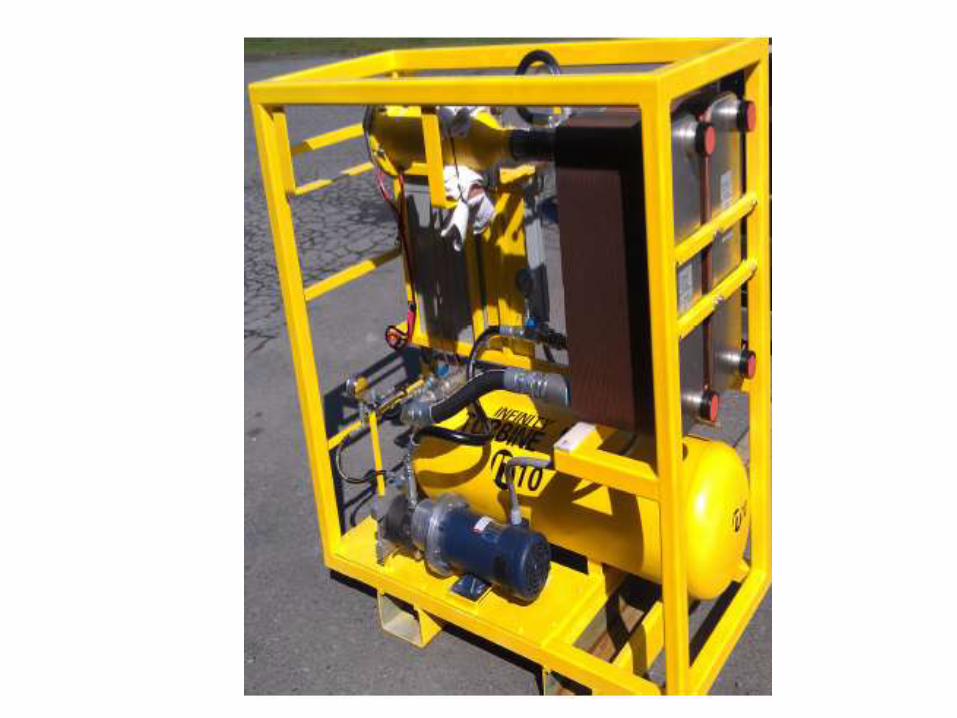
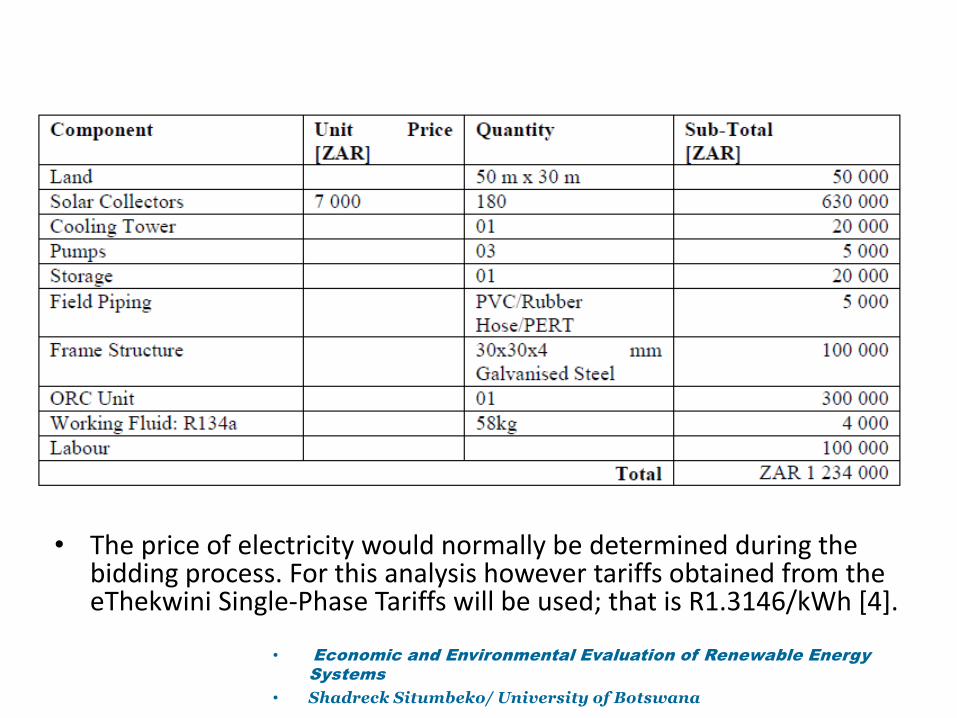
The 10kW plant to be installed in a community/village to be identified will basically consist of a solar field, pumps and field piping, storage tank, a complete ORC plant developed by the University on a similar model of the IT10 supplied by Infinity Turbines of USA, and a cooling tower.
A schematic representation of the concept plant is shown in figure 2.
Table 1 shows a breakdown of costs for the power plant.
• Economic and Environmental Evaluation of Renewable Energy
Systems
• Shadreck Situmbeko/ University of Botswana
• Economic and Environmental Evaluation of Renewable Energy
Systems
• Shadreck Situmbeko/ University of Botswana
• The price of electricity would normally be determined during the bidding process. For this analysis however tariffs obtained from the eThekwini Single-Phase Tariffs will be used; that is R1.3146/kWh [4].
• Economic and Environmental Evaluation of Renewable Energy
Systems
• Shadreck Situmbeko/ University of Botswana
3. CASE STUDY : Calculations
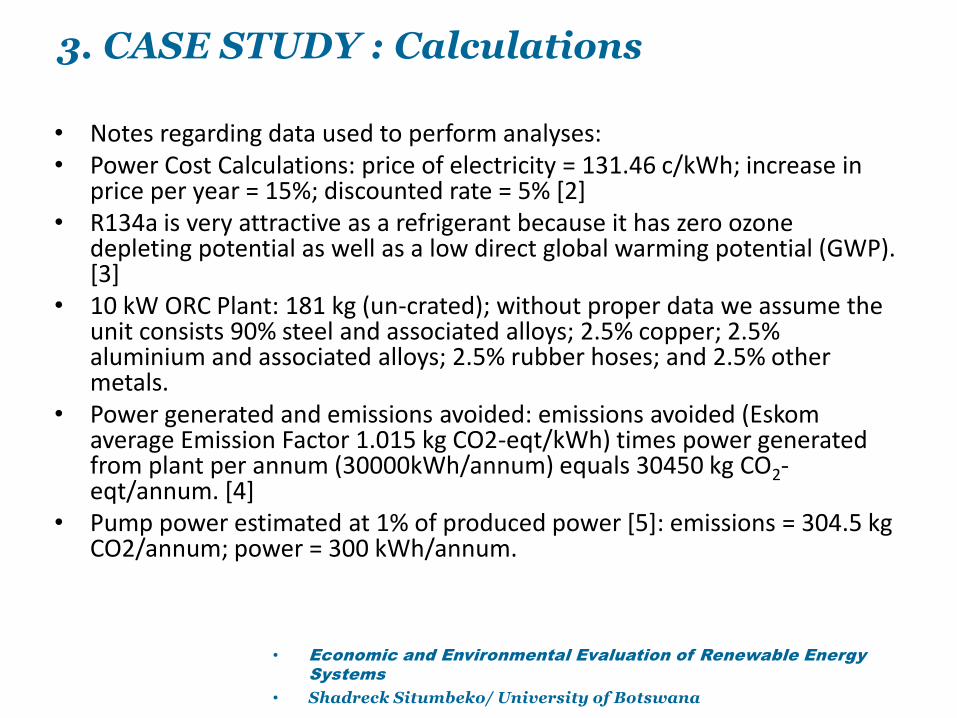
• Notes regarding data used to perform analyses:• Power Cost Calculations: price of electricity = 131.46 c/kWh; increase in
price per year = 15%; discounted rate = 5% [2]• R134a is very attractive as a refrigerant because it has zero ozone
depleting potential as well as a low direct global warming potential (GWP). [3]
• 10 kW ORC Plant: 181 kg (un-crated); without proper data we assume the unit consists 90% steel and associated alloys; 2.5% copper; 2.5% aluminium and associated alloys; 2.5% rubber hoses; and 2.5% other metals.
• Power generated and emissions avoided: emissions avoided (Eskom average Emission Factor 1.015 kg CO2-eqt/kWh) times power generated from plant per annum (30000kWh/annum) equals 30450 kg CO2-eqt/annum. [4]
• Pump power estimated at 1% of produced power [5]: emissions = 304.5 kg CO2/annum; power = 300 kWh/annum.
• Economic and Environmental Evaluation of Renewable Energy
Systems
• Shadreck Situmbeko/ University of Botswana
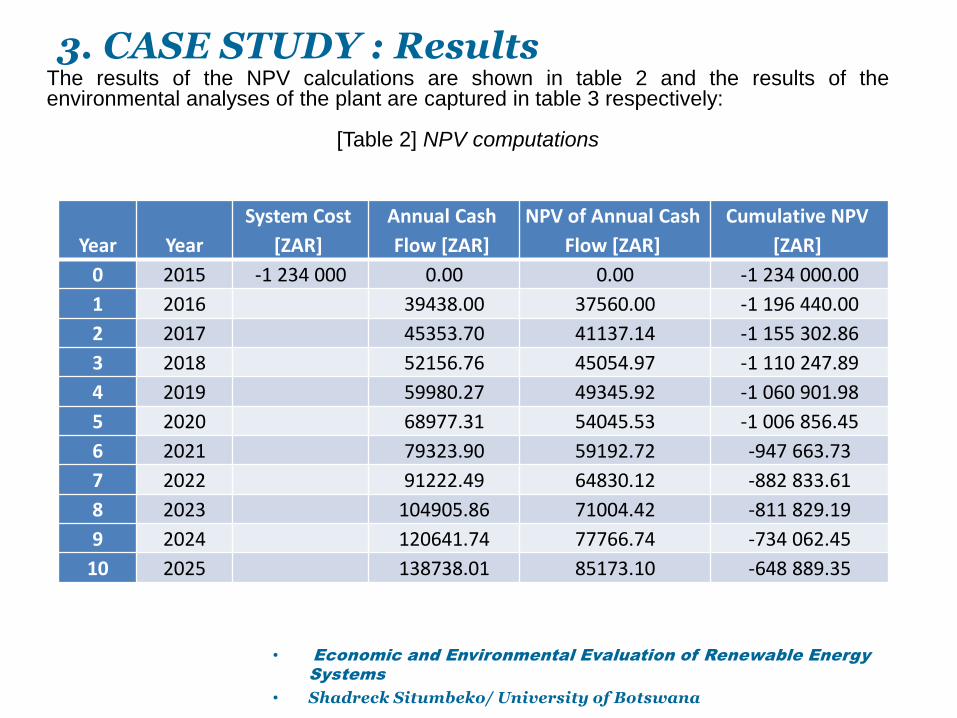
3. CASE STUDY : ResultsThe results of the NPV calculations are shown in table 2 and the results of theenvironmental analyses of the plant are captured in table 3 respectively:
[Table 2] NPV computations
Year Year
System Cost
[ZAR]
Annual Cash
Flow [ZAR]
NPV of Annual Cash
Flow [ZAR]
Cumulative NPV
[ZAR]
0 2015 -1 234 000 0.00 0.00 -1 234 000.00
1 2016 39438.00 37560.00 -1 196 440.00
2 2017 45353.70 41137.14 -1 155 302.86
3 2018 52156.76 45054.97 -1 110 247.89
4 2019 59980.27 49345.92 -1 060 901.98
5 2020 68977.31 54045.53 -1 006 856.45
6 2021 79323.90 59192.72 -947 663.73
7 2022 91222.49 64830.12 -882 833.61
8 2023 104905.86 71004.42 -811 829.19
9 2024 120641.74 77766.74 -734 062.45
10 2025 138738.01 85173.10 -648 889.35
• Economic and Environmental Evaluation of Renewable Energy
Systems
• Shadreck Situmbeko/ University of Botswana
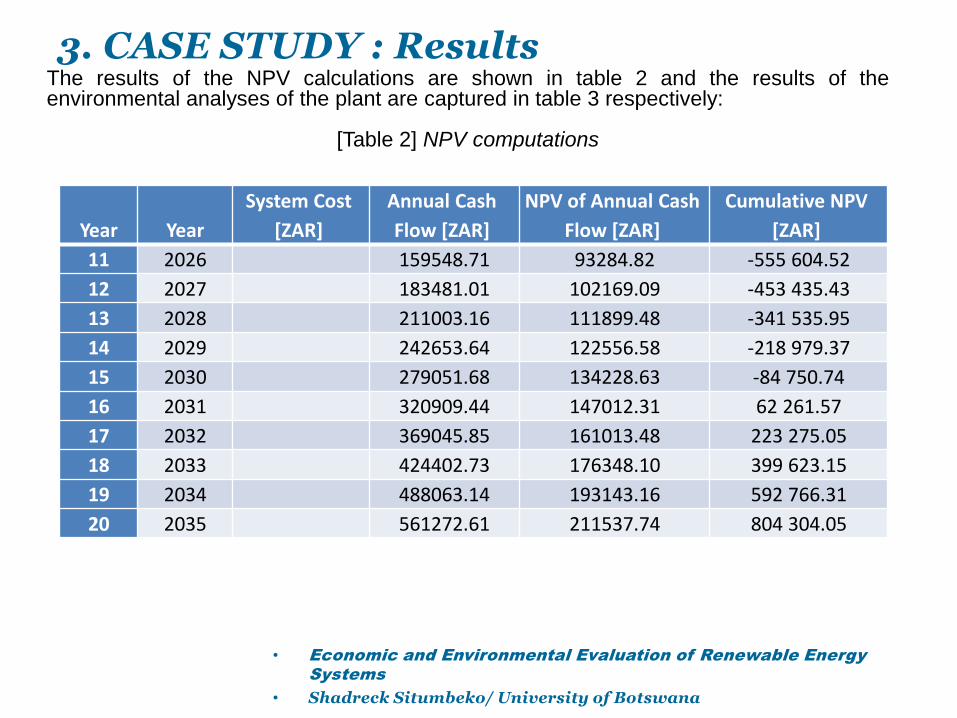
3. CASE STUDY : ResultsThe results of the NPV calculations are shown in table 2 and the results of theenvironmental analyses of the plant are captured in table 3 respectively:
[Table 2] NPV computations
Year Year
System Cost
[ZAR]
Annual Cash
Flow [ZAR]
NPV of Annual Cash
Flow [ZAR]
Cumulative NPV
[ZAR]
11 2026 159548.71 93284.82 -555 604.52
12 2027 183481.01 102169.09 -453 435.43
13 2028 211003.16 111899.48 -341 535.95
14 2029 242653.64 122556.58 -218 979.37
15 2030 279051.68 134228.63 -84 750.74
16 2031 320909.44 147012.31 62 261.57
17 2032 369045.85 161013.48 223 275.05
18 2033 424402.73 176348.10 399 623.15
19 2034 488063.14 193143.16 592 766.31
20 2035 561272.61 211537.74 804 304.05
• Economic and Environmental Evaluation of Renewable Energy
Systems
• Shadreck Situmbeko/ University of Botswana
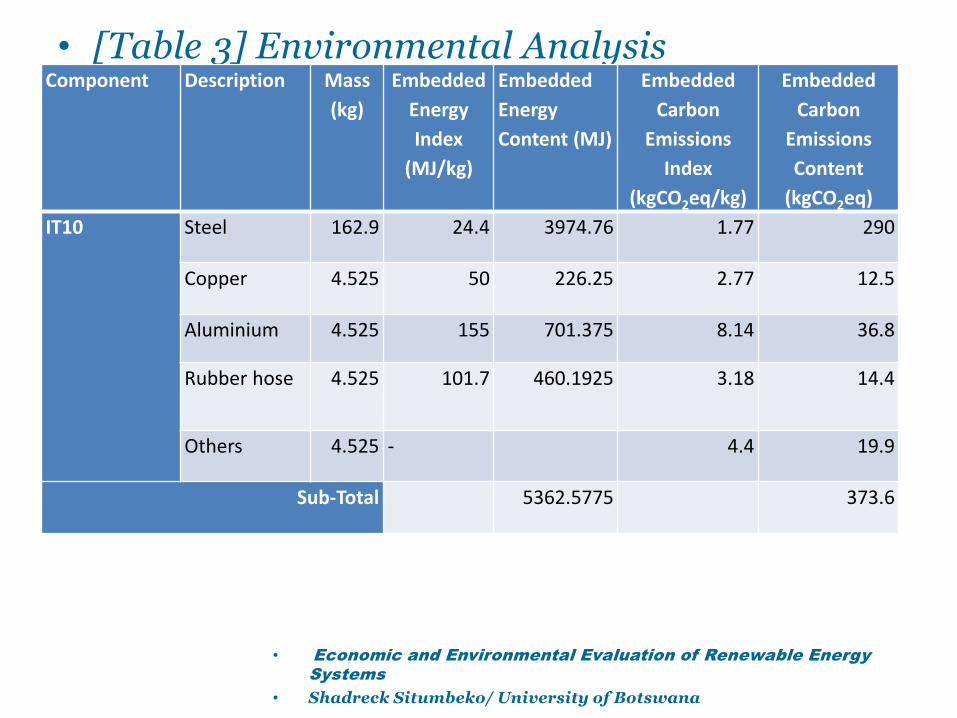
• [Table 3] Environmental AnalysisComponent Description Mass
(kg)
Embedded
Energy
Index
(MJ/kg)
Embedded
Energy
Content (MJ)
Embedded
Carbon
Emissions
Index
(kgCO2eq/kg)
Embedded
Carbon
Emissions
Content
(kgCO2eq)
IT10 Steel 162.9 24.4 3974.76 1.77 290
Copper 4.525 50 226.25 2.77 12.5
Aluminium 4.525 155 701.375 8.14 36.8
Rubber hose 4.525 101.7 460.1925 3.18 14.4
Others 4.525 - 4.4 19.9
Sub-Total 5362.5775 373.6
• Economic and Environmental Evaluation of Renewable Energy
Systems
• Shadreck Situmbeko/ University of Botswana
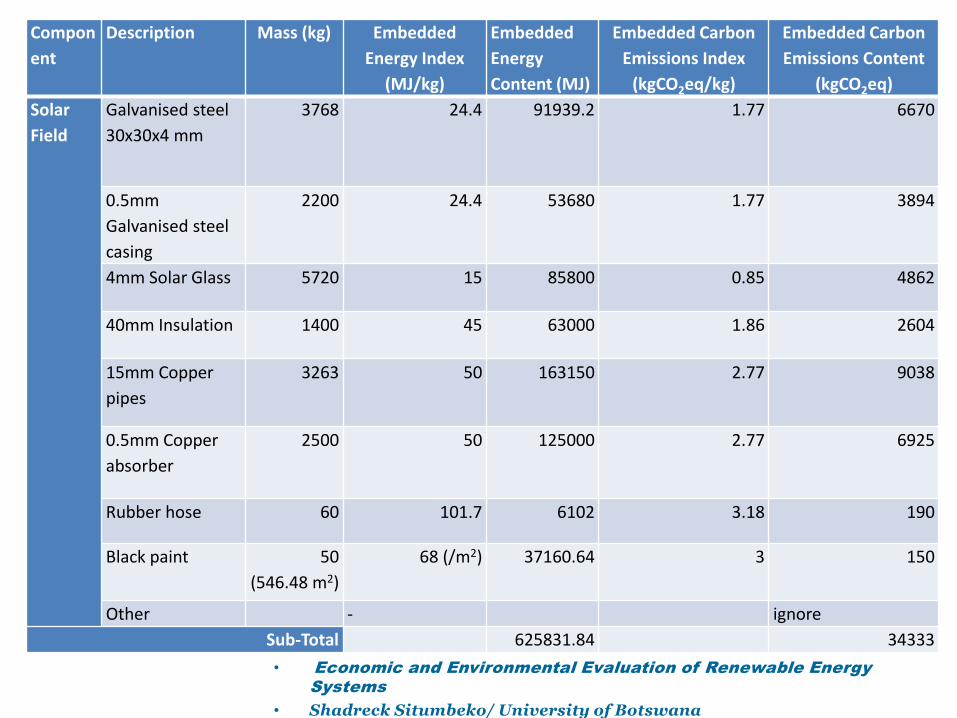
Compon
ent
Description Mass (kg) Embedded
Energy Index
(MJ/kg)
Embedded
Energy
Content (MJ)
Embedded Carbon
Emissions Index
(kgCO2eq/kg)
Embedded Carbon
Emissions Content
(kgCO2eq)
Solar
Field
Galvanised steel
30x30x4 mm
3768 24.4 91939.2 1.77 6670
0.5mm
Galvanised steel
casing
2200 24.4 53680 1.77 3894
4mm Solar Glass 5720 15 85800 0.85 4862
40mm Insulation 1400 45 63000 1.86 2604
15mm Copper
pipes
3263 50 163150 2.77 9038
0.5mm Copper
absorber
2500 50 125000 2.77 6925
Rubber hose 60 101.7 6102 3.18 190
Black paint 50
(546.48 m2)
68 (/m2) 37160.64 3 150
Other - ignore
Sub-Total 625831.84 34333
• Economic and Environmental Evaluation of Renewable Energy
Systems
• Shadreck Situmbeko/ University of Botswana
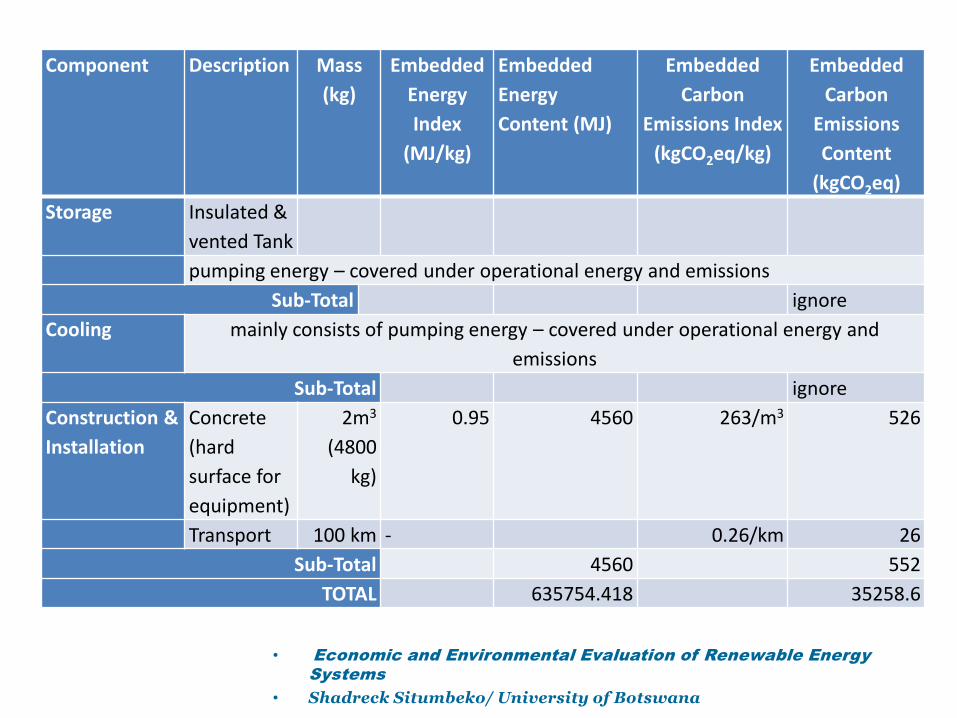
Component Description Mass
(kg)
Embedded
Energy
Index
(MJ/kg)
Embedded
Energy
Content (MJ)
Embedded
Carbon
Emissions Index
(kgCO2eq/kg)
Embedded
Carbon
Emissions
Content
(kgCO2eq)
Storage Insulated &
vented Tank
pumping energy – covered under operational energy and emissions
Sub-Total ignore
Cooling mainly consists of pumping energy – covered under operational energy and
emissions
Sub-Total ignore
Construction &
Installation
Concrete
(hard
surface for
equipment)
2m3
(4800
kg)
0.95 4560 263/m3 526
Transport 100 km - 0.26/km 26
Sub-Total 4560 552
TOTAL 635754.418 35258.6
• Economic and Environmental Evaluation of Renewable Energy
Systems
• Shadreck Situmbeko/ University of Botswana
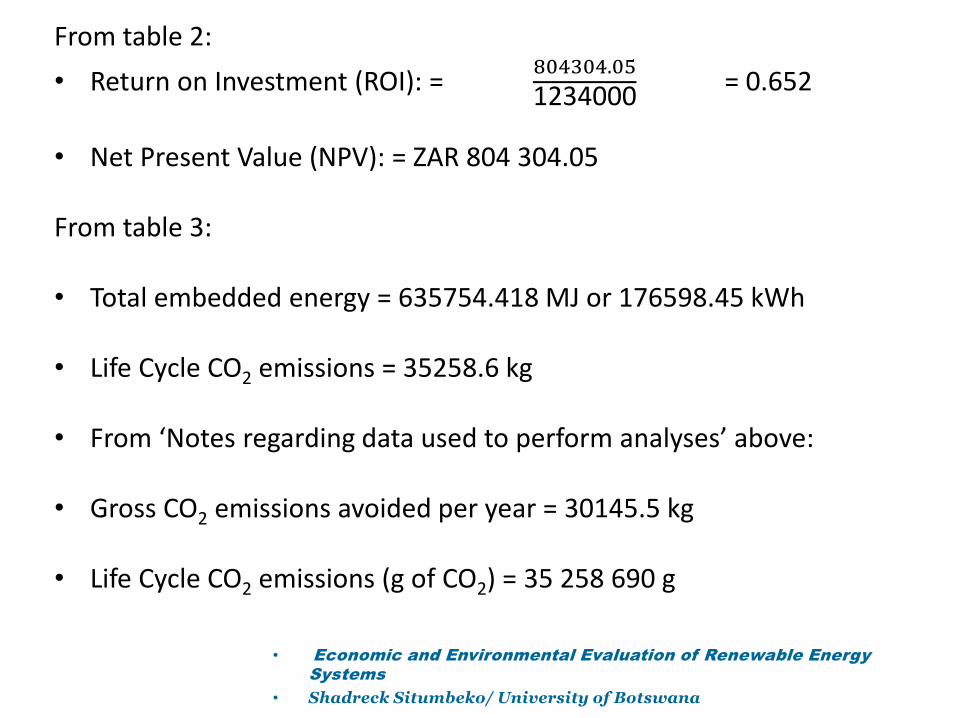
From table 2:
• Return on Investment (ROI): =804304.05
1234000= 0.652
• Net Present Value (NPV): = ZAR 804 304.05
From table 3:
• Total embedded energy = 635754.418 MJ or 176598.45 kWh
• Life Cycle CO2 emissions = 35258.6 kg
• From ‘Notes regarding data used to perform analyses’ above:
• Gross CO2 emissions avoided per year = 30145.5 kg
• Life Cycle CO2 emissions (g of CO2) = 35 258 690 g
• Economic and Environmental Evaluation of Renewable Energy
Systems
• Shadreck Situmbeko/ University of Botswana
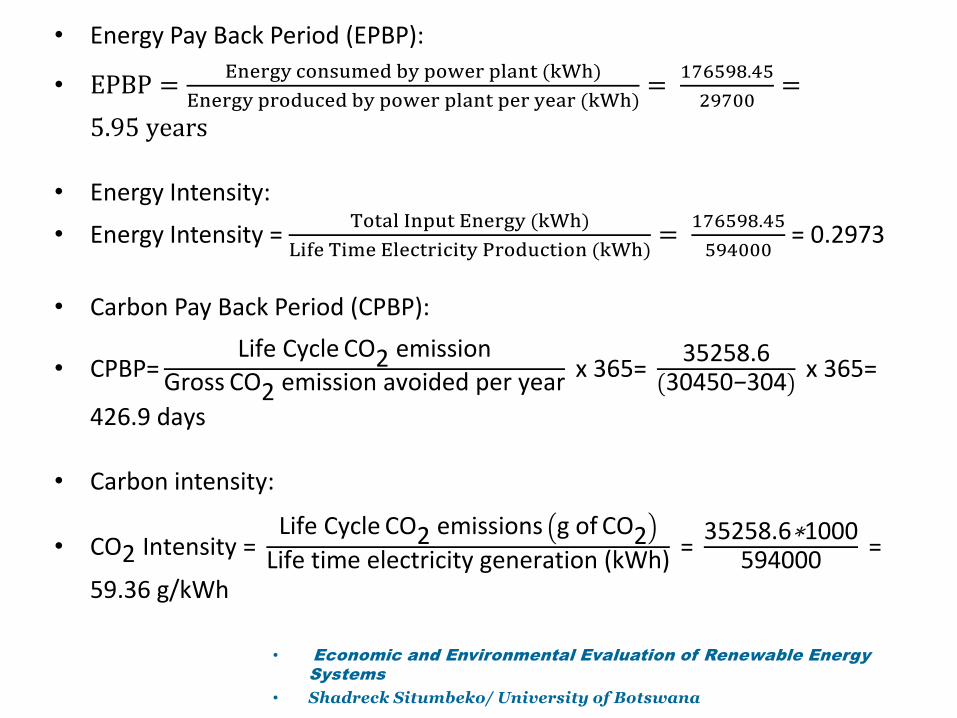
• Energy Pay Back Period (EPBP):
• EPBP =Energy consumed by power plant (kWh)
Energy produced by power plant per year (kWh)=
176598.45
29700=
5.95 years
• Energy Intensity:
• Energy Intensity = Total Input Energy (kWh)
Life Time Electricity Production (kWh)=
176598.45
594000= 0.2973
• Carbon Pay Back Period (CPBP):
• CPBP=Life Cycle CO2 emission
Gross CO2 emission avoided per yearx 365=
35258.630450−304
x 365=
426.9 days
• Carbon intensity:
• CO2 Intensity =Life Cycle CO2 emissions g of CO2
Life time electricity generation (kWh)=
35258.6∗1000594000
=
59.36 g/kWh
• Economic and Environmental Evaluation of Renewable Energy
Systems
• Shadreck Situmbeko/ University of Botswana
Conclusion and Recommendation
• It is evident from the NPV value of ZAR 804 304.05 that under the current scenario the 10 kW Low Temperature Solar Thermal Concept Power Plant is an attractive investment option, economically.
• The energy payback period (EPBP) was obtained as 5.95 years; this is considered comparable with other similar technologies. A typical solar power system is reported to payback after about four years, a photovoltaic system between one-and-half and three-and-half years, while a small wind turbine could take between fifteen to fifty years [6],[7]. Carbon payback period (CPBP) on the other hand was computed as 426.9 days (1.17 years); this figure too is comparable with what has been obtained by other researchers such as 2.21 years obtained for a solar water heater by Marimuthu C. and Kirubakaran V. [8], and carbon payback periods (excluding transport) obtained as 6.0, 2.2, and 1.9 years respectively for PV system, solar thermal-individual and solar thermal-community by CroxfordBen and Scott Kat [9].
• Economic and Environmental Evaluation of Renewable Energy
Systems
• Shadreck Situmbeko/ University of Botswana
Conclusion and Recommendation
• The results obtained here are considered partial or conservative because the scrap and recycling values of the materials or components following decommissioning has not been taken into account; this would reduce the embodied energy and emissions.
• The implications of these analyses do indicate that the low temperature solar thermal concept plant has potential to be a net clean energy producer both cost effectively and environmentally beneficially.