ECONOMIC ANALYSIS OF GROUNDNUT PROCESSING (OIL AND …
145
i ECONOMIC ANALYSIS OF GROUNDNUT PROCESSING (OIL AND CAKE) AND IT’S EFFECTS ON POVERTY LEVEL OF THE PROCESSORS IN ZAMFARA STATE, NIGERIA BY Nasiru Alhaji YA’U PhD/ AGRIC/ 9184/2009-10
Transcript of ECONOMIC ANALYSIS OF GROUNDNUT PROCESSING (OIL AND …

i
ECONOMIC ANALYSIS OF GROUNDNUT PROCESSING
(OIL AND CAKE) AND IT’S EFFECTS ON POVERTY LEVEL OF
THE PROCESSORS IN ZAMFARA STATE, NIGERIA
BY
Nasiru Alhaji YA’U
PhD/ AGRIC/ 9184/2009-10

ii
CHAPTER ONE
INTRODUCTION
1.1 Background to the Study
Processing of agricultural products is generally accepted as the efficient method of
maintaining the shelf-life of produce. Such processed products provide local foods for
consumption among the rural population (Zuberu et al., 2013). Hence, the importance of
crop processing industries especially in Nigeria cannot be over emphasized. The crop
processing industry of Nigeria like other African countries is dominated by the informal
sector comprising mainly of small and medium scale rural enterprises owned and operated
by men and women who depend solely on indigenous technology (Aseidu, 2009).
Groundnut, soya beans, banana, palm kernel, potatoes, cassava, et cetra were some of the
dominant agricultural produce that are processed into local foods consumed by the rural
communities in Nigeria (Napodo and Ditto, 2013).
Groundnut is one of the most valuable legume crops of Nigeria and other tropical countries
with 25 percent protein and more than 40% oil. Nigeria is a major producer of groundnuts
accounting for 25 percent of world exports (IFPRI, 2012). In 2004 the country had 3500
hectares cultivated and production of 2750 tonnes (NBS, 2013). Groundnut accounted for
70% of total Nigeria export prior to petroleum oil boom (World Geography of Peanut,
2013). Groundnut is widely consumed in Nigeria as roasted or boiled nuts in the Western
and Southern parts of the country (Adebesin et al., 2011).
Groundnut has contributed immensely to the development of the Nigerian economy in
general and employment generation among the rural groundnut farmers and processors in
particular. Also, they are important in the confectionary trade among the rural traders and
the stable oil from groundnut is preferred by the deep-frying industries since it has a smoke
iii
point of 229.4oC compared to 193.5
oC of soybean oil. The oil is also used to make
margarine and mayonnaise (Hulme and Mosley, 1996). Confectionary products such as
snack nuts, sauce, flour, peanut butter and cookies are made from high quality nuts of the
crop.
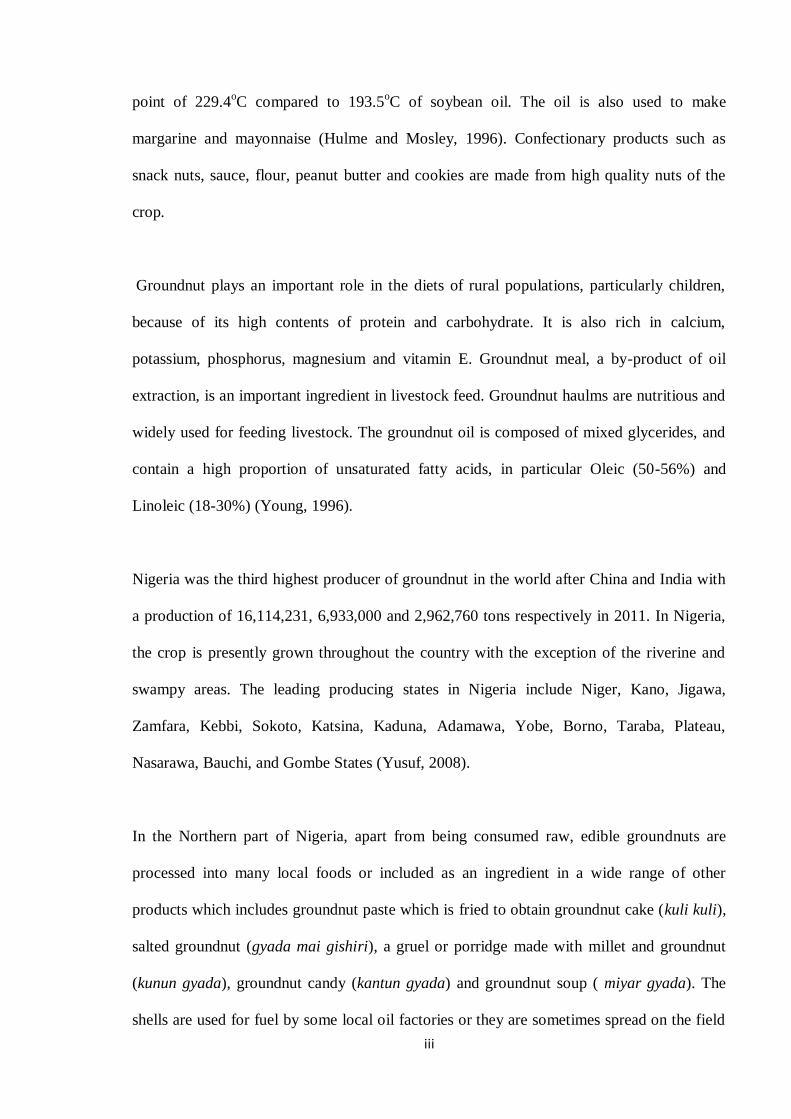
Groundnut plays an important role in the diets of rural populations, particularly children,
because of its high contents of protein and carbohydrate. It is also rich in calcium,
potassium, phosphorus, magnesium and vitamin E. Groundnut meal, a by-product of oil
extraction, is an important ingredient in livestock feed. Groundnut haulms are nutritious and
widely used for feeding livestock. The groundnut oil is composed of mixed glycerides, and
contain a high proportion of unsaturated fatty acids, in particular Oleic (50-56%) and
Linoleic (18-30%) (Young, 1996).
Nigeria was the third highest producer of groundnut in the world after China and India with
a production of 16,114,231, 6,933,000 and 2,962,760 tons respectively in 2011. In Nigeria,
the crop is presently grown throughout the country with the exception of the riverine and
swampy areas. The leading producing states in Nigeria include Niger, Kano, Jigawa,
Zamfara, Kebbi, Sokoto, Katsina, Kaduna, Adamawa, Yobe, Borno, Taraba, Plateau,
Nasarawa, Bauchi, and Gombe States (Yusuf, 2008).
In the Northern part of Nigeria, apart from being consumed raw, edible groundnuts are
processed into many local foods or included as an ingredient in a wide range of other
products which includes groundnut paste which is fried to obtain groundnut cake (kuli kuli),
salted groundnut (gyada mai gishiri), a gruel or porridge made with millet and groundnut
(kunun gyada), groundnut candy (kantun gyada) and groundnut soup ( miyar gyada). The
shells are used for fuel by some local oil factories or they are sometimes spread on the field

iv
as a soil amendment. They could also be used as bulk in livestock rations or in making
chipboard for use in joinery (Mukhtar, 2009).
In Zamfara State, in particular, some of the processed local foods from groundnut include
Nigeria groundnut cake called „kulikuli’, groundnut oil (mangyada), groundnut pap (kunun-
gyada), salted groundnut (gyada mai gishiri), et cetra. The root could also be processed in a
variety of ways, like roasting, baking, boiling, frying or drying for flour while the seeds can
be substituted for beans or lentile in soups and stews (Brian, 2009).
Groundnut cake is a popular local food consumed even by both the urban and the rural
population in Zamfara State. However, despite the importance of groundnut oil and cake
processing ventures in employment generation and poverty reduction among the rural
population in Zamfara State, there was paucity of information about their impacts on the
poverty level of the processors in the State. In order to close this gap, this research focused
on the processing of groundnut into groundnut cake (Kulikuli) and groundnut oil
(mangyada) in Zamfara State. The impact on the poverty level of the processors as well as
the defects associated with the processing methods were investigated and analyzed.
1.2 Problem Statement
The groundnut cake and oil known as „Kulikuli‟and mangyda respectively in Hausa
language contained about 40-50% protein and is a valuable feed mainly for poultry. It is also
used in preparing groundnut soup. Groundnut flour produced from the cake can also be used
for enriching tuber flours such as cassava flour which is low in protein (Aseidu, 2009).
Groundnut cake is a popular local food consumed by the rural population in Zamfara State
in addition to groundnut oil. However, despite the importance of groundnut oil and
groundnut cake processing ventures in employment generation and poverty reduction among
v
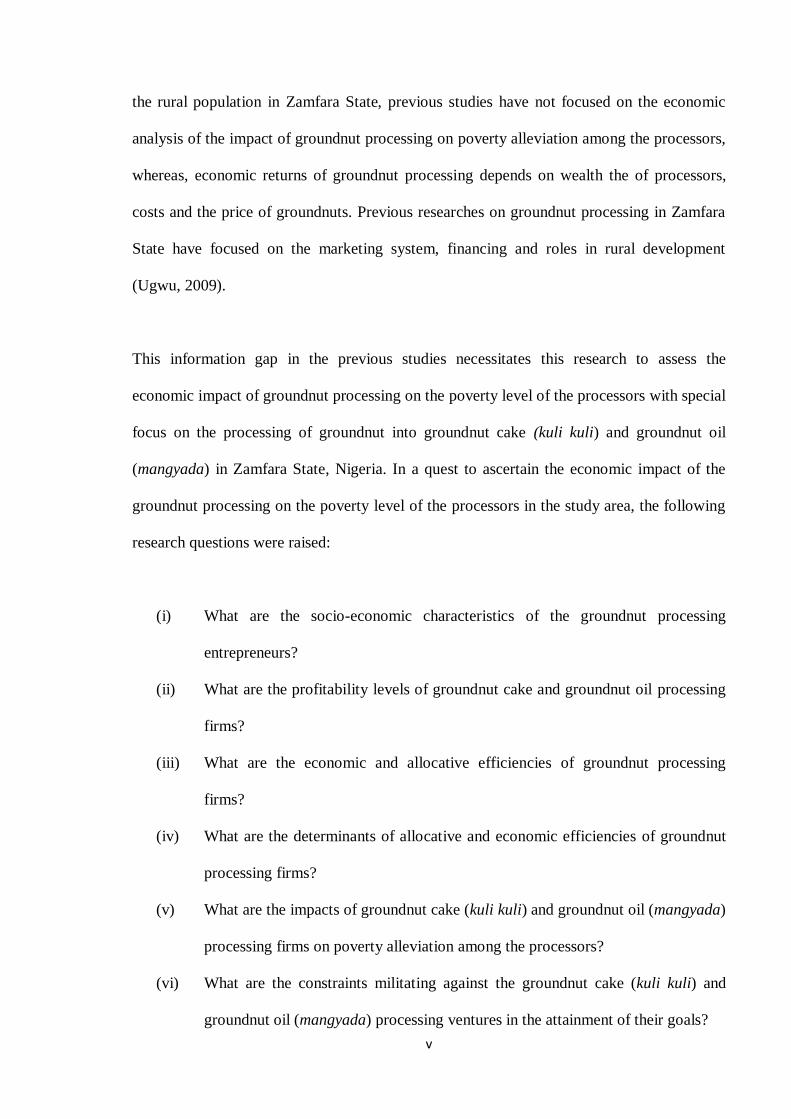
the rural population in Zamfara State, previous studies have not focused on the economic
analysis of the impact of groundnut processing on poverty alleviation among the processors,
whereas, economic returns of groundnut processing depends on wealth the of processors,
costs and the price of groundnuts. Previous researches on groundnut processing in Zamfara
State have focused on the marketing system, financing and roles in rural development
(Ugwu, 2009).
This information gap in the previous studies necessitates this research to assess the
economic impact of groundnut processing on the poverty level of the processors with special
focus on the processing of groundnut into groundnut cake (kuli kuli) and groundnut oil
(mangyada) in Zamfara State, Nigeria. In a quest to ascertain the economic impact of the
groundnut processing on the poverty level of the processors in the study area, the following
research questions were raised:
(i) What are the socio-economic characteristics of the groundnut processing
entrepreneurs?
(ii) What are the profitability levels of groundnut cake and groundnut oil processing
firms?
(iii) What are the economic and allocative efficiencies of groundnut processing
firms?
(iv) What are the determinants of allocative and economic efficiencies of groundnut
processing firms?
(v) What are the impacts of groundnut cake (kuli kuli) and groundnut oil (mangyada)
processing firms on poverty alleviation among the processors?
(vi) What are the constraints militating against the groundnut cake (kuli kuli) and
groundnut oil (mangyada) processing ventures in the attainment of their goals?
vi
1.3 Objectives of the Study
The broad objective of the research is an economic analysis of groundnut processing and its
impact on poverty level of the processors in Zamfara State. The specific objectives are to:
(i) describes the socio-economic characteristics of the groundnut processing
entrepreneurs;
(ii) estimates the profitability of groundnut oil (mangyada) and groundnut cake (kuli
kuli) processing firms;
(iii) determines the economic and allocative efficiency of groundnut processing firms;
(iv) identify the socio-economic determinants of allocative and economic efficiency
of groundnut processing firms;
(v) examines the effect of groundnut oil (mangyada) and groundnut cake (kuli kuli)
processing firms on poverty alleviation among the processors; and
(vi) describes the constraints militating against the groundnut oil (mangyada) and
groundnut cake (kuli kuli) processing firms in the attainment of their goals.
1.4 Research Hypotheses
The following null hypotheses were tested:
(i) The socio-economic characteristics of the groundnut processing entrepreneurs do
not influence the economic and allocative efficiencies of the processors in
Zamfara State.
(ii) The groundnut oil and groundnut cake processing have no impact on poverty
levels of the processors in Zamfara State.
(iii) The groundnut oil and groundnut cake processing in the study area are not
profitable ventures.

vii
1.5 Justification for the Study
In view of increasing concerns about poverty and unemployment, especially among low-
income categories in Nigeria, the need for investments in the small-scale sub-sector becomes
necessary (Oregwu, 2013). There is evidence that employment in small rural enterprises
often exceeds that in large urban industrial firms. The empirical evidence available for more
recent periods indicated that on the aggregate, rural industrial and other nonfarm
employments and outputs have been increasing, rather than decreasing, with development
(Chuta and Liedholm, 1989).
Groundnut, an important oil seed crop, provides significant sources of cash through the
sales of seed, cakes, oil and haulms. Groundnut plays an important role in the diets of rural
populations. Groundnut production and processing is one of the major activities of the rural
people in Zamfara State. Hence it is a source of livelihood for many people such as
groundnut processors, groundnut farmers, marketers, transporters, etc. transformation of
groundnut industry through processing would enhance the overall economic development
through the income and employment generation in the rural economy of Zamfara State.
Generating information on efficient method of groundnut processing helps in alleviating the
problems encountered by the processors as well as improves their standard of living. Such
data on groundnut processing provide information on the profitability and efficiency of the
enterprise and guides the processors on whether or not to embark on groundnut processing
investments.
The output of this research is significant in guiding the policy makers, directing the
government towards effective food production and revamping the agricultural sector with
specific emphasis on groundnut processing. It is expected that the findings of this research

viii
will provide feedback to researchers such as The Institutes for Agricultural Research (IAR)
Samaru, Zaria, National Agricultural Extension and Research Liaison Services (NAERLS)
and International Crop Research Institutes for Semi-Arid Tropics (ICRISAT). In addition
the findings from the study will contribute to increasing literature on agricultural processing
in Nigeria and the world over.
ix
CHAPTER TWO
LITERATURE REVIEW
2.1 The Groundnut (Arachis Hypogeal) Production
Groundnut (Arachis Hypogeal) originated from South America, but is now widely cultivated
throughout the tropical, sub-tropical and temperate countries, and in Africa, Asia, North and
South America. Optimum mean daily temperature to good growth is 3000C and growth
ceases at 1500C and cool temperature delay flowering (Asongwa, Ihemeje ,and Ezihe, 2011).
Between 500-600mm of water reasonably distributed through the growing season allows a
good production. Groundnut does well on sandy–loam soil, with pH range of 5-7 and soil
should be rich in calcium and phosphorus which are essential for pod formation. It has the
bunch, erect and creeping type (Ayozie, 2009). The popular varieties in Nigeria are kano
local, kano 50, Castle- cary, Samnut 21, 22, and 23 (rosette resistant varieties). Groundnut
can be a sole crop or intercropped. It performs better as sole crop. Groundnut is an important
oilseed and food crop for millions of people in the semi-arid tropics. It generates
employment on the farm during cultivation and in agro-processing (CGIAR, 2009). It is the
13th most important food crop of the world and the 4th most important source of edible oil.
Its seeds contain high quality edible oil (50%), easily digestible protein (25%) and
carbohydrates (20%) (FAO, 2004). As such, it is an essential food product that enjoys good
patronage in both the domestic and international market as a veritable source of edible oil,
animal feed and also consumed as snacks (Nnamdi, 2010).
Africa accounts for 38% of global groundnut area and 25% of production. Nigeria is a major
producer of groundnuts accounting for 25% of world exports (IFPRI, 2012). In 2004 the
country had 3500 hectares cultivated and production of 2750 tonnes (NBS, 2013).
Groundnut accounted for 70% of total Nigeria export prior to petroleum oil boom (World
x
Geography of Peanut, 2013). Groundnut is widely consumed in Nigeria as roasted or boiled
nuts in the Western and Southern parts of the country (Adebesin et al., 2011).
In Nigeria, the processing of groundnut into various products is done mostly by women
either for home consumption or for commercial purposes (Ibrahim et al., 2005). The most
common commercial products of groundnut are: groundnut oil, groundnut cake and fried
peanuts which are sold at market places or hawked on the streets, (Ihekoronye and Ngoddy,
1985). In Zamfara State, the participation of women in groundnut production had been
acknowledged by several authors. Women are involved in planting, weeding, harvesting,
processing, storage and marketing. Women farmers are resource poor and illiterate
groundnut producers, they partake in all aspects of the groundnut value chain. They own
farms through their husbands or inheritance for their groundnut production (Ranjha et al.,
2009).They work to acquire basic necessities such as food, clothing and shelter, through
groundnut production.
Limitations in groundnut production ranges from land availability, labour, fund, availability
of appropriate fertilizer dosage, disease control, post harvest challenges, proper storage to
marketing. In the past several technologies have been introduced to the farmers to enhance
their performance and these have impacted positively on productivity. On the other hand,
there are some locations in Zamfara State that were not been captured during dissemination
of groundnut technologies for increased return on production and to effectively utilize the
potential of this crop (Onugu, 2005).
Therefore to up-scale production to meet increasing interest in groundnut for industrial
revolution, emphasis should be placed on the relationship between farmers‟ socio economic,
demographic and institutional variable on the adoption of certified seeds, use of insecticides,

xi
storage techniques and timely harvest. It is imperative to access the effectiveness and
adoption of groundnut production technologies information packages among farmers in
Zamfara state. In addition, it is imperative to understand the factors that could be improved
to ensure increased production among women farmers in Zamfara State. The objectives of
this study are to determine the socio economic and demographic variables of groundnut
farmers in Zamfara State. Attempts were made to determine the economic viability of
groundnut production technologies among farmers, and the allocative efficiency of
groundnut production technologies among farmers in Zamfara State (Simonya et al., 2011).
2.2 Concept of Processing
Processing is defined as any activity that maintained or raises the quality or alters the
physical and/or chemical characteristics of a product, material, object et cetra. Processing
can be simple and quick or complicated. Many farm products must be processed before they
can be used as intended, this include groundnut cake and oil. Many agricultural products are
perishable and only available for short period of time (Diamond and Williams, 1993).
Processing extends the season for which they are available. Processing operation may be
carried out continuously or intermittently. Processing helps to provide more varied and
higher quality meals, reduces waste in the food preparation process and stabilizes costs
through portion control. Processing brings about significant cost saving (Collins, 1988).
These cost savings can be in the form of a discount in the commercial price or by way of a
refund from the processor. Processing is now an integral part of day-to-day service operation
(USDA, 2009).
2.2.1 Processing of groundnut

xii
Groundnut processing is basically the transformation of the primary agricultural products
(raw groundnut) into other finished commodities like groundnut oil, cake and animal feed
among others. Processing of groundnut perhaps is the best area an investor can engage in
with maximum utilization of the product (Olomola, 2004). The milling of the product would
yield edible oil which can be refined to get vegetable oil and groundnut cake which is a
valuable input in the preparation of animal feed and as such can be sold to animal feed
millers. Therefore, groundnut processing can lead to reduction in food wastage, enhanced
food security, improvement in livelihood of low income (Oluwatayo, et al., 2008).
In Zamfara State, ground-nut is grown by the small farmers and processed in different ways
into different local foods and products. The process produced a roasted Nigeria groundnut
cake called ‘kulikuli’. Also, there are two parts of groundnut that are edible, including roots
and the seeds. The root can be processed in a variety of ways, like roasting, baking, boiling,
frying or drying for flour. The small seeds can be substituted for beans or lentile in soups
and stews (Brian, 2009).
However, the results of studies presented by Azizah and Zaimon (2007) suggested that
roasting leads to reduction in Insoluble Dietary Fibre (IDF) and Total Dietary Fibre (TDF),
informed that toasting enhances the flavour and the taste of the food in infant formulation. It
also said that toasting leads to improved digestibility and reduction in formulate food.
The toasting of groundnut with sugar and honey is a new addition just over a decade ago in
the northern Nigeria of which Zamfara, the research study area, is a part. It requires little
capital for production. However its acceptance by the adult class is still in a low ebb because
of some undesirable qualities found in the products. These defects were highlighted and
processing methods to prevent their occurrence investigated.

xiii
2.2.2 Processing of groundnut into groundnut cake ( Kuli kuli)
Kuli kuli is a Northern Nigerian snack that is made from dry roasted groundnuts, grinded
into a semi-paste, mixed with select spices and deep fried until it hardens.
Ingridients for Kuli kuli
Dry roasted groundnuts.
Grated Ginger.
Pinches of grinded Chilli pepper(optional)
Groundnut oil, for frying.
Kuli kuli Making Process
Grind or Pound the roasted groundnuts and ginger, by using a dry mill or mortar,
until smooth. Little oil is sometimes added to the mill/blender to easy grinding.
However, care must be taken in order not to allow it turn completely to paste.
Next, squeeze the groundnut paste to remove as much oil as possible (this step is
very important in producing a very crunchy kuli kuli).Therefore in getting the
crunchiest kuli kuli, squeezing out as much oil out of the paste,as possible is very
essential.
Mold the paste into any shape of choice: circular shape, flat shape, elongated/spindle
shape, et cetra. Little water can be added to help it mold easily).
Now heat about 4 cm deep of groundnut oil in a frying pan or pot, until the oil begins
to smoke. Few slices of onion or cloves can be added to the oil to give it some extra
flavor.
xiv
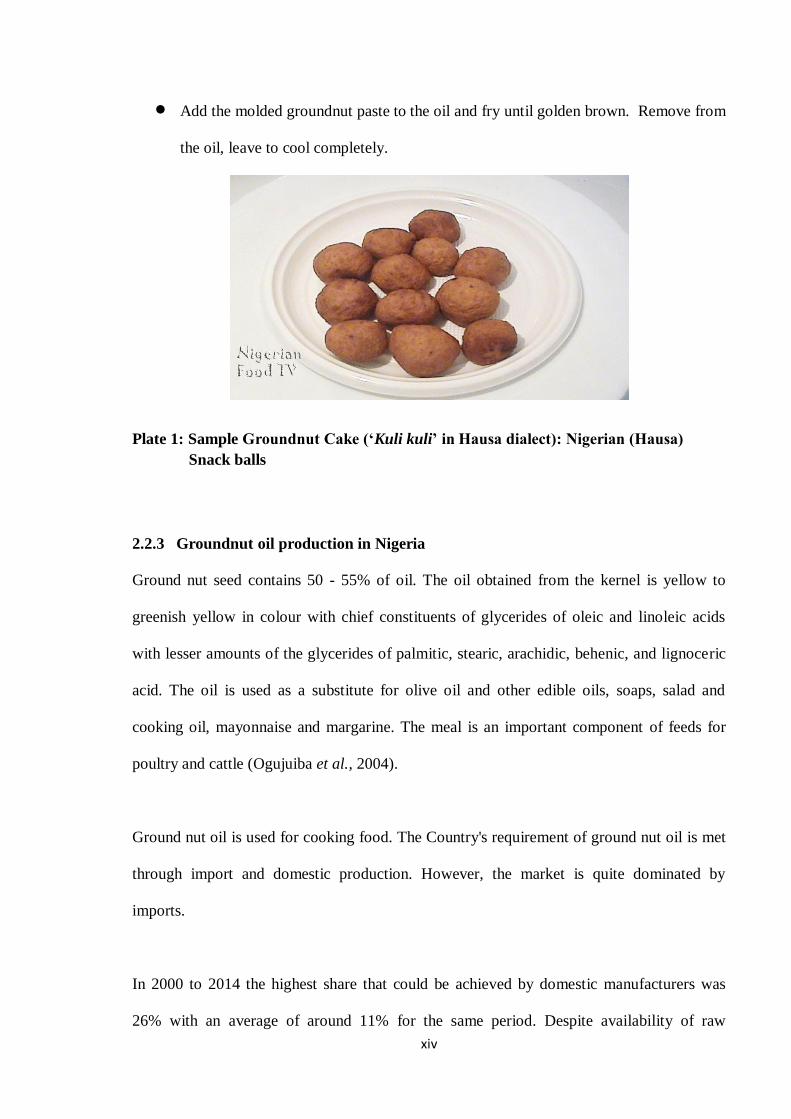
Add the molded groundnut paste to the oil and fry until golden brown. Remove from
the oil, leave to cool completely.
Plate 1: Sample Groundnut Cake (‘Kuli kuli’ in Hausa dialect): Nigerian (Hausa)
Snack balls
2.2.3 Groundnut oil production in Nigeria
Ground nut seed contains 50 - 55% of oil. The oil obtained from the kernel is yellow to
greenish yellow in colour with chief constituents of glycerides of oleic and linoleic acids
with lesser amounts of the glycerides of palmitic, stearic, arachidic, behenic, and lignoceric
acid. The oil is used as a substitute for olive oil and other edible oils, soaps, salad and
cooking oil, mayonnaise and margarine. The meal is an important component of feeds for
poultry and cattle (Ogujuiba et al., 2004).
Ground nut oil is used for cooking food. The Country's requirement of ground nut oil is met
through import and domestic production. However, the market is quite dominated by
imports.
In 2000 to 2014 the highest share that could be achieved by domestic manufacturers was
26% with an average of around 11% for the same period. Despite availability of raw

xv
materials like ground nut, linseed, nigger seed, sesame, rapeseed, cotton seed in the country,
packed edible oil of foreign sources are flooding the market (see Table 2.1).
Table 2.1: Supply of Edible Oil (Tonnes)
Year Domestic
production
Imports Total
2000 6,579 70,789 77,368
2002 6,637 24,785 31,422
2004 8,329 34,196 42,525
2006 7,999 22,283 30,276
2008 8,027 121,812 129,839
2010 6,931 82,014 88,945
2012 4,882 69,473 74,355
2014 8,329 34,196 42,525
Average 7,054 (11%) 60,764 (89%) 67,818
Percentage shares: Domestic production = 26 %; Imports = 74%
Source: Customs Authority for import, CSA, Statistical Abstract for Domestic Production,
2015.
Table 2.1 reveals that domestic production of edible oil was fluctuating around a mean
figure of 7054 tonnes. On the other hand import of edible oil has shown a substantial
increase during the recent years. The import level which was in the range of 22,283 tonnes
and 34,196 tonnes during the year 2002-2004 has increased to 121,812 tonnes, 82,2014
tonnes and 69,473 tonnes during 2008 , 2010 and 2014 , respectively.
xvi
Total apparent consumption (local and imported), during the past fourteen years ranged from
30,276 tonnes (2006) to 129,839 tonnes (2008). The mean apparent consumption in those
years was 67,818 tonnes and this amount is considered to represent effective demand for the
year 2014. Moreover, in order to estimate the present (2015) demand it is assumed that
demand for the product grows at a rate of 4% which is equivalent to the growth of
population.
Accordingly, taking the year 2014 apparent consumption as a base and applying a growth
rate of 4% the current unsatisfied demand which excludes local production is estimated at
65,722 tonnes.
2.2.4 Groundnut oil processing and technology used
To produce groundnut oil, the principal raw material required for the production is ground
nut seeds, which are produced locally in different parts of Zamfara State. All the other raw
materials are also found locally. Groundnut with pedigree to produce oil are then procured
and brought to the local factory. The technology for processing can be grouped into two:
manual pressing/extraction and mechanical pressing. For the manual method, the procured
nuts are sorted out and cleaned, roasted, grinded into viscous liquid-form before being fed
locally into the mutter. An elongated pestle or stick is then used to turn and compress to
extract the oil. The extracted oil is then refined through the process of filtration and
heating. The end product is then collected and packaged in the desired containers. The
procured nuts could also be sorted, cleaned and fed into mechanical machine for extraction
(Odedokun, 1998).
Ground nut oil production process, based on mechanical pressing technology, can be
grouped into three stages: seed preparation, pressing and crude oil refining. The seed

xvii
requires undergoing a thorough cleaning process to remove sand, stalk, plant debris and any
other foreign matters by rotary or table sieve. Usually, the screening process is assisted by
air aspiration unit. After cleaning, the seeds have to be prepared for efficient oil recovery by
pressing. The stages involved are size reduction of the seeds by breaking them and then
conditioning the seeds by adjusting their moisture content and temperature, while keeping
the seeds hot (say 90 -95ºc) for a period of 30-60 minute. Then the prepared seed shall be
conveyed to the screw pressing machine where it is pressed by the action of warm and outer
shell (Makinde and Fayomi, 2008).
However, the used of mechanical extraction method is not very popular among local
producers in the study area. Establishment of this project involves feasibility study
preparation, procurement and installation of machines in the appropriate accommodation,
recruitment of personnel and project commercial take-off.
2.2.5 Groundnut processing, poverty reduction and economic growth in Nigeria
Several studies have focused on understanding the association between groundnut
processing, poverty reduction and economic growth, yet there are some disagreements.
However, the relationship between the groundnut processing sectors and other sectors
should not be a competition but rather be viewed as interdependent where supply and
demand in sectors can be accommodated through strengthened linkages (Blum, 1995). For
instance, industry is an important sector and every economy that strives for development
should work toward strengthening its industries (Levi, 2000).
Nonetheless, the position of groundnut processing sector in the strive for industrialization
should not be ignored as the case has been in Nigeria. As argued by advocates of
agriculture-led growth (ALG), development of the processing sector is a prerequisite for
xviii
industrialization through increase in rural incomes and provision of industrial raw materials,
provision of a domestic market for industry and above all the release of resources to support
the industry (Schultz, 1964; Timmer, 2004). Neglect of the agricultural processing sector in
favour of the industrial sector will only lead to slow economic growth and inequality in
income distribution. Therefore, despite the fact that processing of agricultural produce may
be unable to single-handedly transform an economy, it is a necessary and sufficient
condition in kick-starting industrialization in the early stages of development (Byerlee et al.,
2005).
The contributions of groundnut processing ventures to economic growth can be examined
through the roles of the sector in the economy. Johnston and Mellor (1961) summarized
these roles in five inter-sectoral linkages; food, labour, market, domestic savings and foreign
exchange. The most basic of these roles is, perhaps the supply of food for both domestic
consumption and export. Direct contributions of food production can be through income
generated from sales of farm produce and returns from economic activities related to
production; or indirectly from increased capacity to partake in any form of economic activity
through improved diet. Anyawu et al. (2010) using correlation matrix find that production of
major staples in Nigeria contributed significantly to GDP growth (except wheat) between
1990 and 2001. Also, as observed by Timmer (1995) the agriculture sector contributes to
economic growth through provision of better caloric intake and food availability. The
attainment of global food security and reduction of hunger hinges largely on this singular
role.
According to Food and Agriculture Organization (FAO) (2005), agriculture can facilitate the
attainment of all 8 MDGs through the direct or indirect linkages to food availability and
poverty reduction. In 2008, UNDP reported that the 12.6% reduction recorded in the

xix
proportion of underweight children between 1990 and 2008 can be attributed largely to
growth in the agriculture sector in Nigeria (UNDP, 2008).
Furthermore, as population increases, failure to increase food supply in proportion to
increased demand has negative effects on industrial profits, investment and economic
growth (Johnston and Mellor, 1961). Hazell and Roell (1983) asserted that in the early
stages of development, rising incomes of rural/farming households is essential to providing
market for domestically produced goods and services via strengthened purchasing power.
The most direct contribution of agriculture to economic growth, according to Irz (2001), is
increase in incomes of farmers and therefore their purchasing power. Results of several
studies, including Gallup (1997), Irz (2001) and Thirtle (2001) showed that an increase in
agriculture growth results in an increase in the income level of the poorest of the population.
Also results from cross-country regressions among developing countries show that $1
increase in GDP results in significantly more poverty reduction when the growth is in
agriculture rather than other sectors (Lipton, 2012). This sectoral growth increases the
incomes and therefore purchasing power of farmers resulting in a vibrant domestic market
for other sectors, hence growth in the economy.
An offshoot of income growth is increased domestic savings, both at micro and macro levels
as observed in developed economies like Japan, Taiwan, South Korea, Hong Kong and
recently, China (Harbaugh, 2004). Agriculture therefore contributes to economic growth by
increasing the incomes of majority of the population thereby strengthening their saving
capacity. Results from an IFPRI publication on Ethiopia‟s growth and transformation plan
shows that increased domestic savings is imperative to the achievement of higher Total
Productivity (GTP) (Engida et al., 2011). Using Tobit regression model on multi-stage data
from Kwara state, Nigeria, Obayelu (2012) finds that domestic saving is low among rural

xx
dwellers/farmers in Nigeria. He highlights the effect of high expenditure on food, which is a
consequence of low income due to low productivity, on saving capacities of the farming
households in the study. This implies that domestic savings largely influences the growth
path of the economy.
2.2.6 An overview of the concept of poverty
A concise and universally accepted definition of poverty is elusive largely because it affects
many aspects of the human conditions, including physical, moral and psychological.
Different criteria have, therefore, been used to conceptualize poverty (Adeyeye and
Ajakaiye, 1987). Most analyses follow the conventional view of poverty as a result of
insufficient income for securing basic goods and services. Others view poverty, in part, as a
function of education, health, life expectancy, child mortality etc. Blackwood and Lynch
(1994) identified the poor, using the criteria of the levels of consumption and expenditure.
Further, Sen (1983) related poverty to entitlements which are taken to be the various bundles
of goods and services over which one has command, taking into cognisance the means by
which such goods are acquired (for example, Money and Coupons etc) and the availability
of the needed goods. Yet, other experts see poverty in very broad terms, such as being
unable to meet “basic needs” (physical; (food, health care, education, shelter etc. and non –
physical; participation, identity, etc) requirements for a meaningful life (World Bank, 1996).
Poverty may arise from changes in average income or changes in the distribution of income.
It is generally agreed that in conceptualizing poverty, low income or low consumption is its
symptom. This has been used for the construction of poverty lines. Various theories have
been advanced in order to put in proper perspective the mechanics of poverty. The orthodox
Western views of poverty, reflected in the “Vicious circle” hypothesis stating that a poor

xxi
person is poor because he is poor, and may remain poor, unless the person‟s income level
increases significantly enough to pull the person in question out of the poverty trap
(Johnston and Mellor, 1961). To the classical school of thought, such improvement can only
be real and sustained, if and only if, the population growth is checked and the “limits of
growth” are eliminated. Further, the early classical theorists in the attempt to illuminate on
the concept of poverty based their analytical framework on the laws of diminishing returns
which was believed to be universal in content although this was later upgraded at the time of
Alfred Marshall and his contemporaries when the law of increasing returns in industry was
more clearly articulated (Levi, 2000).
2.2.7 Dimension of poverty in Nigeria
The incidence of poverty in Nigeria has generally been on the rise since 1980, with two
significant dips during 1985- 1992 and 1996-2004. Focusing on the most recent surveys
(1996 and 2014), the national poverty incidence was 65.6 percent in 1996 and declined to
54.4 percent in 2004 and rises to about 71 percent in 2014 (Ajakaiye, 2014). Similarly, in
1996, the poverty depth (P1) and poverty severity (P2) were 0.358 and 0.207, but these
decreased respectively to 0.225 and 0.122 in 2004 (IFPRI, 2014). Estimates of inequality
also indicate that Nigeria has more unequal distribution of income than Ethiopia,
Madagascar, India, and Niger. Further analysis also suggests that poverty in Nigeria is
predominantly a rural phenomenon, with rural poverty increasing from 28.3 percent in 1980
to 63.8 percent in 2004. However, the proportion of the urban poor also rose from 17.2
percent in 1980 to 54.1 percent in 2004 and 71.6 percent in 2014.
Thus, within rural areas approximately 44.4 percent of households in 2004 could not meet
their food expenditure requirements. Another 19.4 percent could meet their food expenditure
requirements, but not the minimum expenditure to cover other basic needs (NBS, 2007). In

xxii
the case of urban households, 26.7 percent were not able to meet their required food
expenditure requirements while 16.4 percent could meet their food expenditure but not other
non-food basic expenditure needs (Ajakaiye, 2014).
The predominance of rural poverty over urban has been consistent during 1996 to 2004. In
1996, about 70 percent of rural households were poor, as compared with 58 percent of the
urban households. In 2004, the incidence of urban poverty declined more rapidly than rural
poverty with 64 percent of rural households being poor (a 6 percent decrease) while urban
poverty decreased by 15 percent to 43 percent. The same pattern holds true for the other
poverty indices (depth and severity). It is important to note that the incidence, depth and
severity of poverty among rural households are higher than the national poverty figures,
while those of the urban households are lower (Foster, 1984).
The North West, North East and North Central zones have the highest poverty incidence,
depth and severity in descending order while the South West, South East, and South-South
have the lowest poverty incidence, depth and severity in ascending order. All zones
witnessed reductions in their poverty measures (incidence, depth and severity) from 1996 to
2004 except the North West where poverty incidence increased from 72.7 percent to 76.4
percent. The reductions in the poverty incidence, depth, and severity for rural households in
the southern zones are greater than those achieved by their northern counterparts. Hence, it
could be concluded that poverty is more prevalent in the northern zones than in the southern
zones (Akanngbe, 2011).
2.2.8 Dimension of poverty in Zamfara State
In terms of poverty, Zamfara is one of the States of the federation with poverty rate above
70 percent. At the end of 2012, the poverty rate in the state was 70.8 percent. The Sokoto

xxiii
State remained the poorest state in the country, with 81.2 per cent poverty rate (NBS, 2014).
According to the information, other states with over 70 per cent poverty rate include
Katsina, 74.5 per cent; Adamawa, 74.2 per cent; Gombe, 74.2 per cent; Jigawa, 74.1 per
cent; Plateau, 74.1 per cent; Ebonyi, 73.6 per cent; Bauchi, 73 per cent; and Kebbi, 72 per
cent (NBS, 2014).
The state with the lowest poverty rate was Niger with 33.8 per cent, followed by Osun with
37.9 per cent and Ondo, 45.7 per cent. Others with less than 50 per cent poverty rate were
Bayelsa State, 47 per cent and Lagos State, 48.6 per cent (NBS, 2014).
The average poverty rate of the states in the North -West geopolitical zone remained the
highest at 71.4 per cent followed by North-East 69.1 per cent and North Central, 60.7 per
cent. The record showed that poverty was least prevalent in the South-West, with an average
of 49.8 per cent, followed by South-South, 55.5 per cent and South-East, 59.5 per cent.
According to National Bureau of Statistics (NBS) (2014) national unemployment rate stood
at 23.9 per cent at the beginning of 2012. There were no figures for 2011 but the 2012
statistics represented an improvement in the figures released by the bureau for 2010. For
unemployment rate, Zamfara State had the highest rate of 42.6 per cent, followed by Bauchi,
41.4 per cent. Other states with above 30 per cent unemployment rate included, Gombe, 38.7
per cent; Nassarawa, 36.5 per cent; Jigawa, 35.9 per cent; Edo, 35.2 per cent; Adamawa,
33.8 per cent and Kaduna, 30.3 per cent. According to the records, unemployment was least
in Osun followed by Kwara and Lagos (NBS, 2014).
2.2.9 Causes of rural Poverty in Nigeria
xxiv
According to Adeyeye and Ajakaiye (1989) there is no one cause or determinant of poverty.
On the contrary, combinations of several complex factors contribute to poverty. They
include low or negative economic growth, inappropriate macroeconomic policies,
deficiencies in the labour market resulting in limited job growth, low productivity and low
wages in the informal sector, and a lag in human resource development. Other factors which
have contributed to a decline in living standards and are structural causes or determinants of
poverty include increase in crime and violence, environmental degradation, retrenchment of
workers, a fall in the real value of safety nets, and changes in family structures. These are
examined below:
(i) Low economic growth performance: Growth of the economy is a must for poverty
reduction. In developing countries such as Nigeria growth that is employment generating
and with export base is desirable in order to achieve growth that is poverty reducing with
equity. Although the economic performance of countries in the World has generally been
highly volatile since the early 1980s, on the whole, growth rates have been low or negative,
with overall declines in several countries. This is due in part to external shocks such as
adverse changes in several country‟s terms of trade, changes in global demand for exports
and changes in global interest rates on developing countries external debt. All these are
probably responsible for the increase in poverty level in various countries of the world.
Extensive evidence links the importance of economic growth to poverty reduction (World
Bank 2010). For example, in Indonesia and Thailand poverty was reduced by between 30
and 40 percent during a twenty-year period in which annual growth rates were
approximately 3 percent (investments in the social sectors also contributed).
Accordingly, of a sample of countries, those that reduced poverty the least (for example,

xxv
India and Sri Lanka) had growth rates of less than 1 percent. Growth can reduce poverty
through rising employment, increased labour productivity and higher real wages it generates
(World Bank, 2010).
(ii) Macroeconomic shocks and policy failure: This has been a major cause of poverty in
several countries of the world. As many economies in the world faced macroeconomic
disequilibrium, mostly in the balance of payments due to expansive aggregate demand
policies, terms-of-trade shocks, and natural disasters, it become necessary to undertake
major policy reforms. In the process such economies became vulnerable to poverty
(Falconer, 1990).
Macro-economic shocks and policy failure account for poverty largely because they
constrain the poor from using their greatest asset “labour”. Also, monetary policies that
adversely affect cost and access to credit by the poor, fiscal policy which results in
retrenchment, lay-off and factor Substitution; exchange rate policy which raises the
domestic cost of production in an import dependent production system will affect the poor
negatively. However, an exchange rate policy which boosts exports particularly those in
which the poor are predominantly engaged (for example agriculture) will help reduce
poverty. The urban poor, as a result of policy failure, are vulnerable to job losses resulting
from job-cut-backs in the public sectors or from the decline of industries adversely affected
by shifts in relative prices. They also lose from the removal of food subsidies and other
welfare packages. Further, devaluation produce both negative and positive effects on equity
and poverty incidence. On the negative side higher production costs of import, especially in
import dependent economy usually result in declining capacity utilization rate in
manufacturing and lay –off and retrenchment in the private sector all worsening poverty
(Dasgupta, 1993).

xxvi
(iii) Labour markets deficiencies: The poor‟s most abundant resource is their labour, a
verilel labour market is important to reducing poverty and income inequality. In most
countries of the world the majority of poor households participate in the labour market in
one way or another, and thus poverty is a problem of low wages (in the informal sector), low
labour returns to rural self-employment activities, underemployment, and in some cases,
protracted unemployment. These problems are affected in different ways by deficiencies in
labour market. The majority of the labour force work as paid employees in the private
informal sector, followed by employees in the public sector. When there are deficiencies in
labour market, the poor are affected by limited job growth and absorption capacity in the
formal sector. Also, relatively high labour costs in the formal sector that lead to over
expansion of a low-productivity informal sector, thus putting downward pressure on wages
in the informal sector (where many of the poor work), and limited opportunities for
unskilled youth to acquire job training and skills can perpetuate a cycle of poverty (WHO,
2004).
(iv) Migration: Migration rates do reduce poverty especially when the majority of
individuals who migrate are skilled workers. On the other hand, individuals who emigrate
vacate jobs in labour markets. Thus, migration drains on skills. It reduces the pace of
economic growth and thus slows the process of overall job creation and affects the long-run
development potential in a country.
(v) Unemployment and underemployment: Employment is a key determinant of poverty.

xxvii
Gainful employment is important for individual to earn income and escape from “income”
poverty. While generally in countries of the world the non poor suffer from transitional or
involuntary unemployment, the poor are faced with problems of structural unemployment
due to lack of skills or extremely low educational levels, medical problems, geographical
isolation (which affects some of the rural poor in general and the urban poor due to
marginalization of persons living in high- crime neighborhood) and in some countries,
discrimination based on race or other attributes. Further, underemployment occurs largely in
the informal sectors and results in low incomes for an important segment of the labour force,
particularly in rural areas (Seyoum, 1998). Unemployment is due to low economic growth
than to the direct effects of imperfections in the labour market, although regulations
affecting the formal sector are likely to induce more underemployment in the informal
sector. In poorer, rural areas, this mainly takes the form of seasonal unemployment and in
urban areas those who have given up searching for work. High unemployment particularly
affects youths, women urban dwellers, and those “queuing” for good jobs in the formal
sector (Bifarin, 2011).
(vi) Human resource development: This is key for human capital development and
capability to escape from poverty. Continued investment in human capital with
improvements in efficiency is necessary to sustain reduction in poverty changes in the
labour market. Investment in people can boost the living standards of households by
expanding opportunities, raising productivity, attracting capital investment, and increasing
earning power: In addition, providing additional educational opportunities for adolescents
may prevent some youths from becoming involved with gangs, drugs and violence, given
the evidence linking the perpetrators of crime with school dropouts (Tanko and Opara,
2009).
xxviii
(vii) Health/diseases. Good health is basic to human welfare and a fundamental objective
of social and economic development. Poor health shackles human capital, reduces returns to
learning , impedes entrepreneurial activities and holds back growth and economic
development. Diseases cause poverty and vice versa. In most countries of the World major
diseases causing poverty are Malaria, HIV/AIDS and other infections/diseases. In Nigeria
for instance, AIDS prevalence is about 5.4% with an infected adult population of 2.6
million. This will constrain availability and participation of this segment of the population in
the labour market to earn income (Ugwu, 2009).
(viii) Debt burden: In several developing countries of the world, debt burden is assuming
increasing importance as a cause of poverty. In such countries servicing of the debt has
encroached on the volume of resources needed for socio-economic development. The
productive sector such as agriculture, manufacturing etc are equally constrained leading to
low productivity, low capacity utilization, under employment and low purchasing power
thereby subjecting the masses of the people to abject poverty. In Nigeria, at the end of
December 2000 external debt stood at US$28.5 (about 80% of GDP). Amount required to
service this debt annually is enough to hamper government expenditure for the provision of
social and physical infrastructure for the poor (Zuberu et al., 2013).
(ix) Governance: The persistence and pervasiveness of poverty in several countries has
been linked to the lack of popular participation in governance and decision- marking as well
as weak institutional base. This has led among other things to poor accountability,
transparency in resource allocation, weak programme implementation and monitoring.
Ultimately, development programmes are rendered ineffective poverty reduction initiatives
are therefore ineffective and resources wasted (Weir and Knight, 2000).

xxix
(x) Environmental Degradation: Environmental degradation is a cause of accentuated
poverty. At the same time, poverty itself can be a cause of environmental degradation.
This reverse causality stems from the fact that for poor people in poor countries such as
Nigeria, a number of environmental resources are complementary in production and
consumption to other goods and services while a number of environmental resources
supplement income most especially in time of acute economic stress (Falconer and Arnold,
1989, Falconer 1990). This can be a source of cumulative causations, where poverty, high
fertility rates and environmental degradation feed upon one another. In fact, an erosion of
the environmental resource base can make certain categories of people destitute even when
the economy on the average grows (Dasgupta, 1993).
In several countries of the world inaccessibility of the poor to credit and resource inputs
leave them with no choice order than to employ natural resources such as forests, woodlands
and rivers in order to survive. Quite often, their continuous exploitation of these resources
have led to stress/depletion and environmental degradation thereby making poor both agents
and victims of unsatisfactory ecological practices. In most rural areas, developing countries
fallow duration has declined to four to five years and in several instances as low as two
years. Short fallow period is usually not adequate for regeneration of vegetation and the
restoration of host nutrients; soil and water quality are therefore quickly depleted. Among
the poor; frequent cutting of forest trees with low replanting rate has resulted in scarcity of
fuel wood. Immediate effect of this is that poor households turn to alternative fuels such as
crop residues, coconut husks, rice hulls or elephant grass. The smoke from these inferior
fuels according to Cece Laki (1985), is often more poisonous than that of fuel wood, while
emissions from all biomass fuels are known to be dangerous sources of air pollution in the
house. Also, scarcity of fuel woods forces women to make what is available burn slowly.
WHO (2004) reckons that under slow burning conditions wood fuels are capable of
xxx
producing pollution concentrates higher than fossil fuels and subject the households to more
smoke pollutants.
The incessant cutting down of trees for firewood and charcoal have hindered prospect for
increased yield and hasten the prospect of the creeping desert while profligate use of the
country‟s resources by industries and industrial pollution from improper waste disposal has
further exacerbated the plight of the poor. Other consequences of over exploitation of
environment due to poverty are depletion of fish in the local rivers and streams.
(xi) Crime and Violence: A steady increase in crime and violence has degraded the quality
of life to a varying extent in many counties of the world. Although individuals of all
socioeconomic groups are affected, the urban poor are particularly vulnerable to these social
problems. There are instances of shootings, gang killings, etc. Crime and Violence have
serious economic costs. For instance, an increasing proportion of public resources, which is
limited, is required to strengthen police enforcement, support the growing prison population,
finance the demands place on the judicial system, and provide health care for persons
injured by violence (Yususf, 2008). Other costs include the expensive security systems and
guards now required by businesses and homes, the loss in potential revenues from foreign
investor and tourists who have sought other destination as a result of the threat of crime, and
the migration of the urban middle class. Because of the heterogeneous nature of the poor, it
is difficult to link poverty, crime and violence directly. However the adverse social
consequence of crime have been closely associated with poverty e.g loss of lives at
productive age and quantum loss of properties (Udoh, 2008).
2.2.10 General approach for reducing poverty
xxxi
Almost half the world's people (some 2.8 billion) live on less than $2 a day, and a fifth
(some 1.2 billion) live on less than $1 a day. This horrific level of poverty persists despite
unprecedented but unevenly distributed increases in global wealth in the past century. Over
the past 40 years the gap between rich and poor has doubled, with income in the richest 20
countries now averaging 37 times that in the poorest 20 (World Bank, 2000).
The bank‟s new strategy builds on the experience of the past decade in proposing a broader
approach to fighting poverty. The three-pronged approach focuses on increasing
opportunities for poor people, facilitating their empowerment and enhancing their security.
In spite of the challenges confronting small -and medium -scale enterprises in Nigeria,
government realized the role of SMEs as the catalyst for poverty eradication and economic
growth through employment, and their contribution to macro-economic development.
(Omolola, 2008). Government in the past has established various support institutions
agencies and reliefs measures aimed at enhancing and improving the capacity of SMEs.
Example of these includes specialized banks such as Bank of Industry (BOI), to offer
investment credits and loans to improve the investment capacity of SMEs.
The establishment of Bank of Industry (BOI), small and medium scale enterprises
development agencies of Nigeria (SMEDAN), the facilitation of small and medium scale
industries equity investment scheme (SMIEIS) and other employment generation and
poverty alleviation scheme such as National Economic Empowerment and Development
strategies (NEEDS), at national level, State level and Local Government level,, were all
signs of prosperity in the live of SMEs in Nigeria. As Onugu (2005) put it the economic
reform programme would aid the creation and consolidation of existing small and medium
scale enterprises because of its focus on income generating opportunities for the people.
(Onugu, 2005). Similarly, Omolola (2008) views the current effort of government since

xxxii
1999 towards revamping SMEs as a sustainable process capable of building the prospect of
small and medium scale enterprises and a path to national recovery of the Nigerian ailing
economy.
While lauding government effort, the organized private sector is also making a vital
contribution in this direction. As Onugu (2005) observed, the capital market, driven by the
Nigerian stock exchange (NSE) and the security and exchange commission (SEC) has not
only been expanding its facilities for small and medium scale enterprises to access funds
from the market.
At the international front, the globalization and current economic reforms which has
liberalization, commercialization and privatization as its main components has also opened
up vista for the SMEs and entrepreneurs. The liberalization of trade through world trade
agreement has opened up opportunities to SMEs to access international markets. The
African Growth Opportunity Act also offers incentives to exporters from African countries
to the United State of America. (Onugu 2005; Omolola, 2008).
Faced with the unprecedented poverty level, the Nigerian Federal Government developed
some programmes towards poverty alleviation between 1990 and 2010. These programmes
include:
(i) National Directorate of Employment (NDE)
Decree number 24 of October 19, 1986 established this Directorate, which commenced
operation in January 1987 with the primary role of promoting skill acquisition, self-
employment and labour intensive work schemes. It also collects and maintains a data bank
on unemployment and vacancies in the country. It has been concerning itself with designing

xxxiii
of employment programmes such as school leaver apprentice scheme, entrepreneurs training
programmes for graduates, labour-based work programmes, and resettlement of trained
beneficiaries. The NDE has trained more than 2 million unemployed Nigerians, provided
business training for not less than 400.000 people, vocational training in up to 90 different
trades, assistance to more than 40,000 unemployed to set up their own businesses. The
Directorate has organized labour based groups through which 160,000 people benefited.
The NDE suffers from inadequate funding from the Federal Government. Its predicament is
worsened by the fact that is has over stretched itself by engaging in skills acquisition,
granting of loans, procuring and selling agricultural inputs such as fertilizers. It has
succeeded in recovering less than 10% of its loans. There is also the problem of duplication
of efforts with the statutory roles of the Federal Ministry of Labour and Productivity in the
area of compilation of statistics on the unemployed in the country and claims to maintain a
data bank of these as well as matching applicants with vacancies.
Despite all the problems enumerated above, the NDE possesses great potentials as an agency
for the promotion of skill acquisition and self-employment schemes, given its widespread
presence and over 15 years relative experience in the design and execution of employment
generating programmes.
(ii) Peoples Bank of Nigeria (PBN)
Decree No. 22 of 1990 established the PBN which commenced business in October, 1989. It
was charged with the responsibility of extending credit to under-privileged Nigerians who
could not ordinarily access such loans from the orthodox banking system. Before it was
merged with the Nigerian Agriculture and Cooperative Bank (NACB) to form the Nigerian
Agricultural, Cooperative and Rural Development Bank (NACRDB), the PBN was merged

xxxiv
in group lending to cottage industry promoters, agricultural producers, NGOs and
cooperative societies. It disbursed up to N1.7 billion as in-house loans from funds derived
from the Federal Government, with which it provided support for over 1 million new
businesses, with a net saving of about 1 billion Naria. It also disbursed No. 9 billion as loans
from funds provided by the Family Economic Advancement Programme (FEAP).
The bank had a high degree of problem loan. Its external audit report showed a huge loss
provision of over 80% on its loan portfolio at its close. Some of its funds were also trapped
in distressed and liquidated banks due to unwise investment decisions.
(iii) Nigerian Agricultural and Cooperative Bank (NACB)
This bank, which started operations on March 6, 1973 was established by Decree No. 19 of
November 1972. it had responsibility for providing credit for the production, processing, and
marketing agricultural produce. Its target groups included individual farmers, cooperative
organizations, limited liability companies, states and federal government. Before its merger
with the PBN in 2001, the bank had extended credit to 318,000 to the tune of about N5.8
billion.
The bank‟s statutes, which restricted it from taking deposits from the public was a hindrance
to it. It had other problems including its inability to charge market interest rates and high
cost of credit administration, huge portfolio of non-performing loans, funds trapped in
distressed and liquidated banks etc.
(iv) National Board for Community Banks (NBCB)
The National Board for Community Banks is a regulatory body set by Decree No. 46 of
1992, but it started operations in December 1990 with the main purpose of supervising the
xxxv
operations of Community Banks in the country. There are about 1000 Community Banks
under the purview of the NBCB. The Community Banks are private sector owned micro –
credit banking institutions promoted by the federal government to inculcate savings culture,
disciplined banking habit as well as encourage economic development at the grass-root
level. These banks are allowed to operate normal banking business except in certain areas
such as foreign exchange dealings, direct participation in the clearing system, etc.
The NBCB has encouraged rural banking. It also helped in mobilizing about N4.4 billion
deposits for the Community Banks nationwide granting of N2.58 billion loans by
Community Banks which have staff strength of about 12,000 people nation-wide. Current,
the Board is having problems, including having no clearing house specifically for the
Community Banks who have to go through correspondent banks at a cost, non-issuance of
final licenses by the CBN, non-inclusion of Community Banks‟ deposits under the Nigeria
Deposit Insurance Corporation‟s deposit insurance scheme, under-capitalization of the
Community of the Community Banks and government‟s under-funding of the NBCB.
(v) National Commission for Mass Literacy, Adult and Non-Formal Education
(NCMLAE)
The functions of the Commission, which came into being through Decree No. 17 of 1990
include establishing links, in cooperation with all stakeholders, to eradicate illiteracy in the
country, designing and promoting strategies and programmes for the conduct and
implementation of a national mass literacy campaign in concert with relevant government
institutions and NGOs. Similarly, it was to organized in-service professional training courses
for senior staff from government and capacity building. The Universal Basic Education
(UBA) has since submitted the Commission and its programmes.
(vi) Family Economic Advancement Programme (FEAP)

xxxvi
This programme was established to provide credit for agricultural production and
processing, cottage and small-scale industries through cooperative societies; to encourage
the design and manufacture of plants, machinery and equipment; and to establish enterprises
and pilot projects at village level as a means of providing employment – as provided for in
its enabling Decree No. 11 of August 12, 1997 and as amended by Decree 47 of May 10,
1999, Before it was wound up in 2000, FEAP financed 20,382 projects with a total credit of
N3.33 billion, trained about 2000 loan beneficiaries in cooperative laws, principles and
practice and financial management and basic marketing skills.
The programme has problems including the non-supervision and monitoring of the loans and
project by the participating banks, fabricators connivance with the beneficiaries to inflate
cost of equipment, provision of sub-standard equipment and delays in the fabrication, and
poor loan recovery. The programme‟s assets and liability were handed over to the National
Poverty Eradication Programme (NAPEP).
2.3 Empirical Review on Socio-economic Characteristics of Groundnut Processors
Socio-economic variables of processors have been found to have substantial impact on
groundnut cake and oil processing. Involvement of middle aged processors could result in a
positive effect on production while large family size guarantee free and cheap labour.
Education and experience are measure of human capital and they reflect the ability to
implement technology. Hence education is expected to increase technology adoption and
output of the processors. Oluyele and Sanusi (2009) stated that education is a good pointer
to improved productivity as the level of education is a tool with which an individual could
be efficient at whatever endeavour being undertaken by the individual.

xxxvii
Ekine and Onu (2008) reported that in their study in River State, mean age of sample
processors was 56 years. Education plays an important role in groundnut processing
operations since it facilitate the adoption of innovations that improve groundnut processing.
Their study revealed that over 95 percent of the respondents had formal education in one
level or the other and that the most prominent system of labour requirement is family.
The level of awareness and adoption of modern methods of groundnut processing are
affected by the literacy status of the processors. Those who are literate are expected to be
more innovative because of their ability to get information more quickly and their ability to
take more risk. Studies by Oluwatayo et al. (2008) on resource use efficiency of maize
processors in rural Nigeria revealed that the more educated an entrepreneur is, the more the
chances that he/she will adopt innovations than the uneducated ones. Therefore there is high
probability that the groundnut processors in the study area will easily adopt new groundnut
processing practices since about 84.1 % of them are educated.
2.4 Empirical Review on Profitability of Groundnut Processing
Profit-making is generally accepted as a major objective of a business. There are several
different ways to look at the profitability of a business activity. The particular type of
analysis to be done will vary with the time frame selected, the scale of activity being
selected, and the availability of data to do the analysis (Engle and Neira, 2005). Profit is a
major viability of any business. It is the difference between the value of goods produced and
the cost of resources used in their production. The amount of revenue realized and the
operating costs of a business enterprise determined how much gain or loss an enterprise can
achieve within a certain period. However, the determination of the processor‟s margin or
return is difficult in small-scale groundnut processing ventures since they have several
objectives including their consumption needs.

xxxviii
Ekine and Onu (2008) revealed that the quantity and amount of revenue realized by
processing firms are usually under estimated mainly due to inadequate recording and
improper accounting procedures. The level of gross margin of small-scale groundnut
processing firms is influenced by many determining factors including costs of groundnut,
costs of equipments, price of labour and availability of labour. These determinants are
essential because the survival of a small-scale processing enterprise depends on them.
2.5 Empirical Review on Economic and Allocative Efficiencies of Groundnut
Processing Firms
Efficiency is often cited as an indicator or measure of competitiveness. It is a measure of the
distance from a given observation to the frontier. Firms operating on the frontier are said to
be fully efficient in their use of inputs and those operating beneath it are inefficient. This
notion of inefficiency referred to the neoclassical efficient allocation of resources and the
pareto optimality criterion (Latruffe, 2010). In order to ascertain whether resources were
efficiently utilized in sorghum farming, Muhammed et al (2011) used the marginal value
product (MVP) of the variable inputs to compute and compared input prices in order to
determine the efficiency of the inputs used. It was reported that seeds, fertilizer and other
inputs were under-utilized.
The efficiency of a system means the ratio between the works or energy got out of it and the
work or energy put into it (Dave, 2012). In order to assess farm efficiency in production
economics, two observation behavior of the operators can be modeled depending on the
research question and data availability. First, operators theoretically behave as a profit-
maximizer or cost-minimizer when choosing the optimal bundle for the farming process.
Second the time horizon influences how many variables the producer can control. When the

xxxix
operator is planning for long run, all inputs and outputs can be varied. On the contrary when
the time horizon is limited, the operator can choose to vary only some of the inputs referred
to as variable inputs. Other production factors referred to as fixed inputs cannot be changed
in this time horizon.
The concept of efficiency is concern with the relative performance of the processes used in
transforming given inputs into outputs. The problem of measuring the productive efficiency
of an industry is important to both the economic theorists and economic policy makers.
Economic theory identified at least three types of efficiency. These are technical, allocative
and economic efficiencies. Allocative efficiency referred to the choice of optimum
combination inputs consistent with the relative factor prices. Technical efficiency shows the
ability of firms to employ the best practice in an industry, so that no more than the necessary
amount of a given set of inputs is used in producing the best level of output. Economic
efficiency is the product of technical and allocative efficiencies (Bifarin et al, 2010).
The two most popular methods of measuring efficiency assuming the presence of
inefficiency effect in the production system are data envelopment analysis (DEA) and the
stochastic production frontier method. DEA is a non-parametric method while the stochastic
frontier is a parametric method. Coelli (1995) compared the two methods and concluded that
the main strengths of the stochastic frontier approach are its ability to deal with stochastic
noises and the incorporation of statistical hypothesis tests pertaining to production structure
and the degree of inefficiency.
2.6 Empirical Review on the Application of Stochastic Frontier in Efficiency Studies
Fleming and Coelli (1995) assessed the performance of a nucleous estate and small holder
scheme for groundnut processing in West Sumatra, using stochastic frontier production

xl
function in measuring their technical efficiency. Their results indicate a mean technical
efficiency and the use of female labour, suggesting there is no need to target extension
services especially at female labourers in the household. Finally, education was found to
have an unexpected negative impact on technical efficiency, indicating that farmers with
primary education may be more important than those with secondary and tertiary education
as targets of development schemes and extension programs entailing non-formal education.
Piesse and Thirtle (2006) fitted the translog stochastic frontiers with inefficiency effects to a
panel of Hungarian firm level for agricultural enterprises and light manufacturing sector
during the early transition period (1985-1991). Their findings revealed that labour and
materials make salient contribution to output while energy and capital do not, whereas the
cross section estimates show that relative efficiency improved sufficiently in agriculture and
industry that in the later years the average production function is preferred to the stochastic
frontier except when manufacturing efficiency collapsed in 1991. The inefficiencies were
explained by over capitalization, subsidies and excessive management, while firms that had
established export markets were more efficient.
Tchale (2009) in his study on the efficiency of smallholder agriculture in Malawi, used the
stochastic frontier in his analysis and discovered that fertilizer and land are the key factors in
the production of the major crops grown by the majority of smallholder farmers. Labour is
also key variable, especially among farmers who grow labour intensive crops within the
maize-based smallholder farming system. The average levels of technical, allocative and
economic efficiency were estimated at 53%, 46%, and 38% respectively. The results
generally highlight the relative inefficiency that characterizes smallholder agriculture in
Malawi. The results further indicate that allocative inefficiency is worse than technical

xli
inefficiency, which implies that the low level of overall economic efficiency is the result of
higher cost inefficiency.
In the work of Seyoun et al. (1998) they applied the Cobb-Douglas stochastic frontier
production function in investigating the technical efficiency of two sample of maize
producers in Ethiopia, one involving farmers within the Sasakawa-Global 2000 project and
the other involving farmers outside this program. The empirical results indicate that farmers
within the SG-2000 project were more technically efficient than farmers outside the project
relative to their respective technologies. The mean frontier output of maize for farmers
within the SG-2000 project was significantly greater than that for farmers outside the
project.
Research conducted on technical efficiency differentials in rice production technologies in
Nigeria by Ogundele and Okoruwa (2006) showed that the use of some critical inputs such
as Fertilizer and herbicide by the farmers were found to be below recommended quantity per
hectare. Applying stochastic frontier analysis revealed that there was also significant
difference in the use of such inputs as labour between the two groups of farmers. Other
variables that tend to contribute to technical efficiency were hired labour, herbicide and
seeds, while fertilizer was found not to have contributed significantly to technical efficiency,
the estimated technical efficiencies for the two groups were correspondingly high (0.90),
which indicate that there is little opportunity for increase efficiency given the present state
of technology. The test of hypothesis on the differentials in technical efficiency between the
two groups of farmers showed that there was no absolute differential.
A study carried out to investigate technical inefficiency of production among the food crop
farmers of the National Directorate of Employment in Ondo State of Nigeria, by Ajibefun

xlii
and Abdulkadri (1999) considers translog stochastic frontier production functions in which
the technical inefficiency effects are defined by three different sub models. Given the
specifications of the stochastic frontier production function, the null hypothesis, that the
frontier is adequately represented by the Cobb-Douglas function, was accepted but the null
hypothesis that the farmers are fully technically efficient, which implies that inefficiency
effects are absent from the model, was rejected. Further, the null hypothesis of half-normal
distribution for the inefficiency effects was rejected. Predicted technical efficiencies vary
widely across farms, ranging between 21.7% and 87.8% and a mean technical efficiency of
67%.
Alabi et al. (2010) used the stochastic production function in estimating the technical
efficiency in sesame production in Nasarawa Doma Local Government Area of Nasarawa
State. The model was estimated by the maximum likelihood method which shows the
elasticity of production for seeds (0.51); labour (0.71); capital (0.55) had significant effect
on sesame output. The inefficiency model revealed that education and access to credit were
significant at 5 percent and positively affects farmer‟s efficiency level. Also, technical
efficiency in cassava-based food crop production system in delta state was studied by
chukwudi (2010) using stochastic frontier function; he discovered that 71 and 67 percent of
the variations in output is attributed differences in technical inefficiencies. Means technical
efficiencies for mixed crop and mono crop farmer were 80 and 71 percent respectively.
Level of formal education, contacts with extension agents, farming experiences and capital
to labour ratio and credit to total cost ratio had positive effect on efficiency.
In a research conducted by Ogundari et al. (2006) to determine economics of scale and cost
efficiency in small scale maize production in Nigeria, they observed cost efficiency scores of
1.16 as the mean cost efficiency of the farms. Meaning that, an average maize farm in the
xliii
sample area has that are about 16% above the minimum defined by the farms in the words.
16% of their costs are wasted relative to be best practiced farms producing the output
(maize) and facing the same technology. All parameters estimate have the expected sign
with cost of labour, cost of seed, annual depreciation cost and maize output highly
significant different from zero and thus were important in maize production. Bravo-Ureta
and pinheiro (1997) reported a mean allocative efficiency of 44% and a mean economic
efficiency of 31% in their study of peasant farming in the Dominican republic with the
maximum allocative and economic efficiency been 84 and 62%. Paudel and matsuaka
(2009) conducted a research on cost efficiency estimates of maize production in Nepal and
observed a mean cost efficiency of 63%. Age was found to be positive coefficient, implying
that farmers of older age tend to be less cost efficient that is, the decrease in cost efficiency
tends to increase with the household head age for maize production in the study area.
Allocative and economic efficiency determined by Bifarin et al. (2010) on plantain
production in Ondo State, Nigeria; shows a wide difference in the farmers efficiency, with
averages of 57% and 35% and a modal clas of (51 – 60%) which had a higher allocative
efficiency than the lower class (11 – 20%) because farmers in the modal class had a higher
level of formal education, were younger, adhered strictly to the stipulated replanting age and
had been in the system for quite aome time. However, none of the respondents had a 100%
efficiency index. This implies that resources could be allocated to their best alternative uses
and prices could as well be allowed to perform their allocative functions in the use of inputs.
2.7 Review of Groundnut Processing Constraints
Since independence in 1960, Nigeria‟s agricultural sector has experienced slow output
growth that has not kept pace with population increase. This has resulted in declining
agricultural exports and domestic food supplies and a growing reliance on imported food as

xliv
a result of problems encountered by the sector. The decline in the agricultural sector can be
partly explained by drought and serious pest and diseases infestations, though, there are
other prominent reasons for its decline, including the neglect of the agricultural sector after
the oil boom, and unfavourable government policies which greatly affected the technology
generation capacity and technology environment, level of processing and marketing
environment and production and coordination machinations between different stages of the
sector (Hyman, 1990).
Ugwu (2009) undertook a research to identify problems or constraints with respect to
production, processing, storage and marketing of groundnut processing products in Cross
River State. He concluded that productivity in Nigeria has not grown sufficiently due largely
to under investment in new technology, slow adoption of existing improved technologies,
constraints associated with the investment climate, and lagging infrastructure. Others are:
unattractive market prices, high cost of palm oil extraction and palm kernel cracking
machines, lack of unimproved varieties of oil palm resulting in low output and low quality
of products.
According to Ekine and Onu (2008) high cost of processing equipment and independent
fund are the serious problems faced by processors in Rivers State. This problem had
discouraged intending processors from establishing their own mills. Therefore, majority of
the processors in the area resort to hiring of processing equipment and this had resulted to
delay in processing of the palm fruits. Those who do not own mills face marketing problems
during the peak season when fruit is abundant and processors do not have to forage for raw
materials. In Imo State, Nwajiuba and Akinsami (2003) asserted that scarcity of fuel wood
and water are the major problems encountered by processors. Ogah (2004) recorded that in
Oju Local government Area of Benue State, processors encounter problems such as

xlv
unimproved technology, irregular supply of fresh fruit bunch (FFB), nut cracking,
transportation, credit/fund, lack of water and unsteady labour supply.
Studies by Soyebo et al. (2005) in Ife Central Local Government Area of Osun State
reported that 34.2% of processors had fund problem while 53.2% complained of inadequate
information and limited knowledge on improved processing methods of oil palm. About
54% of the processors claimed lack of government support on oil palm processing. These
constraints faced by the oil palm processors may have contributed to lack of the enterprise.
2.8 Major Constraints Faced by Rural Groundnut Processing Ventures
The constraints militating against groundnut processing in the study area varies from one
respondent to another. However, the processors pointed out that inadequate capital for
expansion, unstable price of inputs and inadequate processing machines are the three major
constraints hindering the processing of groundnut. Other constraints include inadequate
labour supply, lack of readily available market, incomplete return of credit sales, low
volume of production, unstable Electricity, and lack of processing shed. A similar finding
was also made by Haruna et al. (2006). The respondents also pointed out that their profit
will increase if the constraints can be overcome.
(i) Financial problems
Lack of Finance is a constraint to the growth or expansion of groundnut processing firms in
Zamfara State. Empirical evidence shows that adequate financing contributes about 25
percent to the success of groundnut processing firms (Ogujuiba et al., 2004). In Nigeria,
most groundnut processing firms are folding up or lack competitiveness because they lack
the much required financial capacity to prosecute their manufacturing concern. Most of
these groundnut processing firms cannot access loan on a long -and short -term basis. In a

xlvi
World Bank report in 2001, it was reported that almost 50 percent of micro, 39 percent of
small-scale firms (groundnut processing firms included), and 37 percent of medium -scale
firms are financially constrained in Nigeria, as opposed to 25 percent of the very large firms
(World Bank, 2001). The implication of this is that groundnut processing firms are either
discriminated against or cannot access funds at the credit market. In addition to this, the
stringent conditions attached to loan and credit also discourages these industries from
accessing credit from the credit market. This factor has largely undermined the capacity of
groundnut processing firms in Nigeria generally and Zamfara State in particular. While
small-scale groundnut processing firms operators have been claiming that banks impose
stringent conditions and terms of approval, the Banks on the other hand, have claimed that
SME operators don‟t present bankable projects. Ogujuiba et al. (2004) in a report on
groundnut processing firms claimed that 20 percent of processing nentures have reported
being constrained in receiving long-term loans. This has forced groundnut processing firms
to use their internal financing which is usually unsustainable and increases the vulnerability
of ventures as a result of low capital base.
(ii) Lack of infrastructural facilities
The performance of groundnut processing has also been hindered by the lack of
infrastructural facilities. Inadequate facilities like power supply, telecommunication,
accessible road networks and water supply constitute one of the major constraints facing
groundnut processing firms. A World Bank study in 1989 estimated that “the cost of
providing infrastructural facilities by groundnut processing in the absence of those facilities
is estimated to be about 15-20 percent of the cost of establishing manufacturing enterprises
in Nigeria. Omolola (2008) contended that the percentage has since increased to 30-35
percent of the cost of establishing manufacturing concerns in Nigeria.

xlvii
Of the infrastructural problems, the problem of lack of power supply has been the most
critical. The erratic power supply has hindered the business environment. In Nigeria, most
businesses have folded up or cannot operate as result of irregular and epileptic power
supply. The problem of power supply is so bad to the extent that the large industries are now
relocating to Ghana and other neighbouring countries, while majority of the small -and
medium -scale businesses have since gone into extinction. The implication of this is that it
has led to the reduction in production activities. The cost of fuelling generators, machines
and equipments has led to cut in employees and increase in running cost of the groundnut
processing enterprises. This eventually leads to the folding up of most of these enterprises in
Nigeria, since they cannot compete in the market any more.
Most banks have capitalized on this and blamed their inability to fund groundnut processing
firms on the poor state of infrastructure, economic climate and low performance of public
utilities (Olarenwaju, 2000). However, Chris (2008) of the International Bank in
contradiction rejected Banks‟ excuse on infrastructural facilities, claiming that the huge
profits declared by banks‟ shows that the operating environment is not as bad as they think.
The truth however, is that the state of infrastructural facilities in Nigeria is poor.
Where infrastructural facilities are neither present, adequate not functional, the investment
environment cannot stimulate improvement for small-and medium-scale enterprises. In these
instances, banks would not be willing to invest in groundnut processing because of high risk
and the uncertainty of the investment climate.
(iii) Government unfavourable fiscal policy and policy inconsistencies
The inability of government to execute favourable fiscal policy and policy inconsistencies
have undermined the capacity of small-and medium-scale processing enterprises. According

xlviii
to Njoku (2002) inconsistencies in government policies is a major problem affecting
groundnut processing enterprises. Ogujuiba (2004) also factored in the problem of
inappropriate time or delay in budget implementation as a factor constraining investment
and trade decision. In most cases, the process of approving budget at the legislative level is
usually delayed due to executive and legislative face-off most times and even when the
budget is approved, the executive implementation is very slow, due to administrative
bottlenecks. Factors such as these have made the investment environment to be
unpredictable and uncertain for small-and medium-scale enterprises. In some cases, high
incidences of government regulatory activities, taxes and levies by different levels of
government have resulted in high cost of running groundnut processors seem not to be
motivated by these factors. As Onugu (2005) posits, this is due to the absence of harmonized
and gazzetted tax regime which would enable manufacturers to build in recognized benefit
from such policy measures. Instability in government policies has caused some SMEs to
collapse. One of such policies is that of the 1980s when government specified that cocoa
should not be exported in raw or unprocessed form after a specified deadline. Many
processing firms had to import machineries only for government to reverse this policy. The
present high mortality rate of groundnut processing firms in Nigeria is awful and constitutes
a danger to the entire economic system. It represents serious financial pressure on the
nation‟s economy as well as a waste of valuable resources.
(iv) Internal characteristics and problems.
Most small -and medium -scale enterprises in Nigeria are battling with serious internal
problems. These problems range from poor management practices, poor accounting
standards, shortage of manpower, financial indiscipline and corruption. The reasons why
most groundnut processing firms have not been able to improve are due to poor management
knowledge and practices, absence of transparent organizational set up, poor succession plan,
xlix
lack of entrepreneurial skills, lack of strategic business plan, et cetera. The dearth of such
skills in most groundnut processing firms due to inadequate educational, professional, and
technical background on the part of the owners and employees of groundnut processing
firms has plunged groundnut processors into further crisis (Oluwatayo, 2008).
It is characteristic of groundnut processing enterprises to ignore basic management
procedures and thus run businesses as a family affair by undermining proper book keeping
and accounting and managerial practices. Because of the way the business management and
accountability measures are ignored, reckless financial administration, wrong investment
decision and corruption becomes the order of the day (Omolola, 2004).
(v) Management problems
Lack of trained manpower and management skills also constitute a major challenge to the
survival of groundnut processing firms in Nigeria. According to West and Wood (2009)
“90% of all these business‟ failures result from lack of experience and competence”. Rogers
(2013) also added that inefficiency in overall business management and poor record keeping
is also a major feature of most groundnut processing firms. Technical problems and lack of
essential and required expertise in production, procurement, maintenance, marketing and
finances have always led to funds misapplication and wrong and costly decision making.
(vi) Socio-cultural problems
Most Nigerian entrepreneurs do not have the investment culture of ploughing back profits.
Bala (2002) stressed that the attitude of a typical Nigerian entrepreneur is to invest today and
reap tomorrow. Also, the socio-political ambitions of some entrepreneurs may lead to the
diversion of valuable funds and energy from business to social responsibilities. The problem

l
of bias against made-in-Nigeria goods is significant. Most Nigerians have developed a high
propensity for the consumption of foreign goods against their locally-made substitutes.
(vii) Strategic planning problems
SMEs often do not carry out proper strategic planning in their operations. Ojiako (2013)
stated that one problem of groundnut processing firms is lack of strategic planning. Sound
planning is a necessary input to a sound decision-making.
CHAPTER THREE
METHODOLOGY
3.1 Description of the Study Area
This study was conducted in Zamfara State, Nigeria. The State is located in the north-
western Nigeria. Its capital is Gusau. The State was created on 1st October 1996 and lies in
northwestern Nigeria, between latitudes 120
10‟ and 120 17N and longitudes 6
015‟ and
6025E. It shares boundaries with Niger Republic, to the east, Katsina, to the west, Sokoto, to
the north and Kebbi State, to the south. It occupies a land area of about 39.762 square
kilometers which represents about 4.3 percent of the total land area of Nigeria of 923,768
square kilometres. The population of Zamfara State is 3,602,356, according to the 2006
Census, and with population growth rate of 3.5 per annum, it is expected to hit 4,911,016 by
2015 (Onogwu, 2013).
li
Zamfara has a tropical climate. The rain in Zamfara falls mostly in the winter, with
relatively little rain in summer. The koppen-Geiger classification is As. The average annual
rainfall is 27.0 oC in Zamara State. In a year, the average rainfall is 1199 mm. The driest
month is January, with 0 mm of rainfall. In September, the precipitation reaches its peak,
with an average of 271 mm. the warmest month of the year is April, with an average
temperature of 30.5 oC. August is the coldest month of the year, with an average of 24.9
oC.
The difference in precipitation between the driest month and the wettest month is 271 mm.
The variation in annual rainfall is around 5.6 oC.
Zamfara State is dominated by two major soil types, the ferruginous tropical soils and the
lithosols soils. The ferruginous tropical soils can be found in some parts of the State,
particularly around Gummi, Bukuyyum, Anka and Bakura. The lithosols soils dominated
other areas of the State including Shinkafi, Talata Mafara, Zurmi, Kaura Namoda, Birnin
Magaji, et cetera. The soil are characterized by sandy surface region with a clay subsoil both
of which are fertile for agricultural production.
The current Zamfara State consists of Hausa and Fulani people with an estimated population
of about 4,911,019. Major groups include the Zamfarawa mainly found in Anka, Gumi,
Bukkuyum, Talata Mafara, Kaura Namoda, etc. By occupation the inhabitants of zamfara
are mainly farmers, however a significant percentage of the population of zamfara are petty,
small and medium scale entrepreneurs (Wikipedia, 2010).
In terms of poverty, Zamfara is one of the States of the federation with poverty rate above
70 percent. At the end of 2012, the poverty rate in the state was 70.8 percent. The Sokoto
State remained the poorest state in the country, with 81.2 per cent poverty rate (NBS, 2014).
According to the information, other states with over 70 per cent poverty rate include

lii
Katsina, 74.5 per cent; Adamawa, 74.2 per cent; Gombe, 74.2 per cent; Jigawa, 74.1 per
cent; Plateau, 74.1 per cent; Ebonyi, 73.6 per cent; Bauchi, 73 per cent; and Kebbi, 72 per
cent.
The state with the lowest poverty rate was Niger with 33.8 per cent, followed by Osun with
37.9 per cent and Ondo, 45.7 per cent. Others with less than 50 per cent poverty rate were
Bayelsa State, 47 per cent and Lagos State, 48.6 per cent (NBS, 2014).
The average poverty rate of the states in the North -West geopolitical zone remained the
highest at 71.4 per cent followed by North-East 69.1 per cent and North Central, 60.7 per
cent. The record showed that poverty was least prevalent in the South-West, with an average
of 49.8 per cent, followed by South-South, 55.5 per cent and South-East, 59.5 per cent.
According to NBS (2014), national unemployment rate stood at 23.9 per cent at the
beginning of 2012. There were no figures for 2011 but the 2012 statistics represented an
improvement in the figures released by the bureau for 2010. For unemployment rate,
Zamfara State had the highest rate of 42.6 per cent, followed by Bauchi, 41.4 per cent. Other
states with above 30 per cent unemployment rate included, Gombe, 38.7 per cent;
Nassarawa, 36.5 per cent; Jigawa, 35.9 per cent; Edo, 35.2 per cent; Adamawa, 33.8 per cent
and Kaduna, 30.3 per cent. According to the records, unemployment was least in Osun
followed by Kwara and Lagos (NBS, 2014).
3.2 Sampling Procedure
A survey method using structured questionnaire and informal interview of key informants as
well as direct observation of mangyada‟ and ‘kulikuli market situation was used to obtain
relevant information for the study. The multi-stage sampling technique was employed in
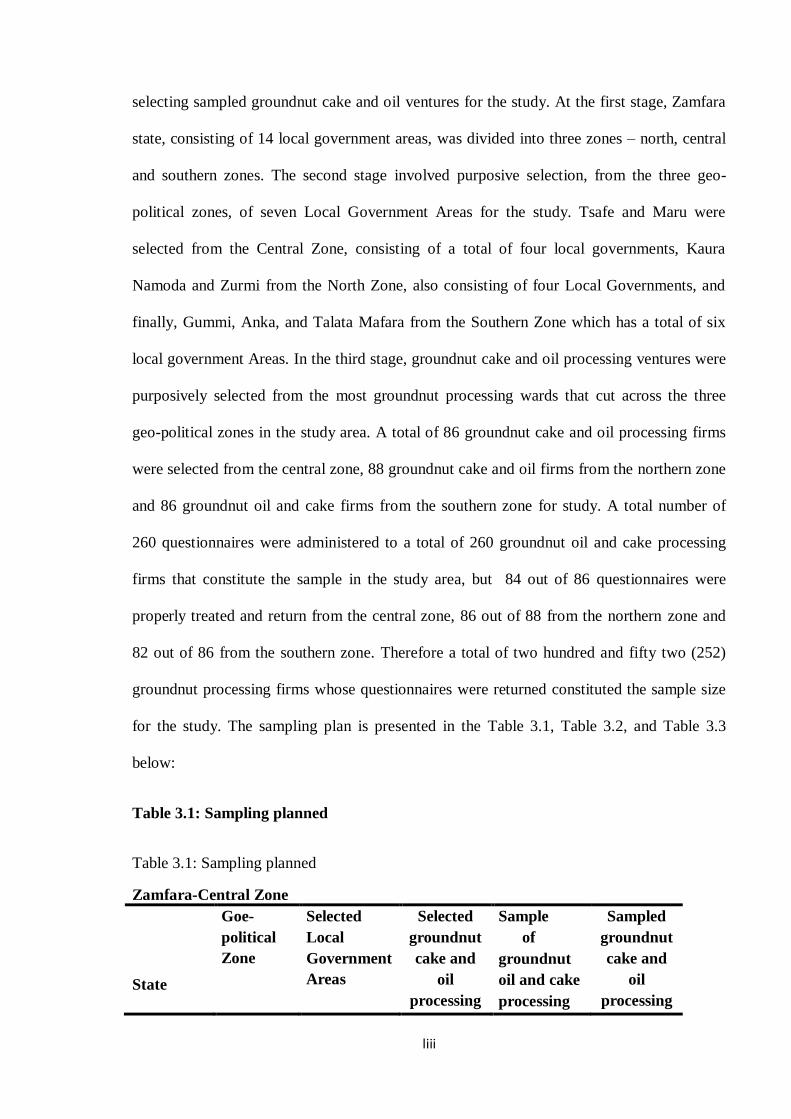
liii
selecting sampled groundnut cake and oil ventures for the study. At the first stage, Zamfara
state, consisting of 14 local government areas, was divided into three zones – north, central
and southern zones. The second stage involved purposive selection, from the three geo-
political zones, of seven Local Government Areas for the study. Tsafe and Maru were
selected from the Central Zone, consisting of a total of four local governments, Kaura
Namoda and Zurmi from the North Zone, also consisting of four Local Governments, and
finally, Gummi, Anka, and Talata Mafara from the Southern Zone which has a total of six
local government Areas. In the third stage, groundnut cake and oil processing ventures were
purposively selected from the most groundnut processing wards that cut across the three
geo-political zones in the study area. A total of 86 groundnut cake and oil processing firms
were selected from the central zone, 88 groundnut cake and oil firms from the northern zone
and 86 groundnut oil and cake firms from the southern zone for study. A total number of
260 questionnaires were administered to a total of 260 groundnut oil and cake processing
firms that constitute the sample in the study area, but 84 out of 86 questionnaires were
properly treated and return from the central zone, 86 out of 88 from the northern zone and
82 out of 86 from the southern zone. Therefore a total of two hundred and fifty two (252)
groundnut processing firms whose questionnaires were returned constituted the sample size
for the study. The sampling plan is presented in the Table 3.1, Table 3.2, and Table 3.3
below:
Table 3.1: Sampling planned
Table 3.1: Sampling planned
Zamfara-Central Zone
State
Goe-
political
Zone
Selected
Local
Government
Areas
Selected
groundnut
cake and
oil
processing
Sample
of
groundnut
oil and cake
processing
Sampled
groundnut
cake and
oil
processing

liv
Areas Ventures Ventures
Zamfara
Zamfra-
central
Zone
Tsafe
Tsafe 7 7
Yandoto 9 8
Bilbis 10 9
Keta 4 4
Kucheri 7 7
Danjibga 4 4
Total
41
39
Mrau
Maru 7 7
Dausadau 7 7
Mayanchi 7 7
Jabaka 5 5
Lugga 3 3
Dankurmi 4 4
Bindim 3 3
Matunji 4 4
Kanoma 5 5
Total
45
45
Aggregate
86
84
Source: Field survey, 2015
Table 3.2: Zamfara-North Zone
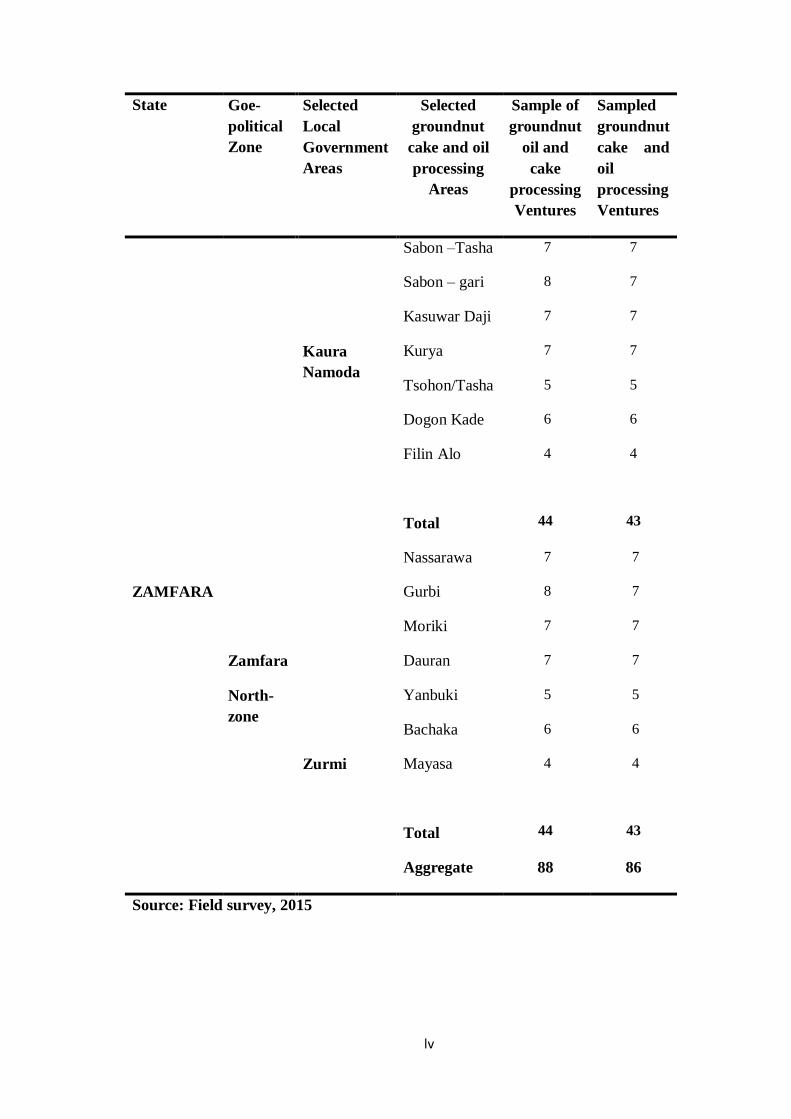
lv
State Goe-
political
Zone
Selected
Local
Government
Areas
Selected
groundnut
cake and oil
processing
Areas
Sample of
groundnut
oil and
cake
processing
Ventures
Sampled
groundnut
cake and
oil
processing
Ventures
ZAMFARA
Zamfara
North-
zone
Kaura
Namoda
Sabon –Tasha 7 7
Sabon – gari 8 7
Kasuwar Daji 7 7
Kurya 7 7
Tsohon/Tasha 5 5
Dogon Kade 6 6
Filin Alo 4 4
Total
44
43
Zurmi
Nassarawa 7 7
Gurbi 8 7
Moriki 7 7
Dauran 7 7
Yanbuki 5 5
Bachaka 6 6
Mayasa 4 4
Total
44
43
Aggregate 88 86
Source: Field survey, 2015
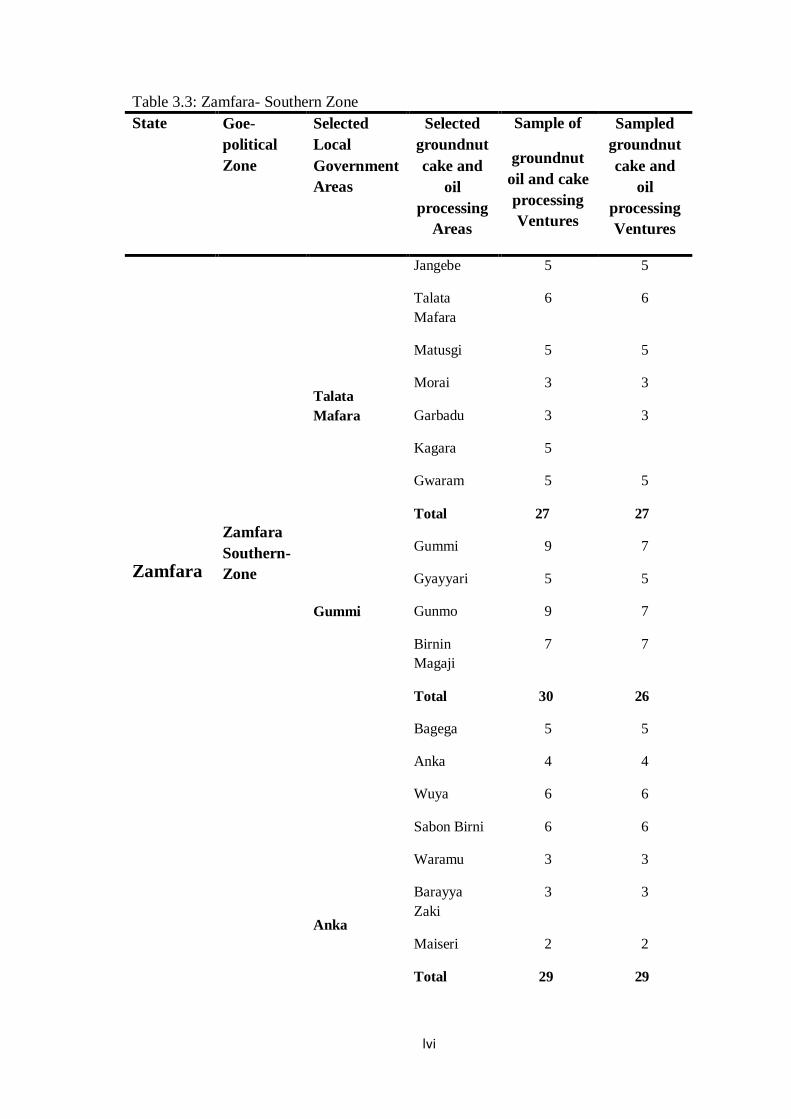
lvi
Table 3.3: Zamfara- Southern Zone
State Goe-
political
Zone
Selected
Local
Government
Areas
Selected
groundnut
cake and
oil
processing
Areas
Sample of
groundnut
oil and cake
processing
Ventures
Sampled
groundnut
cake and
oil
processing
Ventures
Zamfara
Zamfara
Southern-
Zone
Talata
Mafara
Jangebe 5 5
Talata
Mafara
6 6
Matusgi 5 5
Morai 3 3
Garbadu 3 3
Kagara 5
Gwaram 5 5
Total 27 27
Gummi
Gummi 9 7
Gyayyari 5 5
Gunmo 9 7
Birnin
Magaji
7 7
Total 30 26
Anka
Bagega 5 5
Anka 4 4
Wuya 6 6
Sabon Birni 6 6
Waramu 3 3
Barayya
Zaki
3 3
Maiseri 2 2
Total 29 29

lvii
Aggregate 86 82
Source: Field survey, 2015

lviii
Figure 1: Map of Zamfara State showing the Study Area
lix
3.3 Sources of Data Collection
Primary data was used for the study. The primary data was collected from August, 2014 to
September, 2015, by means of structured questionnaire. A survey approach was used to
collect the primary data. The data collected included data on socio – economic
characteristics of the entrepreneurs such as their ages, their gender, educational level, access
to loan, and profit level. Information from the primary source were used to assess the
respondents on the basis on their age, level of education, household size, years of experience
in the groundnut cake and oil („mangyada and kulikuli‟) processing business, profitability of
the business and the size of the processors‟ annual income. The data were also used to
calculate the mean, standard deviations and the variances in the observation. Such summary
statistic(s) provide information on how close or far the estimated results are from the actual
data.
3.4 Method of Data Analysis
Combinations of analytical techniques were employed for data analysis to achieve the
objectives of this study. These included descriptive and inferential statistics, frequency table
and percentages, gross margin analysis, stochastic production frontier, and t- statistics.
3.4.1 Descriptive and inferential statistics
Descriptive statistics such as percentages and frequency distribution were used to describe
and summarized data on responses on the socio-economic characteristics of the groundnut
processing entrepreneurs and the constraints militating against their performance in the
study area. They were used to achieve objective (i) and objective (vi). To achieve objective
(vi), the frequency distribution was used. This was done by calculating the mean, standard
deviations and the variances in the observation. Such summary statistic(s) provide

lx
information on how close or far the estimated results were from the actual data. The mean
and the variance are generally expressed as:
Mean = ∑ FX / ∑ F………………………………………………………............. 1
Variance = ∑ f (X – m )2 / ∑ f …………………………........................................2
Where;
X = the Observed variable under investigation
F = frequency of observation
m = mean of the observation
∑ = summation or sigma notation
3.4.2 Gross margin analysis
Gross Margin (GM) analysis was used to analyze the costs and returns of groundnut oil and
cake in groundnut processing firms of the study area. This is to allow for the determination
of the profitability of the groundnut processing ventures. It was used to achieve objective
(ii). GM is estimated as:
GM = ATR – ATC, and
ATC = ATVC + AFC,........................................................................................................ (4)
Where
GM = gross margin ATR = Average Total Revenue, ATC = Average total costs, AFC =
Average fixed costs and ATVC = Average Total Variable Cost
Total Revenue includes the returns from groundnut oil and all other bi-products from
groundnut. ATVC includes cost of raw groundnuts, salts, water, pepper, firewood, and cost
of other variable inputs.

lxi
3.4.3 Stochastic frontier model
The Stochastic Frontier Model was used to determine the economic and allocative
efficiencies of the groundnut processing in the study area to achieve objective (iii) and
objective (iv). Coelli (1992) stated the general stochastic frontier model as:
Log Y = f (log Xi) + V – U ..................................................................................(5)
However, the Cobb – Douglas form of the stochastic frontier model is widely used in many
empirical efficiency measurements. It is transformed into processing function as:
Y=βo + β1lnX1+β2lnX2 + β3lnX3 + β4lnX4 + β5lnX5 + Vit - U..............................(6)
Where;
Y = Output of the groundnut processed in litres (oil) and in Kg (cake) per month
X1= Labour (hours) per month
X2= quantity of 100 Kg bags of fresh groundnut per month
X3= fuel wood (Naira)
X4=depreciation cost (Naira)
X5= other variables (water, transport, storage) (Naira)
U it = one sided components which captures deviations from frontier as a result of
inefficiency of the firm.
Vit = effect of random shock outside the processors control, observation, measurement
error and other stochastic error terms.
βi = vector of coefficients for the associated independent variables in the production
function,
i= 1, 2, …………… 5

lxii
From the frontier production function, the technical efficiency can be estimated as follows:
TE = Yi / Yj = f (Xi) ev * e
-u / f (Xi) e
v = ej
-u
Where;
e = natural logarithm = 2.718 and other variables are as defined earlier.
The allocative efficiency (AE) is calculated using the Cobb-Douglas stochastic frontier cost
function stated as:
lnC = βo + β1lnX1+β2lnX2 + β3lnX3 + β4lnX4 + β5lnX5 + Vit + U..............................(7)
lnC = total cost of processing per month (Naira)
X1= cost of Labour (hours) per month
X2= cost of quantity of 100 Kg bags of fresh groundnut per month
X3 = cost of fuel wood (Naira)
X4 = depreciation cost (Naira)
X5 = costs of other variables (water, transport, storage) per month (Naira)
U it = one sided components which captures deviations from frontier as a result of
inefficiency of the firm.
Vit = effect of random shock outside the processors control, observation, measurement
error and other stochastic error terms.
βi = vector of coefficients for the associated independent variables in the production
function,
i= 1, 2, …………… 5

lxiii
Economic efficiency (EE) is defined as the capacity of a firm to produce a predetermined
quantity of output at minimum cost for a given level of technology. It is equal to the product
of technical efficiency and allocative efficiency, expressed as;
EE= TE * AE ……………………………………………………………….(8)
3.4.4 Inefficiency model
To obtain the socio-economic factors influencing the processors‟ level of inefficiency, a
model against some socio-economic factors of the processors was used to further achieve
objective (iv). Battese and Coelli (1995) expressed the inefficiency model as:
Yit = exp (X β +Vit – Uit)
……………………………………………………………(9)
The linearized form of the model is expressed as:
Ui = δ0 + δ1 Z1 + δ2 Z2 + δ3 Z3 + δ4 Z4 + δ5 Z5 + Wi …………………………… (10)
Where ;
Z1 = years of experience of the groundnut processors
Z2 = level of education of the groundnut processors
Z3 = age of the groundnut processors
Z4 = membership of association
Z5= amount of credit
Wi = random variable with a mean of zero and constant variance
δi = partial slopes, i= 0, 1,2,……5

lxiv
These variables are included in the model to determine their possible influence on the
technical and allocative efficiencies of the groundnut processors.
3.4.5 Independent variables
(i) Labour (X1):- This is made up of both family and hired labour. Family labour was
evaluated using the principle of opportunity cost; it is assumed that family labour served as a
substitute for hired labour (Ogah, 2004).The labour equivalent was adopted in line with that
of Norman (1972). Children, accorded 0.50; women accorded 1 and men accorded 1.Since
women rather than men mostly take part in processing activities, they were given equal
value of one. Labour input was measured in labour hours with unit cost as multiplied to get
the labour cost (both family and hired labour). Labour is expected to relate positively with
output and was measured in naira.
(ii) Fresh groundnut seeds (X2):-This refers to the quantity of fresh groundnut used for
processing into groundnut cake and oil. The seeds were measured in kilogram. Fresh
groundnut seeds determine the total output because it is the main processing raw material;
therefore, it is expected to have a positive sign. The cost was derived from the multiplication
of price per kilogram and the number of kilogram‟s processed. It was measured in naira and
is expected to relate with total cost of processing positively.
(iii) Fuel wood (X3):- This referred to fuels such as firewood, charcoal, chips, sheets,
pellets and saw dust. The particular form used depends on upon sources, quantity and
application. In many areas in the study area, wood is the most easily available form of fuel,
requiring few or no tools in the case of picking them.

lxv
(iv) Depreciation cost (X4):- All fixed items were depreciated using straight line method of
depreciation in order to guard against over valuation of the cost incurred in each processing
year. The depreciation items include: machines (thresher, sterilizer, digester, presser, and
clarifier), drums, mortar and pestle, jerry-can, basin and pot. This is because of the wear and
tear of the items which can render it inefficient. It is expected to have a negative sign to
signify that depreciation is a decreasing function of output. It was measured in naira and
expected to have negative relationship with the output.
(v) Other variable costs (X5):- This variable was measured in terms of amount spent on
items such as transportation, water, fuel, security and storage. This cost increases total cost
of processing and reduces profit. It was measured in naira and expected to have negative
relationship with the output.
(vi) Processing experience (Z1):- This indicates the number of years spent so far in
groundnut processing business. According to Omoti (2001) the primary determinants of a
potential processor‟s capabilities are experience in business and the quality of the
information provided as far as extension workers are concerned. Based on their exposure it
could be adjudged that they possess greater ability to predict possible problems and likely
solutions that result in higher efficiency level. It is therefore expected that the processing
experience should have a positive relationship with efficiency. It was measured in years.
(vii) Education (Z2):- This refers to the level of formal education received by the
processor. Education level of the processor is expected to have positive sign, since educated
processors are more likely to be business alert and possess the ability to seize business
initiatives or advantage. It was measured in years of schooling.

lxvi
(viii) Age (Z3): Asongwa et al (2011) also observed that groundnut processors within the
active age bracket has a positive effect on technical efficiency while the age of elderly
groundnut processors has positive effect on technical inefficiency. This is because old
people are less energetic less receptive to business innovations and hence, developed
inefficient and production practices. Similarly Ogundari and Ojo (2006) in their work on the
economic efficiency of small-scale food crop production in Nigeria, stated that rising age of
groundnut processors would lead to a declined in their level of efficiency.
(ix) Membership of association of the processors (Z4): Membership of association
empowers people in their business and farming activities thereby improving their economic
status. It is expected that members of processing association will tend to adopt an innovation
faster than non-members as a result of ease of information flow and influence from adopters
in the association. Therefore, it is expected to be negative in the inefficiency model. This
was measured as the number of years a member has spent in the association.
(x) Amount of credit loans (Z5): This represents processors‟ amount of credit facilities
received either in cash or in kind. It refers to the amount or its money value equivalent
borrowed from lending agencies (banks, government, friends, money lenders, relatives) by
the processors in order to sustain and improve management of his processing business
through the purchase of processing inputs and the hiring of labour where needed. This was
measured as dummy; 1 = access; 0 = otherwise.
3.4.6 Foster – Greer and Thorbeke (FGT) model of poverty measurement
The Foster – Green and Thorbeke (FGT) model of poverty measurement was used to
achieve objective (v). The model was developed by Foster – Green and Thorbeke in 1984.

lxvii
It is also called the P-alpha class of poverty measures (Glewwe, 1990). The model is stated
as;
P α = q / n [(𝑞1 𝑍𝑖 − 𝑌𝑖 )/𝑍] …………………………………………….3.4.6a
Where the variables are redefined as follows:
Z = poverty line
q = number of groundnut processor below the poverty line in the study area
n = total number of groundnut processors in the study area
Yi = expenditure of the groundnut processors in the study area
α = Foster – Greer and Thorbeke index which takes the value 0, 1 , 2.
In using this model, consideration was given to the differences in the needs of the groundnut
processors due to differences in their household size and composition. The household
expenditure per adult equivalent was used as a measure of welfare. However, there are wide
choices of adult equivalent scales used in different countries, this research adopts that of the
Organization for Economic Cooperation and Development (OECD) because of its simplicity
and familiarity. In using the equivalent scale, a cut-off point needs to be selected to serve as
poverty line across the distribution of real household expenditure per adult equivalent.
Hence a relative poverty line set at one-third (1/3) of mean consumption-expenditure was
used in identifying the core poor (Anyawu, 2007). The equivalent scale is expressed as:
Exp = exp / n0.7
………………………………………………………… 3.4.6b
Where;
Exp = total expenditure by the groundnut processors
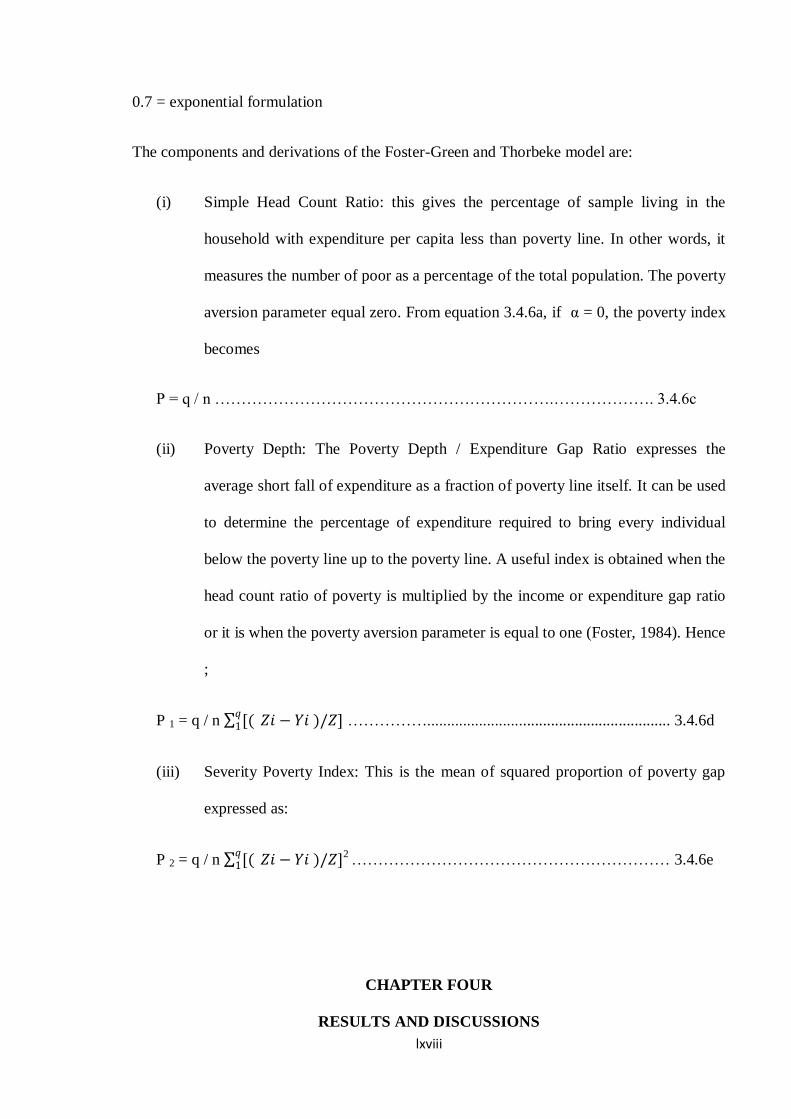
lxviii
0.7 = exponential formulation
The components and derivations of the Foster-Green and Thorbeke model are:
(i) Simple Head Count Ratio: this gives the percentage of sample living in the
household with expenditure per capita less than poverty line. In other words, it
measures the number of poor as a percentage of the total population. The poverty
aversion parameter equal zero. From equation 3.4.6a, if α = 0, the poverty index
becomes
P = q / n ……………………………………………………….………………. 3.4.6c
(ii) Poverty Depth: The Poverty Depth / Expenditure Gap Ratio expresses the
average short fall of expenditure as a fraction of poverty line itself. It can be used
to determine the percentage of expenditure required to bring every individual
below the poverty line up to the poverty line. A useful index is obtained when the
head count ratio of poverty is multiplied by the income or expenditure gap ratio
or it is when the poverty aversion parameter is equal to one (Foster, 1984). Hence
;
P 1 = q / n [(𝑞1 𝑍𝑖 − 𝑌𝑖 )/𝑍] ……………............................................................. 3.4.6d
(iii) Severity Poverty Index: This is the mean of squared proportion of poverty gap
expressed as:
P 2 = q / n [(𝑞1 𝑍𝑖 − 𝑌𝑖 )/𝑍]2
…………………………………………………… 3.4.6e
CHAPTER FOUR
RESULTS AND DISCUSSIONS

lxix
Introduction
This chapter focuses on the presentation and analysis of the research data. The result is
presented as follows:
4.1 Socio-Economic Characteristics of Respondents
The socio-economic characteristics of the respondents which include education, sex, years
of experience and age were considered to elicit relevant information on groundnut cake and
oil processing in the study area.
4.1.1 Age of the respondents
The result of the study as presented in Table 4.1 showed that 30.2 percent of the groundnut
processors were between the ages of 20-29 years, 21.0 percent were between 30-39 years,
15.1 percent were between 40-49 years, 19.0 percent between 50-59 years and 14.7 percent
between 60-69 years. The result implied that groundnut processing ventures in the study
area were largely embraced by the young and the middle-age men between the ages of 20 –
29 and 30 – 39. The average age of the processors in the groundnut processing businesses is
40 years. The role of age of entrepreneurs is very essential in business. The result of a study
by Udoh and Nyienakuma (2008) on processing of agricultural products in Akwa Ibom State
showed that processors within the active age groups are able to withstand stress and put
more time in various business operations. Asongwa et al (2011) also observed that age of
processors within the active age bracket has a positive effect on technical efficiency while
the age of elderly entrepreneurs has positive effect on technical inefficiency. This is because
old people are less energetic less receptive to business innovations and hence, developed
inefficient and production practices. Similarly Ogundari and Ojo (2006) in their work on the
economic efficiency of small-scale food crop production in Nigeria, stated that rising age of
processors would lead to a declined in their level of efficiency.

lxx
Table 4.1: Age of the Respondents
Age Group (Year) Frequency Percentage
20-29 76 30.2
30-39 53 21.0
40-49 38 15.1
50-59 48 19.0
60-69 37 14.7
Total 252 100
Mean = 40 years,
Minimum = 20 years,
Maximum = 69 years,
Standard error = 0.79
Source: Field Survey, 2015
4.1.2 Respondents’ level of education
The Table 4.2 shows that 15.9 % of the respondents had no formal education. 19.8 % and
13.9 % of the respondents had quranic education and others respectively. The percentage of
respondents with secondary and primary education was estimated as 31.3 % and 19.1 %
respectively. This distribution indicated that majority of them were literate processors who
could read and write. The average time spent in educational institution was 8 years. The
level of awareness and adoption of modern methods of groundnut processing are affected by
the literacy status of the entrepreneurs. Those who are literate are expected to be more
innovative because of their ability to get information more quickly and their ability to take
more risk. Studies by Oluwatayo et al. (2008) on resource use efficiency of maize
processors in rural Nigeria revealed that the more educated an entrepreneur is, the more the
chances that he/she will adopt innovations than the uneducated ones. Therefore there is high
probability that the groundnut processors in the study area will easily adopt new groundnut
processing practices since about 84.1 % of them are educated.

lxxi
Table 4.2: Respondents‟ level of education
Education Frequency Percentage
No formal education 40 15.9
Quranic Education 50 19.8
Primary Education 48 19.1
Secondary Education 79 31.3
Others 35 13.9
Total 252 100
Mean = 8 years
Minimum = 14 years
Maximum = 69 years
Standard error = 0.17
Source: Field Survey, 2015
4.1.3 Gender of the respondents
No society can progress without if some of its population is disadvantaged for reasons of
gender. Incorporating gender into agricultural processing activities can encourage
innovations and technological development which can lead to increase output. Result obtain
shows that the average of the sex distribution in the study area is 5. Sampled groundnut
processing respondents were about 90 percent female and about 19 percent males. This can
be attributed to land tenure system which limited the proportion of land allotment by
inheritance to females. Therefore the women engaged themselves mostly in the post harvest
processing activities than men. This support the result of Akanngbe et al (2011) which
reported that groundnut processing is a female dominated endeavour in Oyo State because
over 90 percent of their processors were females.
4.1.4 Respondents’ years of experience

lxxii
The distribution of the respondents according to their years of experience in table 4.1.4
shows that 46.4% of groundnut processing entrepreneurs in the study area had experience in
the business from one to ten years. 39.7% had been in the venture for about twenty years,
9.95 for about thirty years, 3.6% for about 40 years and only 0.39% for about 50 years. The
mean year of experience for the groundnut processors in the study area is 13 years. This
implied that the processors are highly experienced in the enterprise and that introduction of
any change in technology may not be difficult to adopt by them.
Table 4.3: Respondents‟ Years of Experience
Years of Experience Frequency Percentage
1 – 10 117 46.4
11 – 20 100 39.7
21 – 30 25 9.9
31 – 40 9 3.6
41 – 50 1 0.39
Total 252 100
Mean = 13
Minimum = 1
Maximum = 41
Standard error = 0.64
Source: Field Survey, 2015
4.1.5 Scale of operation of the respondents
The distribution of the respondents according to the scale of operation in Table 4.4 shows
that 27.8% of groundnut processors in the study area were mini- scale processors with start-
up capital of less than N 100, 000. The result also showed that 21.9% of groundnut
processors in the study area were micro- scale processors whose start-up capital ranges from
N100,000 to N250,000, 31.8 % of groundnut processors in the study area were small- scale
processors with start-up capital ranging from N250,000 to N500,000 and 18.7 of groundnut
processors in the study area were medium- scale processors whose start-up capital ranges
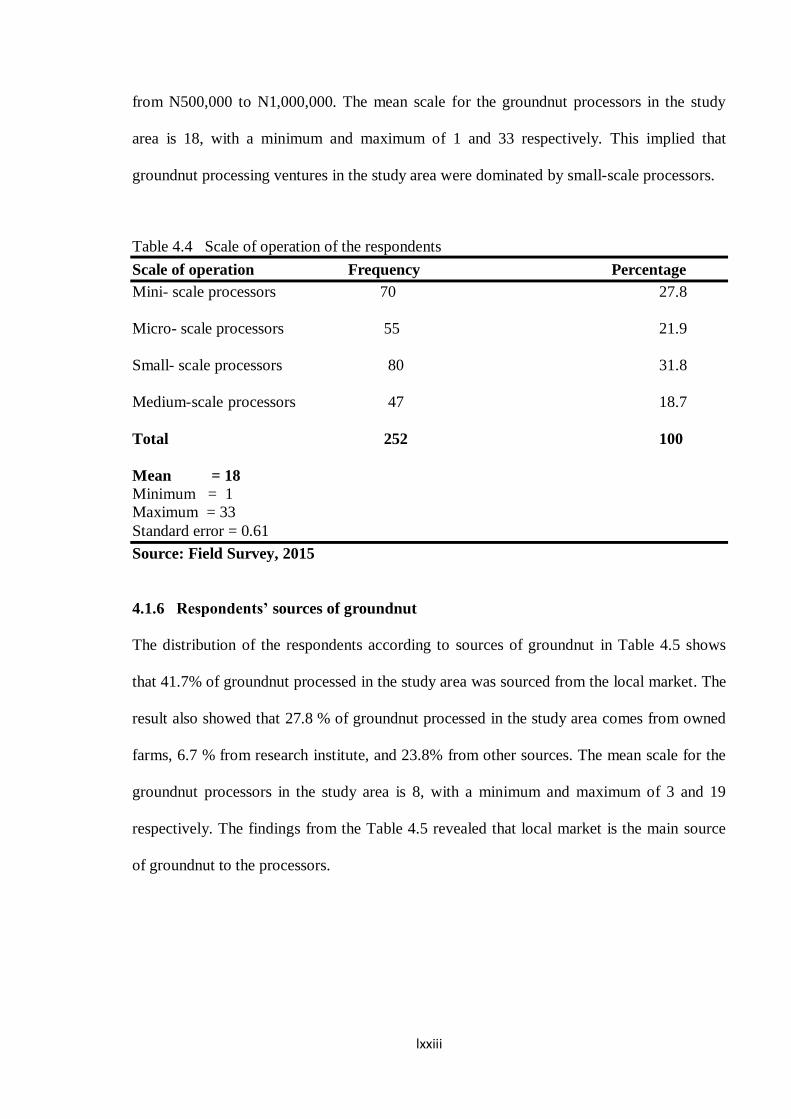
lxxiii
from N500,000 to N1,000,000. The mean scale for the groundnut processors in the study
area is 18, with a minimum and maximum of 1 and 33 respectively. This implied that
groundnut processing ventures in the study area were dominated by small-scale processors.
Table 4.4 Scale of operation of the respondents
Scale of operation Frequency Percentage
Mini- scale processors 70 27.8
Micro- scale processors 55 21.9
Small- scale processors 80 31.8
Medium-scale processors 47 18.7
Total 252 100
Mean = 18
Minimum = 1
Maximum = 33
Standard error = 0.61
Source: Field Survey, 2015
4.1.6 Respondents’ sources of groundnut
The distribution of the respondents according to sources of groundnut in Table 4.5 shows
that 41.7% of groundnut processed in the study area was sourced from the local market. The
result also showed that 27.8 % of groundnut processed in the study area comes from owned
farms, 6.7 % from research institute, and 23.8% from other sources. The mean scale for the
groundnut processors in the study area is 8, with a minimum and maximum of 3 and 19
respectively. The findings from the Table 4.5 revealed that local market is the main source
of groundnut to the processors.
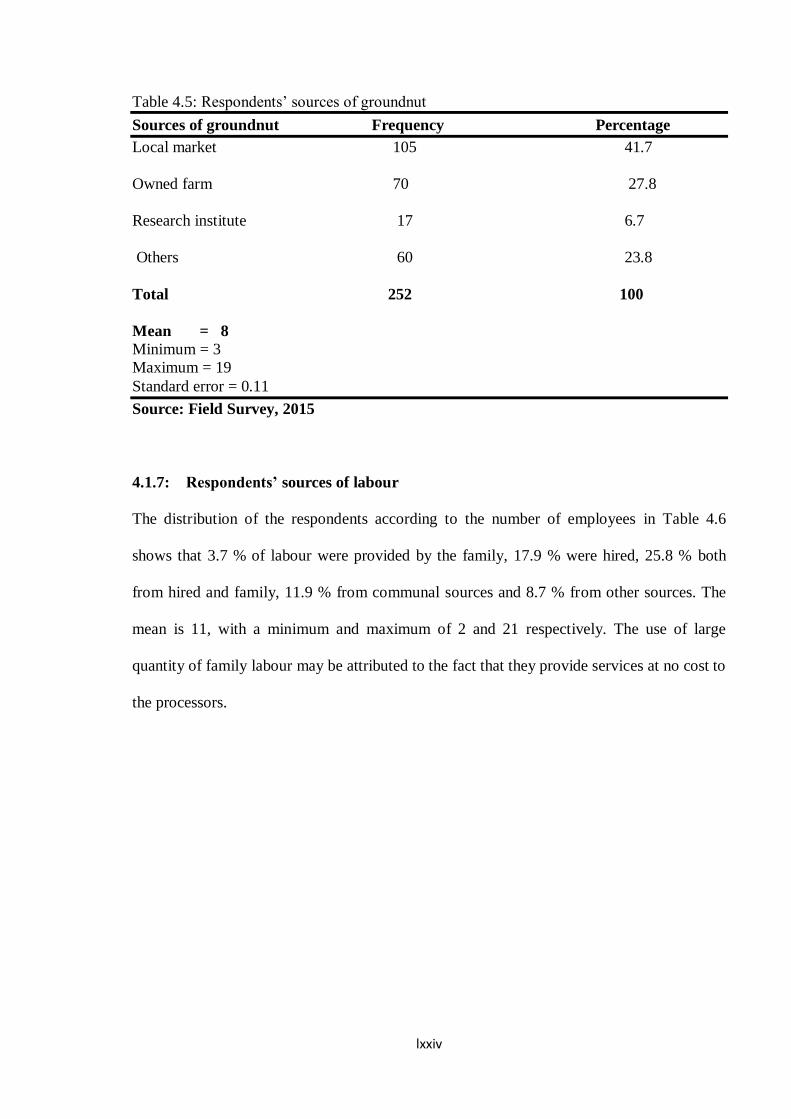
lxxiv
Table 4.5: Respondents‟ sources of groundnut
Sources of groundnut Frequency Percentage
Local market 105 41.7
Owned farm 70 27.8
Research institute 17 6.7
Others 60 23.8
Total 252 100
Mean = 8
Minimum = 3
Maximum = 19
Standard error = 0.11
Source: Field Survey, 2015
4.1.7: Respondents’ sources of labour
The distribution of the respondents according to the number of employees in Table 4.6
shows that 3.7 % of labour were provided by the family, 17.9 % were hired, 25.8 % both
from hired and family, 11.9 % from communal sources and 8.7 % from other sources. The
mean is 11, with a minimum and maximum of 2 and 21 respectively. The use of large
quantity of family labour may be attributed to the fact that they provide services at no cost to
the processors.

lxxv
Table 4.6: Respondents‟ sources of labour
Sources of labour Frequency Percentage
Family labour 90
35.7
Hired labour 45 17.9
Both family and hired 65 25.8
Communal labour 30 11.9
Others 22 8.7
Total 252 100
Mean = 11
Minimum = 2
Maximum = 21
Standard error = 0.44
Source: Field Survey, 2015
4.1.8 Total number of labour used per month by the respondents
The distribution of the respondents according to the number of labour in Table 4.7 shows
that 27.8% of mini-scale groundnut processors in the study area used 1 – 10 labour per
month. The result also showed that 21.9% of micro-scale groundnut processors in the study
area used 11 – 20 labour per month, 31.8 of small-scale groundnut processors in the study
area used 21 – 30 labour per month, and 18.7 of groundnut processors in the study area used
31 – 40 per month. The mean scale for the groundnut processors in the study area is 18, with
a minimum and maximum of 1 and 33 respectively. The results from the table 4.1.8 suggest
that the number of labour used by the processors increases with expansion in the scale of
operation. Thus large firms used more labour than the small ones.

lxxvi
Table 4.7: Total number of labour used per month by the respondents
Scale of operation Number of labour Frequency Percentage
Mini- scale processors 1 - 10 70 27.8
Micro- scale processors 11 -20 55 21.9
Small- scale processors 21 - 30 80 31.8
Medium-scale processors 31 - 40 47 18.7
Total 252 100
Mean = 18
Minimum = 1
Maximum = 33
Standard error = 0.61
Source: Field Survey, 2015
4.1.9: Respondents’ household size
Table 4.8 shows the distribution of respondents based on their household. For the purpose of
this study, household size was defined as the number of people the respondents fed and take
care of. The result of the analysis presented in table 4.1.9 shows that about 60 percent of the
mini-scale groundnut processors had a household size between one and five people and
about 41 percent had a household size between six and ten people. This implies that
expenditure on food and other household necessities may be minimal since majority of the
groundnut processors (59.5) had only 1 to 5 members of household to feed and take care of,
which is relatively small.
The Table 4.8 further shows that about 56 percent of the micro-scale groundnut processors
had a household size between one and five people and about 44 percent had a household size
between six and ten people. For small-scale processors, 52 percent of the groundnut
processors had a household size between one and five people and about 48 percent had a
household size between six and ten people while the medium-scale processors had 50
percent of household size between one and five people and about 50 percent household size
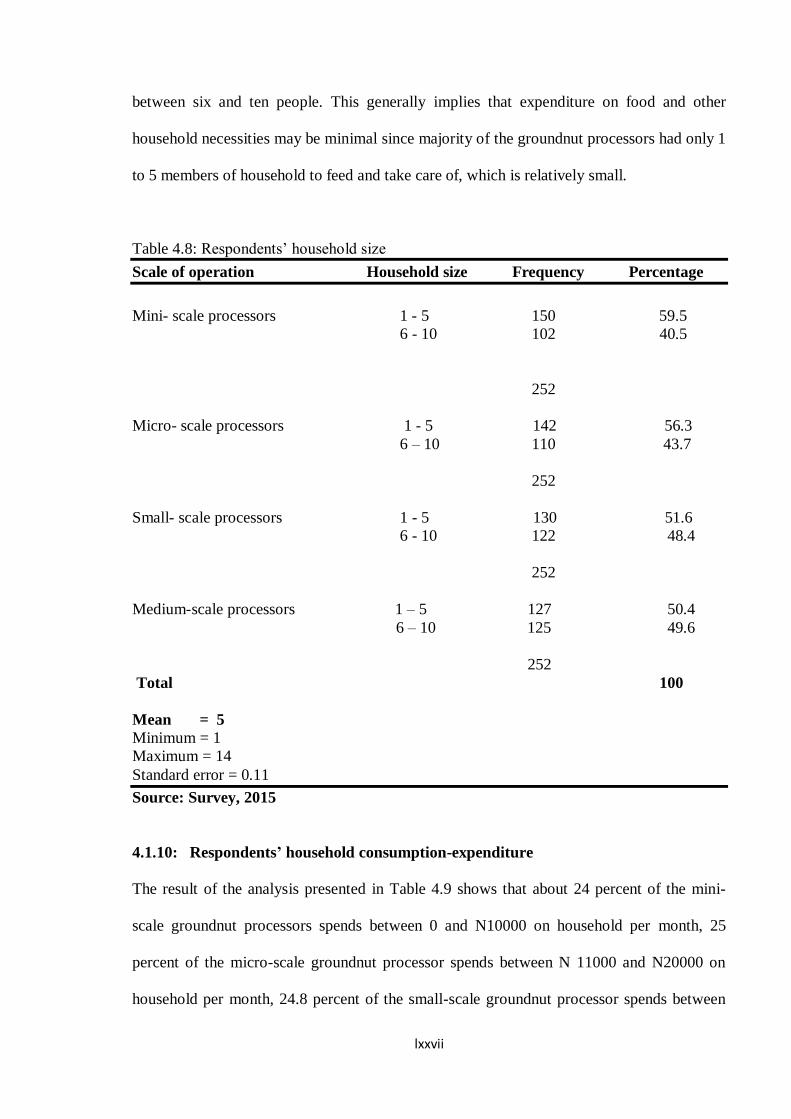
lxxvii
between six and ten people. This generally implies that expenditure on food and other
household necessities may be minimal since majority of the groundnut processors had only 1
to 5 members of household to feed and take care of, which is relatively small.
Table 4.8: Respondents‟ household size
Scale of operation Household size Frequency Percentage
Mini- scale processors 1 - 5 150 59.5
6 - 10 102 40.5
252
Micro- scale processors 1 - 5 142 56.3
6 – 10 110 43.7
252
Small- scale processors 1 - 5 130 51.6
6 - 10 122 48.4
252
Medium-scale processors 1 – 5 127 50.4
6 – 10 125 49.6
252
Total 100
Mean = 5
Minimum = 1
Maximum = 14
Standard error = 0.11
Source: Survey, 2015
4.1.10: Respondents’ household consumption-expenditure
The result of the analysis presented in Table 4.9 shows that about 24 percent of the mini-
scale groundnut processors spends between 0 and N10000 on household per month, 25
percent of the micro-scale groundnut processor spends between N 11000 and N20000 on
household per month, 24.8 percent of the small-scale groundnut processor spends between

lxxviii
21000 and N30000 on household per month and 25.4 percent of the medium-scale
groundnut processors spends between 0 and N10000 on household per month. The average
weekly expenditure is N5000.
Table 4.9: Respondents‟ household consumption-expenditure
Scale of operation Household expenditure
per month (N) Frequency Percentage
Mini- scale processors 0 - 10000 60 23.8
Micro- scale processors 11000 - 20000 63 25.0
Small- scale processors 21000 – 30000 65 25.8
Medium-scale processors 31000 – 40000 64 25.4
Total 63000 – 100000 252 100
Mean = N20375
Minimum = N 5000
Maximum = N 30000
Standard error = 0.34
Source: Field Survey, 2015
4.1.11 Quantity (100kg bags) of groundnut processed by the respondents
The distribution of the respondents according to the quantity of groundnut processed in
Table 4.10 shows that 27.8% of mini-scale groundnut processors in the study area processed
1/2 bag (100Kg) of groundnut per month. The result also showed that 21.9% of micro-scale
groundnut processors in the study area 5 bags (100Kg) of groundnut per month, 31.8 % of
small-scale groundnut processors in the study area processed 10 bags (100Kg) of groundnut
per month, 18.7 of groundnut processors in the study area processed 20 bags (100Kg) of
groundnut per month. The mean scale for the groundnut processors in the study area is 12,
with a minimum and maximum of 3 and 13 respectively.

lxxix
Table 4.10: Quantity (100kg bags) of groundnut processed by the Respondents
Scale of operation 100 kg bags processed per month Frequency Percentage
Mini- scale processors 0.5 70 27.8
Micro- scale processors 5 55 21.9
Small- scale processors 10 80 31.8
Medium-scale processors 20 47 18.7
Total 252 100
Mean = 12
Minimum = 3
Maximum = 13
Standard error = 0.46
Source: Field Survey, 2015
4.2 Profitability Analysis
In order to determine the profitability of groundnut oil and groundnut cake production in the
study area various costs incurred and returns derived from the products were estimated. The
sum of the total variable costs (TVC) and the total fixed costs (TFC) was subtracted from
the gross revenue (GR) to give the gross margin (GM), which is a measure of profitability of
the production. Since the ground processors in the study area have different scales of
operations, different gross margins were computed for each scale of operation considered in
this study. The cost and return profiles involved in the mini-scale processing of groundnut
are shown in Table 4.11.

lxxx
Table 4.11: Estimated gross margin per 100kg bag of groundnut for mini-scale processors
Scale of
operation
Input per
month
Quantity Costs (N) Revenue (N)
Variable
Inputs
Groundnut (in
100kg bag)
50 kg
7,250 Cake = 24,000
Labour (hired) 4 1800 Oil = 7,500
Salt (satchet) 3 150
Mini-scale Pepper (kg) 6 tons 720
Processors Water (litre) 4 0
Griding - 300
Frying - 2,000
Fixed Inputs
Mutter 4 5,600
Wooden pestle 4 600
Total 18,420 31,500
Gross margin = 31500 – 18420 = N 13080
Source: estimated by the researcher (2015)
From the Table 4.11 above, groundnut constituted the highest variable cost (N 7,250) while
salt had the least costs (N 150.00). This is expected since groundnut is the major input in the
processing of groundnut oil and groundnut cake while salt is only included in groundnut
cake and in a very small quantity.

lxxxi
Table 4.11 also showed that groundnuts cake gave the highest return of N 24000 while
groundnut oil contributed N 7500 to gross revenue of the groundnut processors under study.
This is also expected because groundnut cake is the major product and larger in quantity
than the groundnut oil. The gross margin of N 13080 was realized in every ½ bag of 100 kg
size of groundnut used in production of groundnut cake and groundnut oil. Thus, groundnut
cake and groundnut oil production from the foregoing analysis is profitable.
From the Table 4.12, groundnut constituted the highest variable cost (N 72000) while salt
had the least costs (N 1,200). The Table 4.12 also showed that groundnuts cake gave the
highest return of N 137,000 while groundnut oil contributed N 37500 to gross revenue of the
groundnut processors under study. This is also expected because groundnut cake is the
major product and larger in quantity than the groundnut cake. The gross margin of N 29,700
was realized in every 5 bags of 100 kg size of groundnut used in production of groundnut
cake and groundnut oil. Thus, groundnut cake and groundnut oil production from the
foregoing analysis is profitable to the micro-scale processors in the study area.

lxxxii
Table 4.12: Estimated gross margin per 100kg bag of groundnut for micro-scale processors
Scale of operation Input per month Quantity Costs(N) Revenue(N)
Variable Inputs
Groundnut (in 100 Kg bag) 500 kg 72,500 cake =135, 000
labour (hired) 8 3,600 oil = 37, 500
salt (satchet) 30 1200
Micro- scale pepper (kg) 60 tons 7200
Processors water (litre) 40 0
Griding - 3000
Frying - 18000
Fixed Inputs
Mutter 30 36000
Wooden Pestle 30 1300
Total 142,800 172, 500
Gross margin = 172500 – 112,800 = N 29,700
Source: estimated by the researcher (2015)
From the Table 4.13, groundnut constituted the highest variable cost (N 145000) while
wooden pestle had the least costs (N3000). The Table 4.13 also showed that groundnuts
cake gave the highest return of N300,000 while groundnut oil contributed N112,500 to gross
revenue of the groundnut processors under study. This is also expected because groundnut
cake is the major product and larger in quantity than the groundnut cake. The gross margin
of N164,400 was realized in every 10 bags of 100 kg size of groundnut used in production
of groundnut cake and groundnut oil. Thus, groundnut cake and groundnut oil production
from the foregoing analysis is profitable to the small-scale processors in the study area.
Table 4.13: Estimated gross margin per 100kg bag of groundnut for small-scale processors
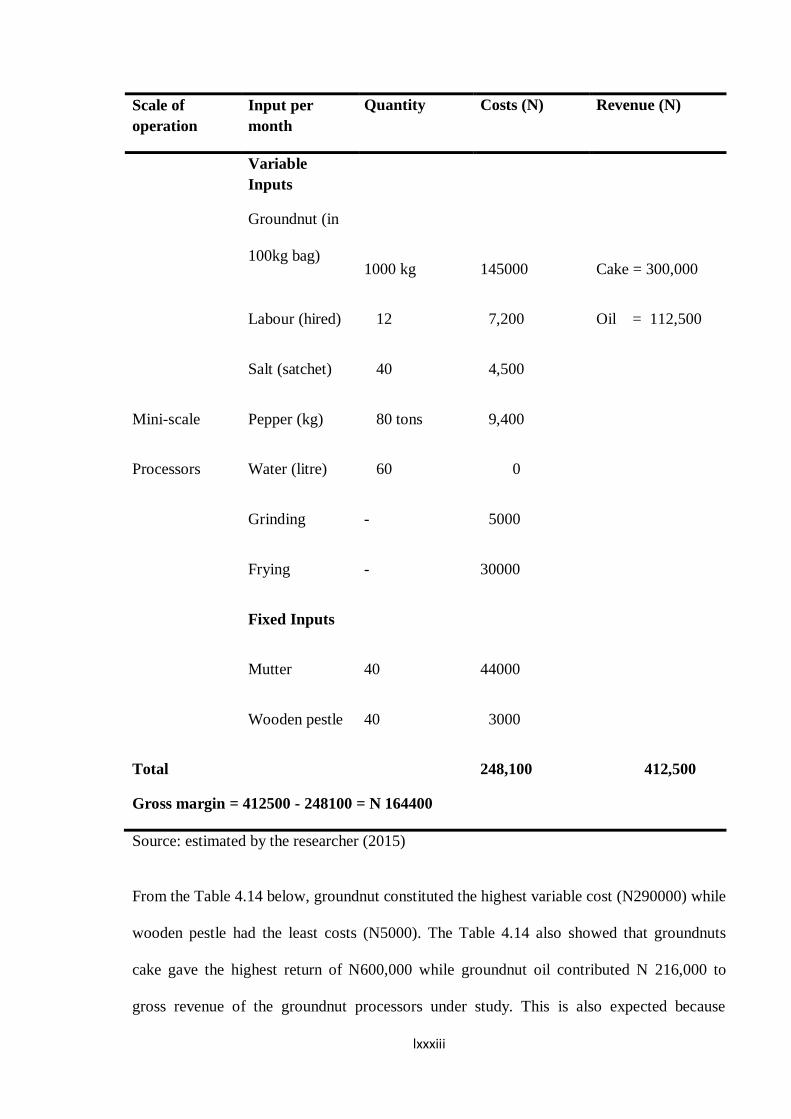
lxxxiii
Scale of
operation
Input per
month
Quantity Costs (N) Revenue (N)
Variable
Inputs
Groundnut (in
100kg bag)
1000 kg
145000
Cake = 300,000
Labour (hired) 12 7,200 Oil = 112,500
Salt (satchet) 40 4,500
Mini-scale Pepper (kg) 80 tons 9,400
Processors Water (litre) 60 0
Grinding - 5000
Frying - 30000
Fixed Inputs
Mutter 40 44000
Wooden pestle 40 3000
Total 248,100 412,500
Gross margin = 412500 - 248100 = N 164400
Source: estimated by the researcher (2015)
From the Table 4.14 below, groundnut constituted the highest variable cost (N290000) while
wooden pestle had the least costs (N5000). The Table 4.14 also showed that groundnuts
cake gave the highest return of N600,000 while groundnut oil contributed N 216,000 to
gross revenue of the groundnut processors under study. This is also expected because

lxxxiv
groundnut cake is the major product and larger in quantity than the groundnut cake. The
gross margin of N289.700 was realized in every 20 bags of 100 kg size of groundnut used in
production of groundnut cake and groundnut oil. Thus, groundnut cake and groundnut oil
production from the foregoing analysis is profitable to the small-scale processors in the
study area.
Table 4.14: Gross margin per 100kg bag of groundnut for medium-scale processors
Scale of operation Input per month Quantity Costs (N) Revenue(N)
Variable Inputs
Groundnut (in 100 Kg bag) 20 bag 290000 cake = 600, 000
labour (hired) 12 14,400 oil = 216,000
salt (satchet) 40 4,500
Medium- scale pepper (kg) 80 cups 9,400
Processors water (litre) 60 0
Griding - 8000
Frying - 40000
Fixed Inputs
Mutter 40 155000
Wooden Pestle 40 5000
Total 526,300 816,000
Gross margin = 816000 - 526300 = N 289700
Source: estimated by the researcher (2015)
From the Table 4.15 below, the overall total costs is N998,220 while the overall total
revenue is N1,432,500. The gross margin of N 434,280 was realized. Thus, groundnut cake
and groundnut oil production from the foregoing analysis are profitable to all the groundnut
processors in the study area irrespective the scale of operation they adopt.

lxxxv
Table 4.15: Total Gross margin analysis
Scale of operation Total costs (N) Total revenue (N)
Mini- scale Processors 18, 820 31, 500
Micro- scale Processors 119,000 172, 500
Small- scale Processors 334,100 412, 500
Medium- scale 526,300 816,000
Aggregate 998,220 1,432,500
Gross margin = 1,432,500 - 998,220 = N 434,280
Source: estimated by the researcher (2015)
4.3 Economic and Allocative Efficiencies of Groundnut Processors
4.3.1 Groundnut processors’ economic efficiency indices
The stochastic frontier production and cost functions were used to estimate the economic
efficiency indices of the groundnut processors in the study area. As Greene (1993) observed,
economic efficiency indices were estimated from as products of technical and allocative
efficiency indices. Thus, the level of technical efficiency of a particular firm is characterized
by the relationship between observed production and some ideal or potential production. The
frequency distribution of the predicted economic efficiency of the groundnut processing
firms in the study area is presented in Table 4.16. From Table 4.16, the average economic
efficiency indices of the groundnut processing firms in the study area was 0.36, with a low
of 0.06 and a high of 0.66. The result showed that 23.9 percent of the groundnut processing
firms had economic efficiency indices between 0.01 and 0.20. About 29.8 % of the

lxxxvi
groundnut processing firms had economic efficiency indices between 0.21 and 0.30, 11.9%
had between 0.31 and 0.40, 7.9% between 0.51 and 0.60 and 2.8% between 0.61 and 0.70.
The average best groundnut processing firms needs a cost saving of 45%, that is, (1–
[0,36/0.66 x 100]) to attain the frontier while the average worse groundnut processing firms
require a cost saving of 91%, that is, (1 – [0.06/0.66 x100]) to become the most efficient
entrepreneur in the business.
Table 4.16: Economic efficiency estimates.
Economic efficiency range Frequency Percentage
0.01 – 0.1 60 23.8
0.11 – 0.20 60 23.8
0.21 – 0.30 75 29.8
0.31 – 0.40 30 11.9
0.41 – 0.50 00 0.00
0.51 – 0.60 20 7.9
0.61 – 0.70 7 2.8
Total 252 100
Mean = 0.36
Minimum = 0.06
Maximum = 0.66
Standard error = 0.12
Source: Field Survey, 2015
4.3.2 Groundnut processors’ allocative efficiency
Table 4.17 shows the frequency distribution of allocative efficiency of the groundnut
processing firms in the study area. Of the sampled groundnut processing ventures, 13.9%
had allocative efficiency between 0.01 and 0.1, 11.9% between 0.11 and 0.2, 17.9% between
0.21 and 0.30, 18.7% between 0.31 and 0.40, 19.8% between 0.41 and 0.50, 6.7% between
0.51 and 0.60, 4.0% between 0.61 and 0.70, 3.2% between 0.71 and 0.80, 2.4% between
0.81 and 0.90 and 1.6% between 0.91 and 1.00. The predictive allocative efficiencies vary
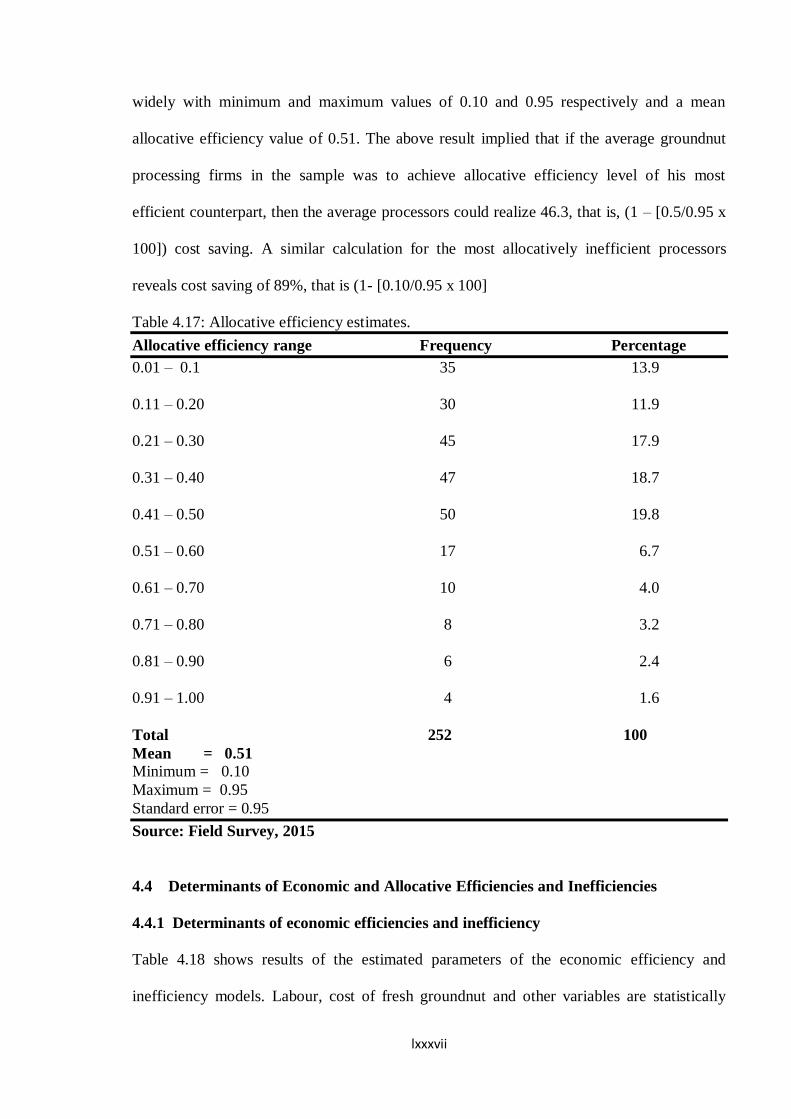
lxxxvii
widely with minimum and maximum values of 0.10 and 0.95 respectively and a mean
allocative efficiency value of 0.51. The above result implied that if the average groundnut
processing firms in the sample was to achieve allocative efficiency level of his most
efficient counterpart, then the average processors could realize 46.3, that is, (1 – [0.5/0.95 x
100]) cost saving. A similar calculation for the most allocatively inefficient processors
reveals cost saving of 89%, that is (1- [0.10/0.95 x 100]
Table 4.17: Allocative efficiency estimates.
Allocative efficiency range Frequency Percentage
0.01 – 0.1 35 13.9
0.11 – 0.20 30 11.9
0.21 – 0.30 45 17.9
0.31 – 0.40 47 18.7
0.41 – 0.50 50 19.8
0.51 – 0.60 17 6.7
0.61 – 0.70 10 4.0
0.71 – 0.80 8 3.2
0.81 – 0.90 6 2.4
0.91 – 1.00 4 1.6
Total 252 100
Mean = 0.51
Minimum = 0.10
Maximum = 0.95
Standard error = 0.95
Source: Field Survey, 2015
4.4 Determinants of Economic and Allocative Efficiencies and Inefficiencies
4.4.1 Determinants of economic efficiencies and inefficiency
Table 4.18 shows results of the estimated parameters of the economic efficiency and
inefficiency models. Labour, cost of fresh groundnut and other variables are statistically
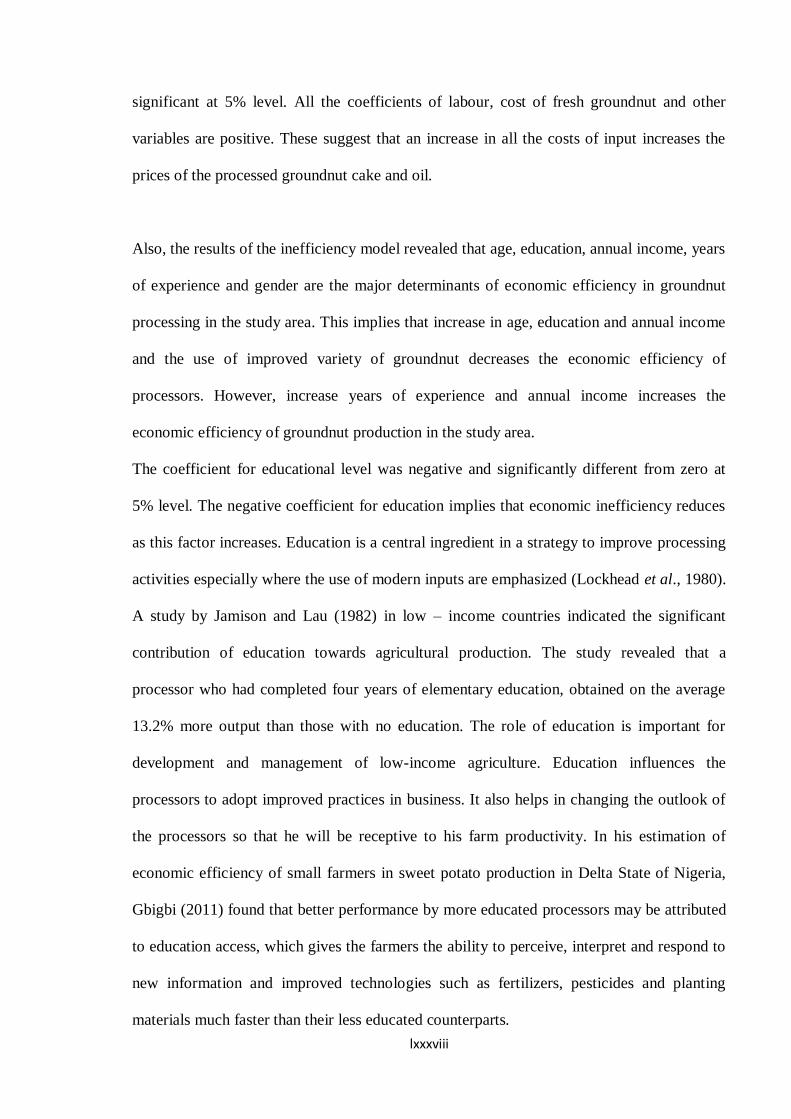
lxxxviii
significant at 5% level. All the coefficients of labour, cost of fresh groundnut and other
variables are positive. These suggest that an increase in all the costs of input increases the
prices of the processed groundnut cake and oil.
Also, the results of the inefficiency model revealed that age, education, annual income, years
of experience and gender are the major determinants of economic efficiency in groundnut
processing in the study area. This implies that increase in age, education and annual income
and the use of improved variety of groundnut decreases the economic efficiency of
processors. However, increase years of experience and annual income increases the
economic efficiency of groundnut production in the study area.
The coefficient for educational level was negative and significantly different from zero at
5% level. The negative coefficient for education implies that economic inefficiency reduces
as this factor increases. Education is a central ingredient in a strategy to improve processing
activities especially where the use of modern inputs are emphasized (Lockhead et al., 1980).
A study by Jamison and Lau (1982) in low – income countries indicated the significant
contribution of education towards agricultural production. The study revealed that a
processor who had completed four years of elementary education, obtained on the average
13.2% more output than those with no education. The role of education is important for
development and management of low-income agriculture. Education influences the
processors to adopt improved practices in business. It also helps in changing the outlook of
the processors so that he will be receptive to his farm productivity. In his estimation of
economic efficiency of small farmers in sweet potato production in Delta State of Nigeria,
Gbigbi (2011) found that better performance by more educated processors may be attributed
to education access, which gives the farmers the ability to perceive, interpret and respond to
new information and improved technologies such as fertilizers, pesticides and planting
materials much faster than their less educated counterparts.

lxxxix
The coefficient for membership of cooperative was negative and statistically significant at
10% level of probability. This means that increase in the years spent as a member of a
cooperative will reduce the level of economic inefficiency. Membership of cooperative can
serve as a medium for exchange of ideas that can improve their business operations. It has
also been reported that membership of cooperative can serve as an avenue through which
innovations diffuse among processors (Adeola et al., 2011).
Table 4.18: Estimated Determinants of Economic efficiency and inefficiency
‘Variable Coefficient Standard
Error
t-ratio
Constant (βo) 0.0724 0.0345 2.0985
cost of Labour (β1) 0.30005** 0.0008 0.0250
cost of fresh groundnut (β2) 0.2404** 0.0025 0.0960
Fuel wood (β3) - 0.1230 0.0012 2.5000
Depreciation (β4)
Other variables (β5)
Inefficiency model
Constant (δ 0)
- 0.1100**
0.4512**
8.28**
0.0058
0.0671
0.0124
-1.6974
0.0003
9.4300
experience of the processors (δ
1)
-0.822* 0.0023 -4.115
Educational level (δ 2) -0.039** 0.0008 -0.40
Age (δ 3) 1.14 0.0234 1.94
Association membership (δ4) -0.32** 0.0087 -5.20
Amount of credit (δ 5) 0.04 0.i765 0.717
***P<0.01, **P<0.05, and *P<0.10
Source: estimated by the researcher using e-view 3.4
4.4.2 Explanation of parameters of economic efficiency

xc
(i) Labour (X1): From the Table 4.18, labour has an estimated coefficient of 0.3 and
significant at 5% level of probability. This shows that a unit increased in the quantity of
labour increases the output of processing by about 30%. Therefore labour is a very important
factor input in groundnut processing enterprises in the study area.
(ii) Fresh groundnut seeds (X2): the coefficient of fresh groundnut seeds was found to be
0.24 and significant at 5% level of probability. This indicates that a unit increase in the
quantity of fresh groundnut bunch increases the output of processing by 24%. Hence, the
seeds of fresh groundnut are relevant in groundnut processing in the study area.
(iii) Fuel wood (X3): the coefficient of fuel wood was negative and not significant. This
shows that expenditures on fuel wood is a decreasing function of the output of groundnut. In
other word, the more the fuel consumed in the processing process, the less the profit margin.
Thus, a unit increase in the cost of fuel decreases the output of groundnut cake and oil by
12%.
(iv) Depreciation (X4): the coefficient of depreciation was estimated at -0.11 but
significant at 5% level of probability. This implies that a unit increases in deprecation
decreases the output of groundnut processing by 11%. The negative sign is attributed to the
fact that the wear and tear of processing equipments could lead to loss of groundnut cake
and oil output.
(v) Other variables (X5): other variable costs include the cost of transportation, water,
storage, fuel and loading associated with groundnut processing in the study area. It has a
positive coefficient and significant at 5% level of probability. This suggests that a unit
increase in the efficient use of other variables increases the output of groundnut processing

xci
by 45%. Therefore the influence of other variables in the groundnut processing into cake and
oil cannot be neglected.
4.3.3 Explanation of parameters of economic inefficiency
(i) Experience of the processors (Z1): the estimated coefficient of processing experience
was found to be -0.822 and significant at 10% level of probability. Therefore a unit increase
in years of experience decreases inefficiency level of the processors by about 80%. This
implied that as years of processing experience increases, economic inefficiency decreases. It
further suggests that processors with longer years of experience tend to be more efficient
than those with fewer years of experience. Therefore, the years of experience of the
groundnut processors in the study area contribute significantly to their economic efficiency.
(ii) Education (Z2): The coefficient of education is negatively related to inefficiency. It was
estimated to be -0.039 and significant at 5% level of probability. It suggests that a unit
increases in education decreases the inefficiency level of the groundnut processors by about
3%. This is so because groundnut processors with considerable years of cognate and related
years of education respond readily to effective decision-making in processing.
(iii) Age (Z3): the coefficient of age of the processors was estimated to be 1.14. However, it
is insignificant as shown in the Table 4.18. The positive sign suggests that as the processor
gets old inefficiency increases. This support the result of study by Barret (2009) that
processors within the active age bracket are more efficient that those within the inactive age
bracket.
(iv) Membership of association (Z4): the coefficient of association membership was found
to be positive and significant at 5% probability level. This suggests that processing
inefficiency will be lowered the longer the processors stay in associations.
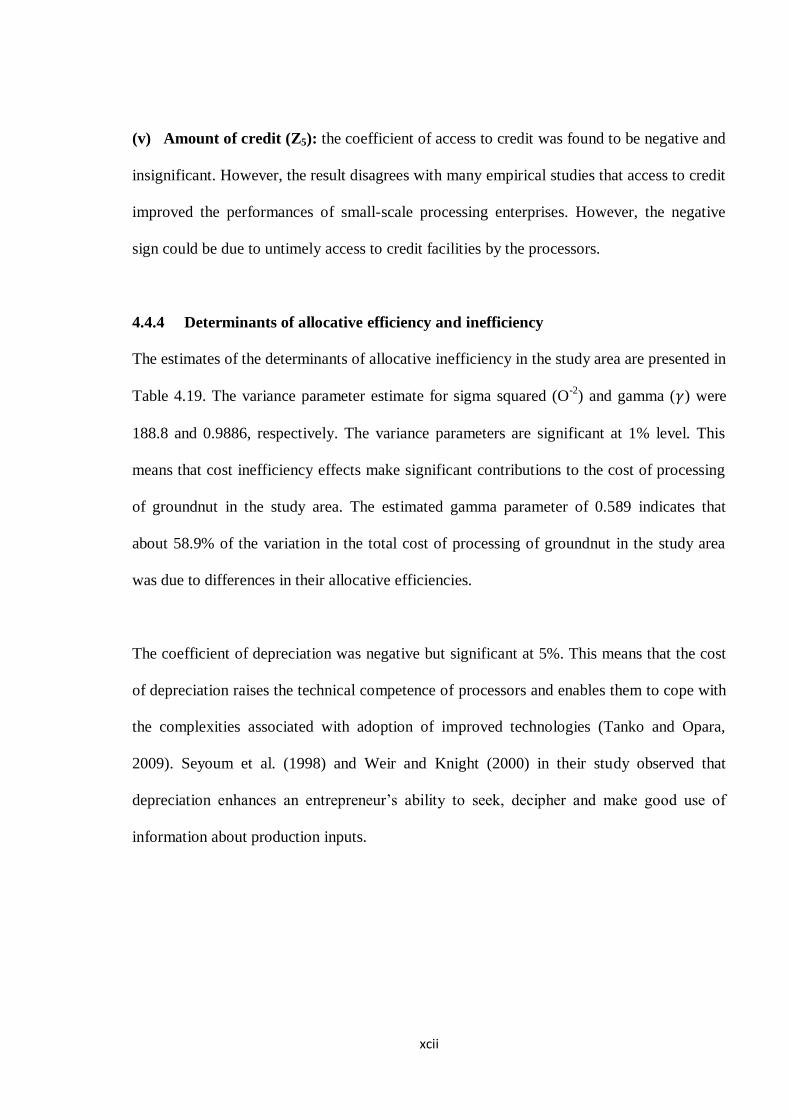
xcii
(v) Amount of credit (Z5): the coefficient of access to credit was found to be negative and
insignificant. However, the result disagrees with many empirical studies that access to credit
improved the performances of small-scale processing enterprises. However, the negative
sign could be due to untimely access to credit facilities by the processors.
4.4.4 Determinants of allocative efficiency and inefficiency
The estimates of the determinants of allocative inefficiency in the study area are presented in
Table 4.19. The variance parameter estimate for sigma squared (O-2
) and gamma (𝛾) were
188.8 and 0.9886, respectively. The variance parameters are significant at 1% level. This
means that cost inefficiency effects make significant contributions to the cost of processing
of groundnut in the study area. The estimated gamma parameter of 0.589 indicates that
about 58.9% of the variation in the total cost of processing of groundnut in the study area
was due to differences in their allocative efficiencies.
The coefficient of depreciation was negative but significant at 5%. This means that the cost
of depreciation raises the technical competence of processors and enables them to cope with
the complexities associated with adoption of improved technologies (Tanko and Opara,
2009). Seyoum et al. (1998) and Weir and Knight (2000) in their study observed that
depreciation enhances an entrepreneur‟s ability to seek, decipher and make good use of
information about production inputs.

xciii
Table 4.19: Estimated Determinants of allocative efficiency and inefficiency `
Variable Coefficient Standard error T-ratio
Constant (βo) 0.5257*** 0.0812 6.4741
cost of Labour (β1) 0.3006 0.0011 0.0545
cost of fresh groundnut (β2) -0.0087 0.0057 -1.5263
Wood fuel (β3) -0.0132 0.0050 -2.6400
Depreciation (β4) -0.0198** 0.0149 -1.3288
Other variables (β5)
Inefficiency model
Constant (δ 0)
0.4512**
1.08**
0.0671
0.0104
0.0003
1.4300
Experience of processors (δ 1) -0.467* 0.0761 -0.0115
Educational level (δ 2) -0.006** 0.0003 -0.403
Age (δ 3) 4..111 0.0354 2.3294
Association membership (δ4) -0.342** 0.0066 -7.3420
Amount of credit (δ 5)
Sigma-square (σ2) = 188.8
Gamma (𝛾) = 0.9886
1.214 0.1355 0.7174
***P<0.01, **P<0.05, and *P<0.10
Source: estimated by the researcher using e-view 7
4.4.5 Explanation of parameters of allocative efficiency
(i) Labour (X1): From the Table 4.19, the estimated coefficient of labour was 0.3 but
insignificant. This shows that labour cost has positive effects on allocative efficiency of the
processors in the study area by about 30%. The positive relationship between labour and
allocative efficiency supports the study by Ogundari (2006) on economics of scale and cost
efficiency in in small-scale maize production in Nigeria.

xciv
(ii) Fresh groundnut seeds (X2): the coefficient of fresh groundnut seeds was found to be
-0.0087 but insignificant. This indicates that a unit increase in the cost of fresh groundnut
bunch decreases the output of processing by 0.08%. However, this is in line with the aprori
expectation. Experience had shows that an increase in costs should have negative impact on
the return of a processing business. Hence the seeds of fresh groundnut are relevant in
groundnut processing in the study area.
(iii) Wood fuel (X3): the coefficient of wood fuel was negative and not significant. This
shows that as the expenditure on fire wood increases, the profitability of the processed
products or output decreases. Thus a unit increase in the wood fuel decreases the return on
groundnut cake and oil by 1.3%.
(iv) Depreciation (X4): the coefficient of depreciation was estimated at -0.0198 and
significant at 5% level of probability. This implies that a unit increases in deprecation
decreases the allocatve efficiency of the processors and the output of groundnut processing
by about 2%. The negative sign is attributed to the fact that the wear and tear of processing
equipments could lead to loss of groundnut cake and oil output.
(v) Other variables (X5): other variable costs include the cost of transportation, water,
storage, fuel and loading associated with groundnut processing in the study area. It has a
positive coefficient of 0.4512 and significant at 5% level of probability. This suggests that a
unit increase in the efficient use of other variables increases the output of groundnut
processing by 45%. Therefore the influence of other variables in the groundnut processing
into cake and oil cannot be neglected.
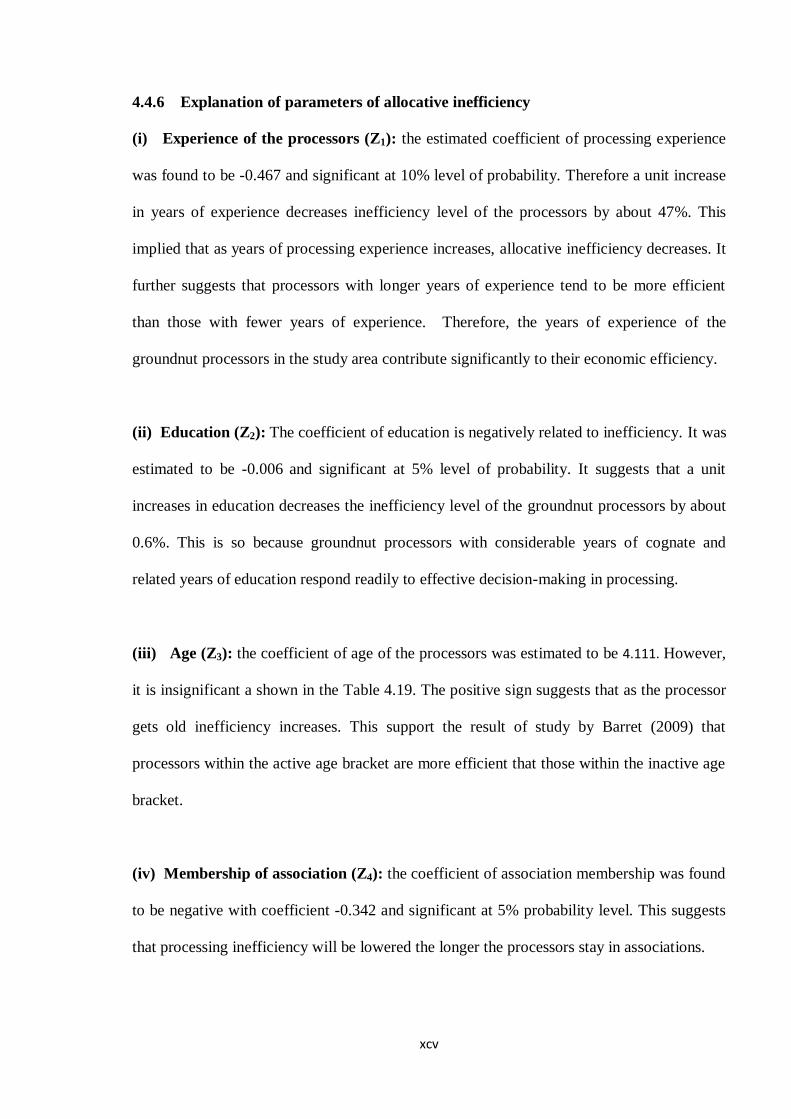
xcv
4.4.6 Explanation of parameters of allocative inefficiency
(i) Experience of the processors (Z1): the estimated coefficient of processing experience
was found to be -0.467 and significant at 10% level of probability. Therefore a unit increase
in years of experience decreases inefficiency level of the processors by about 47%. This
implied that as years of processing experience increases, allocative inefficiency decreases. It
further suggests that processors with longer years of experience tend to be more efficient
than those with fewer years of experience. Therefore, the years of experience of the
groundnut processors in the study area contribute significantly to their economic efficiency.
(ii) Education (Z2): The coefficient of education is negatively related to inefficiency. It was
estimated to be -0.006 and significant at 5% level of probability. It suggests that a unit
increases in education decreases the inefficiency level of the groundnut processors by about
0.6%. This is so because groundnut processors with considerable years of cognate and
related years of education respond readily to effective decision-making in processing.
(iii) Age (Z3): the coefficient of age of the processors was estimated to be 4.111. However,
it is insignificant a shown in the Table 4.19. The positive sign suggests that as the processor
gets old inefficiency increases. This support the result of study by Barret (2009) that
processors within the active age bracket are more efficient that those within the inactive age
bracket.
(iv) Membership of association (Z4): the coefficient of association membership was found
to be negative with coefficient -0.342 and significant at 5% probability level. This suggests
that processing inefficiency will be lowered the longer the processors stay in associations.

xcvi
(v) Amount of credit (Z5): the coefficient of amount of credit to the processors was
estimated to be 1.214. However, it is insignificant a shown in the Table 4.19. The positive
sign suggests that as the more the groundnut processors could get access to credits, the more
their efficiency parameters. Credit refers to the amount or its money value equivalent
borrowed from lending agencies (banks, government, friends, money lenders, relatives) by
the processors in order to sustain and improve management of his processing business
through the purchase of processing inputs and the hiring of labour where needed.
4.5 The Level of Poverty among the Groundnut Processors in Zamfara State
The poverty indices were estimated by measuring the wellbeing of the groundnut processors
in terms of their total consumption-expenditure and their household size before and after
engaging in groundnut processing business. The Foster-Greer and Thorbeck model of adult
equivalent scale was used. Having established the individual members of the household
consumption-expenditure per month as indicated in Table 4.20, one-third (1/3) of the mean
consumption expenditure was used to establish a poverty line of N1198.40 and N 1173.94
per month per household before and after engaging in groundnut processing ventures
respectively. These measures of poverty lines were in accordance with Foster-Greer and
Thorbeck model as shown in column III of Table 4.20(a) and Table 4.20 (b) respectively.
From these poverty lines, the p-alpha (poverty index) class of poverty measures was used in
determining the headcount, depth and severity of poverty among the groundnut processors
as indicated in column VI, VIII and IX of both Table 4.20(a) and Table 4.20(b)
Table 4.20 (a): Foster-Greer and Thorbeck measure of poverty for Groundnut Processors
I II III IV V VI VII VIII IX
Y (N) ME (N) Z(N) TEP
(N)
AEP
(N)
HCR PGR PD(%) PS(%)

xcvii
(%) (%) P = 1 P = 2
98,200 244.32 198.40 27, 011 29.98 0.39 0.87 0.291 0.193
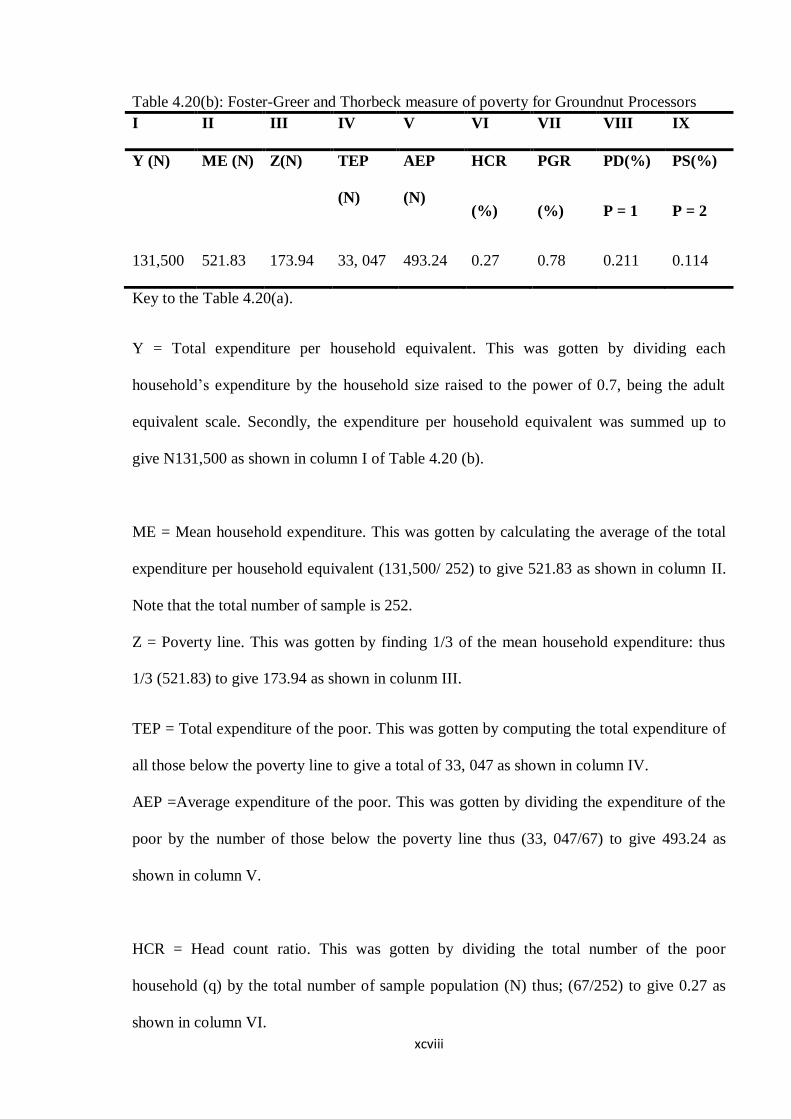
xcviii
Table 4.20(b): Foster-Greer and Thorbeck measure of poverty for Groundnut Processors
I II III IV V VI VII VIII IX
Y (N) ME (N) Z(N) TEP
(N)
AEP
(N)
HCR
(%)
PGR
(%)
PD(%)
P = 1
PS(%)
P = 2
131,500 521.83 173.94 33, 047 493.24 0.27 0.78 0.211 0.114
Key to the Table 4.20(a).
Y = Total expenditure per household equivalent. This was gotten by dividing each
household‟s expenditure by the household size raised to the power of 0.7, being the adult
equivalent scale. Secondly, the expenditure per household equivalent was summed up to
give N131,500 as shown in column I of Table 4.20 (b).
ME = Mean household expenditure. This was gotten by calculating the average of the total
expenditure per household equivalent (131,500/ 252) to give 521.83 as shown in column II.
Note that the total number of sample is 252.
Z = Poverty line. This was gotten by finding 1/3 of the mean household expenditure: thus
1/3 (521.83) to give 173.94 as shown in colunm III.
TEP = Total expenditure of the poor. This was gotten by computing the total expenditure of
all those below the poverty line to give a total of 33, 047 as shown in column IV.
AEP =Average expenditure of the poor. This was gotten by dividing the expenditure of the
poor by the number of those below the poverty line thus (33, 047/67) to give 493.24 as
shown in column V.
HCR = Head count ratio. This was gotten by dividing the total number of the poor
household (q) by the total number of sample population (N) thus; (67/252) to give 0.27 as
shown in column VI.

xcix
PGR = Poverty gap ratio. This was gotten by calculating the difference between expenditure
of the poverty line and average expenditure of the poor and expressing it as a function of the
poverty line thus; (173.94 – 37.95) /173.94 to give 0.78 as shown in column VII.
PD = Poverty depth. This was gotten by multiplying the head count ratio by the poverty gap
ratio thus; 0.27 x 0.78 to give 0.211
PS = Poverty severity. This was computed by multiplying the head count ratio by the
poverty gap ratio raised to the power of 2, thus; 0.27 x (0.78)2
to give 0.114 as shown in
column IX.
Po = Head count Poverty index
P1 = poverty gap (depth)
P2 = poverty severity
The poverty measures indicated in Table 4.20(a) shows the poverty status of the groundnut
processors before engaging in groundnut processing business. The Table 4.20(a) shows that
39 % of the groundnut processor was living below the line of poverty while 61% were above
the poverty line. The poverty head count, depth and severity were 87 %, 29 % and 19 %
respectively. This implied that 87 % of the groundnut processor was below the poverty line
of N N1198.40 per month while 29 % of expenditure is needed to bring them up to the
poverty line. The poorest groundnut processors accounted for only 19 %.
Table 4.20(b) shows the poverty status of the groundnut processors after engaging in
groundnut processing business. The Table 4.20(b) shows that 27 % of the groundnut
processor was living below the line of poverty while 73% were above the poverty line. What
this suggests is that, by engaging in groundnut processing business in the study area, the

c
number of respondents living below the poverty line has been reduced from 39 % to 27 %.
The poverty line, poverty head count, depth and severity which were N 1198.40, 87 %, 29 %
and 19 % respectively falls to 1173.94, 27 %, 21 % and 11 % respectively. In other word, 27
% of the groundnut processor was below the poverty line of N N1173.94 per month while
only 21 % of expenditure is needed to bring them up to the poverty line. The poorest
groundnut processors accounted for is reduced to only 16% from 19 %. Hence groundnut
processing business could be said to have positive impact on the wellbeing of the processors
in the study area.
4.6 Constraints Encountered by Groundnut Processing Firms in the Study Area
The constraints militating against groundnut processing in the study area varies from one
respondent to another. However, the processors pointed out that inadequate capital for
expansion, inadequate infrastructure, management characteristics, socio-economic problem,
and strategic planning problem are the major constraints hindering the processing of
groundnut. Other constraints include inadequate labour supply, lack of readily available
market, incomplete return of credit sales, low volume of production, unstable Electricity,
and lack of processing shed. A similar finding was also made by Haruna et al., 2006). The
respondents also pointed out that their profit will increase if the constraints can be
overcome. The frequency distribution of the constraints faced by the processors are ranked
in order of priority in the Table 4.21 below:

ci
Table 4.21: Constraints faced by groundnut processors
Problem Frequency Percentage
Financial problem 155 61.5
Inadequate infrastructures 39 15.5
Internal characteristics 36 14.3
Management problem 11 4.4
Socio-cultural problem 7 2.8
Strategic planning problem 4 1.6
Total 252* 100*
Source: estimated by the researcher
(i) Financial problems
Lack of Finance is a major constraint to the growth and expansion of groundnut processing
firms in Zamfara State as shown in Table 4.21. It accounted for about 61.5 %. Empirical
evidence shows that adequate financing contributes about 25 percent to the success of
groundnut processing firms (Ogujuiba et al., 2004). In Nigeria, most groundnut processing
firms are folding up or lack competitiveness because they lack the much required financial
capacity to prosecute their manufacturing concern. Most of these groundnut processing
firms cannot access loan on a long -and short -term basis. In a World Bank report in 2001, it
was reported that almost 50 percent of micro, 39 percent of small-scale firms (groundnut
processing firms included), and 37 percent of medium -scale firms are financially
constrained in Nigeria, as opposed to 25 percent of the very large firms (World Bank, 2001).
The implication of this is that groundnut processing firms are either discriminated against or
cannot access funds at the credit market. In addition to this, the stringent conditions attached
to loan and credit also discourages these industries from accessing credit from the credit

cii
market. This factor has largely undermined the capacity of groundnut processing firms in
Nigeria generally and Zamfara State in particular. While small-scale groundnut processing
firm operators have been claiming that banks impose stringent conditions and terms of
approval, the Banks on the other hand, have claimed that SME operators don‟t present
bankable projects. Ogujuiba et al. (2004) in a report on groundnut processing firms claimed
that 20 percent groundnut processing ventures have reported being constrained in receiving
long-term loans. This has forced groundnut processing firms to use their internal financing
which is usually unsustainable and increases the vulnerability of ventures as a result of low
capital base.
(ii) Inadequate Infrastructural facilities
The performance of groundnut processing ventures has also been hindered by the lack of
infrastructural facilities which accounted for about 15.5 %. Inadequate facilities like power
supply, telecommunication, accessible road networks and water supply constitute the
constraints facing groundnut processing firms after financial problem. A World Bank study
in 1989 estimated that “the cost of providing infrastructural facilities by groundnut
processing ventures in the absence of those facilities is estimated to be about 15-20 percent
of the cost of establishing manufacturing enterprises in Nigeria. Omolola (2008) contended
that the percentage has since increased to 30-35 percent of the cost of establishing
manufacturing concerns in Nigeria.
Of the infrastructural problems, the problem of lack of power supply has been the most
critical. The erratic power supply has hindered the business environment. In Nigeria, most
businesses have folded up or cannot operate as result of irregular and epileptic power
supply. The problem of power supply is so bad to the extent that the large industries are now
relocating to Ghana and other neighboring countries, while majority of the groundnut
processing ventures have since gone into extinction. The implication of this is that it has led

ciii
to the reduction in production activities. The cost of fuelling generators, machines and
equipments has led to cut in employees and increase in running cost of the groundnut
processing enterprises. This eventually leads to the folding up of most of these enterprises in
Nigeria, since they cannot compete in the market any more.
Most banks have capitalized on this and blamed their inability to fund groundnut processing
firms on the poor state of infrastructure, economic climate and low performance of public
utilities (Olarenwaju, 2001). However, Chris (2008), of the International Bank in
contradiction rejected Banks‟ excuse on infrastructural facilities, claiming that the huge
profits declared by banks‟ shows that the operating environment is not as bad as they think.
The truth however, is that the state of infrastructural facilities in Nigeria is poor. Where
infrastructural facilities are neither present, adequate not functional, the investment
environment cannot stimulate improvement for groundnut processing ventures.
(iii) Internal Characteristics Problems
Most groundnut processing ventures in Nigeria are battling with serious internal problems.
These problems range from poor management practices, poor accounting standards, shortage
of manpower, financial indiscipline to corruption and accounted for about 14.3% as shown
in Table 4.21. The reasons why most groundnut processing firms have not been able to
improve are due to poor management knowledge and practices, absence of transparent
organizational set up, poor succession plan, lack of entrepreneurial skills, lack of strategic
business plan, et cetera. The dearth of such skills in most groundnut processing firms due to
inadequate educational, professional, and technical background on the part of the owners
and employees of groundnut processing firms has plunged groundnut processing ventures
into further crisis.
civ
It is characteristic of groundnut processing ventures to ignore basic management procedures
and thus run businesses as a family affair by undermining proper book keeping and
accounting and managerial practices. Because of the way the business management and
accountability measures are ignored, reckless financial administration, wrong investment
decision and corruption becomes the order of the day (Omolola, 2008).
(iv) Management Problems
Lack of trained manpower and management skills also constitute a challenge to the survival
of groundnut processing firms in Nigeria, with about 4.4 frequency of occurrence as shown
in Table 4.21. According to West and Wood (2009), „90% of all these business‟ failures
result from lack of experience and competence.” Rogers (2013) also added that inefficiency
in overall business management and poor record keeping is also a major feature of most
groundnut processing firms. Technical problems and lack of essential and required expertise
in production, procurement, maintenance, marketing and finances have always led to funds
misapplication and wrong and costly decision making.
(v) Socio-Cultural Problems
Most Nigerian entrepreneurs do not have the investment culture of ploughing back profits.
Bala (2002) stressed that the attitude of a typical Nigerian entrepreneur is to invest today and
reap tomorrow. Also, the socio-political ambitions of some entrepreneurs may lead to the
diversion of valuable funds and energy from business to social responsibilities. The problem
of bias against made-in-Nigeria goods is significant. Most Nigerians have developed a high
propensity for the consumption of foreign goods against their locally-made substitutes.
(vi) Strategic Planning Problems

cv
SMEs often do not carry out proper strategic planning in their operations. Ojiako (2013)
stated that one problem of groundnut processing firms is lack of strategic planning. Sound
planning is a necessary input to a sound decision-making.
4.7 Test of Hypothesis
The hypotheses for the study are tested using chi-square as follows:
Table 4.22 Chi-Square Test of Hypothesis One (H01)
Responses Fo Fe Fo – fe (Fo – fe )2 (Fo – fe )
2/ fe
Yes 100 84 16 256 3.04
No 77 84 -7 49 0.58
No answer 75 84 -9 81 0.96
Total 252 252 4.58
Chi – Square (critical value), df = 249, α = 0.05 = 1.02
Source: computed by the researcher
Table 4.23 Chi-Square Test of Hypothesis Two (H02)
Responses Fo Fe Fo – fe (Fo – fe )2 (Fo – fe )
2/ fe
Yes 150 126 24 576 4.67
No 102 126 -24 576 4.67
Total 252 252 9.34
Chi – Square (critical value), df = 249, α = 0.05 = 1.02
Source: computed by the researcher

cvi
Table 4.24: Chi-Square Test of Hypothesis Three (H03)
Responses Fo Fe Fo – fe (Fo – fe )2 (Fo – fe )
2/ fe
Yes 90 84 6 36 0.43
No 85 84 1 1 0.012
No answer 77 84 -7 49 0.58
Total 252 252 1.03
Chi – Square (critical value), df = 119, α = 0.05 = 1.02
Source: computed by the researcher
Decision
Since the calculated chi- square values are greater than the tabulated value, we reject the null
hypothesis and accept the alternative hypothesis. We then conclude that:
(i) The socio-economic characteristics of the Groundnut processing entrepreneurs
significantly influenced their economic and allocative efficiencies of the
processors in Zamfara State.
(ii) The groundnut oil and groundnut cake processing ventures have impact on
poverty levels of the processors in Zamfara State.
(iii) The groundnut oil and groundnut cake processing in the study area are profitable
ventures.
cvii
CHAPTER FIVE
SUMMARY, CONCLUSION AND RECOMMENDATIONS
5.1 Summary
The study is an investigation of the economic analysis of groundnut processing and its
impact on the poverty level of the processors in Zamfara State, with the main focus on
groundnut cake and oil processing ventures. It provided insight into the socioeconomic
characteristics of groundnut cake and oil processors in the study area, estimates the
profitability of the groundnut processing ventures, its economic and allocative efficiencies
its impact on the poverty levels of the processors and identify the major constraints faced by
groundnut processing firms in the study area.
Primary data for the study were collected using structured questionnaire, administered to
252 groundnut cake and oil processing firms in the study area. Multi-stage sampling
technique was employed in selecting the respondents. Data collected were analyzed using
descriptive statistics, stochastic frontier function, gross margin analysis and Foster-Greer
and Thorbeck model.
Results of the study indicated that majority (66.2 %) of the groundnut cake and oil
processors in the study area fell between 20 and 49 years with mean age of 40 years,
indicating that middle-aged entrepreneurs were into groundnut processing ventures in the
study area. About 53.8 % of the groundnut processors in the study area were experienced in
the venture for 1-49 years, the average year of experience being 13.1 %. 15.9 % of the
groundnut processors had no formal education, 50.4 % had formal education, 19.8% had
quranic education and 13.9% had other forms of education. The average period of education
was 8 years.

cviii
The study also shows that 27.8% of groundnut processors in the study area were mini- scale
processors, 21.9% were micro- scale processors, 19.8 of groundnut processors were small-
scale processors and 18.7 were medium- scale processors. About 60 percent of the mini-
scale, miro-scale, small-scale and medium-scale groundnut processors had a household size
between one and five people and about 41 percent had a household size between six and ten
people. This implies that expenditure on food and other household necessities may be
minimal since majority of the groundnut processors (59.5) had only 1 to 5 members of
household to feed and take care of, which is relatively small. The mean scale for the
groundnut processors in the study area is 18.
The result of the study further revealed that groundnut processing is a profitable business
with groundnuts cake giving the highest total return of N 1,059,000 per month for all the
processors under study, while groundnut oil contributed N 373,500 per month to gross
revenue of the groundnut processors under study. A gross margin of N 434,280, which is a
measure of profitability, was realized for every 35½ bag of 100 kg size of groundnut
processed into groundnut cake and groundnut oil. Thus, groundnut cake and groundnut oil
production are profitable to all the groundnut processors in the study area irrespective the
scale of operation they operate.
The economic and allocative efficiency analyses indicated that the groundnut processors
operate their businesses with different levels of efficiencies. The average economic and
allocative efficiencies were 0.36 and 0.51, respectively.
The result of Foster-Green and Thorbeck measure of poverty revealed that, by engaging in
groundnut processing businesses in the study area, the number of groundnut processors
living below the poverty line has been reduced from 39 % to 35 % while those living above
cix
the poverty line has been increase from 61 % to 65 %. Also, the poverty line, poverty head
count, depth and severity which were N 1198.40, 87 %, 29 % and 19 % respectively fell to
N1173.94, 35 %, 24 % and 16 % respectively. Hence groundnut processing business could
be said to have positive impact on the wellbeing of the processors in the study area.
Some constraints hindering the performance of the groundnut processors include inadequate
finance, inadequate infrastructural facilities, managerial problems, socio-cultural problem,
and internal characteristics problems.
5.2 Conclusion
This study revealed that groundnut processing ventures have positive impact on the poverty
levels of the processors in the study area. This was confirmed by the result of the Foster-
Greer and Thorbeck model of poverty, which shows a reduction in the number of groundnut
processors living below the poverty line after engaging in the groundnut processing
businesses. The gross margin analysis gave a positive gross margin value, indicating that the
returns from the groundnut processing businesses in the study area are higher than its costs
of inputs. Therefore, the groundnut processing business is profitable.
The economic and allocative efficiency analyses indicated that the groundnut processors
operate their businesses with different levels of efficiencies, with the average economic and
allocative efficiencies being 0.36 and 0.51 respectively. The average values suggest that
some scope exist for the groundnut processors to increase their level of economic and
allocative efficiencies by allocating the input resources optimally. Furthermore, the analysis
of the frontier function showed that the major input variables influencing groundnut
processing were labour, costs of groundnut, output of groundnut, depreciation. These results
imply that in order to improve performance in groundnut processing, there is need to
cx
improve the quality of labour, charged a faire price, and improved the quality of the
processed products.
Results of the determinants of allocative and economic efficiency indicated that groundnut
cake and oil processing entrepreneurs‟ socio-economic variables should be considered as
significant factors influencing their efficiency in groundnut processing. Findings from the
study are that there is ample opportunity to increase the present level of efficiency for
groundnut processing in the study area. This can be achieved through improved socio-
economic factors which include the groundnut processors‟ education level, scale of
operation, quality groundnut seed and other processing inputs. Despite the benefit that
higher efficiency levels can have on output however, productivity gains stemming from
technological innovation remains of critical importance in groundnut processing.
5.3 Recommendations
Based on the findings and conclusions of the research, some policy recommendations that
will help in improving upon the level of groundnut processing and ameliorating the
identified constraints are proffered.
(i) Most socio-economic attributes of the groundnut processors investigated had
meaningful bearings on the processors‟ ability to procure and use the processing
inputs. Hence, government agencies should distribute inputs timely and at
affordable prices so as to enhance productivity in the groundnut processing
ventures.
(ii) Since the coefficient of labour and that of education are positively related to
output increasing level of utilization of these inputs will increase the output of

cxi
groundnut processing in the study area. The groundnut processing entrepreneurs
should therefore be encouraged to improve on the use of these inputs.
(iii) The mean level of allocative efficiency (0.589) and economic efficiency (0.889)
were below the optimum level. This indicates that there is scope for increasing
the level of allocative and economic efficiencies by 41 % and 11% respectively
through the adoption of efficient and improved methods such as using skilled
labour and improved groundnut seeds.
(iv) Education was found to have contributed in increasing economic and allocative
efficiencies in groundnut processing in the study area. Therefore all policy
measures that build the educational capacities of the groundnut entrepreneurs and
strengthen their managerial capacities will enhance greater performance of the
groundnut entrepreneurs. For example, adult education could be introduced in
rural parts of the study area as part of these progrmme.
(v) Inadequate capital was found to impede groundnut cake and oil processing in the
area. Hence, government and concerned organizations should effectively link
groundnut cake and oil processors to available financial institutions for the
provision of on-lending short and long term credit facilities. These financial
institutions can also provide advisory role to the processors to ensure prudent
management of such facilities.
(vi) In addition, the groundnut processors could help themselves by forming an
interest group that can stand on their behalf and put their request before the
government. Such requests should put pressure on the government to provide

cxii
adequate rural infrastructure such as markets, feeder roads and other social
amenities. This should be done in order to promote good investment climate for
the commercial development of groundnut cake and oil processing in the study
area.
5.4 Contribution of the Study to Knowledge
The study revealed that groundnut processing is a worthwhile business which businessmen
need to explore in order to increase their income level economic and welfare. This research
differed from previous studies in the following ways:
i. The use of Foster-Greer Thorbeck model of poverty measure distinguished this
study from the previous ones in related topics where used were made of
Purchasing Power Parity (PPP) for measuring poverty level. The Purchasing
Power Parity (PPP) was considered inefficient because of frequent fluctuation in
exchange rate, especially in Nigeria where this study is conducted. The Foster-
Greer Thorbeck model used information on the socio-economic characteristics of
the respondents, which are easily generated directly from the respondents. Its
result shows a 4% reduction in the poverty level of the respondents that are
engaged in the groundnut processing ventures in the study area. The Foster-Greer
Thorbeck model provides a more realistic measure of poverty than the
Purchasing Power Parity (PPP).
ii. The estimation of the profitability analysis shows how primary data sourced
through questionnaires can provide opportunity to make forecast and prediction
based on available data. The analysis worked out and established separate total

cxiii
revenue for groundnut cake and groundnut oil, compared their sum to total costs
off inputs and arrived at a positive margin, which is a measure of profitability.
iii. Groundnut processors operate with different level of efficiencies which are beset
with various constraints which hindered their ability to be productive. Financial
problem ranked first with 61.5%, limited infrastructure ranked second with 8.7%,
managerial problem ranked third with 8.2%, while policy inconsistency is the
least constraint with 1.9%. Those who were co-operative members reaped
benefits of membership which contributed immensely in overcoming such
constraints and improve on processing efficiency.

cxiv
REFERENCES
Abdulkadri, S. (1999). Why Small Businesses Have Not Thrived: Paper Presented at New
Business Enlightenment Forum organized by Nigeria Chamber of Commerce,
North-south Zone, Financial Standard, Millennium Harvest Ltd, Lagos.
Adeyeye, V.A. and Ajakaiye, G. (1987). Concept, Measurement and Causes of Poverty,
CBN Economic and Financial Review, Vol.39, No4
Adebesin, A. Umaru, B. and Daniel, M. (2011). SMEs Do Not Enjoy Any Form of
Incentive: A socio- economic Dimension of the Rural Enterprises in the southern
metropolis of Nigeria, Businessday, Media Limited, Lagos, Nigeria.
Adeola, N.; Sahan, M. and Jereb, T. (2011). China on Business, The Economist Business
Travelers Guides, Published by Collins, 8 Grafton Street, London WI
Ajakaiye, G. (2014). An Evaluation of Groundnut Processing by Women in a Rural Area of
North Central Nigeria. Journal of Agricultural Science, 21 – 34.
Akanngbe, R.; Sule, M. and Adamole, A. (2011). Technical Efficiency and Metatechnology
Ratios for Dairy Farms in Three Southern Cone Countries: A Stochastic Meta-
Frontier Model Journal of Productivity Analysis. 33(1): 33-45.
Alabi, S.; Samuel T. and Ladani, O. (2010). World Geography of Groundnuts Distribution
Production, Uses and Trade. ;www.lanra.uga.edu/ peanut/ publication/wgs.cfm
Anyawu, N.; Ibekwe, D. and Adesope, O. (2010). Profit Efficiency among Bangladeshi
Groundnut Farmers. Proceeding of 25th Conference of International Association
of Agricultural Economics (IAAE).
Aseidu, T. (2009). An Analysis of Productivity and Technical Efficiency of Small Holder
Cocoa Farmers in Nigeria. Journal of Sciences. 15(2): 127 - 133
Asongwa, B.C.; Ihemeje, J.C. and Ezihe, J.A.C. (2011). Technical and Allocative Efficiency
Analysis of Nigerian Rural Farmers: Implication for Poverty Reduction. Medwel
Agricultural Journal. 2(2): 132 – 136.
Ayozie, O. (2009). Nigeria/Vietnam Relations to Benefit from Small and Medium Scale
Enterprise (SMEs), An Article Published by Businessday News Paper August 23rd
,
Media Ltd, Lagos.
Azizah, D. and Zaimon, Y. (2007). Priorities and strategies for groundnut research in
Nigeria. Paper presented at the national workshop on groundnut rehabilitation in
Nigeria, Kano 11-12 May, 1999 15pp
Bala, R. (2002). Introduction to Farm Management Economics. Principles and
Applications. Agitab Publishers Ltd Zaria, Nigeria. pp 102 – 207.
Barret, S. (2009). Processing tropical crops. A technological approach, 1st Edition
Published by Macmillan Education Ltd.

cxv
Bifarin, H.; Nataly, Y. and Duke, J.A. (2010). A Handbook of Legume of world economic
importance. New York Plenum press.
Blum, L. (1995). Free Money – For Small Businesses and Entrepreneurs in Africa Sub
region Nigerian Journal of Rural Sociological Association. Obafemi Awolowo
University, Nigeria, Vol.12, NO3, PP 123 – 130
Bravo-Ureta, G. and Pinheiro P. (1997). Peanut Production, Processing and Products.
AVI publishing Company, Connecticut, USA
Brown, O. (2003). Essential Strategies for the New American Corporation: A practical
Analysis of the problems of Micro, Small and Medium Sized Businesses,
Huntonthon Publication Centre, Ltd, Enugu, Nigeria.
Brian, G. (2009). The Management of Business and Public Organisation in Competitive
Business Environment : Journal of Social and Management Sciences. Vol. 12 No
3, pp 20-26.
Byerlee, F.; Diao, E. and Jackson, K. (2005). Storage of rabi/summer groundnut
(Arachishypogaea L.) with calcium chloride for prolonged seed viability and
vigour, Tropical Science 31, 21-26.
Chukwudi, C. (2010). Update on transformation of groundnut and potential genes for
enhancement of quality, International Arachis News letter, 17, pp. 18-19.
Cece Laki, D. (1985). Assessment of crop loss in peanut caused by Sclerotinia sclerotiorum,
S. minor, and Sclerotium rolfsii in Argentina. Fitopatologia, Universidad Nacional
de Rio Cuarto (UNRC), Estafeta Postal 9, 5800 Rio Cuarto, Argentina.
International Journal of Pest Management. 44: 4, 251-254
Central Bank of Nigeria. (2001). First Annual Conference of the Monetary Policy
Department of the Central Bank of Nigeria on Practical Strategies on Growing
the Nigerian Economy, 26th October, 2001.
Central Bank of Nigeria. (2002). Second Annual Conference of the Monetary Policy
Department of the Central Bank of Nigeria on Practical Strategies on Growing
the Nigerian Economy, 26th October, 2001.
Chuta, H. and Liedholm, S. (1989). Transformation versus stagnation in the oil palm
Industry A.Comparison between Malaysia and Nigeria. Staff Paper no 91,
Department of Agricultural Economics Michigan State University, USA.
Consultative Group for International Agricultural Research (CGIAR). (2009). “Invest in the
processing of groundnuts”. Investment opportunities in
Nigeria. Retrieved on 18/1/11 from
www.tradeinvestnigeria.com/investment_opportunities/944416.html USDA,
(2008) Oilseeds: World Markets and
Tradehttp://usda.mannlib.cornell.edu/MannUsda/viewDocumentInfo.do?documentI
D=1490

cxvi
Coelli, C. (1995). Assessment of crop loss in peanut caused by Sclerotinia sclerotiorum, S.
minor, and Sclerotium rolfsii in Argentina. Fitopatologia, Universidad Nacional de
Rio Cuarto (UNRC), Estafeta Postal 9,
Coelli, C. (1992). A new peanut variety. Agricultural Experimental Stations Institiue of
Food and Agricultural Sciences, J.W. Site, Dean for Research, University of
Florida, Gainesville.
Cooperate Affairs Commission. (2011). An Evaluation of Groundnut Processing by Women
in a Rural Area of North Central Nigeria. Journal of Agricultural Sciences. 2
Chris, P. (2008). Factors influencing Labour Utilization in Small–Scale Cassava Production:
A Case Study Akwa Ibom State”, Unpublished M.Sc. Dissertation, University of
Uyo, Akwa Ibom State. pp1-69.
Dave, B. (2012). Optimal Production Plan and Resource Allocation for Small Rice-based
Farmers in Ogun State, Nigeria”, Asset Series A 2(2):37- 42.
Dasgupta, G. (1993). Groundnut seed multiplication and constraint; FAO‟S experience. In A
Aliyu, G. O Nwafor (Eds.): proceedings of National Workshop on Groundnut
Rehabilitation in Nigeria, Kano, Nigeria: FAO/FDA. 11 – 12 may 1999 pp. 14-22.
Diamond, M. R. and Williams, J. L. (1993). How to Incorporate New Business Strategies
into Already Established Venture A Handbook for Entrepreneurs and Professionals,
2nd Edition, McGrawhill Printing Press.
Ekine, O.N. and Onu, B. (2008). New Democratic Policies in Nigeria: An Official
Publication of the Nigeria High Commission on Political and Economic Policy
London Publishing Unit, Volume 1, No. 44. Pp34-38.
Engida, R.; Danil, M. and Das, B. (2011). Many Ways to Improving Your Business Skills,
Tallents and Experience: A Simplified Approach, Edited by the International
Labour Office, Geneva Printing Press.
Engle, D. and Neira, N. (2005). A Quantitative and Qualitative Assessment of Vulnerability
to Poverty in Nigeria. Being a Paper submitted for presentation of CSAE
Conference on Poverty reduction, Growth and Human Development in Africa,
March, 2004.
Falconer, D. and Arnold, N. (1989). “The Impact of Community Banks on Grassroots
Development in Nigeria: An Empirical and Analytical Investigation”. Journal of
Social and Management Sciences. Vol. 3.(2): 23-29.
Falconer, D. (1990). The Role of Community Banks in Entrepreneurial Development”.
Nigerian Journal of Rural Sociological Association. Obafemi Awolowo University,
Nigeria, Vol. 9, No 3, pp 54- 59.
Food and Agricultural Organization (2005). Production Year Book, Vol. 60.
Foster, G. and Thorbeck, E. (1984). On Economic Poverty: A Survey of Aggregate
Measures. Advances in Econometrics, Vol.3, 18:20 - 50

cxvii
Gbigbi, M.T. (2001). Economic Efficiency of Smallholder sweet Potatoes Producers in
Delta State, Nigeria: A Case Study of Ugbeli South Local Government Area.
Research Journal of Agriculture and Biological Sciences. 7(2): 163 – 168.
Glewwe, T. (1990). An Appraisal of Community Banking as a Strategy for Development in
Selected States of the South-western Nigeria”. An Unpublished Ph.D. Thesis of
Obafemi Awolowo University, Ile-Ife, Nigeria.
Greene, G. (1993). ‟Micro Credit Administration and Assessment and Poverty Reduction
in Nigeria‟‟ African Journal of Institutions and Development (AJID ). Vol.4. Nos. 6
&Pp 34-46.
Harbaugh, H. (2004) Starting a New Business: A Practical Handbook, New Edition,
Awawiya Printing Press Ltd.
Haruna, N.; Ibrahim, A.B.; Zongoma, A., and Shettima, B.G. (2006). Comparative
Economic Analysis of Adopters and Non-adopter of improved Rice Variety
Among Farmers in Hauwul Local Government Area of Borno State. A paper
presented at 20th Annual National Conference of Farm Management Association of
Nigeria held at Forestry Research Institute of Nigeria, Federal College of Forestry
Jos, Plateau State 18th –21st Sept, 2006 pp. 268-272.
Hazell, J. and Roell, N. (1983). Resource –Use and Productivity Among Rain-fed and
Irrigated Irish Potato producers in Plateau State Nigeria. A paper Presented at 20th
Annual National Conference of Farm Management Association of Nigeria held at
Forestry Research Institute of Nigeria, Federal College of Forestry Bauchi, Plateau
State .18th -21st September, 2006. pp. 25-29.
Hulme, D. and Mosley, P. (1996). Financial Strategies Against Poverty, volume 1 and 2,
London: Routledge printing Press
Hyman, V. (1990). The Role of Extension in Agricultural and Rural Development in
Nigeria. J. Agro-Business and Rural Development. 4 (4):60-65.
Ihekoronye, H. and Ngoddy, G. (1985). “Poverty Alleviation and Sustainable Development
in Nigeria”: An Article Published in Daily Trust, August 14, 2002.
International Food Policy and Research Institute (IFPRI). (2012). Groundnut Production,
Utilization, Research Problems and Further research needs in Nigeria. International
Workshop on Groundnuts, Ibadan, Nigeria
International Food Policy and Research Institute (IFPRI). (2014). Groundnut Production,
Utilization, Research Problems and Further research needs in Nigeria. International
Workshop on Groundnuts, Ibadan, Nigeria
International Labour Organization (ILO). (1990). Small Scale oil extraction from groundnut
and copra. Prepared under the joint auspices of the International Labour Office and

cxviii
United Nations Industrial Development Organization, Oxford and IBH Publication
Co. Pvt. Ltd. New Delhi.
Latruffe, J. (2010). How to Start and Manage Your Own Business: A Paper Presented at 3rd
Annual Conference of Nigeria Entrepreneurs and Business Firms: JVC Press,
Kaduna, Kaduna State, Nigeria
Irz, K. (2001). Manage Like an Entrepreneur, Harvard Business School, Publication of
Businessday Media Ltd, Lagos
Johnston, K. and Mellor, H. (1961). Resource Use Efficiency in Urban Farming: An
Application of Stochastic Frontier Production Function. Int. J. Agric. Biol. 8(1):38-
44.
Lau, S. (1982). Groundnut seed multiplication and constraint; FAO‟S experience. In A
Aliyu, G. O Nwafor (Eds.): proceedings of National Workshop on Groundunt
Rehabilitation in Nigeria, Kano, Nigeria: FAO/FDA. 11 – 12 may 1999 pp. 14-22.
Levi, S. C. (2000). Making it in Your Business: Personal Survival in the Business
Environment and Corporate World
Lipton, D. (2012). Profitability of Groundnut Production in Michika Local Government
Area of Adamawa State, Nigeria. J. Agric. Sci. 1(1):25-29.
Lockhead, M.; Kankwamba, H.; Mangisoni, J.H.; Simtowe, F.; Mausch, K. and Siambi, M.
(1980). Improved Legume Seed Demand Systems in Central Malawi: What Do
Farmers‟ Seed Expenditures Say About Their Preferences? 2012 Conference, August
18-24, 2012, Foz do Iguaçu, Brazil
Lynch, H. (1994). Impact of Agricultural Market Reforms on Small Holder Farmers in Benin
and Malawi. IFRI collaborative Research Project.
Makinde, J.T. and Fayomi, I.O. (2008). “Gender-Based Poverty and Micro Financing in
Some Parts of South-Western Nigeria‟‟ African Journal of Public Administration
and Management. Vol. xix. No.2
Muhammed, A. and Getnet Geremew, H. (2011). Efficiency of Resource Use in Coffee
Growing Area: The case of Smallholder Farmers in Ghibi Woreda Unpublished M.sc.
Thesis Presented to the School of Graduate Studies of Alemaya University.
Mukhtar, A.A. (2009). Performance of three groundnut (Arachis hypogaea L.) varieties as
affected by basin size and plant population at Kadawa. Ph.D. Dissertation
Submitted to post graduate school, Ahmadu Bello University, Zaria pp 173.
Napodo, F. and Ditto, D. (2013). New Hope for Small and Medium Scale Enterprises (SMEs)
in Nigeria: A New Perspective and Approach, Financial Standard, Publication
of Millennium Harvest Ltd, Lagos.
National Agricultural Extension Research and Liaison Services (NAERLS) (2011).
Agricultural survey for 2011 wet seasons National Agricultural Extension Research
and Liaisons Service.

cxix
Njoku, H. (2002). Groundnut Agronomy research in Malawi: Past achievements and future
Priorities. Proceedings of the fifth regional groundnut workshop for southern Africa.
National Bureau of Statistics. (2013). Statistical Bulletins
National Bureau of Statistics. (2014). Statistical Bulletins
Nnamdi, J.A. (2010). “An Overview of the Current State of SMEs in Nigeria and the Need
for Intervention,” A Paper Presented at the National Summit on SMIEIS Organised
by the Bankers‟ Committee and Lagos Chambers of Commerce and Industry
(BCLCCI), Lagos, 10th June, 2003.
Nwajiuba, G. and Akinsami, Y. (2003). Comparative profitability analysis of groundnut oil and
sheabutter extraction on the livelihood of women in the Savelugu/Nanton District”, Bsc.
Dissertation. University for Development Studies. Unpublished.
Norman, B. (1972). Food Processing Technology, Principles and Practice, Wood Head Publishing
limited, Cambridge, England, pp. 234-335.
Obayelu, K. (2012). A comparative Analysis of Rice and Groundnut oil extraction in Tamale
Metropolis”, BSc. Dissertation, Department of agricultural Economics &
Extension. University for Development Studies
Odedokun, M.O. (1998). Effectiveness of Selective Credit Policy Alternatives: A
Publication of the Evaluation Unit of the World Bank Development Forum, Re-
Published in the Journal of Economic Development. Vol. 16, pp 120-122.
Ogah, S. (2004). Empowering the Poor through Micro-Finance: Lessons of
Experience Paper presented at the 20th Bi-ennial Conference of the Development
Finance Department of Central Bank of Nigeria, held in Calabar Nigeria 4th-5th
Nov. 2002.
Ogundari, K. and Ojo, S.O. (2006). An Examination of Technical, Economic and Allocative
Efficiency of Small Farms. The Case of Cassava in Osun State of Nigeria. Journal
of Central European Agriculture. 7(3): 423- 432.
Ogundele, G. and Okoruwa, B. (2006). The Role of Small and Medium Scale Industries in
National, Social and Economic Development in Nigeria. Texas Corpus Christi,
Texas, United State, November 3, 2006.
Ogujuiba, K.; Ohuche, F. and Adenuga, A. (2004). Credit Availability to Small and
Medium Scale Enterprises in Nigeria and the importance of New Capital Base for
Banks: Background and Issues. Working paper accessed in December, 2010 in
www. Value fronteraonline.com/publication.jsp?type.
Ojiako, B. (2013). Planning for adequate in raw materials for Food production in Nigeria
"Agro Agua Bulletin Vol. 1.
Olarewaju, B. (2000). Small and Medium Scale Enterprises in Nigeria: An Alternative to
Economic Growth and Development, “African Journal of Social and Economic
Development”. Vol. 4, No13, pp. 67-75.
cxx
Oluwatayo, I.B.; Sekumade, A.B. and Adesoji, S.A. (2008). Resource Used Efficiency of
Maize Farmers in Rural Nigeria: Evidence from Ekiti State. World Journal of
Agricultural Science. 4(1): 91 – 99.
Oluyele, O. and Sanusi G. (2009). Groundnut improvement, production, management,
utilization in Nigeria: Problems and prospects. First ICRISAT Regional Groundnut
Meeting for West Africa, Niamey Niger 1988; 61-64 ICRISAT.
Olomola, O. (2004). Priorities and strategies for groundnut research in Nigeria. Paper
presented at the national workshop on groundnut rehabilitation in Nigeria, Kano 11-
12 May, 1999 15pp.
Omolola, O. (2008). Contributory Role of Non- Agricultural activities in the Rural
Economy: A case Study of Bendel State of Nigeria.
Omoti, N.E. (2001). Present Situation and Prospects for Groundnut Production in China. In
Achieving High Groundnut Yields. Pp. 17-26. Uyo Nigeria: ICRISAT 2001.
Onogwu, M. (2013). A guide to Frontier version 4.1. A Computer Programme for
Stochastic Frontier Production and Cost Function Estimation. Department of
Econometric, University of New England, Armidale.NSW2351 Australi 1994.
Onugu, T. (2005) Identification of factors that influence the technical efficiency of cotton
farmers in Nigeria. Nigeria Agric. Dev.stud., 2000; 2:133-45
Oregwu, D. (2013). Small Scale Enterprises, Economic Reform and National Development
in Nigeria. Lagos, Adejo Publishing.
Onugu, B. A (2005). Small and Medium Enterprises (SMEs) In Nigeria: Problems and
Prospects being dissertation submitted to the ST. Clements University in partial
fulfilment of the requirements for the award of the degree of Doctor of Philosophy
in Management.
Paudel, O and Matsuaka, B. (2009). Quantitative Analysis of Rural Poverty in Nigeria,
International Food Policy Research Institute (IFPRI).
Piesse, P. and Thirtle, A.S. (2006). Loan Administration and Utilization Under the Graduate
Agricultural Loan Scheme in Nigeria”. NISER, Individual Research Project Report.
No. 2, Ibadan: Nigerian Institute of Social and Economic Research NISER.
Ranjha, S.; Bmidele, O. and Syuman, D. (2009). " Impact of Small and Medium Enterprises
on Economic Growth and Development" American Journal of Business and
Management. Vol. 1, No. 1, 2012 pp. 18–22
Schultz, R. (1964). Food and Fee from legumes and oilseeds E Nwokolo and J Smartt Eds. pp
49- 63. New York: Chapman and hall, ODA (Overall Development
Administration).Annual report No. 13 Response of Groundnut to the distribution of
rainfall or irrigation.
cxxi
Sen, L. (1983). Identifying the climatic constraints for optimum production of groundnut and
delineating the areas with highest production potential on climatic basis. In: Proc. of
the symposium on Tropical crop Research and Development I
Simonya, J.B.; Umore, B.D. and Okoye, B.C. (2011). Gender Differentials in Technical
Efficiency among Maize Farmers in Essien Udim Local Government Area, Akwa
Ibom State, Nigeria. International Journal of Economic and Management
Sciences.1(2): 17 – 23.
Seyoum, C.; Ahmed, S.; Rafay, A.; Singh,; R.K. and Verma, U.K. (1998). Response of
groundnut varieties to spacing. Indian Journal of Agronomy. 31(3):248-251
Soyebo, M.; Dalli N. and Galio, D. (2005). Priorities and strategies for groundnut research
in Nigeria. Paper presented at the national workshop on groundnut rehabilitation in
Nigeria, Kano 11-12 May, 1999 15pp
Tanko, M. and Opara, A. (2009). Raw Materials Research and Development Councils
Survey of Agro Raw Materials: Groundnut pp 96.
Thirtle, Y. (2001). Florunner A new peanut variety. Agricultural Experimental Stations
Institute of Food and Agricultural Sciences, J.W. Site, Dean for Research,
University of Florida, Gainesville.
Timmer, H. (1995). Peanut Science and Technology, American Peanut Research and
Education Society, Inc. Yoakum, Taxas, USA
Timmer, H. (2004). Peanut Science and Technology, American Peanut Research and
Education Society, Inc. Yoakum, Taxas, USA
Tchale, L. (2009). Microbial infestation of peanuts as related to windrow-curing conditions.
Proceedings of the American Peanut Research and Education Association, 3: 127-
136.
Pickett, T.A. and K.T. Holley. (1952). Peanut roasting studies.
Ugwu, S. (2009). As cited in Balunywa Waswa; What are Micro, Small and Medium
Scale Enterprises? Entrepreneurship and Small Business Enterprise. Makerere
University Business School.
Udoh, E.J. and Nyienakuna, M.G. (2008). Socioeconomic Characteristic and Adoption
Trend of Artisanal Fisheries of Akwa Ibom State of Nigeria. Journal of
Agricultural Science. 4:141 – 146.
United Nation Development Programme (UNDP). (2008)
United States Development Agency (USDA). (2009)
Weir, T. and Knight, G. (2000). The seed hull weight ratio as an index of peanut maturity.
Peanut Science 4:47-50.

cxxii
West and Wood (2009). Aspects of groundnut utilization and possible improvements of
Indigenous food in some countries of semi-arid tropical Africa. In Groundnut a
Global Perspective (ed.).
World Bank (2010). Policy and Research Bulletin October, 2010 and March, 2010.
World Bank (2001). Policy and Research Bulletin October, 2000 and March, 2001.
World Bank, (2000). Policy and Research Bulletin October, 2000 and March, 2001.
Young, C. (1996). Peanut oil barleys in Industrial oil and fat product, Dikai printing press,
Benin City 2, 337-392
Yusuf, M. (2008). Culinary Preparations with groundnut, Recipe book in English, Hindi,
Tamil, Telugu and Gujatati, UNDP Sub-programme on "Promoting Groundnut as
Food Crop for Sustained nutritional Security" Implemented by National Research
Centre for Groundnut, Junagadh in Collaboration with Acharya NG Ranga
Agricultural University, RRS, Anantpur, Andhrapradesh.
Zuberu, T.A.; Mumni, S.S. and Oladele, A.S. (2013). The Impact of Research Led
Agricultural Producivity Growth on Poverty Reduction in Africa, Asia and Latin
America. Contributed paper for the 25th conference of the International Association
of Agricultural Economists. Durban.

cxxiii
APPENDIX I: RESEARCCH QUESTIONNAIRE
SECTION A: Socio-economic Characteristics of the Respondents
1. Name (optional):
2. Age : 20-29 [ ], 30-39 [ ], 40-49 [ ], 50-59 [ ], 60-69[ ]
3. Sex: male [ ] female [ ]
4. Highest level of education:
No formal education [ ] quranic education [ ] primary education [ ]
Secondary education [ ] adult education [ ]
5. Years of experience
1 - 10 [ ], 10-19 [ ], 20-29 [ ], 30-39 [ ], 40-49 [ ]
6. Scale of operation adopted
Mini- scale processors [ ]
Micro- scale processors [ ]
Small- scale processors [ ]
Medium-scale processors [ ]
7. Sources of groundnut
Local market [ ]
Owned farm [ ]
Research institute[ ]
Others [ ]
cxxiv
8. Sources of labour
Family labour [ ]
Hired labour [ ]
Both family and hired [ ]
Communal labour [ ]
Others [ ]
9. Number of labour used per month
Scale of operation number of labour
Mini- scale processors ………….
Micro- scale processors ………….
Small- scale processors ………….
Medium-scale processors ………….
10. Household size
Scale of operation number of Household size
Mini- scale processors ………….
Micro- scale processors ………….
Small- scale processors ………….
Medium-scale processors ………….
11. Household consumption expenditure per month
Scale of operation Household consumption expenditure
Mini- scale processors N …………. to N…………
Micro- scale processors N …………. to N…………
Small- scale processors N …………. to N…………
Medium-scale processors N…………. to N…………

cxxv
12. Quantity of 100 Kg bags of groundnut processed per month
Scale of operation 100 Kg bags of groundnut processed
Mini- scale processors ………….
Micro- scale processors ………….
Small- scale processors ………….
Medium-scale processors ………….
SECTION B: Profitability Analysis
13. Do you considered returns from the business per month greater than the costs?
Yes [ ]
No [ ]
14. If yes, by what margin per month (estimate)? ……………………………
15. Given the profit level, will you say that groundnut processing business has benefited
you and your household?
Yes [ ]
No [ ]
16. Kindly complete the table below on the inputs used, the quantity and the costs
Inputs Quantity per month Costs
Groundnut (in 100 Kg bag)
labour (hired)
salt (satchet)
pepper (kg)
water (litre)
Griding
Frying
Fixed Inputs
Mutter
cxxvi
Wooden Pestle
17. Which of the groundnut processing inputs used has the highest cost? ……………..
18. Which of the groundnut processing inputs used has the least cost? ………………
19. What is your estimated monthly revenue from groundnut cake? N ……………..
20. What is your estimated monthly revenue from groundnut oil? N ……………..
21. What other income source do you have? Specify …………………………
SECTION C; Poverty Analysis
22. In your opinion what is poverty? ………………………………………………..
23. From your understanding of poverty do you considered yourself poor?
Yes [ ]
No [ ]
24. How do you rate your welfare before engaging in groundnut processing business?
Unsatisfactory [ ]
Satisfactory [ ]
Highly satisfactory [ ]
25. How do you rate your welfare after engaging in groundnut processing business?
Unsatisfactory [ ]
Satisfactory [ ]
Highly satisfactory [ ]
26. What is your monthly expenditure on
(a) Food N…………………………………
(b) Health care N ………………………….
(c) Education N …………………………...
(d) Rent N…………………………………
(e) Others N……………………………….
Is your monthly earning enough to take care of your monthly expenditure?
Yes [ ]
No [ ]
27. If no, how do you complement your monthly expenditure? ………………………..
28. Would you say that groundnut processing ventures have contributed to poverty
reduction among the processors in Zamfara State?
cxxvii
Yes ( )
No ( )
29. If yes, how? ………………………………………………………
30. Suggest other ways you think poverty can be mitigated
(a) ………………………………………………………………..
(b) ………………………………………………………………..
(c) …………………………………………………………………
SECTION D: Constraints to groundnut processing ventures
31. Does Groundnut processing ventures in Zamfara State faced any kind of constraint?
Yes ( )
No ( )
32. Mention the constraints
(a) …………………………….
(b) …………………………….
(c) …………………………….
(d) …………………………….
(e) ……………………………..
33. Given the above challenges, what do you think is the reason why the rural population
still engaged in small-scale groundnut processing enterprise?
a. For family survival ( )
b. interest ( )
c. Convenience ( )
d. Others ……………………..
34. What other product processing ventures does small- scale businesses in Zamfara
engaged in? Specify…..................................................................................................
35. What is the major source of groundnut to the small- scale processors in zamfara state?
a. Personal farm ( )
b. Family farm ( )
c. Cooperative farm ( )
d. Community farm ( )
e. Market ( )

cxxviii
36. Are you a member of any Cooperative society or association?
Yes ( )
No ( )
37. In what ways have you benefited from membership of cooperative society?
a. Loan
b. Others (specify)……………………………………..
38. What are the major sources of capital to groundnut processing firms in Zamfara
State.
a. Personal savings ( )
b. Friends and relatives ( )
c. Cooperative ( )
d. Money-lenders ( )
e. Bank loan ( )
39. How many staff do you have?
Please specify:…….......................................................................................
40. Has there been any infrastructure introduced to your community because of small
businesses around? Yes [ ]
No [ ]
41. If yes, what are they?
a. Roads/bus stops
b. Street lights
c. Housing projects
d. Electricity
e. Others (please specify)…………………………..
42. Do you suggest that government should encourage and create opportunities for small
business in other parts of the state?
43. If yes, why …………………………………………………………………………
44. If no, why……………………………………………………………………………
45. Please feel free to add any additional comment you may want to add:
…………………………………………………………………………………………
…………………………………………………………………………………………

cxxix
…………………………………………………………………………………………
……………………………………………………………………………
Thank You for your Time

cxxx
APPENDIX II: FREQUENCY DISTRIBUTION
Number of workers Employed
Frequenc
y Percent
Cumulative
Percent
Valid less than 10 84 62.0 62.0
greater than
10 25 22.5 84.5
None 11 15.5 100.0
Total 120 100.0
Any infrastructure introduced to your community because of small businesses
Frequency Percent
Valid Yes 91 70.5
No 27 28.5
4 2 1.0
Total 120 100.0

cxxxi
If yes, what are the infrastructures?
Frequency Percent
Valid road or bus
stop 96 53.0
street light 15 7.5
housing
projects 1 .5
electricity 11 10.5
others 4 2.0
Total 107 73.5
Missin
g
System 33 26.5
Total 120 100.0
Should the government encourage and create opportunities for small businesses
elsewhere in the state
Frequency Percent
Valid Yes 118 99.0
Missin
g
System 2 1.0
Total 120 100.0

cxxxii
A THESIS SUBMITTED TO THE SCHOOL OF POSTGRADUATE STUDIES,
AHMADU BELLO UNIVERSITY, ZARIA, IN PARTIAL FULFILMENT OF THE
REQUIREMENTS FOR THE AWARD OF DOCTOR OF PHILOSOPHY DEGREE
IN AGRICULTURAL ECONOMICS
DEPARTMENT OF AGRICULTURAL ECONOMICS AND RURAL SOCIOLOGY
FACULTY OF AGRICULTURE
AHMADU BELLO UNIVERSITY
ZARIA, KADUNA STATE
NIGERIA
FEBRUARY, 2016

cxxxiii
DECLARATION
I hereby declare that the work in this thesis titled “Economic Analysis of Groundnut
Processing (Oil and Cakel) and its Effects on Poverty Level of the Processors in
Zamfara State, Nigeria” has been written by me and is a record of my research work. No
part of this work has been resented in any previous application for another degree or
diploma at any institution. All borrowed information have been duly acknowledged in the
text and a list of references provided.
_____________________ _________________
Nasiru Alhaji YA’U Date

cxxxiv
CERTIFICATION
This Thesis titled: “Economic Analysis of Groundnut Processing (Oil and Cake) and its
Effects on Poverty Level of the Processors in Zamfara State, Nigeria” by Nasiru Alhaji
YA’U meets the regulations governing the award of the degree of Doctor of Philosophy in
Agricultural Economics of the Ahmadu Bello University, Zaria, and is approved for its
contribution to knowledge and literary presentation.
______________________ ___________________
Prof Ben Ahmed Date
Chairman, Supervisory Committee
______________________ ___________________
Dr O. Yusuf Date
Member, Supervisory Committee
______________________ ___________________
Prof J.G. Akpoko Date
Member, Supervisory Committee
______________________ ___________________
Prof Z. Abdulsalam Date
Head of Department
______________________ ___________________
Prof K. Bala Date
Dean, School of Post Graduate Studies

cxxxv
DEDICATION
This work is dedicated to my late father, Alhaji Ya‟u, Galadiman Kaura for his moral and
financial supports and all that matters in child upbringing till his death. May his soul rest in
peace.

cxxxvi
ACKNOWLEDGEMENTS
My profound gratitude goes to Almighty Allah, The Merciful and The Provider, who gave
me the endurance, resilience, foresight and thoughtfulness to undertake this research. To him
the Almighty be the glory.
I wish to specially thank my supervisors, Prof. Ben Ahmed, Dr. O. Yusuf and Prof. J.G.
Akpoko and the Postgraduate Coordinator, Dr. M.A. Damisa, for their patience, guidance
and corrections which have made this work a reality. May your stars never deem.
I cannot but say a big thanks to the head of the department, Prof. Zakari Abdulsalam for his
contributory role in the course of this research work. The lord who lifted you shall not let
you down. Worthy of mention also are the entire staff in the department of Agricultural
Economics and Rural Sociology, Ahmadu Bello University, Zaria. Special thanks to my
employer and sponsor, the Federal Polytechnic Kaura Namoda, Zamfara State, Nigeria for
its role in the entire programme.
I also wish to sincerely acknowledge the motivations, supports, encouragement, prayers and
all that matters in my academic, social and total upbringing from my parents, those alive and
those that are late, especially the late father, Alh. Ya‟u, Galadiman Kaura. May his soul rest
in peace and may Allah grants him Al-Jannat Firdaus. My special thanks go to my brothers
as well as mentors, in person of Engnr. Sanusi Ya‟u and senator Sahabi. Ya‟u. I must
acknowledge the entire members of my family for their patience and perseverance for my
long and frequent journeys across the states of the federation. Mention must also be made of
friends, colleagues, including Dr. A.A Ngaski, Dr. Suleiman Abdulrahman and all wishers
who severally offered words of advice and wisdom on how to improve this research work.
Finally mention must also be made of Mr. Alfa Yakub Kamba‟a whose input in this research
work has contributed in no small amount to its success.

cxxxvii
TABLE OF CONTENTS
Content Page
TITLE PAGE ………………………………………………………………..... i
DEDICATION ………………………………………………………………..... ii
DECLARATION ………………………………………………………………..... iii
CERTIFICATION ………………………………………………………………..... iv
ACKNOWLEDGMENTS ………………………………………………………………..... v
TABLE OF CONTENT ………………………………………………………………..... vi
LIST OF TABLES ………………………………………………………………..... viii
LIST OF FIGURES ..................................................................................................... xi
ABSTRACT ………………………………………………………………..... xiii
CHAPTER ONE …………………………………………………………........................ 1
INTRODUCTION………………………………………………............................................. 1
1.1 Background to the Study…………………………………………………........ 1
1.2 Problem Statement………………………………………………………......... 3
1.3 Objectives of the Study……………………………………………………....... 5
1.4 Research Hypotheses ……………………………………………………......... 5
1.5 Justification for the Study…………………………………………………....... 6
CHAPTER TWO…………………………………………………………………...................
8
LITERATURE REVIEW………………………………………………………...................... 8
2.1 The Groundnut Production.......................................................................................... 8
2.2 Concept of Processing................................................................................................. 10
2.2.1 Processing of groundnut............................................................................................. 11
2.2.2 Processing of groundnut into groundnut cake (kuli kuli)............................................ 12
cxxxviii
2.2.3 Groundnut oil production in Nigeria........................................................................... 13
2.2.4 Groundnut oil processing and technology used.......................................................... 15
2.2.5 Groundnut processing, poverty reduction and economic growth in Nigeria.............. 16
2.2.6 An overview of the concept of poverty....................................................................... 19
2.2.7 Dimension of poverty in Nigeria................................................................................. 20
2.2.8 Dimension of poverty in Zamfara State...................................................................... 21
2.2.9 Causes of rural poverty in Nigeria.............................................................................. 23
2.2.10 General approach for reducing poverty..................................................................... 30
2.3 Empirical Review on Socio-economic Characteristics of Groundnut
processors............................................................................................................ ........
35
2.4 Empirical Review on Profitability of Groundnut Processing..................................... 36
2.5 Empirical Review on Economic and Allocative Efficiencies of Groundnut
Processing Firms.........................................................................................................
37
2.6 Empirical Review on the application of Stochastic Frontier in Efficiency
Studies................................................................................................................. .......
39
2.7 Review of Groundnut Processing Constraints............................................................ 43
2.8 Major Constraints Faced by Rural Groundnut Processing Ventures in Zamfara
State...................................................................................................................... .......
44
CHAPTER THREE……………………………………………………………………...........
50
RESEARCH METHODOLOGY………………………………………………………......... 50
3.1 Description of Study Area…………..………………………………………….. 50
3.2 Sample size and Sampling Technique................................................................. 52
3.3 Sources of Data Collection…………………………………………………..... 57
3.4 Method of Data Analysis……………………………………………………..... 57
3.4.1 Descriptive and inferential statistics………………………………………….... 57
3.4.2 Gross Margin analysis………………………………………………………….. 58
3.4.3 Stochastic frontier model………………………………………………………. 59

cxxxix
3.4.4 Inefficiency model............................................................................................... 61
3.4.5 Independent variables.......................................................................................... 62
3.4.6 Foster-Green and Thorbeke (FGT) model of poverty measurement................... 64
CHAPTER FOUR……………....……………………………………………………….
67
RESULTS AND DISCUSSION…………………………………………………………. 67
4.1 Socio-economic Characteristics Respondents………………………………… 67
4.1.1 Distribution of the respondents according to age…………………………....... 67
4.1.2 Respondents‟ level of education………………................................................. 68
4.1.3 Gender of the respondents.............................................................…………....... 69
4.1.4 Respondents‟ years of experience…………........................................................ 70
4.1.5 Scale of operation of the respondents.................................................................. 70
4.1.6 Respondents sources of groundnut...................................................................... 71
4.1.7 Respondents sources of labour............................................................................. 72
4.1.8 Total number of labour used per month by the respondents ............................... 73
4.1.9 Respondents household size................................................................................. 74
4.1.10 Respondents household consumption expenditure.............................................. 75
4.1.11 Quantity of (100kg bags) groundnut processed by the respondents................... 76
4.2 Profitability Analysis........................................................................................... 77
4.3 Economic and Allocative Efficiencies of Groundnut Processors........................ 83
4.3.1 Groundnut Processors‟ allocative efficiency indices.....……………………...... 83
4.3.2 Groundnut processors‟ allocative efficiency…................................................... 84
4.4 Determinants of Economic Inefficiencies and Inefficiency………………...... 85
4.4.1 Determinants of economic efficiencies and inefficiency.................................... 85
4.4.2 Explanation of Parameters of economic efficiency............................................. 87
cxl
4.4.3 Explanation of parameters of economic inefficiency.......................................... 88
4.4.4 Determinants of allocative efficiency and inefficiency...................................... 89
4.4.5 Explanation of parameters of allocative inefficiency......................................... 91
4.4.6 Explanation of Parameters of allocative inefficiency........................................ 92
4.5 The level of poverty among the groundnut processors in Zamfara State.......... 94
4.6 Constraints encountered by groundnut processing firm in the study area…....... 97
4.7 Test of Hypothesis............................................................................................... 102
CHAPTER FIVE…………………………………………………………………………
104
SUMMARY, CONCLUSION AND RECOMMENDATIONS…………………........... 104
5.1 Summary………………………………………………………………………. 104
5.2 Conclusion…………………………………………………………………….. 106
5.3 Recommendations…………………………………………………………….. 107
5.4 Contribution of the study to Knowledge............................................................ 109
REFERENCES……………………………………………………………………... 111

cxli
LIST OF TABLES
Table Page
Table 2.1: Supply of edible oil (tones)........................................................................... 14
Table 3.1: Sampling panned (Zamfara Central Zone)...............................………….... 53
Table 3.2: Zamfara North Zone..................................................................................... 54
Table 3.3: Zamfara Southern Zone................................................................................ 55
Table 4.1: Age of the respondents……..………………............................................... 68
Table 4:2 Respondents‟ level of education……..………............................................. 69
Table 4.3: Respondents years of experience…….......................................................... 70
Table 4.4: Scale of operation of the respondents........................................................... 71
Table 4.5: Respondents sources of groundnut............................................................... 72
Table 4.6: Respondents‟ sources of labour.................................................................... 73
Table 4.7: Total number of labour used per month by the respondents........................ 74
Table 4.8: Respondents‟ household size........................................................................ 75
Table 4.9: Respondents‟ household consumption-expenditure.................................... 76
Table 4.10: Quantity (100kg bags) of groundnut processed by the respondents............ 77
Table 4.11: Estimated gross margin per 100kg bag of groundnut for mini-scale
processors......................................................................................................
78
Table 4.12: Estimated gross margin per 100kg bag of groundnut for micro-scale
processors......................................................................................................
80
Table 4.13: Estimated gross margin per 100kg bag of groundnut for small-scale
processors......................................................................................................
81
Table 4.14: Gross margin per 100kg bag of groundnut for medium-scale processors.... 82
Table 4.15: Total gross margin analysis.......................................................................... 83
Table 4.16: Economic efficiency estimates..................................................................... 84
Table 4.17: Allocative efficiency estimates..................................................................... 85
Table 4.18: Estimated determinants of economic efficiency and inefficiency……….. 87
Table 4.19: Estimated determinants of allocative efficiency and inefficiency.............. 91
Table 4.20a: Foster-Geer and Thorbeck measure of poverty for groundnut processors.. 94

cxlii
Table 4.20b Foster-Greer and Thorbeck measure of poverty for groundnut processors. 95
Table 4.21: Constraints faced by groundnut processors.................................................. 98
Table 4.22: Chi-square test of hypothesis one (Ho1)....................................................... 102
Table 4.23: Chi-square test of hypothesis two (Ho2)..................................................... 102
Table 4.24: Chi-square test of hypothesis three (Ho3).................................................... 103

cxliii
LIST OF FIGURES
Plate 2.1: Sample groundnut cake (Kuli Kuli in Hausa dialect): Nigerian
(Hausa) Snack balls...........................................................................13
Figure 3.1: Map of Zamfara State showing the study Area.................................56

cxliv
LIST OF APPENDICES
Appendices
Appendix I: Research Questionnaire……………………………………………………
Page
120
Appendix II: Frequency Distribution.................................................................................
126

cxlv
ABSTRACT
This research carried out an economic analysis of groundnut processing and determined its
effects on the poverty level of the processors in Zamfara State, with main focus on
groundnut oil and cake processing ventures. The multi-stage sampling procedure was used
in selecting sampled groundnut oil and cake in the study area. The research adopted a survey
method by using questionnaire to collect primary data from the respondents. The primary
data collected for the study were analyzed using descriptive statistics, stochastic production
frontier, Foster-Green and Thorbeck model and gross margin analysis. The result showed
that, on the average, the socio-economic characteristics of the groundnut oil and cake
processors in the study area influenced their poverty level. It was also found that the overall
total costs of processing groundnut per month was N998, 220 while the overall total revenue
was N1,432,500. The gross margin of N 434,280 was realized, suggesting that groundnut
processing is a profitable venture in the study area irrespective of the scale of operation
adopted. Also, the mean level of allocative efficiency (0.589) and economic efficiency
(0.889) were found to be below the optimum level, suggesting that there is scope for
increasing the level of allocative and economic efficiencies by 41 % and 11% respectively
through the adoption of efficient and improved technologies. Also, education was found to
have contributed in increasing economic and allocative efficiencies in groundnut processing
in the study area. The result of poverty analysis showed that by engaging in groundnut
processing business in the study area, the number of respondents living below the poverty
line has been reduced from 39 % to 27 %. Also, the poverty line, poverty head count, depth
and severity which were N 1198.40, 87 %, 29 % and 19 % respectively falls to 1173.94, 27
%, 21 % and 11 % respectively, indicating that groundnut processing businesses have
positive impact on the well being of the processors in the study area. Also, inadequate
capital was found to impede groundnut cake and oil processing in the area. Therefore all
policy measures that build the educational capacities of the groundnut entrepreneurs and
strengthen their managerial capacities will enhance greater performance of the groundnut
entrepreneurs. The government and concerned organizations should effectively link
groundnut cake and oil processors to available financial institutions for provision of credit
facilities. These financial institutions can also provide advisory role to the processors to
ensure prudent management of such facilities. In addition, the groundnut processors could
help themselves by forming an interest group that can stand on their behalf and put their
request before the government. Such requests should put pressure on the government to
provide adequate rural infrastructure and other social amenities. This should be done in
order to promote good investment climate for the commercial development of groundnut
cake and oil processing in the study area.