Economic Analysis and Optimal Sizing for Behind-the-meter ... Battery... · 175 kW/175 kWh...
15
Economic Analysis and Optimal Sizing for Behind-the-meter Battery Storage DI WU Pacific Northwest National Laboratory Interagency Sustainability Working Group Webinar March 22, 2018
Transcript of Economic Analysis and Optimal Sizing for Behind-the-meter ... Battery... · 175 kW/175 kWh...

Economic Analysis and Optimal Sizing for Behind-the-meter Battery Storage
DI WUPacific Northwest National LaboratoryInteragency Sustainability Working Group WebinarMarch 22, 2018
2
2
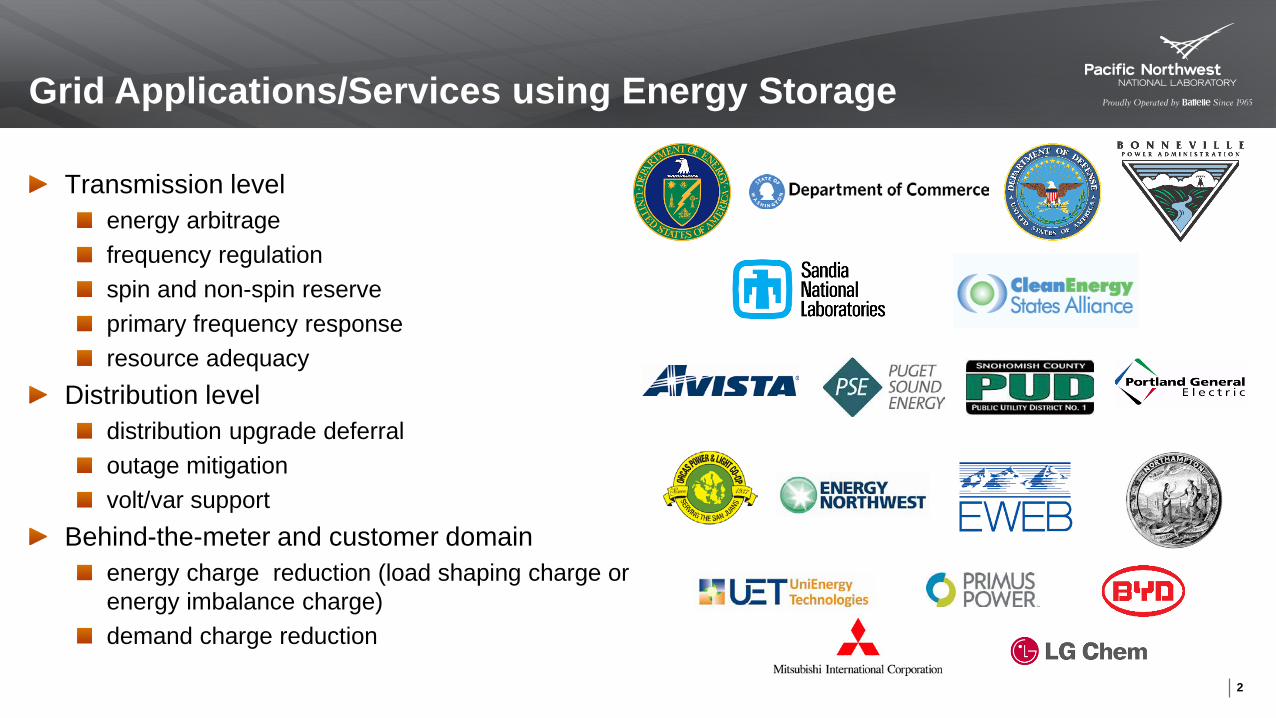
Grid Applications/Services using Energy Storage
Transmission levelenergy arbitragefrequency regulationspin and non-spin reserveprimary frequency responseresource adequacy
Distribution leveldistribution upgrade deferraloutage mitigationvolt/var support
Behind-the-meter and customer domainenergy charge reduction (load shaping charge or energy imbalance charge)demand charge reduction
3
3
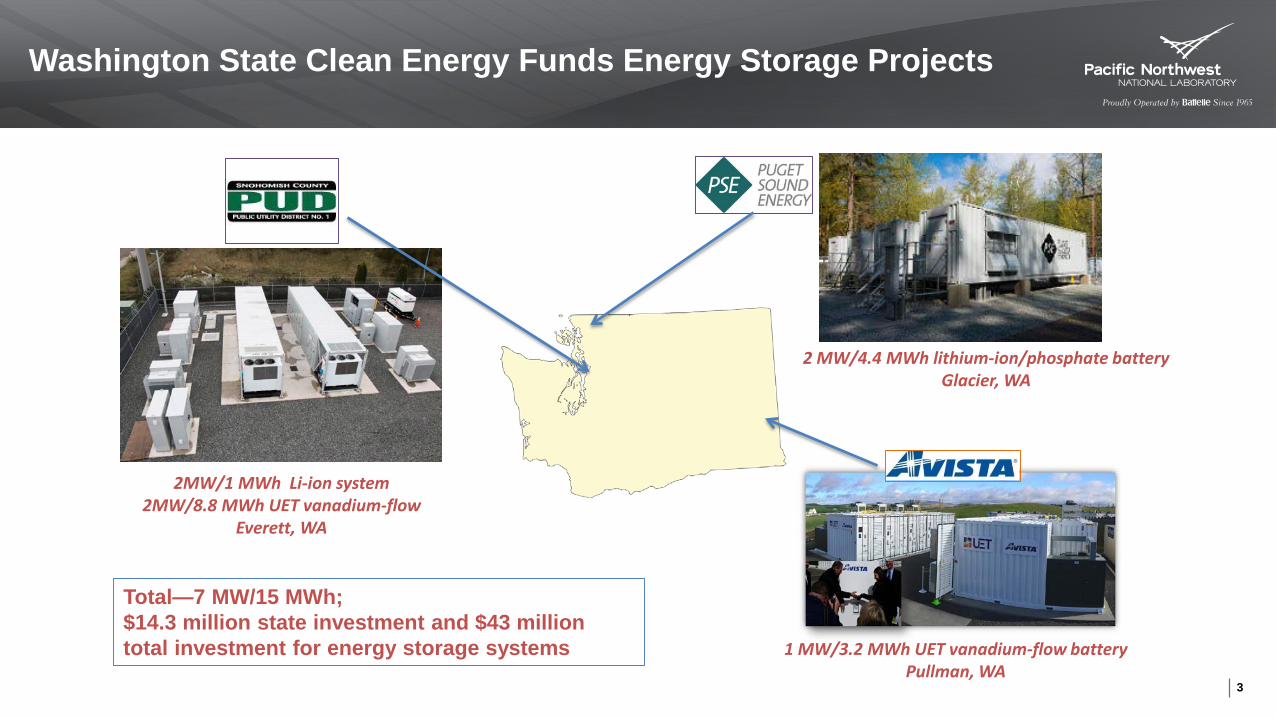
Washington State Clean Energy Funds Energy Storage Projects
2 MW/4.4 MWh lithium-ion/phosphate batteryGlacier, WA
1 MW/3.2 MWh UET vanadium-flow batteryPullman, WA
2MW/1 MWh Li-ion system 2MW/8.8 MWh UET vanadium-flow
Everett, WA
Total—7 MW/15 MWh; $14.3 million state investment and $43 million total investment for energy storage systems

4
4
Battery Storage for Behind-the-meter Applications
Energy charge is based on the amount and time when energy is consumed. Load shaping charge and energy imbalance charge are very similar as energy charge and can be modeled using the same mathematic formulation.
Demand charge is based on the highest power consumption in different time periods.Separate charges for energy and demand more fairly distributed power system’s operation and investment cost to customers.Example of electric utility rate tariff
Summer Winter(Oct.-May)
Energy ($/kWh)
On 0.145 NA
Mid 0.092 0.096
Off 0.067 0.073
Demand ($/kW/month) 30

5
5
Battery Optimal Dispatch
• D. Wu, C. Jin, P. Balducci, and M. Kintner-Meyer, “An energy storage assessment: Using optimal control strategies to capture multiple services,” IEEE Power and Energy General Meeting, Denver, CO, Jul. 2015.
• D. Wu, M. Kintner-Meyer, T. Yang, and P. Balducci, “Economic analysis and optimal sizing for behind-the-meter battery storage,” IEEE Power and Energy General Meeting, Boston, MA, Jul. 2016.
• D. Wu, M. Kintner-Meyer, T. Yang, and P. Balducci, “Analytical sizing methods for behind-the-meter battery storage,” Journal of Energy Storage, Aug. 2017.• D. Wu, P. Balducci, A. Crawford, V. Viswanathan, and M. Kintner-Meyer, “Optimal control for battery storage using nonlinear models” Electrical Energy Storage Applications and
Technologies Conference, San Diego, CA, Oct. 2017.

6
6
Annual Electricity Cost and Saving
Demand charge account for half of total electricity bill. The capability of lowering peak from battery provides a great opportunity to cut electricity bill.Saving in energy charge is marginal comparing with demand charge due to losses.Total saving in electricity bill do not vary significantly with office load patterns.Energy charge reduction is independent of load profiles.Annual saving in electricity bill is quite linear to demand charge rate.
Battery rating: 0.2 MW/0.8 MWhEfficiency: 0.868 (charging) and 0.887 (discharging)
Annual Electricity Cost
Annual saving vs. demand charge rate

7
7
Optimal Sizing
Sensitivity of net value on battery sizes with Chicago office building load profile
Annual benefits vs. levelized cost with optimal size

8
8
Los Alamitos Microgrid with Energy Storage
BackgroundKey questions
What are the potential benefits from different investment candidates?What is the optimal scale in terms of power and energy capacity for the energy storage systems?How can we evaluate tradeoffs between benefits accruing to end-user and utility?
9
9
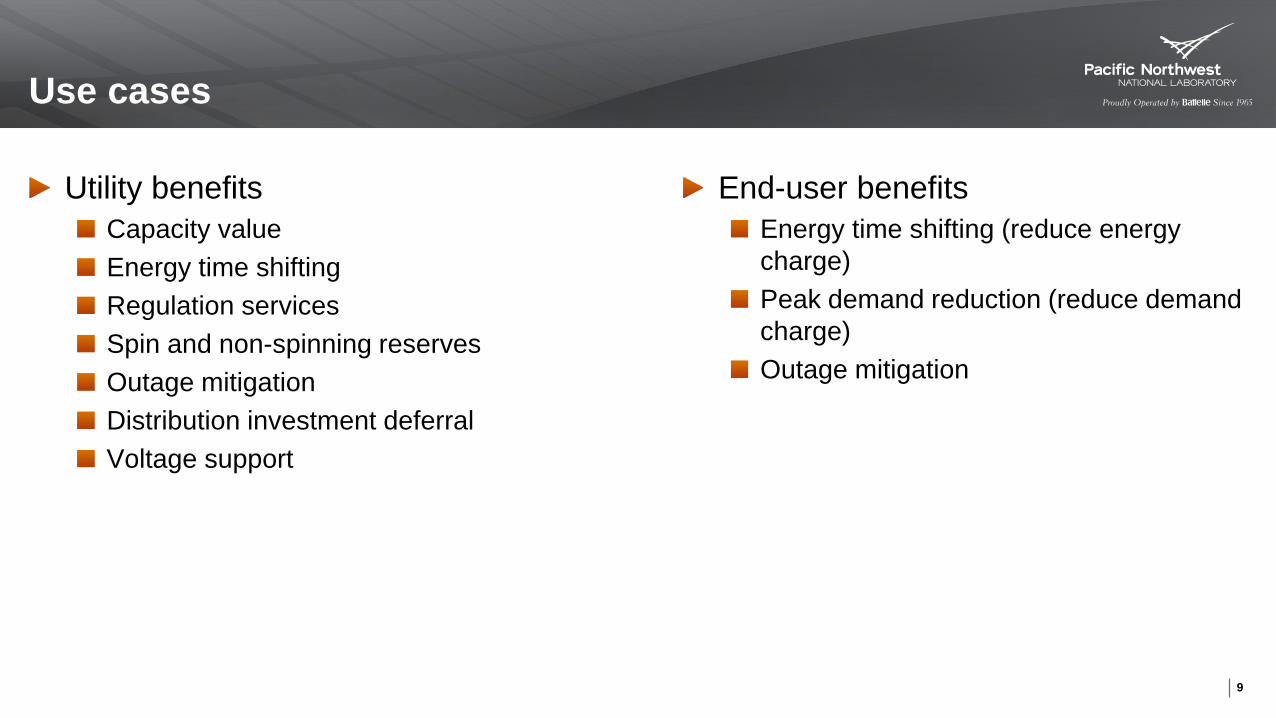
Use cases
Utility benefitsCapacity valueEnergy time shiftingRegulation servicesSpin and non-spinning reservesOutage mitigationDistribution investment deferralVoltage support
End-user benefitsEnergy time shifting (reduce energy charge)Peak demand reduction (reduce demand charge)Outage mitigation

10
10
Results in Scenario a
0
100
200
300
400
500
600
700
800
Energy charge Facilitydemandcharge
on-peakdemandcharge
mid-peakdemandcharge
Total
w/o batt. ($000
w/ batt. ($000)
Annual Present value
Key Point: BSET found optimal energy storage sizing at 204 kW/258 kWh when combined with 625 kW of PV.
175 kW/175 kWh (behind-the-meter, benefits to end-user)
11
11
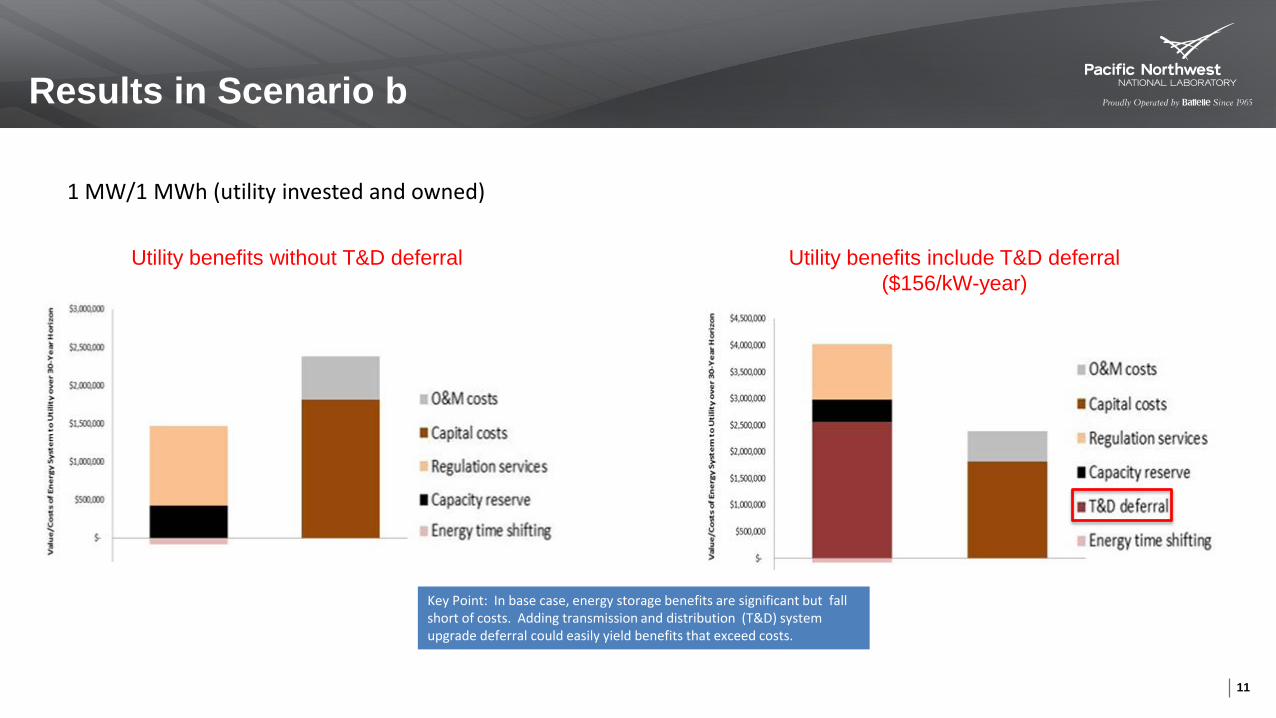
Results in Scenario b
Utility benefits without T&D deferral Utility benefits include T&D deferral ($156/kW-year)
Key Point: In base case, energy storage benefits are significant but fall short of costs. Adding transmission and distribution (T&D) system upgrade deferral could easily yield benefits that exceed costs.
1 MW/1 MWh (utility invested and owned)

12
12
Bundling Services: How To Do It Optimally?
Energy price ($/MWh)
Arbitrage only
Arbitrage + Balancing
Arbitrage + Balancing + T&D deferral
Power output (MW)
Power output (MW)
Power output (MW)

13
13
Pareto Front for Multi-objective Optimization
175kW /175kWh battery 625 kW PV + 175kW /175kWh battery
Annual Present value
There does not exist a single solution that can simultaneously maximize both objectives; there exist Pareto optimal solutions
Not good solutions

14
14
Evaluation and Sizing Tool