Economic Activity Index (“GDB EAI”) - AAFAF the interpretation of the GDB-EAI (2) 3 The GDB-EAI...
14
Economic Activity Index (“GDB-EAI”) September, October, November & December 2017
Transcript of Economic Activity Index (“GDB EAI”) - AAFAF the interpretation of the GDB-EAI (2) 3 The GDB-EAI...
Economic Activity Index (“GDB-EAI”)
September, October, November & December 2017

When it is annualized, the level of the EAI is highly correlated with the level of real GNP (with a Pearson correlation coefficient of 0.9760, for FY1981-FY2016).
Annual growth rates of both variables are also highly correlated (with a Pearson correlation coefficient of 0.9547, for FY1982-FY2016).
Nevertheless, the annual growth rate of the EAI IS NOT the same as the annual growth rate of real GNP. Being highly correlated does not mean being equal.
In order to approximate real GNP growth from EAI annual growth, we estimate a linear regression model relating both variables.
Plugging in EAI annual growth rates into the resulting equation, we obtain estimates for the annual growth rates of real GNP, which approximate real GNP annual growth figures published by the Planning Board.
2
The GDB-EAI is an indicator of general economic activity, not a direct measurement of real GNP. The annual growth rate of the EAI is not the same as the annual growth rate of real GNP.
About the interpretation of the GDB-EAI

About the interpretation of the GDB-EAI (2)
3
The GDB-EAI is an indicator of the general economic activity, not a direct measurement of real GNP. The annual growth rate of the EAI is not the same as the annual growth rate of real GNP.
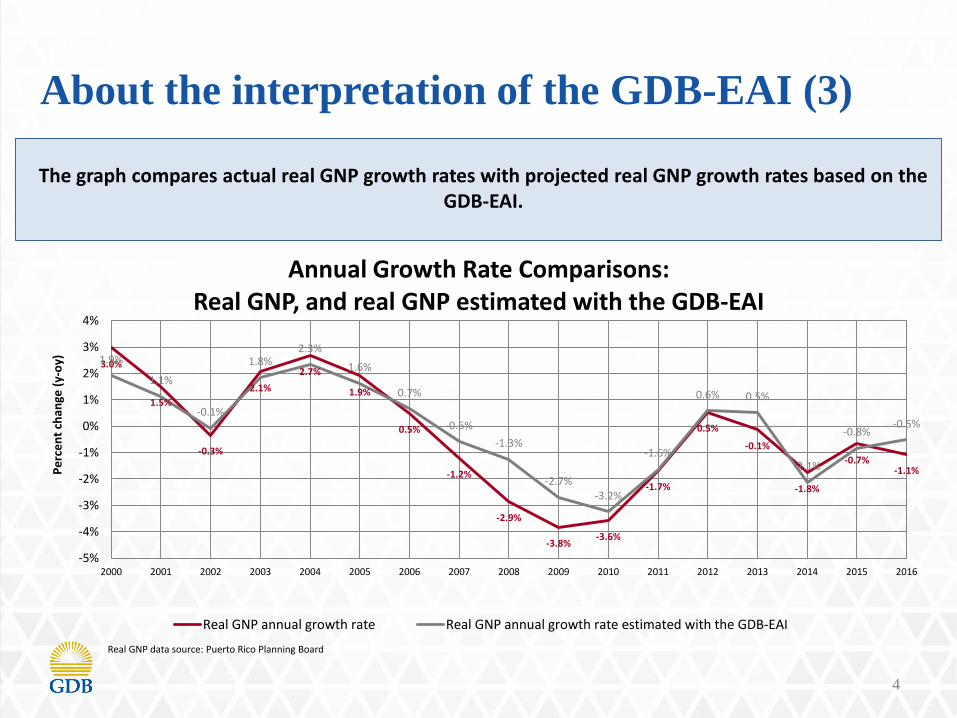
• However, real GNP growth estimates based on the EAI arerelatively close (although not identical) to actual real GNPgrowth figures.
• Real GNP growth for FY2016 was estimated at -0.5% using aregression equation with the growth of the EAI as theindependent variable, while the Planning Board reported adecline of 1.1%. The index’s annual growth is calculated asthe annual percentage change of the twelve-month average.
• On average, the index-based estimates for real GNP growthwere close to the current estimates of the Planning Board.
Fiscal
Year
GDB-EAI
annual
growth
Real GNP
annual
growth
estimated
using the GDB-
EAI
Current
real GNP
annual
growth
2003 1.6% 1.8% 2.1%
2004 2.3% 2.3% 2.7%
2005 1.4% 1.6% 1.9%
2006 0.1% 0.7% 0.5%
2007 -1.5% -0.6% -1.2%
2008 -2.3% -1.3% -2.9%
2009 -4.2% -2.7% -3.8%
2010 -4.9% -3.2% -3.6%
2011 -2.8% -1.6% -1.7%
2012 0.0% 0.6% 0.5%
2013 -0.1% 0.5% -0.1%
2014 -3.4% -2.1% -1.8%
2015 -1.8% -0.8% -0.7%
2016 -1.4% -0.5% -1.1%
4
The graph compares actual real GNP growth rates with projected real GNP growth rates based on the GDB-EAI.
3.0%
1.5%
-0.3%
2.1%
2.7%
1.9%
0.5%
-1.2%
-2.9%
-3.8%-3.6%
-1.7%
0.5%
-0.1%
-1.8%
-0.7%-1.1%
1.9%
1.1%
-0.1%
1.8%2.3%
1.6%
0.7%
-0.6%
-1.3%
-2.7%-3.2%
-1.6%
0.6% 0.5%
-2.1%
-0.8%-0.5%
-5%
-4%
-3%
-2%
-1%
0%
1%
2%
3%
4%
2000 2001 2002 2003 2004 2005 2006 2007 2008 2009 2010 2011 2012 2013 2014 2015 2016
Pe
rce
nt
chan
ge(y
-oy)
Annual Growth Rate Comparisons:Real GNP, and real GNP estimated with the GDB-EAI
Real GNP annual growth rate Real GNP annual growth rate estimated with the GDB-EAI
Real GNP data source: Puerto Rico Planning Board
About the interpretation of the GDB-EAI (3)
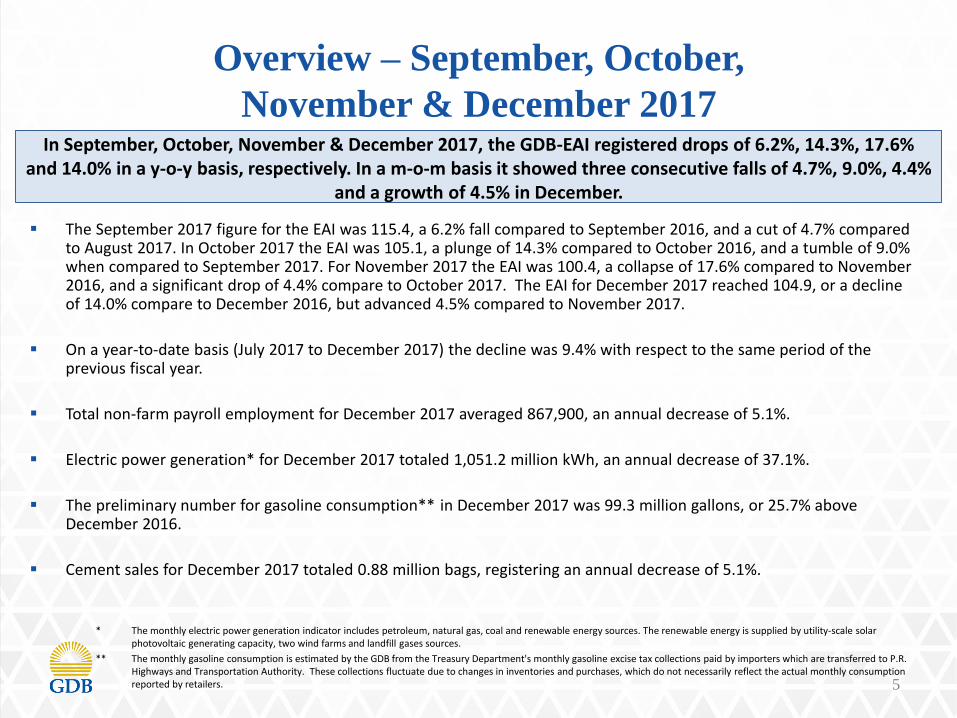
The September 2017 figure for the EAI was 115.4, a 6.2% fall compared to September 2016, and a cut of 4.7% compared to August 2017. In October 2017 the EAI was 105.1, a plunge of 14.3% compared to October 2016, and a tumble of 9.0% when compared to September 2017. For November 2017 the EAI was 100.4, a collapse of 17.6% compared to November 2016, and a significant drop of 4.4% compare to October 2017. The EAI for December 2017 reached 104.9, or a decline of 14.0% compare to December 2016, but advanced 4.5% compared to November 2017.
On a year-to-date basis (July 2017 to December 2017) the decline was 9.4% with respect to the same period of the previous fiscal year.
Total non-farm payroll employment for December 2017 averaged 867,900, an annual decrease of 5.1%.
Electric power generation* for December 2017 totaled 1,051.2 million kWh, an annual decrease of 37.1%.
The preliminary number for gasoline consumption** in December 2017 was 99.3 million gallons, or 25.7% above December 2016.
Cement sales for December 2017 totaled 0.88 million bags, registering an annual decrease of 5.1%.
5
In September, October, November & December 2017, the GDB-EAI registered drops of 6.2%, 14.3%, 17.6% and 14.0% in a y-o-y basis, respectively. In a m-o-m basis it showed three consecutive falls of 4.7%, 9.0%, 4.4%
and a growth of 4.5% in December.
* The monthly electric power generation indicator includes petroleum, natural gas, coal and renewable energy sources. The renewable energy is supplied by utility-scale solar photovoltaic generating capacity, two wind farms and landfill gases sources.
** The monthly gasoline consumption is estimated by the GDB from the Treasury Department's monthly gasoline excise tax collections paid by importers which are transferred to P.R. Highways and Transportation Authority. These collections fluctuate due to changes in inventories and purchases, which do not necessarily reflect the actual monthly consumption reported by retailers.
Overview – September, October,
November & December 2017

6
In December 2017, the GDB-EAI registered a 14.0% y-o-y reduction, and a 4.5% increment on a m-o-m basis.
1.0
%1
.1%
0.9
%1
.0%
1.2
%1
.7%
1.8
%2
.3%
2.3
%1
.9%
1.1
%0
.2%
-0.5
%-1
.1%
-1.5
%-1
.8%
-2.2
%-3
.1%
-3.5
%-3
.6%
-3.6
%-3
.7%
-4.1
%-4
.1%
-3.9
%-3
.6%
-2.9
%-2
.9%
-2.7
%-2
.4%
-2.1
%-2
.2%
-2.8
%-2
.8%
-2.5
% -1.7
%-1
.5%
-1.1
%-1
.3%
-1.2
%-1
.0%
-0.9
%-0
.8%
-1.0
%-0
.8%
-0.9
%-1
.0%
-1.2
%-1
.4%
-1.6
%-2
.0%
-2.0
%-2
.1%
-1.9
%-2
.0%
-1.7
%-1
.8%
-2.0
%-2
.6%
-2.4
%-2
.4%
-1.8
%-1
.8%
-1.4
%-1
.6%
-2.1
%-2
.2%
-1.9
%-6
.2%
-14.
3%-1
7.6%
-14.
0%
0.2
%0
.1%
-0.1
%0
.0%
0.0
%0
.3%
-0.1
%0
.0%
0.2
%0
.1%
0.1
%-0
.6%
-0.5
%-0
.6%
-0.5
%-0
.3%
-0.4
%-0
.6%
-0.5
%-0
.1%
0.2
%0
.0%
-0.3
%-0
.6%
-0.2
%-0
.3%
0.2
%-0
.3%
-0.3
%-0
.2%
-0.2
%-0
.2%
-0.4
%0
.0%
0.0
%0
.2%
-0.1
%0
.1%
0.0
%-0
.1%
-0.1
%-0
.2%
-0.1
%-0
.4%
-0.2
%-0
.2%
0.0
%0
.0%
-0.2
%-0
.1%
-0.4
%-0
.2%
-0.2
%0
.0%
-0.1
%-0
.1%
-0.2
%-0
.4%
-0.6
% 0.2
%-0
.2% 0.6
%-0
.4%
0.2
%-0
.4%
-0.5
%-0
.3%
0.2
%
-9.0
%-4
.4%
4.5
%
-20%
-15%
-10%
-5%
0%
5%
10%
95
100
105
110
115
120
125
130
135
140
Jan
-12
Ap
r-1
2
Jul-
12
Oct
-12
Jan
-13
Ap
r-1
3
Jul-
13
Oct
-13
Jan
-14
Ap
r-1
4
Jul-
14
Oct
-14
Jan
-15
Ap
r-1
5
Jul-
15
Oct
-15
Jan
-16
Ap
r-1
6
Jul-
16
Oct
-16
Jan
-17
Ap
r-1
7
Jul-
17
Oct
-17
Ind
ex(J
anu
ary
19
80
= 1
00
)
GDB Economic Activity Index
Value (LHS) Year-over-year percent change (RHS) Month-over-month percent change (RHS)

7
The complete series of the new EAI, which starts in January 1980, shows the recessions of FY1982 and FY1983, the mild recession of FY1991, and the recession of 2001. It also shows the downward path of the Index since the beginning of the current recession and the collapse experienced after the hurricanes stroked the Island in September 2017.
80
90
100
110
120
130
140
150
160
Jan
-80
Jan
-81
Jan
-82
Jan
-83
Jan
-84
Jan
-85
Jan
-86
Jan
-87
Jan
-88
Jan
-89
Jan
-90
Jan
-91
Jan
-92
Jan
-93
Jan
-94
Jan
-95
Jan
-96
Jan
-97
Jan
-98
Jan
-99
Jan
-00
Jan
-01
Jan
-02
Jan
-03
Jan
-04
Jan
-05
Jan
-06
Jan
-07
Jan
-08
Jan
-09
Jan
-10
Jan
-11
Jan
-12
Jan
-13
Jan
-14
Jan
-15
Jan
-16
Jan
-17
Jan
-18
Ind
ex
(Jan
uar
y1
98
0 =
10
0)
GDB Economic Activity Index
8
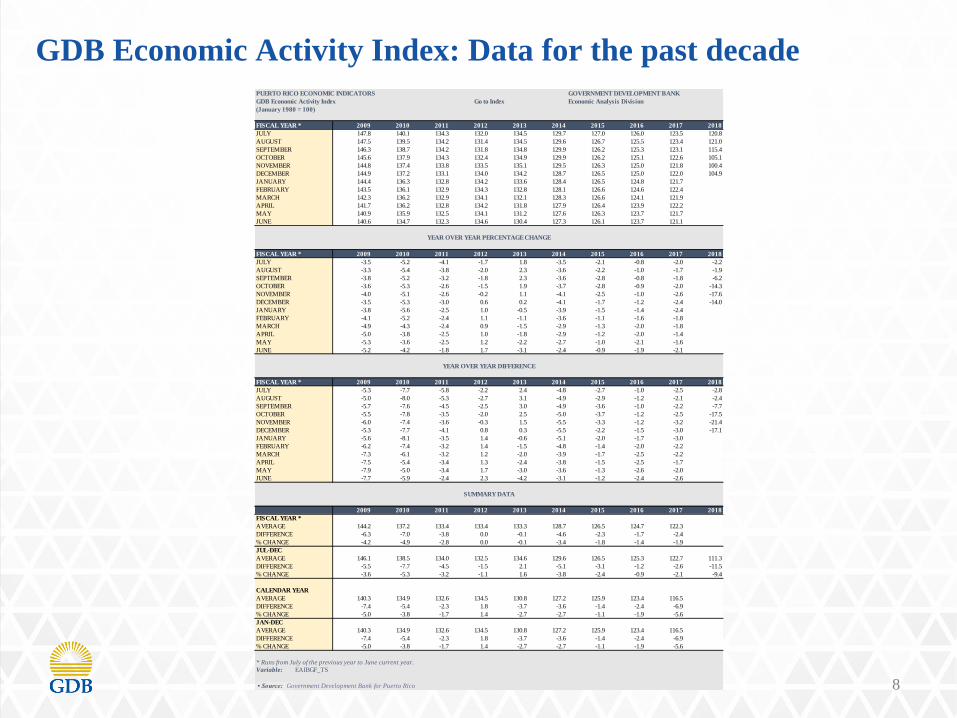
GDB Economic Activity Index: Data for the past decadePUERTO RICO ECONOMIC INDICATORS GOVERNMENT DEVELOPMENT BANK
GDB Economic Activity Index Economic Analysis Division
(January 1980 = 100)
FISCAL YEAR * 2009 2010 2011 2012 2013 2014 2015 2016 2017 2018
JULY 147.8 140.1 134.3 132.0 134.5 129.7 127.0 126.0 123.5 120.8
AUGUST 147.5 139.5 134.2 131.4 134.5 129.6 126.7 125.5 123.4 121.0
SEPTEMBER 146.3 138.7 134.2 131.8 134.8 129.9 126.2 125.3 123.1 115.4
OCTOBER 145.6 137.9 134.3 132.4 134.9 129.9 126.2 125.1 122.6 105.1
NOVEMBER 144.8 137.4 133.8 133.5 135.1 129.5 126.3 125.0 121.8 100.4
DECEMBER 144.9 137.2 133.1 134.0 134.2 128.7 126.5 125.0 122.0 104.9
JANUARY 144.4 136.3 132.8 134.2 133.6 128.4 126.5 124.8 121.7
FEBRUARY 143.5 136.1 132.9 134.3 132.8 128.1 126.6 124.6 122.4
MARCH 142.3 136.2 132.9 134.1 132.1 128.3 126.6 124.1 121.9
APRIL 141.7 136.2 132.8 134.2 131.8 127.9 126.4 123.9 122.2
MAY 140.9 135.9 132.5 134.1 131.2 127.6 126.3 123.7 121.7
JUNE 140.6 134.7 132.3 134.6 130.4 127.3 126.1 123.7 121.1
FISCAL YEAR * 2009 2010 2011 2012 2013 2014 2015 2016 2017 2018
JULY -3.5 -5.2 -4.1 -1.7 1.8 -3.5 -2.1 -0.8 -2.0 -2.2
AUGUST -3.3 -5.4 -3.8 -2.0 2.3 -3.6 -2.2 -1.0 -1.7 -1.9
SEPTEMBER -3.8 -5.2 -3.2 -1.8 2.3 -3.6 -2.8 -0.8 -1.8 -6.2
OCTOBER -3.6 -5.3 -2.6 -1.5 1.9 -3.7 -2.8 -0.9 -2.0 -14.3
NOVEMBER -4.0 -5.1 -2.6 -0.2 1.1 -4.1 -2.5 -1.0 -2.6 -17.6
DECEMBER -3.5 -5.3 -3.0 0.6 0.2 -4.1 -1.7 -1.2 -2.4 -14.0
JANUARY -3.8 -5.6 -2.5 1.0 -0.5 -3.9 -1.5 -1.4 -2.4
FEBRUARY -4.1 -5.2 -2.4 1.1 -1.1 -3.6 -1.1 -1.6 -1.8
MARCH -4.9 -4.3 -2.4 0.9 -1.5 -2.9 -1.3 -2.0 -1.8
APRIL -5.0 -3.8 -2.5 1.0 -1.8 -2.9 -1.2 -2.0 -1.4
MAY -5.3 -3.6 -2.5 1.2 -2.2 -2.7 -1.0 -2.1 -1.6
JUNE -5.2 -4.2 -1.8 1.7 -3.1 -2.4 -0.9 -1.9 -2.1
FISCAL YEAR * 2009 2010 2011 2012 2013 2014 2015 2016 2017 2018
JULY -5.3 -7.7 -5.8 -2.2 2.4 -4.8 -2.7 -1.0 -2.5 -2.8
AUGUST -5.0 -8.0 -5.3 -2.7 3.1 -4.9 -2.9 -1.2 -2.1 -2.4
SEPTEMBER -5.7 -7.6 -4.5 -2.5 3.0 -4.9 -3.6 -1.0 -2.2 -7.7
OCTOBER -5.5 -7.8 -3.5 -2.0 2.5 -5.0 -3.7 -1.2 -2.5 -17.5
NOVEMBER -6.0 -7.4 -3.6 -0.3 1.5 -5.5 -3.3 -1.2 -3.2 -21.4
DECEMBER -5.3 -7.7 -4.1 0.8 0.3 -5.5 -2.2 -1.5 -3.0 -17.1
JANUARY -5.6 -8.1 -3.5 1.4 -0.6 -5.1 -2.0 -1.7 -3.0
FEBRUARY -6.2 -7.4 -3.2 1.4 -1.5 -4.8 -1.4 -2.0 -2.2
MARCH -7.3 -6.1 -3.2 1.2 -2.0 -3.9 -1.7 -2.5 -2.2
APRIL -7.5 -5.4 -3.4 1.3 -2.4 -3.8 -1.5 -2.5 -1.7
MAY -7.9 -5.0 -3.4 1.7 -3.0 -3.6 -1.3 -2.6 -2.0
JUNE -7.7 -5.9 -2.4 2.3 -4.2 -3.1 -1.2 -2.4 -2.6
2009 2010 2011 2012 2013 2014 2015 2016 2017 2018
FISCAL YEAR *
AVERAGE 144.2 137.2 133.4 133.4 133.3 128.7 126.5 124.7 122.3
DIFFERENCE -6.3 -7.0 -3.8 0.0 -0.1 -4.6 -2.3 -1.7 -2.4
% CHANGE -4.2 -4.9 -2.8 0.0 -0.1 -3.4 -1.8 -1.4 -1.9
JUL-DEC
AVERAGE 146.1 138.5 134.0 132.5 134.6 129.6 126.5 125.3 122.7 111.3
DIFFERENCE -5.5 -7.7 -4.5 -1.5 2.1 -5.1 -3.1 -1.2 -2.6 -11.5
% CHANGE -3.6 -5.3 -3.2 -1.1 1.6 -3.8 -2.4 -0.9 -2.1 -9.4
CALENDAR YEAR
AVERAGE 140.3 134.9 132.6 134.5 130.8 127.2 125.9 123.4 116.5
DIFFERENCE -7.4 -5.4 -2.3 1.8 -3.7 -3.6 -1.4 -2.4 -6.9
% CHANGE -5.0 -3.8 -1.7 1.4 -2.7 -2.7 -1.1 -1.9 -5.6
JAN-DEC
AVERAGE 140.3 134.9 132.6 134.5 130.8 127.2 125.9 123.4 116.5
DIFFERENCE -7.4 -5.4 -2.3 1.8 -3.7 -3.6 -1.4 -2.4 -6.9
% CHANGE -5.0 -3.8 -1.7 1.4 -2.7 -2.7 -1.1 -1.9 -5.6
* Runs from July of the previous year to June current year.
Variable: EAIBGF_TS
• Source: Government Development Bank for Puerto Rico
Go to Index
YEAR OVER YEAR PERCENTAGE CHANGE
YEAR OVER YEAR DIFFERENCE
SUMMARY DATA

9
Total non-farm payroll employment for December 2017 averaged 867,900, an annual decrease of 5.1%.
Sources: BLS and PREPA
* Not seasonally adjusted.
GDB Economic Activity Index Components
Total Non-Farm Payroll Employment*(Thousands of jobs)
780800820840860880900920940960980
Jan-1
3
Jul-
13
Jan-1
4
Jul-
14
Jan-1
5
Jul-
15
Jan-1
6
Jul-
16
Jan-1
7
Jul-
17
Electric power generation for December 2017 averaged 1,051.2 million kWh, an annual reduction of 37.1%.
Electric Power Generation*(Millions of kWh)
0
500
1,000
1,500
2,000
2,500
Jan-1
3
Jul-
13
Jan-1
4
Jul-
14
Jan-1
5
Jul-
15
Jan-1
6
Jul-
16
Jan-1
7
Jul-
17
* The monthly electric power generation indicator includes petroleum, natural gas, coal and renewable energy sources. The renewable energy is supplied by utility-scale solar photovoltaic generating capacity, two wind farms and landfill gases sources.
10
Sources: PRHTA and GDB
* Not seasonally adjusted.
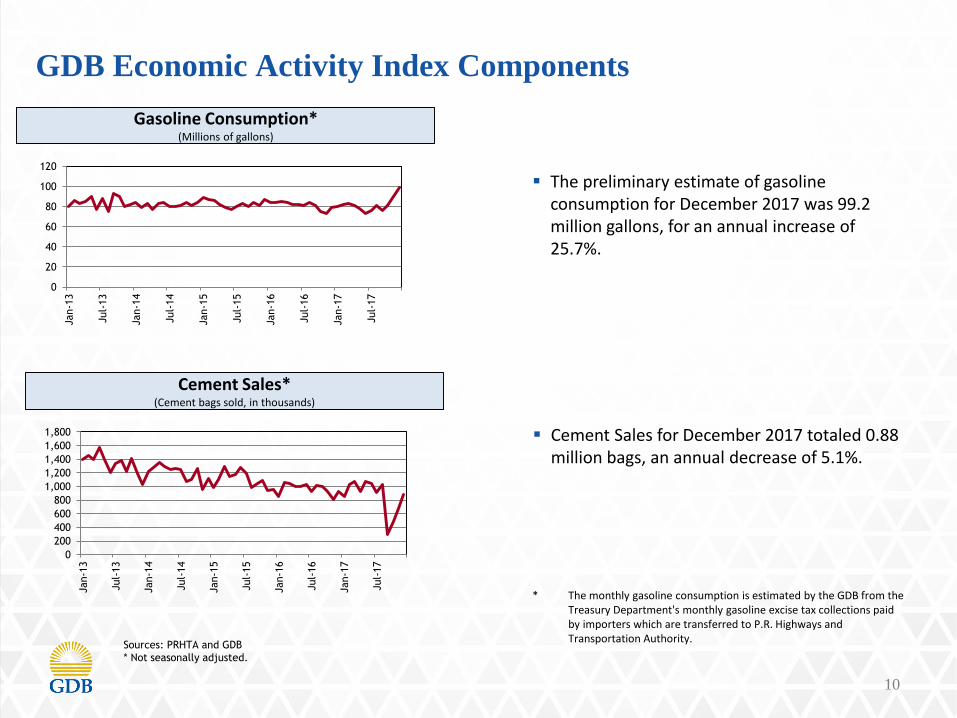
Cement Sales for December 2017 totaled 0.88 million bags, an annual decrease of 5.1%.
GDB Economic Activity Index Components
Cement Sales*(Cement bags sold, in thousands)
0
200
400
600
800
1,000
1,200
1,400
1,600
1,800
Jan-1
3
Jul-
13
Jan-1
4
Jul-
14
Jan-1
5
Jul-
15
Jan-1
6
Jul-
16
Jan-1
7
Jul-
17
The preliminary estimate of gasoline consumption for December 2017 was 99.2 million gallons, for an annual increase of 25.7%.
Gasoline Consumption*(Millions of gallons)
0
20
40
60
80
100
120
Jan-1
3
Jul-
13
Jan-1
4
Jul-
14
Jan-1
5
Jul-
15
Jan-1
6
Jul-
16
Jan-1
7
Jul-
17
* The monthly gasoline consumption is estimated by the GDB from the Treasury Department's monthly gasoline excise tax collections paid by importers which are transferred to P.R. Highways and Transportation Authority.

11
Description of the
GDB-Economic Activity Index

12
Advantages of the GDB-EAI:
Readily available
Highly correlated to Puerto Rico’s real GNP
Reliable tool to monitor actual trend of Puerto Rico’s economy
The GDB-EAI is made up of 4 indicators:
Total Payroll Employment (Establishment Survey/ Thousands of employees)
Total Electric Power Generation (Millions of kWh)
Cement Sales (Millions of bags)
Gas Consumption (Millions of gallons)
GDB-EAI Highlights and Composition
GDB Economic Activity Index Highlights
13
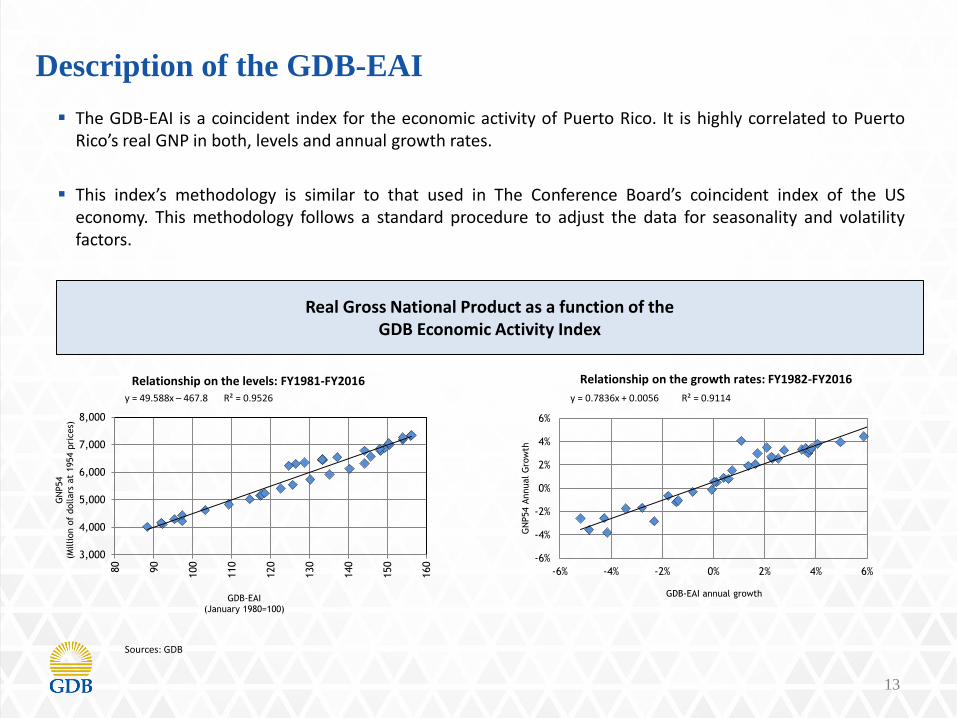
The GDB-EAI is a coincident index for the economic activity of Puerto Rico. It is highly correlated to PuertoRico’s real GNP in both, levels and annual growth rates.
This index’s methodology is similar to that used in The Conference Board’s coincident index of the USeconomy. This methodology follows a standard procedure to adjust the data for seasonality and volatilityfactors.
Description of the GDB-EAI
Relationship on the levels: FY1981-FY2016y = 49.588x – 467.8 R² = 0.9526
Real Gross National Product as a function of the GDB Economic Activity Index
Relationship on the growth rates: FY1982-FY2016
y = 0.7836x + 0.0056 R² = 0.9114
Sources: GDB
3,000
4,000
5,000
6,000
7,000
8,000
80
90
100
110
120
130
140
150
160
GN
P54
(Million o
f dollars
at
1954 p
rices)
GDB-EAI(January 1980=100)
-6%
-4%
-2%
0%
2%
4%
6%
-6% -4% -2% 0% 2% 4% 6%
GN
P54 A
nnual
Gro
wth
GDB-EAI annual growth
14
The GDB-EAI and its indicators are subject to revisions. Whilethe information comprising the GDB EAI has been obtainedfrom sources GDB believes to be reliable, GDB is notresponsible for any errors or omissions, or for the resultsobtained from the use of this information.
Disclaimer