Economic Activity Index (“GDB EAI”) - gdbpr.com • The complete series of the new EAI, which...
14
Economic Activity Index (“GDB-EAI”) May 2014
Transcript of Economic Activity Index (“GDB EAI”) - gdbpr.com • The complete series of the new EAI, which...

Economic Activity Index (“GDB-EAI”)
May 2014
General Commentary – May 2014
Total non-farm payroll employment for May 2014 averaged 932,100, an annual increase of 0.4%,
while FY2014 YTD total non-farm payroll employment showed a 1.3% decrease with respect to the
corresponding figure for FY2013. During this month, total private employment increased by 1.8% y-o-
y (12,000 jobs), while total public employment decreased by 3.4% y-o-y (8,400 jobs).
Electric power generation for May 2014 totaled 1,784.4 million kWh, an annual reduction of 3.3%.
Electricity generation for FY2014 YTD was 3.1% less than during the same period of FY2013.
The preliminary number for gasoline consumption* in May 2014 was 90.0 million gallons, 0.5% below
May 2013. The FY2014 YTD gasoline consumption number was 2.1% below the corresponding figure
for FY2013.
Cement sales for May 2014 totaled 1.25 million bags, registering an annual reduction of 10.8%. Sales
for FY2014 YTD were 14.2% below the figure for the same period of FY2013.
2
The GDB-EAI registered a 1.1% year-over-year reduction in May, after showing a 1.3% y-o-
y decrease in April 2014, holding up with a stabilization scenario.
* The monthly gasoline consumption is estimated by the GDB from the Treasury Department's monthly gasoline excise tax collections paid by importers
which are transferred to P.R. Highways and Transportation Authority. These collections fluctuate due to changes in inventories and purchases, which
do not necessarily reflect the actual monthly consumption reported by retailers.
3
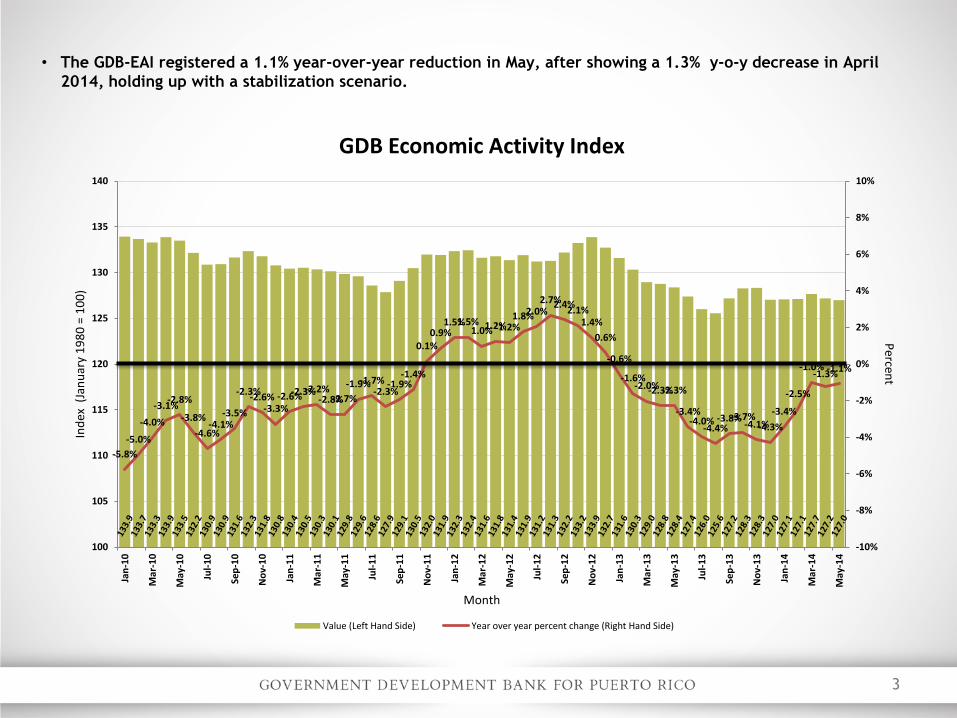
• The GDB-EAI registered a 1.1% year-over-year reduction in May, after showing a 1.3% y-o-y decrease in April
2014, holding up with a stabilization scenario.
-5.8%
-5.0%
-4.0%
-3.1% -2.8%
-3.8%
-4.6% -4.1%
-3.5%
-2.3% -2.6%
-3.3% -2.6% -2.3% -2.2%
-2.8% -2.7%
-1.9% -1.7% -2.3%
-1.9% -1.4%
0.1% 0.9%
1.5% 1.5% 1.0% 1.2% 1.2%
1.8% 2.0% 2.7% 2.4%
2.1% 1.4%
0.6%
-0.6%
-1.6% -2.0% -2.3% -2.3%
-3.4% -4.0%
-4.4% -3.8% -3.7%
-4.1% -4.3%
-3.4%
-2.5%
-1.0% -1.3%
-1.1%
-10%
-8%
-6%
-4%
-2%
0%
2%
4%
6%
8%
10%
100
105
110
115
120
125
130
135
140
Jan
-10
Mar
-10
May
-10
Jul-
10
Sep
-10
No
v-1
0
Jan
-11
Mar
-11
May
-11
Jul-
11
Sep
-11
No
v-1
1
Jan
-12
Mar
-12
May
-12
Jul-
12
Sep
-12
No
v-1
2
Jan
-13
Mar
-13
May
-13
Jul-
13
Sep
-13
No
v-1
3
Jan
-14
Mar
-14
May
-14
Percen
t In
dex
(Ja
nu
ary
19
80
= 1
00
)
Month
GDB Economic Activity Index
Value (Left Hand Side) Year over year percent change (Right Hand Side)

4
• The complete series of the new EAI, which starts in January 1980, shows the recessions of FY1982 and FY1983,
and the mild recession of FY1991, the recession of 2001. It also shows the path of the Index since the beginning
of the recession and its recent signs of stabilization.
80
90
100
110
120
130
140
150
160Ja
n-8
0
Jan
-81
Jan
-82
Jan
-83
Jan
-84
Jan
-85
Jan
-86
Jan
-87
Jan
-88
Jan
-89
Jan
-90
Jan
-91
Jan
-92
Jan
-93
Jan
-94
Jan
-95
Jan
-96
Jan
-97
Jan
-98
Jan
-99
Jan
-00
Jan
-01
Jan
-02
Jan
-03
Jan
-04
Jan
-05
Jan
-06
Jan
-07
Jan
-08
Jan
-09
Jan
-10
Jan
-11
Jan
-12
Jan
-13
Jan
-14
Ind
ex
(Jan
. 19
80
= 1
00
)
Month
GDB Economic Activity Index
5
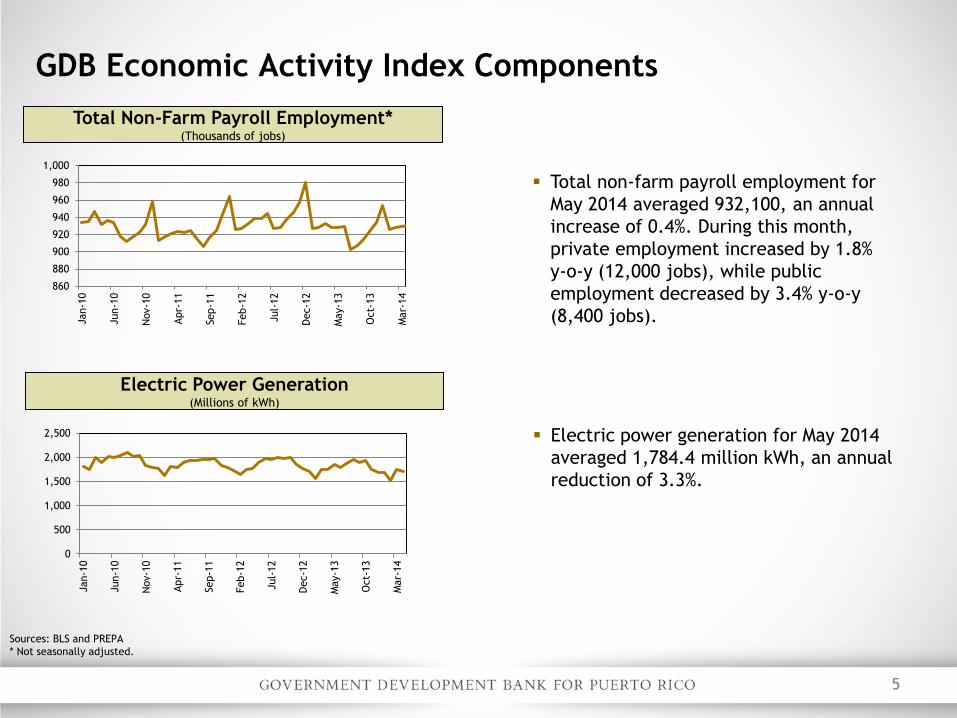
Total non-farm payroll employment for
May 2014 averaged 932,100, an annual
increase of 0.4%. During this month,
private employment increased by 1.8%
y-o-y (12,000 jobs), while public
employment decreased by 3.4% y-o-y
(8,400 jobs).
Sources: BLS and PREPA
* Not seasonally adjusted.
GDB Economic Activity Index Components
Total Non-Farm Payroll Employment* (Thousands of jobs)
860
880
900
920
940
960
980
1,000
Jan-1
0
Jun-1
0
Nov-1
0
Apr-
11
Sep-1
1
Feb-1
2
Jul-
12
Dec-1
2
May-1
3
Oct-
13
Mar-
14
Electric power generation for May 2014
averaged 1,784.4 million kWh, an annual
reduction of 3.3%.
Electric Power Generation (Millions of kWh)
0
500
1,000
1,500
2,000
2,500
Jan-1
0
Jun-1
0
Nov-1
0
Apr-
11
Sep-1
1
Feb-1
2
Jul-
12
Dec-1
2
May-1
3
Oct-
13
Mar-
14

6
Sources: PRHTA and GDB
* Not seasonally adjusted.
Cement Sales for May 2014 totaled 1.25
million bags, an annual decrease of 10.8%.
GDB Economic Activity Index Components
Cement Sales (Cement bags sold, in thousands)
1,000
1,200
1,400
1,600
1,800
2,000
Jan-1
0
Jun-1
0
Nov-1
0
Apr-
11
Sep-1
1
Feb-1
2
Jul-
12
Dec-1
2
May-1
3
Oct-
13
Mar-
14
The preliminary estimate of gasoline
consumption* for May 2014 was 90.0
million gallons, for an annual decrease of
0.5%.
Gasoline Consumption (Millions of gallons)
0
20
40
60
80
100
120
Jan-1
0
Jun-1
0
Nov-1
0
Apr-
11
Sep-1
1
Feb-1
2
Jul-
12
Dec-1
2
May-1
3
Oct-
13
Mar-
14
*The monthly gasoline consumption is estimated by the GDB from the Treasury Department's
monthly gasoline excise tax collections paid by importers which are transferred to P.R. Highways
and Transportation Authority.
7
Description of the
GDB-Economic Activity Index
8
Advantages of the GDB-EAI:
Readily available
Highly correlated to Puerto Rico’s real GNP
Reliable tool to monitor actual trend of Puerto Rico economy
The GDB-EAI is made up of 4 indicators:
Total Payroll Employment (Establishment Survey/ Thousand of employees)
Total Electric Power Generation (Millions of kWh)
Cement Sales (Millions of bags)
Gas Consumption (Millions of gallons)
GDB-EAI Highlights and Composition
GDB Economic Activity Index Highlights
9
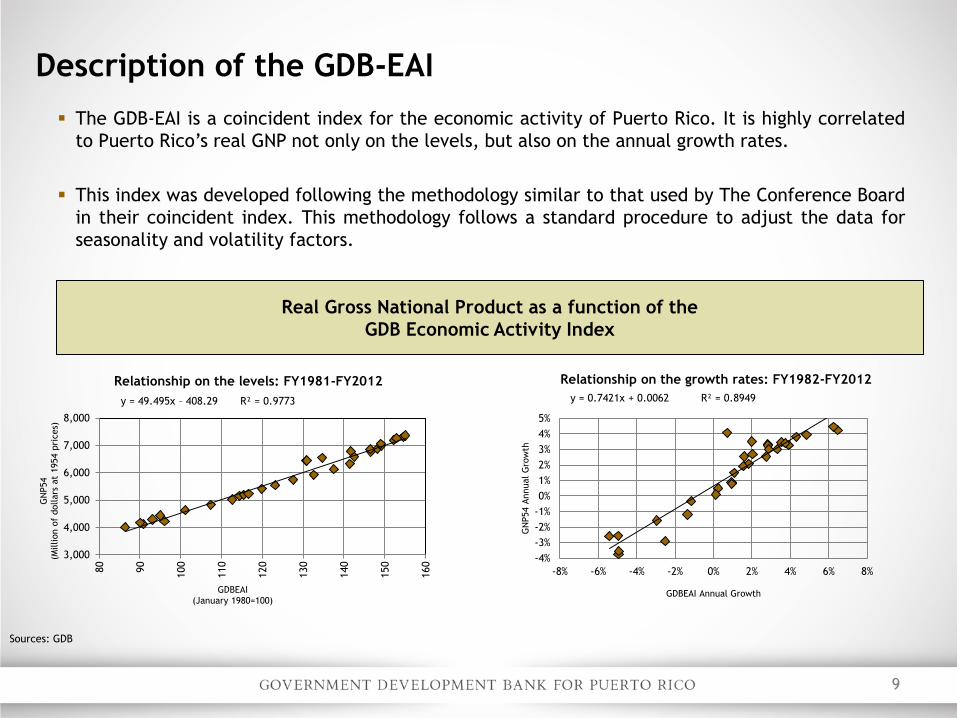
The GDB-EAI is a coincident index for the economic activity of Puerto Rico. It is highly correlated
to Puerto Rico’s real GNP not only on the levels, but also on the annual growth rates.
This index was developed following the methodology similar to that used by The Conference Board
in their coincident index. This methodology follows a standard procedure to adjust the data for
seasonality and volatility factors.
Description of the GDB-EAI
Relationship on the levels: FY1981-FY2012
3,000
4,000
5,000
6,000
7,000
8,000
80
90
100
110
120
130
140
150
160
GN
P54
(Million o
f dollars
at
1954 p
rices)
GDBEAI (January 1980=100)
y = 49.495x – 408.29 R² = 0.9773
Real Gross National Product as a function of the
GDB Economic Activity Index
-4%
-3%
-2%
-1%
0%
1%
2%
3%
4%
5%
-8% -6% -4% -2% 0% 2% 4% 6% 8%
GN
P54 A
nnual
Gro
wth
GDBEAI Annual Growth
Relationship on the growth rates: FY1982-FY2012
y = 0.7421x + 0.0062 R² = 0.8949
Sources: GDB

Appendix
10

Clarification about the interpretation of
the GDB-EAI figures
When it is annualized, the level of the EAI is highly correlated with the level of the
real GNP (with a Pearson correlation coefficient of 0.9886, for FY1981-FY2012).
The annual growth rates of both variables are also highly correlated (with a Pearson
correlation coefficient of 0.9508, for FY1982-FY2012).
Nevertheless, the annual growth rate of the EAI IS NOT the same as the annual growth
rate of the real GNP. Being highly correlated does not mean being equal.
In order to approximate real GNP growth from the EAI annual growth, we estimate a
linear regression model relating both variables.
Plugging in the EAI annual growth rates into the resulting equation we obtain estimates
for the annual growth rates of the real GNP.
This transformation generates an approximation of the actual real GNP growth figures.
11
The GDB-EAI is an indicator of the general economic activity, not a direct measurement of
the real GNP. Moreover, the GDB-EAI annual growth rates are not the same as the real GNP
growth rates, because the former are more volatile than the latter.

Clarification about the interpretation of
the GDB-EAI figures (2)
12
Here is a comparison of the annual growth rates of the GDB-EAI with the actual real GNP
figures. There are also estimates of the annual growth of the real GNP using the figures
coming from the GDB-EAI.
• Notice that the real GNP growth
estimates coming from the EAI are
relatively close to the actual real GNP
growth figures.
Fiscal
Year
EAI
Annual
growth
Real GNP annual
growth estimated
using the EAI
Actual Real GNP
annual Growth
2000 2.9% 2.7% 3.0%
2001 1.1% 1.4% 1.5%
2002 -1.2% -0.2% 0.3%
2003 1.8% 1.9% 2.1%
2004 2.0% 2.1% 2.7%
2005 1.6% 1.7% 1.9%
2006 0.3% 0.8% 0.5%
2007 -1.3% -0.4% -1.2%
2008 -2.5% -1.2% -2.9%
2009 -4.9% -2.9% -3.8%
2010 -4.9% -2.9% -3.6%
2011 -2.9% -1.5% -1.6%
2012 0.1% 0.7% 0.1%
Clarification about the interpretation of
the GDB-EAI figures (3)
13
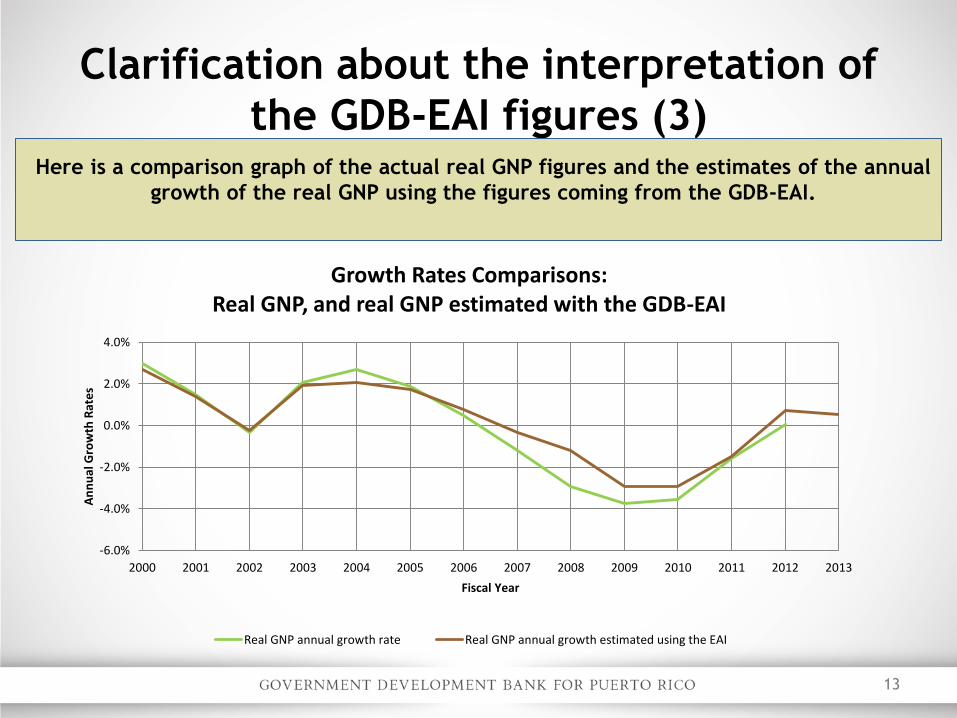
Here is a comparison graph of the actual real GNP figures and the estimates of the annual
growth of the real GNP using the figures coming from the GDB-EAI.
-6.0%
-4.0%
-2.0%
0.0%
2.0%
4.0%
2000 2001 2002 2003 2004 2005 2006 2007 2008 2009 2010 2011 2012 2013
An
nu
al G
row
th R
ate
s
Fiscal Year
Growth Rates Comparisons: Real GNP, and real GNP estimated with the GDB-EAI
Real GNP annual growth rate Real GNP annual growth estimated using the EAI
14
The GDB-EAI and its indicators are subject to
revisions. While the information comprising the GDB EAI
has been obtained from sources GDB believes to be
reliable, GDB is not responsible for any errors or
omissions, or for the results obtained from the use of this
information.
Disclaimer