universiti putra malaysia sharifah sofiah bt syed zainudin fbmk 2013 ...

109109109109
CCCCoooorrrrrrrreeeessssppppoooonnnnddddiiiinnnngggg AAAAuuuutttthhhhoooorrrr:::: DDDDrrrr.... David UmoruDavid UmoruDavid UmoruDavid Umoru
CARD International Journal ofCARD International Journal ofCARD International Journal ofCARD International Journal of Management Studies, BusinessManagement Studies, BusinessManagement Studies, BusinessManagement Studies, Business &&&& Entrepreneurship ResearchEntrepreneurship ResearchEntrepreneurship ResearchEntrepreneurship Research ISSNISSNISSNISSN: : : : (Print):(Print):(Print):(Print): 2545254525452545----5907590759075907 (Online)(Online)(Online)(Online): 2545: 2545: 2545: 2545----5885588558855885 Volume 2Volume 2Volume 2Volume 2, Number , Number , Number , Number 2, June 2, June 2, June 2, June 2017201720172017
http://www.casirmediapublishing.comhttp://www.casirmediapublishing.comhttp://www.casirmediapublishing.comhttp://www.casirmediapublishing.com
Econometrics test of Arbitrage Pricing and its Volatility Econometrics test of Arbitrage Pricing and its Volatility Econometrics test of Arbitrage Pricing and its Volatility Econometrics test of Arbitrage Pricing and its Volatility in the Nigerian Equities Market in the Nigerian Equities Market in the Nigerian Equities Market in the Nigerian Equities Market David David David David Umoru Umoru Umoru Umoru AERCAERCAERCAERC, , , , FMNESFMNESFMNESFMNES &&&& Samuel IwerieborSamuel IwerieborSamuel IwerieborSamuel Iweriebor,,,, (MSc)(MSc)(MSc)(MSc) Department of Economics, Faculty of Arts, Mgt. & Social Sciences, Edo University, Iyamho
Department of Economics College of Education, Agbor Delta State
EEEE----mail:mail:mail:mail: [email protected] AAAABSTRACT BSTRACT BSTRACT BSTRACT The study is an empirical test of validity of arbitrage pricing theory (APT) in Nigerian Stock Exchange Market (NSEM) and its volatility for the sample period of 2010 to 2014 using quarterly data on forty-two stocks listed in NSE. Using the EGARCH model, GLS and the fixed effect panel data estimator with cross section specific coefficients, the study validates the APT for NSEM. The policy implication is such that the study upholds the APT theory for NSEM. Results show money supply had significant positive outcome on stock return; Treasury bill with inflation rates had significant negative outcome on return of NSEM. Above all, a significant EGARCH effect was found with indication of harmful market volatility on stock return. This indeed validates that Nigerian stock exchange is vulnerable to instability in the market. The study so recommends the need for stock investors to be cognizant of trend of both domestic macroeconomic fundamentals. KeywordsKeywordsKeywordsKeywords:::: APT, Volatility, Nigerian Stock Exchange Market (NSEM) JEL Classification: A38, D26, F45
INTRODUCTIONINTRODUCTIONINTRODUCTIONINTRODUCTION Stock markets occupy a pivotal part of a country’s financial system (Van-Treek, 2009). The foremost models in financial economics that explains association between risk and asset returns are the capital asset pricing model (CAPM) and the arbitrage pricing theory (APT). This study is on the APT. The APT predicts an association linking returns of a portfolio and risky asset returns by means of combination of explanatory macroeconomic variables.

110110110110
Econometrics test of Arbitrage Pricing and its Volatility in the Nigerian Equities Market Econometrics test of Arbitrage Pricing and its Volatility in the Nigerian Equities Market Econometrics test of Arbitrage Pricing and its Volatility in the Nigerian Equities Market Econometrics test of Arbitrage Pricing and its Volatility in the Nigerian Equities Market
As the test for APT relies on variable analysis, the concern for number and variable type in explanation of stock performance is yet to be established for the NSEM. Hence, this study attempts to test validity of APT for NSE using forty-two individual firms enlisted in the NSE. We so hypothesized that findings of Chen, Roll and Ross (1986) for US are invalid to Nigerian Stock Exchange. Chen et al. (1986) argued that amongst the economic variables affecting stock market are aggregate production, inflation, short-term interest rates, the maturity risk premium and default risk premium. The next section is the literature on APT. This if flowed by framework and model. Results are in section four and after that, conclusion. The Economics of Arbitrage Pricing and Trends in Nigerian Equities The Economics of Arbitrage Pricing and Trends in Nigerian Equities The Economics of Arbitrage Pricing and Trends in Nigerian Equities The Economics of Arbitrage Pricing and Trends in Nigerian Equities Market Market Market Market (NEM)(NEM)(NEM)(NEM) Arbitrage refers to the trade in two assets with one of assets being mispriced. It is the practice of taking positive expected returns from overvalued or undervalued securities in the inefficient market with no incremental risk and zero additional investments. The arbitrageur sells the asset which is relatively exceptionally costly and using proceeds to purchase the one which is comparatively low-priced. In line with the APT, an asset is mispriced if its current price deviates from the price forecasted by the model. In effect, current asset price equals sum of every future cash flows discounted at the APT rate. Arbitrageur generates portfolio by spotting number of accurately priced assets, one asset per macroeconomic variable plus one and then weighting the assets such that portfolio beta per macroeconomic variable is equal to mispriced asset. Recently, the NEM has witnessed scenario when practically investors sell or hurry to sell stocks to exit the market at all cost. The reality as at today is that investors’ trading incentive is declining fast and hence

111111111111
CARD International Journal ofCARD International Journal ofCARD International Journal ofCARD International Journal of Management Studies, BusinessManagement Studies, BusinessManagement Studies, BusinessManagement Studies, Business &&&& Entrepreneurship ResearchEntrepreneurship ResearchEntrepreneurship ResearchEntrepreneurship Research Volume 2Volume 2Volume 2Volume 2, Number , Number , Number , Number 2, June 20172, June 20172, June 20172, June 2017
demand to exit the market and seek safe haven in investments such real estate (Abdullahi, 2011). The worst current market trend is the urgency by foreign portfolio managers to exit the NEM in sense of shock absorber to their collapsed situation in Nigeria’s economic recessions. Regarding domestic investors, the mass transfer of funds from stocks to safer investments and increased news on investors’ not having interest and day after day losses in stock replaced the records of the early 2008, when every individual dispense money into penny stocks that had no basic strengths (Maku and Attanda, 2009). Regulator's intervention in the direction of stabilizing the market has in recent times induced controversial wiles amongst operators in the market. While some operators envisaged it as a vehicle for thwarting timely market recovery, authority of Stock Exchange holds that it an indispensable measure to protect stock market investors. EMPIRICAL EMPIRICAL EMPIRICAL EMPIRICAL REVIEW REVIEW REVIEW REVIEW Empirical studies of APT theory abound for different countries. Wongbangpo and Sharma (2002) found inflation induces long run negative link with stock prices in Indonesia and Philippine while money growth in Malaysia, Singapore and Thailand led to positive outcome on their stock market indices. Chakravarty (2005) found link from industrial production to stock prices in India. Tan, Loh and Zainudin (2006) found inflation; crude oil price and Treasury Bills’ rate have long-time relation with Malaysian stock market. To Maysami et al. (2004), interest rate has both significant positive and negative impact on Singapores stock markets. Engle and Rangel (2008) investigate the GARCH equation for low rate volatility. The outcome was high frequency aggregate capital market volatility had both short-run and long-rung component and suggest long-run dimension is related

112112112112
Econometrics test of Arbitrage Pricing and its Volatility in the Nigerian Equities Market Econometrics test of Arbitrage Pricing and its Volatility in the Nigerian Equities Market Econometrics test of Arbitrage Pricing and its Volatility in the Nigerian Equities Market Econometrics test of Arbitrage Pricing and its Volatility in the Nigerian Equities Market
to the fluctuation of economic activities. Results of Tursoy et al. (2008) indicate no significant pricing link connecting stock return with interest rate. Robert (2008) validates absence of a considerable link involving present and past market returns with macroeconomic variables, suggesting that the markets of Brazil, Russia, India and China exhibit weak form of market efficiency. Humpe and Macmillan (2009) obtained negative inflation effect on stock prices. Mohammad, Hussain and Ali (2009) observe significant positive impact of exchange rate plus foreign exchange reserves on stock price in Kerachi exchange in Pakistan using quarterly data. Asaolu and Ogunmuyiwa (2010) found feeble association between share price and economic variables was observed under the error correction model. Choo, Lee and Ung (2011) using GARCH models found macroeconomic variables have no impact on the volatility of Japanese stock market. Sangmi and Hassan (2013) found a significant association between variables like inflation, exchange rate, interest rate and money supply in India. The findings of the literature suggests existence of linkage between macroeconomic variables and stock prices in developed economies but such relationship is yet to be robust in developing economies. THEORETICAL FRAMEWORKTHEORETICAL FRAMEWORKTHEORETICAL FRAMEWORKTHEORETICAL FRAMEWORK, MODEL SPECIFICATION , MODEL SPECIFICATION , MODEL SPECIFICATION , MODEL SPECIFICATION AND AND AND AND RESEARCH RESEARCH RESEARCH RESEARCH METHODOLOGY METHODOLOGY METHODOLOGY METHODOLOGY Theoretically, an econometric test of the APT demands the modelling of anticipated return of a financial asset as linear function of macroeconomic variables in return generating process Chen and Ingersoll (1983), taking into cognizance degree of responsiveness to changes in variables which are represented by a factor-specific coefficient

113113113113
CARD International Journal ofCARD International Journal ofCARD International Journal ofCARD International Journal of Management Studies, BusinessManagement Studies, BusinessManagement Studies, BusinessManagement Studies, Business &&&& Entrepreneurship ResearchEntrepreneurship ResearchEntrepreneurship ResearchEntrepreneurship Research Volume 2Volume 2Volume 2Volume 2, Number , Number , Number , Number 2, June 20172, June 20172, June 20172, June 2017
subsequent to a return generating process, which is mathematical computation of how the equity returns move with economic factors.
1 ,,1( ) ( ) ...i i K ii Ki
R E R δ δ υ− = ℑ + + ℑ +
(3.1)
Where i
ℑ is sensitivity of variables to stock returns. For every variables,
( ) 0iE ℑ =
. Practically, we rather define an f as deviation of returns from
what was expected. Often we assume ,( ) 0,i jE i jℑ ℑ = ∀ ≠
. Thus, we re-
specified our model is:
1 ,,1( ) ...i i K ii Ki
R E R δ δ υ= + ℑ + + ℑ +
(3.2)
Where ,i jδ
denotes the loading of the ith stock on the jth macroeconomic
variable and it explains by how much quantity stock return rises when
the variable is one unit higher than expected. The iυ
denotes the
idiosyncratic risk. So, iυ
is negative when a firm loses large contract.
Going by the usual econometric assumption, ( , ) 0i jCov υ υ =
for all
securities i and j. In this study, we estimated variance-components equation and fixed effect model. The variance-component model was estimated with the panel GLS estimator:
'
2
2
(0, )
(0, )
i
i it
i u
it s
itit it
it u s
u IID
s IID
R G
σ
σ
δ υυ
ℑ
= +
= + +
Where
iℑ is the sensitivity of every variable to stock return. For
1,..., ; 1,..., ;i N t T= = u and s are serially independent. The GLS regression
equation is consequently specified as:
2 2
'
( )( ) u N T s N
it itNT
I J I
R G
Var σ σ
δ υ
υ
ℑ
= ⊗ +
= + +

114114114114
Econometrics test of Arbitrage Pricing and its Volatility in the Nigerian Equities Market Econometrics test of Arbitrage Pricing and its Volatility in the Nigerian Equities Market Econometrics test of Arbitrage Pricing and its Volatility in the Nigerian Equities Market Econometrics test of Arbitrage Pricing and its Volatility in the Nigerian Equities Market
Denoting the error variance matrix by ( ')E υυ = Ω the GLS estimation
grips the inversion of the ( )NT NT× matrixΩ from a ‘spectral’
decomposition into orthogonal parts such that: 2 2
2 2 2
2 2 2
( )
( )( ) ( )
( )
Tu N s NT
T Tu s N s NT N
u s s
I J I
I J I I J
Q
T
T
T P
σ σ
σ σ σ
σ σ σ
−
− −
⊗ +
+ ⊗ + − ⊗
+
Ω =
=
= +
In effect, cross-section weighted regression is apposite to take care of residuals that are cross-section heteroskedastic and contemporaneously linked. This is derived as follows:
21 1
21 1
21 1
'
0 . . . 0
0 . . . 0
0 0 . . .
( )
IT
E IT
IT
E
σ
σ
σ
υυ
Ω = = (3.7)
By definition, TJ−
is a ( )T T× matrix of elements 1T − . Given the properties
of the spectral decomposition, we inverted Ω component-wise such that: 1 2 2 1 2
) ( )( ( )T Tu s N s NT NI J I I JTσ σ σ− −
− − −+ ⊗ + − ⊗Ω =
( )1
' 2 2 1 2 ' 2 2 1 2( ) ( ):
u s s u s sP Q P Q RGLS estimator G T G G Tσ σ σ σ σ σ
−− − − − + + + + =
Given that GLS estimator is invariant to any re-scaling of the transformation matrix, the unidentified weight parameter was estimated as:
2 2
2 2
1
)
(1 )
)
(
1(
s
u s
s
u s
P Q
P Q
PT
T
σ
σ σ
θ
σθ
σ σ
++
− +
+
=
=
= −

115115115115
CARD International Journal ofCARD International Journal ofCARD International Journal ofCARD International Journal of Management Studies, BusinessManagement Studies, BusinessManagement Studies, BusinessManagement Studies, Business &&&& Entrepreneurship ResearchEntrepreneurship ResearchEntrepreneurship ResearchEntrepreneurship Research Volume 2Volume 2Volume 2Volume 2, Number , Number , Number , Number 2, June 20172, June 20172, June 20172, June 2017
Therefore, we utilized Nerlove method to estimate 2
uσ directly from the
estimates in a first-step least square dummy variable regression and therein form θ accordingly. Modelling Stock VolatilityModelling Stock VolatilityModelling Stock VolatilityModelling Stock Volatility The study modelled stock volatility by variance equation of exponential GARCH model. Thus, mean and variance equations of EGARCH model are specified as:
1 1 1
( )( )q q p
t i t ij i j
i i ji t i
t i t i
LnLn R RR R
υ υφζ − −
= = =−
− −
ℵ + += + ℑ∑ ∑ ∑
Where ,, and βζ ℵ ℑ are the parameters of equation. The working of
variance equation is that 0 1,2,3,...,i
i kℑ > ∀ = represents significant effect
of positive speculation in market. Using return generating process, we calculated the portfolio variance for macroeconomic variables as:
1 2 3 4 5,5,1 ,2 ,3 ,4( ) (i iii i i i
Var R Var δ δ δ δ δ υ+= + +ℑ + ℑ + ℑ ℑ ℑ
1 22 2 2
,,1 1 ,2 2 ,1 ,2. ( , )( ) ( ) ( ) 2 .i ii i i iCovVar R Var Var υδ δ σδ δ ℑ ℑ= ℑ + ℑ + +
2 2 2,,1 1 ,2 2
( ) ( ) ( )i ii iVar R Var Var υδ δ δ= ℑ + ℑ +
(3.3)
Equation (3.3) holds for uncorrelated macroeconomic variables. The regular formula for n variables is derived thus:
2, ,, ,
1 1
2( ) . . .N N
i i j ii K j Kj K
i R υδ δ σ σσ= =
=∑∑
(3.4)
Where
,j kσ denotes covariance between jth and kth variables. The
systematic variance is 2
, , ,1 1.
n n
i k j k ij k υδ δ σ= =
+∑ ∑ . The idiosyncratic variance is 2
,iυσ . The covariance of stocks, i and j (for two factors) is obtained as:
,11 2 1 2,1 ,2 ,2, ,( ) ( ji j iii i j
Cov R R Cov δ φ δ φ υ δ φ δ φ υ= + ++ +
(3.5)

116116116116
Econometrics test of Arbitrage Pricing and its Volatility in the Nigerian Equities Market Econometrics test of Arbitrage Pricing and its Volatility in the Nigerian Equities Market Econometrics test of Arbitrage Pricing and its Volatility in the Nigerian Equities Market Econometrics test of Arbitrage Pricing and its Volatility in the Nigerian Equities Market
1 2 1, 2,1 ,1 ,2 ,2 ,1 ,2 ,1 ,2, ) )( ) ( ( ) ( ( )i j i j i j i j j i
Cov R R Var Var Covδ δ φ δ δ φ δ δ δ δ φ φ= ++ +
1 2,1 ,1 ,2 ,2, )( ) ( ( )i j i j i j
Cov R R Var Varδ δ φ δ δ φ= +
(3.6) Equation (3.6) holds for uncorrelated macroeconomic variables. The APT provides the impetus for a supply-side modeling of portfolio proceeds and linear combination of exogenous macroeconomic variables, since its beta coefficients denote responsiveness of causal asset to macroeconomic variables. So, variable shocks could cause structural changes in assets' expected returns or in firms' profit level. Utilizing panel fixed effect estimator to test validity of arbitrage pricing theory, we estimated link involving macroeconomic variables with stock market returns in individual firms enlisted in the NSE. There are forty two cross-sectional stocks and five-year time series such that panel is consisted 210 NT pooled observations. Given that each cross-sectional unit has equal number of time series observation, we then have a balanced panel. Explicitly, our panel model for the cross-sectional level of NSM is hereby specified as:
'it it it i itR Gδ φ υ= + + (3.7)
Where
itR is stock market returns, '
itW is the k vector of macroeconomic
variables [ ]'( ), ( ), ( ), ( )itG Ln f Ln b Ln d Ln m= , f is inflation rate, i is the
treasury bill rate, d is the index of industrial production, m is the growth of broad money in circulation, υ is stochastic error term in the model specification and
iφ is the parameter vector, that is, [ ]1 2 3 4 5
, , , ,iφ φ φ φ φ φ= for і
= 1, 2…., k cross sectional unit of stock. Each cross-section unit of stock is observed for dated period t= 1, 2…, 210, ,i t
δ is common effect of intercept which is assumed to be identical for

117117117117
CARD International Journal ofCARD International Journal ofCARD International Journal ofCARD International Journal of Management Studies, BusinessManagement Studies, BusinessManagement Studies, BusinessManagement Studies, Business &&&& Entrepreneurship ResearchEntrepreneurship ResearchEntrepreneurship ResearchEntrepreneurship Research Volume 2Volume 2Volume 2Volume 2, Number , Number , Number , Number 2, June 20172, June 20172, June 20172, June 2017
all the pool of stocks in the Nigerian Stock Market. To detect cross-section heteroskedasticity and contemporaneous correlation, the residual variance-covariance matrix for the equation is specified thus:
' ' '1 1 2 1 1
' ' ' '2 1 2 1 2
' ' '1 2
...
( ) ...
...
N
N
N N N N
E E υ υυυ
υ υ υ υ υ υ
υ υ υ υ
υ υ υ υ υ υ
Ω = = (3.8)
The basic specification treats the pool specification as a system of equation and estimates the model using fixed estimator. This specification is apt when the residual are contemporaneously uncorrelated and the time-period and cross section homoskedastic such that:
2N T
I IσΩ = ⊗ (3.9)
The coefficients and their covariance are estimated using the techniques applied to the stacked model. Fixed effect estimator allows the intercept
iδ to differ across cross-section units by estimating different constants
for every cross section. The fixed effect is computed by subtracting “within” mean from each variable and estimating the equation using transformed data as specified:
( ) ( )
/ , / , / ,
i ii i
i i it itt t t
R R Q Q
where R R T Q Q T T
φ υ υ
υ υ
− = − + −
= = =∑ ∑ ∑ (3.10)
Covariance matrix estimates are given by OLS covariance formula applied to mean difference model:
'2 1( ) ( )wFEVar q qσφ −= (3.11)
Where Q represents the mean difference and ' 2'
2( )
( )it itit
wFE
R R FEFE FEVar
NT N K NT N K
φυ υσφ
−= = =
− − − −∑
(3.12)

118118118118
Econometrics test of Arbitrage Pricing and its Volatility in the Nigerian Equities Market Econometrics test of Arbitrage Pricing and its Volatility in the Nigerian Equities Market Econometrics test of Arbitrage Pricing and its Volatility in the Nigerian Equities Market Econometrics test of Arbitrage Pricing and its Volatility in the Nigerian Equities Market
Where 'FE FEυ υ is the SSR from fixed effects model. In effect, the
weighted statistics are derived from equation (3.12). The rationale for panel fixed effect estimator is that it cognizance heterogeneity effect of the individual firms. Panel Unit Root and CoPanel Unit Root and CoPanel Unit Root and CoPanel Unit Root and Co----integration Testintegration Testintegration Testintegration Test The study utilized Im, Pesaran and Shin (IPS) unit root test to test for the presence of unit root in panels that combines time series with cross section dimension, such that lesser time observations are required for the test to have power. IPS begins by specifying an ADF equation for every cross-section with individual effects and no time trend:
, 1 1
i
it i i i it iti t jR a R Gφ µ
ℑ
− =∆ = + ℑ + ∆ +∑
(3.13)
Where i = 1, . . ., N cross-section units, that are observed over periods and t = 1, . . .,T. The itG represent the exogenous variables in model
with fixed effects or individual trends, iρ are the autoregressive
coefficients, and errors itµ are mutually independent idiosyncratic
disturbances. The test procedure is that if 1iℑ < , itR is weakly (trend)
stationary. If 1iℑ = then itR contains a unit root.
We utilized E Views to compute IPS test which is based on Augmented Dickey-fuller (ADF) statistics averaged across groups. The average of the t-statistics for
1ρ from the individual ADF regressions is computed
as:
1
1( )
N
it i iNT it t
Nβ
== ℑ∑ (3.14)
The standardized t-bar statistic converges to the standard normal distribution as N and T ∞→ . We utilized the Pedroni test of panel co-integration. The Pedroni’s panel co-integration test is based on the estimated residuals from a co-integration regression of the form in equation (3.15) after regularizing panel statistics with correction terms.

119119119119
CARD International Journal ofCARD International Journal ofCARD International Journal ofCARD International Journal of Management Studies, BusinessManagement Studies, BusinessManagement Studies, BusinessManagement Studies, Business &&&& Entrepreneurship ResearchEntrepreneurship ResearchEntrepreneurship ResearchEntrepreneurship Research Volume 2Volume 2Volume 2Volume 2, Number , Number , Number , Number 2, June 20172, June 20172, June 20172, June 2017
, ,,1 1 , 2 2 ,i t i i i tKi Ki ti i t i i tR f t G G Gδ β β β µ= + + + + + +K (3.15)
1,..., ; 1,..., ; 1,...,t T i N k K∀ = = =
Where T is the number of observations over time, N number of cross-sectional units in the panel, and M number of macroeconomic variables. Thus,
if is the individual fixed effects parameter which varies across
individual cross-sectional units. This also holds for slope coefficients and individual specific time effects,
itδ .
VariablesVariablesVariablesVariables, Data, Data, Data, Data DescriptionDescriptionDescriptionDescription, Measurement , Measurement , Measurement , Measurement and Sourcesand Sourcesand Sourcesand Sources In this study, we measured stock volatility as the variance of stock market returns over time. Standard deviation measures extent of return fluctuation in relation to its mean over a period. Our variables are inflation rate measured as consumer price index (f), Treasury bill rate (b), index of industrial production (d) and money supply (m). The variables were transformed into natural logarithm to diminish heteroskedasticity. Data were obtained sourced from different sources. Data on macroeconomic variables were acquired from CBN, while stock returns were acquired from equities report. The data covers January 2000 to September, 2016. EMPIRICAL EMPIRICAL EMPIRICAL EMPIRICAL RESULTSRESULTSRESULTSRESULTS The rundown statistics of the variables are provided in Table 4.1. Deviation of variables is relatively high as it portrays enormous variation of the series. Analysis of the results is perhaps reliable to stand the test of time given the co-integrating vector.
Table Table Table Table 4.14.14.14.1: Descriptive Statistics: Descriptive Statistics: Descriptive Statistics: Descriptive Statistics
VariablesVariablesVariablesVariables Measure Measure Measure Measure Statistic Statistic Statistic Statistic
Ln(R) Mean 1.492
Std. dev 0.256
Min -1.635
Max 1.823
Ln(f) Mean 9.658

120120120120
Econometrics test of Arbitrage Pricing and its Volatility in the Nigerian Equities Market Econometrics test of Arbitrage Pricing and its Volatility in the Nigerian Equities Market Econometrics test of Arbitrage Pricing and its Volatility in the Nigerian Equities Market Econometrics test of Arbitrage Pricing and its Volatility in the Nigerian Equities Market
Std. dev 0.234
Min 1.398
Max 2.643
Ln(b) Mean 1.973
Std. dev 2.245
Min 2.589
Max 4.879
Ln(d) Mean 12.435
Std. dev 0.692
Min 0.594
Max 6.352
Ln(m) Mean 5.768
Std. dev 0.524
Min 1.298
Max 2.963
The correlation results are in Table 4.2. A strong positive link involving stock market returns, money supply, growth rate of output and real interest rate is evident. While a fairly weak negative association involving stock market returns, exchange rate and industrial production is observed, the negative relationship between stock market returns and inflation and oil price level is rather strong. Table Table Table Table 4.24.24.24.2: Correlation Results: Correlation Results: Correlation Results: Correlation Results
VariablesVariablesVariablesVariables Ln(R)Ln(R)Ln(R)Ln(R) Ln(f) Ln(f) Ln(f) Ln(f) Ln(b)Ln(b)Ln(b)Ln(b) Ln(d)Ln(d)Ln(d)Ln(d) Ln(m)Ln(m)Ln(m)Ln(m)
Ln(R) 1.000
Ln(f) -0.234 1.000
Ln(b) 0.657 0.826 1.000
Ln(d) -0.492 0.856 0.286 1.000
Ln(m) 0.862 0.542 0.659 -0.286 1.000

121121121121
CARD International Journal ofCARD International Journal ofCARD International Journal ofCARD International Journal of Management Studies, BusinessManagement Studies, BusinessManagement Studies, BusinessManagement Studies, Business &&&& Entrepreneurship ResearchEntrepreneurship ResearchEntrepreneurship ResearchEntrepreneurship Research Volume 2Volume 2Volume 2Volume 2, Number , Number , Number , Number 2, June 20172, June 20172, June 20172, June 2017
Table 4.3 shows unit root results at first difference for IPS test in constant and constant plus time trend. With IPS test, every series is integrated of order one.
Table Table Table Table 4.34.34.34.3: Im, Pesaran and Shin Panel Unit Root Test Results: Im, Pesaran and Shin Panel Unit Root Test Results: Im, Pesaran and Shin Panel Unit Root Test Results: Im, Pesaran and Shin Panel Unit Root Test Results
The results of panel co-integration test are as presented in Table 4.2. The results reject the null hypothesis of no co-integration at the 5% for the Panel ρ-Statistic, Panel t-Statistic, Group ρ–Statistic and Group t-Statistic. These results are analogous to outcomes of the model in constant level only. Table D: Table D: Table D: Table D: Pedroni Panel CoPedroni Panel CoPedroni Panel CoPedroni Panel Co----integration Testintegration Testintegration Testintegration Test
VariablesVariablesVariablesVariables ConstantConstantConstantConstant Constant and Constant and Constant and Constant and TrendTrendTrendTrend
∆ Ln(R) -4.267* (0.000)
-2.291** (0.004)
∆ Ln(f) -2.958* (0.005)
-3.928* (0.002)
∆ Ln(b) -2.534** (0.002)
-3.273* (0.002)
∆ Ln(d) -2.459** (0.008)
-2.549** (0.006)
∆ Ln(m) -2.964** (0.005)
-2.075** (0.003)
Note: *, ** indicates co-integration at 1% and 5% levels
TestTestTestTest ConstantConstantConstantConstant Constant and TrendConstant and TrendConstant and TrendConstant and Trend
Panel v-Statistic -1.068 -1.845
Panel ρ-Statistic -2.925** -2.634**
Panel t-Statistic: (non-parametric)
-1.546 -0.325
Panel t-Statistic (adf): (parametric)
-2.982** -2.591**

122122122122
Econometrics test of Arbitrage Pricing and its Volatility in the Nigerian Equities Market Econometrics test of Arbitrage Pricing and its Volatility in the Nigerian Equities Market Econometrics test of Arbitrage Pricing and its Volatility in the Nigerian Equities Market Econometrics test of Arbitrage Pricing and its Volatility in the Nigerian Equities Market
The GLS and fixed effects results are shown in the Table 4.4 below. A comparison of both estimates shows similar findings that inflation, Treasury bill rate and money supply are significant in explaining stock market returns in Nigeria while industrial production is statistically insignificant. The estimated result validated positive association involving money supply stock return with a significant coefficient of 0.537 and 0.53 for the GLS and fixed effect respectively. Significant negative coefficients of inflation rate on stock return was obtained as seen in the coefficient of -1.052 and -0.273 respectively for the GLS and fixed effects. In fact, with inflationary tendencies, prices are rising and as such stock return would decline. This further highlights import dependence of Nigerian economy. So, fallen Naira will skyrocket the price level and this discourages saving for investment. The estimates also reported significant negative impact of Treasury bill price on stock return with coefficients of -0.453 for GLS estimator and -0.039 for fixed effects estimator respectively. The negative coefficients
Group ρ–Statistic
-3.782* -2.468**
Group t-Statistic: (non-parametric)
-1.693 -1.296
Group t-Statistic (adf): (parametric)
-4.728* -3.287*
(a) The Pedroni critical value of k < -1.64 acceptance of alternative except the v-statistic that has a critical value of k > 1.64 suggests rejection of the null.
(b) *, ** indicates co-integration at 1% and 5%, level

123123123123
CARD International Journal ofCARD International Journal ofCARD International Journal ofCARD International Journal of Management Studies, BusinessManagement Studies, BusinessManagement Studies, BusinessManagement Studies, Business &&&& Entrepreneurship ResearchEntrepreneurship ResearchEntrepreneurship ResearchEntrepreneurship Research Volume 2Volume 2Volume 2Volume 2, Number , Number , Number , Number 2, June 20172, June 20172, June 20172, June 2017
could be interpreted to mean that increase in rate of Treasury bill discourages investment in the stocks of Treasury bills. Hence, the adverse effects on stock return. Table Table Table Table 4.44.44.44.4: : : : GLS & Fixed Effects GLS & Fixed Effects GLS & Fixed Effects GLS & Fixed Effects ResultsResultsResultsResults
VariablesVariablesVariablesVariables GLS GLS GLS GLS Estimates Estimates Estimates Estimates
Fixed Effects Fixed Effects Fixed Effects Fixed Effects EstimatesEstimatesEstimatesEstimates
c -1.347** (2.050)
-1.225** (3.624)
Ln(f) -1.052** (2.391)
-0.273* (2.152)
Ln(d) -0.231 (1.364)
-0.051 (1.123)
Ln(b) -0.453** (7.568)
-0.039** (9.326)
Ln(m) 0.537 (16.142)
0.253 (1.902)
Adjusted R2 F-stat.(Prob)
0.32 2.35(0.002)
0.34 2.453(0.003)
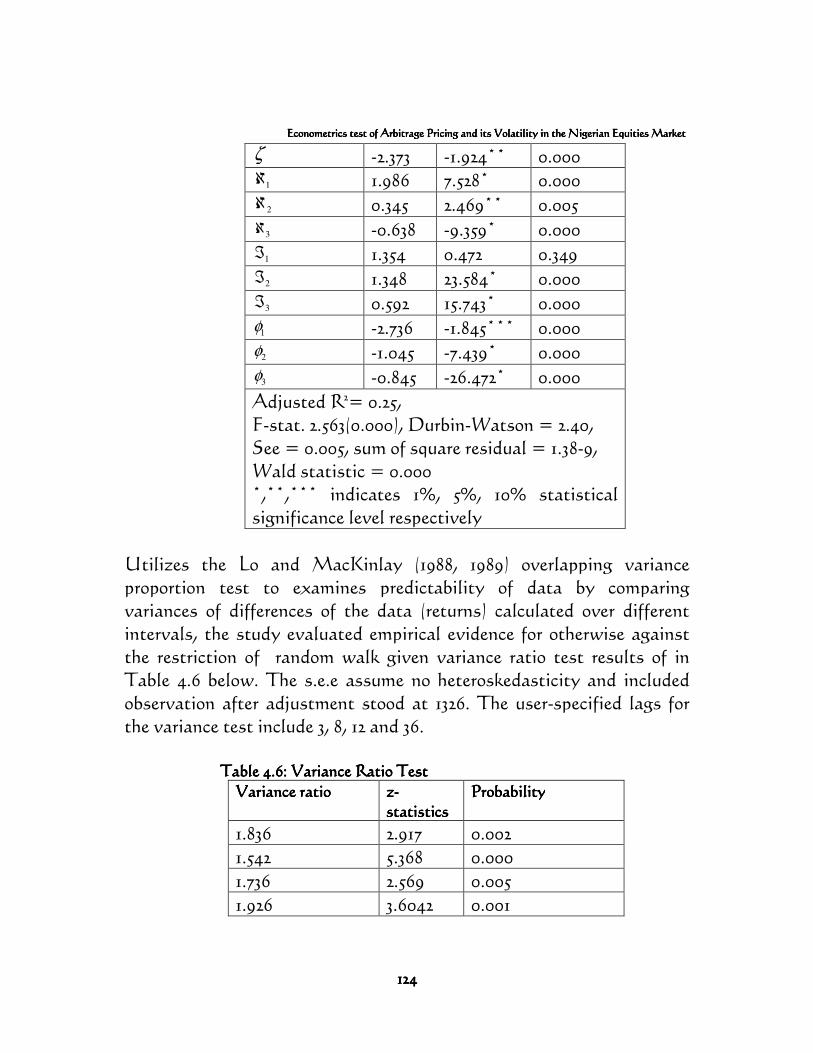
The results of exponential GARCH model are reported in Table 4.5 below. The EGARCH effect is statistically significant even at 1%. The negative coefficient of (-1.569) is shows stock volatility have harmful effects on returns. In fact, the results amplify asymmetric volatility effect on stock market in Nigeria.
Table Table Table Table 4.54.54.54.5: EGARCH (3: EGARCH (3: EGARCH (3: EGARCH (3,3,3,3,3) ) ) ) MoMoMoModel Results of Stock Returnsdel Results of Stock Returnsdel Results of Stock Returnsdel Results of Stock Returns
Variables/Variables/Variables/Variables/CoefficientsCoefficientsCoefficientsCoefficients zzzz----statisticsstatisticsstatisticsstatistics probprobprobprob
RESID(-1)^2
-2.373 -5.324* 0.000
EGARCH(-1)
-1.569 -33.947* 0.000
124124124124
Econometrics test of Arbitrage Pricing and its Volatility in the Nigerian Equities Market Econometrics test of Arbitrage Pricing and its Volatility in the Nigerian Equities Market Econometrics test of Arbitrage Pricing and its Volatility in the Nigerian Equities Market Econometrics test of Arbitrage Pricing and its Volatility in the Nigerian Equities Market
ζ -2.373 -1.924** 0.000
1ℵ 1.986 7.528* 0.000
2ℵ 0.345 2.469** 0.005
3ℵ -0.638 -9.359* 0.000
1ℑ 1.354 0.472 0.349
2ℑ 1.348 23.584* 0.000
3ℑ 0.592 15.743* 0.000
1φ -2.736 -1.845*** 0.000
2φ -1.045 -7.439* 0.000
3φ -0.845 -26.472* 0.000
Adjusted R2= 0.25, F-stat. 2.563(0.000), Durbin-Watson = 2.40, See = 0.005, sum of square residual = 1.38-9, Wald statistic = 0.000 *,**,*** indicates 1%, 5%, 10% statistical significance level respectively
Utilizes the Lo and MacKinlay (1988, 1989) overlapping variance proportion test to examines predictability of data by comparing variances of differences of the data (returns) calculated over different intervals, the study evaluated empirical evidence for otherwise against the restriction of random walk given variance ratio test results of in Table 4.6 below. The s.e.e assume no heteroskedasticity and included observation after adjustment stood at 1326. The user-specified lags for the variance test include 3, 8, 12 and 36.
Table Table Table Table 4.64.64.64.6: : : : Variance Ratio TestVariance Ratio TestVariance Ratio TestVariance Ratio Test
Variance ratioVariance ratioVariance ratioVariance ratio zzzz----statisticsstatisticsstatisticsstatistics
ProbabilityProbabilityProbabilityProbability
1.836 2.917 0.002
1.542 5.368 0.000
1.736 2.569 0.005
1.926 3.6042 0.001

125125125125
CARD International Journal ofCARD International Journal ofCARD International Journal ofCARD International Journal of Management Studies, BusinessManagement Studies, BusinessManagement Studies, BusinessManagement Studies, Business &&&& Entrepreneurship ResearchEntrepreneurship ResearchEntrepreneurship ResearchEntrepreneurship Research Volume 2Volume 2Volume 2Volume 2, Number , Number , Number , Number 2, June 20172, June 20172, June 20172, June 2017
Thus, the statistical significance and validity of variance ratio results for homoskedastic random walk were ascertained using the asymptotic normal distribution of Wild bootstrap (Kim, 2006) to evaluate. Given that we have specified above one test period namely, 3, 8, 12 and 36, there are two categories of test results. These include joint and individual test results. The joint test is test of joint hypothesis for all the periods, while individual test is variance ratio as conducted on individual period. Results show the Chow-Denning maximum z statistic of 4.295 for
period 8 individual tests. The p-value of 0.000 is obtained using the studentized highest modulus with infinite df in order that null of random walk is rejected. The Wald statistic for the joint hypotheses also invalidates hypothesis of random walk. CONCLUSION CONCLUSION CONCLUSION CONCLUSION The study tests validity of arbitrage pricing theory for NEM and the volatility therein. This was conducted by estimating the EGARCH model together with the GLS and fixed effects models with cross section specific coefficients of the stocks enlisted in NSEM. The policy implications are indeed uncomplicated as the study upholds the APT theory for Nigerian Stock Market. Accordingly, money supply had significant positive outcome on stock return, Treasury bill rate plus inflation rate had significant negative outcome on return of NSEM. In particular, the EGARCH effect was found statistically significant with
Joint Tests Value Probability
Max z @ (period
8)* 5.368 0.000
Wald (chi-Square)
35.270 0.000
Probability is based on studentized highest modulus with parameter figure 6 and infinite df

126126126126
Econometrics test of Arbitrage Pricing and its Volatility in the Nigerian Equities Market Econometrics test of Arbitrage Pricing and its Volatility in the Nigerian Equities Market Econometrics test of Arbitrage Pricing and its Volatility in the Nigerian Equities Market Econometrics test of Arbitrage Pricing and its Volatility in the Nigerian Equities Market
the implication that stock volatility is harmful stock return. This indeed validates NSE as vulnerable to the instability in the market. The study so recommends the requirement for stock investors to be cognizant of trend of both domestic macroeconomic fundamentals. REFERENCESREFERENCESREFERENCESREFERENCES Abdullahi, I.B. (2011) Sectoral Analysis of Risks and Returns of the
Quoted Firms in the Nigerian Capital Market. Unpublished Ph.D. thesis Submitted to University of Ilorin, Nigeria pp.53-124.
Ahmed, S. (2008) Aggregate Economic Variables and Stock Markets in
India. International Research Journal of Finance and Economics Vol. 14: 14165.
Altay, E. (2003) The Effect of Macroeconomic Factors on Asset
Returns: A Comparative Analysis of the German and Turkish Markets in an APT Framework. Martin-Luther-Universitat Halle, Betviebswirschaftliche Diskussionbatrage Nr. 84/2003.
Ali I., Rehman K. U., Yilmaz A. K., Khan M. A. and Afzal H. (2010)
‘Causal Relationship between Macreconomic Indicators and stock Exchange Prices in Pakistan’ African Journal of Business Management, 4(3), 312 - 319
Amadi S.N., Onyema J.I. and T.D. Odubo (2002), Macroeconomic Variables and Stock Prices. A Multivariate Analysis. Africa Journal of Development Studies, 2(1), 159-164.
Asaolu T.O. and Ogunmakinwa M. S. (2011), ‘An Econometric
Analysis of the Impact of Macroeconomic Variables on Stock Market Movement in Nigeria’ Asian Journal of Business Management, 3(1), 72 – 78.

127127127127
CARD International Journal ofCARD International Journal ofCARD International Journal ofCARD International Journal of Management Studies, BusinessManagement Studies, BusinessManagement Studies, BusinessManagement Studies, Business &&&& Entrepreneurship ResearchEntrepreneurship ResearchEntrepreneurship ResearchEntrepreneurship Research Volume 2Volume 2Volume 2Volume 2, Number , Number , Number , Number 2, June 20172, June 20172, June 20172, June 2017
Brurbridge, J., & Harrison A. (1984), Testing for the Effects of Oil-price
Rises using VAR. Int Economic Rev, 25, 459-84. Beenstocks, M.and Chen, K. (1988) Economic Forces in the London
Stock Market. Oxford Bulletin of Economics and Statistics. Vol. 50 (1): 27 39.
Brown, S.J. and Weinstein, M.I. (1983) A New Approach to Testing
Asset Pricing Models: The Bilinear Paradigm. Journal of Finance Vol. 38: 22- 39.
Chen, N. F.; Ingersoll, E. (1983), "Exact Pricing in Linear Factor Models
with Finitely Many Assets: A Note". Journal of Finance. 38 (3): 985–988.
Cheng, A.C.S. (1995) The UK Stock Market and Economic Factors: A
New Approach. Journal of Business Finance and Accounting. Vol. 22 (1): 129-142.
Clare, A.D. and Thomas, S.H. (1994) Macroeconomic Factors, the
APT and the UK Stock Market Journal of Business Finance and Accounting Vol. 21 (3): 309.
Chen N.F., Roll R. and S.A. Ross (1986), Economic Forces and the
Stock Market. Journal of Business, 59(3), 383-403. Dhrymes, P.J. Friend, I., Gultekin, N.B. and Gultekin, M.N. (1985) An
Empirical Examination of the Implication of APT Journal of Banking and Finance Vol. 9: 73-99.
Dhrymes, P.J., Friend, I. and Gultekin, N.B. (1984) A Critical Re-
examination of the Empirical Evidence on the APT. Journal of Finance Vol. 39 (2): 323-346.

128128128128
Econometrics test of Arbitrage Pricing and its Volatility in the Nigerian Equities Market Econometrics test of Arbitrage Pricing and its Volatility in the Nigerian Equities Market Econometrics test of Arbitrage Pricing and its Volatility in the Nigerian Equities Market Econometrics test of Arbitrage Pricing and its Volatility in the Nigerian Equities Market
Diacogiannis, G.P. (1986) Arbitrate Pricing Model: A Critical
Examination of its Empirical Applicability for the London Stock Exchange. Journal of Business Finance and Accounting Vol. 113 (5): 489-504.
Dickinson, D.G. (2000) Stock Market Integration and Macroeconomic
Fundamentals and Empirical Analysis. Applied Financial Economics Vol. 10, pp.261-76.
Fama, E. (1990) Stock Returns, Expected Returns, and Real Activity.
Journal of Finance 45 (1): 108a-108. Gunsel, N. and Cukur, S. (2007) The Effects of Macroeconomic Factors
on the London Stock Returns: A Sectoral Approach. International Research Journal of Finance and Economics, Vol. 10: 140-52.
Flannery M.I. and A.A. Protopapadakis (2002): Macroeconomic Factors
do Increase Aggregate Stock Returns. Review of Financial Studies, 15, 751-789.
Hussainey and Ngoc (2009), ‘Impact of Macroeconomic Variables on
Vietnamese Stock Exchange’ Journal of Risk Finance, 4, 18-46 Jefferis, K. R. and Okeahalam, C. C. (2000). The Impact of Economic
Fundamentals on Stock Markets in Southern Africa. Development Southern Africa, 17(1), 23-51.
Leon, K. (2008) The Effect of Interest Rates Volatility on Stock Returns
and Volatility: Evidence From Korea. International Research Journal of Finance and Economics Vol. 14: 285-90.

129129129129
CARD International Journal ofCARD International Journal ofCARD International Journal ofCARD International Journal of Management Studies, BusinessManagement Studies, BusinessManagement Studies, BusinessManagement Studies, Business &&&& Entrepreneurship ResearchEntrepreneurship ResearchEntrepreneurship ResearchEntrepreneurship Research Volume 2Volume 2Volume 2Volume 2, Number , Number , Number , Number 2, June 20172, June 20172, June 20172, June 2017
Nasseh, A. and Strauss (2000) Stock Prizes and Domestic and
International Macroeconomic Activity: A Co-integration Approach. The Quarterly Review of Economics and Finance Vol. 40 pp.229-45.
Nikolaos, S. Girigoris, G. Nikkolaos, L. and Nikos, K. (2009) Empirical
Analysis of Determinants of D.J.S.I. US Mean Returns World Academy of Science, Engineering and Technology. 54.
Maku O. E. and Attanda A. A. (2009), ‘Does Macroeconomic
Indicators Exert shock on the Nigerian Capital Market? Online at http://mpra.ub.uni-muenchen.de/17917/
Mork K. (1989), oil and the Macroeconomy, When prices go up and
down: An Extension of Hamilton’s results. Journal of Political Economy, 97(51), 740-744.
Mukherjee T.K. and A. Naka (1995), Dynamic Relations between
Macroeconomic Variables and the Japanese Stock Market. An application of Vector Error Correction Model. Journal of Finance Research, 18, 223-237.
Nwokoma N.I. (2002), ‘Stock Market Performance and Macroeconomic
Indicators Nexus in Nigeria. An Empirical Investigation’ Nigerian Journal of Economic and Social Studies, 44-62.
Ologunde, A.O., Elumilade, D.O. and Asaolu, T. O. (2006). Stock Market Capitalization and Interest Rate in Nigeria: A Time Series Analysis. International Research Journal of Finance and Economics, 4, 154-166.
Olowe, R. A. (2007), ‘The Relationship Between Stock Prices and
Macroeconomic Factors in the Nigerian Stock Market’ African Review of Money, Finance and Banking, 79 - 98

130130130130
Econometrics test of Arbitrage Pricing and its Volatility in the Nigerian Equities Market Econometrics test of Arbitrage Pricing and its Volatility in the Nigerian Equities Market Econometrics test of Arbitrage Pricing and its Volatility in the Nigerian Equities Market Econometrics test of Arbitrage Pricing and its Volatility in the Nigerian Equities Market
Ozcam, M. (1997) An Analysis of the Macroeconomic Factors that
Determine Stock Return in Turkey. Capital Market Board of Turkey Publication No. 75.
Poon, S. and Taylor, S.J. (1991), Macroeconomic Factors and the UK
Stock Market. Journal of Business Finance and Accounting Vol. 18(5): 619-636.
Priestley, R. (1996) The Arbitrate Pricing Theory, Macroeconomic and
Financial Factors and Expectations Generating Processes. Journal of Banking and Finance Vol. 20: 869-890.
Ross S.A.(1976): ‘The Arbitrage Theory of Capital Asset Pricing’.
Journal of Economic Theory, 13(3), 341-360. Roll, R. and Ross, S.A. (1980) An Empirical Investigation of the
Arbitrage Pricing Theory. Journal of Finance. Vol. 3, (5): 1073-1103. Ross, S.A. (1976) The Arbitrage Theory of Capital Assets Pricing.
Journal of Economic Theory 13: 340-362. Shanken, J. and Weinstein, M.I. (2006) Economic Forces and Stock
Market Revisited. Journal of Empirical Finance Vol. 13: 129-44. Sunitas, A. and Kenourgios, D. (2007) Macroeconomic Factors’
Influence on New European Countries Stock Return: The Case of Four Transition Economies. International Journal of Financial Services Management, Vol. 2: 34-49.
Soyode (1993): ‘Nigerian Capital Markey and Macroeconomic
Variables. An Empirical Analysis’, Nigerian Journal of Monetary Economics,3.

131131131131
CARD International Journal ofCARD International Journal ofCARD International Journal ofCARD International Journal of Management Studies, BusinessManagement Studies, BusinessManagement Studies, BusinessManagement Studies, Business &&&& Entrepreneurship ResearchEntrepreneurship ResearchEntrepreneurship ResearchEntrepreneurship Research Volume 2Volume 2Volume 2Volume 2, Number , Number , Number , Number 2, June 20172, June 20172, June 20172, June 2017
Tursoy, T., Gunsel, N. and Rjoub, H. (2008) Macroeconomic Factors,
the APT and the Istanbul Stock Market. International Research Journal of Finance and Economics ISSN 1450-2887 Issue 22.


![Article - White Rose Research Onlineeprints.whiterose.ac.uk/113339/2/[Bladder_cancer]_Figures...TERT mutation and 9q LOH Flat dysplasia TP53 mutation, 9p LOH and 9q LOH T1 Invasive](https://static.fdocuments.us/doc/165x107/5f24abd2d3ccb012d859c51c/article-white-rose-research-bladdercancerfigures-tert-mutation-and-9q-loh.jpg)