Econometrics - FIFA Research
13
DETERMINANTS OF INTERNATIONAL SOCCER PERFORMANCE IN THE FIFA WORLD CUP A RESEARCH PAPER Presented to Dr. Peter Schuhmann of the Economics Department The University of North Carolina Wilmington By William R F. Carpenter Niels Sommerfeld May 2014
-
Upload
niels-sommerfeld -
Category
Documents
-
view
348 -
download
0
Transcript of Econometrics - FIFA Research
DETERMINANTS OF INTERNATIONAL SOCCER
PERFORMANCE IN THE FIFA WORLD CUP
Will Carpenter
[Pick the date]
A RESEARCH PAPER
Presented to
Dr. Peter Schuhmann of the Economics Department
The University of North Carolina Wilmington
By
William R F. Carpenter
Niels Sommerfeld
May 2014
DETERMINANTS OF INTERNATIONAL SOCCER
PERFORMANCE
Niels Sommerfeld & William Carpenter
University of North Carolina Wilmington
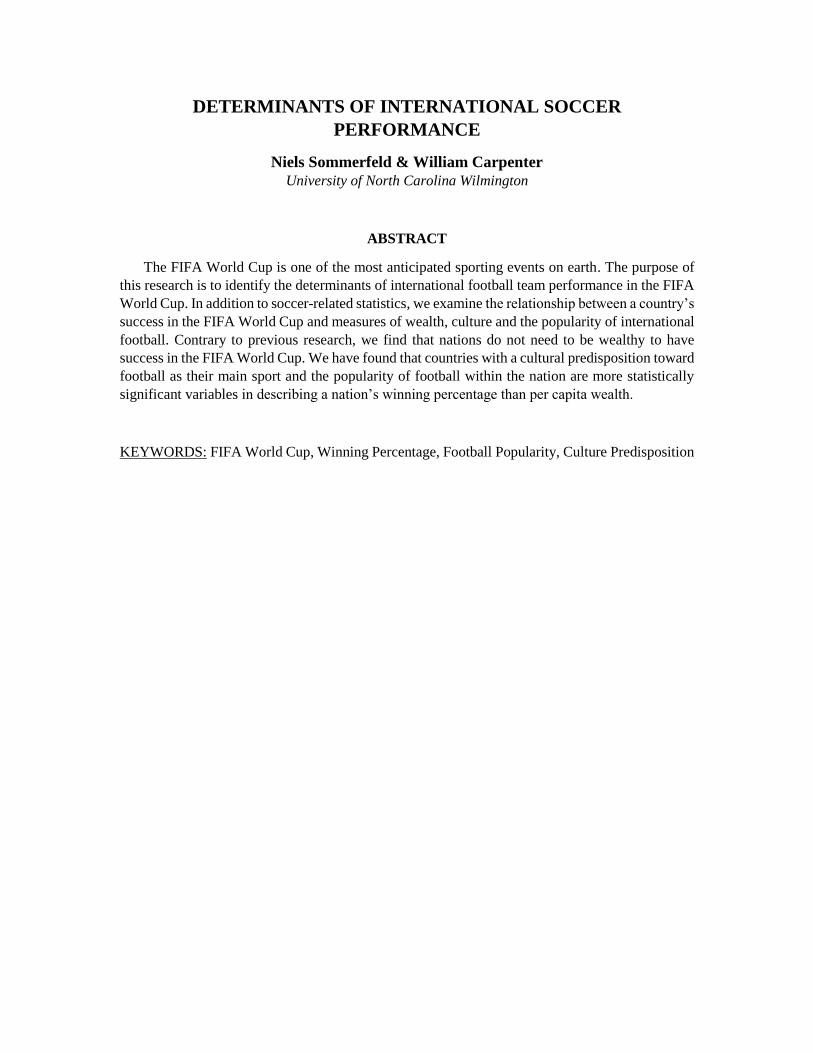
ABSTRACT
The FIFA World Cup is one of the most anticipated sporting events on earth. The purpose of
this research is to identify the determinants of international football team performance in the FIFA
World Cup. In addition to soccer-related statistics, we examine the relationship between a country’s
success in the FIFA World Cup and measures of wealth, culture and the popularity of international
football. Contrary to previous research, we find that nations do not need to be wealthy to have
success in the FIFA World Cup. We have found that countries with a cultural predisposition toward
football as their main sport and the popularity of football within the nation are more statistically
significant variables in describing a nation’s winning percentage than per capita wealth.
KEYWORDS: FIFA World Cup, Winning Percentage, Football Popularity, Culture Predisposition

TABLE OF CONTENTS
ABSTRACT…………………………………………………………………………… ii
ACKNOWLEDGEMENTS……………………………………………………………. iii
I. INTRODUCTION………………………………………………………… 1
II. LITERATURE REVIEW…………………………………………………. 2
III. DATA……………………………………………………………………… 3
IV. RESULTS…………………………………………………………………. 5
V. DISCUSSION……………………………………………………………... 7
VI. CONCLUSION……………………………………………………………. 8
VII. SOURCES…………………………………………………………………. 9

ACKNOWLEDGEMENTS
Conducting research and completing our paper has been a difficult although rewarding
process. We would like to thank Dr. Peter Schuhmann for sharing his knowledge and expertise in
Econometrics and advising us throughout the entire project. He offered productive criticism and
allowed us to understand a higher knowledge of uncovering relationships through econometric
methods, while making this research valuable yet gratifying.

INTRODUCTION
The Federation Internationale de Football Association (FIFA) sponsors what is considered
to be the most popular sporting event in the World: The FIFA World Cup. Founded in Paris on
May 21st, 1904, the FIFA World Cup is held every 4 years since 1930 except 1942 and
1946(WWII). In 2014 it will be held in Rio De Janero, Brazil. The anticipation for the 2014 World
Cup was a major contributor to why we are conducting this study. In preparation for the World
Cup, countries dedicate their most talented players and a large amount of resources towards their
country’s international squad. For this World Cup there were 208 nations who competed in
qualifying matches to set the stage for a 32-team tournament. According to FIFA, in 2006 there
were 265 million male and female soccer players or 4% of the World’s population. The Worldwide
popularity of this sport has fueled football into a billion dollar industry and success in the World
Cup can lead to positive externalities for a nation. The popularity of the sport is no secret. At the
2010 FIFA World Cup in South Africa at the stadiums alone there were over 750,000 liters of beer
and 390,600 hot dogs sold (FIFA). In addition to the popularity FIFA has become highly profitable,
with total revenue over 4 years of $4.189 billion and a profit of $631 million. With this kind of
money involved, nations with deeper pockets would be assumed to have an advantage because of
their ability to fund their programs and develop the best teams.
Football has become a worldwide sport and received international attention but the success
of each nation differs tremendously. Since the first World Cup in 1930 there have only been 2
continents in which countries have won the World Cup, South America and Europe. Within those
continents only 8 individual countries have won 19 World Cups with Brazil leading at 5 wins. Most
of the World champions were participants in the first World Cup in 1904, and have since been
frequent competitors in the World Cup. Empirical studies regarding football success are still
relatively scarce in the literature, only really gaining popularity in the late 1990s. Many of those
past studies have used measures of wealth to explain the relationship between a nations success in
the World Cup. However, our results suggest that a country’s cultural disposition towards football
and the sport’s popularity are more important factors of World Cup Performance than wealth.
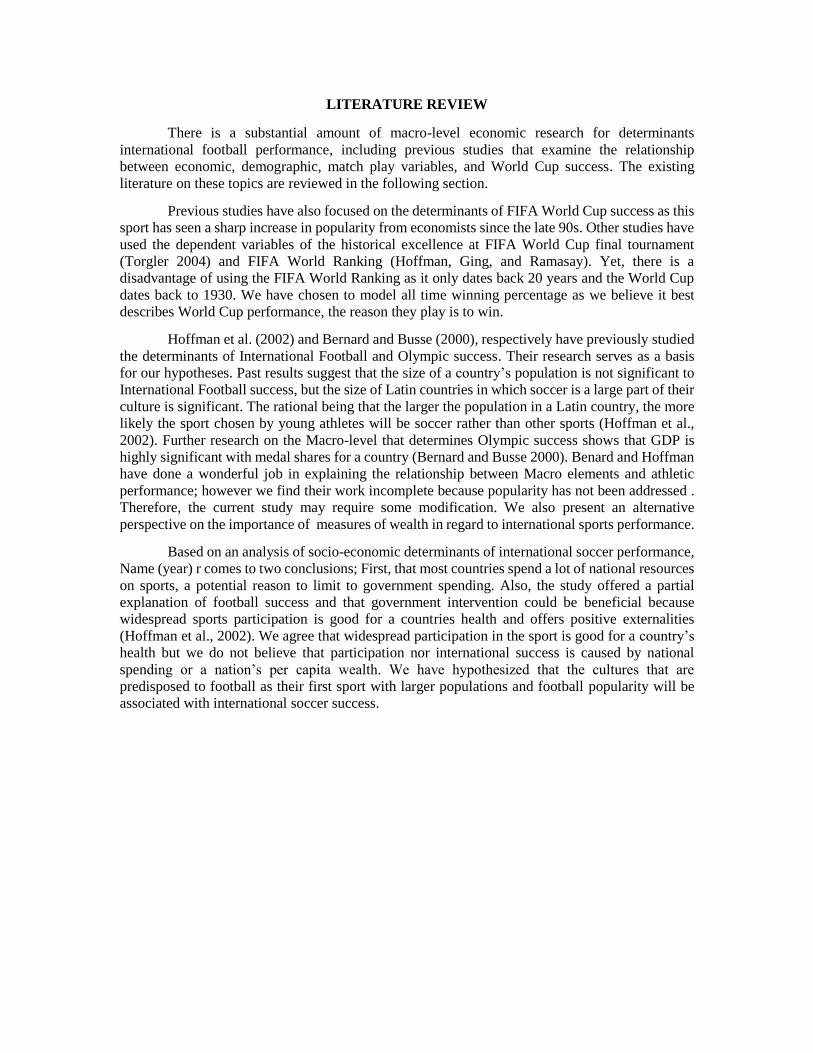
LITERATURE REVIEW
There is a substantial amount of macro-level economic research for determinants
international football performance, including previous studies that examine the relationship
between economic, demographic, match play variables, and World Cup success. The existing
literature on these topics are reviewed in the following section.
Previous studies have also focused on the determinants of FIFA World Cup success as this
sport has seen a sharp increase in popularity from economists since the late 90s. Other studies have
used the dependent variables of the historical excellence at FIFA World Cup final tournament
(Torgler 2004) and FIFA World Ranking (Hoffman, Ging, and Ramasay). Yet, there is a
disadvantage of using the FIFA World Ranking as it only dates back 20 years and the World Cup
dates back to 1930. We have chosen to model all time winning percentage as we believe it best
describes World Cup performance, the reason they play is to win.
Hoffman et al. (2002) and Bernard and Busse (2000), respectively have previously studied
the determinants of International Football and Olympic success. Their research serves as a basis
for our hypotheses. Past results suggest that the size of a country’s population is not significant to
International Football success, but the size of Latin countries in which soccer is a large part of their
culture is significant. The rational being that the larger the population in a Latin country, the more
likely the sport chosen by young athletes will be soccer rather than other sports (Hoffman et al.,
2002). Further research on the Macro-level that determines Olympic success shows that GDP is
highly significant with medal shares for a country (Bernard and Busse 2000). Benard and Hoffman
have done a wonderful job in explaining the relationship between Macro elements and athletic
performance; however we find their work incomplete because popularity has not been addressed .
Therefore, the current study may require some modification. We also present an alternative
perspective on the importance of measures of wealth in regard to international sports performance.
Based on an analysis of socio-economic determinants of international soccer performance,
Name (year) r comes to two conclusions; First, that most countries spend a lot of national resources
on sports, a potential reason to limit to government spending. Also, the study offered a partial
explanation of football success and that government intervention could be beneficial because
widespread sports participation is good for a countries health and offers positive externalities
(Hoffman et al., 2002). We agree that widespread participation in the sport is good for a country’s
health but we do not believe that participation nor international success is caused by national
spending or a nation’s per capita wealth. We have hypothesized that the cultures that are
predisposed to football as their first sport with larger populations and football popularity will be
associated with international soccer success.

DATA
Data for every match that has occurred in each world cup from the first FIFA World Cup
in 1930 until the latest one in 2010 were obtained from FIFA.com. Statistics gathered applied to
every country that has participated in the World Cup events with at least 9 wins. Countries with
less than nine wins were excluded. Morocco, Saudi Arabia, and Tunsinia were not included due to
insufficient Macro level statistics. We have used statistics from England to represent the United
Kingdom because it is the largest country in the United Kingdom. This method has been used in
past studies (see Hoffmann, Ging and Ramasay 2002 and Torgler 2004) Hence, Northern Ireland,
Scotland and Whales were not included in our analysis since several of our independent variables
including GDP per capita, Population size and Viewership were only available at the UK level. In
addition, to match statistics for each qualifying country, we obtained statistics for major economic
variables that we hypothesize to affect team performance.
Our data consists of 40 countries from all around the world that meet the above criteria.
The determinants (X variables) are split into 2 separate categories that we perceive as having an
effect on the winning percentage (Y variable) of each country in the FIFA World Cup. The first
category involves match variables which include World Cup matches played, total amount of goals
scored against their team, total points, number of World Cup appearances, and the Golden Shoe
(Player on the team that has scored the most goals in each World Cup). The second category
involves socioeconomic variables that affect each country’s team, including percentage of world
cup viewership in 2010 (which indicates the amount of fans for each country’s team watched a
match for 20 or more consecutive minutes), Average temperature for each country (in Fahrenheit),
and Per Capita wealth. All the variables and there definitions can be seen in Table 1.
Table 1. Variable Names and Definitions
DEFINITIONS
Independent Variable
wPct
Dependent Variables
pctView
popLatin
popEuro
avgTemp
pcWealth
pcWealth2
Dummy Variable (1 = countries that have hosted at
least one World Cup since 1930)
host
Total population of a country in Europe
Annual average temperature of a country
Per capita wealth of a country
Quadratic Per capita wealth of a country
The total percentage a country's team has won
matches in the FIFA World Cup since 1930
Definitions
Total percentage amount of a country's population that
watch match for 20 or more consecutive minutes
Total population of a country in Latin America

Descriptive statistics for variables used in this study are shown in Table 1.2. Winning
Percentage on average is 0.37 with a range of 0.57, the minimum being 0.11 (Iran) and a maximum
of 0.6907 (Brazil) for the data set of our 41 observed countries. The average amount of percentage
World Cup viewership for each country is 63%. The country with the highest percentage World
Cup viewership is Japan with 86% and the country with the least percentage of viewership is
Cameroon with a low of 17%. The average per capita wealth in each country is $24,368. The
highest amount of per capita wealth by a country is $80,158 (Switzerland) and the lowest amount
is $1,205 (Cameroon). The average temperature in each country is 57 degrees Fahrenheit. The
highest average temperature in a country is 80.2 degrees Fahrenheit (Ghana) and the lowest average
temperature is 30.3 degrees (Russia). The average total population in Latin American countries are
about 11.8 million persons. The country with the highest amount of total population in Latin
America is Brazil with 202 million persons and the country with the lowest amount is Uruguay 3.3
million persons. Looking at total population in Europe, the average is about 14.3 million persons.
The country with the highest amount of total population in Europe is Turkey with 81.6 million
persons and the country with the lowest amount is Croatia with about 4.5 million persons.
Table 1.2. Descriptive Statistics
wpct PctView popLatin PopEuro host avgtemp pcwealth pcWealth2
Mean 0.3702 0.6323 11837334 14344671 0.3659 57 24369 1014065742
Standard Error 0.0216 0.0307 5801036 3729160 0.0762 2 3241 224991149
Median 0.3810 0.6795 0 4470534 0.0000 55 14831 219963432
Mode 0.5000 #N/A 0 0 0.0000 61 #N/A #N/A
Standard Deviation 0.1385 0.1967 37144751 23878272 0.4877 12 20754 1440646277
Sample Variance 0.0192 0.0387 1.37973E+15 5.70172E+14 0.237804878 139 430727510.5 2.07546E+18
Kurtosis -0.714 0.495 19.150 2.205 -1.754 -0.402 -0.212 4.043
Skewness 0.070 -1.300 4.230 1.846 0.578 0.243 0.905 1.911
Range 0.5796 0.6913 202656643 81619392 1 50 78953 6423951600
Minimum 0.1111 0.1639 0 0 0 30 1205 1452806
Maximum 0.6907 0.8552 202656643 81619392 1 80 80159 6425404407
Sum 15.1773 25.9259 485330698 588131518 15 2348 999125 41576695442
Count 41 41 41 41 41 41 41 41
Table 1.2 shows that the Skewness for World Cup Viewership is greater than 1, indicating
that the distribution on our data is far from symmetrical. Figure 1.1 shows a histogram in for World
Cup Viewership in 2010 by country, again revealing a right-skewed distribution due to a majority
countries having <10,000,000 viewers who watched a match for 20 or more consecutive minutes.
Figure 1.1 shows that there are a few outliers, Japan and Brazil, who each had over 100 million
viewers in 2010 causing us to create the interaction variable of Percentage viewership of a country
portraying the popularity of football by percentage of population in each nation.
RESULTS

To investigate empirically the economic determinants of success in FIFA World Cup, we
estimated a number of different regression models. In our model selection processes, we observed
a variety of issues and results from examining different combinations of variables. Equation (1)
below provides an overview of the model which involves all of the economic variables mentioned
in our data section that were used in previous studies and what we hypothesized would have a
strong relationship in winning percentage. Equation (1) was estimated using the Ordinary-Squares-
Least Squares technique:
= 0 + 1 + 2 + 3 + 4 + 5 ℎ + 6ℎ
where i indexes the countries in the sample. We first ran each independent variable individually to
test their significance on the dependent variable. The next step was adding each independent
variable one by one until we reached an equation with all independent variables included. This
resulted in an increase of the Adjusted R-square until we included average temperature, per capita
wealth, and dummy variable host.
Table 1. Regression Results
Note: *, **, and *** denote significance at the 10, 5, and 1% - levels respectively.
About 35% of the winning percentage for international football teams is explained by the
economic variables in the first regression. Note in Table 1, pctView, and popLatin are statistically
significant at the 5% level based on their respective t-statistics and p-value’s. Also note that
popEuro is statistically significant at the 1% level based on their respective t-statistic, suggesting
that this variable explains variation in winning percentage better than the population for countries
in Latin America.
The estimated coefficients can be interpreted as follows; for every country’s percentage
increase in World Cup match viewership, its football teams winning percentage increases by
0.213% while controlling for population increase in Latin America and Europe. If a country that is
located in Latin America can increase their population by 100,000 persons, its football teams
winning percentage increases by 0.001%, while controlling for percentage of viewership and
European population. Also, if a country that is located in Europe can increase their population by
100,000 persons, its football teams winning percentage increases by 0.0026%, while controlling
for percentage viewership and Latin American population. Our results indicated that Europe has a
stronger presence of football in their culture and therefore increases their chances on winning.
Variables Coefficients t Stat P-value
Intercept 0.1861961749 3.12696*** 0.00343
PctView 0.2132325629 2.27645** 0.02870
popLatin 0.0000000010 2.06675** 0.04581
PopEuro 0.0000000026 3.31413*** 0.00206
Adjusted R-Square = .34849

Table 2. Regression Results
Note: *, **, and *** denote significance at the 10, 5, and 1% - levels respectively.
Comparing regression results from Table 1 and Table 2, we observe that the Adjusted R-
Square has decreased to about 32% after adding the average temperature and per capita wealth of
each country, as well as the dummy variable host. Note in Table 2, host is not statistically significant
at any level based on their respective t-statistic and p-value. Also note that avgTemp, pcWealth,
and pcWealth2, are not statistically significant at any level based on their respective t-statistic and
p-value. This result indicates that countries that have hosted the FIFA World Cup in the past does
not have a strong impact on the winning percentage of a country’s football team. In contrast to
previous studies, the average temperature of a country throughout the year does not significantly
affect the performance of a country’s football team. Also, our results imply that the amount of per
capita wealth in each country does not have a strong relationship with the winning percentage of
their football team. Based on these results, we conclude the success of a country’s football team in
FIFA World Cup is mostly explained by the popularity of the sport in a country and its population
size rather than the average temperature, per capita wealth, and whether or not a country has hosted
a World Cup.
DISCUSSION
Variable Coefficients t Stat P-value
Intercept 0.2029085220 1.26147 0.21599
pctView 0.1589965703 1.40188 0.17029
popLatin 0.0000000013 2.23275** 0.03247
popEuro 0.0000000024 2.85661*** 0.00735
host -0.0376340053 -0.84699 0.40310
avgTemp -0.0004308493 -0.21082 0.83432
pcWealth 0.0000044548 1.16391 0.25281
pcWealth2 -0.0000000001 -1.01692 0.31659
Adjusted R-Square = .31466
Our results implty that the total percentage of a country’s population that watches a match
for 20 consecutive minutes or more has a strong association with the variation in winning
percentage. We also observe an interaction term between Latin American/European origin and
population size to be significant in our study, as reported. This implies that population size has no
impact on football performance if a country is not located in Latin America or Europe. The result
also indicates that the larger the population size for a country located in Latin America or Europe,
the higher winning percentage a country’s team will have, as football is a large part of the culture
in these countries. Increasing population is a benefit to these countries footballing success because
these people will more likely be engaged in football than any other sports, which would be the
opposite case in Olympics study, where a range of sports are concerned. (Bernard & Boose 2000).
If you are playing the odds in Vegas, you have a better chance of winning by picking a
country’s football team in Latin America or Europe. You will also increase your odds by picking a
team where soccer has a strong following within the country. Other researchers can use this
information to uncover the relationship between other sports and popularity. Governments can use
this information to identify how popularity of the sport within the country affects their team’s
football performance. With this information governments may choose to launch marketing
campaigns to improve the popularity of their football team which can lead to higher profits brought
into the country as well as creating other positive externalities, such as an increase in participation
with soccer therefore leading to a healthier population.
CONCLUSION

We derived our findings from an OLS multiple regression analysis. Our results can be
used to help explain the relationship between overall winning percentage and other socio-
economic variables. Our study has taken into account the past studies on both international
football success as well as Olympic success (Hoffman, et al). Previous studies have taken into
account specific football game statistics as well as other socioeconomic variables. However, the
past studies have not included popularity of the sport in countries that attracts the best talent,
coaches and resources. This study has shown that popularity, and the population size of countries
,which have a predisposed position to football in their culture, are more important than a
countries per capita wealth. Nations do not have to be in the best economic standing to have
experienced international football success in the FIFA World Cup. Future research could look
deeper into popularity and wealth variables to further prove this relationship.
SOURCES

Bernard, Andrew B., and Meghan R. Busse. "Who Wins The Olympic Games: Economic Resources
And Medal Totals." Review of Economics and Statistics 5.9 (): 413-417. Print.
Hoffmann, Robert, Lee Chew Ging, and Bala Ramasamy. "The Socio-Economic Determinants of
International Soccer Performance." Journal of Applied Economics V (): 253-272. Print.
Torgler, Benno. "'Historical Excellence' In Football World Cup Tournaments: Empirical Evidence With
Data From 1930 to 2002." Rivista di Diritto ed Economia dello Sport 2 (): 101-117. Print.