
Econometric benchmarking in the UK postal sector - Ofcom · Important Notice from Deloitte ......
68
Econometric benchmarking in the UK postal sector. Final report Non-confidential version 24 May 2016
Transcript of Econometric benchmarking in the UK postal sector - Ofcom · Important Notice from Deloitte ......
Econometric benchmarking in the UK postal sector.
Final report
Non-confidential version
24 May 2016
© 2016 Deloitte LLP 2
Contents Important Notice from Deloitte ................................................................................ 3
Executive Summary ................................................................................................ 4
1 Introduction ................................................................................................ 6
2 Methodology .............................................................................................. 8
3 Data .................................................................................................... 13
4 Delivery Office efficiency analysis ............................................................ 22
5 Mail Centre efficiency analysis ................................................................. 33
References .................................................................................................... 42
Technical Appendix .............................................................................................. 43
Econometric benchmarking in the UK postal sector
Econometric benchmarking in the UK postal sector
© 2016 Deloitte LLP 3
Important Notice from Deloitte
This final report (the “Final Report”) has been prepared by Deloitte LLP (“Deloitte”) for Ofcom in accordance with the contract with them dated 1st April 2015 (“the Contract”) and the contract variation order dated 29th October 2015, and on the basis of the scope and limitations set out below.
The Final Report has been prepared solely for the purposes of estimating the relative efficiency of Royal Mail’s Delivery Office and Mail Centre network, as set out in the Contract. It should not be used for any other purpose or in any other context, and Deloitte accepts no responsibility for its use in either regard, including its use by Ofcom for decision making or reporting to third parties.
The Final Report is provided exclusively for Ofcom’s use under the terms of the Contract. No party other than Ofcom is entitled to rely on the Final Report for any purpose whatsoever and Deloitte accepts no responsibility or liability or duty of care to any party other than Ofcom in respect of the Final Report or any of its contents.
As set out in the contract, the scope of our work has been limited by the time, information and explanations made available to us. The information contained in the Final Report has been obtained from Ofcom and third party sources that are clearly referenced in the appropriate sections of the Final Report. Deloitte has neither sought to corroborate this information nor to review its overall reasonableness. Further, any results from the analysis contained in the Final Report are reliant on the information available at the time of writing the Final Report and should not be relied upon in subsequent periods.
All copyright and other proprietary rights in the Final Report remain the property of Deloitte LLP and any rights not expressly granted in these terms or in the Contract are reserved.
Any decision to invest, conduct business, enter or exit the markets considered in the Final Report should be made solely on independent advice and no information in the Final Report should be relied upon in any way by any third party. This Final Report and its contents do not constitute financial or other professional advice, and specific advice should be sought about your specific circumstances. In particular, the Final Report does not constitute a recommendation or endorsement by Deloitte to invest or participate in, exit, or otherwise use any of the markets or companies referred to in it. To the fullest extent possible, both Deloitte and Ofcom disclaim any liability arising out of the use (or non-use) of the Final Report and its contents, including any action or decision taken as a result of such use (or non-use).
Econometric benchmarking in the UK postal sector
© 2016 Deloitte LLP 4
Executive Summary
In 2015, Ofcom announced a fundamental review of the regulation of Royal Mail to ensure that the regulation remains appropriate to secure the financial sustainability of the universal service. As part of this review, Ofcom wishes to understand Royal Mail’s historical achieved levels of efficiency improvement and its capacity to realise further efficiency savings.
This study carries out a cost benchmarking analysis with the aim of quantifying the relative efficiency of Royal Mail’s Delivery Office and Mail Centre network and assesses the scope for future efficiency savings. The cost benchmarking uses an econometrics framework, applying Stochastic Frontier Analysis, a well-established methodology within the UK regulated sectors. Data for the cost benchmarking was provided from 2010/11 to 2014/15 for Delivery Offices and 2012/13 to 2014/15 for Mail Centres.
Our key findings are:
• Royal Mail has achieved efficiency savings over recent years, most notably in the Mail Centre network where estimated average operational efficiency in terms of gross hours has improved by 8.8% over the last three years. Average operational efficiency for Delivery Offices is estimated to have improved by 5.8% since 2010/11 in terms of staff hours. When taking into account wage increases relative to the sector average, historical cost efficiency savings are estimated at 4.5% and 2.9% for Mail Centres and Delivery Offices respectively. These efficiency gains are likely to be largely explained by the modernisation programme implemented by Royal Mail since 2007/08.1 The greater savings estimated for Mail Centres are likely to reflect the larger proportion of processing activities that can be automated relative to delivery operations.
• Despite the historical efficiency improvements, differences in the relative efficiency of Royal Mail’s Delivery Offices and Mail Centres still remain. For instance, catch-up efficiency estimates range between 3.2% and 6.1% for Delivery Offices and 4.8% and 9.5% for Mail Centres across the various staff costs and hours models. These estimates measure the catch-up to the upper quartile of the efficiency distribution. Catch-up opportunities are significantly higher when measured against the upper decile or to the frontier.2
1 This programme is now largely complete, although continuous transformation within Royal Mail’s Mail Centres remains ongoing.
2 The catch-up to the frontier represents the efficiency savings that can be achieved if all operating units become as efficient as the most efficient operating unit. Conversely, the catch-up to the upper quartile and upper decile reflect the efficiency opportunities under the assumption that the benchmark is represented by the upper quartile and upper decile of the efficiency distribution. An operating unit represented by the upper quartile has an efficiency score which is higher than the score of 75% of the operating units. The upper decile reflects the top 10% of the most efficient operating units.
Econometric benchmarking in the UK postal sector
© 2016 Deloitte LLP 5
• The most conservative estimates suggest that Royal Mail could achieve total efficiency savings of 4.3% to 6.6% in the Delivery Office network and 5.2% to 9.9% in the Mail Centre operations over the next five years. The most stretching estimates found within the sensitivity analysis represent catch-up opportunities to the frontier and suggest scope for total efficiency improvements of up to c.15% in Mail Centres and 18% in Delivery Offices. The estimates implied by the frontier, however, may reflect the limitations of the benchmarking analysis, in particular the challenge of controlling for heterogeneity across Mail Centres and Delivery Offices.
The efficiency savings documented in this report are based on internal benchmarking and therefore reflect efficiency savings that could be achieved if all operating units become as efficient as the most efficient Royal Mail units. The analysis does not consider Royal Mail’s efficiency in relation to international benchmarks or the capacity for Royal Mail to realise efficiency gains through improvements in its best practices.
The main conclusion is that Royal Mail has achieved efficiency savings over the last five years, however, scope for further efficiency improvement remains.
Econometric benchmarking in the UK postal sector
© 2016 Deloitte LLP 6
1 Introduction
As the designated provider of the universal service under the Postal Services Act 2011, Royal Mail has a responsibility to provide postal services at an affordable, uniform tariff across all addresses within the UK.
In recent years, Royal Mail has experienced a significant decline in letter volumes, which has only been partially offset by a rise in the number of parcels (Royal Mail, 2014).3 The overall mail volume decline reflects the prominence of alternative communication technologies and electronic substitution.
In response to mail volume decline together with efforts to improve operational efficiency, Royal Mail has implemented a series of modernisation initiatives including automation in mail sequencing and revision of working methods; it has also consolidated its Mail Centre estate.
Background
In 2014 Royal Mail called upon Ofcom to undertake a review of end-to-end letter competition4 in the UK postal market and its implications for the sustainability of the universal postal service. Royal Mail argued that the expected expansion of the rival operator (Whistl) would undermine Royal Mail’s ability to reach sufficient profit margins and as a result put the sustainability of the universal service under threat.
In response to Royal Mail’s regulatory submission, Ofcom (2014) conducted a full review of end-to-end competition in the UK postal sector. The objective of this review was to assess the impact of increased competition in the delivery of letters on Royal Mail’s profitability and ultimately on the financial sustainability of the universal service network. Ofcom concluded that the evidence did not indicate that end-to-end letter competition presented a threat to Royal Mail’s ability to provide the universal postal service. It therefore decided that there were no grounds to impose regulatory conditions on Whistl’s end-to-end letter competition. However, Ofcom recognised that there was uncertainty around Royal Mail’s future financial position and that regulatory actions may be needed in the future. Ofcom noted that, to a significant extent, this uncertainty arose from factors other than end-to-end competition, including Royal Mail’s ability to reduce its costs and deliver efficiency savings.
Following Whistl’s exit from the end-to-end letters market in 2015 and in light of other developments in the postal sector since 2012, Ofcom (2015) announced a fundamental review of the regulation of Royal Mail to ensure that this remains appropriate and sufficient to secure the financial sustainability of the universal service.
3 Parcels require proportionally greater resources to process and deliver relative to letters. 4 End-to-end letter competition occurs when an operator other than Royal Mail collects, processes and
delivers mail directly to the recipient in direct competition with Royal Mail, without the need to use Royal Mail’s network.
Econometric benchmarking in the UK postal sector
© 2016 Deloitte LLP 7
Scope
In light of the above, Ofcom is interested to understand:
• Royal Mail’s historical achieved levels of efficiency improvement; and
• Royal Mail’s capacity to realise further increases in efficiency.
This study carries out an econometric analysis and estimates the relative efficiency of Royal Mail’s:
i) Delivery Offices (DOs): Operational units where mail is sorted and is then delivered to recipients; and
ii) Mail Centres (MCs): These facilities undertake two functions. First they operate as outward Mail Centres, whereby mail collected in a local area is processed and sorted to be dispatched to other MCs. Second, they act as inward Mail Centres, receiving mail from other areas for distribution to DOs.
The analysis carried out in this study represents an internal benchmarking exercise in that it benchmarks performance against Royal Mail’s most efficient DO or MC; it therefore estimates the efficiency savings that can be achieved if all DOs or MCs become as efficient as the most efficient operating units at Royal Mail. The analysis does not consider Royal Mail’s efficiency in relation to international benchmarks, or the capacity for Royal Mail to realise efficiency gains through improvements in its best practices.
The remainder of this report is organised as follows:
• Section 2 sets out the econometric methodology employed;
• Section 3 describes the data used in the analysis;
• Sections 4 and 5 present the results of the econometric benchmarking for DOs and MCs respectively.
Econometric benchmarking in the UK postal sector
© 2016 Deloitte LLP 8
2 Methodology
Efficiency benchmarking in its simplest form involves a comparison of the cost of delivering or processing one unit of mail across operating units. However, DOs operate in different environments and are subject to a number of exogenous factors that may lead to differences in operating costs, for example different mail mix5 and geography. Similarly, there might be a number of exogenous factors that affect the cost performance of MCs such as mail composition and the degree of remoteness. If this heterogeneity between operating units is not taken into account, differences in operating costs cannot be attributed to differences in efficiency. The primary challenge of measuring efficiency is therefore to control for these exogenous factors; this is achieved through the use of econometric techniques.6
The econometric model is estimated within a Stochastic Frontier Analysis (SFA) framework; this has been undertaken separately for DOs and MCs. SFA involves the specification of an econometric model of staff costs or hours that controls for factors which are determined to be beyond the control of the DO. Further detail on the econometric estimation is provided in Figure 1.
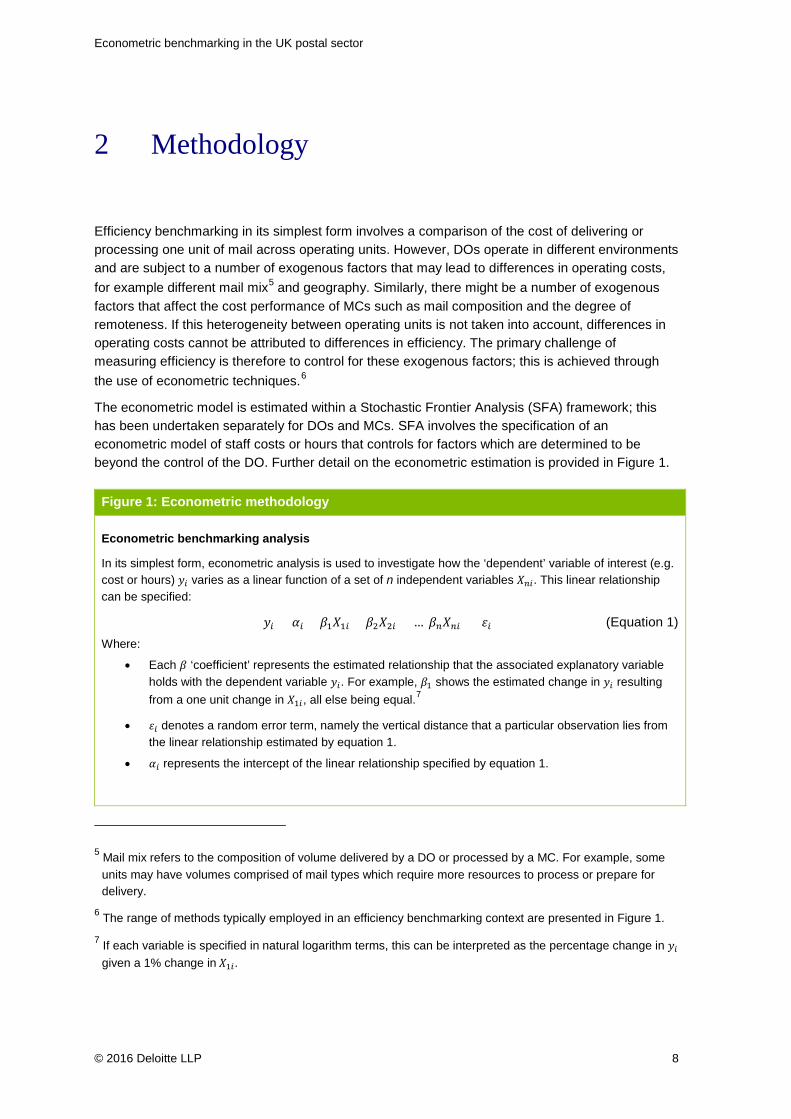
Figure 1: Econometric methodology
Econometric benchmarking analysis
In its simplest form, econometric analysis is used to investigate how the ‘dependent’ variable of interest (e.g. cost or hours) 𝑦𝑦𝑖𝑖 varies as a linear function of a set of n independent variables 𝑋𝑋𝑛𝑛𝑖𝑖. This linear relationship can be specified:
𝑦𝑦𝑖𝑖 = 𝛼𝛼𝑖𝑖 + 𝛽𝛽1𝑋𝑋1𝑖𝑖 + 𝛽𝛽2𝑋𝑋2𝑖𝑖 + … 𝛽𝛽𝑛𝑛𝑋𝑋𝑛𝑛𝑖𝑖 + 𝜀𝜀𝑖𝑖 (Equation 1) Where:
• Each 𝛽𝛽 ‘coefficient’ represents the estimated relationship that the associated explanatory variable holds with the dependent variable 𝑦𝑦𝑖𝑖. For example, 𝛽𝛽1 shows the estimated change in 𝑦𝑦𝑖𝑖 resulting from a one unit change in 𝑋𝑋1𝑖𝑖, all else being equal.7
• 𝜀𝜀𝑖𝑖 denotes a random error term, namely the vertical distance that a particular observation lies from the linear relationship estimated by equation 1.
• 𝛼𝛼𝑖𝑖 represents the intercept of the linear relationship specified by equation 1.
5 Mail mix refers to the composition of volume delivered by a DO or processed by a MC. For example, some units may have volumes comprised of mail types which require more resources to process or prepare for delivery.
6 The range of methods typically employed in an efficiency benchmarking context are presented in Figure 1.
7 If each variable is specified in natural logarithm terms, this can be interpreted as the percentage change in 𝑦𝑦𝑖𝑖 given a 1% change in 𝑋𝑋1𝑖𝑖.
Econometric benchmarking in the UK postal sector
© 2016 Deloitte LLP 9
Figure 1: Econometric methodology Intuitively, the model predictions provide an estimate of the expected cost for each operating unit (e.g. DO or MC) given these determinants. The difference (𝜀𝜀𝑖𝑖) between the cost predicted by the model and the observed cost is then used to infer the relative efficiency of each operating unit.
Stochastic Frontier Analysis (SFA)
SFA is based on the premise that it is unreasonable to expect the observed performance by one unit to be matched by all other DOs or MCs without taking into account modelling or data errors, referred to as ‘noise’. SFA therefore decomposes the error term into two components:
i) 𝑢𝑢𝑖𝑖𝑖𝑖 – Component quantifying the relative inefficiency of a DO or MC at time t
ii) 𝑣𝑣𝑖𝑖𝑖𝑖 − ‘Noise’ component of the error term
Given the availability of historical data, the method utilises a panel dataset which holds a number of observations both within a given period (cross-sectional dimension) and across a number of periods (time-series dimension). This allows for more accurate inference of parameters than cross-sectional methods due to the larger sample variability across both dimensions (Hsiao 2008). SFA is also chosen over pooled methods; observations over time for each DO and MC are likely to be correlated. It therefore appears inappropriate to consider observations for a particular DO or MC to be independent of other observations for the same DO or MC. The method also holds a number of advantages over other panel methods such as random effects, for example enhanced flexibility regarding the underlying distribution of efficiency scores.
Within this type of analysis, there exist a number of variants, including:
Trend specification: A linear trend or year dummies can be included in the model to capture frontier shifts. The advantage of the year dummy approach compared to the linear trend is that it is more flexible in that it allows for non-linear frontier shift.
Time-Varying Decay (TVD): A particular class of models can be estimated which allow the efficiency scores to vary over time (Battese-Coelli, 1992).
Battese-Coelli (1995) model: A class of SFA in which inefficiency can be modelled directly as a function of its potential sources, in this case for example the number of delivery points per route (a proxy for enhanced route optimisation).
Distributional assumptions: A number of possible underlying distributions of efficiency scores can be modelled. This study assumes a truncated normal, however half-normal or an exponential distribution can also be modelled. A half-normal distribution has been estimated to analyse the robustness of the results to the underlying shape of the efficiency score distribution chosen.
Econometric benchmarking in the UK postal sector
© 2016 Deloitte LLP 10
2.1 Model specification
What exogenous factors need to be controlled for?
A number of factors must be included in order to account for differences in efficiency driven by circumstances outside of management control. Variables that are driven by management decisions are omitted from the model and captured through the efficiency component.8 In this context, variables are included to account for exogenous differences in:
i) Scale and Volume: A DO that serves a larger number of delivery points, or processes mail for other DOs (Mail Processing Unit), is logically expected to incur greater staff costs and hours. By the same rationale, a MC that processes mail for a larger number of DOs would be expected to incur additional costs.
ii) Mail Mix: Variation in the proportion of mail types processed by different operating units drives staff cost and hours differences; this is because the various types of mail (e.g. letters and parcels) require different resources to process and prepare for delivery. A weighted volume (workload) measure is included to account for the time taken to process different mail types across DOs and MCs.
iii) Geography: Differences in staff costs or hours might originate from differences in rurality or remoteness of the area served. To account for density, the number of delivery points per area covered and the proportion of delivery points that are businesses are included within the DO equation. Similarly for MCs, the number of DOs per area, the arrival time of final dispatch (at an inward MC) and the arrival time of the final network vehicle (at the DO) are also included as proxies for rurality.9
2.2 Quantifying efficiency: Catch-up efficiency and frontier shift
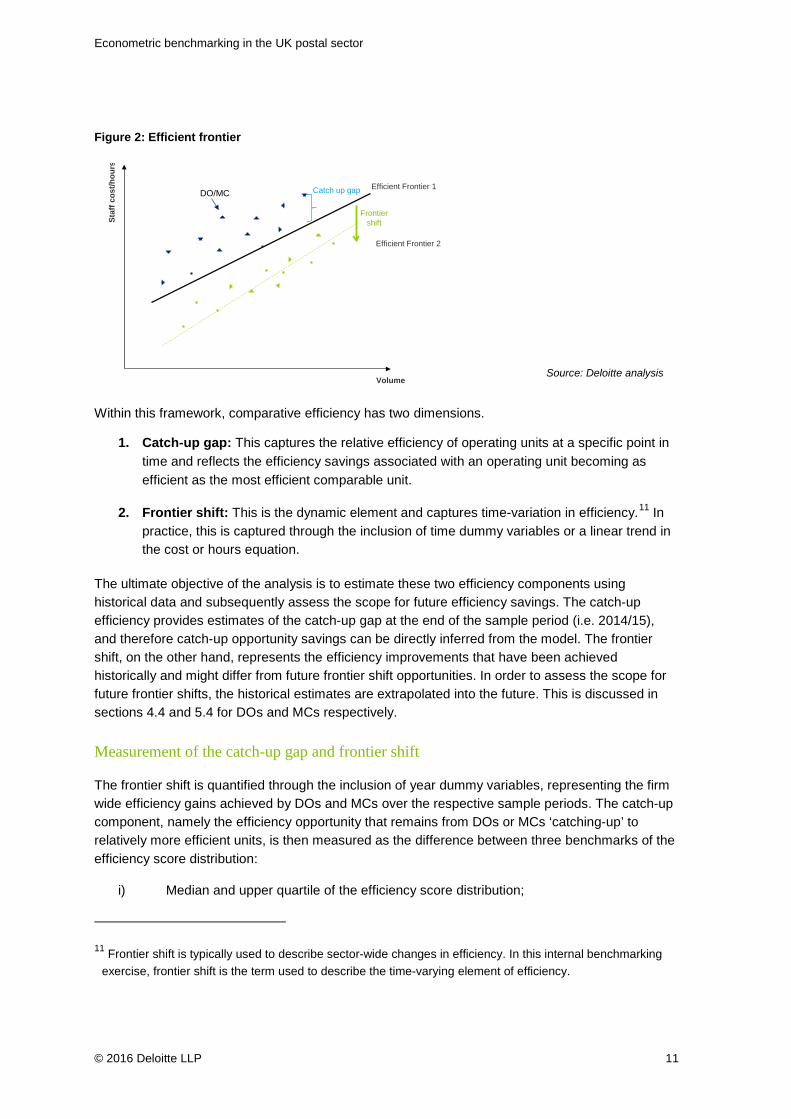
The objective of the analysis is to estimate the efficient frontier as illustrated in Figure 2. The frontier demonstrates the minimum cost or resource that is required to process and deliver different volumes of mail (all other factors being equal) and effectively reflects the cost-volume relationship of a fully efficient Royal Mail operating unit.10 With modernisation and technology improvements over time, operating units can become more efficient, leading to a downward shift in the efficient frontier.
8 In some circumstances it is difficult to determine whether a particular factor is endogenous or exogenous. For example, staff turnover may be influenced by management but also local labour market conditions. To account for this, the sensitivity of the results is examined across other assumptions and specifications.
9 A later final dispatch time is expected to occur with urban Mail Centres, due to lower time required to distribute inward mail. A later final network vehicle time would be associated with more rural MCs; this is likely due to the additional time taken to reach the relevant DO.
10 The frontier depicted in this example is linear, that is, it assumes constant returns to scale.
Econometric benchmarking in the UK postal sector
© 2016 Deloitte LLP 11
Figure 2: Efficient frontier
Within this framework, comparative efficiency has two dimensions.
1. Catch-up gap: This captures the relative efficiency of operating units at a specific point in time and reflects the efficiency savings associated with an operating unit becoming as efficient as the most efficient comparable unit.
2. Frontier shift: This is the dynamic element and captures time-variation in efficiency.11 In practice, this is captured through the inclusion of time dummy variables or a linear trend in the cost or hours equation.
The ultimate objective of the analysis is to estimate these two efficiency components using historical data and subsequently assess the scope for future efficiency savings. The catch-up efficiency provides estimates of the catch-up gap at the end of the sample period (i.e. 2014/15), and therefore catch-up opportunity savings can be directly inferred from the model. The frontier shift, on the other hand, represents the efficiency improvements that have been achieved historically and might differ from future frontier shift opportunities. In order to assess the scope for future frontier shifts, the historical estimates are extrapolated into the future. This is discussed in sections 4.4 and 5.4 for DOs and MCs respectively.
Measurement of the catch-up gap and frontier shift
The frontier shift is quantified through the inclusion of year dummy variables, representing the firm wide efficiency gains achieved by DOs and MCs over the respective sample periods. The catch-up component, namely the efficiency opportunity that remains from DOs or MCs ‘catching-up’ to relatively more efficient units, is then measured as the difference between three benchmarks of the efficiency score distribution:
i) Median and upper quartile of the efficiency score distribution;
11 Frontier shift is typically used to describe sector-wide changes in efficiency. In this internal benchmarking exercise, frontier shift is the term used to describe the time-varying element of efficiency.
Staf
f cos
t/hou
rs
Volume
Efficient Frontier 2
Efficient Frontier 1Catch up gapDO/MC
Frontier shift
Source: Deloitte analysis
Econometric benchmarking in the UK postal sector
© 2016 Deloitte LLP 12
ii) Median and upper decile; and
iii) Median and 99th percentile.
The median is considered in order to represent the potential relative efficiency improvement available to an average DO or MC. The catch-up gap remaining is represented by the difference in efficiency scores across these efficiency percentiles. The median DO is estimated to have an efficiency score that is equal to or greater than 50% of all other providers, whereas for those in the upper quartile, only 25% have efficiency scores that are higher.
The choice of the appropriate benchmark is typically determined on the basis of estimation uncertainty. For instance, Ofgem (2013) and Ofwat (2014) have previously used the upper quartile benchmark, recognising the estimation uncertainty stemming from the small number of comparators and estimation sample. Within the postal sector, Postcomm (2005) previously employed the upper decile benchmark in its analysis of Royal Mail DOs, an approach consistent with that used by Ofcom (2008) in relation to relative efficiency at British Telecom. In its 2015/16 national tariff efficiency assessment, Monitor (2015) also used this benchmark to estimate the efficiency opportunities of acute providers.
2.3 Sensitivity analysis
The degree to which econometric models are capable of isolating efficiency from variations in staff cost or hours driven by exogenous factors relies upon the type of variables that have been controlled for and the power of the econometric methodology. Whilst theory can determine a set of preferred modelling strategies, it is not possible to decide a single best approach. At the same time, econometric results could be sensitive to the underlying modelling features.
In order to examine the sensitivity of the results, a series of robustness checks have been performed. Further detail is provided in Appendix A4.
Econometric benchmarking in the UK postal sector
© 2016 Deloitte LLP 13
3 Data
3.1 Data description
Table 1 summarises the key data used in the analysis.12 Annual data covering the period 2010/11 to 2014/15 for DOs and 2012/13 to 2014/15 for MCs13 is disaggregated to obtain a number of observations against each individual DO and MC for each financial year. In addition, aggregated data for MCs was obtained over the last five years, where observations are recorded against Royal Mail’s entire MC estate for a given financial year. This data was used for the purposes of providing a high-level descriptive analysis.
Together with staff operating costs and hours, the key benchmarking metrics, several other variables were obtained to control for differences in volume, scale and environmental factors.14 As described in Section 2, this is necessary so that the efficiency factor estimated from the model represents actual efficiency opportunities, as opposed to differences in exogenous factors such as the rurality of the area served.
To evaluate the impact of DO and MC modernisation on Royal Mail’s efficiency, information on the start and completion dates of various modernisation programmes was obtained.
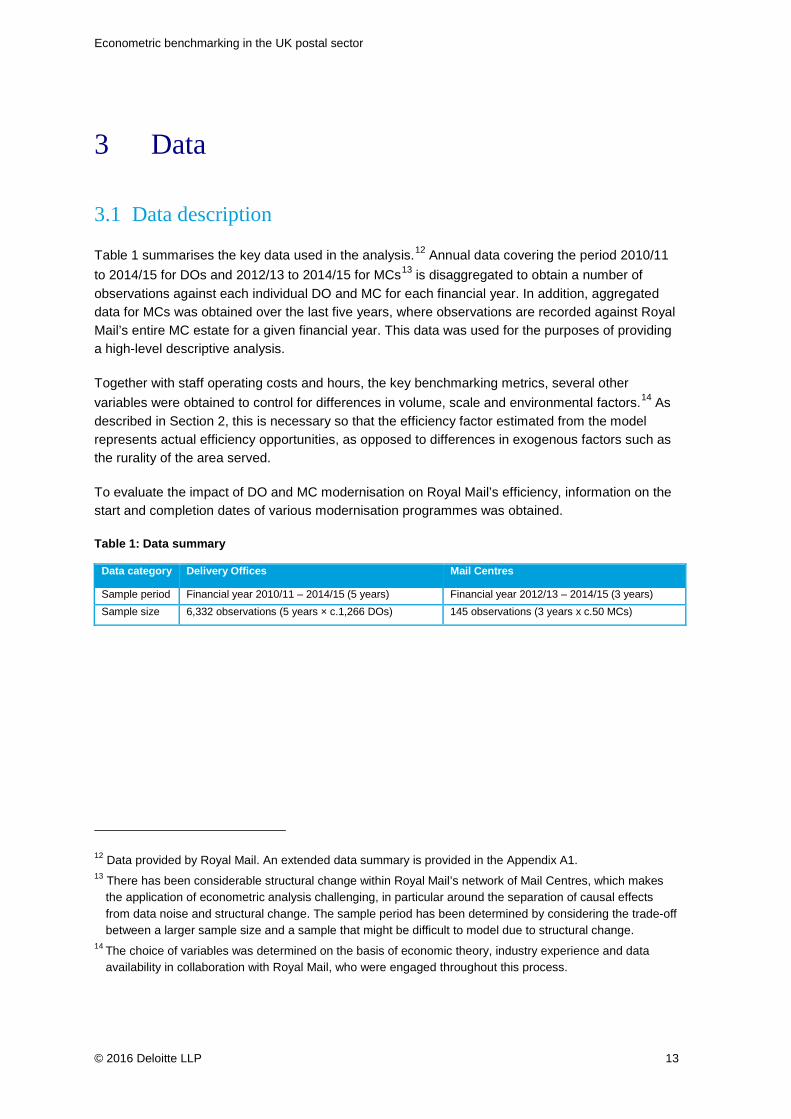
Table 1: Data summary
Data category Delivery Offices Mail Centres
Sample period Financial year 2010/11 – 2014/15 (5 years) Financial year 2012/13 – 2014/15 (3 years) Sample size 6,332 observations (5 years × c.1,266 DOs) 145 observations (3 years x c.50 MCs)
12 Data provided by Royal Mail. An extended data summary is provided in the Appendix A1. 13 There has been considerable structural change within Royal Mail’s network of Mail Centres, which makes
the application of econometric analysis challenging, in particular around the separation of causal effects from data noise and structural change. The sample period has been determined by considering the trade-off between a larger sample size and a sample that might be difficult to model due to structural change.
14 The choice of variables was determined on the basis of economic theory, industry experience and data availability in collaboration with Royal Mail, who were engaged throughout this process.
Econometric benchmarking in the UK postal sector
© 2016 Deloitte LLP 14
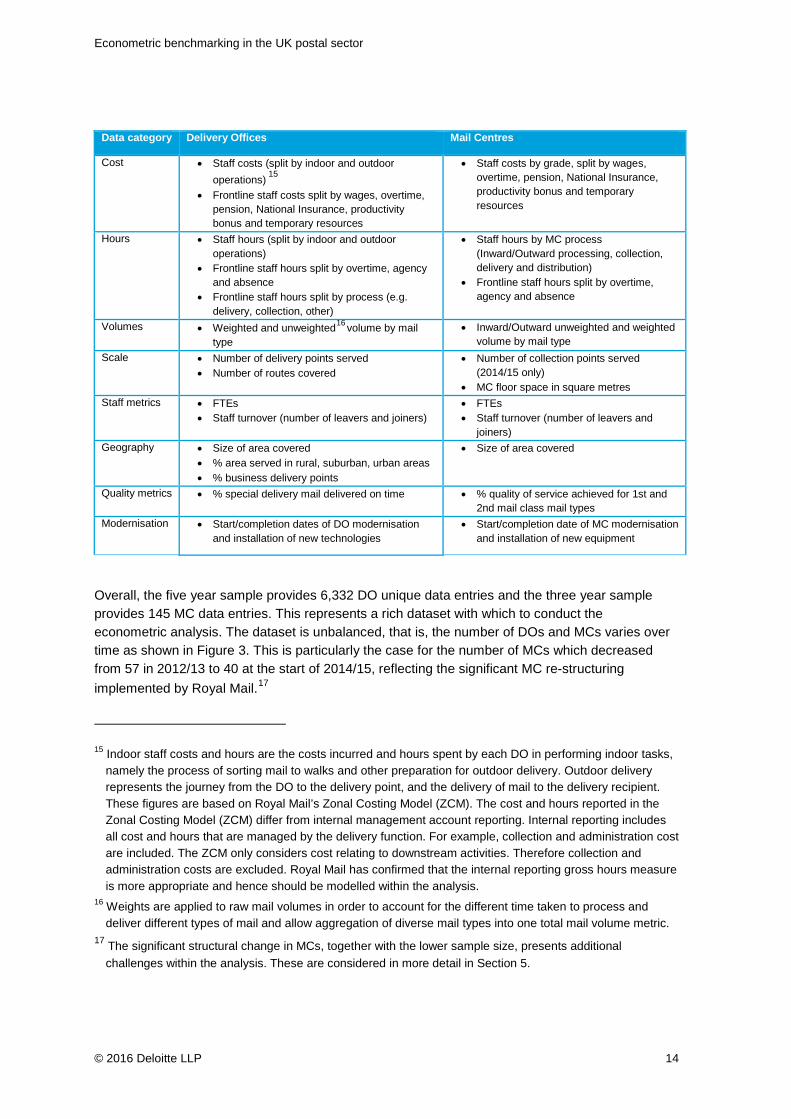
Data category Delivery Offices Mail Centres
Cost • Staff costs (split by indoor and outdoor operations) 15
• Frontline staff costs split by wages, overtime, pension, National Insurance, productivity bonus and temporary resources
• Staff costs by grade, split by wages, overtime, pension, National Insurance, productivity bonus and temporary resources
Hours • Staff hours (split by indoor and outdoor operations)
• Frontline staff hours split by overtime, agency and absence
• Frontline staff hours split by process (e.g. delivery, collection, other)
• Staff hours by MC process (Inward/Outward processing, collection, delivery and distribution)
• Frontline staff hours split by overtime, agency and absence
Volumes • Weighted and unweighted16 volume by mail type
• Inward/Outward unweighted and weighted volume by mail type
Scale • Number of delivery points served • Number of routes covered
• Number of collection points served (2014/15 only)
• MC floor space in square metres Staff metrics • FTEs
• Staff turnover (number of leavers and joiners) • FTEs • Staff turnover (number of leavers and
joiners) Geography • Size of area covered
• % area served in rural, suburban, urban areas • % business delivery points
• Size of area covered
Quality metrics • % special delivery mail delivered on time • % quality of service achieved for 1st and 2nd mail class mail types
Modernisation • Start/completion dates of DO modernisation and installation of new technologies
• Start/completion date of MC modernisation and installation of new equipment
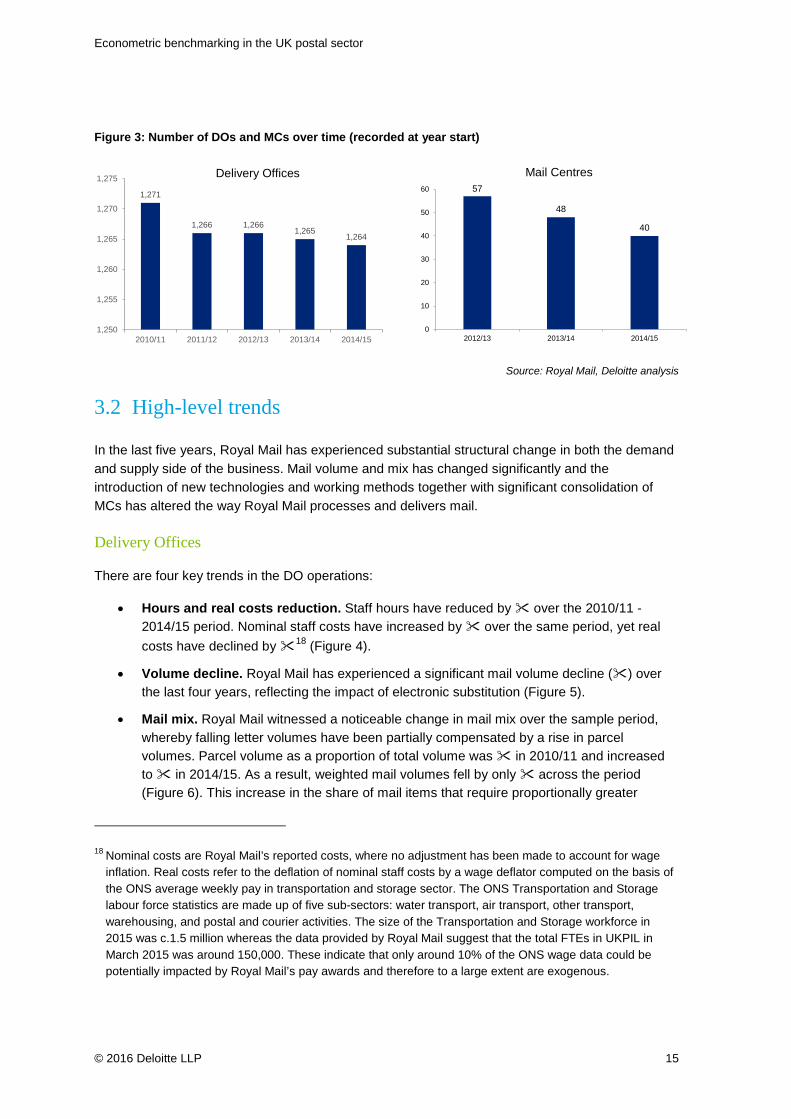
Overall, the five year sample provides 6,332 DO unique data entries and the three year sample provides 145 MC data entries. This represents a rich dataset with which to conduct the econometric analysis. The dataset is unbalanced, that is, the number of DOs and MCs varies over time as shown in Figure 3. This is particularly the case for the number of MCs which decreased from 57 in 2012/13 to 40 at the start of 2014/15, reflecting the significant MC re-structuring implemented by Royal Mail.17
15 Indoor staff costs and hours are the costs incurred and hours spent by each DO in performing indoor tasks,
namely the process of sorting mail to walks and other preparation for outdoor delivery. Outdoor delivery represents the journey from the DO to the delivery point, and the delivery of mail to the delivery recipient. These figures are based on Royal Mail’s Zonal Costing Model (ZCM). The cost and hours reported in the Zonal Costing Model (ZCM) differ from internal management account reporting. Internal reporting includes all cost and hours that are managed by the delivery function. For example, collection and administration cost are included. The ZCM only considers cost relating to downstream activities. Therefore collection and administration costs are excluded. Royal Mail has confirmed that the internal reporting gross hours measure is more appropriate and hence should be modelled within the analysis.
16 Weights are applied to raw mail volumes in order to account for the different time taken to process and deliver different types of mail and allow aggregation of diverse mail types into one total mail volume metric.
17 The significant structural change in MCs, together with the lower sample size, presents additional challenges within the analysis. These are considered in more detail in Section 5.
Econometric benchmarking in the UK postal sector
© 2016 Deloitte LLP 15
57
48
40
0
10
20
30
40
50
60
2012/13 2013/14 2014/15
Figure 3: Number of DOs and MCs over time (recorded at year start)
Source: Royal Mail, Deloitte analysis
3.2 High-level trends
In the last five years, Royal Mail has experienced substantial structural change in both the demand and supply side of the business. Mail volume and mix has changed significantly and the introduction of new technologies and working methods together with significant consolidation of MCs has altered the way Royal Mail processes and delivers mail.
Delivery Offices
There are four key trends in the DO operations:
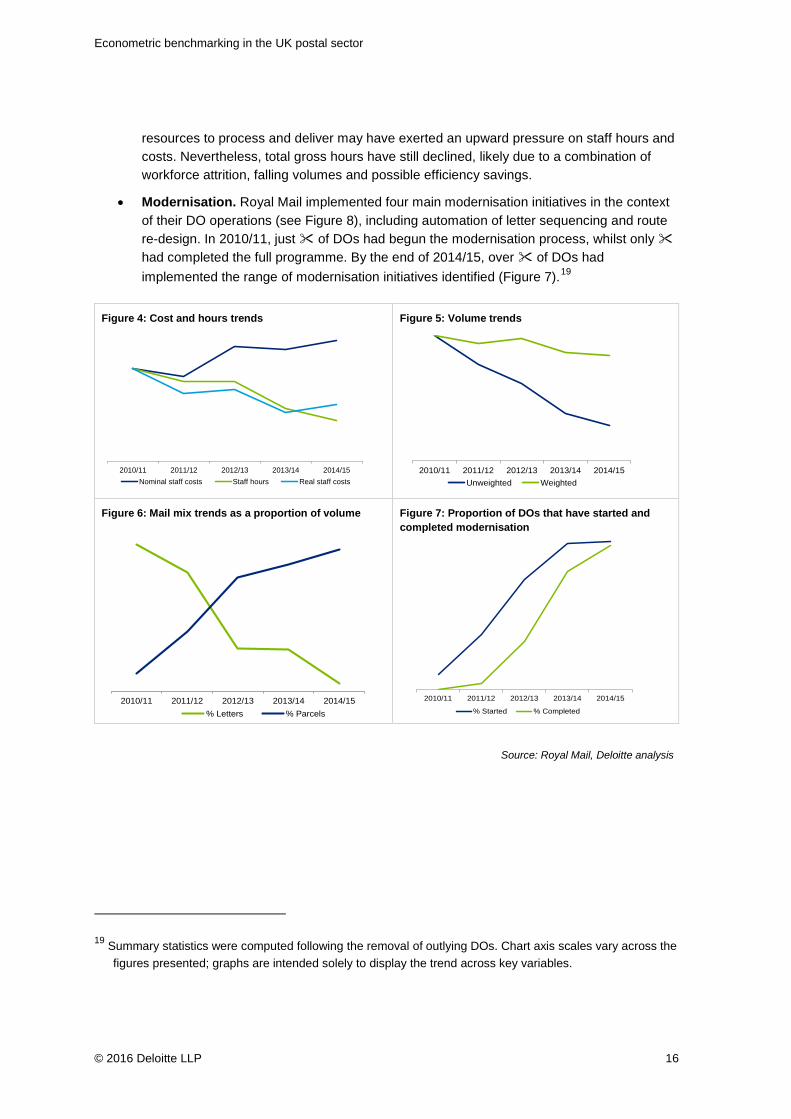
• Hours and real costs reduction. Staff hours have reduced by over the 2010/11 -2014/15 period. Nominal staff costs have increased by over the same period, yet real costs have declined by 18 (Figure 4).
• Volume decline. Royal Mail has experienced a significant mail volume decline () over the last four years, reflecting the impact of electronic substitution (Figure 5).
• Mail mix. Royal Mail witnessed a noticeable change in mail mix over the sample period, whereby falling letter volumes have been partially compensated by a rise in parcel volumes. Parcel volume as a proportion of total volume was in 2010/11 and increased to in 2014/15. As a result, weighted mail volumes fell by only across the period (Figure 6). This increase in the share of mail items that require proportionally greater
18 Nominal costs are Royal Mail’s reported costs, where no adjustment has been made to account for wage
inflation. Real costs refer to the deflation of nominal staff costs by a wage deflator computed on the basis of the ONS average weekly pay in transportation and storage sector. The ONS Transportation and Storage labour force statistics are made up of five sub-sectors: water transport, air transport, other transport, warehousing, and postal and courier activities. The size of the Transportation and Storage workforce in 2015 was c.1.5 million whereas the data provided by Royal Mail suggest that the total FTEs in UKPIL in March 2015 was around 150,000. These indicate that only around 10% of the ONS wage data could be potentially impacted by Royal Mail’s pay awards and therefore to a large extent are exogenous.
1,271
1,266 1,2661,265
1,264
1,250
1,255
1,260
1,265
1,270
1,275
2010/11 2011/12 2012/13 2013/14 2014/15
Delivery Offices Mail Centres
Econometric benchmarking in the UK postal sector
© 2016 Deloitte LLP 16
2010/11 2011/12 2012/13 2013/14 2014/15Unweighted Weighted
2010/11 2011/12 2012/13 2013/14 2014/15
% Started % Completed2010/11 2011/12 2012/13 2013/14 2014/15
% Letters % Parcels
resources to process and deliver may have exerted an upward pressure on staff hours and costs. Nevertheless, total gross hours have still declined, likely due to a combination of workforce attrition, falling volumes and possible efficiency savings.
• Modernisation. Royal Mail implemented four main modernisation initiatives in the context of their DO operations (see Figure 8), including automation of letter sequencing and route re-design. In 2010/11, just of DOs had begun the modernisation process, whilst only had completed the full programme. By the end of 2014/15, over of DOs had implemented the range of modernisation initiatives identified (Figure 7).19
Figure 4: Cost and hours trends
Figure 5: Volume trends
Figure 6: Mail mix trends as a proportion of volume
Figure 7: Proportion of DOs that have started and completed modernisation
19 Summary statistics were computed following the removal of outlying DOs. Chart axis scales vary across the figures presented; graphs are intended solely to display the trend across key variables.
2010/11 2011/12 2012/13 2013/14 2014/15Nominal staff costs Staff hours Real staff costs
Source: Royal Mail, Deloitte analysis
Econometric benchmarking in the UK postal sector
© 2016 Deloitte LLP 17
2010/11 2011/12 2012/13 2013/14 2014/15 2010/11 2011/12 2012/13 2013/14 2014/15
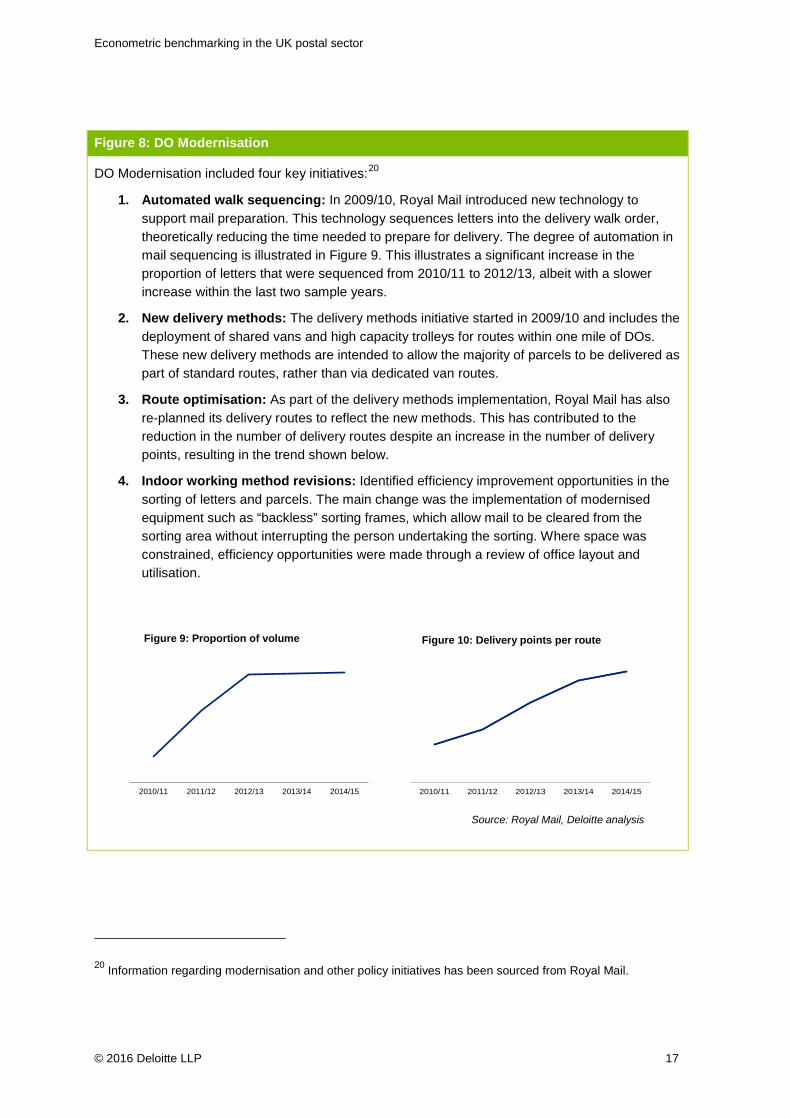
Figure 8: DO Modernisation
DO Modernisation included four key initiatives:20
1. Automated walk sequencing: In 2009/10, Royal Mail introduced new technology to support mail preparation. This technology sequences letters into the delivery walk order, theoretically reducing the time needed to prepare for delivery. The degree of automation in mail sequencing is illustrated in Figure 9. This illustrates a significant increase in the proportion of letters that were sequenced from 2010/11 to 2012/13, albeit with a slower increase within the last two sample years.
2. New delivery methods: The delivery methods initiative started in 2009/10 and includes the deployment of shared vans and high capacity trolleys for routes within one mile of DOs. These new delivery methods are intended to allow the majority of parcels to be delivered as part of standard routes, rather than via dedicated van routes.
3. Route optimisation: As part of the delivery methods implementation, Royal Mail has also re-planned its delivery routes to reflect the new methods. This has contributed to the reduction in the number of delivery routes despite an increase in the number of delivery points, resulting in the trend shown below.
4. Indoor working method revisions: Identified efficiency improvement opportunities in the sorting of letters and parcels. The main change was the implementation of modernised equipment such as “backless” sorting frames, which allow mail to be cleared from the sorting area without interrupting the person undertaking the sorting. Where space was constrained, efficiency opportunities were made through a review of office layout and utilisation.
20 Information regarding modernisation and other policy initiatives has been sourced from Royal Mail.
Source: Royal Mail, Deloitte analysis
Figure 9: Proportion of volume
Figure 10: Delivery points per route
Econometric benchmarking in the UK postal sector
© 2016 Deloitte LLP 18
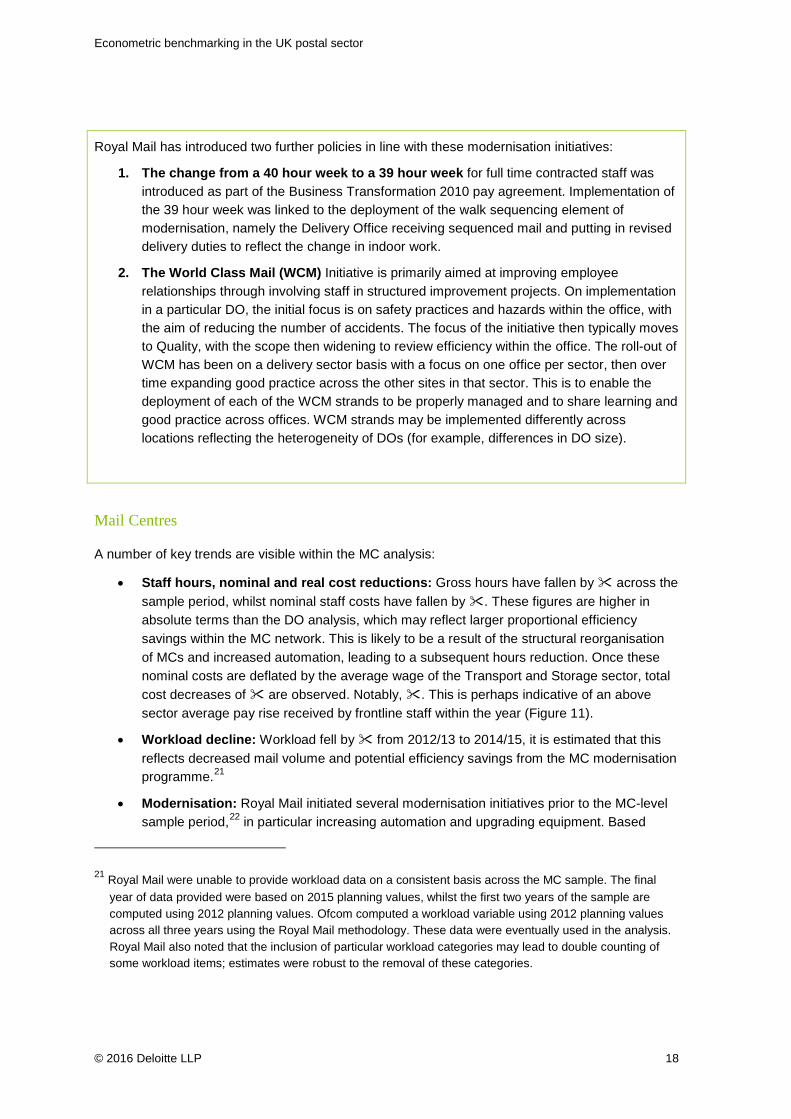
Royal Mail has introduced two further policies in line with these modernisation initiatives:
1. The change from a 40 hour week to a 39 hour week for full time contracted staff was introduced as part of the Business Transformation 2010 pay agreement. Implementation of the 39 hour week was linked to the deployment of the walk sequencing element of modernisation, namely the Delivery Office receiving sequenced mail and putting in revised delivery duties to reflect the change in indoor work.
2. The World Class Mail (WCM) Initiative is primarily aimed at improving employee relationships through involving staff in structured improvement projects. On implementation in a particular DO, the initial focus is on safety practices and hazards within the office, with the aim of reducing the number of accidents. The focus of the initiative then typically moves to Quality, with the scope then widening to review efficiency within the office. The roll-out of WCM has been on a delivery sector basis with a focus on one office per sector, then over time expanding good practice across the other sites in that sector. This is to enable the deployment of each of the WCM strands to be properly managed and to share learning and good practice across offices. WCM strands may be implemented differently across locations reflecting the heterogeneity of DOs (for example, differences in DO size).
Mail Centres
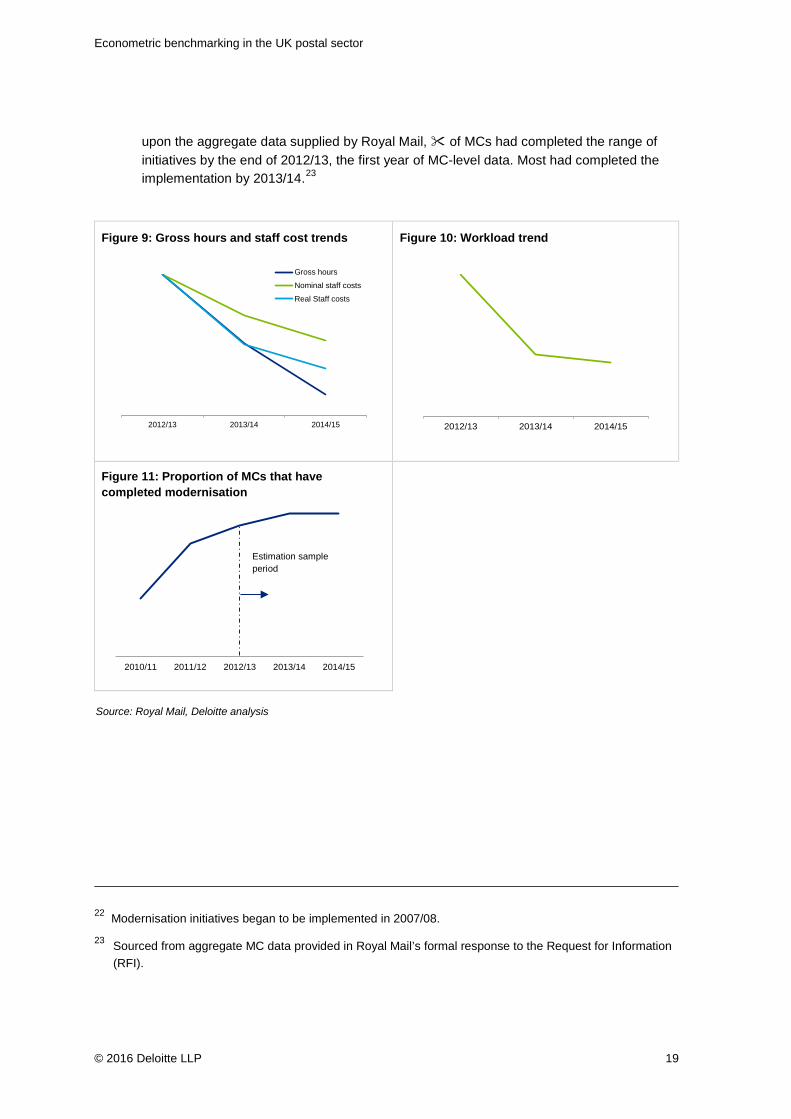
A number of key trends are visible within the MC analysis:
• Staff hours, nominal and real cost reductions: Gross hours have fallen by across the sample period, whilst nominal staff costs have fallen by . These figures are higher in absolute terms than the DO analysis, which may reflect larger proportional efficiency savings within the MC network. This is likely to be a result of the structural reorganisation of MCs and increased automation, leading to a subsequent hours reduction. Once these nominal costs are deflated by the average wage of the Transport and Storage sector, total cost decreases of are observed. Notably, . This is perhaps indicative of an above sector average pay rise received by frontline staff within the year (Figure 11).
• Workload decline: Workload fell by from 2012/13 to 2014/15, it is estimated that this reflects decreased mail volume and potential efficiency savings from the MC modernisation programme.21
• Modernisation: Royal Mail initiated several modernisation initiatives prior to the MC-level sample period,22 in particular increasing automation and upgrading equipment. Based
21 Royal Mail were unable to provide workload data on a consistent basis across the MC sample. The final year of data provided were based on 2015 planning values, whilst the first two years of the sample are computed using 2012 planning values. Ofcom computed a workload variable using 2012 planning values across all three years using the Royal Mail methodology. These data were eventually used in the analysis. Royal Mail also noted that the inclusion of particular workload categories may lead to double counting of some workload items; estimates were robust to the removal of these categories.
Econometric benchmarking in the UK postal sector
© 2016 Deloitte LLP 19
2012/13 2013/14 2014/15
Gross hours
Nominal staff costs
Real Staff costs
2012/13 2013/14 2014/15
2010/11 2011/12 2012/13 2013/14 2014/15
upon the aggregate data supplied by Royal Mail, of MCs had completed the range of initiatives by the end of 2012/13, the first year of MC-level data. Most had completed the implementation by 2013/14.23
Figure 9: Gross hours and staff cost trends
Figure 10: Workload trend
Figure 11: Proportion of MCs that have completed modernisation
22 Modernisation initiatives began to be implemented in 2007/08.
23 Sourced from aggregate MC data provided in Royal Mail’s formal response to the Request for Information (RFI).
Estimation sample period
Source: Royal Mail, Deloitte analysis
Econometric benchmarking in the UK postal sector
© 2016 Deloitte LLP 20
Figures 13 and 14: Percentage mechanised letters sequence sorted and letters walk sorted
2010/11 2011/12 2012/13 2013/14 2014/15
% Mechanised letters sequence sorted
2010/11 2011/12 2012/13 2013/14 2014/15% Letters walk sorted
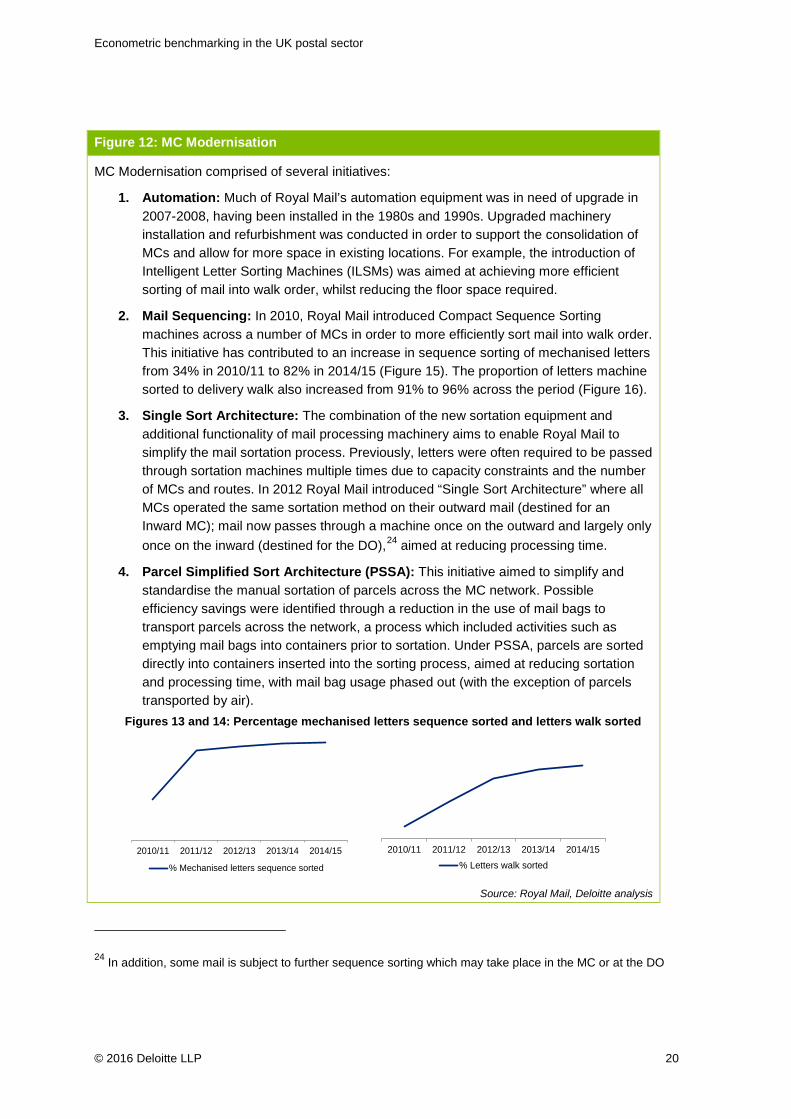
Figure 12: MC Modernisation
MC Modernisation comprised of several initiatives:
1. Automation: Much of Royal Mail’s automation equipment was in need of upgrade in 2007-2008, having been installed in the 1980s and 1990s. Upgraded machinery installation and refurbishment was conducted in order to support the consolidation of MCs and allow for more space in existing locations. For example, the introduction of Intelligent Letter Sorting Machines (ILSMs) was aimed at achieving more efficient sorting of mail into walk order, whilst reducing the floor space required.
2. Mail Sequencing: In 2010, Royal Mail introduced Compact Sequence Sorting machines across a number of MCs in order to more efficiently sort mail into walk order. This initiative has contributed to an increase in sequence sorting of mechanised letters from 34% in 2010/11 to 82% in 2014/15 (Figure 15). The proportion of letters machine sorted to delivery walk also increased from 91% to 96% across the period (Figure 16).
3. Single Sort Architecture: The combination of the new sortation equipment and additional functionality of mail processing machinery aims to enable Royal Mail to simplify the mail sortation process. Previously, letters were often required to be passed through sortation machines multiple times due to capacity constraints and the number of MCs and routes. In 2012 Royal Mail introduced “Single Sort Architecture” where all MCs operated the same sortation method on their outward mail (destined for an Inward MC); mail now passes through a machine once on the outward and largely only once on the inward (destined for the DO),24 aimed at reducing processing time.
4. Parcel Simplified Sort Architecture (PSSA): This initiative aimed to simplify and standardise the manual sortation of parcels across the MC network. Possible efficiency savings were identified through a reduction in the use of mail bags to transport parcels across the network, a process which included activities such as emptying mail bags into containers prior to sortation. Under PSSA, parcels are sorted directly into containers inserted into the sorting process, aimed at reducing sortation and processing time, with mail bag usage phased out (with the exception of parcels transported by air).
Source: Royal Mail, Deloitte analysis
24 In addition, some mail is subject to further sequence sorting which may take place in the MC or at the DO
Econometric benchmarking in the UK postal sector
© 2016 Deloitte LLP 21
Figure 12: MC Modernisation
MCs have also introduced two further policies in line with these modernisation initiatives:
1. The change from a 40 hour week to a 39 hour week for full time contracted staff was introduced as part of the Business Transformation 2010 pay agreement. By 2012/13, staff at only one MC remained on a 40 hour week.
2. The World Class Mail (WCM) Iniative is an approach which aims to improve safety, quality and performance across MCs.This was applied across all MCs scheduled to remain open after 2012/13. Fourteen MCs achieved ‘Bronze Standard’, a certification recognising the successful implementation of the programme based on key performance indicators.
Econometric benchmarking in the UK postal sector
© 2016 Deloitte LLP 22
4 Delivery Office efficiency analysis
This section discusses the results of the DO econometric benchmarking, focusing on the following findings:
i) Model coefficients;
ii) Catch-up gap and historical frontier shift estimates;
iii) Sensitivity analysis; and
iv) Scope for future efficiency savings.
In summary, the following key insights arise:
• The efficiency frontier for staff costs and gross hours is estimated to have shifted downwards (in the sense that Royal Mail’s DO network has become more efficient over time). These movements suggest efficiency savings of 2.9% and 5.8% respectively from 2010/11 to 2014/15. This is likely to reflect benefits yielded from the modernisation programme implemented by Royal Mail.
• Assuming the frontier shift is fully driven by modernisation initiatives, it is expected that Royal Mail will realise further frontier shifts in the next three years given that the impact of the modernisation programme has not fully been realised. It is estimated that Royal Mail has the potential to achieve another 1.6% frontier shift savings between 2015/16 and 2018/19 in terms of staff hours, based on assumptions regarding the lagged impact of modernisation.
• There is variation in the catch-up gap across DOs. DO efficiency scores vary from 60% to 100% (that is, there are DOs that are 40% less efficient than the most efficient unit, which has a score of 100%). The average catch-up efficiency score is c.80%, which implies that the average catch-up to the efficient frontier could be up to 20%.
• If the catch-up opportunity is assumed to be represented by the upper decile or quartile of the efficient score distribution, the average catch-up gaps are 11.0% and 6.1% respectively for staff costs.
• The catch-up gap is somewhat lower when gross hours are used (9.8% and 5.0% to the upper decile and quartile, respectively).
• The findings remain relatively consistent across alternative model specifications and estimation approaches, providing a degree of confidence in the robustness of the results presented.
• Overall, the most conservative estimates presented in this section suggest that Royal Mail could achieve total efficiency savings in DOs of 4.3% to 6.6% over the following five years, although this could be up to 18.1% at its most stretching.
Econometric benchmarking in the UK postal sector
© 2016 Deloitte LLP 23
4.1 Model coefficients
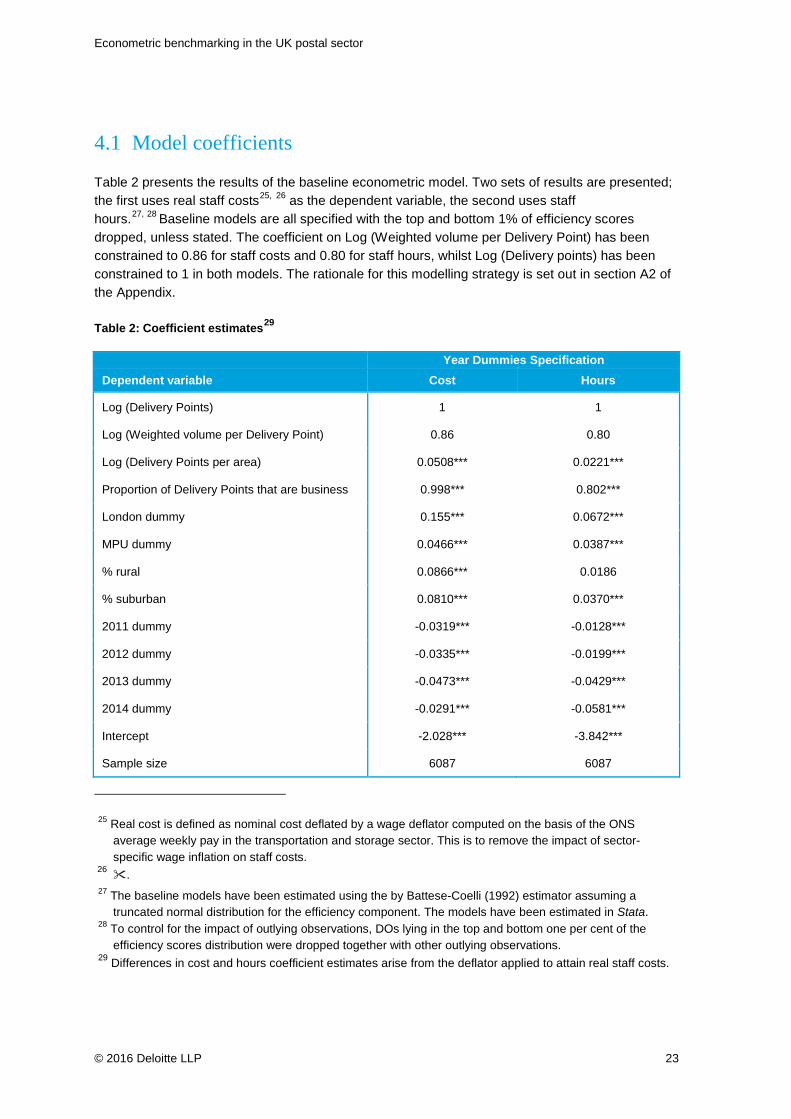
Table 2 presents the results of the baseline econometric model. Two sets of results are presented; the first uses real staff costs25,,26 as the dependent variable, the second uses staff hours.27, 28 Baseline models are all specified with the top and bottom 1% of efficiency scores dropped, unless stated. The coefficient on Log (Weighted volume per Delivery Point) has been constrained to 0.86 for staff costs and 0.80 for staff hours, whilst Log (Delivery points) has been constrained to 1 in both models. The rationale for this modelling strategy is set out in section A2 of the Appendix.
Table 2: Coefficient estimates29
Year Dummies Specification
Dependent variable Cost Hours
Log (Delivery Points) 1 1
Log (Weighted volume per Delivery Point) 0.86 0.80
Log (Delivery Points per area) 0.0508*** 0.0221***
Proportion of Delivery Points that are business 0.998*** 0.802***
London dummy 0.155*** 0.0672***
MPU dummy 0.0466*** 0.0387***
% rural 0.0866*** 0.0186
% suburban 0.0810*** 0.0370***
2011 dummy -0.0319*** -0.0128***
2012 dummy -0.0335*** -0.0199***
2013 dummy -0.0473*** -0.0429***
2014 dummy -0.0291*** -0.0581***
Intercept -2.028*** -3.842***
Sample size 6087 6087
25 Real cost is defined as nominal cost deflated by a wage deflator computed on the basis of the ONS
average weekly pay in the transportation and storage sector. This is to remove the impact of sector-specific wage inflation on staff costs.
26 . 27 The baseline models have been estimated using the by Battese-Coelli (1992) estimator assuming a
truncated normal distribution for the efficiency component. The models have been estimated in Stata. 28 To control for the impact of outlying observations, DOs lying in the top and bottom one per cent of the
efficiency scores distribution were dropped together with other outlying observations. 29 Differences in cost and hours coefficient estimates arise from the deflator applied to attain real staff costs.
Econometric benchmarking in the UK postal sector
© 2016 Deloitte LLP 24
Key: ***1% significance **5% significance *10% significance; Source: Deloitte analysis.
The model controls for a number of factors driving cost and hour differences across DOs.
• Scale: The number of delivery points serviced by each DO is included to account for differences in scale. The coefficient is constrained to have a unit relationship with both costs and hours.30 A binary variable representing whether the DO is a mail processing unit (MPU)31 is also included given the higher volumes serviced by these DOs. The results indicate a cost and hours uplift of and respectively if a DO is also an MPU.
• Mail Mix: Weighted volume per delivery point for each DO is included to account for differences in volume and mail mix across DOs. A 1% decrease in weighted volume per delivery point is constrained to decrease costs by 0.86% and hours by 0.80%.32
• Geography: Together with the number of delivery points per area, the proportion of delivery points that are business addresses and a binary variable for whether the DO is in London are included in the model. The proportion of the area served by a DO that is rural and suburban is also modelled to control for exogenous differences across DOs. Due to the collinearity33 between geography variables, it is not possible to draw direct inferences from these coefficient estimates.
• Year dummies: These are included to capture the frontier shifts. The results indicate a 2.9% reduction in staff costs and a 5.8% reduction in staff hours over the sample period, implying firm-wide improvements in efficiency.
4.2 Catch-up and frontier shift efficiency estimates
Catch-up estimates
The catch-up efficiency score distributions, as predicted by the baseline model for cost and hours, are shown in Figure 17. The distributions are similar across the two models, with both having a median efficiency score of approximately 80%.
30 A unit elasticity implies constant return to scales with regards to number of delivery points. The rationale
behind the constraint is set out in Appendix A2. 31 An MPU is a DO that sorts mail for delivery by other DOs as well as delivering mail itself. 32 The weighted volume effectively reflects workload or the time required to process a specific volume of mail
and is computed by multiplying a planning value (i.e. a weight) with the mail volume. Different planning values are used for different mail types on the basis of the expected time required to process and deliver one unit of mail. In principle, the coefficient of weighted mail should be equal to one. A coefficient different to one might indicate that there is a disparity between the estimated and actual time taken to process different mail types. The rationale behind the constraint is set out in Appendix A2.
33 Collinearity reflects shared trends and strong correlation between the variables of interest.
Econometric benchmarking in the UK postal sector
© 2016 Deloitte LLP 25
0.0%
1.0%
2.0%
3.0%
4.0%
5.0%
6.0%
7.0%
0.60 0.64 0.68 0.72 0.76 0.80 0.84 0.88 0.92 0.96 1.00
5.0%
9.8% 16.5%
81.0%Median UQ UD 99th
percentile
0.0%
1.0%
2.0%
3.0%
4.0%
5.0%
6.0%
7.0%
0.60 0.64 0.68 0.72 0.76 0.80 0.84 0.88 0.92 0.96 1.00
6.1%
11.0% 17.8%
79.4%Median UQ UD 99th
percentile
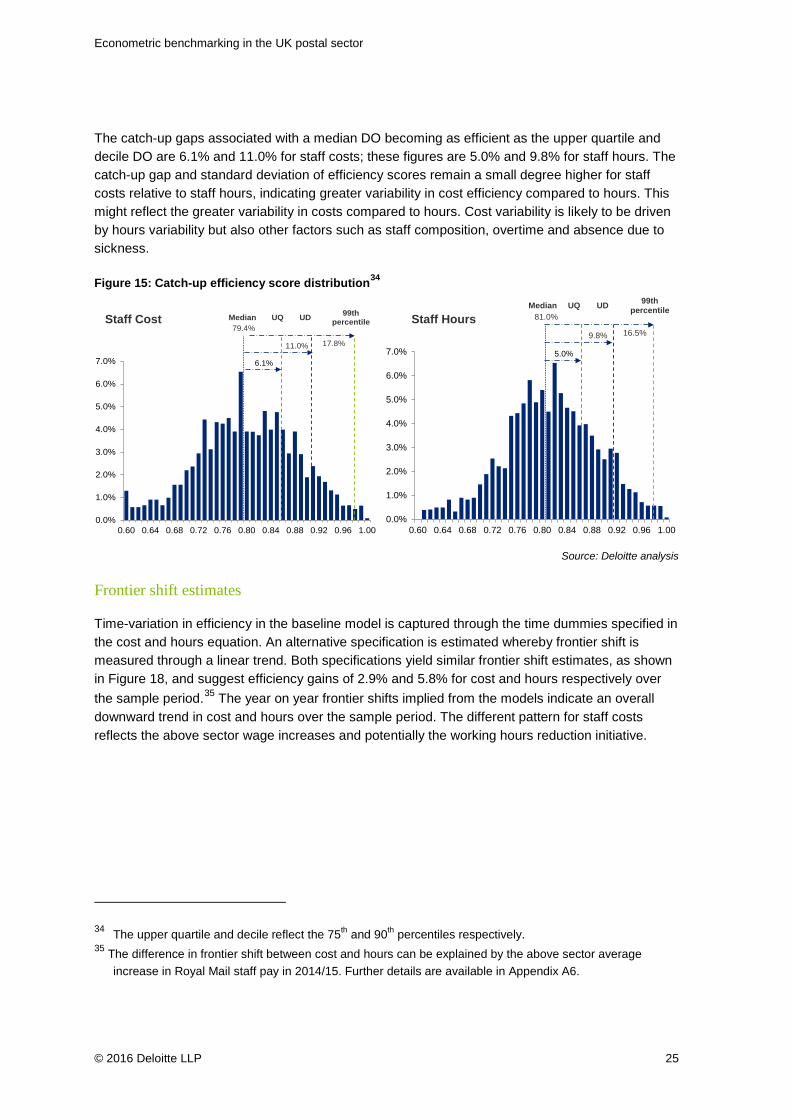
The catch-up gaps associated with a median DO becoming as efficient as the upper quartile and decile DO are 6.1% and 11.0% for staff costs; these figures are 5.0% and 9.8% for staff hours. The catch-up gap and standard deviation of efficiency scores remain a small degree higher for staff costs relative to staff hours, indicating greater variability in cost efficiency compared to hours. This might reflect the greater variability in costs compared to hours. Cost variability is likely to be driven by hours variability but also other factors such as staff composition, overtime and absence due to sickness.
Figure 15: Catch-up efficiency score distribution34
Source: Deloitte analysis
Frontier shift estimates
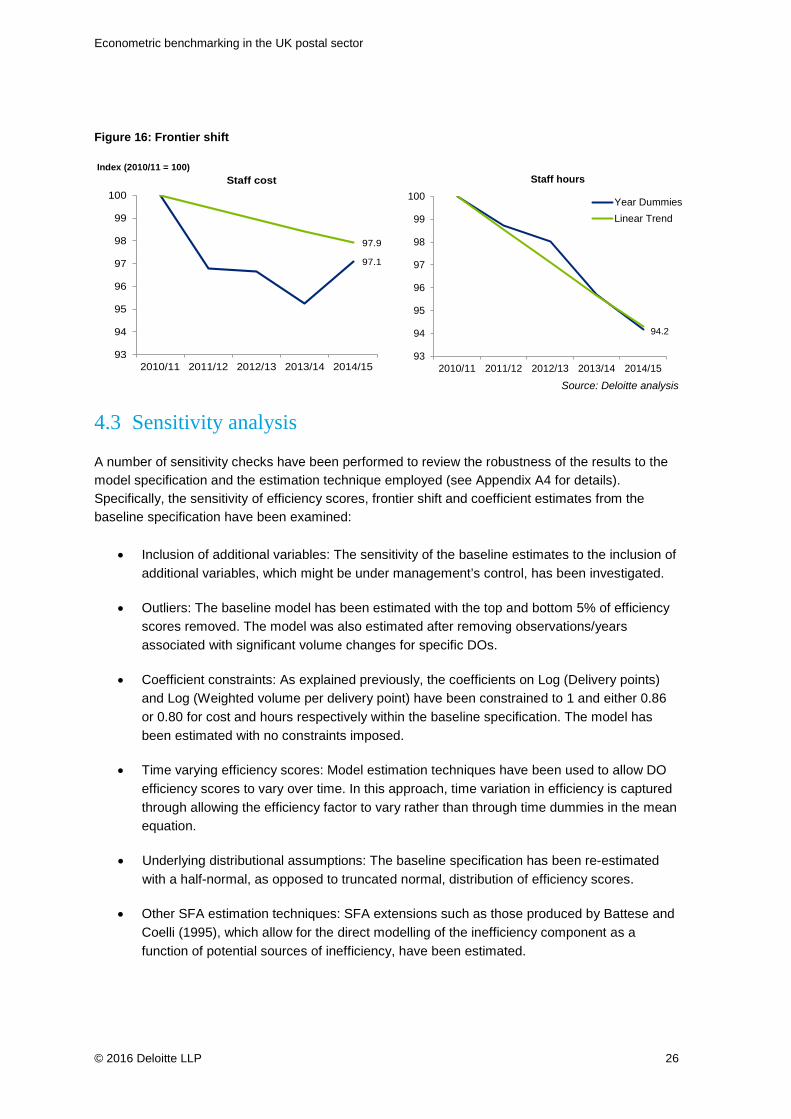
Time-variation in efficiency in the baseline model is captured through the time dummies specified in the cost and hours equation. An alternative specification is estimated whereby frontier shift is measured through a linear trend. Both specifications yield similar frontier shift estimates, as shown in Figure 18, and suggest efficiency gains of 2.9% and 5.8% for cost and hours respectively over the sample period.35 The year on year frontier shifts implied from the models indicate an overall downward trend in cost and hours over the sample period. The different pattern for staff costs reflects the above sector wage increases and potentially the working hours reduction initiative.
34 The upper quartile and decile reflect the 75th and 90th percentiles respectively. 35 The difference in frontier shift between cost and hours can be explained by the above sector average
increase in Royal Mail staff pay in 2014/15. Further details are available in Appendix A6.
Staff Cost Staff Hours
Econometric benchmarking in the UK postal sector
© 2016 Deloitte LLP 26
94.2
93
94
95
96
97
98
99
100
2010/11 2011/12 2012/13 2013/14 2014/15
Staff hours
Year DummiesLinear Trend
Figure 16: Frontier shift
Source: Deloitte analysis
4.3 Sensitivity analysis
A number of sensitivity checks have been performed to review the robustness of the results to the model specification and the estimation technique employed (see Appendix A4 for details). Specifically, the sensitivity of efficiency scores, frontier shift and coefficient estimates from the baseline specification have been examined:
• Inclusion of additional variables: The sensitivity of the baseline estimates to the inclusion of additional variables, which might be under management’s control, has been investigated.
• Outliers: The baseline model has been estimated with the top and bottom 5% of efficiency scores removed. The model was also estimated after removing observations/years associated with significant volume changes for specific DOs.
• Coefficient constraints: As explained previously, the coefficients on Log (Delivery points) and Log (Weighted volume per delivery point) have been constrained to 1 and either 0.86 or 0.80 for cost and hours respectively within the baseline specification. The model has been estimated with no constraints imposed.
• Time varying efficiency scores: Model estimation techniques have been used to allow DO efficiency scores to vary over time. In this approach, time variation in efficiency is captured through allowing the efficiency factor to vary rather than through time dummies in the mean equation.
• Underlying distributional assumptions: The baseline specification has been re-estimated with a half-normal, as opposed to truncated normal, distribution of efficiency scores.
• Other SFA estimation techniques: SFA extensions such as those produced by Battese and Coelli (1995), which allow for the direct modelling of the inefficiency component as a function of potential sources of inefficiency, have been estimated.
97.1
97.9
93
94
95
96
97
98
99
100
2010/11 2011/12 2012/13 2013/14 2014/15
Staff costIndex (2010/11 = 100)
Econometric benchmarking in the UK postal sector
© 2016 Deloitte LLP 27
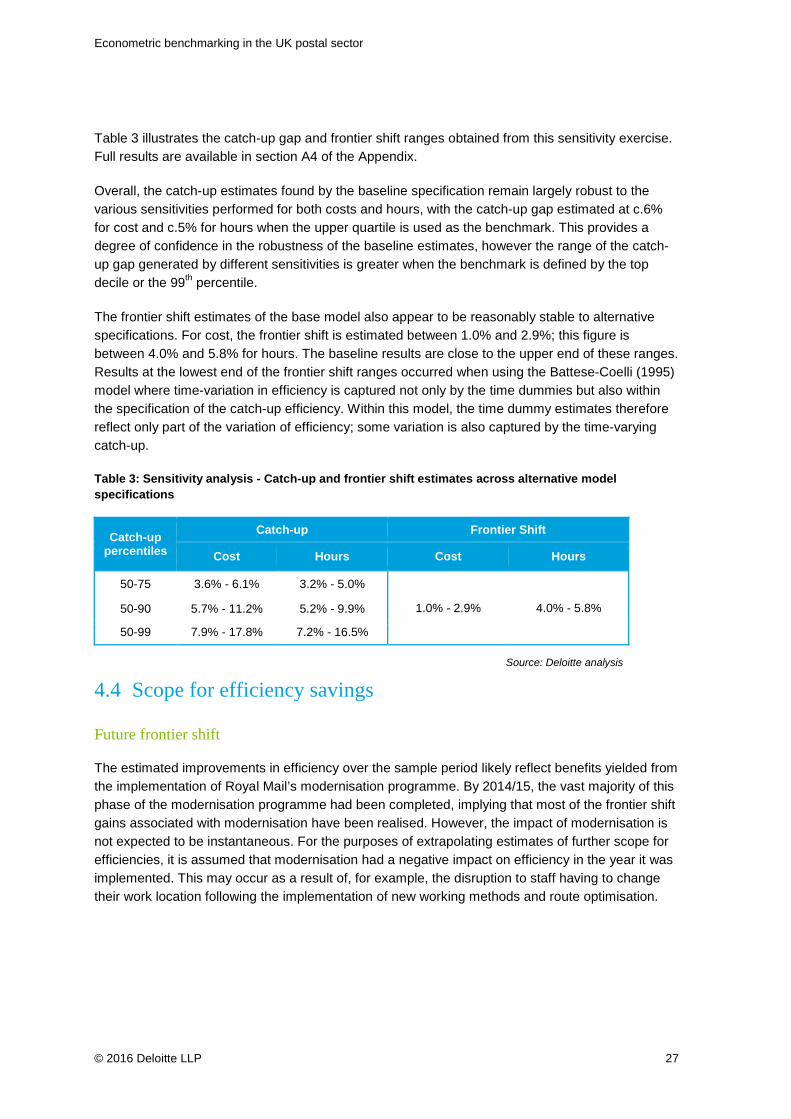
Table 3 illustrates the catch-up gap and frontier shift ranges obtained from this sensitivity exercise. Full results are available in section A4 of the Appendix.
Overall, the catch-up estimates found by the baseline specification remain largely robust to the various sensitivities performed for both costs and hours, with the catch-up gap estimated at c.6% for cost and c.5% for hours when the upper quartile is used as the benchmark. This provides a degree of confidence in the robustness of the baseline estimates, however the range of the catch-up gap generated by different sensitivities is greater when the benchmark is defined by the top decile or the 99th percentile.
The frontier shift estimates of the base model also appear to be reasonably stable to alternative specifications. For cost, the frontier shift is estimated between 1.0% and 2.9%; this figure is between 4.0% and 5.8% for hours. The baseline results are close to the upper end of these ranges. Results at the lowest end of the frontier shift ranges occurred when using the Battese-Coelli (1995) model where time-variation in efficiency is captured not only by the time dummies but also within the specification of the catch-up efficiency. Within this model, the time dummy estimates therefore reflect only part of the variation of efficiency; some variation is also captured by the time-varying catch-up.
Table 3: Sensitivity analysis - Catch-up and frontier shift estimates across alternative model specifications
Catch-up percentiles
Catch-up Frontier Shift Cost Hours Cost Hours
50-75 3.6% - 6.1% 3.2% - 5.0%
1.0% - 2.9% 4.0% - 5.8% 50-90 5.7% - 11.2% 5.2% - 9.9%
50-99 7.9% - 17.8% 7.2% - 16.5%
4.4 Scope for efficiency savings
Future frontier shift
The estimated improvements in efficiency over the sample period likely reflect benefits yielded from the implementation of Royal Mail’s modernisation programme. By 2014/15, the vast majority of this phase of the modernisation programme had been completed, implying that most of the frontier shift gains associated with modernisation have been realised. However, the impact of modernisation is not expected to be instantaneous. For the purposes of extrapolating estimates of further scope for efficiencies, it is assumed that modernisation had a negative impact on efficiency in the year it was implemented. This may occur as a result of, for example, the disruption to staff having to change their work location following the implementation of new working methods and route optimisation.
Source: Deloitte analysis
Econometric benchmarking in the UK postal sector
© 2016 Deloitte LLP 28
Furthermore, it is assumed that it takes up to two years following completion for the full impact of modernisation initiatives to be realised. 36
In this section, the expected frontier shift is estimated by extrapolating the impact of modernisation into the following years by considering:
1. The proportion of DOs that have completed modernisation by 2014/15; and
2. The time required for the full impact of modernisation to be realised.
Combining (1) and (2) above together with the 2010/11 - 2014/15 estimated frontier shift can provide an estimate of the full impact of modernisation and therefore an estimate of the effect that has not yet been realised (see Appendix section A3 for further details).
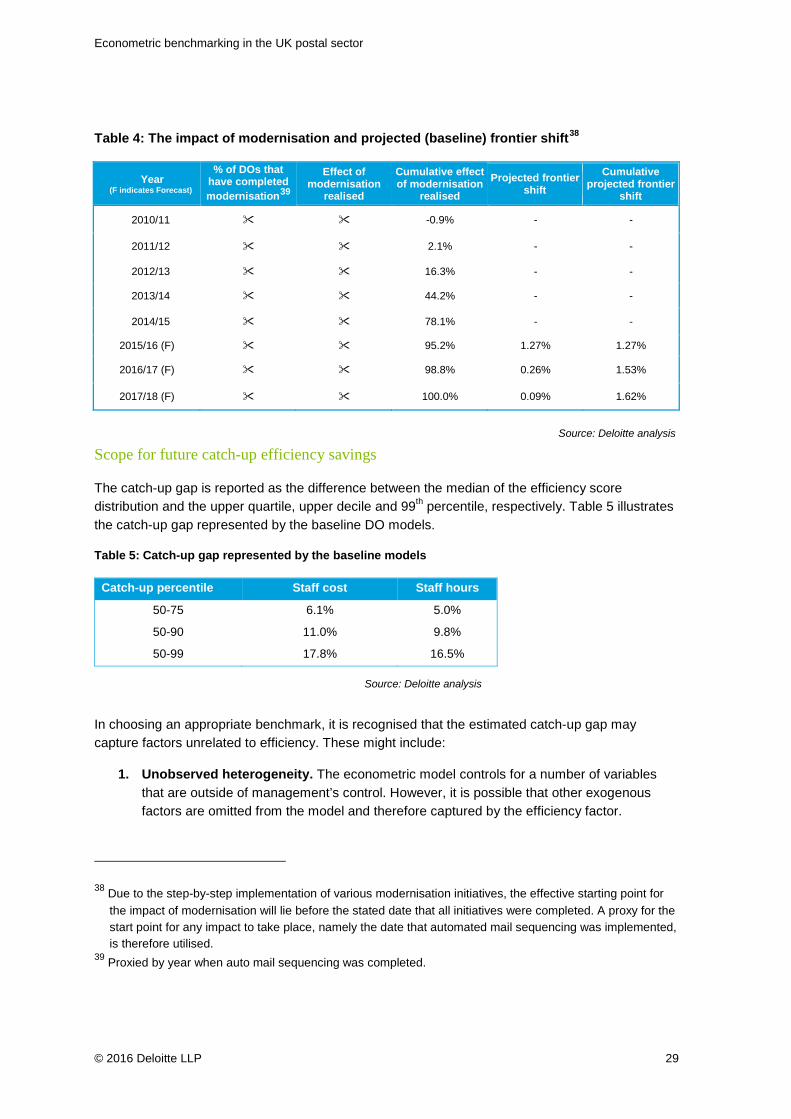
On this basis, it is estimated that 78% of the impact of modernisation had been realised at the end of the 2014/15 financial year. The remaining 22% impact of modernisation is expected to be fully realised within the next three years, which equates to a 1.6% frontier shift (See Table 4). 37
This result reflects efficiency savings in terms of staff hours; future frontier shift in terms of staff costs will depend on the magnitude of real wage increases. Moreover, these estimates rely on the assumption that:
• The historical frontier shift is fully attributed to the modernisation programme;
• All DOs complete modernisation by the end of 2015/16;
• The impact of modernisation is the same for the DOs modernised towards the end of sample period compared to the DOs for which the modernisation took place at the beginning of the sample period; and
• No additional efficiency initiatives that drive frontier shifts will be implemented in the following years.
36 .
37 These estimates are based upon the assumption discussed in this section and in the Appendix.
Econometric benchmarking in the UK postal sector
© 2016 Deloitte LLP 29
Table 4: The impact of modernisation and projected (baseline) frontier shift38
Year (F indicates Forecast)
% of DOs that have completed modernisation39
Effect of modernisation
realised
Cumulative effect of modernisation
realised
Projected frontier shift
Cumulative projected frontier
shift
2010/11 -0.9% - -
2011/12 2.1% - -
2012/13 16.3% - -
2013/14 44.2% - -
2014/15 78.1% - -
2015/16 (F) 95.2% 1.27% 1.27%
2016/17 (F) 98.8% 0.26% 1.53%
2017/18 (F) 100.0% 0.09% 1.62%
Scope for future catch-up efficiency savings
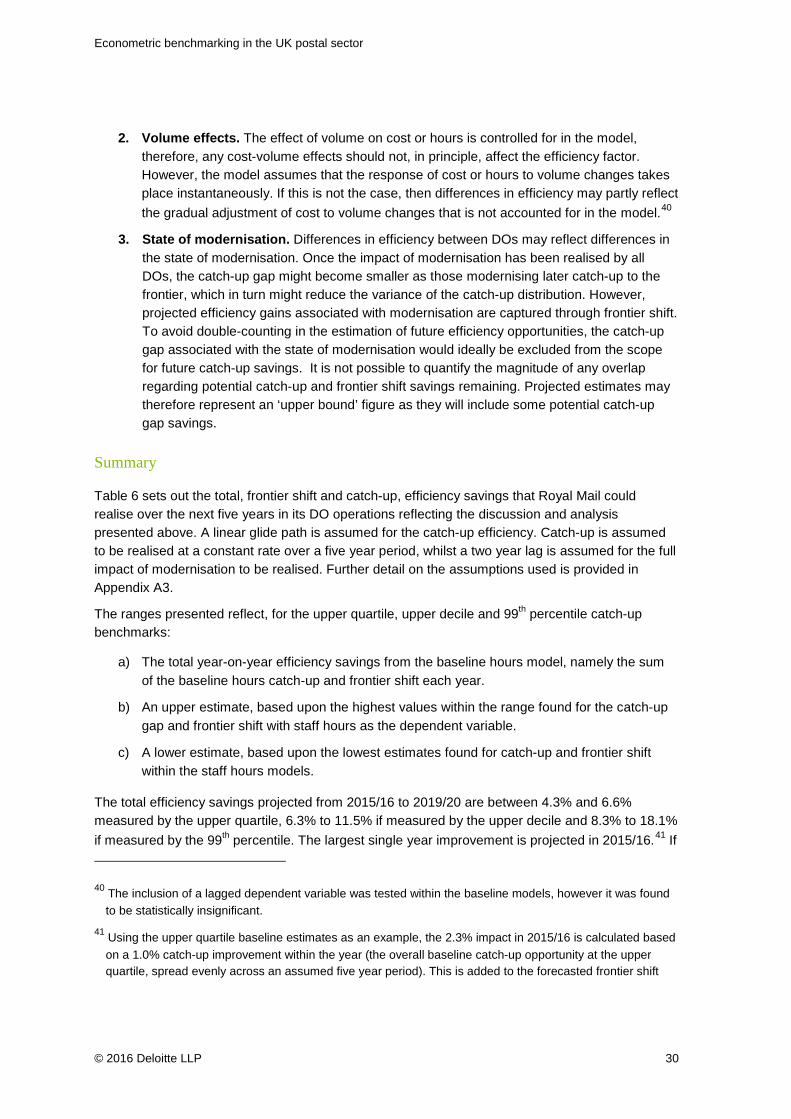
The catch-up gap is reported as the difference between the median of the efficiency score distribution and the upper quartile, upper decile and 99th percentile, respectively. Table 5 illustrates the catch-up gap represented by the baseline DO models.
Table 5: Catch-up gap represented by the baseline models
Catch-up percentile Staff cost Staff hours
50-75 6.1% 5.0%
50-90 11.0% 9.8%
50-99 17.8% 16.5%
In choosing an appropriate benchmark, it is recognised that the estimated catch-up gap may capture factors unrelated to efficiency. These might include:
1. Unobserved heterogeneity. The econometric model controls for a number of variables that are outside of management’s control. However, it is possible that other exogenous factors are omitted from the model and therefore captured by the efficiency factor.
38 Due to the step-by-step implementation of various modernisation initiatives, the effective starting point for the impact of modernisation will lie before the stated date that all initiatives were completed. A proxy for the start point for any impact to take place, namely the date that automated mail sequencing was implemented, is therefore utilised.
39 Proxied by year when auto mail sequencing was completed.
Source: Deloitte analysis
Source: Deloitte analysis
Econometric benchmarking in the UK postal sector
© 2016 Deloitte LLP 30
2. Volume effects. The effect of volume on cost or hours is controlled for in the model, therefore, any cost-volume effects should not, in principle, affect the efficiency factor. However, the model assumes that the response of cost or hours to volume changes takes place instantaneously. If this is not the case, then differences in efficiency may partly reflect the gradual adjustment of cost to volume changes that is not accounted for in the model.40
3. State of modernisation. Differences in efficiency between DOs may reflect differences in the state of modernisation. Once the impact of modernisation has been realised by all DOs, the catch-up gap might become smaller as those modernising later catch-up to the frontier, which in turn might reduce the variance of the catch-up distribution. However, projected efficiency gains associated with modernisation are captured through frontier shift. To avoid double-counting in the estimation of future efficiency opportunities, the catch-up gap associated with the state of modernisation would ideally be excluded from the scope for future catch-up savings. It is not possible to quantify the magnitude of any overlap regarding potential catch-up and frontier shift savings remaining. Projected estimates may therefore represent an ‘upper bound’ figure as they will include some potential catch-up gap savings.
Summary
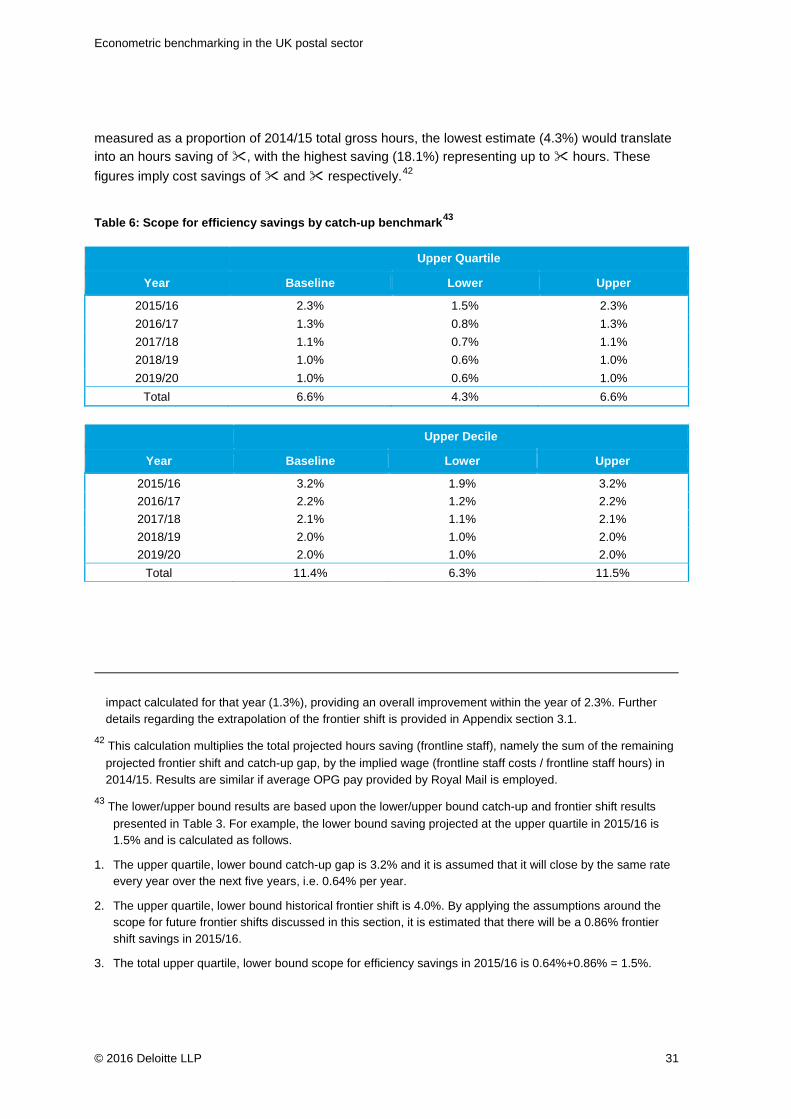
Table 6 sets out the total, frontier shift and catch-up, efficiency savings that Royal Mail could realise over the next five years in its DO operations reflecting the discussion and analysis presented above. A linear glide path is assumed for the catch-up efficiency. Catch-up is assumed to be realised at a constant rate over a five year period, whilst a two year lag is assumed for the full impact of modernisation to be realised. Further detail on the assumptions used is provided in Appendix A3.
The ranges presented reflect, for the upper quartile, upper decile and 99th percentile catch-up benchmarks:
a) The total year-on-year efficiency savings from the baseline hours model, namely the sum of the baseline hours catch-up and frontier shift each year.
b) An upper estimate, based upon the highest values within the range found for the catch-up gap and frontier shift with staff hours as the dependent variable.
c) A lower estimate, based upon the lowest estimates found for catch-up and frontier shift within the staff hours models.
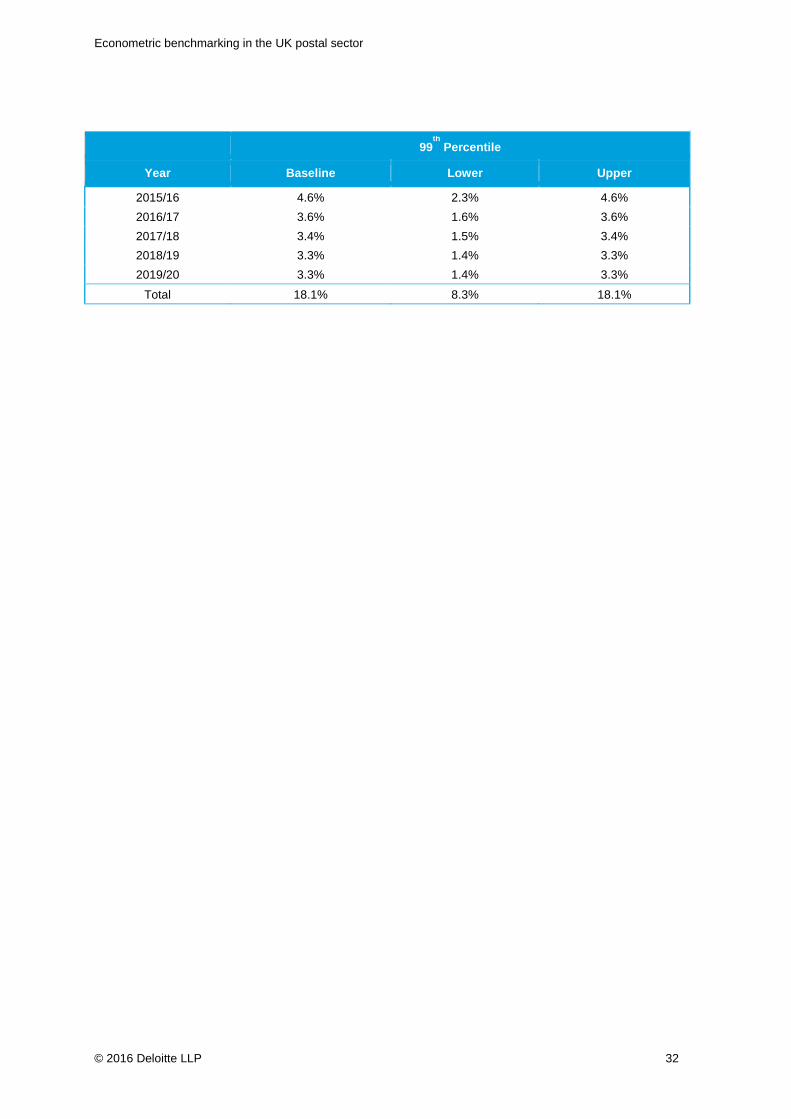
The total efficiency savings projected from 2015/16 to 2019/20 are between 4.3% and 6.6% measured by the upper quartile, 6.3% to 11.5% if measured by the upper decile and 8.3% to 18.1% if measured by the 99th percentile. The largest single year improvement is projected in 2015/16.41 If
40 The inclusion of a lagged dependent variable was tested within the baseline models, however it was found to be statistically insignificant.
41 Using the upper quartile baseline estimates as an example, the 2.3% impact in 2015/16 is calculated based on a 1.0% catch-up improvement within the year (the overall baseline catch-up opportunity at the upper quartile, spread evenly across an assumed five year period). This is added to the forecasted frontier shift
Econometric benchmarking in the UK postal sector
© 2016 Deloitte LLP 31
measured as a proportion of 2014/15 total gross hours, the lowest estimate (4.3%) would translate into an hours saving of , with the highest saving (18.1%) representing up to hours. These figures imply cost savings of and respectively.42
Table 6: Scope for efficiency savings by catch-up benchmark43 Upper Quartile
Year Baseline Lower Upper
2015/16 2.3% 1.5% 2.3% 2016/17 1.3% 0.8% 1.3% 2017/18 1.1% 0.7% 1.1% 2018/19 1.0% 0.6% 1.0% 2019/20 1.0% 0.6% 1.0%
Total 6.6% 4.3% 6.6% Upper Decile
Year Baseline Lower Upper
2015/16 3.2% 1.9% 3.2% 2016/17 2.2% 1.2% 2.2% 2017/18 2.1% 1.1% 2.1% 2018/19 2.0% 1.0% 2.0% 2019/20 2.0% 1.0% 2.0%
Total 11.4% 6.3% 11.5%
impact calculated for that year (1.3%), providing an overall improvement within the year of 2.3%. Further details regarding the extrapolation of the frontier shift is provided in Appendix section 3.1.
42 This calculation multiplies the total projected hours saving (frontline staff), namely the sum of the remaining projected frontier shift and catch-up gap, by the implied wage (frontline staff costs / frontline staff hours) in 2014/15. Results are similar if average OPG pay provided by Royal Mail is employed.
43 The lower/upper bound results are based upon the lower/upper bound catch-up and frontier shift results presented in Table 3. For example, the lower bound saving projected at the upper quartile in 2015/16 is 1.5% and is calculated as follows.
1. The upper quartile, lower bound catch-up gap is 3.2% and it is assumed that it will close by the same rate every year over the next five years, i.e. 0.64% per year.
2. The upper quartile, lower bound historical frontier shift is 4.0%. By applying the assumptions around the scope for future frontier shifts discussed in this section, it is estimated that there will be a 0.86% frontier shift savings in 2015/16.
3. The total upper quartile, lower bound scope for efficiency savings in 2015/16 is 0.64%+0.86% = 1.5%.
Econometric benchmarking in the UK postal sector
© 2016 Deloitte LLP 32
99th
Percentile
Year Baseline Lower Upper
2015/16 4.6% 2.3% 4.6% 2016/17 3.6% 1.6% 3.6% 2017/18 3.4% 1.5% 3.4% 2018/19 3.3% 1.4% 3.3% 2019/20 3.3% 1.4% 3.3%
Total 18.1% 8.3% 18.1%
Econometric benchmarking in the UK postal sector
© 2016 Deloitte LLP 33
5 Mail Centre efficiency analysis
This section discusses the results of the MC econometric benchmarking, which are summarised below:
• The efficient frontier for staff costs and hours is estimated to have shifted downwards, indicating savings of 4.5% and 8.8% respectively from 2012/13 to 2014/15. This is likely to be largely explained by benefits yielded from the modernisation programme implemented by Royal Mail.
• Given most MCs had completed the range of initiatives by 2013/14, it is anticipated that only one year of additional frontier shift, of magnitude 0.4%, is still to take place under the assumption that no further modernisation initiatives will take place. This analysis assumes that frontier shift movements are driven purely by the modernisation programme, with movements measured in terms of hours.
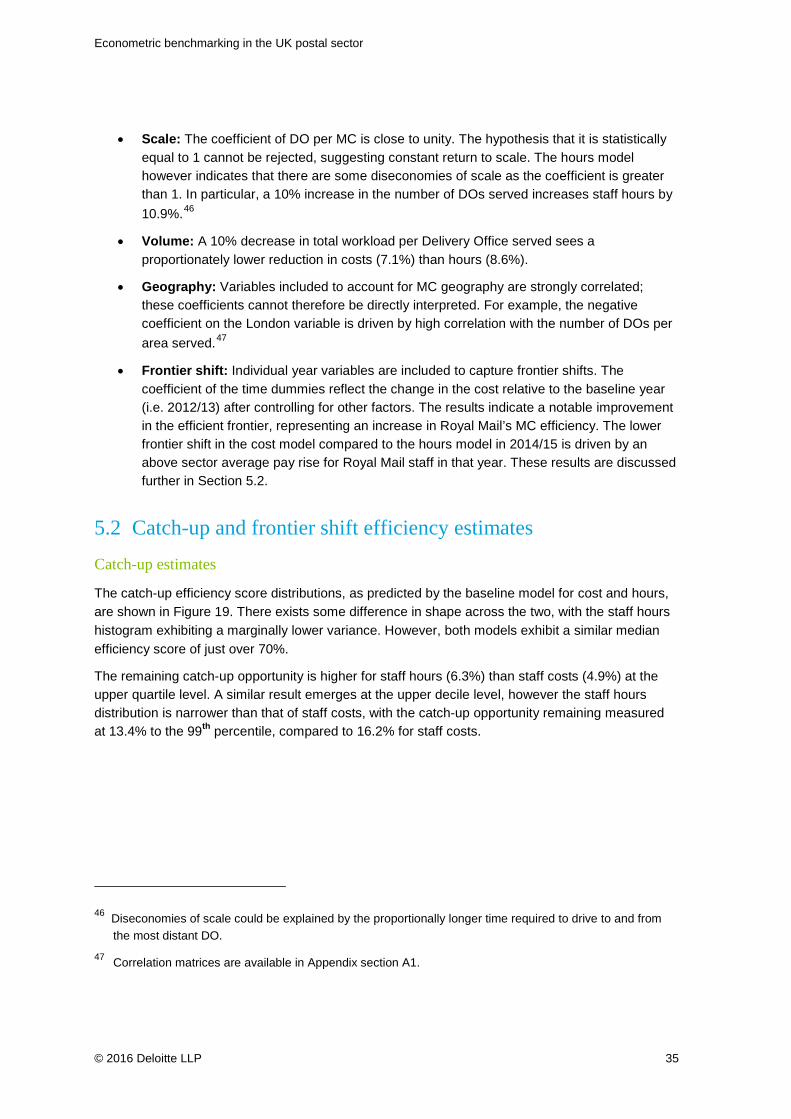
• The median efficiency score is just over 70% for both cost and hours models. There is a some variation in scores, with the distribution typically ranging from c.60% to just under 95%. This implies some MCs are up to 35% less efficient than the most efficient units.
• If the catch-up opportunity benchmark is represented by the upper quartile or upper decile of the efficiency score distribution, the average catch-up gaps are 4.9% and 9.9% for staff costs. The remaining catch-up opportunity for staff hours at these benchmarks are 6.3% and 11.5% respectively.
• The magnitude of the catch-up to upper quartile varies between 4.8% and 9.5% depending on the model specification and estimation technique across the cost and hours models. The variance of the estimated catch-up to the upper decile and 99th percentile is relatively small across the sensitivity checks.
• The upper quartile catch-up estimates are, in general, greater in magnitude than those found in the DO analysis although the estimated upper decile and 99th decile catch-up are relatively similar between MCs and DOs. Differences in the level of efficiency were expected to be lower between MCs given that modernisation started and completed earlier than DOs and that a larger part of their operations are automated. The relatively large catch-up estimates might reflect estimation error stemming from the small estimation sample and the structural changes that took place in the MC network.
• Overall, the most conservative estimates presented in this section suggest that Royal Mail could achieve total efficiency savings between 5.2% and 9.9% within its MC network over the following 5 years. These savings primarily stem from catch-up efficiencies as the majority of the modernisation impact has already been realised. The most stretching estimates suggest up to 14.6% potential savings.
Econometric benchmarking in the UK postal sector
© 2016 Deloitte LLP 34
5.1 Model coefficients
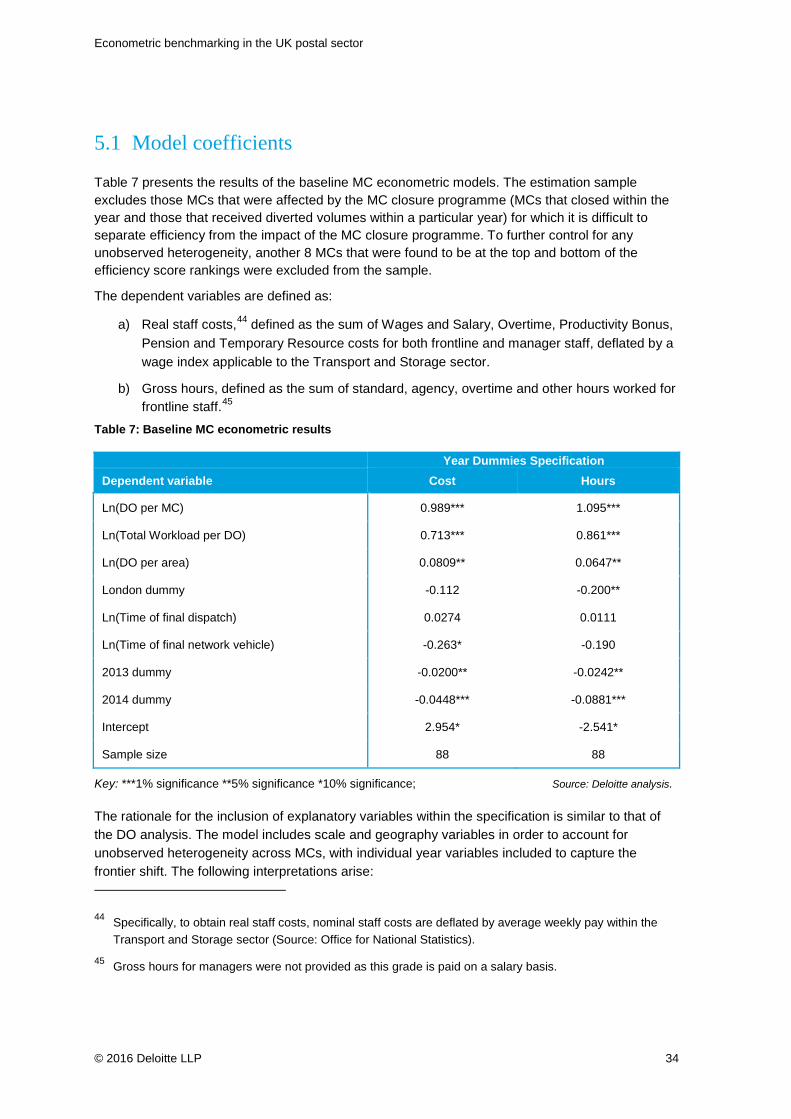
Table 7 presents the results of the baseline MC econometric models. The estimation sample excludes those MCs that were affected by the MC closure programme (MCs that closed within the year and those that received diverted volumes within a particular year) for which it is difficult to separate efficiency from the impact of the MC closure programme. To further control for any unobserved heterogeneity, another 8 MCs that were found to be at the top and bottom of the efficiency score rankings were excluded from the sample.
The dependent variables are defined as:
a) Real staff costs,44 defined as the sum of Wages and Salary, Overtime, Productivity Bonus, Pension and Temporary Resource costs for both frontline and manager staff, deflated by a wage index applicable to the Transport and Storage sector.
b) Gross hours, defined as the sum of standard, agency, overtime and other hours worked for frontline staff.45
Table 7: Baseline MC econometric results
Year Dummies Specification
Dependent variable Cost Hours
Ln(DO per MC) 0.989*** 1.095***
Ln(Total Workload per DO) 0.713*** 0.861***
Ln(DO per area) 0.0809** 0.0647**
London dummy -0.112 -0.200**
Ln(Time of final dispatch) 0.0274 0.0111
Ln(Time of final network vehicle) -0.263* -0.190
2013 dummy -0.0200** -0.0242**
2014 dummy -0.0448*** -0.0881***
Intercept 2.954* -2.541*
Sample size 88 88
Key: ***1% significance **5% significance *10% significance; Source: Deloitte analysis.
The rationale for the inclusion of explanatory variables within the specification is similar to that of the DO analysis. The model includes scale and geography variables in order to account for unobserved heterogeneity across MCs, with individual year variables included to capture the frontier shift. The following interpretations arise:
44 Specifically, to obtain real staff costs, nominal staff costs are deflated by average weekly pay within the Transport and Storage sector (Source: Office for National Statistics).
45 Gross hours for managers were not provided as this grade is paid on a salary basis.
Econometric benchmarking in the UK postal sector
© 2016 Deloitte LLP 35
• Scale: The coefficient of DO per MC is close to unity. The hypothesis that it is statistically equal to 1 cannot be rejected, suggesting constant return to scale. The hours model however indicates that there are some diseconomies of scale as the coefficient is greater than 1. In particular, a 10% increase in the number of DOs served increases staff hours by 10.9%.46
• Volume: A 10% decrease in total workload per Delivery Office served sees a proportionately lower reduction in costs (7.1%) than hours (8.6%).
• Geography: Variables included to account for MC geography are strongly correlated; these coefficients cannot therefore be directly interpreted. For example, the negative coefficient on the London variable is driven by high correlation with the number of DOs per area served.47
• Frontier shift: Individual year variables are included to capture frontier shifts. The coefficient of the time dummies reflect the change in the cost relative to the baseline year (i.e. 2012/13) after controlling for other factors. The results indicate a notable improvement in the efficient frontier, representing an increase in Royal Mail’s MC efficiency. The lower frontier shift in the cost model compared to the hours model in 2014/15 is driven by an above sector average pay rise for Royal Mail staff in that year. These results are discussed further in Section 5.2.
5.2 Catch-up and frontier shift efficiency estimates Catch-up estimates
The catch-up efficiency score distributions, as predicted by the baseline model for cost and hours, are shown in Figure 19. There exists some difference in shape across the two, with the staff hours histogram exhibiting a marginally lower variance. However, both models exhibit a similar median efficiency score of just over 70%.
The remaining catch-up opportunity is higher for staff hours (6.3%) than staff costs (4.9%) at the upper quartile level. A similar result emerges at the upper decile level, however the staff hours distribution is narrower than that of staff costs, with the catch-up opportunity remaining measured at 13.4% to the 99th percentile, compared to 16.2% for staff costs.
46 Diseconomies of scale could be explained by the proportionally longer time required to drive to and from the most distant DO.
47 Correlation matrices are available in Appendix section A1.
Econometric benchmarking in the UK postal sector
© 2016 Deloitte LLP 36
0%
5%
10%
15%
20%
25%
30%
35%
0.60 0.65 0.70 0.75 0.80 0.85 0.90 0.95 1.00
6.3%
72.6%
Median
UQ UD99th
percentile
11.5%
13.4%
0%
5%
10%
15%
20%
25%
30%
35%
0.60 0.65 0.70 0.75 0.80 0.85 0.90 0.95 1.00
4.9%
73.6%
Median
9.9%
16.2%
UQ UD99th
percentile
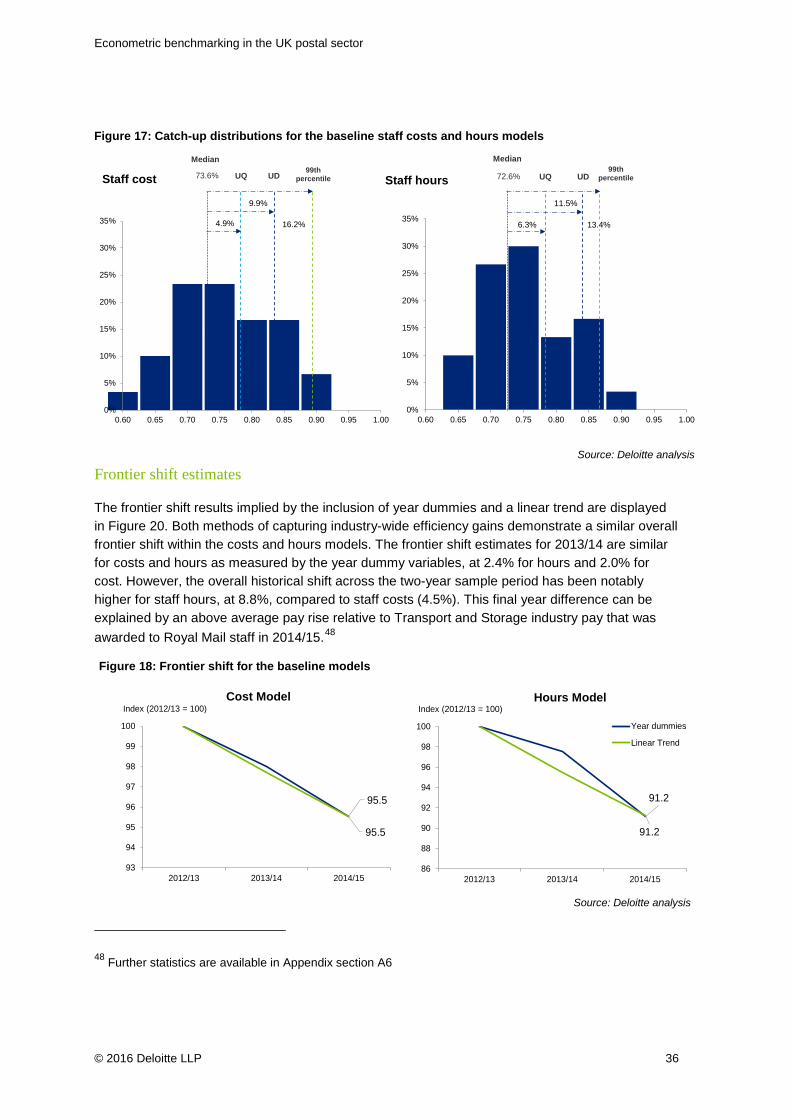
Figure 18: Frontier shift for the baseline models
95.5
95.5
93
94
95
96
97
98
99
100
2012/13 2013/14 2014/15
Index (2012/13 = 100)
91.2
91.2
86
88
90
92
94
96
98
100
2012/13 2013/14 2014/15
Index (2012/13 = 100)
Year dummies
Linear Trend
Frontier shift estimates
The frontier shift results implied by the inclusion of year dummies and a linear trend are displayed in Figure 20. Both methods of capturing industry-wide efficiency gains demonstrate a similar overall frontier shift within the costs and hours models. The frontier shift estimates for 2013/14 are similar for costs and hours as measured by the year dummy variables, at 2.4% for hours and 2.0% for cost. However, the overall historical shift across the two-year sample period has been notably higher for staff hours, at 8.8%, compared to staff costs (4.5%). This final year difference can be explained by an above average pay rise relative to Transport and Storage industry pay that was awarded to Royal Mail staff in 2014/15.48
48 Further statistics are available in Appendix section A6
Staff cost Staff hours
Figure 17: Catch-up distributions for the baseline staff costs and hours models
Cost Model Hours Model
Source: Deloitte analysis
Source: Deloitte analysis
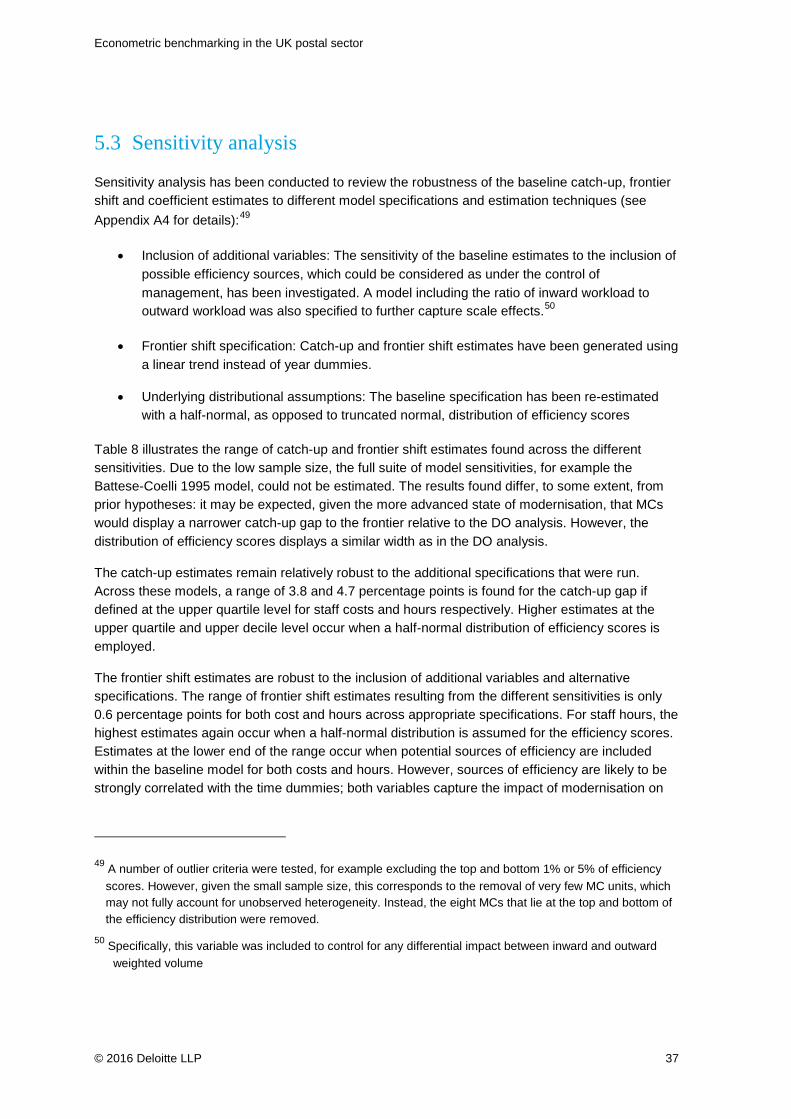
Econometric benchmarking in the UK postal sector
© 2016 Deloitte LLP 37
5.3 Sensitivity analysis
Sensitivity analysis has been conducted to review the robustness of the baseline catch-up, frontier shift and coefficient estimates to different model specifications and estimation techniques (see Appendix A4 for details):49
• Inclusion of additional variables: The sensitivity of the baseline estimates to the inclusion of possible efficiency sources, which could be considered as under the control of management, has been investigated. A model including the ratio of inward workload to outward workload was also specified to further capture scale effects.50
• Frontier shift specification: Catch-up and frontier shift estimates have been generated using a linear trend instead of year dummies.
• Underlying distributional assumptions: The baseline specification has been re-estimated with a half-normal, as opposed to truncated normal, distribution of efficiency scores
Table 8 illustrates the range of catch-up and frontier shift estimates found across the different sensitivities. Due to the low sample size, the full suite of model sensitivities, for example the Battese-Coelli 1995 model, could not be estimated. The results found differ, to some extent, from prior hypotheses: it may be expected, given the more advanced state of modernisation, that MCs would display a narrower catch-up gap to the frontier relative to the DO analysis. However, the distribution of efficiency scores displays a similar width as in the DO analysis.
The catch-up estimates remain relatively robust to the additional specifications that were run. Across these models, a range of 3.8 and 4.7 percentage points is found for the catch-up gap if defined at the upper quartile level for staff costs and hours respectively. Higher estimates at the upper quartile and upper decile level occur when a half-normal distribution of efficiency scores is employed.
The frontier shift estimates are robust to the inclusion of additional variables and alternative specifications. The range of frontier shift estimates resulting from the different sensitivities is only 0.6 percentage points for both cost and hours across appropriate specifications. For staff hours, the highest estimates again occur when a half-normal distribution is assumed for the efficiency scores. Estimates at the lower end of the range occur when potential sources of efficiency are included within the baseline model for both costs and hours. However, sources of efficiency are likely to be strongly correlated with the time dummies; both variables capture the impact of modernisation on
49 A number of outlier criteria were tested, for example excluding the top and bottom 1% or 5% of efficiency scores. However, given the small sample size, this corresponds to the removal of very few MC units, which may not fully account for unobserved heterogeneity. Instead, the eight MCs that lie at the top and bottom of the efficiency distribution were removed.
50 Specifically, this variable was included to control for any differential impact between inward and outward weighted volume
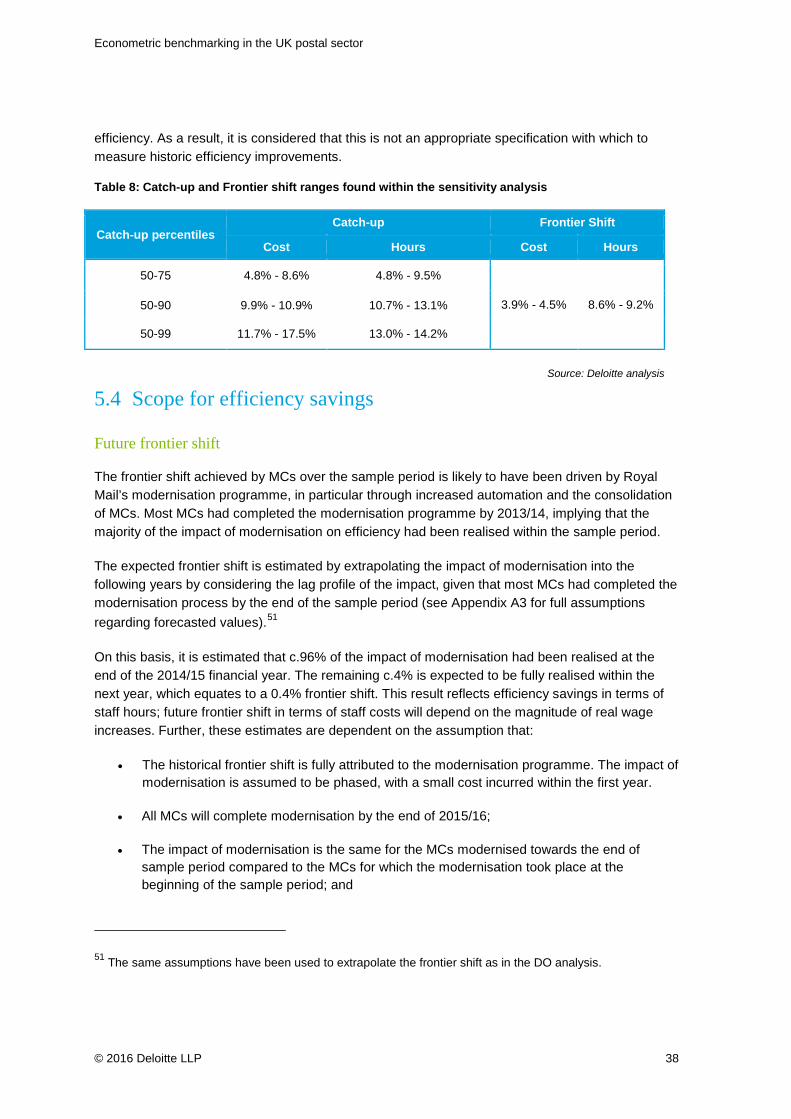
Econometric benchmarking in the UK postal sector
© 2016 Deloitte LLP 38
efficiency. As a result, it is considered that this is not an appropriate specification with which to measure historic efficiency improvements.
Table 8: Catch-up and Frontier shift ranges found within the sensitivity analysis
Catch-up percentiles Catch-up Frontier Shift Cost Hours Cost Hours
50-75 4.8% - 8.6% 4.8% - 9.5% 3.9% - 4.5% 8.6% - 9.2% 50-90 9.9% - 10.9% 10.7% - 13.1%
50-99 11.7% - 17.5% 13.0% - 14.2%
5.4 Scope for efficiency savings
Future frontier shift
The frontier shift achieved by MCs over the sample period is likely to have been driven by Royal Mail’s modernisation programme, in particular through increased automation and the consolidation of MCs. Most MCs had completed the modernisation programme by 2013/14, implying that the majority of the impact of modernisation on efficiency had been realised within the sample period.
The expected frontier shift is estimated by extrapolating the impact of modernisation into the following years by considering the lag profile of the impact, given that most MCs had completed the modernisation process by the end of the sample period (see Appendix A3 for full assumptions regarding forecasted values).51
On this basis, it is estimated that c.96% of the impact of modernisation had been realised at the end of the 2014/15 financial year. The remaining c.4% is expected to be fully realised within the next year, which equates to a 0.4% frontier shift. This result reflects efficiency savings in terms of staff hours; future frontier shift in terms of staff costs will depend on the magnitude of real wage increases. Further, these estimates are dependent on the assumption that:
• The historical frontier shift is fully attributed to the modernisation programme. The impact of modernisation is assumed to be phased, with a small cost incurred within the first year.
• All MCs will complete modernisation by the end of 2015/16;
• The impact of modernisation is the same for the MCs modernised towards the end of sample period compared to the MCs for which the modernisation took place at the beginning of the sample period; and
51 The same assumptions have been used to extrapolate the frontier shift as in the DO analysis.
Source: Deloitte analysis
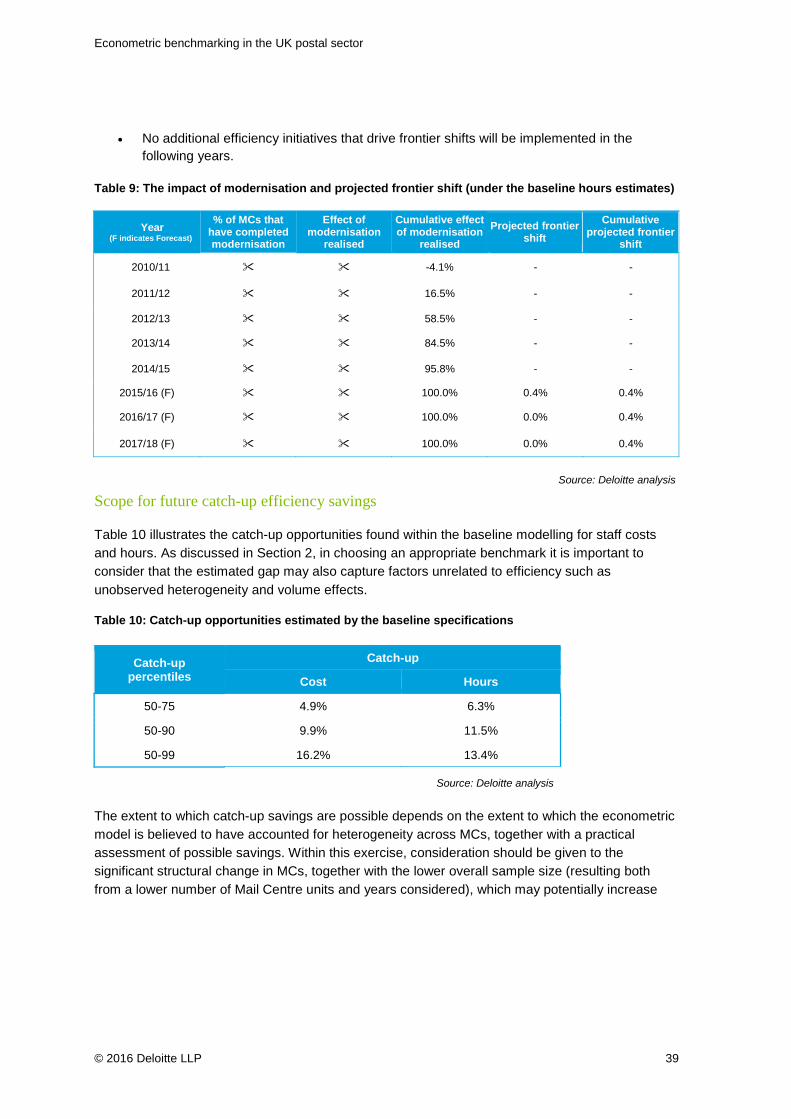
Econometric benchmarking in the UK postal sector
© 2016 Deloitte LLP 39
• No additional efficiency initiatives that drive frontier shifts will be implemented in the following years.
Table 9: The impact of modernisation and projected frontier shift (under the baseline hours estimates)
Year (F indicates Forecast)
% of MCs that have completed modernisation
Effect of modernisation
realised
Cumulative effect of modernisation
realised
Projected frontier shift
Cumulative projected frontier
shift
2010/11 -4.1% - -
2011/12 16.5% - -
2012/13 58.5% - -
2013/14 84.5% - -
2014/15 95.8% - -
2015/16 (F) 100.0% 0.4% 0.4%
2016/17 (F) 100.0% 0.0% 0.4%
2017/18 (F) 100.0% 0.0% 0.4%
Scope for future catch-up efficiency savings
Table 10 illustrates the catch-up opportunities found within the baseline modelling for staff costs and hours. As discussed in Section 2, in choosing an appropriate benchmark it is important to consider that the estimated gap may also capture factors unrelated to efficiency such as unobserved heterogeneity and volume effects.
Table 10: Catch-up opportunities estimated by the baseline specifications
The extent to which catch-up savings are possible depends on the extent to which the econometric model is believed to have accounted for heterogeneity across MCs, together with a practical assessment of possible savings. Within this exercise, consideration should be given to the significant structural change in MCs, together with the lower overall sample size (resulting both from a lower number of Mail Centre units and years considered), which may potentially increase
Catch-up percentiles
Catch-up Cost Hours
50-75 4.9% 6.3%
50-90 9.9% 11.5%
50-99 16.2% 13.4%
Source: Deloitte analysis
Source: Deloitte analysis
Econometric benchmarking in the UK postal sector
© 2016 Deloitte LLP 40
the magnitude of estimation error.52 Due to data availability, the MC analysis also uses proxies for MC geography in place of more direct variables such as the proportion of area covered that can be classed as rural. Together, these factors induce a greater degree of uncertainty within the results compared to the DO analysis.
Summary
Table 11 sets out the total frontier shift and catch-up efficiency savings that Royal Mail could realise over the next five years in its MC operations reflecting the discussion and analysis presented above. A linear glide path is assumed for the catch-up efficiency.53
The ranges presented reflect, for the upper quartile, upper decile and 99th percentile catch-up benchmarks:
a) The total year-on-year efficiency savings from the baseline hours model, namely the sum of the baseline hours catch-up and frontier shift each year.
b) An upper estimate, based upon the highest values within the range found for the catch-up gap and frontier shift with staff hours as the dependent variable.
c) A lower estimate, based upon the lowest estimates found for catch-up and frontier shift within the staff hours models.
Total efficiency savings from 2015/16 to 2019/20 are projected at between 5.2%-9.9% if measured at the upper quartile, 11.1%-13.5% at the upper decile, and 13.4%-14.6% at the 99th percentile. The largest single year improvement is projected in 2015/16. This is due to the remaining modernisation impact, and hence the largest frontier shift, taking place within that year. If measured as a proportion of 2014/15 reported gross hours, the lowest estimate (5.2%) would equate to staff hours, with the upper estimate (14.6%) equating to hours. These correspond to figures of and based upon implied 2014/15 frontline wages.54
52 The smaller sample size also affected the robustness checks that could be run. This is discussed in Appendix A4.2
53 The catch-up opportunity is assumed to be realised at a constant rate over a period of 5 years, with total savings characterised by the sum of the two.
54 The calculation is based upon multiplying the total projected staff hours saving (at the OPG level) by the implied 2014 OPG wage (OPG people cost / OPG gross hours). Results are similar if average staff pay is employed.
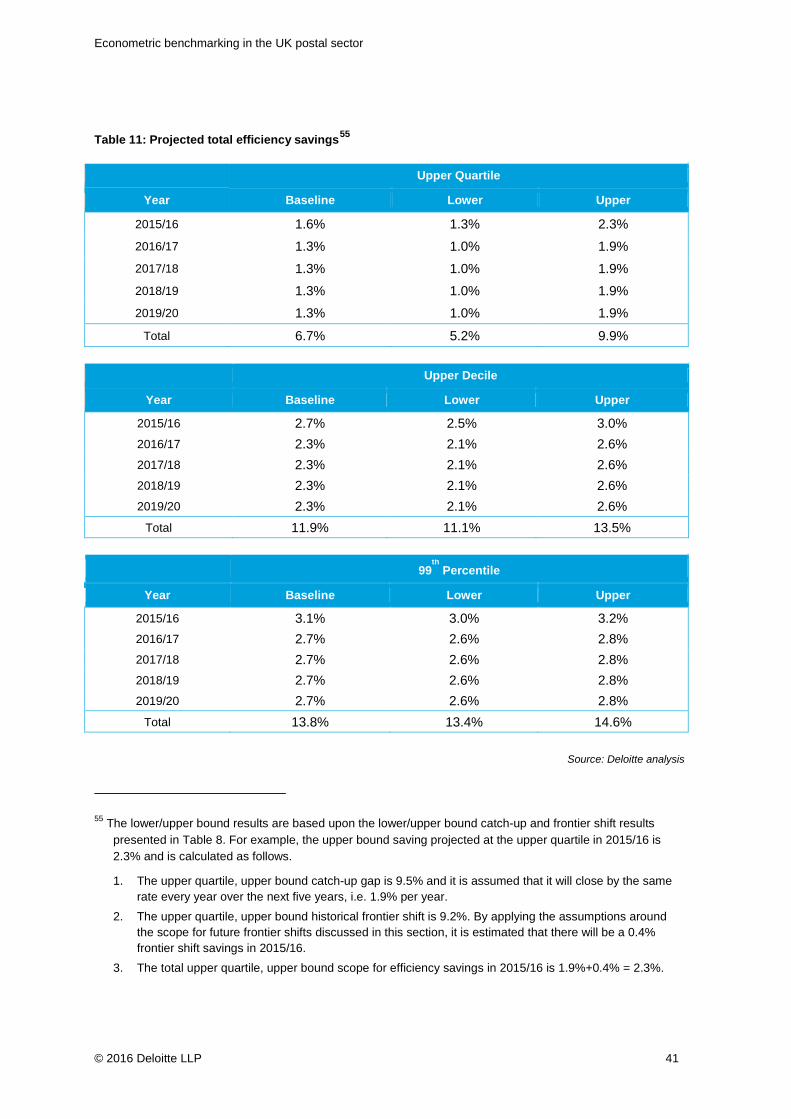
Econometric benchmarking in the UK postal sector
© 2016 Deloitte LLP 41
Table 11: Projected total efficiency savings55
Upper Quartile
Year Baseline Lower Upper
2015/16 1.6% 1.3% 2.3%
2016/17 1.3% 1.0% 1.9%
2017/18 1.3% 1.0% 1.9%
2018/19 1.3% 1.0% 1.9%
2019/20 1.3% 1.0% 1.9%
Total 6.7% 5.2% 9.9%
Upper Decile
Year Baseline Lower Upper
2015/16 2.7% 2.5% 3.0%
2016/17 2.3% 2.1% 2.6%
2017/18 2.3% 2.1% 2.6%
2018/19 2.3% 2.1% 2.6%
2019/20 2.3% 2.1% 2.6%
Total 11.9% 11.1% 13.5%
99th
Percentile
Year Baseline Lower Upper
2015/16 3.1% 3.0% 3.2%
2016/17 2.7% 2.6% 2.8%
2017/18 2.7% 2.6% 2.8%
2018/19 2.7% 2.6% 2.8%
2019/20 2.7% 2.6% 2.8%
Total 13.8% 13.4% 14.6% 55 The lower/upper bound results are based upon the lower/upper bound catch-up and frontier shift results
presented in Table 8. For example, the upper bound saving projected at the upper quartile in 2015/16 is 2.3% and is calculated as follows.
1. The upper quartile, upper bound catch-up gap is 9.5% and it is assumed that it will close by the same rate every year over the next five years, i.e. 1.9% per year.
2. The upper quartile, upper bound historical frontier shift is 9.2%. By applying the assumptions around the scope for future frontier shifts discussed in this section, it is estimated that there will be a 0.4% frontier shift savings in 2015/16.
3. The total upper quartile, upper bound scope for efficiency savings in 2015/16 is 1.9%+0.4% = 2.3%.
Source: Deloitte analysis
Econometric benchmarking in the UK postal sector
© 2016 Deloitte LLP 42
References
Battese, G. and Coelli, T. (1995): A model for technical inefficiency effects in a stochastic frontier production function for panel data. Empirical Economics (1995) 20:325-332
Cazals, C., J.-P. Florens and S. Soteri (2005): ‘Delivery Costs for Postal Services in the UK: Some results on Scale economies with Panel Data’ in M.A. Crew and P.R. Kleindorfer, ‘Future directions in Postal Reform’, Boston, MA: Kluwer Academic Publishers
Cubbin, J. (2004): Assessing Ofwat’s efficiency econometrics. A report for Water UK.
Hsiao, C. (2007): Panel Data Analysis – Advantages and Challenges. Test 16, pp1-22
Jacobs, R. (2001): Alternative Methods to Examine Hospital Efficiency: Data Envelopment Analysis and Stochastic Frontier Analysis. Health Care Management Sciences (4), pp103-15. www.york.ac.uk/che/pdf/DP177.pdf
Ofcom (2008): The comparative efficiency of BT Openreach. Stakeholders.ofcom.org.uk/binaries/consultations/llcc/annexes/efficiency.pdf
Ofcom (2014): Review of end-to-end competition in the postal sector: Statement. December 2nd 2014. stakeholders.ofcom.org.uk/binaries/post/end-to-end-statement/end-to-end.pdf
Ofcom (2015). Review of the regulation of Royal Mail.
Ofgem (2013): RIIO-ED1 business plan expenditure assessment – methodology and results. www.ofgem.gov.uk/ofgem-publications/85039/costassessmentmethdologyandresultsmasterv2.pdf
Ofwat (2014). Draft determinations for PR14.
Postcomm. (2005). Future Efficient Costs of Royal Mail’s Regulated Mail Activities. LECG. August 2005. Excised version available at www.psc.gov.uk
Royal Mail (2014). Direct Delivery: A Threat to the Universal Postal Service. Regulatory Submission to Ofcom.
Stern, J. (2013): Econometric Benchmarking and its uses by ORR: A review. CCRP Working Paper No 21, February 2013. www.city.ac.uk/_media/city-site/documents/social-sciences/economics/ccrp-16/CCRP-Discusssion-Paper-21-Stern-Feb_13.pdf
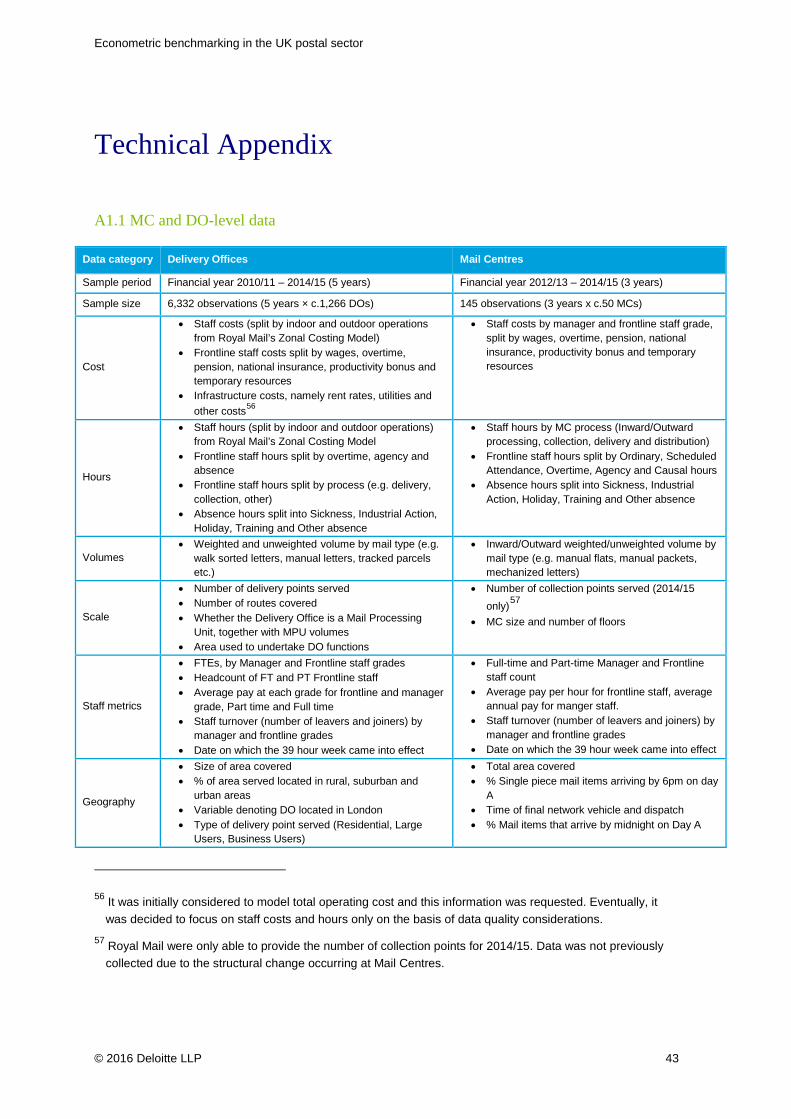
Econometric benchmarking in the UK postal sector
© 2016 Deloitte LLP 43
Technical Appendix
A1.1 MC and DO-level data
Data category Delivery Offices Mail Centres
Sample period Financial year 2010/11 – 2014/15 (5 years) Financial year 2012/13 – 2014/15 (3 years)
Sample size 6,332 observations (5 years × c.1,266 DOs) 145 observations (3 years x c.50 MCs)
Cost
• Staff costs (split by indoor and outdoor operations from Royal Mail’s Zonal Costing Model)
• Frontline staff costs split by wages, overtime, pension, national insurance, productivity bonus and temporary resources
• Infrastructure costs, namely rent rates, utilities and other costs56
• Staff costs by manager and frontline staff grade, split by wages, overtime, pension, national insurance, productivity bonus and temporary resources
Hours
• Staff hours (split by indoor and outdoor operations) from Royal Mail’s Zonal Costing Model
• Frontline staff hours split by overtime, agency and absence
• Frontline staff hours split by process (e.g. delivery, collection, other)
• Absence hours split into Sickness, Industrial Action, Holiday, Training and Other absence
• Staff hours by MC process (Inward/Outward processing, collection, delivery and distribution)
• Frontline staff hours split by Ordinary, Scheduled Attendance, Overtime, Agency and Causal hours
• Absence hours split into Sickness, Industrial Action, Holiday, Training and Other absence
Volumes • Weighted and unweighted volume by mail type (e.g.
walk sorted letters, manual letters, tracked parcels etc.)
• Inward/Outward weighted/unweighted volume by mail type (e.g. manual flats, manual packets, mechanized letters)
Scale
• Number of delivery points served • Number of routes covered • Whether the Delivery Office is a Mail Processing
Unit, together with MPU volumes • Area used to undertake DO functions
• Number of collection points served (2014/15 only)57
• MC size and number of floors
Staff metrics
• FTEs, by Manager and Frontline staff grades • Headcount of FT and PT Frontline staff • Average pay at each grade for frontline and manager
grade, Part time and Full time • Staff turnover (number of leavers and joiners) by
manager and frontline grades • Date on which the 39 hour week came into effect
• Full-time and Part-time Manager and Frontline staff count
• Average pay per hour for frontline staff, average annual pay for manger staff.
• Staff turnover (number of leavers and joiners) by manager and frontline grades
• Date on which the 39 hour week came into effect
Geography
• Size of area covered • % of area served located in rural, suburban and
urban areas • Variable denoting DO located in London • Type of delivery point served (Residential, Large
Users, Business Users)
• Total area covered • % Single piece mail items arriving by 6pm on day
A • Time of final network vehicle and dispatch • % Mail items that arrive by midnight on Day A
56 It was initially considered to model total operating cost and this information was requested. Eventually, it was decided to focus on staff costs and hours only on the basis of data quality considerations.
57 Royal Mail were only able to provide the number of collection points for 2014/15. Data was not previously collected due to the structural change occurring at Mail Centres.
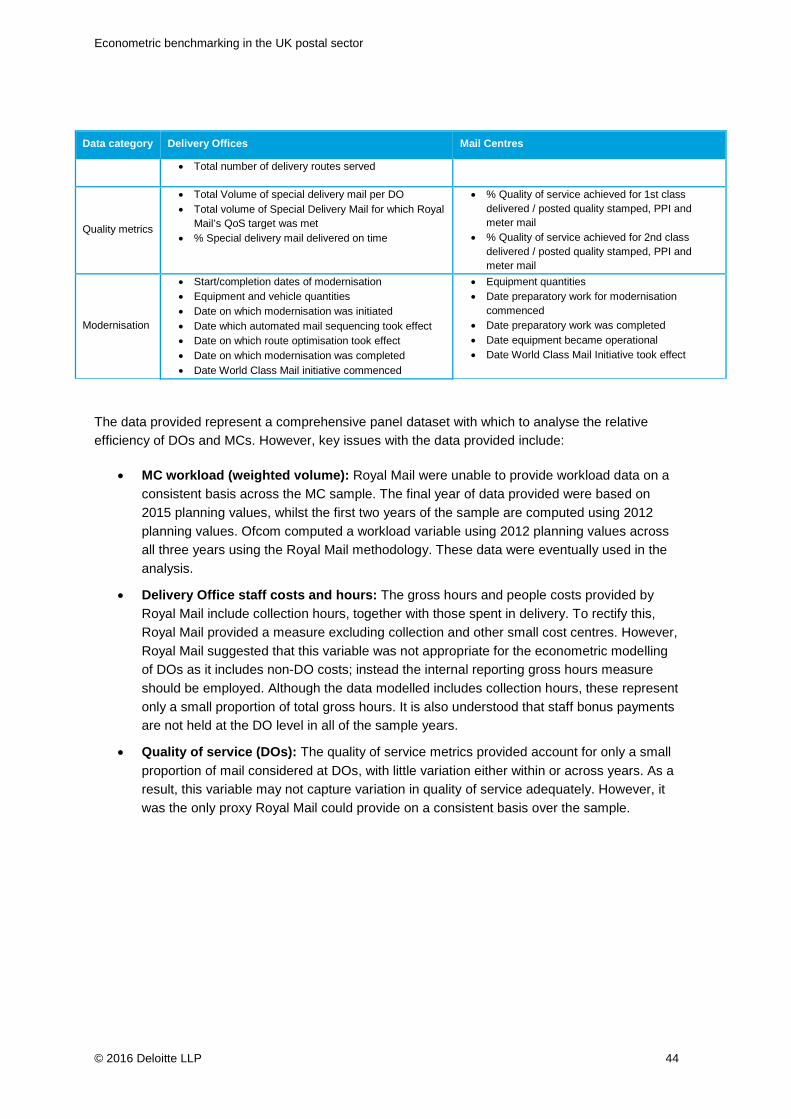
Econometric benchmarking in the UK postal sector
© 2016 Deloitte LLP 44
Data category Delivery Offices Mail Centres
• Total number of delivery routes served
Quality metrics
• Total Volume of special delivery mail per DO • Total volume of Special Delivery Mail for which Royal
Mail’s QoS target was met • % Special delivery mail delivered on time
• % Quality of service achieved for 1st class delivered / posted quality stamped, PPI and meter mail
• % Quality of service achieved for 2nd class delivered / posted quality stamped, PPI and meter mail
Modernisation
• Start/completion dates of modernisation • Equipment and vehicle quantities • Date on which modernisation was initiated • Date which automated mail sequencing took effect • Date on which route optimisation took effect • Date on which modernisation was completed • Date World Class Mail initiative commenced
• Equipment quantities • Date preparatory work for modernisation
commenced • Date preparatory work was completed • Date equipment became operational • Date World Class Mail Initiative took effect
The data provided represent a comprehensive panel dataset with which to analyse the relative efficiency of DOs and MCs. However, key issues with the data provided include:
• MC workload (weighted volume): Royal Mail were unable to provide workload data on a consistent basis across the MC sample. The final year of data provided were based on 2015 planning values, whilst the first two years of the sample are computed using 2012 planning values. Ofcom computed a workload variable using 2012 planning values across all three years using the Royal Mail methodology. These data were eventually used in the analysis.
• Delivery Office staff costs and hours: The gross hours and people costs provided by Royal Mail include collection hours, together with those spent in delivery. To rectify this, Royal Mail provided a measure excluding collection and other small cost centres. However, Royal Mail suggested that this variable was not appropriate for the econometric modelling of DOs as it includes non-DO costs; instead the internal reporting gross hours measure should be employed. Although the data modelled includes collection hours, these represent only a small proportion of total gross hours. It is also understood that staff bonus payments are not held at the DO level in all of the sample years.
• Quality of service (DOs): The quality of service metrics provided account for only a small proportion of mail considered at DOs, with little variation either within or across years. As a result, this variable may not capture variation in quality of service adequately. However, it was the only proxy Royal Mail could provide on a consistent basis over the sample.
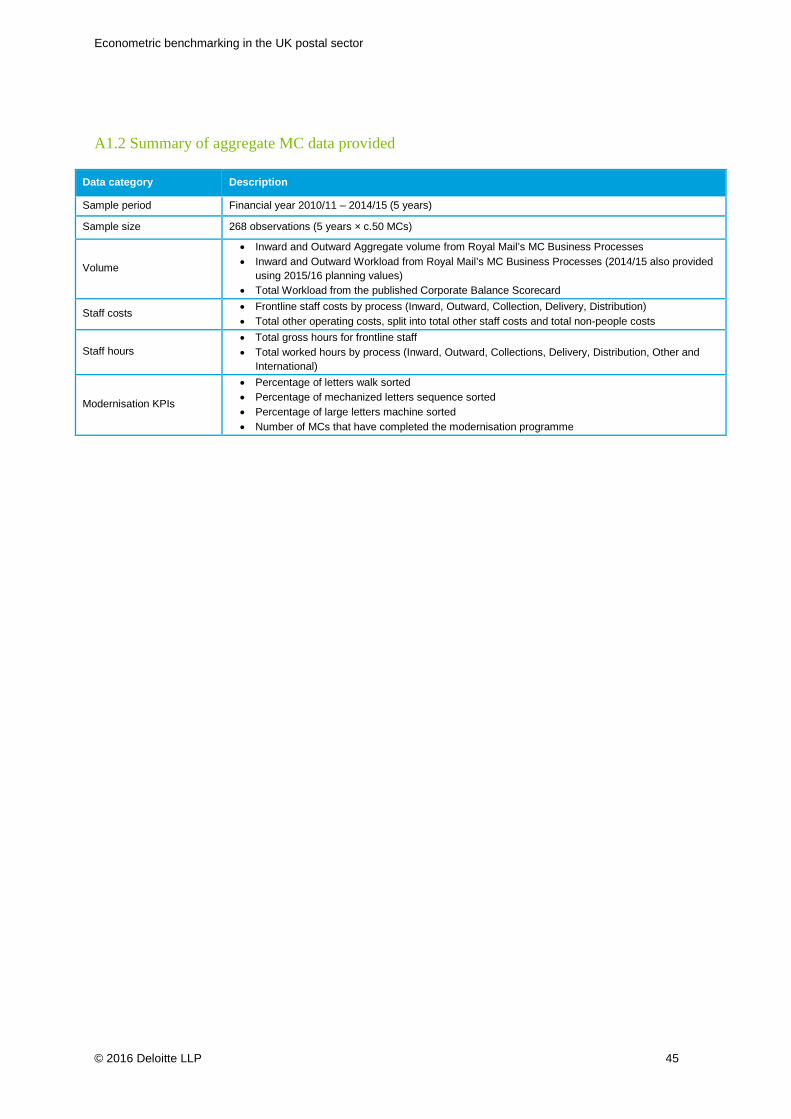
Econometric benchmarking in the UK postal sector
© 2016 Deloitte LLP 45
A1.2 Summary of aggregate MC data provided
Data category Description
Sample period Financial year 2010/11 – 2014/15 (5 years)
Sample size 268 observations (5 years × c.50 MCs)
Volume
• Inward and Outward Aggregate volume from Royal Mail’s MC Business Processes • Inward and Outward Workload from Royal Mail’s MC Business Processes (2014/15 also provided
using 2015/16 planning values) • Total Workload from the published Corporate Balance Scorecard
Staff costs • Frontline staff costs by process (Inward, Outward, Collection, Delivery, Distribution) • Total other operating costs, split into total other staff costs and total non-people costs
Staff hours • Total gross hours for frontline staff • Total worked hours by process (Inward, Outward, Collections, Delivery, Distribution, Other and
International)
Modernisation KPIs
• Percentage of letters walk sorted • Percentage of mechanized letters sequence sorted • Percentage of large letters machine sorted • Number of MCs that have completed the modernisation programme
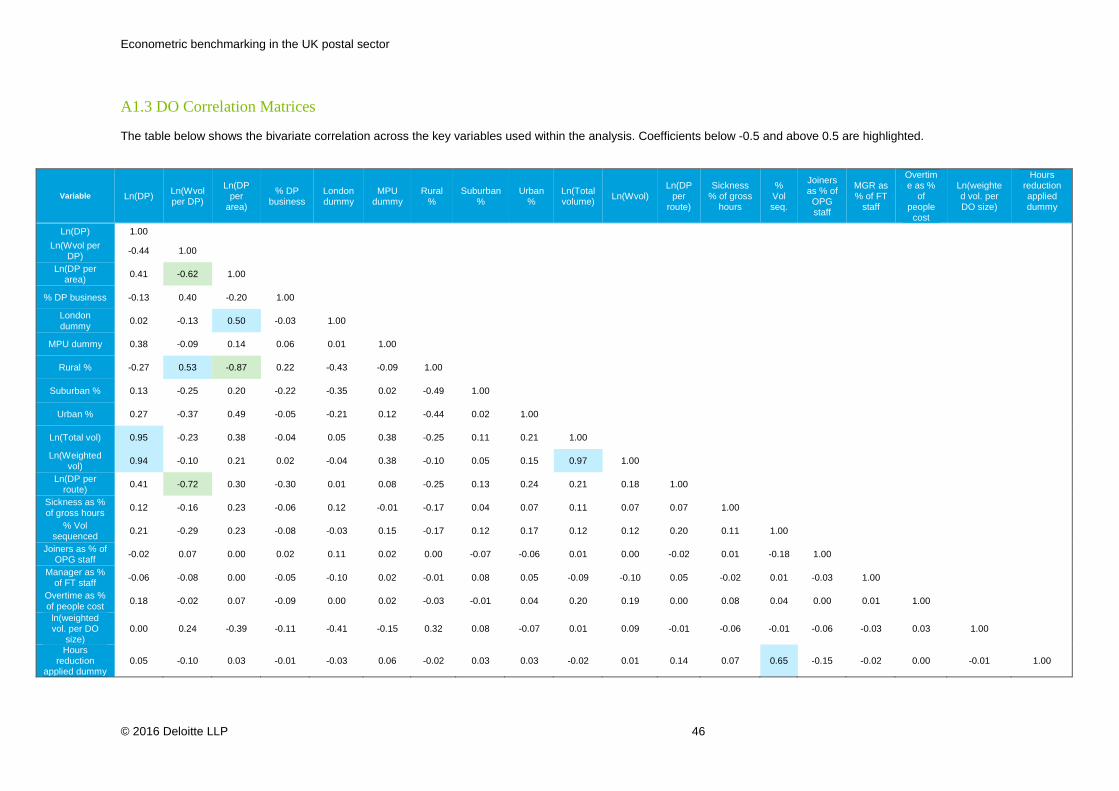
Econometric benchmarking in the UK postal sector
© 2016 Deloitte LLP 46
A1.3 DO Correlation Matrices
The table below shows the bivariate correlation across the key variables used within the analysis. Coefficients below -0.5 and above 0.5 are highlighted.
Variable Ln(DP) Ln(Wvol per DP)
Ln(DP per
area)
% DP business
London dummy
MPU dummy
Rural %
Suburban %
Urban %
Ln(Total volume) Ln(Wvol)
Ln(DP per
route)
Sickness % of gross
hours
% Vol seq.
Joiners as % of OPG staff
MGR as % of FT
staff
Overtime as %
of people
cost
Ln(weighted vol. per DO size)
Hours reduction applied dummy
Ln(DP) 1.00
Ln(Wvol per
DP) -0.44 1.00
Ln(DP per
area) 0.41 -0.62 1.00
% DP business -0.13 0.40 -0.20 1.00
London dummy 0.02 -0.13 0.50 -0.03 1.00
MPU dummy 0.38 -0.09 0.14 0.06 0.01 1.00
Rural % -0.27 0.53 -0.87 0.22 -0.43 -0.09 1.00
Suburban % 0.13 -0.25 0.20 -0.22 -0.35 0.02 -0.49 1.00
Urban % 0.27 -0.37 0.49 -0.05 -0.21 0.12 -0.44 0.02 1.00
Ln(Total vol) 0.95 -0.23 0.38 -0.04 0.05 0.38 -0.25 0.11 0.21 1.00
Ln(Weighted
vol) 0.94 -0.10 0.21 0.02 -0.04 0.38 -0.10 0.05 0.15 0.97 1.00
Ln(DP per
route) 0.41 -0.72 0.30 -0.30 0.01 0.08 -0.25 0.13 0.24 0.21 0.18 1.00
Sickness as % of gross hours 0.12 -0.16 0.23 -0.06 0.12 -0.01 -0.17 0.04 0.07 0.11 0.07 0.07 1.00
% Vol
sequenced 0.21 -0.29 0.23 -0.08 -0.03 0.15 -0.17 0.12 0.17 0.12 0.12 0.20 0.11 1.00
Joiners as % of
OPG staff -0.02 0.07 0.00 0.02 0.11 0.02 0.00 -0.07 -0.06 0.01 0.00 -0.02 0.01 -0.18 1.00
Manager as %
of FT staff -0.06 -0.08 0.00 -0.05 -0.10 0.02 -0.01 0.08 0.05 -0.09 -0.10 0.05 -0.02 0.01 -0.03 1.00
Overtime as % of people cost 0.18 -0.02 0.07 -0.09 0.00 0.02 -0.03 -0.01 0.04 0.20 0.19 0.00 0.08 0.04 0.00 0.01 1.00
ln(weighted vol. per DO
size) 0.00 0.24 -0.39 -0.11 -0.41 -0.15 0.32 0.08 -0.07 0.01 0.09 -0.01 -0.06 -0.01 -0.06 -0.03 0.03 1.00
Hours reduction
applied dummy 0.05 -0.10 0.03 -0.01 -0.03 0.06 -0.02 0.03 0.03 -0.02 0.01 0.14 0.07 0.65 -0.15 -0.02 0.00 -0.01 1.00
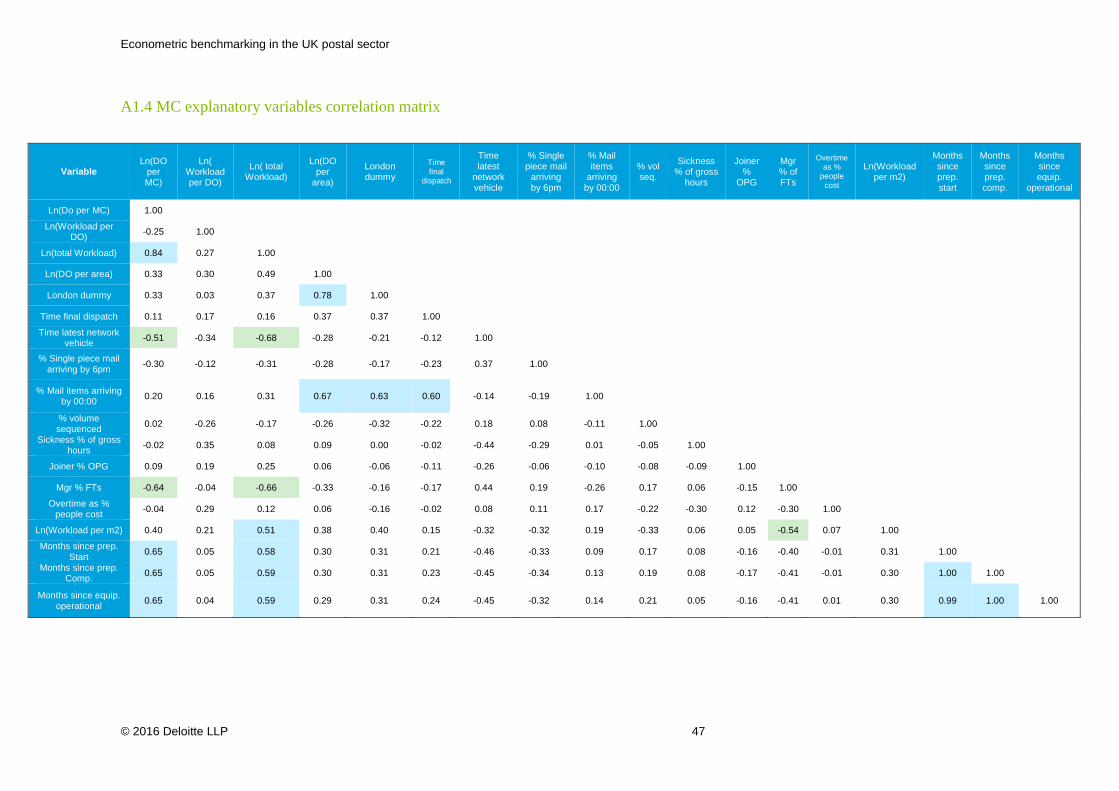
Econometric benchmarking in the UK postal sector
© 2016 Deloitte LLP 47
A1.4 MC explanatory variables correlation matrix
Variable Ln(DO
per MC)
Ln( Workload per DO)
Ln( total Workload)
Ln(DO per
area)
London dummy
Time final
dispatch
Time latest
network vehicle
% Single piece mail
arriving by 6pm
% Mail items
arriving by 00:00
% vol seq.
Sickness % of gross
hours
Joiner %
OPG
Mgr % of FTs
Overtime as %
people cost
Ln(Workload per m2)
Months since prep. start
Months since prep. comp.
Months since equip.
operational
Ln(Do per MC) 1.00
Ln(Workload per DO) -0.25 1.00
Ln(total Workload) 0.84 0.27 1.00
Ln(DO per area) 0.33 0.30 0.49 1.00
London dummy 0.33 0.03 0.37 0.78 1.00
Time final dispatch 0.11 0.17 0.16 0.37 0.37 1.00
Time latest network vehicle -0.51 -0.34 -0.68 -0.28 -0.21 -0.12 1.00
% Single piece mail arriving by 6pm -0.30 -0.12 -0.31 -0.28 -0.17 -0.23 0.37 1.00
% Mail items arriving by 00:00 0.20 0.16 0.31 0.67 0.63 0.60 -0.14 -0.19 1.00
% volume
sequenced 0.02 -0.26 -0.17 -0.26 -0.32 -0.22 0.18 0.08 -0.11 1.00
Sickness % of gross hours -0.02 0.35 0.08 0.09 0.00 -0.02 -0.44 -0.29 0.01 -0.05 1.00
Joiner % OPG 0.09 0.19 0.25 0.06 -0.06 -0.11 -0.26 -0.06 -0.10 -0.08 -0.09 1.00
Mgr % FTs -0.64 -0.04 -0.66 -0.33 -0.16 -0.17 0.44 0.19 -0.26 0.17 0.06 -0.15 1.00
Overtime as % people cost -0.04 0.29 0.12 0.06 -0.16 -0.02 0.08 0.11 0.17 -0.22 -0.30 0.12 -0.30 1.00
Ln(Workload per m2) 0.40 0.21 0.51 0.38 0.40 0.15 -0.32 -0.32 0.19 -0.33 0.06 0.05 -0.54 0.07 1.00
Months since prep. Start 0.65 0.05 0.58 0.30 0.31 0.21 -0.46 -0.33 0.09 0.17 0.08 -0.16 -0.40 -0.01 0.31 1.00
Months since prep. Comp. 0.65 0.05 0.59 0.30 0.31 0.23 -0.45 -0.34 0.13 0.19 0.08 -0.17 -0.41 -0.01 0.30 1.00 1.00
Months since equip. operational 0.65 0.04 0.59 0.29 0.31 0.24 -0.45 -0.32 0.14 0.21 0.05 -0.16 -0.41 0.01 0.30 0.99 1.00 1.00
Econometric benchmarking in the UK postal sector
© 2016 Deloitte LLP 48
A2.1 DO Model coefficient constraints
Within the baseline DO model, the coefficient of Log (Delivery points) has been constrained to 1 for both cost and hours, whilst the coefficient of Log (Weighted volume per DP) has been constrained to 0.86 within the staff costs model and 0.80 within the staff hours model. The rationale for these constraints is explained below.
Tables A1 and A2 show the results of 5 models for staff costs and hours. All are run with the top and bottom 1% of efficiency scores removed:
1) Baseline specification with no coefficient constraints employed 2) Baseline specification with the addition of Log(DP per route) 3) Baseline model with potential sources of inefficiency included 4) Model results with a constraint applied to the weighted volume per delivery point variable 5) Baseline model with the chosen constraints employed
Upon estimating model 1, a coefficient of approximately 0.98 is attained for the weighted volume per delivery point variable for both costs and hours. However, when the number of delivery points per route and other variables that capture potential sources of inefficiency are included (columns 2 and 3), the coefficient falls to 0.86 for staff costs (column 3) and approaches 0.80 for staff hours. This suggests that the high coefficient within the unconstrained model is likely to be the result of omitted variable bias (i.e. weighted volume per delivery point captures the effect of omitted factors).58 The rational for excluding the potential sources of inefficiency from the baseline model is that they are, to some degree, within management’s control and only exogenous factors should be controlled for within the econometric model.
In column 4, where Log (Weighted volume per DP) is constrained to 0.86 and 0.80 for staff costs and hours respectively, the coefficient of Log (Delivery points) drops to 0.98 and 0.97. A unit restriction is justified on the basis of previous work in this area, which suggests that delivery costs rise in line with the number of delivery points (for example, Cazals et al., 2005; ), together with the observation that the coefficient varies around a value of 1 across different models. As a result, both constraints are applied within the suite of baseline models, as illustrated in column 5. The constrained models provide higher frontier shift estimates relative to the unconstrained models by c. 0.7% (cost models) and 1.1% (hours models). The catch-up estimates effectively remain unaffected.
58 Most of the difference in volume per DP coefficients seems to be driven by the exclusion of DP per route. This is not surprising as the two variables are highly correlated (see correlation analysis in previous section), which supports the idea that omitting DP per route in particular would lead to its effects being picked up by volume per DP.
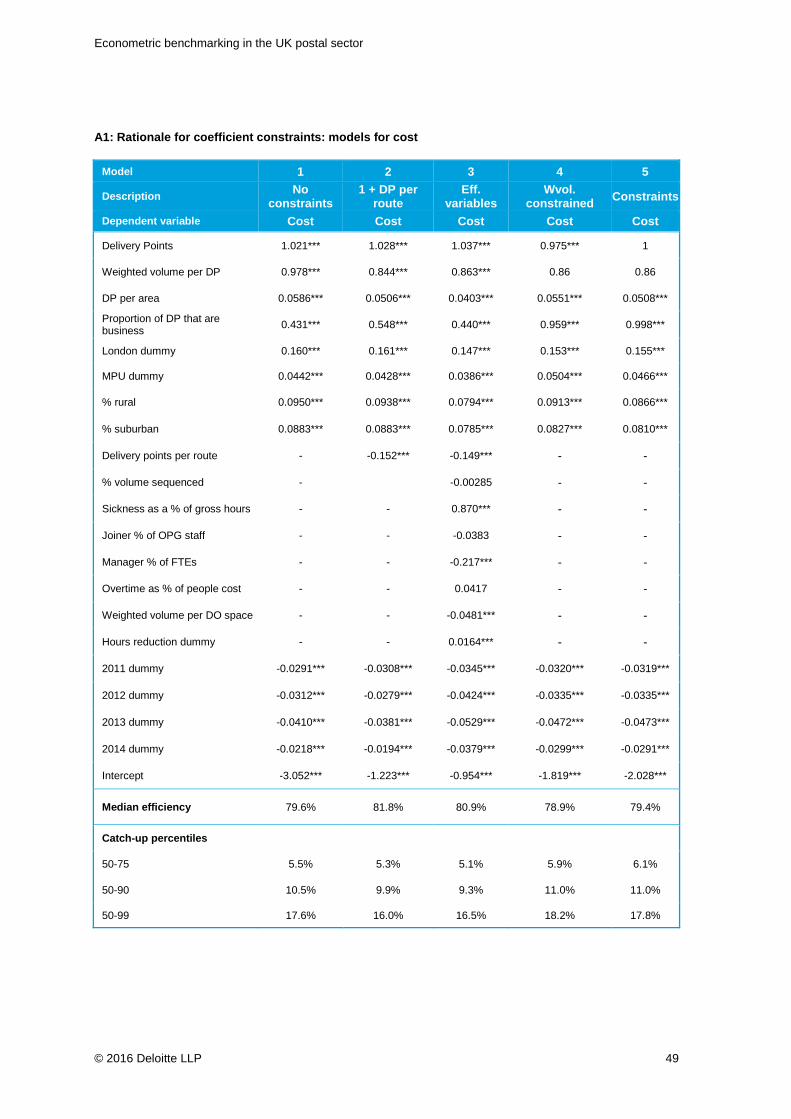
Econometric benchmarking in the UK postal sector
© 2016 Deloitte LLP 49
A1: Rationale for coefficient constraints: models for cost
Model 1 2 3 4 5 Description No
constraints 1 + DP per
route Eff.
variables Wvol.
constrained Constraints Dependent variable Cost Cost Cost Cost Cost Delivery Points 1.021*** 1.028*** 1.037*** 0.975*** 1 Weighted volume per DP 0.978*** 0.844*** 0.863*** 0.86 0.86 DP per area 0.0586*** 0.0506*** 0.0403*** 0.0551*** 0.0508*** Proportion of DP that are business 0.431*** 0.548*** 0.440*** 0.959*** 0.998*** London dummy 0.160*** 0.161*** 0.147*** 0.153*** 0.155*** MPU dummy 0.0442*** 0.0428*** 0.0386*** 0.0504*** 0.0466*** % rural 0.0950*** 0.0938*** 0.0794*** 0.0913*** 0.0866*** % suburban 0.0883*** 0.0883*** 0.0785*** 0.0827*** 0.0810*** Delivery points per route - -0.152*** -0.149*** - - % volume sequenced - -0.00285 - -
Sickness as a % of gross hours - - 0.870*** - -
Joiner % of OPG staff - - -0.0383 - -
Manager % of FTEs - - -0.217*** - -
Overtime as % of people cost - - 0.0417 - -
Weighted volume per DO space - - -0.0481*** - -
Hours reduction dummy - - 0.0164*** - -
2011 dummy -0.0291*** -0.0308*** -0.0345*** -0.0320*** -0.0319*** 2012 dummy -0.0312*** -0.0279*** -0.0424*** -0.0335*** -0.0335*** 2013 dummy -0.0410*** -0.0381*** -0.0529*** -0.0472*** -0.0473*** 2014 dummy -0.0218*** -0.0194*** -0.0379*** -0.0299*** -0.0291*** Intercept -3.052*** -1.223*** -0.954*** -1.819*** -2.028*** Median efficiency 79.6% 81.8% 80.9% 78.9% 79.4% Catch-up percentiles
50-75 5.5% 5.3% 5.1% 5.9% 6.1% 50-90 10.5% 9.9% 9.3% 11.0% 11.0% 50-99 17.6% 16.0% 16.5% 18.2% 17.8%
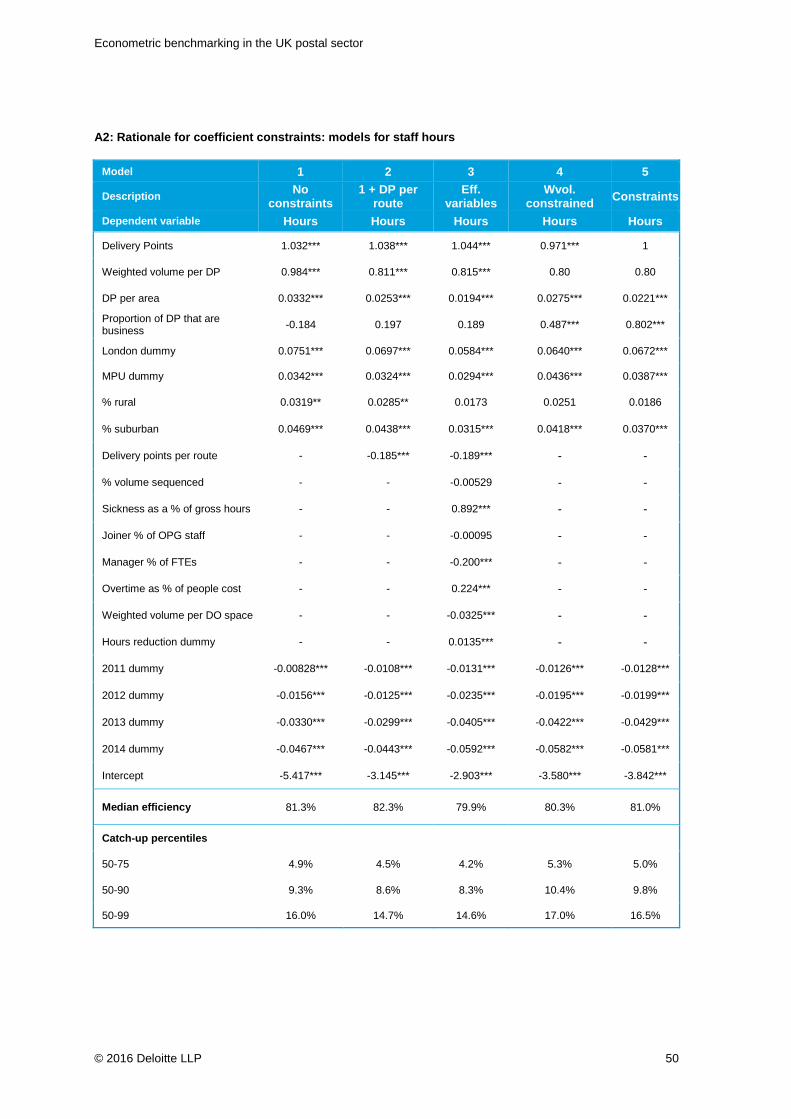
Econometric benchmarking in the UK postal sector
© 2016 Deloitte LLP 50
A2: Rationale for coefficient constraints: models for staff hours
Model 1 2 3 4 5 Description No
constraints 1 + DP per
route Eff.
variables Wvol.
constrained Constraints Dependent variable Hours Hours Hours Hours Hours Delivery Points 1.032*** 1.038*** 1.044*** 0.971*** 1 Weighted volume per DP 0.984*** 0.811*** 0.815*** 0.80 0.80 DP per area 0.0332*** 0.0253*** 0.0194*** 0.0275*** 0.0221*** Proportion of DP that are business -0.184 0.197 0.189 0.487*** 0.802*** London dummy 0.0751*** 0.0697*** 0.0584*** 0.0640*** 0.0672*** MPU dummy 0.0342*** 0.0324*** 0.0294*** 0.0436*** 0.0387*** % rural 0.0319** 0.0285** 0.0173 0.0251 0.0186 % suburban 0.0469*** 0.0438*** 0.0315*** 0.0418*** 0.0370*** Delivery points per route - -0.185*** -0.189*** - - % volume sequenced - - -0.00529 - -
Sickness as a % of gross hours - - 0.892*** - -
Joiner % of OPG staff - - -0.00095 - -
Manager % of FTEs - - -0.200*** - -
Overtime as % of people cost - - 0.224*** - -
Weighted volume per DO space - - -0.0325*** - -
Hours reduction dummy - - 0.0135*** - -
2011 dummy -0.00828*** -0.0108*** -0.0131*** -0.0126*** -0.0128*** 2012 dummy -0.0156*** -0.0125*** -0.0235*** -0.0195*** -0.0199*** 2013 dummy -0.0330*** -0.0299*** -0.0405*** -0.0422*** -0.0429*** 2014 dummy -0.0467*** -0.0443*** -0.0592*** -0.0582*** -0.0581*** Intercept -5.417*** -3.145*** -2.903*** -3.580*** -3.842*** Median efficiency 81.3% 82.3% 79.9% 80.3% 81.0% Catch-up percentiles
50-75 4.9% 4.5% 4.2% 5.3% 5.0% 50-90 9.3% 8.6% 8.3% 10.4% 9.8% 50-99 16.0% 14.7% 14.6% 17.0% 16.5%
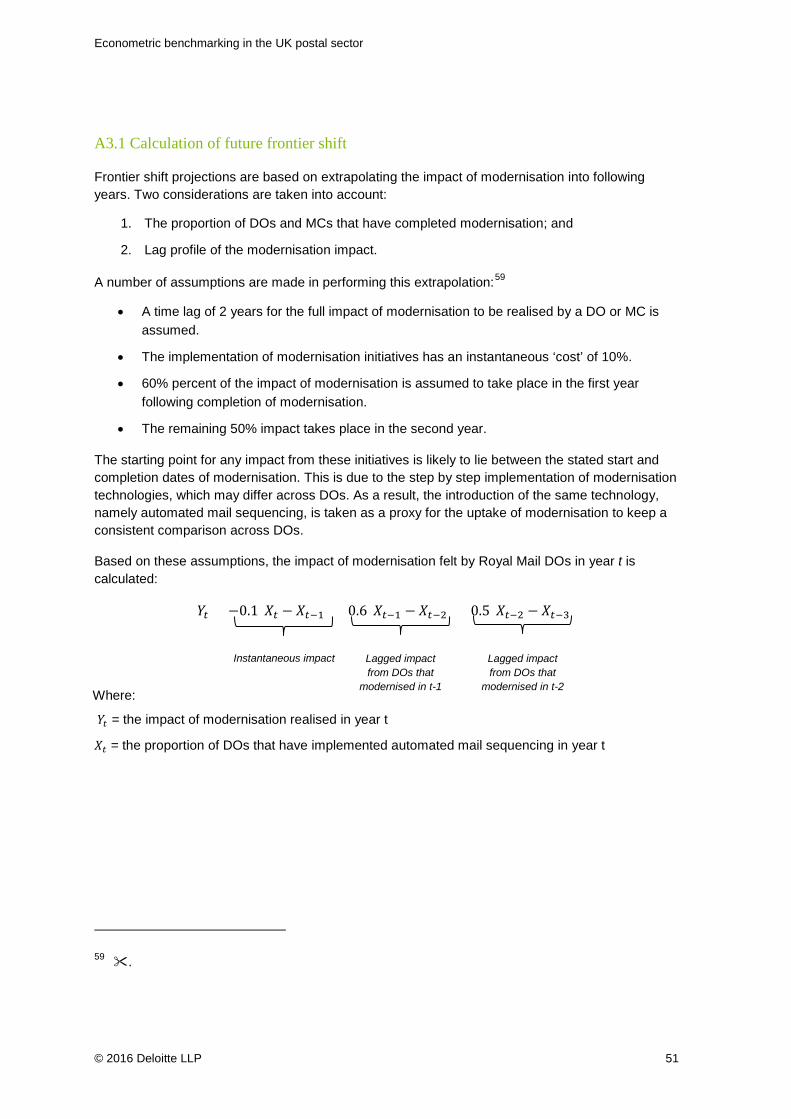
Econometric benchmarking in the UK postal sector
© 2016 Deloitte LLP 51
A3.1 Calculation of future frontier shift
Frontier shift projections are based on extrapolating the impact of modernisation into following years. Two considerations are taken into account:
1. The proportion of DOs and MCs that have completed modernisation; and
2. Lag profile of the modernisation impact.
A number of assumptions are made in performing this extrapolation:59
• A time lag of 2 years for the full impact of modernisation to be realised by a DO or MC is assumed.
• The implementation of modernisation initiatives has an instantaneous ‘cost’ of 10%.
• 60% percent of the impact of modernisation is assumed to take place in the first year following completion of modernisation.
• The remaining 50% impact takes place in the second year.
The starting point for any impact from these initiatives is likely to lie between the stated start and completion dates of modernisation. This is due to the step by step implementation of modernisation technologies, which may differ across DOs. As a result, the introduction of the same technology, namely automated mail sequencing, is taken as a proxy for the uptake of modernisation to keep a consistent comparison across DOs.
Based on these assumptions, the impact of modernisation felt by Royal Mail DOs in year t is calculated:
𝑌𝑌𝑖𝑖 = −0.1(𝑋𝑋𝑖𝑖 − 𝑋𝑋𝑖𝑖−1) + 0.6(𝑋𝑋𝑖𝑖−1 − 𝑋𝑋𝑖𝑖−2) + 0.5(𝑋𝑋𝑖𝑖−2 − 𝑋𝑋𝑖𝑖−3)
𝑌𝑌𝑖𝑖 = the impact of modernisation realised in year t
𝑋𝑋𝑖𝑖 = the proportion of DOs that have implemented automated mail sequencing in year t
59 .
Instantaneous impact Lagged impact from DOs that
modernised in t-1
Lagged impact from DOs that
modernised in t-2 Where:
Econometric benchmarking in the UK postal sector
© 2016 Deloitte LLP 52
A4.1 DO Sensitivity results
Sensitivity of catch-up and frontier shift estimates
A number of sensitivities were performed to review the robustness of the baseline staff costs and hours models to the inclusion of additional variables and alternative model specifications; these enable the development of a range of possible efficiency savings. These are summarised in table A3, with full model results in A4-5. The following models are presented:
Model 1: This is the baseline model discussed in the main sections of this report. This was estimated with the top and bottom 1% of efficiency scores removed following initial estimation. The specification is the Battese-Coelli 1992 time-invariant model, with year dummy variables included to capture the frontier shift. The underlying distribution of efficiency scores is assumed to be of a truncated normal form.
Model 2: The baseline models were estimated employing a single linear trend variable as opposed to year dummies. The frontier shift estimated from this model is similar to the baseline model.
Model 3: The top and bottom 5% of efficiency scores were removed (as opposed to the top and bottom 1% in the baseline model), having first estimated a model with no outlier criteria. A small decrease in the catch-up gap estimated is observed at the upper quartile and decile benchmarks. By construction, the width of the distribution of catch-up efficiency scores also narrows, leading to a smaller catch-up estimate to the frontier.
Model 4: The baseline model was estimated without imposing any coefficient constraints leading to smaller estimates for both the catch-up gap and frontier shift.
Model 5: Efficiency scores were allowed to vary over time using the Battese–Coelli (1992) time varying decay model. The baseline model captures time variation in efficiency through the time dummies whereas this model through variation in the efficiency scores. The implied frontier shift implied by the time-decay model is similar to the baseline model for staff costs, although 1.5 percentage points lower for staff hours.
Model 6: Variables that are potentially within management control, such as the proportion of volume that is sequenced, were included in the model. A decrease in catch-up of approximately 1 percentage point at the upper quartile and 1.5 percentage points at the upper decile is observed, suggesting that part of the catch-up estimates in the baseline model can be explained by these variables.
Model 7: The Battese-Coelli (1995) model allows for the inefficiency component to be modelled directly as a function of factors that are potentially within management control (Ui or inefficiency equation), whilst simultaneously modelling staff cost and hours as a function of exogenous determinants (mean equation). The mean equation for staff costs and hours is presented as part of the full results in tables A4 and A5 for staff costs and hours, with the Ui equation presented in table A6. The advantage of this model is that it identifies the catch-up efficiency by using information on the factors that potentially drive differences in efficiency across DOs. However, if there are other factors that affect efficiency but excluded from the model then the efficiency estimates may be biased. Battese-Coelli (1995) model provides the lowest catch-up and frontier shift estimates.
Model 8: The baseline model assumes a truncated normal distribution of efficiency scores, which determines the maximisation of the likelihood function. The sensitivity of the catch-up and frontier
Econometric benchmarking in the UK postal sector
© 2016 Deloitte LLP 53
shift was therefore examined when assuming a half-normal distribution of efficiency scores. The catch-up estimates remain robust to the change in distributional assumption, albeit with a slight fall in estimated frontier shift. By construction, the median efficiency score increases relative to the baseline models.
Overall, the sensitivity results from the DO analysis suggests that the baseline models may represent an upper bound of the total efficiency savings possible to Royal Mail, based upon the historical frontier shift and catch-up opportunity found.
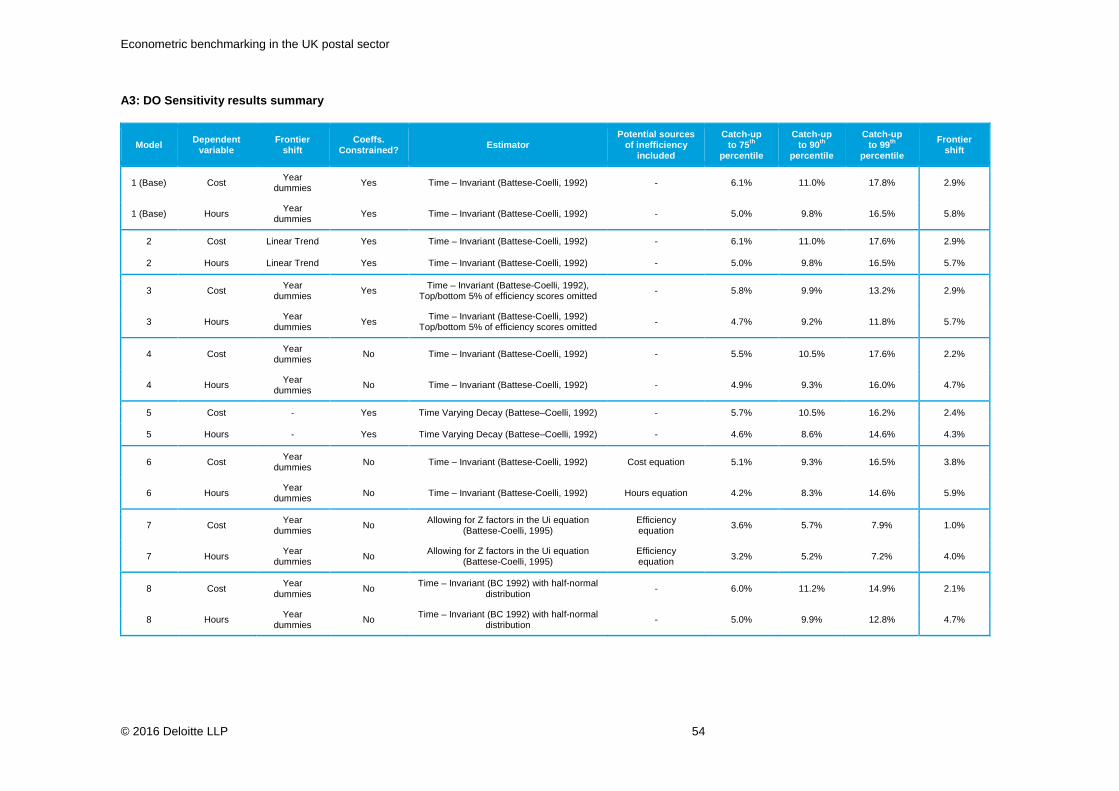
Econometric benchmarking in the UK postal sector
© 2016 Deloitte LLP 54
A3: DO Sensitivity results summary
Model Dependent variable
Frontier shift
Coeffs. Constrained? Estimator
Potential sources of inefficiency
included
Catch-up to 75th
percentile
Catch-up to 90th
percentile
Catch-up to 99th
percentile
Frontier shift
1 (Base) Cost Year dummies Yes Time – Invariant (Battese-Coelli, 1992) - 6.1% 11.0% 17.8% 2.9%
1 (Base) Hours Year dummies Yes Time – Invariant (Battese-Coelli, 1992) - 5.0% 9.8% 16.5% 5.8%
2 Cost Linear Trend Yes Time – Invariant (Battese-Coelli, 1992) - 6.1% 11.0% 17.6% 2.9%
2 Hours Linear Trend Yes Time – Invariant (Battese-Coelli, 1992) - 5.0% 9.8% 16.5% 5.7%
3 Cost Year dummies Yes Time – Invariant (Battese-Coelli, 1992),
Top/bottom 5% of efficiency scores omitted - 5.8% 9.9% 13.2% 2.9%
3 Hours Year dummies Yes Time – Invariant (Battese-Coelli, 1992)
Top/bottom 5% of efficiency scores omitted - 4.7% 9.2% 11.8% 5.7%
4 Cost Year dummies No Time – Invariant (Battese-Coelli, 1992) - 5.5% 10.5% 17.6% 2.2%
4 Hours Year dummies No Time – Invariant (Battese-Coelli, 1992) - 4.9% 9.3% 16.0% 4.7%
5 Cost - Yes Time Varying Decay (Battese–Coelli, 1992) - 5.7% 10.5% 16.2% 2.4%
5 Hours - Yes Time Varying Decay (Battese–Coelli, 1992) - 4.6% 8.6% 14.6% 4.3%
6 Cost Year dummies No Time – Invariant (Battese-Coelli, 1992) Cost equation 5.1% 9.3% 16.5% 3.8%
6 Hours Year dummies No Time – Invariant (Battese-Coelli, 1992) Hours equation 4.2% 8.3% 14.6% 5.9%
7 Cost Year dummies No Allowing for Z factors in the Ui equation
(Battese-Coelli, 1995) Efficiency equation 3.6% 5.7% 7.9% 1.0%
7 Hours Year dummies No Allowing for Z factors in the Ui equation
(Battese-Coelli, 1995) Efficiency equation 3.2% 5.2% 7.2% 4.0%
8 Cost Year dummies No Time – Invariant (BC 1992) with half-normal
distribution - 6.0% 11.2% 14.9% 2.1%
8 Hours Year dummies No Time – Invariant (BC 1992) with half-normal
distribution - 5.0% 9.9% 12.8% 4.7%
Econometric benchmarking in the UK postal sector
© 2016 Deloitte LLP 55
DO coefficient estimates
Full model results from the sensitivities described are presented in tables A4 and A5 for costs and hours. Variables are all strongly significant in the majority of cases. What is noticeable from these results is the instability of the coefficients on variables included to account for differences in geography across DOs. In particular, the proportion of delivery points classed as business was included to account for differences in urban density across the area covered by DOs. The coefficient on this variable is sensitive to the specification chosen; this might be due to the collinearity between the geography variables included. Also, fluctuation within the rural percentage variable is visible in the alternative hours model specifications. Otherwise, coefficients remain relatively stable across the specifications chosen. There is some variation in the frontier shift, as discussed previously.
Inclusion of potential sources of efficiency (Model 6)
When efficiency variables are included within the mean equation (model 6 in tables A4 and A5), variables that are significant have the correct sign. For example, a 1% increase in the number of delivery points per route, included as a proxy for enhanced route optimisation, is shown to decrease staff costs by 0.15% and staff hours by 0.19%. One exception to this is the hours reduction dummy, representing when the DO applied the hours reduction. This is shown to marginally increase staff costs and hours. However, collinearity across these variables is a possible cause for this result, for example between the hour reduction dummy and the proportion of volume that is sequenced (0.65).
Battese-Coelli (1995) model inefficiency equation (Model 7)
The inefficiency equation estimated within the Battese-Coelli (1995) model is shown in table A6. It is noted that these coefficients are not directly interpretable as they do not reflect marginal effects. However, all coefficients are significant at the 1% level and all but the hours reduction dummy have the expected sign. This exception may again result from correlation between the hours reduction dummy and the proportion of volume that is sequenced. For example, the number of delivery points per route and the proportion of volume that is sequenced are estimated to reduce inefficiencies, whilst an increase in sickness as a proportion of gross hours is, as expected, shown to increases inefficiencies across DOs. The coefficients on these variables do not represent elasticities, so cannot be interpreted directly. However, their sign and magnitude does provide insight as to which of these factors may have a strong effect on inefficiency.
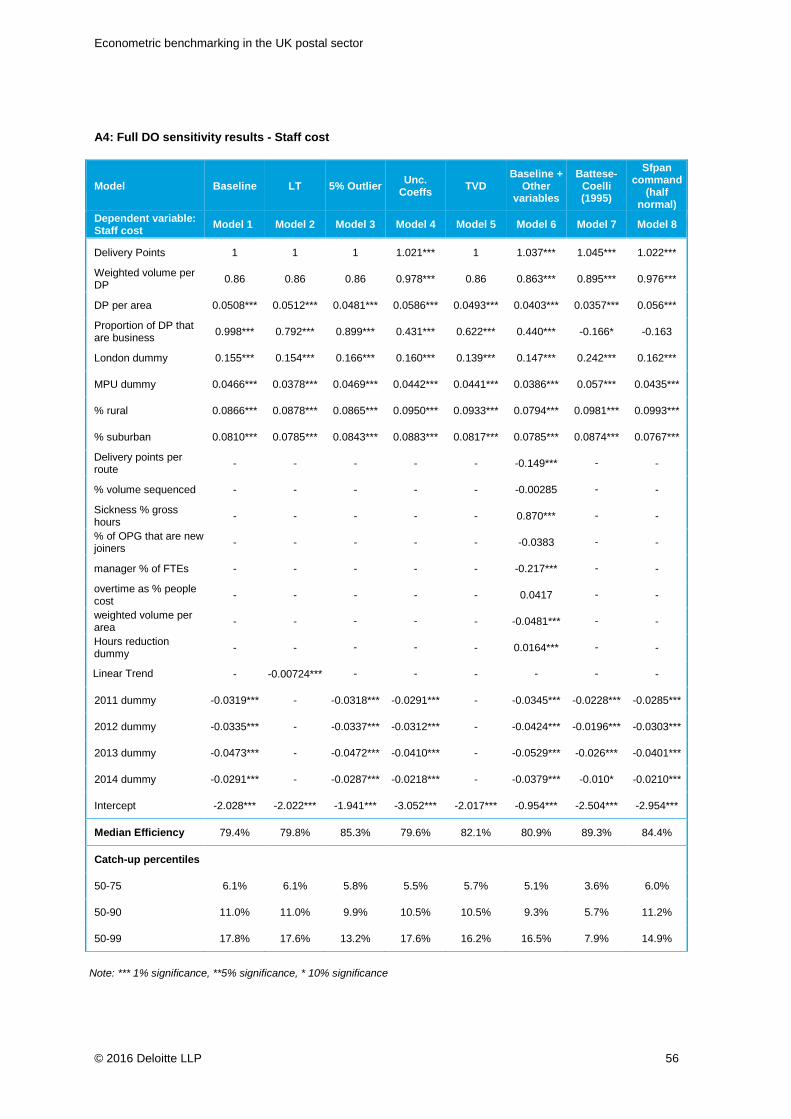
Econometric benchmarking in the UK postal sector
© 2016 Deloitte LLP 56
A4: Full DO sensitivity results - Staff cost
Model Baseline LT 5% Outlier Unc. Coeffs TVD
Baseline + Other
variables
Battese-Coelli (1995)
Sfpan command
(half normal)
Dependent variable: Staff cost Model 1 Model 2 Model 3 Model 4 Model 5 Model 6 Model 7 Model 8
Delivery Points 1 1 1 1.021*** 1 1.037*** 1.045*** 1.022***
Weighted volume per DP 0.86 0.86 0.86 0.978*** 0.86 0.863*** 0.895*** 0.976***
DP per area 0.0508*** 0.0512*** 0.0481*** 0.0586*** 0.0493*** 0.0403*** 0.0357*** 0.056***
Proportion of DP that are business 0.998*** 0.792*** 0.899*** 0.431*** 0.622*** 0.440*** -0.166* -0.163
London dummy 0.155*** 0.154*** 0.166*** 0.160*** 0.139*** 0.147*** 0.242*** 0.162***
MPU dummy 0.0466*** 0.0378*** 0.0469*** 0.0442*** 0.0441*** 0.0386*** 0.057*** 0.0435***
% rural 0.0866*** 0.0878*** 0.0865*** 0.0950*** 0.0933*** 0.0794*** 0.0981*** 0.0993***
% suburban 0.0810*** 0.0785*** 0.0843*** 0.0883*** 0.0817*** 0.0785*** 0.0874*** 0.0767***
Delivery points per route - - - - - -0.149*** - -
% volume sequenced - - - - - -0.00285 - -
Sickness % gross hours - - - - - 0.870*** - -
% of OPG that are new joiners - - - - - -0.0383 - -
manager % of FTEs - - - - - -0.217*** - -
overtime as % people cost - - - - - 0.0417 - -
weighted volume per area - - - - - -0.0481*** - -
Hours reduction dummy - - - - - 0.0164*** - -
Linear Trend - -0.00724*** - - - - - -
2011 dummy -0.0319*** - -0.0318*** -0.0291*** - -0.0345*** -0.0228*** -0.0285***
2012 dummy -0.0335*** - -0.0337*** -0.0312*** - -0.0424*** -0.0196*** -0.0303***
2013 dummy -0.0473*** - -0.0472*** -0.0410*** - -0.0529*** -0.026*** -0.0401***
2014 dummy -0.0291*** - -0.0287*** -0.0218*** - -0.0379*** -0.010* -0.0210***
Intercept -2.028*** -2.022*** -1.941*** -3.052*** -2.017*** -0.954*** -2.504*** -2.954***
Median Efficiency 79.4% 79.8% 85.3% 79.6% 82.1% 80.9% 89.3% 84.4%
Catch-up percentiles
50-75 6.1% 6.1% 5.8% 5.5% 5.7% 5.1% 3.6% 6.0%
50-90 11.0% 11.0% 9.9% 10.5% 10.5% 9.3% 5.7% 11.2%
50-99 17.8% 17.6% 13.2% 17.6% 16.2% 16.5% 7.9% 14.9%
Note: *** 1% significance, **5% significance, * 10% significance
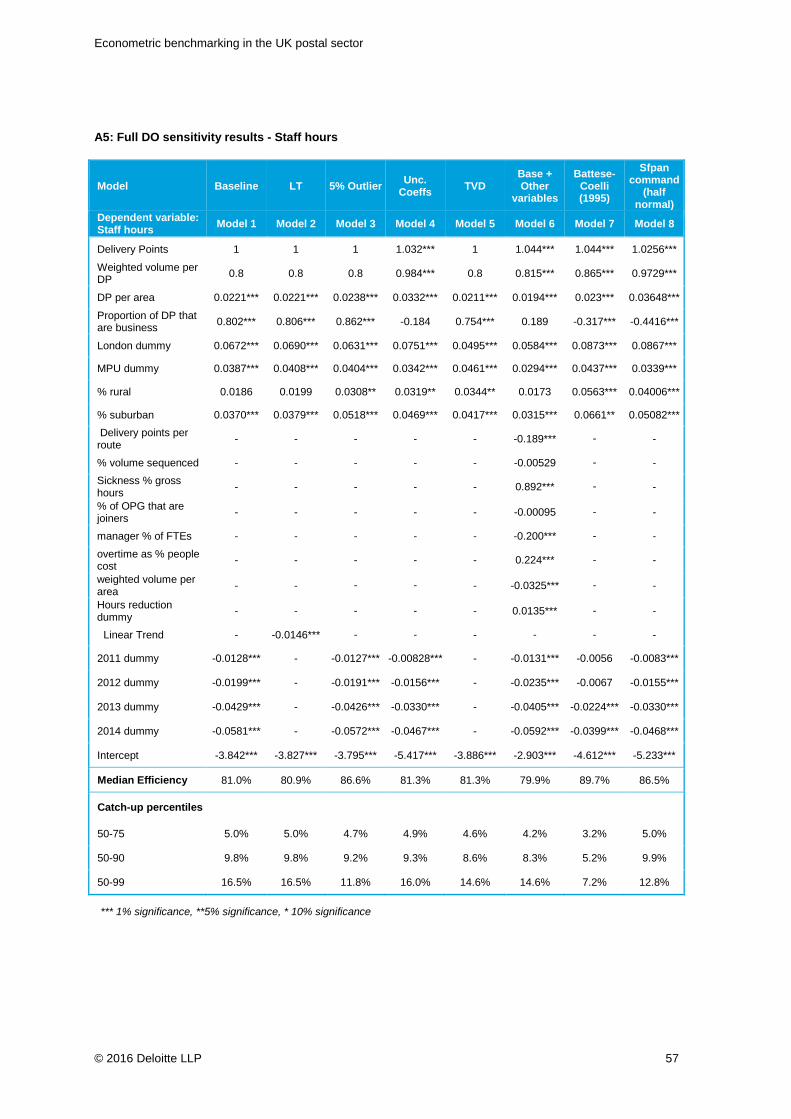
Econometric benchmarking in the UK postal sector
© 2016 Deloitte LLP 57
A5: Full DO sensitivity results - Staff hours
Model Baseline LT 5% Outlier Unc. Coeffs TVD
Base + Other
variables
Battese-Coelli (1995)
Sfpan command
(half normal)
Dependent variable: Staff hours Model 1 Model 2 Model 3 Model 4 Model 5 Model 6 Model 7 Model 8
Delivery Points 1 1 1 1.032*** 1 1.044*** 1.044*** 1.0256*** Weighted volume per DP 0.8 0.8 0.8 0.984*** 0.8 0.815*** 0.865*** 0.9729*** DP per area 0.0221*** 0.0221*** 0.0238*** 0.0332*** 0.0211*** 0.0194*** 0.023*** 0.03648*** Proportion of DP that are business 0.802*** 0.806*** 0.862*** -0.184 0.754*** 0.189 -0.317*** -0.4416*** London dummy 0.0672*** 0.0690*** 0.0631*** 0.0751*** 0.0495*** 0.0584*** 0.0873*** 0.0867*** MPU dummy 0.0387*** 0.0408*** 0.0404*** 0.0342*** 0.0461*** 0.0294*** 0.0437*** 0.0339*** % rural 0.0186 0.0199 0.0308** 0.0319** 0.0344** 0.0173 0.0563*** 0.04006*** % suburban 0.0370*** 0.0379*** 0.0518*** 0.0469*** 0.0417*** 0.0315*** 0.0661** 0.05082*** Delivery points per route - - - - - -0.189*** - - % volume sequenced - - - - - -0.00529 - - Sickness % gross hours - - - - - 0.892*** - - % of OPG that are joiners - - - - - -0.00095 - - manager % of FTEs - - - - - -0.200*** - - overtime as % people cost - - - - - 0.224*** - - weighted volume per area - - - - - -0.0325*** - - Hours reduction dummy - - - - - 0.0135*** - -
Linear Trend - -0.0146*** - - - - - - 2011 dummy -0.0128*** - -0.0127*** -0.00828*** - -0.0131*** -0.0056 -0.0083*** 2012 dummy -0.0199*** - -0.0191*** -0.0156*** - -0.0235*** -0.0067 -0.0155*** 2013 dummy -0.0429*** - -0.0426*** -0.0330*** - -0.0405*** -0.0224*** -0.0330*** 2014 dummy -0.0581*** - -0.0572*** -0.0467*** - -0.0592*** -0.0399*** -0.0468*** Intercept -3.842*** -3.827*** -3.795*** -5.417*** -3.886*** -2.903*** -4.612*** -5.233*** Median Efficiency 81.0% 80.9% 86.6% 81.3% 81.3% 79.9% 89.7% 86.5% Catch-up percentiles 50-75 5.0% 5.0% 4.7% 4.9% 4.6% 4.2% 3.2% 5.0% 50-90 9.8% 9.8% 9.2% 9.3% 8.6% 8.3% 5.2% 9.9% 50-99 16.5% 16.5% 11.8% 16.0% 14.6% 14.6% 7.2% 12.8%
*** 1% significance, **5% significance, * 10% significance
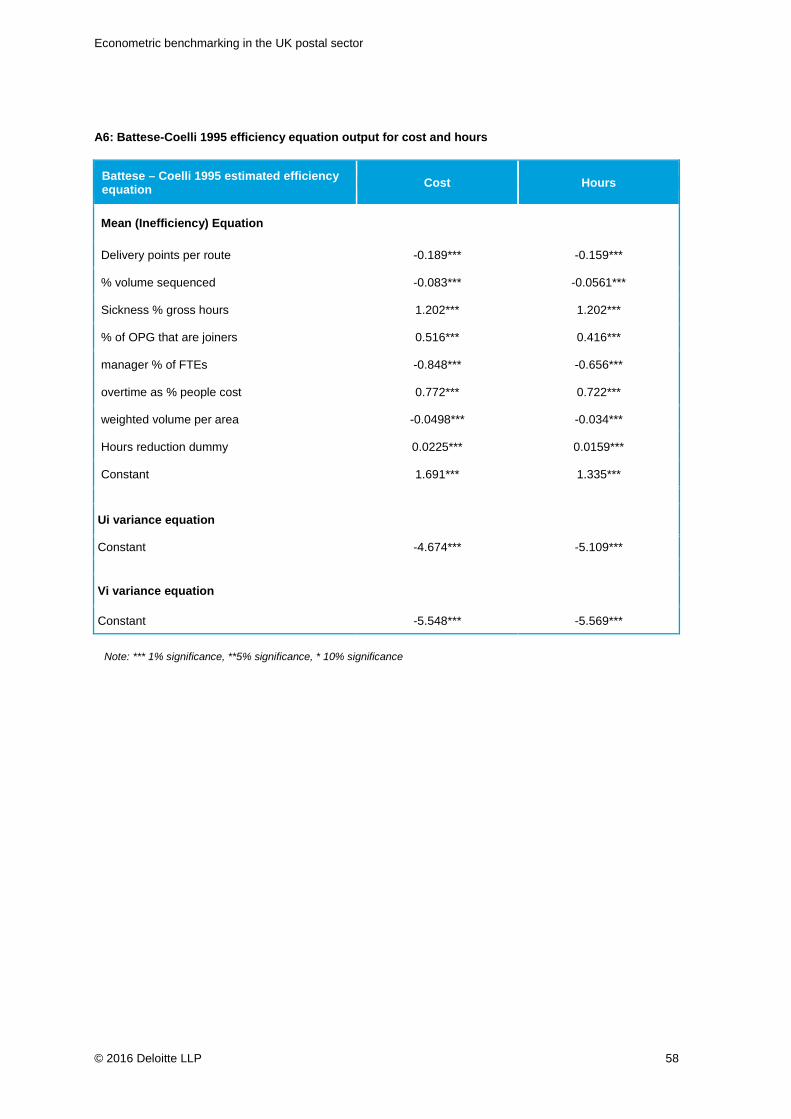
Econometric benchmarking in the UK postal sector
© 2016 Deloitte LLP 58
A6: Battese-Coelli 1995 efficiency equation output for cost and hours
Battese – Coelli 1995 estimated efficiency equation Cost Hours
Mean (Inefficiency) Equation Delivery points per route -0.189*** -0.159***
% volume sequenced -0.083*** -0.0561*** Sickness % gross hours 1.202*** 1.202*** % of OPG that are joiners 0.516*** 0.416*** manager % of FTEs -0.848*** -0.656*** overtime as % people cost 0.772*** 0.722*** weighted volume per area -0.0498*** -0.034*** Hours reduction dummy 0.0225*** 0.0159*** Constant 1.691*** 1.335*** Ui variance equation
Constant -4.674*** -5.109*** Vi variance equation
Constant -5.548*** -5.569***
Note: *** 1% significance, **5% significance, * 10% significance
Econometric benchmarking in the UK postal sector
© 2016 Deloitte LLP 59
A4.2 MC Sensitivity results
Sensitivity of coefficient and frontier shift estimates
A number of robustness checks were performed upon the baseline MC models. Due to the lower number of unique observations, the full suite of SFA models could not be tested due to issues in obtaining convergence of the likelihood function. However, a number of models including additional variables and alternative assumptions were run. The results of the catch-up and frontier shift components are presented in table A7, with full results in tables A8 and A9. The models included are:
Model 1: Results from the baseline model are first presented for comparison. This was estimated using the specific removal of the re-occurring top and bottom four MCs in terms of efficiency scores. The specification used is time-invariant, with year dummies included to capture the frontier shift. A truncated normal distribution of efficiency scores is also assumed.
Model 2: A linear trend is included to review the sensitivity of the baseline results to the specification of the frontier shift. The frontier shift estimates remain robust, although some volatility is observed within the catch-up estimates, particularly for staff hours.
Model 3: The ratio of inward to outward workload was included to account for scale, given that larger MCs are observed to have larger proportions of outward volumes (destined for a MC). This variable was insignificant in both cost and hours models. Small variation in the catch-up estimates was observed.
Model 4: Potential sources of efficiency were included within the model to review the impact on the catch-up opportunity. The frontier shift cannot be interpreted in this model due to correlation between the efficiency sources and the year dummies. Although the width of the distribution narrows, the catch-up opportunities measured by the upper quartile increase. This may result from the possible existence of collinearity across the variables included; the majority of coefficients are also insignificant within the model.
Model 5: The baseline model was re-estimated assuming a half-normal distribution of efficiency scores. By construction, the median efficiency score increases to c.85% for both staff costs and hours, with a narrower overall distribution. The estimated catch-up opportunity also increases at the upper quartile and decile benchmarks relative to the baseline specification, whilst the frontier shift represents an upper bound for staff hours.
Overall, some variation is observed within the catch-up estimates. The baseline model tends to provide estimates close to the lower bound catch-up opportunity amongst the models estimated. The median efficiency score remains at approximately 70% across the range of models, although increases when a half-normal distribution is assumed, as could be expected. The frontier shift estimates remain robust across the different models, although the half-normal distribution for staff hours suggests that marginally higher historical savings may have been achieved.
Despite these robustness checks providing some confidence to the MC results, not all SFA extensions could be estimated due to the lower sample size, for instance the Battese-Coelli (1995)
Econometric benchmarking in the UK postal sector
© 2016 Deloitte LLP 60
specification, a model which had provided a lower bound at the DO-level. This represents a notable caveat to the MC results.
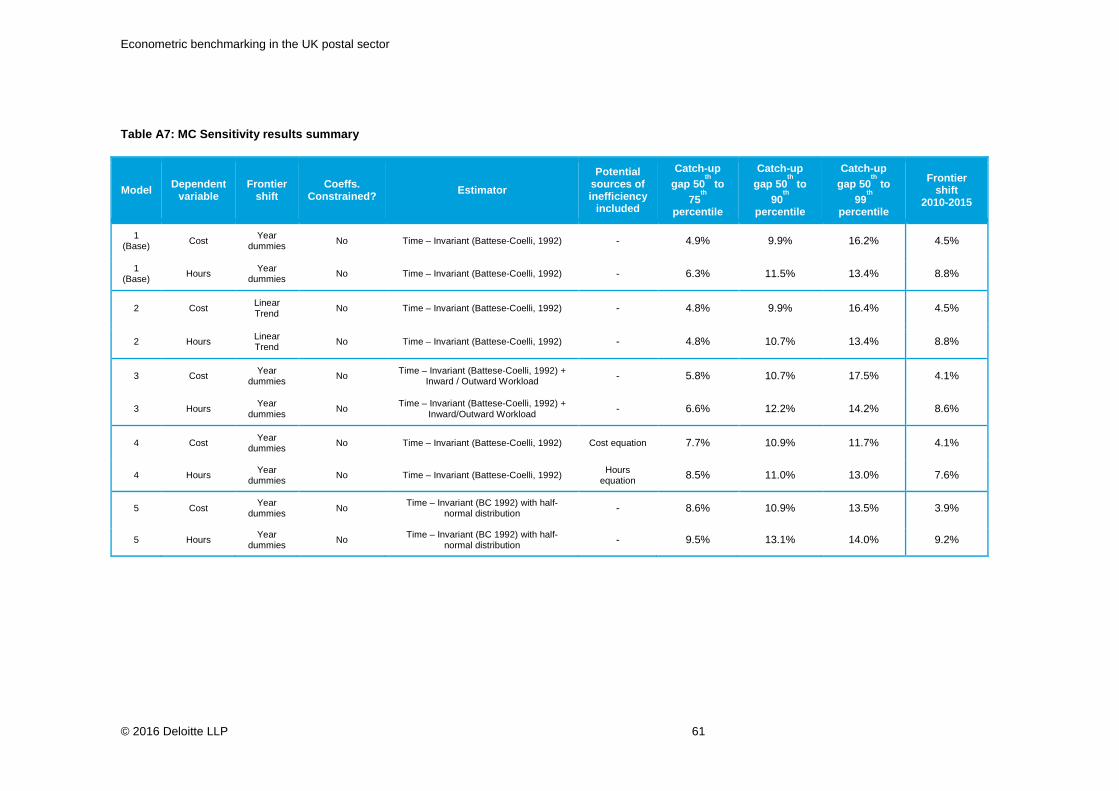
Econometric benchmarking in the UK postal sector
© 2016 Deloitte LLP 61
Table A7: MC Sensitivity results summary
Model Dependent variable Frontier
shift Coeffs. Constrained? Estimator
Potential sources of inefficiency
included
Catch-up gap 50
th to
75th
percentile
Catch-up gap 50
th to
90th
percentile
Catch-up gap 50
th to
99th
percentile
Frontier shift
2010-2015 1
(Base) Cost Year dummies No Time – Invariant (Battese-Coelli, 1992) - 4.9% 9.9% 16.2% 4.5%
1 (Base) Hours Year
dummies No Time – Invariant (Battese-Coelli, 1992) - 6.3% 11.5% 13.4% 8.8%
2 Cost Linear Trend No Time – Invariant (Battese-Coelli, 1992) - 4.8% 9.9% 16.4% 4.5%
2 Hours Linear Trend No Time – Invariant (Battese-Coelli, 1992) - 4.8% 10.7% 13.4% 8.8%
3 Cost Year dummies No Time – Invariant (Battese-Coelli, 1992) +
Inward / Outward Workload - 5.8% 10.7% 17.5% 4.1%
3 Hours Year dummies No Time – Invariant (Battese-Coelli, 1992) +
Inward/Outward Workload - 6.6% 12.2% 14.2% 8.6%
4 Cost Year dummies No Time – Invariant (Battese-Coelli, 1992) Cost equation 7.7% 10.9% 11.7% 4.1%
4 Hours Year dummies No Time – Invariant (Battese-Coelli, 1992) Hours
equation 8.5% 11.0% 13.0% 7.6%
5 Cost Year dummies No Time – Invariant (BC 1992) with half-
normal distribution - 8.6% 10.9% 13.5% 3.9%
5 Hours Year dummies No Time – Invariant (BC 1992) with half-
normal distribution - 9.5% 13.1% 14.0% 9.2%
Econometric benchmarking in the UK postal sector
© 2016 Deloitte LLP 62
Coefficient estimates
Coefficient volatility
Large coefficient volatility was observed across the MC specifications, primarily as a result of the low number of observations. Variable insignificance was also an issue. The full model results are illustrated in tables A8 and A9.
As in the DO analysis, the most volatile coefficients were found on variables that were included to account for differences in MC geography. This can be explained by correlation across these variables, in particular between geography factors and the number of DOs per area served by a MC. Indeed correlation with the number of DOs per area served is the key driver underlying the negative London coefficient; when this variable is removed, the London dummy becomes positive and significant.
Efficiency variables
When sources of efficiency were included within the baseline model, many were insignificant, even though the majority held the correct sign. Variables such as the time of final network vehicle, significant in previous specifications, were also found to be insignificant when sources were included, resulting from correlation across the different variables. Of those found to be significant, a higher proportion of managers relative to total employees was found to have a large negative impact on staff costs and hours, whilst an increase in workload per MC size (in square metres) is also found to reduce the inefficiency component.

Econometric benchmarking in the UK postal sector
© 2016 Deloitte LLP 63
Table A8: MC sensitivity results: Staff cost
Model Baseline Linear Trend Baseline + Inward/Outward
Baseline including efficiency sources
Sfpan (half-normal)
Dependent variable: Staff cost Model 1 Model 2 Model 3 Model 4 Model 5 Ln(DO per MC) 0.989*** 0.986*** 0.978*** 1.066*** 1.044***
Ln(Total Workload per DO) 0.713*** 0.703*** 0.677*** 0.821*** 0.836***
Ln(Inward workload/Outward workload) - - -0.044 - -
Ln(DO per area) 0.0809** 0.0827** 0.0830* 0.0727** 0.111***
London dummy -0.112 -0.115 -0.115 -0.0745 -0.141**
Ln(Time of final dispatch) 0.0274 0.00749 0.0053 0.0248 0.221
Ln(Time of final network vehicle) -0.263* -0.269* -0.266* 0.0189 -0.120
% vol. sequenced - - - 0.0777 -
Sickness as % of gross hrs. - - - -0.12 -
OPG joiners as % of OPG staff - - - -0.0216 -
Manger as % of FTEs - - - -0.707** -
Overtime as % of people cost - - - -0.376 -
Workload per m^2 - - - -0.126*** -
Linear Trend - -0.0227*** - - -
2013 dummy -0.0200** - -0.0186* -0.0182* -0.009
2014 dummy -0.0448*** - -0.0413*** -0.0406*** -0.039***
Intercept 2.954* 3.218** 3.678* 2.062 0.447
Median efficiency 73.6% 73.5% 76.9% 86.4% 85.7%
Catch-up percentiles
50-75 4.9% 4.8% 5.8% 7.7% 8.6%
50-90 9.9% 9.9% 10.7% 10.9% 10.9%
50-99 16.2% 16.4% 17.5% 11.7% 13.5%
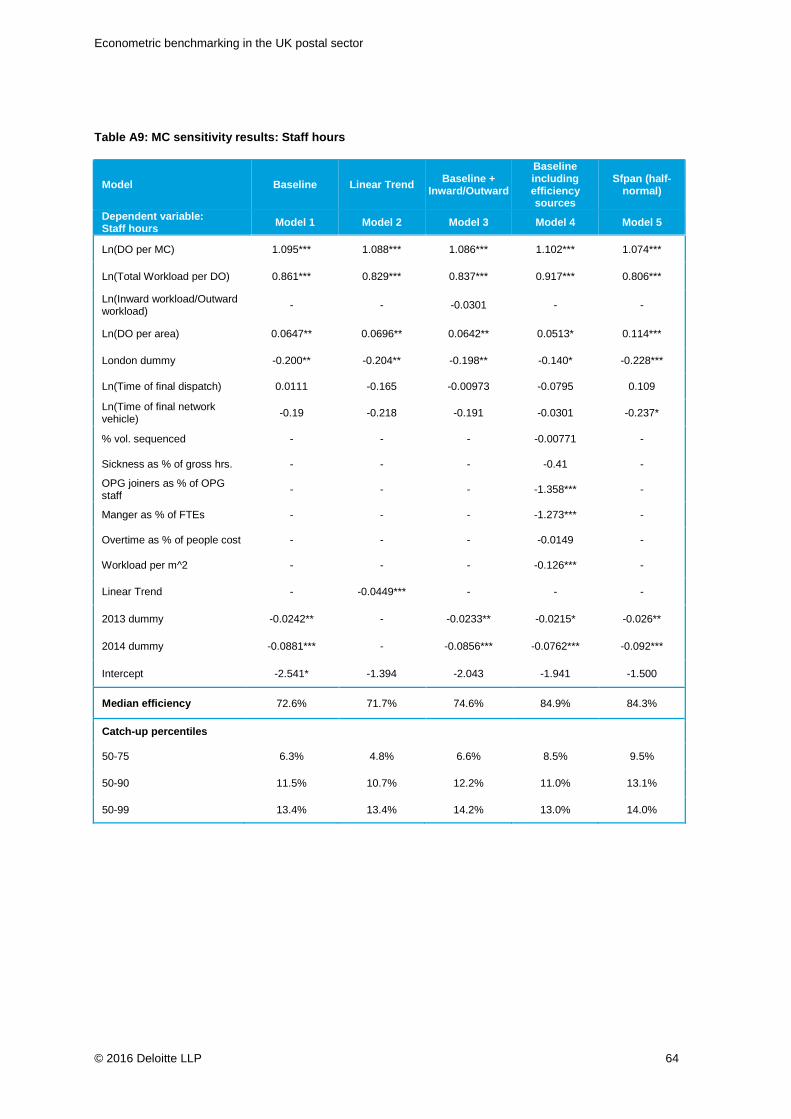
Econometric benchmarking in the UK postal sector
© 2016 Deloitte LLP 64
Table A9: MC sensitivity results: Staff hours
Model Baseline Linear Trend Baseline + Inward/Outward
Baseline including efficiency sources
Sfpan (half-normal)
Dependent variable: Staff hours Model 1 Model 2 Model 3 Model 4 Model 5 Ln(DO per MC) 1.095*** 1.088*** 1.086*** 1.102*** 1.074***
Ln(Total Workload per DO) 0.861*** 0.829*** 0.837*** 0.917*** 0.806***
Ln(Inward workload/Outward workload) - - -0.0301 - -
Ln(DO per area) 0.0647** 0.0696** 0.0642** 0.0513* 0.114***
London dummy -0.200** -0.204** -0.198** -0.140* -0.228***
Ln(Time of final dispatch) 0.0111 -0.165 -0.00973 -0.0795 0.109
Ln(Time of final network vehicle) -0.19 -0.218 -0.191 -0.0301 -0.237*
% vol. sequenced - - - -0.00771 -
Sickness as % of gross hrs. - - - -0.41 -
OPG joiners as % of OPG staff - - - -1.358*** -
Manger as % of FTEs - - - -1.273*** -
Overtime as % of people cost - - - -0.0149 -
Workload per m^2 - - - -0.126*** -
Linear Trend - -0.0449*** - - -
2013 dummy -0.0242** - -0.0233** -0.0215* -0.026**
2014 dummy -0.0881*** - -0.0856*** -0.0762*** -0.092***
Intercept -2.541* -1.394 -2.043 -1.941 -1.500
Median efficiency 72.6% 71.7% 74.6% 84.9% 84.3%
Catch-up percentiles
50-75 6.3% 4.8% 6.6% 8.5% 9.5%
50-90 11.5% 10.7% 12.2% 11.0% 13.1%
50-99 13.4% 13.4% 14.2% 13.0% 14.0%
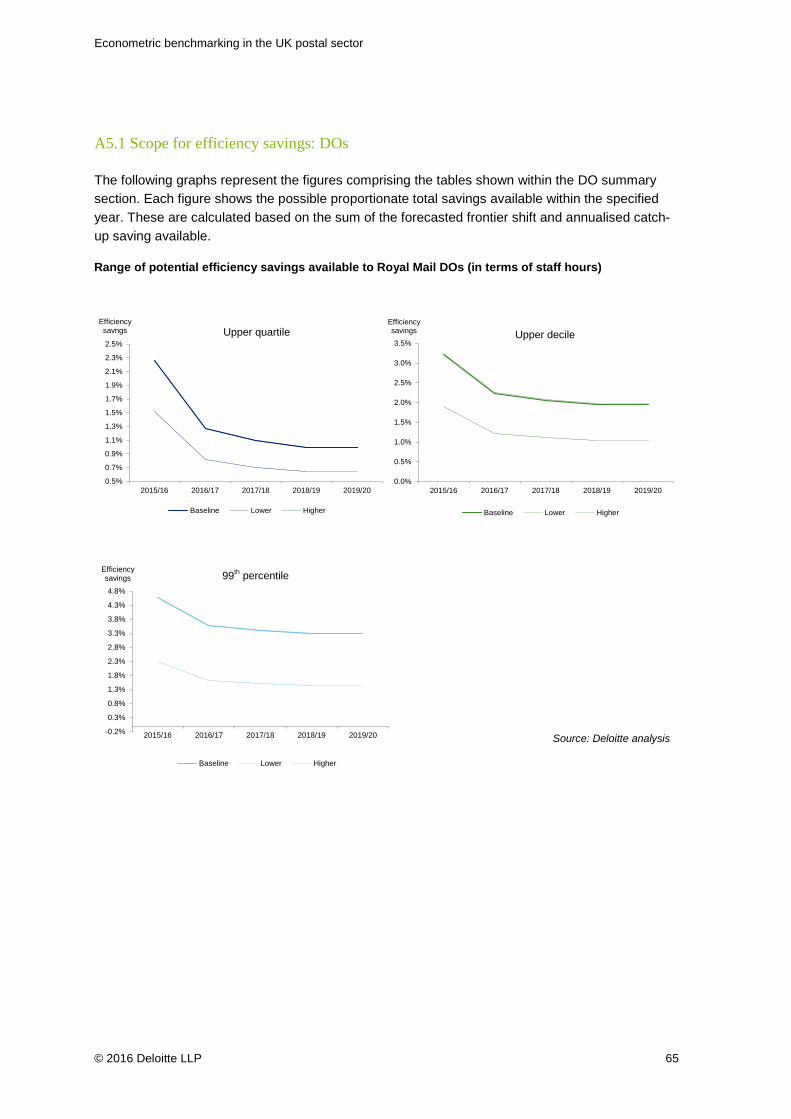
Econometric benchmarking in the UK postal sector
© 2016 Deloitte LLP 65
Range of potential efficiency savings available to Royal Mail DOs (in terms of staff hours)
A5.1 Scope for efficiency savings: DOs
The following graphs represent the figures comprising the tables shown within the DO summary section. Each figure shows the possible proportionate total savings available within the specified year. These are calculated based on the sum of the forecasted frontier shift and annualised catch-up saving available.
Source: Deloitte analysis
0.0%
0.5%
1.0%
1.5%
2.0%
2.5%
3.0%
3.5%
2015/16 2016/17 2017/18 2018/19 2019/20
Efficiency savings
Baseline Lower Higher
0.5%
0.7%
0.9%
1.1%
1.3%
1.5%
1.7%
1.9%
2.1%
2.3%
2.5%
2015/16 2016/17 2017/18 2018/19 2019/20
Efficiencysavngs
Baseline Lower Higher
Upper decile
-0.2%
0.3%
0.8%
1.3%
1.8%
2.3%
2.8%
3.3%
3.8%
4.3%
4.8%
2015/16 2016/17 2017/18 2018/19 2019/20
Efficiency savings
Baseline Lower Higher
99th percentile
Upper quartile
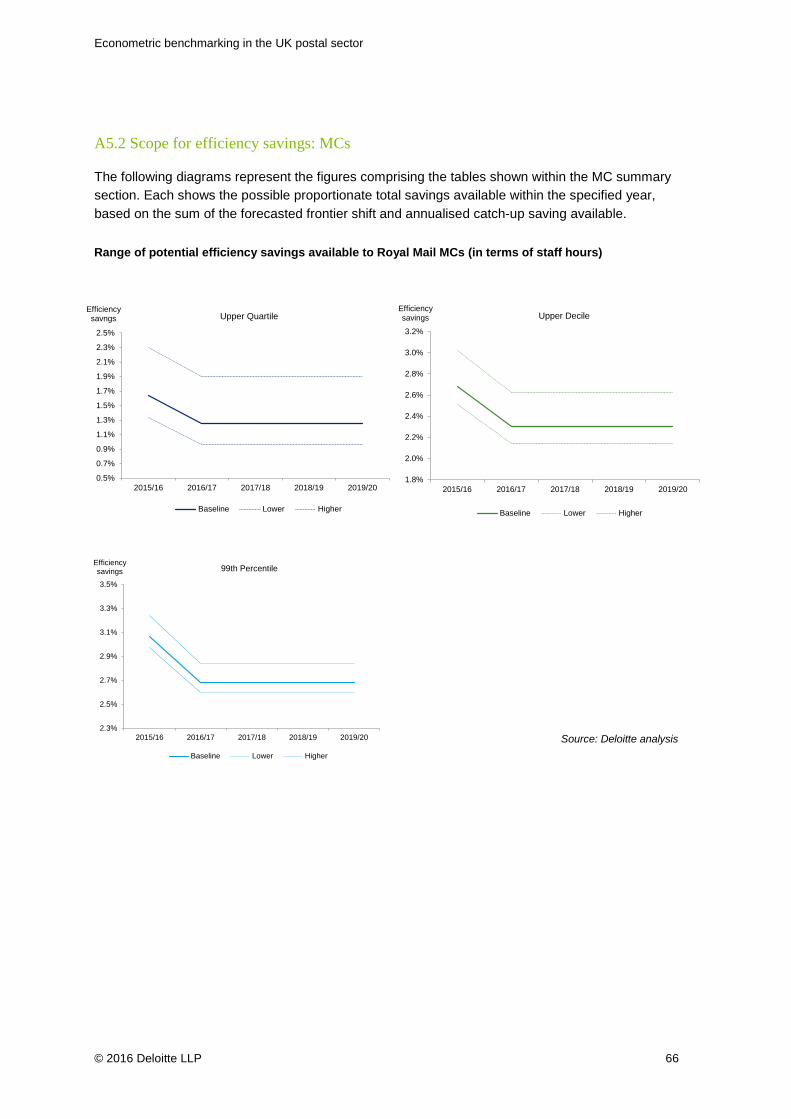
Econometric benchmarking in the UK postal sector
© 2016 Deloitte LLP 66
Range of potential efficiency savings available to Royal Mail MCs (in terms of staff hours)
1.8%
2.0%
2.2%
2.4%
2.6%
2.8%
3.0%
3.2%
2015/16 2016/17 2017/18 2018/19 2019/20
Efficiency savings
Baseline Lower Higher
Upper Decile
0.5%
0.7%
0.9%
1.1%
1.3%
1.5%
1.7%
1.9%
2.1%
2.3%
2.5%
2015/16 2016/17 2017/18 2018/19 2019/20
Efficiencysavngs
Baseline Lower Higher
Upper Quartile
2.3%
2.5%
2.7%
2.9%
3.1%
3.3%
3.5%
2015/16 2016/17 2017/18 2018/19 2019/20
Efficiency savings
Baseline Lower Higher
99th Percentile
A5.2 Scope for efficiency savings: MCs
The following diagrams represent the figures comprising the tables shown within the MC summary section. Each shows the possible proportionate total savings available within the specified year, based on the sum of the forecasted frontier shift and annualised catch-up saving available.
Source: Deloitte analysis
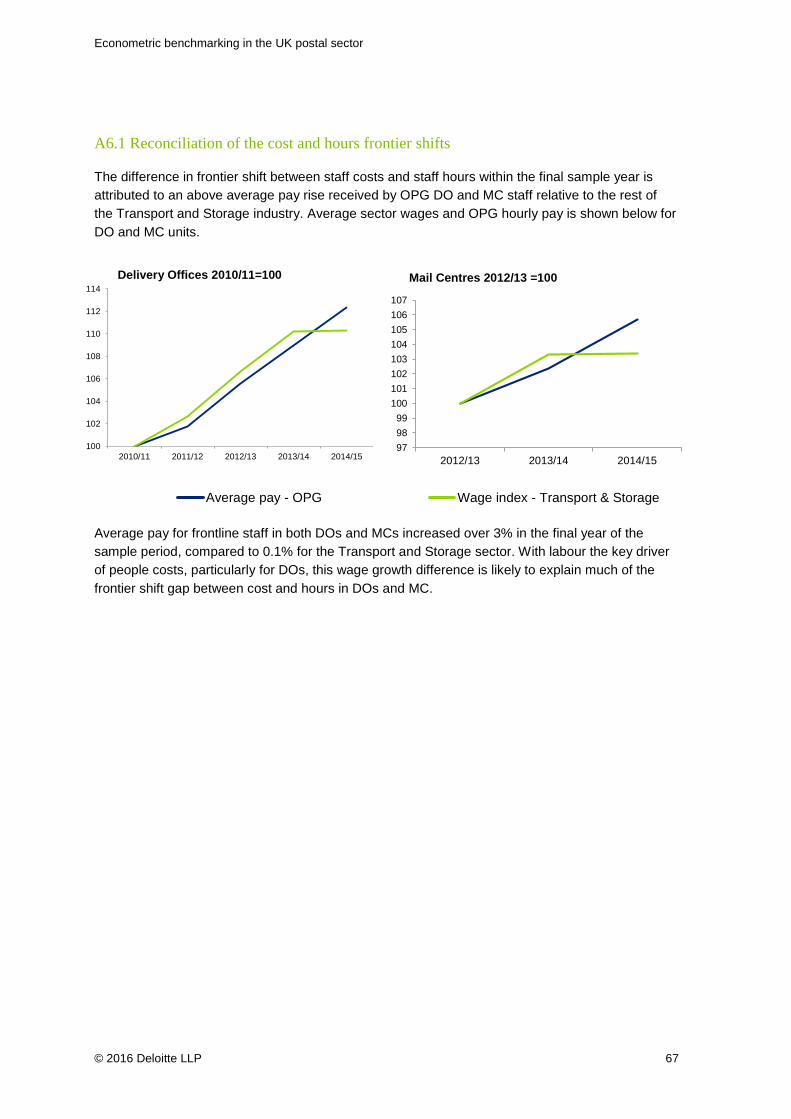
Econometric benchmarking in the UK postal sector
© 2016 Deloitte LLP 67
100
102
104
106
108
110
112
114
2010/11 2011/12 2012/13 2013/14 2014/15
A6.1 Reconciliation of the cost and hours frontier shifts
The difference in frontier shift between staff costs and staff hours within the final sample year is attributed to an above average pay rise received by OPG DO and MC staff relative to the rest of the Transport and Storage industry. Average sector wages and OPG hourly pay is shown below for DO and MC units.
Average pay for frontline staff in both DOs and MCs increased over 3% in the final year of the sample period, compared to 0.1% for the Transport and Storage sector. With labour the key driver of people costs, particularly for DOs, this wage growth difference is likely to explain much of the frontier shift gap between cost and hours in DOs and MC.
979899
100101102103104105106107
2012/13 2013/14 2014/15
Wage index - Transport & Storage
Delivery Offices 2010/11=100 Mail Centres 2012/13 =100
Average pay - OPG
Econometric benchmarking in the UK postal sector
© 2016 Deloitte LLP 68
© 2016 Deloitte LLP. All rights reserved.
Deloitte LLP is a limited liability partnership registered in England and Wales with registered number OC303675 and its registered office at 2 New Street Square, London EC4A 3BZ, United Kingdom.
Deloitte LLP is the United Kingdom member firm of Deloitte Touche Tohmatsu Limited (“DTTL”), a UK private company limited by guarantee, whose member firms are legally separate and independent entities. Please see www.deloitte.co.uk/about for a detailed description of the legal structure of DTTL and its member firms.”