Econimcs Notes by Me
11
Economics Few Definitions Regarding Economist.. Layman Economics Is Relate To An Unknown Least Value” ADAM SMITH Economics Is A Science Of Wealth And One Of Great Objects Of Political Economy Of Every Country Is To Increase Wealth And Power Of That Country. Or Economics Is The Study Of Social Problems And Their Solutions. Robbins(British Economist) Economics Is A Science Which Studies Human Behavior As A Relationship Between Ends And Scarce Means Which Have Alternative Uses. (John Maynard Keynes) British Economist ,Founder Of Modern Macro Economics “Active Government Policy Is Required To Stabilize Economy And To Prevent Valuable Resources From Standing Idle ” Post Keynesian Definition: Economics Is The Study Of Social Problems And Its Solution Through Least Available Resources. Willingness To Purchase Any Things. Demand Relationship. Supply And Demand Is Perhaps One Of The Most Fundamental Concepts Of Economics And It Is The Backbone Of A Market Economy. Demand Refers To How Much (Quantity) Of A Product Or Service Is Desired By Buyers. The Quantity Demanded Is The Amount Of A Product People Are Willing To Buy At A Certain Price; The Relationship Between Price And Quantity Demanded Is Known As The Demand Relationship Supply And Demand. Supply And Demand Is An Economic Model Of Price Determination In A Market. The Four Basic Laws Of Supply And Demand Are: 1. If Demand Increases And Supply Remains Unchanged, Then It Leads To Higher Equilibrium Price And Quantity. 2. If Demand Decreases And Supply Remains Unchanged, Then It Leads To Lower Equilibrium Price And Quantity. 3. If Supply Increases And Demand Remains Unchanged, Then It Leads To Lower Equilibrium Price And Higher Quantity. 4. If Supply Decreases And Demand Remains Unchanged, Then It Leads To Higher Price And Lower Quantity.
-
Upload
kelashbatra -
Category
Documents
-
view
221 -
download
0
Transcript of Econimcs Notes by Me
8/4/2019 Econimcs Notes by Me
http://slidepdf.com/reader/full/econimcs-notes-by-me 1/10
Economics
Few Definitions Regarding Economist..
LaymanEconomics Is Relate To An Unknown Least Value”
ADAM SMITHEconomics Is A Science Of Wealth And One Of Great Objects Of Political Economy Of Every Country Is To Increase WealthAnd Power Of That Country.
OrEconomics Is The Study Of Social Problems And Their Solutions.
Robbins(British Economist)Economics Is A Science Which Studies Human Behavior As A Relationship Between Ends And Scarce Means Which HaveAlternative Uses.
(John Maynard Keynes) British Economist ,Founder Of Modern Macro Economics “Active Government Policy Is Required To Stabilize Economy And To Prevent Valuable Resources From Standing Idle ” Post Keynesian Definition: Economics Is The Study Of Social Problems And Its Solution Through Least AvailableResources.Willingness To Purchase Any Things.
Demand Relationship.Supply And Demand Is Perhaps One Of The Most Fundamental Concepts Of Economics And It Is The Backbone Of A
Market Economy. Demand Refers To How Much (Quantity) Of A Product Or Service Is Desired By Buyers. The QuantityDemanded Is The Amount Of A Product People Are Willing To Buy At A Certain Price; The Relationship Between Price AndQuantity Demanded Is Known As The Demand Relationship
Supply And Demand.Supply And Demand Is An Economic Model Of Price Determination In A Market.
The Four Basic Laws Of Supply And Demand Are:1. If Demand Increases And Supply Remains Unchanged, Then It Leads To Higher Equilibrium Price And Quantity.
2.
If Demand Decreases And Supply Remains Unchanged, Then It Leads To Lower Equilibrium Price And Quantity.3. If Supply Increases And Demand Remains Unchanged, Then It Leads To Lower Equilibrium Price And HigherQuantity.
4. If Supply Decreases And Demand Remains Unchanged, Then It Leads To Higher Price And Lower Quantity.

8/4/2019 Econimcs Notes by Me
http://slidepdf.com/reader/full/econimcs-notes-by-me 2/10
The Law Of Demand. In Economics, The Law Of Demand Is An Economic Law That States That Consumers Buy More Of A Good When Its PriceDecreases And Less When Its Price Increases. The Law Of Demand States That Other Things Held Constant, As The Price Of A Good Increases, The Quantity Demanded Will Fall. Other Factors That Can Influence Demand Include:
Income : Generally, As Income Increases, We Are Able To Buy More Of Most Goods. When Demand For A Good IncreasesWhen Incomes Increase, We Call That Good A "Normal Good". When Demand For Good Decreases When Incomes Increase,Then That Good Is Called An Inferior Good.
Price Of Related Products : Related Goods Come In Two Types, The First Of Which Are " Substitutes”. Substitutes AreSimilar Products That Can Be Used As Alternatives. Examples Of Substitute Goods Are Coke/Pepsi, And Butter/Margarine.Usually, People Substitute Away To The Less Expensive Good. Other Related Products Are Classified As Complements".Complements Are Products That Are Used In Conjunction With Each Other. Examples Of Complements Are Pencil/Eraser,
Left/Right Shoes, And Coffee/Sugar.Tastes And Preferences : Tastes Are A Major Determinant Of The Demand For Products, But Usually Does Not ChangeMuch In The Short Run.Expectations : When You Expect The Price Of A Good To Go Up In The Future, You Tend To Increase Your DemandToday. This Is Another Example Of The Rule Of Substitution, Since You Are Substituting Away From The ExpectedRelatively More Expensive Future Consumption.
The Chart Below Shows That The Curve Is A Downward Slope.
A, B And C Are Points On The Demand Curve. Each Point On The Curve Reflects A Direct Correlation Between QuantityDemanded (Q) And Price (P). So, At Point A, The Quantity Demanded Will Be Q1 And The Price Will Be P1, And So On.The Demand Relationship Curve Illustrates The Negative Relationship Between Price And Quantity Demanded. The HigherThe Price Of A Good The Lower The Quantity Demanded (A), And The Lower The Price, The More The Good Will Be InDemand (C).
Assumptions It Is Assumed That The Income And Tastes Of Consumers And The Prices Of Other Commodities Are Constant. The MainAssumptions Are:
1. Habits, Tastes And Fashions Remain Constant2. Money, Income Of The Consumer Does Not Change.3. Prices Of Other Goods Remain Constant4. The Commodity In Question Has No Substitute5. The Commodity Is A Normal Good And Has No Prestige Or Status Value.6. People Do Not Expect Changes In The Prices.
Exceptions To The Law Of Demand

8/4/2019 Econimcs Notes by Me
http://slidepdf.com/reader/full/econimcs-notes-by-me 3/10
Generally, The Amount Demanded Of Good Increases With A Decrease In Price Of The Good And Vice Versa. In SomeCases, However, This May Not Be True. Such Situations Are Explained Below.
Commodities Which Are Used As Status Symbols.Some Expensive Commodities Like Diamonds, Air Conditioned Cars, Etc., Are Used As Status Symbols To Display One’sWealth. The More Expensive These Commodities Become, The Higher Their Value As A Status Symbol And Hence, TheGreater The Demand For Them. The Amount Demanded Of These Commodities Increase With An Increase In Their PriceAnd Decrease With A Decrease In Their Price
Law Of Supply.As The Price Of A Product Rises, Ceteris Paribus, Suppliers Will Offer More For Sale. This Implies That Price And QuantitySupplied Are Positively Related. The Major Factor That Influences Supply Is The "Cost Of Production", And Includes:Input Prices : As The Prices Of Inputs Such As Labor, Raw Materials, And Capital Increase, Production Tends To Be LessProfitable, And Less Will Be Produced. This Leads To A Decrease In Supply.Technology : Technology Relates To Methods Of Transforming Inputs Into Outputs. Improvements In Technology WillReduce The Costs Of Production And Make Sales More Profitable So It Tends To Increase The Supply.Expectations : If Firms Expect Prices To Rise In The Future, May Try To Product Less Now And More Later.
A, B And C Are Points On The Supply Curve. Each Point On The Curve Reflects A Direct Correlation Between QuantitySupplied (Q) And Price (P). At Point B, The Quantity Supplied Will Be Q2 And The Price Will Be P2, And So On.
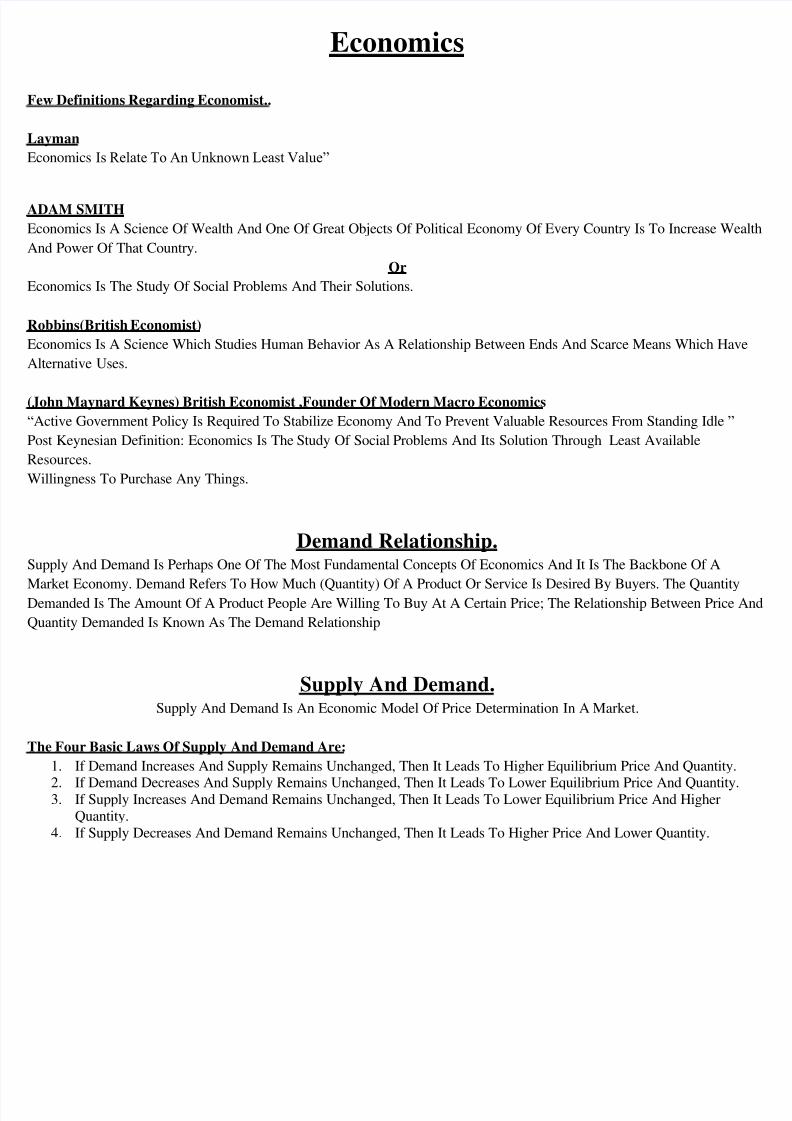
Equilibrium. When Supply And Demand Are Equal (When The Supply Function And Demand Function Intersect) The Economy Is SaidTo Be At Equilibrium. At This Point, The Allocation Of Goods Is At Its Most Efficient Because The Amount Of Goods Being
8/4/2019 Econimcs Notes by Me
http://slidepdf.com/reader/full/econimcs-notes-by-me 4/10
Supplied Is Exactly The Same As The Amount Of Goods Being Demanded. Thus, Everyone (Individuals, Firms, OrCountries) Is Satisfied With The Current Economic Condition. At The Given Price, Suppliers Are Selling All The Goods ThatThey Have Produced And Consumers Are Getting All The Goods That They Are Demanding.
As You Can See On The Chart, Equilibrium Occurs At The Intersection Of The Demand And Supply Curve, Which IndicatesNo Allocative Inefficiency. At This Point, the Price of The Goods Will Be P* And The Quantity Will Be Q*. These FiguresAre Referred To As Equilibrium Price And Quantity.
Note : In The Real Market Place Equilibrium Can Only Ever Be Reached In Theory, So The Prices Of Goods And ServicesAre Constantly Changing In Relation To Fluctuations In Demand And Supply.
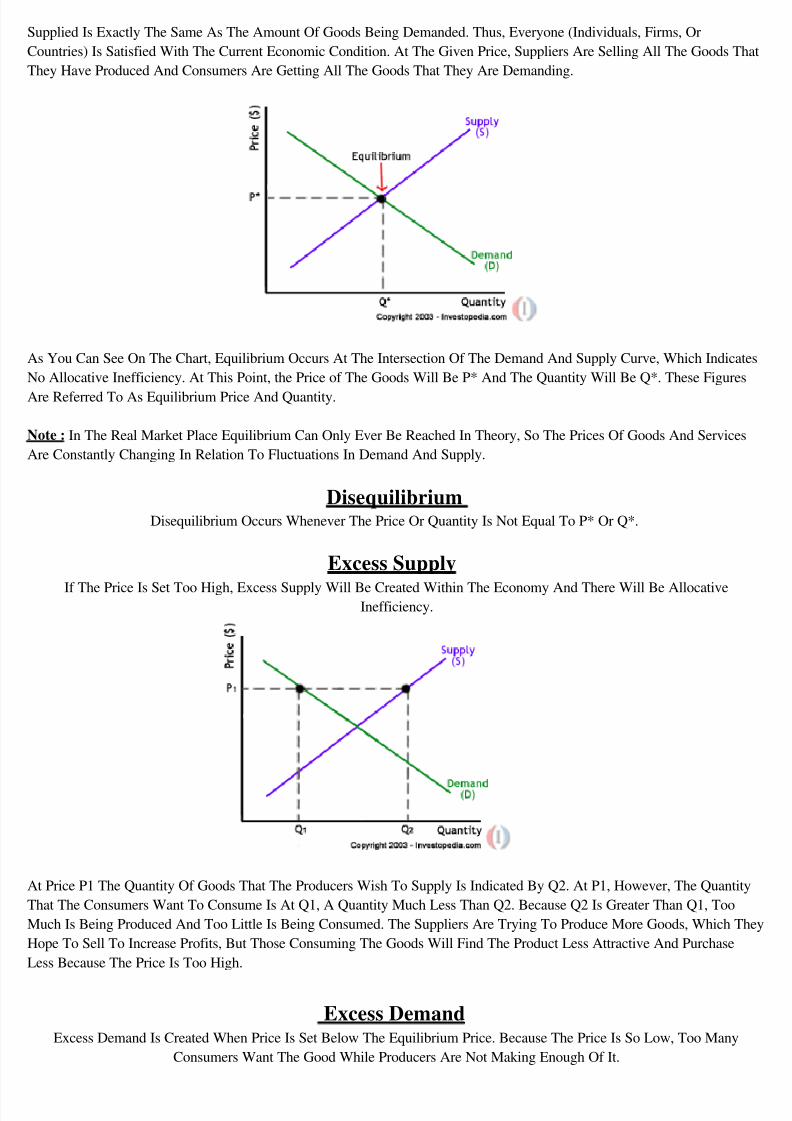
DisequilibriumDisequilibrium Occurs Whenever The Price Or Quantity Is Not Equal To P* Or Q*.
Excess Supply If The Price Is Set Too High, Excess Supply Will Be Created Within The Economy And There Will Be Allocative
Inefficiency.
At Price P1 The Quantity Of Goods That The Producers Wish To Supply Is Indicated By Q2. At P1, However, The QuantityThat The Consumers Want To Consume Is At Q1, A Quantity Much Less Than Q2. Because Q2 Is Greater Than Q1, TooMuch Is Being Produced And Too Little Is Being Consumed. The Suppliers Are Trying To Produce More Goods, Which TheyHope To Sell To Increase Profits, But Those Consuming The Goods Will Find The Product Less Attractive And PurchaseLess Because The Price Is Too High.
Excess Demand Excess Demand Is Created When Price Is Set Below The Equilibrium Price. Because The Price Is So Low, Too Many
Consumers Want The Good While Producers Are Not Making Enough Of It.

8/4/2019 Econimcs Notes by Me
http://slidepdf.com/reader/full/econimcs-notes-by-me 5/10
In This Situation, At Price P1, The Quantity Of Goods Demanded By Consumers At This Price Is Q2. Conversely, TheQuantity Of Goods That Producers Are Willing To Produce At This Price Is Q1. Thus, There Are Too Few Goods BeingProduced To Satisfy The Wants (Demand) Of The Consumers. However, As Consumers Have To Compete With One OtherTo Buy The Good At This Price, The Demand will push the price up, making suppliers want to supply more and bringing the
price closer to its equilibrium.
Price Elasticity Of Demand. Price Elasticity Of Demand (Ped Or E d) Is A Measure Used In Economics To Show The Responsiveness, Or Elasticity, Of The Quantity Demanded Of A Good Or Service To A Change In Its Price. More Precisely, It Gives The Percentage Change InQuantity Demanded In Response To A One Percent Change In Price (Holding Constant All The Other Determinants Of Demand, Such As Income). It Was Devised By Alfred Marshall. Price Elasticities Are Almost Always Negative, Although Analysts Tend To Ignore The Sign Even Though This Can Lead ToAmbiguity.
The Above Formula Usually Yields A Negative Value, Due To The Inverse Nature Of The Relationship Between Price AndQuantity Demanded, As Described By The "Law Of Demand". For Example, If The Price Increases By 5% And QuantityDemanded Decreases By 5%, Then The Elasticity At The Initial Price And Quantity = −5%/5% = −1. The Only Classes Of Goods Which Have A Ped Of Greater Than 0 Ar eveblen And Giffen Goods. Because The Ped Is Negative For The VastMajority Of Goods And Services, However, Economists Often Refer To Price Elasticity Of Demand As A Positive Value(I.E., In Absolute Value Terms).
Price Elasticity Of Supply.In Economics, Price Elasticity Of Supply (Pes) Is An Elasticity Defined As A Numerical Measure Of The Responsiveness Of The Supply Of A Given Good To A Change In The Price Of That Good.

8/4/2019 Econimcs Notes by Me
http://slidepdf.com/reader/full/econimcs-notes-by-me 6/10
In Other Words, Pes Is The Percentage Change In Quantity Supplied That One Would Expect To Occur After A 1% ChangeIn Price. For Example, If, In Response To A 10% Rise In The Price Of A Good, The Quantity Supplied Increases By 20%,The Price Elasticity Of Supply Would Be 20%/10% = 2.
Movement Vs Shifts Of Demand Curve:Movement Along The Demand Curve :
Demand Is A Multivariable Function. If Income And Other Determinants Of Demand Such As Tastes Of The Consumers,Changes In Prices Of Related Goods, Income Distribution, Etc., Remain Constant And There Is A Change Only In Price Of The Commodity, Then We Move Along The Same Demand Curve.
Diagram/Figure:
Here The Price Of A Commodity Falls From $8 To $2. As A Result, Therefore, The Quantity Demanded Increases From 100Units To 400 Units Per Unit Of Time. There Is Extension In Demand By 300 Units. This Movement Is From One Point PriceQuantity Combination (A) To Another Point (B) Along A Given Demand Curve. On The Other Hand, If The Price Of A GoodRises From $2 To $8, There Is Contraction In Demand By 300 Units.
We, Thus, See That As A Result Of Change In The Price Of A Good, The Consumer Moves Along The Given Demand Curve.The Demand Curve Remains The Same And Does Not Change Its Position. The Movement Along The Demand Curve IsDesignated As Change In Quantity Demanded.
Shifts In Demand Curve: Demand, As We Know, Is Determined By Many Factors. When There Is A Change In Demand Due To One Or More ThanOne Factors Other Than Price, Results In The Shift Of Demand Curve.
8/4/2019 Econimcs Notes by Me
http://slidepdf.com/reader/full/econimcs-notes-by-me 7/10
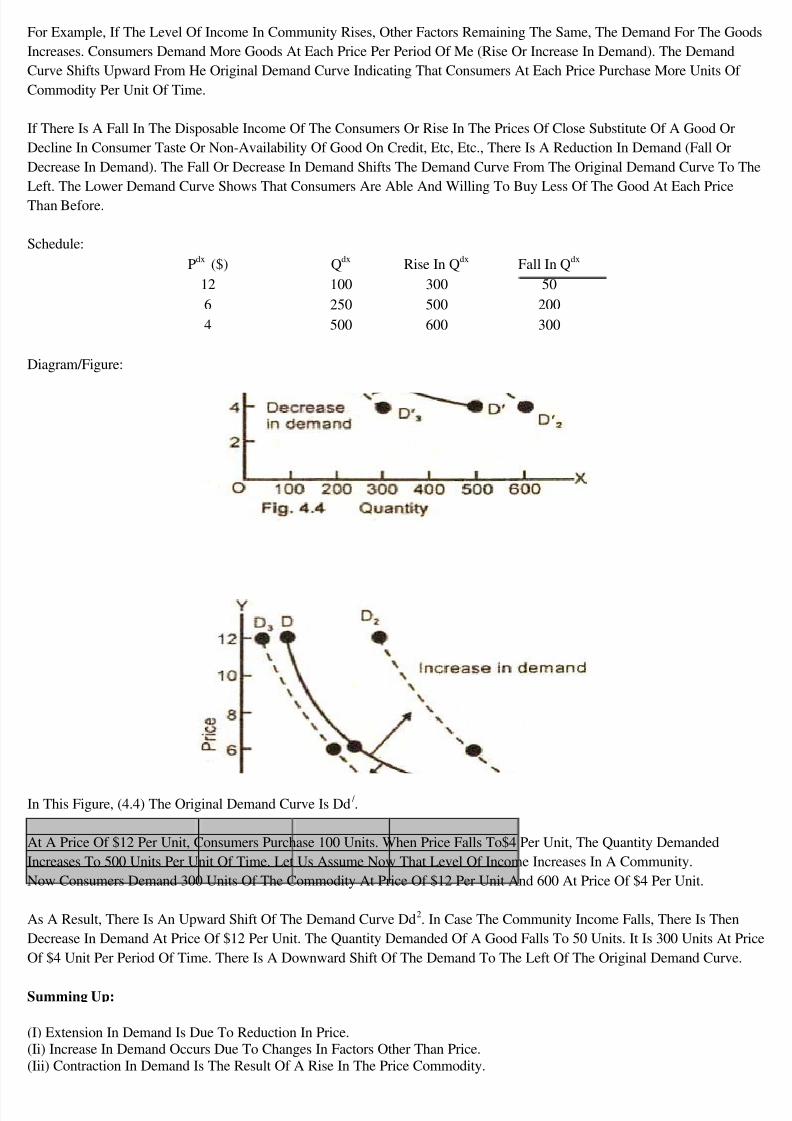
For Example, If The Level Of Income In Community Rises, Other Factors Remaining The Same, The Demand For The GoodsIncreases. Consumers Demand More Goods At Each Price Per Period Of Me (Rise Or Increase In Demand). The DemandCurve Shifts Upward From He Original Demand Curve Indicating That Consumers At Each Price Purchase More Units Of Commodity Per Unit Of Time.
If There Is A Fall In The Disposable Income Of The Consumers Or Rise In The Prices Of Close Substitute Of A Good OrDecline In Consumer Taste Or Non-Availability Of Good On Credit, Etc, Etc., There Is A Reduction In Demand (Fall OrDecrease In Demand). The Fall Or Decrease In Demand Shifts The Demand Curve From The Original Demand Curve To TheLeft. The Lower Demand Curve Shows That Consumers Are Able And Willing To Buy Less Of The Good At Each PriceThan Before.
Schedule:Pdx ($) Q dx Rise In Q dx Fall In Q dx
12 100 300 506 250 500 2004 500 600 300
Diagram/Figure:
In This Figure, (4.4) The Original Demand Curve Is Dd / .
At A Price Of $12 Per Unit, Consumers Purchase 100 Units. When Price Falls To$4 Per Unit, The Quantity DemandedIncreases To 500 Units Per Unit Of Time. Let Us Assume Now That Level Of Income Increases In A Community.Now Consumers Demand 300 Units Of The Commodity At Price Of $12 Per Unit And 600 At Price Of $4 Per Unit.
As A Result, There Is An Upward Shift Of The Demand Curve Dd 2. In Case The Community Income Falls, There Is ThenDecrease In Demand At Price Of $12 Per Unit. The Quantity Demanded Of A Good Falls To 50 Units. It Is 300 Units At PriceOf $4 Unit Per Period Of Time. There Is A Downward Shift Of The Demand To The Left Of The Original Demand Curve.
Summing Up:
(I) Extension In Demand Is Due To Reduction In Price.(Ii) Increase In Demand Occurs Due To Changes In Factors Other Than Price.(Iii) Contraction In Demand Is The Result Of A Rise In The Price Commodity.

8/4/2019 Econimcs Notes by Me
http://slidepdf.com/reader/full/econimcs-notes-by-me 8/10
(Iv) A Decrease In Demand Follows A Change In Factors Other Than Price.(V) Changes In Demand Both Increase And Decrease Are Represent Shifts In The Demand Curve.(Vi) Changes In The Quantity Demanded Are Represented By Move Along The Same Demand Curve.
Movement Vs Shifts Of Supply Curve:
Movement Along With The Same Supply Curve: While Explaining The Law Of Supply We Have Stated That As Price Rise, The Quantity Supplied Increases And As PriceFalls The Quantity Supplied Increases And As Price Provided Other Things Remain The Same. This Change In The QuantitySupplied Of A Commodity Is A Movement Of One Price Quantity Combination To Another On The Same Supply Curve.Such A Movement At Varying Prices Is Now Illustrated With The Help Of The Supply Curve Given In Figure 5.2.
Diagram/Figure:
Figure Of Movement:
In The Above Figure (5.2) At Price "At" ($3.00), "At" 50 Units Quantity Is Supplied. When Price Rises To Dl ($7.0), TheQuantity Supplied By The Producers Increases To Ol (110 Units). The Change In Quantity Supplied At Varying Prices IsReferred As Movement Along The Same Supply Curve.
Shifts In Supply Curve:Shifts In Supply Curve Means Changes In Supply. While Explaining The Law Of Supply, We Have Stated That That OtherThings Remaining The Same (Ceteris Paribus) The Amount Of The Commodity Offered Fore Sale Increases With The Rise InPrice And Decreases With A Fall In Price. When There Is An Increase In Supply Due To One Or More Than One Non-PriceFactor (Which Was Held Constant) Such As Production Techniques, Resource Prices, Changes In The Price Of OtherCommodities, Etc., There Is A Rise In Supply. The Entire Supply Curve Shifts To The Right Of Original Supply CurveIndicating That More Quantity Is Offered Fore Sale At The Same Price Per Time Period.
If Due To One Or A Combination Of Non-Price Factors, Less Quantity Is Brought Into The Market Fore Sale At Each Price,
The Supply Is Said To Have Fallen. In Case Of Fall In Supply, The Supply Curve Shifts To The Left Of The Original SupplyCurve. The Rise And Fall Of Supply Curve (Shifts In Supply Curve) Is Explained With The Help Of An Imaginary ScheduleAnd A Diagram.
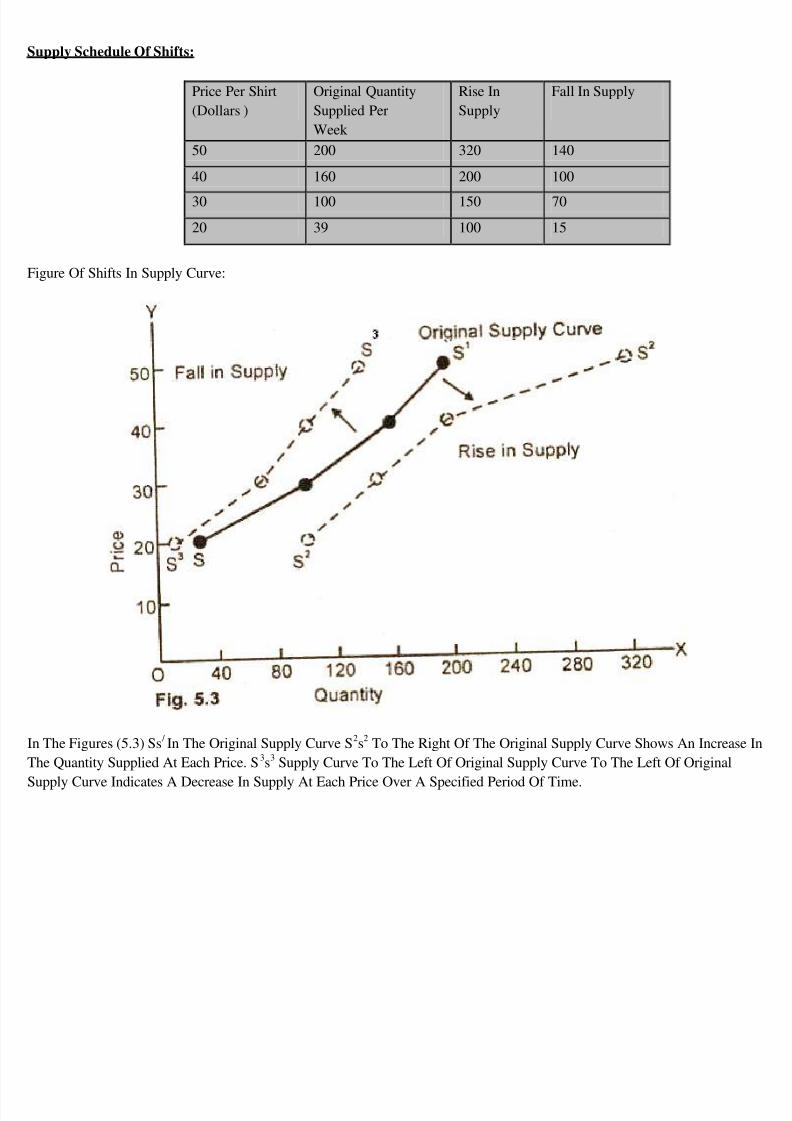
Schedule Of Shifts In Supply Curve:
8/4/2019 Econimcs Notes by Me
http://slidepdf.com/reader/full/econimcs-notes-by-me 9/10
Supply Schedule Of Shifts:
Price Per Shirt(Dollars )
Original QuantitySupplied PerWeek
Rise InSupply
Fall In Supply
50 200 320 140
40 160 200 100
30 100 150 70
20 39 100 15
Figure Of Shifts In Supply Curve:
In The Figures (5.3) Ss / In The Original Supply Curve S 2s2 To The Right Of The Original Supply Curve Shows An Increase InThe Quantity Supplied At Each Price. S 3s3 Supply Curve To The Left Of Original Supply Curve To The Left Of Original
Supply Curve Indicates A Decrease In Supply At Each Price Over A Specified Period Of Time.

8/4/2019 Econimcs Notes by Me
http://slidepdf.com/reader/full/econimcs-notes-by-me 10/10
Price Ceilings:A price ceiling occurs when the government puts a legal limit on how high the price of a product can be. In order for a priceceiling to be effective, it must be set below the natural market equilibrium. One interference with the market process is called a price ceiling. A price ceiling occurs when the price is artificially heldbelow the equilibrium price and is not allowed to rise. There are many examples of price ceilings. Most price ceilings involvethe government in some way. For example, in many cities, there are rent controls. This means that the maximum rent that canbe charged is set by a governmental agency. This rent is usually allowed to rise a certain percent each year to keep upwith inflation. However, the rent is below the equilibrium rent. Also, from 1973 to 1981, there was a price ceiling for gasoline.There was a maximum price allowed by law. Any gas station owner charging more than this maximum price would be guilty
of fraud. During World War II, there were price ceilings on most products. Occasionally, price ceilings are imposed by theseller.
Example : assume that the equilibrium price is $2.00 per gallon of gasoline. The maximum price is set by the government at$1.50 per gallon. At the price of $1.50 per gallon, the quantity demanded is 10 million gallons per week and the quantitysupplied is 5 million gallons per week. There is a shortage (5 million gallons per week). Price ceilings lead to shortages.
Price floorA price floor is a government- or group-imposed limit on how low a price can be charged for a product .[1] For a price floor tobe effective, it must be greater than the equilibrium price.
Effect on the marketA price floor set above the market equilibrium price has several side-effects. Consumers find they must now pay a higher pricefor the same product. As a result, they reduce their purchases or drop out of the market entirely. Meanwhile, suppliers findthey are guaranteed a new, higher price than they were charging before. As a result, they increase production.Taken together, these effects mean there is now an excess supply (known as a surplus) of the product in the market. Tomaintain the price floor over the long term, the government may need to take action to remove this surplus.
Minimum wageA historical (and current) example of a price floor are minimum wage laws, laws specifying the lowest wage a company canpay an employee (employees aresuppliers of labor and the company is the consumer in this case). When the minimum wage isset higher than the equilibrium market price for unskilled labor ,unemployment is created (more people are looking for jobsthan there are jobs available). A minimum wage above the equilibrium wage would induce employers to hire fewer workers aswell as cause more people to enter the labor market, the result is a surplus in the amount of labor available. The equilibriumwage for a worker would be dependent upon the worker's skill sets along with market conditions.
ExampleThis is commonly seen in agriculture. Often the government wishes to maintain high prices of agricultural goods to keep alarge number of farmers working. To limit the surplus, however, governments often pay some farmers not to plant crops, thiscan be known as a subsidy check.Price floors are also commonly imposed on the hospitality industry. Many jurisdictions mandate a minimum price thatlicensed establishments must charge for alcoholic beverages in an effort to prevent over consumption. If minimum prices areset too high they can induce people to drink in unlicensed settings where consumption may be less controlled.