ECOMMERCE DEVELOPMENT SURVEY AND INDEXpdf.usaid.gov/pdf_docs/PA00MP8T.pdf · ECOMMERCE DEVELOPMENT...
45
ECOMMERCE DEVELOPMENT SURVEY AND INDEX April 2017 This paper has been prepared for review by the U.S. Agency for International Development under Dexis Consulting Contract No. AID-OAA-C-13-00075. It was prepared by Kati Suominen and submitted by Erin Endean, Palladium International LLC, Chief of Party, Improving Business Environments for Agile Markets Project to Contracting Officer’s Representative, Paul J. Fekete.
Transcript of ECOMMERCE DEVELOPMENT SURVEY AND INDEXpdf.usaid.gov/pdf_docs/PA00MP8T.pdf · ECOMMERCE DEVELOPMENT...
ECOMMERCE DEVELOPMENT
SURVEY AND INDEX
April 2017
This paper has been prepared for review by the U.S. Agency for International Development under Dexis Consulting
Contract No. AID-OAA-C-13-00075. It was prepared by Kati Suominen and submitted by Erin Endean, Palladium
International LLC, Chief of Party, Improving Business Environments for Agile Markets Project to Contracting Officer’s
Representative, Paul J. Fekete.

ECOMMERCE DEVELOPMENT
SURVEY AND INDEX
APRIL 2017
Dr. Kati Suominen, Nextrade Group

CONTENTS I. Introduction ............................................................................................................... 1
II. Sample and Findings .................................................................................................. 3
A. Characteristics and Performance of Offline vs. Online Sellers ..............................................4
B. Obstacles to Ecommerce ................................................................................................................7
III. Ecommerce Development Index ........................................................................... 25
A. Unweighted Averages ................................................................................................................... 25
B. Distance from the Frontier ......................................................................................................... 27
C. Inclusiveness Index ........................................................................................................................ 29
D. Findings in Sum ............................................................................................................................... 32
IV. Improvements and Policy Directions .................................................................... 33
Appendix I – Descriptive Statistics ................................................................................ 35
FIGURES Figure 1. Surveyed Merchants' Online Activity ............................................................................................4
Figure 2. % of Merchants that Sell to or Purchase from International Markets ...................................5
Figure 3. % of Merchants that Sell to or Purchase from International Markets, by Firm Size ..........5
Figure 4. % of Companies that Export, by Company Size and Online Activity ....................................6
Figure 5. Number of Markets Companies Sell Into, by Company's Online Sales Activity ................6
Figure 6. % of Fast-Growth Companies .........................................................................................................7
Figure 7. Rating of Enabling Environment for Ecommerce and Cross-Border Ecommerce,
Selected Countries .............................................................................................................................8
Figure 8. Performance Countries on Ecommerce Development Index, by Level of Development
.............................................................................................................................................................................. 10
Figure 9. Merchants’ Perceived Obstacles to Ecommerce, by Company Size................................... 10
Figure 10. Severity of Potential Obstacles to Merchants’ Ecommerce - % of Small Companies
Giving a Certain Ranking ............................................................................................................. 11
Figure 11. Severity of Potential Obstacles to Merchants’ Ecommerce - % of Large Companies
Giving a Certain Ranking ............................................................................................................. 11
Figure 12. Merchants’ Perceived Obstacles to Cross-Border Ecommerce, by Company Type and
Size .................................................................................................................................................... 12
Figure 13. Severity of Potential Obstacles to Merchants’ Cross-Border Ecommerce - % of Small
Companies Giving a Certain Ranking ....................................................................................... 12
Figure 14. Severity of Potential Obstacles to Merchants’ Cross-Border Ecommerce - % of Large
Companies Giving a Certain Ranking ....................................................................................... 13
Figure 15. Perceived Obstacles to Ecommerce, by Company Size ...................................................... 14
Figure 16. Merchants’ Perceived Obstacles to Cross-Border Ecommerce, by Company Size ..... 15
Figure 17. Ecommerce Ecosystem Companies’ % of Companies Ranking an Area 5 or less out of
10 to Ecommerce in their Economies, by Main Sectors ...................................................... 16
Figure 18. Ecosystem Companies’ Perceived Obstacles to Ecommerce ............................................ 16
Figure 19. Ecosystem Companies’ Perceived Obstacles to Cross-Border Ecommerce ................. 17
Figure 20. Performance on Ecommerce Development Index, by Firm Type and Size .................... 17
Figure 21. % of Small Companies Ranking an Area 5 or less out of 10 to Ecommerce, by Export
Activity ............................................................................................................................................. 19
Figure 22. % of Small Companies Ranking an Area 5 or less out of 10 to Cross-Border
Ecommerce, by Export Activity ................................................................................................. 19
Figure 23. % of Small Companies Ranking an Area 5 or less out of 10 to Ecommerce, by Online
Sales Activity ................................................................................................................................... 20
Figure 24. % of Small Companies Ranking an Area 5 or less out of 10 to Cross-Border
Ecommerce, by Online Sales Activity ....................................................................................... 20
Figure 25. Revenue and Employment Gains to Companies if Top 3 Barriers to Ecommerce Were
Removed .......................................................................................................................................... 21
Figure 26. Revenue Gains to Companies if Top 3 Barriers to Ecommerce Were Removed, by
Company Size ................................................................................................................................. 22
Figure 27. Revenue Gains to Companies if Top 3 Barriers to Ecommerce Were Removed, by
Country ............................................................................................................................................ 22
Figure 28. % of Non-Exporters and Offline Sellers that Would Increase Domestic and
International Sales If Top 3 Barriers to Ecommerce Were Removed ............................. 23
Figure 29. Perceived Priority Barriers to Starting to Sell Online, % of Firms Agreeing with the
Statement ........................................................................................................................................ 24
Figure 30. Correlation of Ecommerce Development Index with WEF Networked Readiness
Index ................................................................................................................................................. 26
Figure 31. Correlation of Ecommerce Development Index with UNCTAD Ecommerce Index
Ranking ............................................................................................................................................. 26
Figure 32. Correlation of Ecommerce Development Index with World Bank Doing Business
Ranking ............................................................................................................................................. 27
Figure 33. Distance from the Frontier by Country, Overall Score ...................................................... 28
TABLES Table 1. Perceived Obstacles to Ecommerce, by Country .......................................................................9
Table 2. Perceived Obstacles to Cross-Border Ecommerce, by Country ............................................9
Table 3. Distance from the Frontier, Ease of Doing Ecommerce, by Country ................................. 28
Table 4. Distance from the Frontier, Ease of Doing Cross-Border Ecommerce, by Country ...... 29
Table 5. Inclusiveness Index (Focused on Small Business with 0-50 Employees) ............................. 30
Table 6. Inclusiveness Index (Focused on Small Online Seller Exporters) ......................................... 31
1
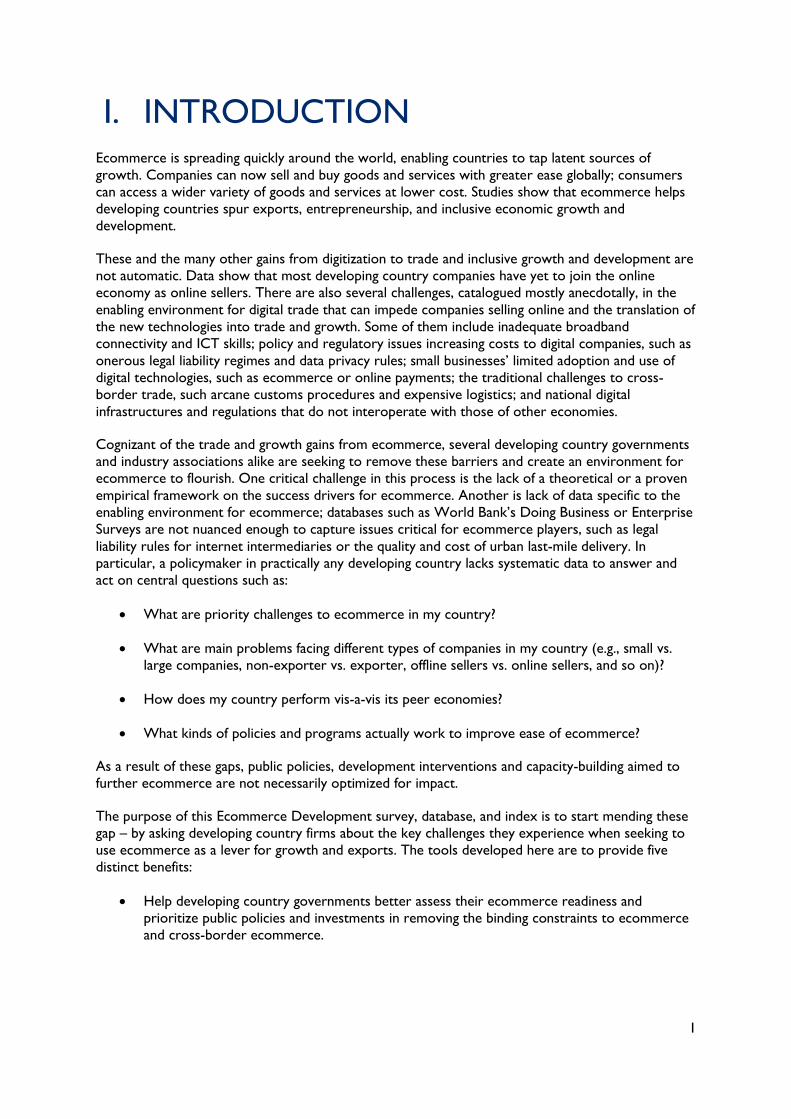
I. INTRODUCTION Ecommerce is spreading quickly around the world, enabling countries to tap latent sources of
growth. Companies can now sell and buy goods and services with greater ease globally; consumers
can access a wider variety of goods and services at lower cost. Studies show that ecommerce helps
developing countries spur exports, entrepreneurship, and inclusive economic growth and
development.
These and the many other gains from digitization to trade and inclusive growth and development are
not automatic. Data show that most developing country companies have yet to join the online
economy as online sellers. There are also several challenges, catalogued mostly anecdotally, in the
enabling environment for digital trade that can impede companies selling online and the translation of
the new technologies into trade and growth. Some of them include inadequate broadband
connectivity and ICT skills; policy and regulatory issues increasing costs to digital companies, such as
onerous legal liability regimes and data privacy rules; small businesses’ limited adoption and use of
digital technologies, such as ecommerce or online payments; the traditional challenges to cross-
border trade, such arcane customs procedures and expensive logistics; and national digital
infrastructures and regulations that do not interoperate with those of other economies.
Cognizant of the trade and growth gains from ecommerce, several developing country governments
and industry associations alike are seeking to remove these barriers and create an environment for
ecommerce to flourish. One critical challenge in this process is the lack of a theoretical or a proven
empirical framework on the success drivers for ecommerce. Another is lack of data specific to the
enabling environment for ecommerce; databases such as World Bank’s Doing Business or Enterprise
Surveys are not nuanced enough to capture issues critical for ecommerce players, such as legal
liability rules for internet intermediaries or the quality and cost of urban last-mile delivery. In
particular, a policymaker in practically any developing country lacks systematic data to answer and
act on central questions such as:
What are priority challenges to ecommerce in my country?
What are main problems facing different types of companies in my country (e.g., small vs.
large companies, non-exporter vs. exporter, offline sellers vs. online sellers, and so on)?
How does my country perform vis-a-vis its peer economies?
What kinds of policies and programs actually work to improve ease of ecommerce?
As a result of these gaps, public policies, development interventions and capacity-building aimed to
further ecommerce are not necessarily optimized for impact.
The purpose of this Ecommerce Development survey, database, and index is to start mending these
gap – by asking developing country firms about the key challenges they experience when seeking to
use ecommerce as a lever for growth and exports. The tools developed here are to provide five
distinct benefits:
Help developing country governments better assess their ecommerce readiness and
prioritize public policies and investments in removing the binding constraints to ecommerce
and cross-border ecommerce.
2
Induce governments around the world to both engage in a healthy “race to the top” in
improving their ecommerce economies, and collaborate with each other to improve the
odds for cross-border ecommerce.
Enable private sector actors in developing countries to better articulate to their
governments the challenges facing them when engaging in ecommerce.
Enable donors and development agencies to offer high-impact, relevant policy advice and to
create development interventions tailored to solving the priority challenges to ecommerce
in any one country.
Provide data to trade and development economists and other analysts to rigorously assess
the binding constraints to ecommerce in different countries around the world, and build a
more robust basis for understanding the sequencing of interventions and policies key to
driving ecommerce.
The following sections elaborate on the behavior of data and put forth three complementary indices
on ecommerce development.

3
II. SAMPLE AND FINDINGS Two surveys have been fielded in each economy – one for SME merchants, another for ecosystem
players such as ecommerce platforms. The surveys were designed with inputs from the private
sector, including such companies as eBay, PayPal and Google. They are in Appendix I. They include
about 30 questions and sub-questions. The author translated the surveys also into Spanish and
Portuguese.
The survey asks companies about their characteristics, such as their sector, growth rate, size,
participation in ecommerce and in trade, and main foreign markets, and the gender of the
respondent and his/her title. It also asks the respondents about their perceived barriers to
ecommerce as well as their forecast revenue gains if these barriers were removed.
Results were secured from 94 countries, with robust samples for 15 countries from:
Latin America: Argentina, Brazil, Chile, Colombia, Mexico, Uruguay
Asia: Pakistan, Bangladesh, India, Philippines, Singapore
Africa: Kenya, Nigeria, South Africa, Ghana
The countries were selected to cover several different geographic regions and based on the ease of
reaching large sets of surveyed (For example, companies in some countries that could be interesting,
such as Tanzania are harder and more expensive to survey). Another factor in country selection
was responsiveness; the countries for which there is robust information were the ones where initial
data spontaneously came in when partner organizations fielded the survey. The country samples
cover companies of all sizes, numerous sectors, various growth trajectories, exporters and non-
exporters, online sellers and offline sellers. Respondents range from staff-level employees to Senior
Vice Presidents and CEOs. The typical sample per country where we have more robust data is on
average 135 merchants and 66 ecosystem players. The total number of responses is 3,250; the
number of quality responses is about 2,500. Descriptive statistics are in Appendix II.
Several partners helped field the survey, including: Latin American Ecommerce Institute, TradeKey,
Ringier Africa, Google, Bangladesh Association of Software and Information (BASIS), Pacific
Economic Cooperation Council (PECC), World SME Forum, and e-Commerce Association of
Bangladesh (e-CAB). Survey firms Cint and QuestionPro were hired to bolster the samples in the
above economies, so as to expand the samples in the countries where we started to have better
data.
There were methodological issues to overcome. For example, the response rate was lower than
expected and the share of incomplete surveys was higher than anticipated; some 20-25 percent
started the survey but did not complete it. The survey is demanding and long to fill out, which is the
likeliest cause of fatigue. Some of the completed surveys needed to be thrown out due to questions
around the quality of the answers. These challenges were, however, overcome.
The following two sections analyze the surveyed companies’ use of the Internet, and describe the
challenges they face when selling online.
4
A. CHARACTERISTICS AND PERFORMANCE OF OFFLINE VS.
ONLINE SELLERS
There are a number of findings related to surveyed companies’ online presence and sales, and export
activity.
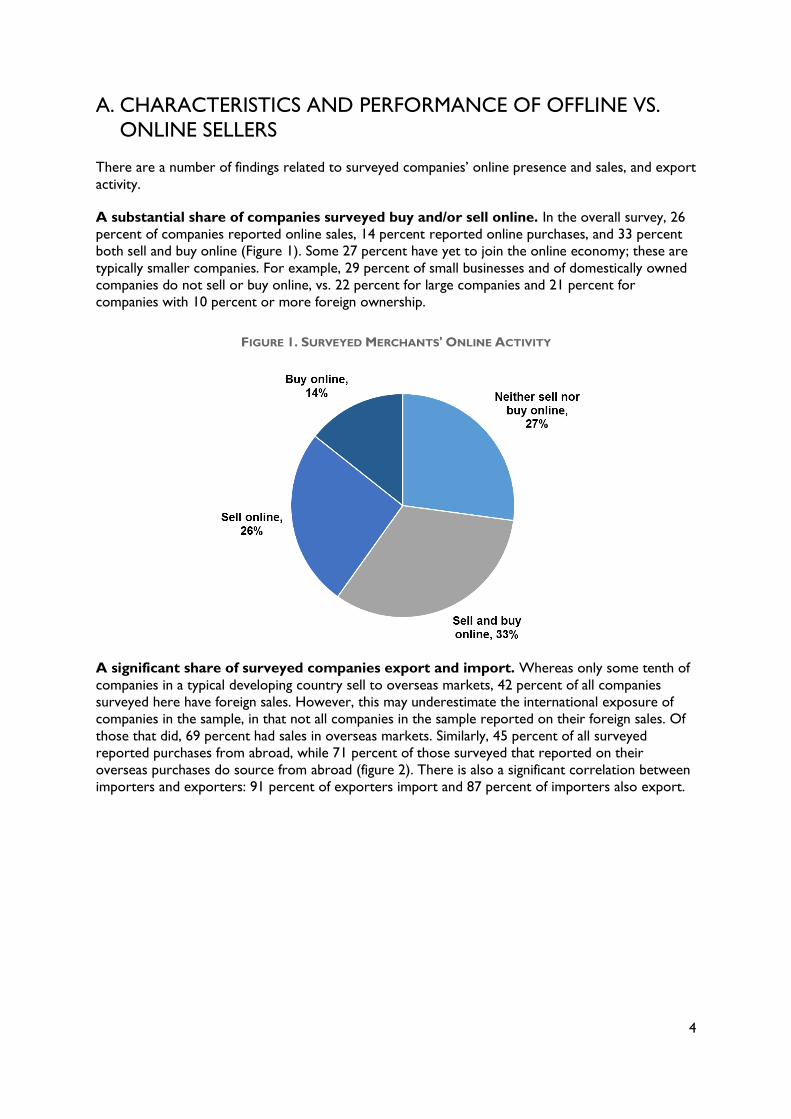
A substantial share of companies surveyed buy and/or sell online. In the overall survey, 26
percent of companies reported online sales, 14 percent reported online purchases, and 33 percent
both sell and buy online (Figure 1). Some 27 percent have yet to join the online economy; these are
typically smaller companies. For example, 29 percent of small businesses and of domestically owned
companies do not sell or buy online, vs. 22 percent for large companies and 21 percent for
companies with 10 percent or more foreign ownership.
FIGURE 1. SURVEYED MERCHANTS' ONLINE ACTIVITY
A significant share of surveyed companies export and import. Whereas only some tenth of
companies in a typical developing country sell to overseas markets, 42 percent of all companies
surveyed here have foreign sales. However, this may underestimate the international exposure of
companies in the sample, in that not all companies in the sample reported on their foreign sales. Of
those that did, 69 percent had sales in overseas markets. Similarly, 45 percent of all surveyed
reported purchases from abroad, while 71 percent of those surveyed that reported on their
overseas purchases do source from abroad (figure 2). There is also a significant correlation between
importers and exporters: 91 percent of exporters import and 87 percent of importers also export.
5
FIGURE 2. % OF MERCHANTS THAT SELL TO OR PURCHASE FROM INTERNATIONAL
MARKETS
There are significant differences across companies in their exposure to international
markets; these are explained mostly by expected factors such as company size and
online sales activity. For example, as could be expected on the basis of empirical work on
companies’ participation in international trade, surveyed large companies and companies with online
sales are much likelier to export than small companies or companies that do not have online sales
(figures 3-4).
FIGURE 3. % OF MERCHANTS THAT SELL TO OR PURCHASE FROM INTERNATIONAL
MARKETS, BY FIRM SIZE
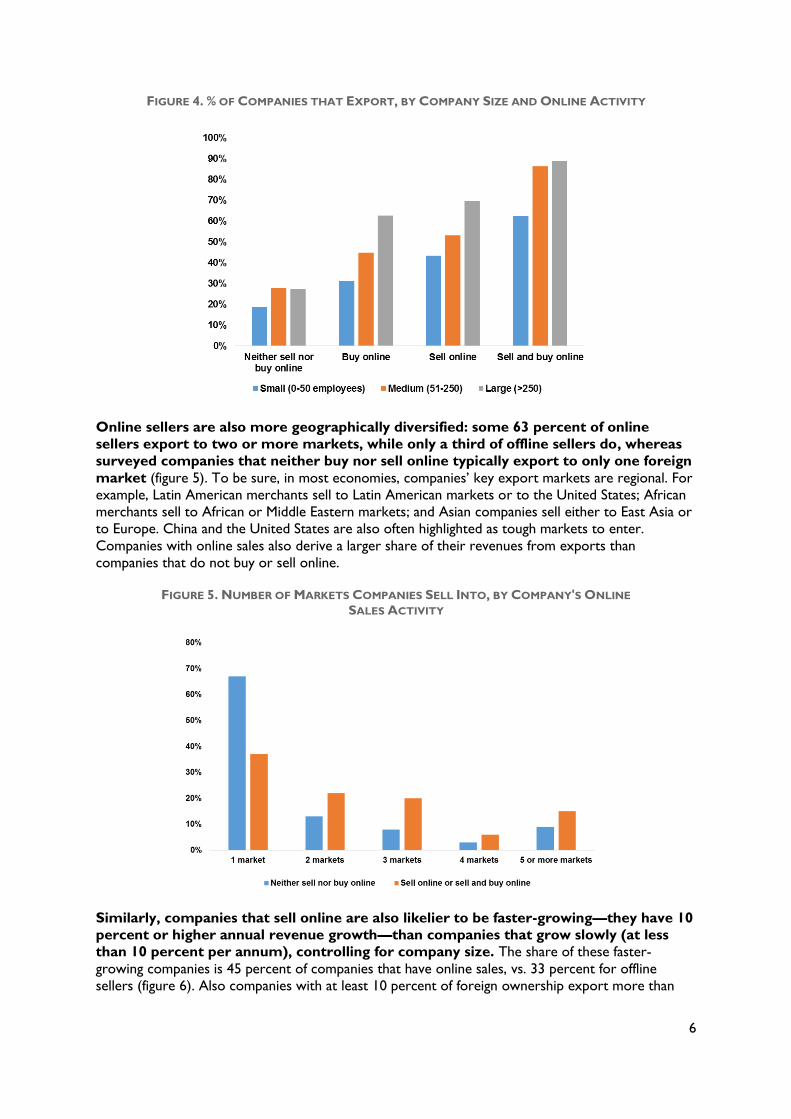
6
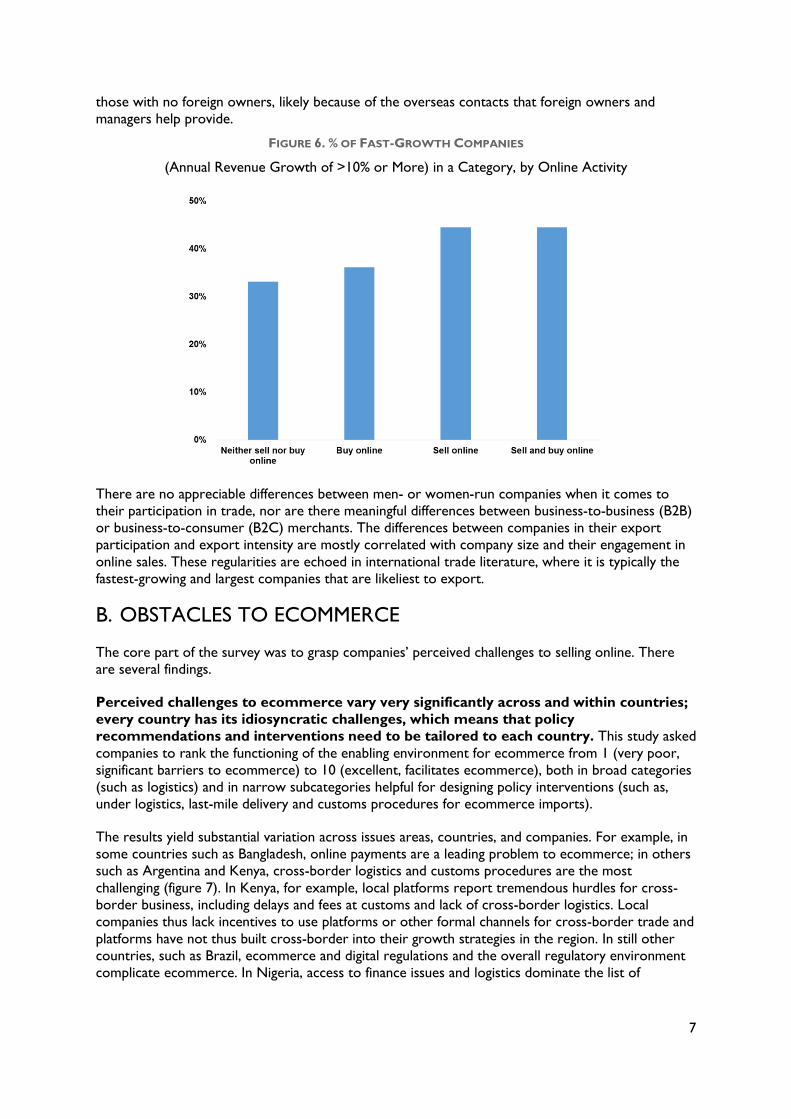
FIGURE 4. % OF COMPANIES THAT EXPORT, BY COMPANY SIZE AND ONLINE ACTIVITY
Online sellers are also more geographically diversified: some 63 percent of online
sellers export to two or more markets, while only a third of offline sellers do, whereas
surveyed companies that neither buy nor sell online typically export to only one foreign
market (figure 5). To be sure, in most economies, companies’ key export markets are regional. For
example, Latin American merchants sell to Latin American markets or to the United States; African
merchants sell to African or Middle Eastern markets; and Asian companies sell either to East Asia or
to Europe. China and the United States are also often highlighted as tough markets to enter.
Companies with online sales also derive a larger share of their revenues from exports than
companies that do not buy or sell online.
FIGURE 5. NUMBER OF MARKETS COMPANIES SELL INTO, BY COMPANY'S ONLINE
SALES ACTIVITY
Similarly, companies that sell online are also likelier to be faster-growing—they have 10
percent or higher annual revenue growth—than companies that grow slowly (at less
than 10 percent per annum), controlling for company size. The share of these faster-
growing companies is 45 percent of companies that have online sales, vs. 33 percent for offline
sellers (figure 6). Also companies with at least 10 percent of foreign ownership export more than
7
those with no foreign owners, likely because of the overseas contacts that foreign owners and
managers help provide.
FIGURE 6. % OF FAST-GROWTH COMPANIES
(Annual Revenue Growth of >10% or More) in a Category, by Online Activity
There are no appreciable differences between men- or women-run companies when it comes to
their participation in trade, nor are there meaningful differences between business-to-business (B2B)
or business-to-consumer (B2C) merchants. The differences between companies in their export
participation and export intensity are mostly correlated with company size and their engagement in
online sales. These regularities are echoed in international trade literature, where it is typically the
fastest-growing and largest companies that are likeliest to export.
B. OBSTACLES TO ECOMMERCE
The core part of the survey was to grasp companies’ perceived challenges to selling online. There
are several findings.
Perceived challenges to ecommerce vary very significantly across and within countries;
every country has its idiosyncratic challenges, which means that policy
recommendations and interventions need to be tailored to each country. This study asked
companies to rank the functioning of the enabling environment for ecommerce from 1 (very poor,
significant barriers to ecommerce) to 10 (excellent, facilitates ecommerce), both in broad categories
(such as logistics) and in narrow subcategories helpful for designing policy interventions (such as,
under logistics, last-mile delivery and customs procedures for ecommerce imports).
The results yield substantial variation across issues areas, countries, and companies. For example, in
some countries such as Bangladesh, online payments are a leading problem to ecommerce; in others
such as Argentina and Kenya, cross-border logistics and customs procedures are the most
challenging (figure 7). In Kenya, for example, local platforms report tremendous hurdles for cross-
border business, including delays and fees at customs and lack of cross-border logistics. Local
companies thus lack incentives to use platforms or other formal channels for cross-border trade and
platforms have not thus built cross-border into their growth strategies in the region. In still other
countries, such as Brazil, ecommerce and digital regulations and the overall regulatory environment
complicate ecommerce. In Nigeria, access to finance issues and logistics dominate the list of
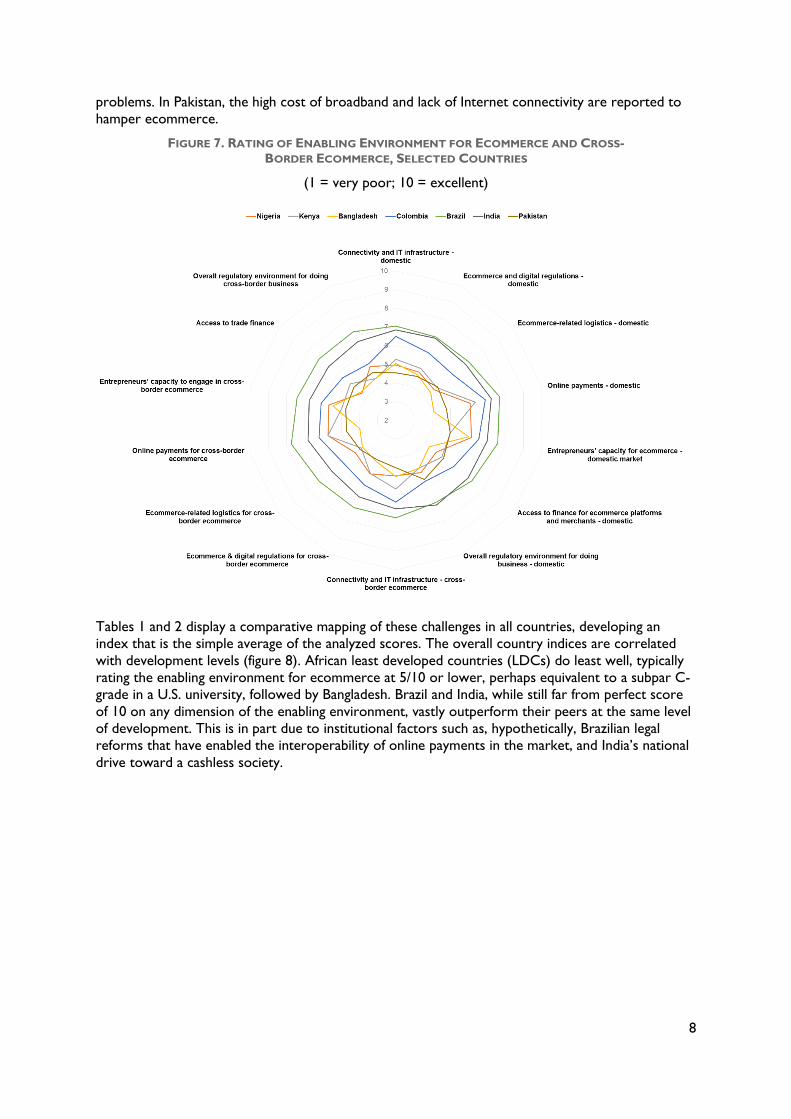
8
problems. In Pakistan, the high cost of broadband and lack of Internet connectivity are reported to
hamper ecommerce.
FIGURE 7. RATING OF ENABLING ENVIRONMENT FOR ECOMMERCE AND CROSS-
BORDER ECOMMERCE, SELECTED COUNTRIES
(1 = very poor; 10 = excellent)
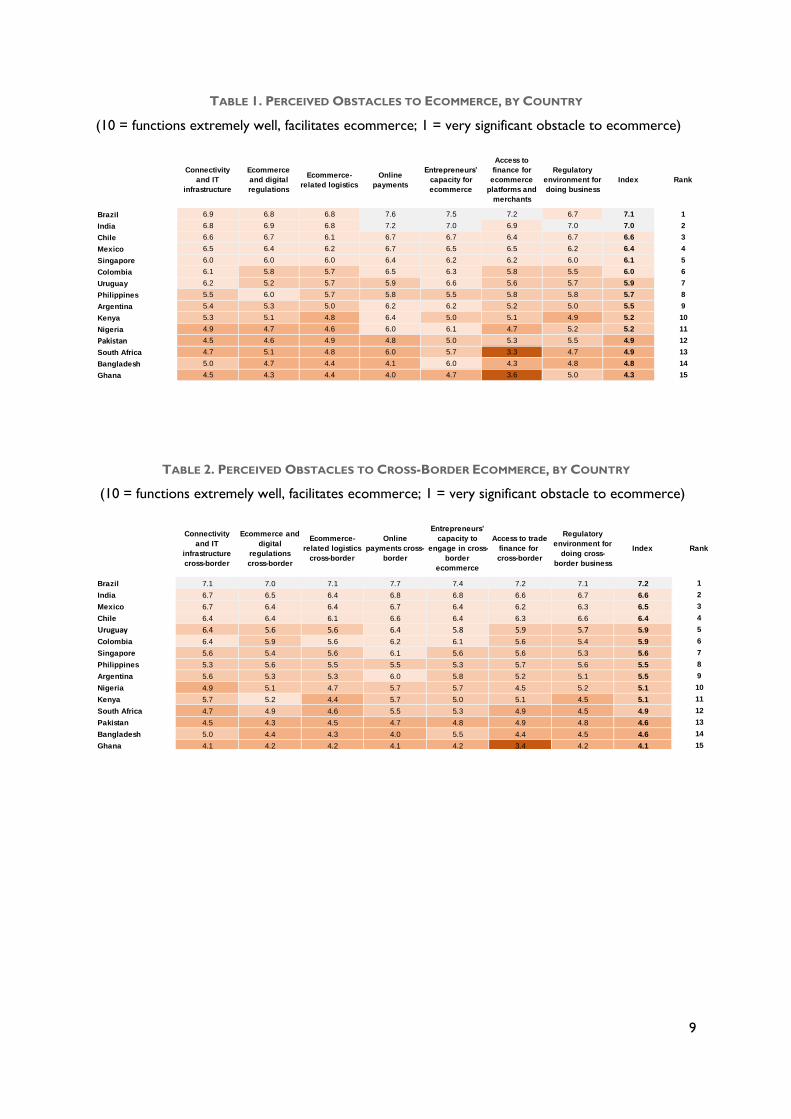
Tables 1 and 2 display a comparative mapping of these challenges in all countries, developing an
index that is the simple average of the analyzed scores. The overall country indices are correlated
with development levels (figure 8). African least developed countries (LDCs) do least well, typically
rating the enabling environment for ecommerce at 5/10 or lower, perhaps equivalent to a subpar C-
grade in a U.S. university, followed by Bangladesh. Brazil and India, while still far from perfect score
of 10 on any dimension of the enabling environment, vastly outperform their peers at the same level
of development. This is in part due to institutional factors such as, hypothetically, Brazilian legal
reforms that have enabled the interoperability of online payments in the market, and India’s national
drive toward a cashless society.
9
TABLE 1. PERCEIVED OBSTACLES TO ECOMMERCE, BY COUNTRY
(10 = functions extremely well, facilitates ecommerce; 1 = very significant obstacle to ecommerce)
TABLE 2. PERCEIVED OBSTACLES TO CROSS-BORDER ECOMMERCE, BY COUNTRY
(10 = functions extremely well, facilitates ecommerce; 1 = very significant obstacle to ecommerce)
Connectivity
and IT
infrastructure
Ecommerce
and digital
regulations
Ecommerce-
related logistics
Online
payments
Entrepreneurs’
capacity for
ecommerce
Access to
finance for
ecommerce
platforms and
merchants
Regulatory
environment for
doing business
Index Rank
Brazil 6.9 6.8 6.8 7.6 7.5 7.2 6.7 7.1 1
India 6.8 6.9 6.8 7.2 7.0 6.9 7.0 7.0 2
Chile 6.6 6.7 6.1 6.7 6.7 6.4 6.7 6.6 3
Mexico 6.5 6.4 6.2 6.7 6.5 6.5 6.2 6.4 4
Singapore 6.0 6.0 6.0 6.4 6.2 6.2 6.0 6.1 5
Colombia 6.1 5.8 5.7 6.5 6.3 5.8 5.5 6.0 6
Uruguay 6.2 5.2 5.7 5.9 6.6 5.6 5.7 5.9 7
Philippines 5.5 6.0 5.7 5.8 5.5 5.8 5.8 5.7 8
Argentina 5.4 5.3 5.0 6.2 6.2 5.2 5.0 5.5 9
Kenya 5.3 5.1 4.8 6.4 5.0 5.1 4.9 5.2 10
Nigeria 4.9 4.7 4.6 6.0 6.1 4.7 5.2 5.2 11
Pakistan 4.5 4.6 4.9 4.8 5.0 5.3 5.5 4.9 12
South Africa 4.7 5.1 4.8 6.0 5.7 3.3 4.7 4.9 13
Bangladesh 5.0 4.7 4.4 4.1 6.0 4.3 4.8 4.8 14
Ghana 4.5 4.3 4.4 4.0 4.7 3.6 5.0 4.3 15
Connectivity
and IT
infrastructure
cross-border
Ecommerce and
digital
regulations
cross-border
Ecommerce-
related logistics
cross-border
Online
payments cross-
border
Entrepreneurs’
capacity to
engage in cross-
border
ecommerce
Access to trade
finance for
cross-border
Regulatory
environment for
doing cross-
border business
Index Rank
Brazil 7.1 7.0 7.1 7.7 7.4 7.2 7.1 7.2 1
India 6.7 6.5 6.4 6.8 6.8 6.6 6.7 6.6 2
Mexico 6.7 6.4 6.4 6.7 6.4 6.2 6.3 6.5 3
Chile 6.4 6.4 6.1 6.6 6.4 6.3 6.6 6.4 4
Uruguay 6.4 5.6 5.6 6.4 5.8 5.9 5.7 5.9 5
Colombia 6.4 5.9 5.6 6.2 6.1 5.6 5.4 5.9 6
Singapore 5.6 5.4 5.6 6.1 5.6 5.6 5.3 5.6 7
Philippines 5.3 5.6 5.5 5.5 5.3 5.7 5.6 5.5 8
Argentina 5.6 5.3 5.3 6.0 5.8 5.2 5.1 5.5 9
Nigeria 4.9 5.1 4.7 5.7 5.7 4.5 5.2 5.1 10
Kenya 5.7 5.2 4.4 5.7 5.0 5.1 4.5 5.1 11
South Africa 4.7 4.9 4.6 5.5 5.3 4.9 4.5 4.9 12
Pakistan 4.5 4.3 4.5 4.7 4.8 4.9 4.8 4.6 13
Bangladesh 5.0 4.4 4.3 4.0 5.5 4.4 4.5 4.6 14
Ghana 4.1 4.2 4.2 4.1 4.2 3.4 4.2 4.1 15
10
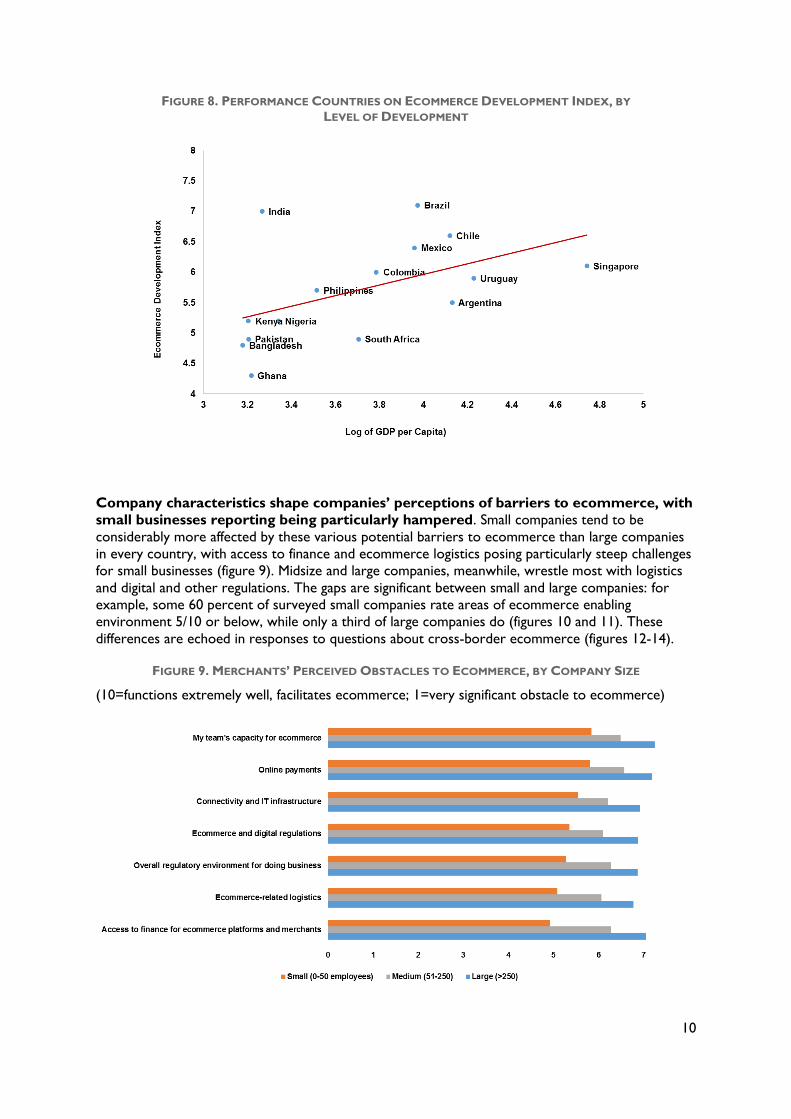
FIGURE 8. PERFORMANCE COUNTRIES ON ECOMMERCE DEVELOPMENT INDEX, BY
LEVEL OF DEVELOPMENT
Company characteristics shape companies’ perceptions of barriers to ecommerce, with
small businesses reporting being particularly hampered. Small companies tend to be
considerably more affected by these various potential barriers to ecommerce than large companies
in every country, with access to finance and ecommerce logistics posing particularly steep challenges
for small businesses (figure 9). Midsize and large companies, meanwhile, wrestle most with logistics
and digital and other regulations. The gaps are significant between small and large companies: for
example, some 60 percent of surveyed small companies rate areas of ecommerce enabling
environment 5/10 or below, while only a third of large companies do (figures 10 and 11). These
differences are echoed in responses to questions about cross-border ecommerce (figures 12-14).
FIGURE 9. MERCHANTS’ PERCEIVED OBSTACLES TO ECOMMERCE, BY COMPANY SIZE
(10=functions extremely well, facilitates ecommerce; 1=very significant obstacle to ecommerce)

11
FIGURE 10. SEVERITY OF POTENTIAL OBSTACLES TO MERCHANTS’ ECOMMERCE - % OF
SMALL COMPANIES GIVING A CERTAIN RANKING
(10=functions extremely well, facilitates ecommerce; 1=very significant obstacle to ecommerce)
FIGURE 11. SEVERITY OF POTENTIAL OBSTACLES TO MERCHANTS’ ECOMMERCE - % OF
LARGE COMPANIES GIVING A CERTAIN RANKING
(10=functions extremely well, facilitates ecommerce; 1=very significant obstacle to ecommerce)
12
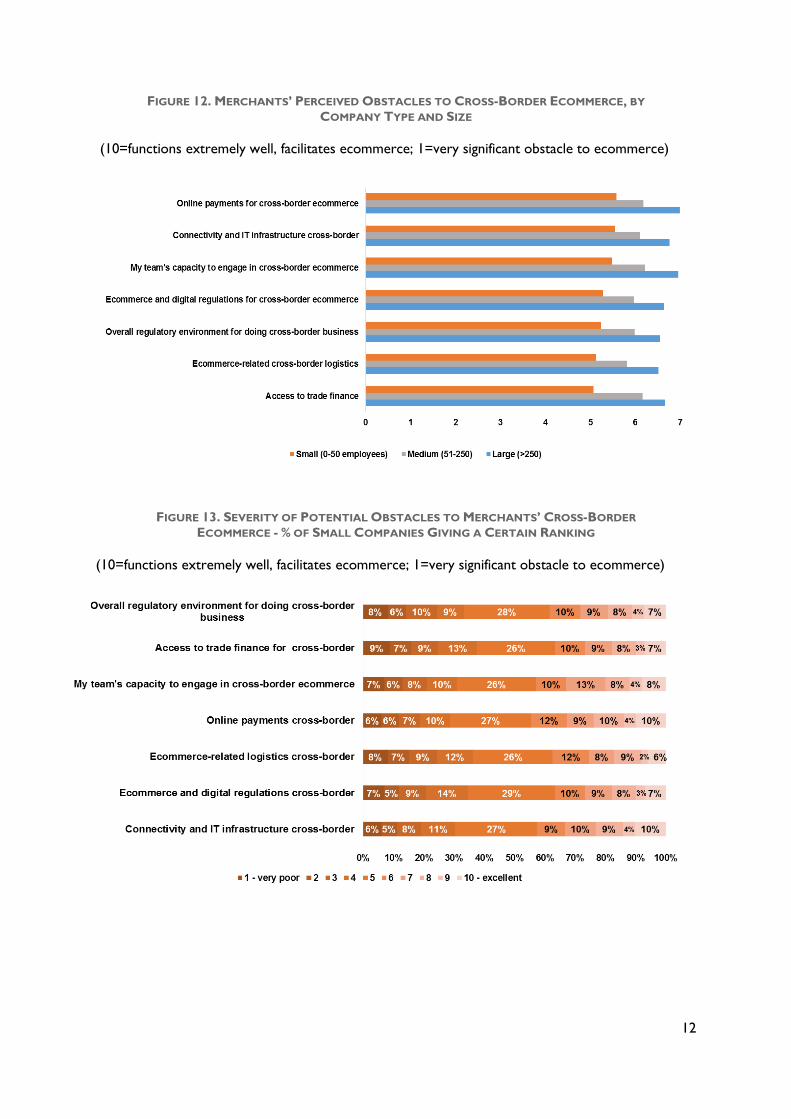
FIGURE 12. MERCHANTS’ PERCEIVED OBSTACLES TO CROSS-BORDER ECOMMERCE, BY
COMPANY TYPE AND SIZE
(10=functions extremely well, facilitates ecommerce; 1=very significant obstacle to ecommerce)
FIGURE 13. SEVERITY OF POTENTIAL OBSTACLES TO MERCHANTS’ CROSS-BORDER
ECOMMERCE - % OF SMALL COMPANIES GIVING A CERTAIN RANKING
(10=functions extremely well, facilitates ecommerce; 1=very significant obstacle to ecommerce)
13
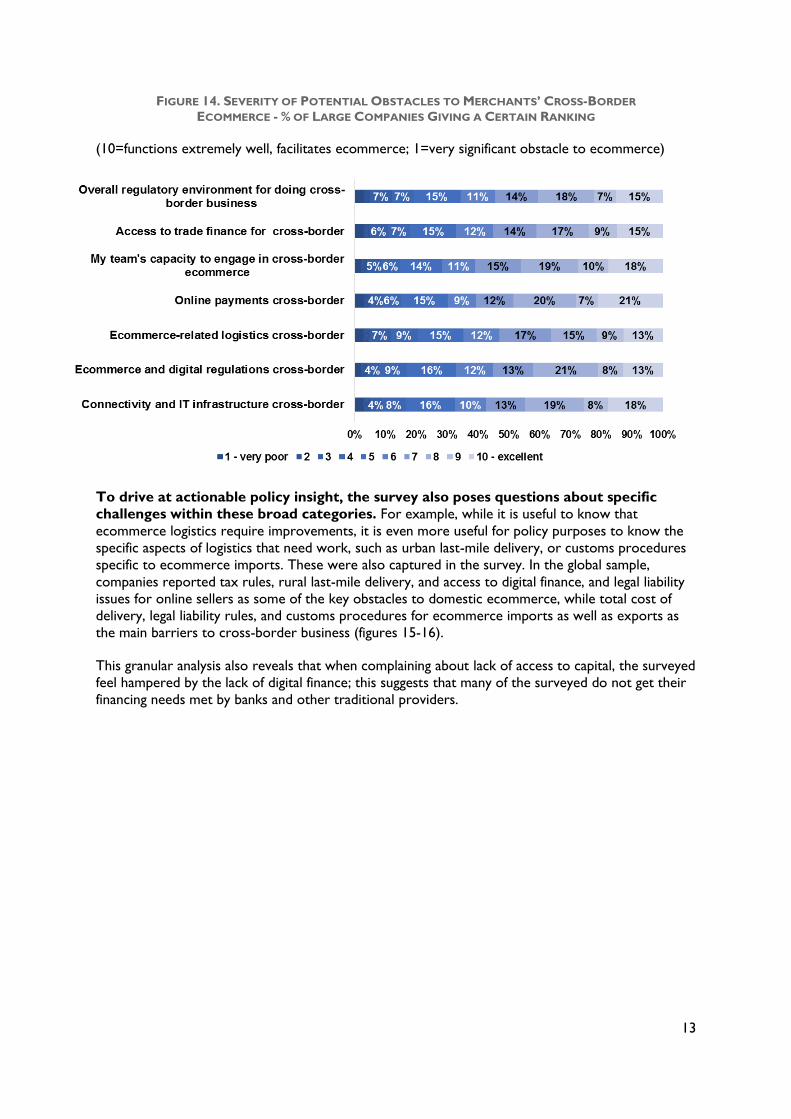
FIGURE 14. SEVERITY OF POTENTIAL OBSTACLES TO MERCHANTS’ CROSS-BORDER
ECOMMERCE - % OF LARGE COMPANIES GIVING A CERTAIN RANKING
(10=functions extremely well, facilitates ecommerce; 1=very significant obstacle to ecommerce)
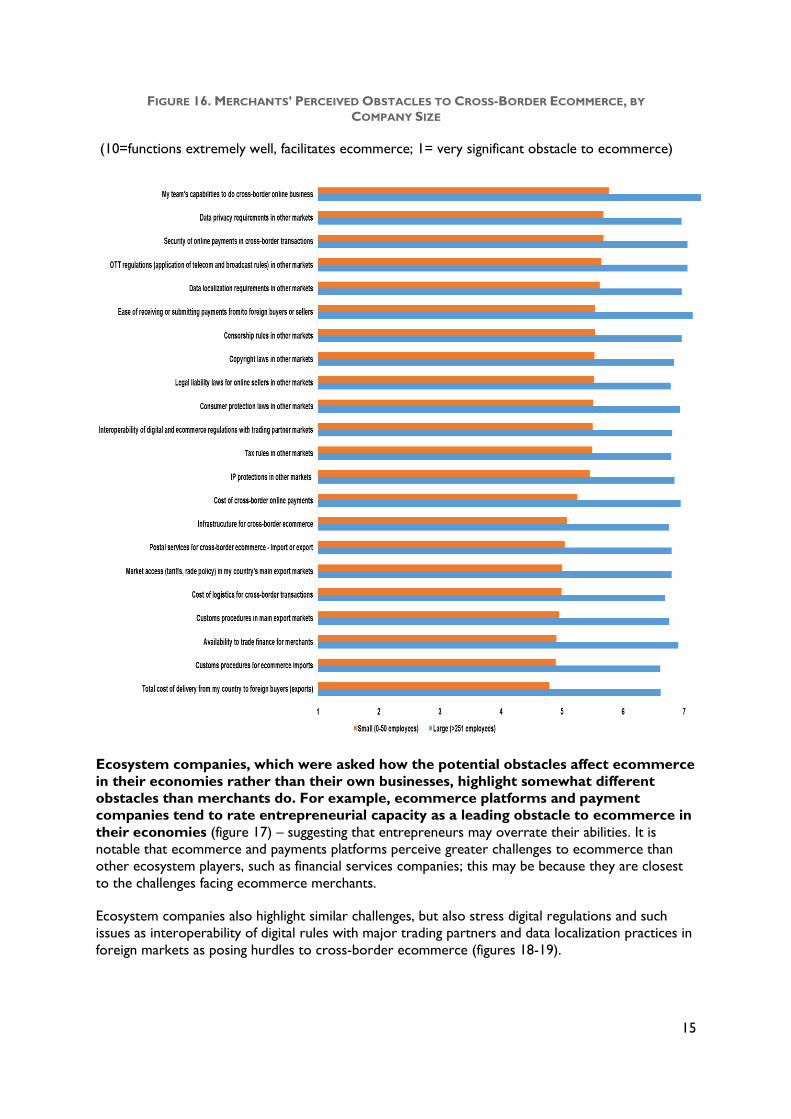
To drive at actionable policy insight, the survey also poses questions about specific
challenges within these broad categories. For example, while it is useful to know that
ecommerce logistics require improvements, it is even more useful for policy purposes to know the
specific aspects of logistics that need work, such as urban last-mile delivery, or customs procedures
specific to ecommerce imports. These were also captured in the survey. In the global sample,
companies reported tax rules, rural last-mile delivery, and access to digital finance, and legal liability
issues for online sellers as some of the key obstacles to domestic ecommerce, while total cost of
delivery, legal liability rules, and customs procedures for ecommerce imports as well as exports as
the main barriers to cross-border business (figures 15-16).
This granular analysis also reveals that when complaining about lack of access to capital, the surveyed
feel hampered by the lack of digital finance; this suggests that many of the surveyed do not get their
financing needs met by banks and other traditional providers.
14
FIGURE 15. PERCEIVED OBSTACLES TO ECOMMERCE, BY COMPANY SIZE
(10=functions extremely well, facilitates ecommerce; 1= very significant obstacle to ecommerce)
15
FIGURE 16. MERCHANTS’ PERCEIVED OBSTACLES TO CROSS-BORDER ECOMMERCE, BY
COMPANY SIZE
(10=functions extremely well, facilitates ecommerce; 1= very significant obstacle to ecommerce)
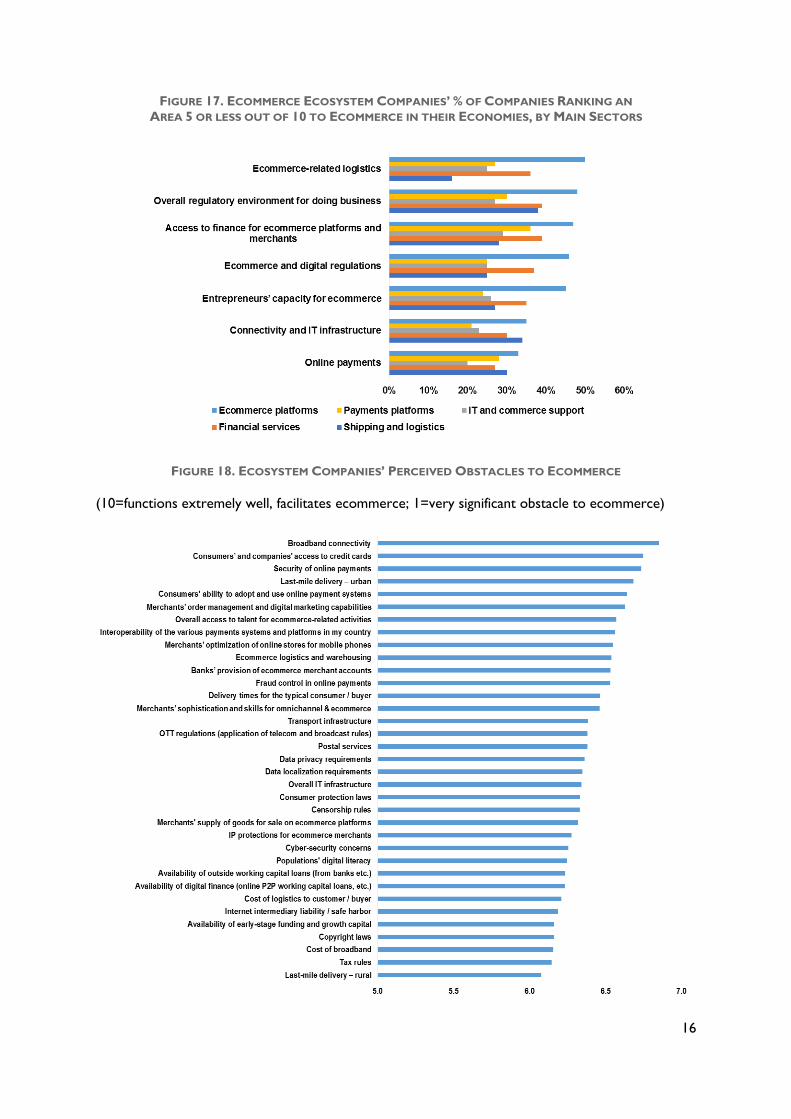
Ecosystem companies, which were asked how the potential obstacles affect ecommerce
in their economies rather than their own businesses, highlight somewhat different
obstacles than merchants do. For example, ecommerce platforms and payment
companies tend to rate entrepreneurial capacity as a leading obstacle to ecommerce in
their economies (figure 17) – suggesting that entrepreneurs may overrate their abilities. It is
notable that ecommerce and payments platforms perceive greater challenges to ecommerce than
other ecosystem players, such as financial services companies; this may be because they are closest
to the challenges facing ecommerce merchants.
Ecosystem companies also highlight similar challenges, but also stress digital regulations and such
issues as interoperability of digital rules with major trading partners and data localization practices in
foreign markets as posing hurdles to cross-border ecommerce (figures 18-19).
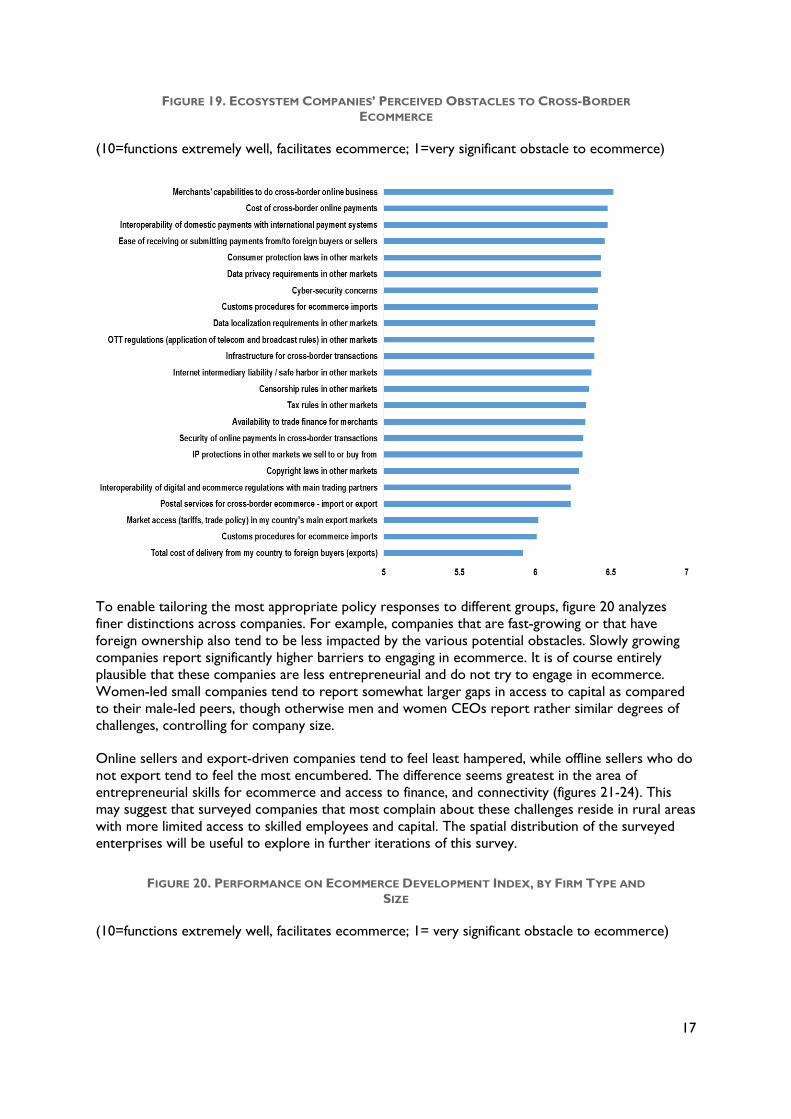
16
FIGURE 17. ECOMMERCE ECOSYSTEM COMPANIES’ % OF COMPANIES RANKING AN
AREA 5 OR LESS OUT OF 10 TO ECOMMERCE IN THEIR ECONOMIES, BY MAIN SECTORS
FIGURE 18. ECOSYSTEM COMPANIES’ PERCEIVED OBSTACLES TO ECOMMERCE
(10=functions extremely well, facilitates ecommerce; 1=very significant obstacle to ecommerce)
17
FIGURE 19. ECOSYSTEM COMPANIES’ PERCEIVED OBSTACLES TO CROSS-BORDER
ECOMMERCE
(10=functions extremely well, facilitates ecommerce; 1=very significant obstacle to ecommerce)
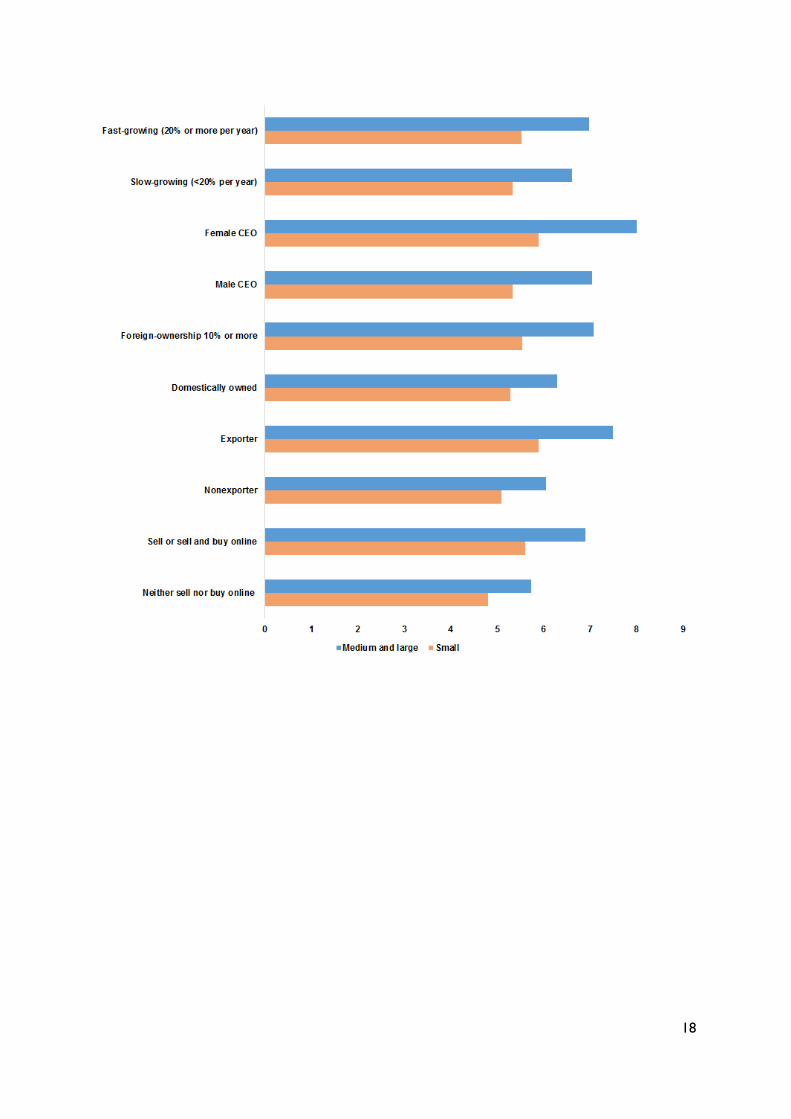
To enable tailoring the most appropriate policy responses to different groups, figure 20 analyzes
finer distinctions across companies. For example, companies that are fast-growing or that have
foreign ownership also tend to be less impacted by the various potential obstacles. Slowly growing
companies report significantly higher barriers to engaging in ecommerce. It is of course entirely
plausible that these companies are less entrepreneurial and do not try to engage in ecommerce.
Women-led small companies tend to report somewhat larger gaps in access to capital as compared
to their male-led peers, though otherwise men and women CEOs report rather similar degrees of
challenges, controlling for company size.
Online sellers and export-driven companies tend to feel least hampered, while offline sellers who do
not export tend to feel the most encumbered. The difference seems greatest in the area of
entrepreneurial skills for ecommerce and access to finance, and connectivity (figures 21-24). This
may suggest that surveyed companies that most complain about these challenges reside in rural areas
with more limited access to skilled employees and capital. The spatial distribution of the surveyed
enterprises will be useful to explore in further iterations of this survey.
FIGURE 20. PERFORMANCE ON ECOMMERCE DEVELOPMENT INDEX, BY FIRM TYPE AND
SIZE
(10=functions extremely well, facilitates ecommerce; 1= very significant obstacle to ecommerce)
18

19
FIGURE 21. % OF SMALL COMPANIES RANKING AN AREA 5 OR LESS OUT OF 10 TO
ECOMMERCE, BY EXPORT ACTIVITY
FIGURE 22. % OF SMALL COMPANIES RANKING AN AREA 5 OR LESS OUT OF 10 TO
CROSS-BORDER ECOMMERCE, BY EXPORT ACTIVITY
20
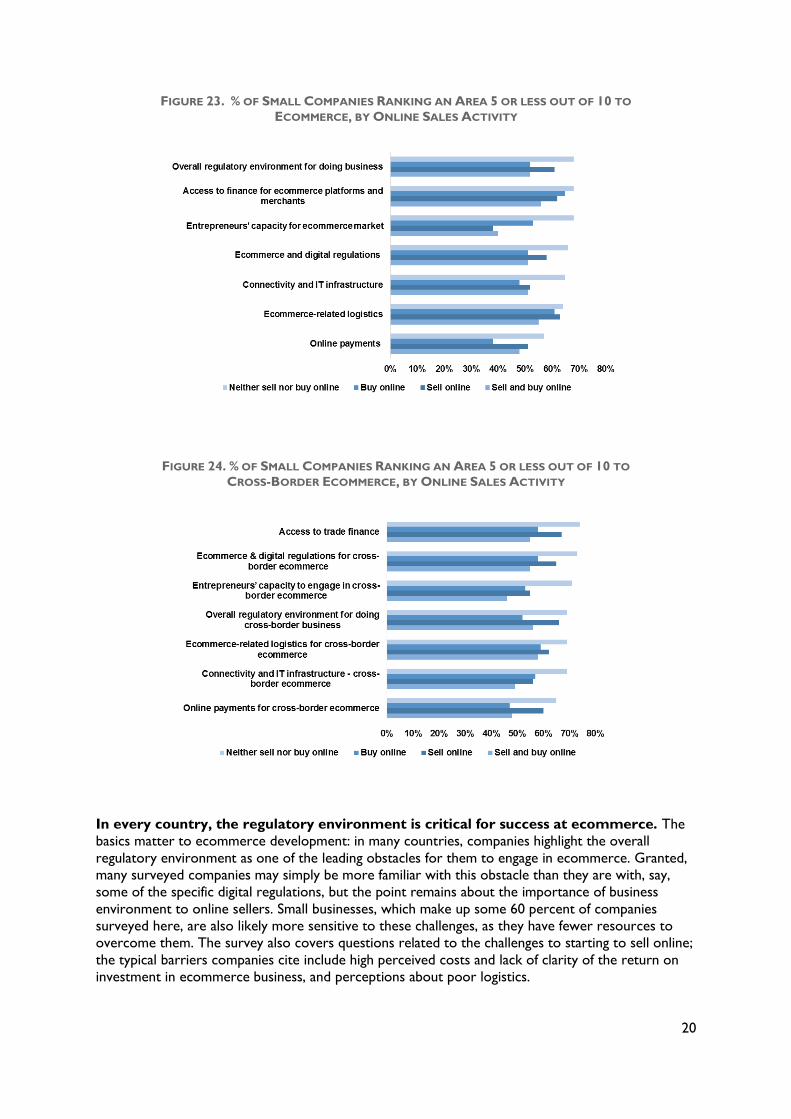
FIGURE 23. % OF SMALL COMPANIES RANKING AN AREA 5 OR LESS OUT OF 10 TO
ECOMMERCE, BY ONLINE SALES ACTIVITY
FIGURE 24. % OF SMALL COMPANIES RANKING AN AREA 5 OR LESS OUT OF 10 TO
CROSS-BORDER ECOMMERCE, BY ONLINE SALES ACTIVITY
In every country, the regulatory environment is critical for success at ecommerce. The
basics matter to ecommerce development: in many countries, companies highlight the overall
regulatory environment as one of the leading obstacles for them to engage in ecommerce. Granted,
many surveyed companies may simply be more familiar with this obstacle than they are with, say,
some of the specific digital regulations, but the point remains about the importance of business
environment to online sellers. Small businesses, which make up some 60 percent of companies
surveyed here, are also likely more sensitive to these challenges, as they have fewer resources to
overcome them. The survey also covers questions related to the challenges to starting to sell online;
the typical barriers companies cite include high perceived costs and lack of clarity of the return on
investment in ecommerce business, and perceptions about poor logistics.
21
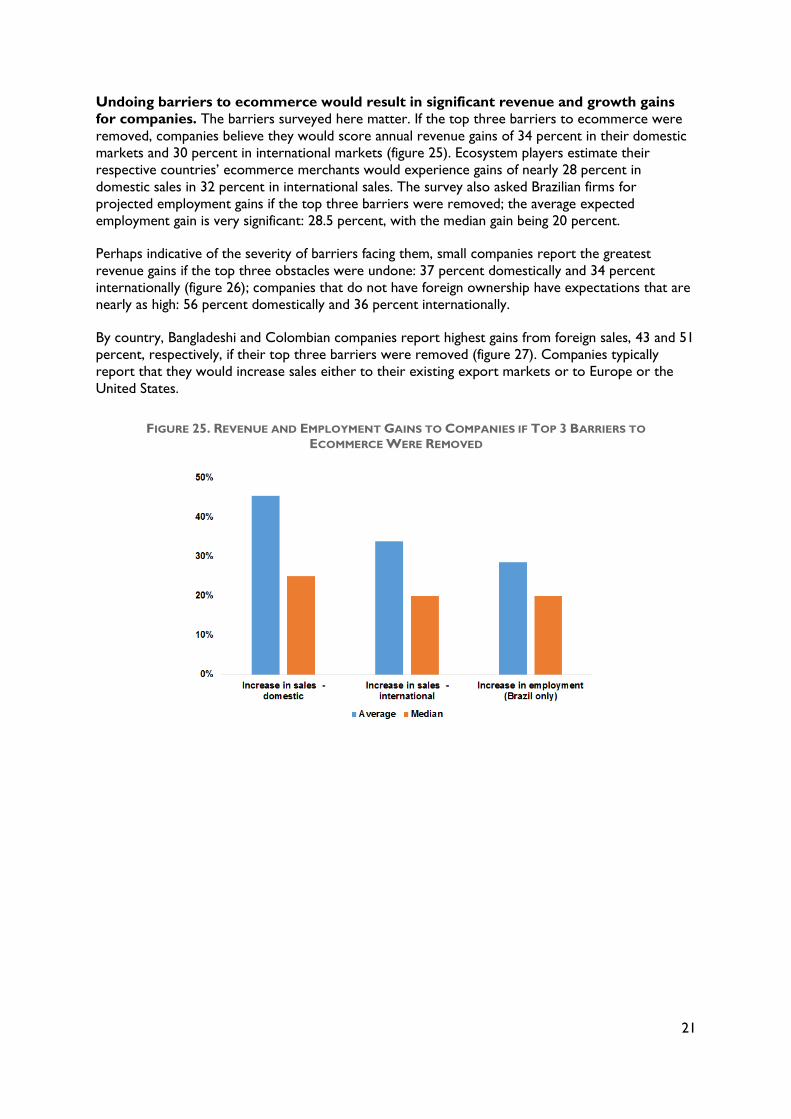
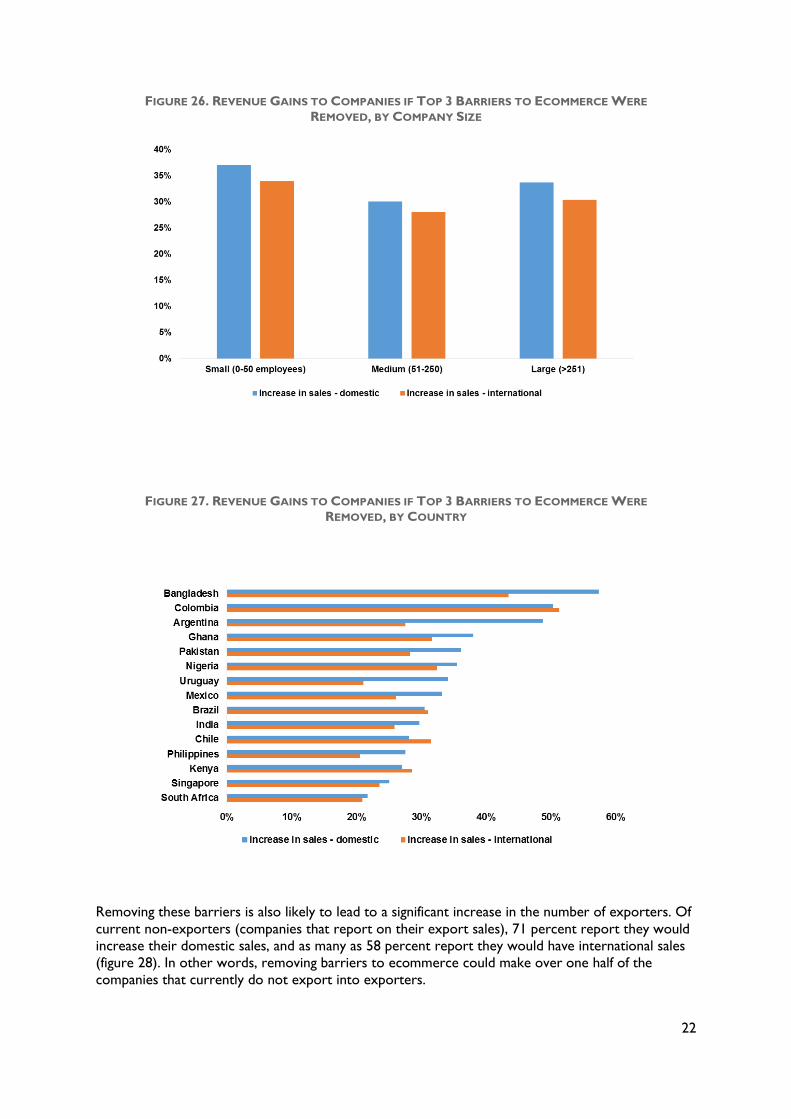
Undoing barriers to ecommerce would result in significant revenue and growth gains
for companies. The barriers surveyed here matter. If the top three barriers to ecommerce were
removed, companies believe they would score annual revenue gains of 34 percent in their domestic
markets and 30 percent in international markets (figure 25). Ecosystem players estimate their
respective countries’ ecommerce merchants would experience gains of nearly 28 percent in
domestic sales in 32 percent in international sales. The survey also asked Brazilian firms for
projected employment gains if the top three barriers were removed; the average expected
employment gain is very significant: 28.5 percent, with the median gain being 20 percent.
Perhaps indicative of the severity of barriers facing them, small companies report the greatest
revenue gains if the top three obstacles were undone: 37 percent domestically and 34 percent
internationally (figure 26); companies that do not have foreign ownership have expectations that are
nearly as high: 56 percent domestically and 36 percent internationally.
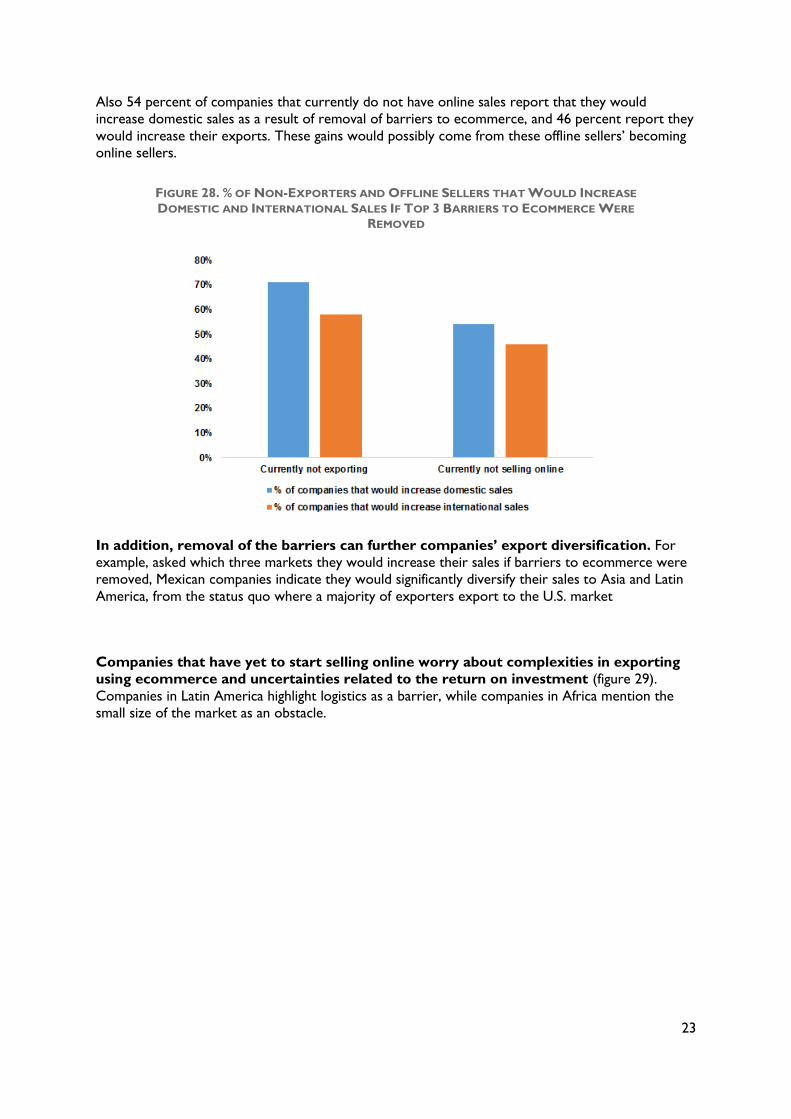
By country, Bangladeshi and Colombian companies report highest gains from foreign sales, 43 and 51
percent, respectively, if their top three barriers were removed (figure 27). Companies typically
report that they would increase sales either to their existing export markets or to Europe or the
United States.
FIGURE 25. REVENUE AND EMPLOYMENT GAINS TO COMPANIES IF TOP 3 BARRIERS TO
ECOMMERCE WERE REMOVED
22
FIGURE 26. REVENUE GAINS TO COMPANIES IF TOP 3 BARRIERS TO ECOMMERCE WERE
REMOVED, BY COMPANY SIZE
FIGURE 27. REVENUE GAINS TO COMPANIES IF TOP 3 BARRIERS TO ECOMMERCE WERE
REMOVED, BY COUNTRY
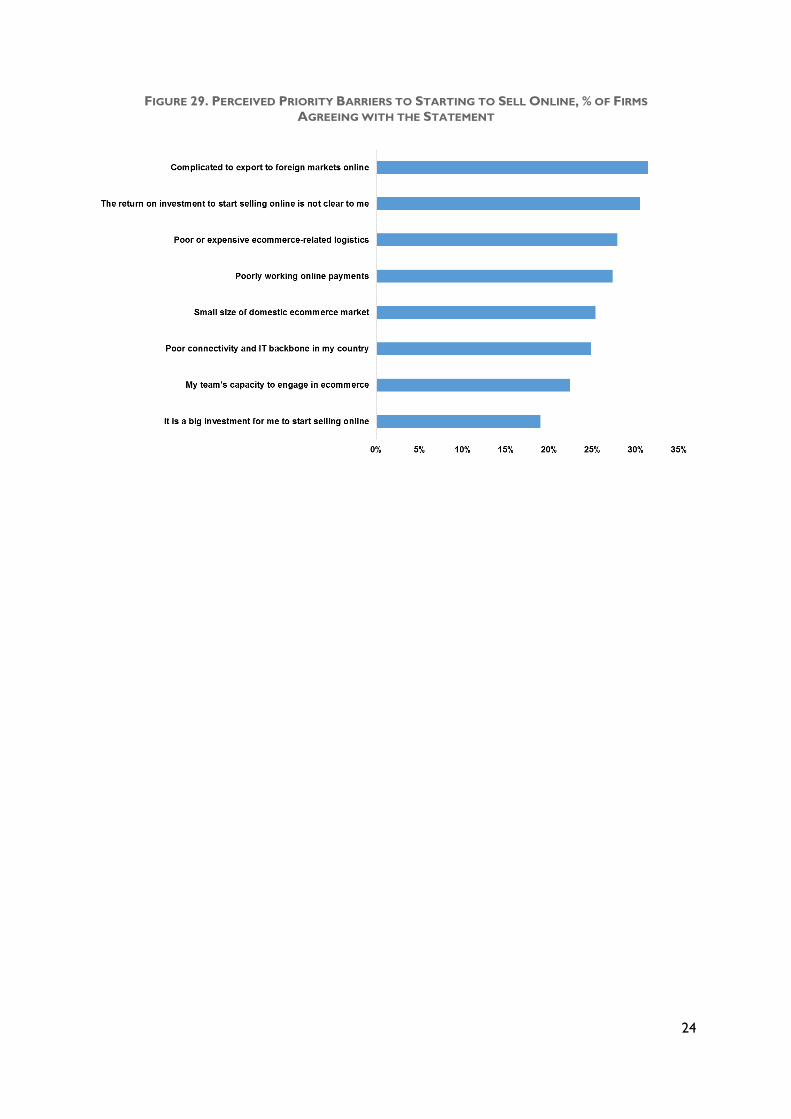
Removing these barriers is also likely to lead to a significant increase in the number of exporters. Of
current non-exporters (companies that report on their export sales), 71 percent report they would
increase their domestic sales, and as many as 58 percent report they would have international sales
(figure 28). In other words, removing barriers to ecommerce could make over one half of the
companies that currently do not export into exporters.
23
Also 54 percent of companies that currently do not have online sales report that they would
increase domestic sales as a result of removal of barriers to ecommerce, and 46 percent report they
would increase their exports. These gains would possibly come from these offline sellers’ becoming
online sellers.
FIGURE 28. % OF NON-EXPORTERS AND OFFLINE SELLERS THAT WOULD INCREASE
DOMESTIC AND INTERNATIONAL SALES IF TOP 3 BARRIERS TO ECOMMERCE WERE
REMOVED
In addition, removal of the barriers can further companies’ export diversification. For
example, asked which three markets they would increase their sales if barriers to ecommerce were
removed, Mexican companies indicate they would significantly diversify their sales to Asia and Latin
America, from the status quo where a majority of exporters export to the U.S. market
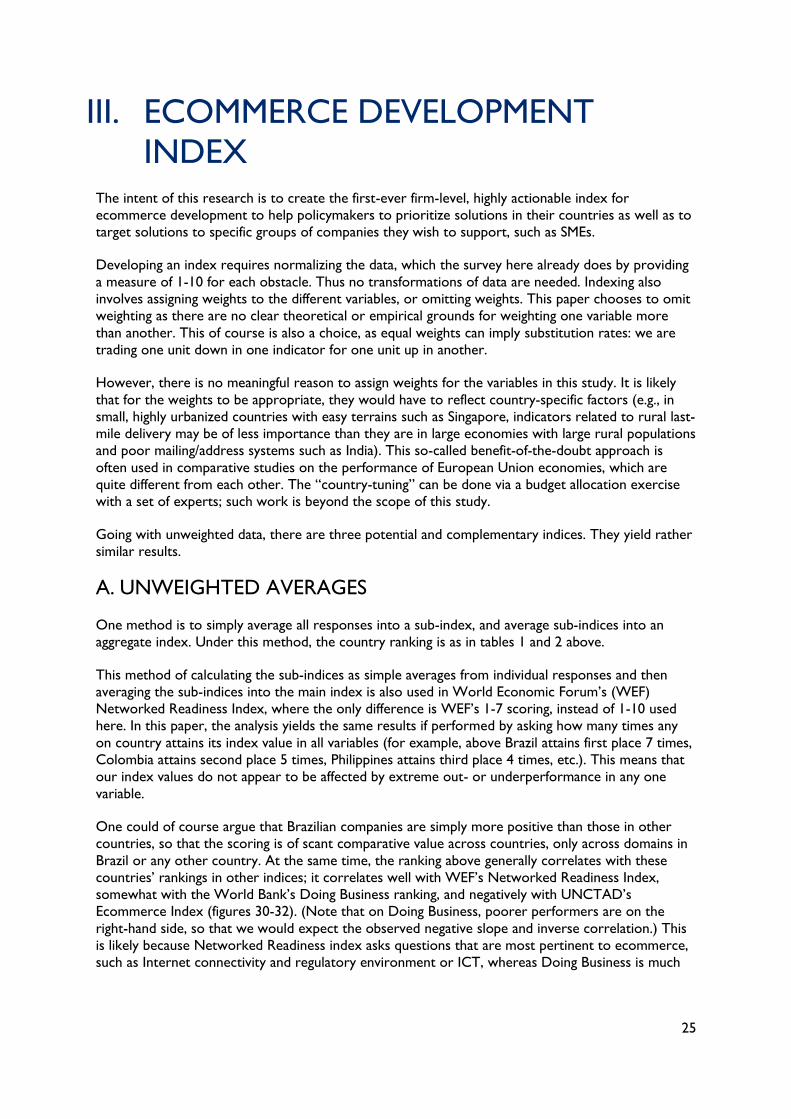
Companies that have yet to start selling online worry about complexities in exporting
using ecommerce and uncertainties related to the return on investment (figure 29).
Companies in Latin America highlight logistics as a barrier, while companies in Africa mention the
small size of the market as an obstacle.
24
FIGURE 29. PERCEIVED PRIORITY BARRIERS TO STARTING TO SELL ONLINE, % OF FIRMS
AGREEING WITH THE STATEMENT
25
III. ECOMMERCE DEVELOPMENT
INDEX The intent of this research is to create the first-ever firm-level, highly actionable index for
ecommerce development to help policymakers to prioritize solutions in their countries as well as to
target solutions to specific groups of companies they wish to support, such as SMEs.
Developing an index requires normalizing the data, which the survey here already does by providing
a measure of 1-10 for each obstacle. Thus no transformations of data are needed. Indexing also
involves assigning weights to the different variables, or omitting weights. This paper chooses to omit
weighting as there are no clear theoretical or empirical grounds for weighting one variable more
than another. This of course is also a choice, as equal weights can imply substitution rates: we are
trading one unit down in one indicator for one unit up in another.
However, there is no meaningful reason to assign weights for the variables in this study. It is likely
that for the weights to be appropriate, they would have to reflect country-specific factors (e.g., in
small, highly urbanized countries with easy terrains such as Singapore, indicators related to rural last-
mile delivery may be of less importance than they are in large economies with large rural populations
and poor mailing/address systems such as India). This so-called benefit-of-the-doubt approach is
often used in comparative studies on the performance of European Union economies, which are
quite different from each other. The “country-tuning” can be done via a budget allocation exercise
with a set of experts; such work is beyond the scope of this study.
Going with unweighted data, there are three potential and complementary indices. They yield rather
similar results.
A. UNWEIGHTED AVERAGES
One method is to simply average all responses into a sub-index, and average sub-indices into an
aggregate index. Under this method, the country ranking is as in tables 1 and 2 above.
This method of calculating the sub-indices as simple averages from individual responses and then
averaging the sub-indices into the main index is also used in World Economic Forum’s (WEF)
Networked Readiness Index, where the only difference is WEF’s 1-7 scoring, instead of 1-10 used
here. In this paper, the analysis yields the same results if performed by asking how many times any
on country attains its index value in all variables (for example, above Brazil attains first place 7 times,
Colombia attains second place 5 times, Philippines attains third place 4 times, etc.). This means that
our index values do not appear to be affected by extreme out- or underperformance in any one
variable.
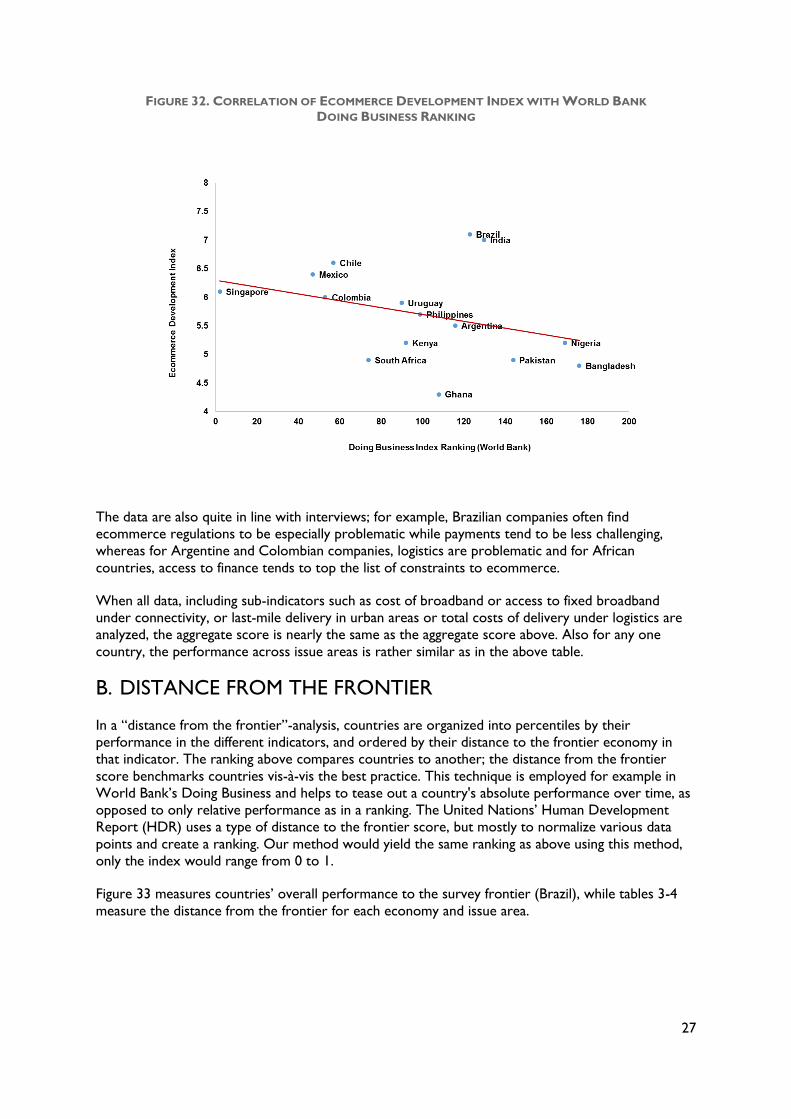
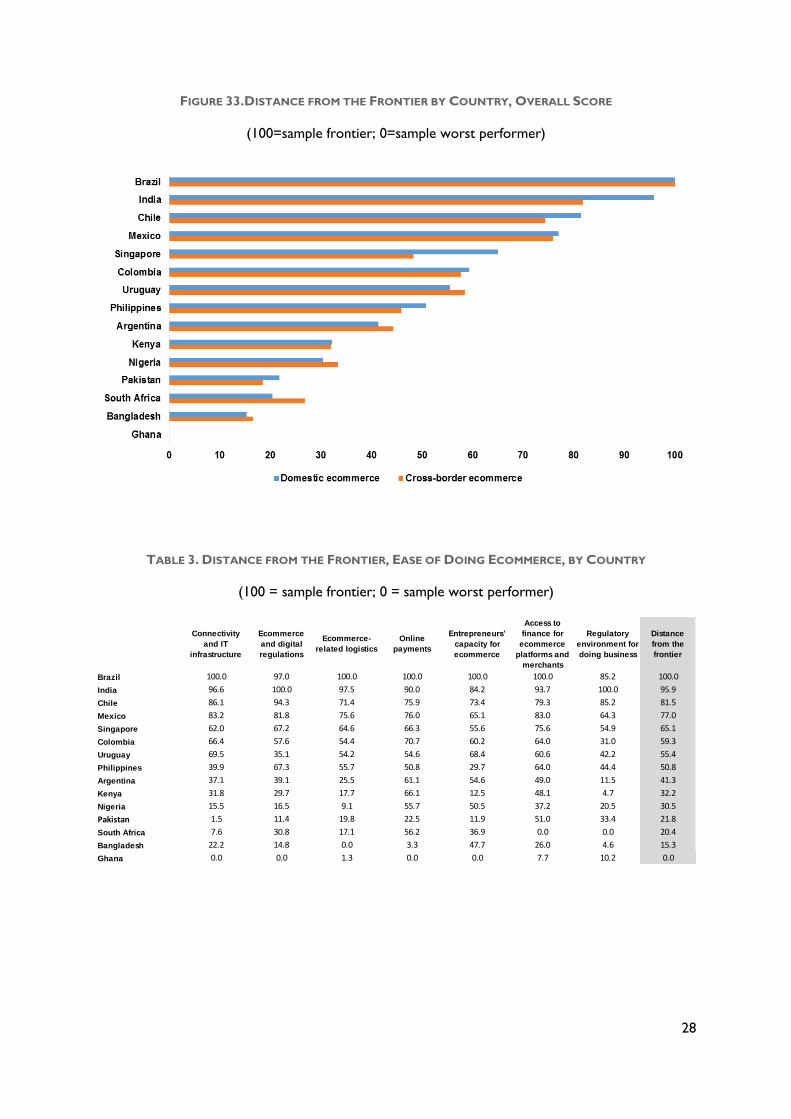
One could of course argue that Brazilian companies are simply more positive than those in other
countries, so that the scoring is of scant comparative value across countries, only across domains in
Brazil or any other country. At the same time, the ranking above generally correlates with these
countries’ rankings in other indices; it correlates well with WEF’s Networked Readiness Index,
somewhat with the World Bank’s Doing Business ranking, and negatively with UNCTAD’s
Ecommerce Index (figures 30-32). (Note that on Doing Business, poorer performers are on the
right-hand side, so that we would expect the observed negative slope and inverse correlation.) This
is likely because Networked Readiness index asks questions that are most pertinent to ecommerce,
such as Internet connectivity and regulatory environment or ICT, whereas Doing Business is much
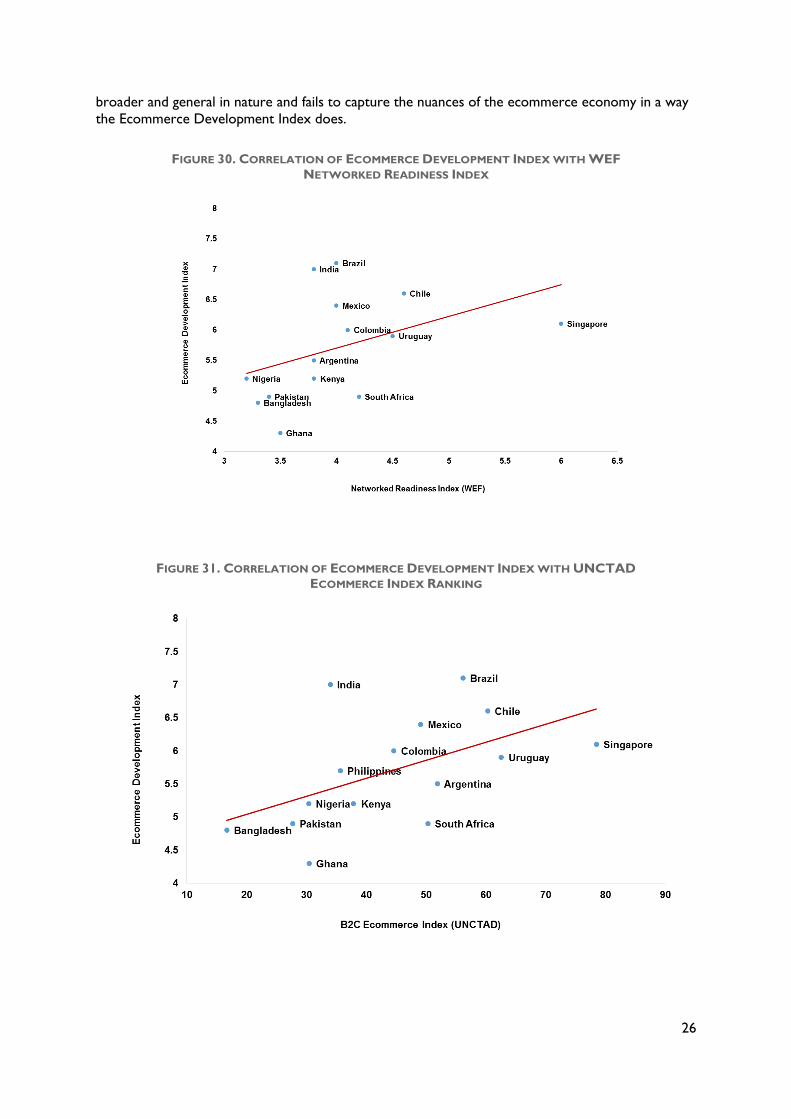
26
broader and general in nature and fails to capture the nuances of the ecommerce economy in a way
the Ecommerce Development Index does.
FIGURE 30. CORRELATION OF ECOMMERCE DEVELOPMENT INDEX WITH WEF
NETWORKED READINESS INDEX
FIGURE 31. CORRELATION OF ECOMMERCE DEVELOPMENT INDEX WITH UNCTAD
ECOMMERCE INDEX RANKING
27
FIGURE 32. CORRELATION OF ECOMMERCE DEVELOPMENT INDEX WITH WORLD BANK
DOING BUSINESS RANKING
The data are also quite in line with interviews; for example, Brazilian companies often find
ecommerce regulations to be especially problematic while payments tend to be less challenging,
whereas for Argentine and Colombian companies, logistics are problematic and for African
countries, access to finance tends to top the list of constraints to ecommerce.
When all data, including sub-indicators such as cost of broadband or access to fixed broadband
under connectivity, or last-mile delivery in urban areas or total costs of delivery under logistics are
analyzed, the aggregate score is nearly the same as the aggregate score above. Also for any one
country, the performance across issue areas is rather similar as in the above table.
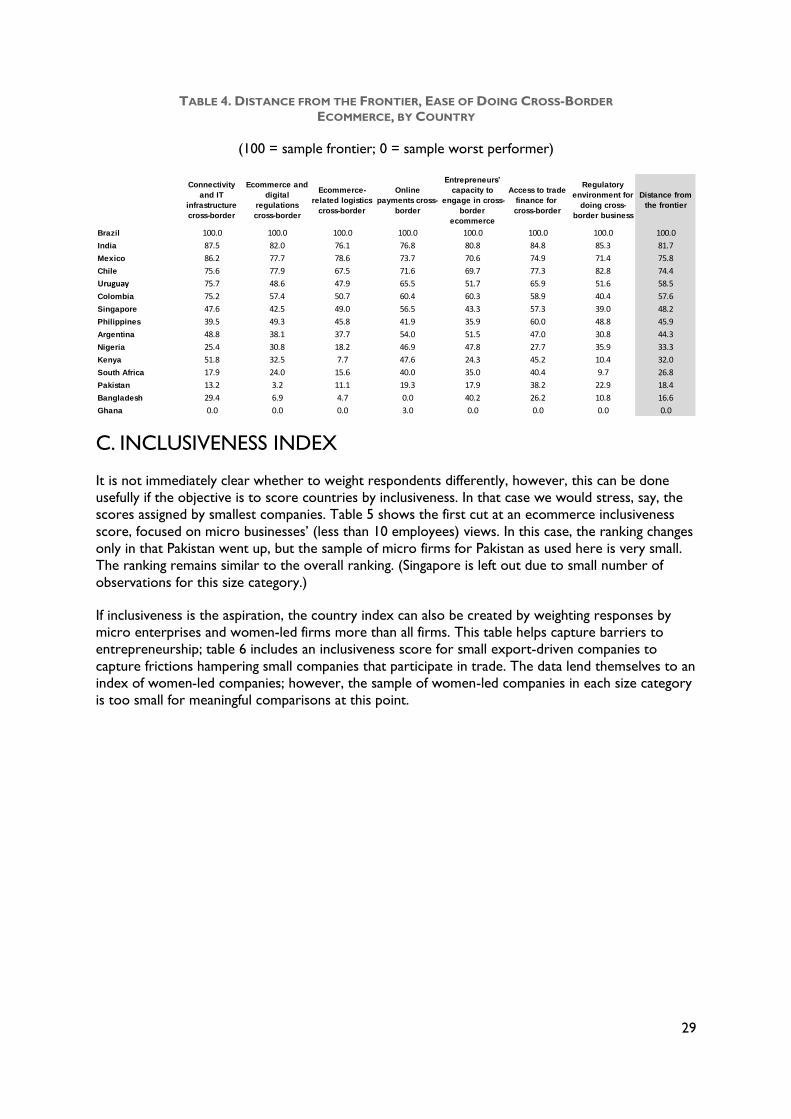
B. DISTANCE FROM THE FRONTIER
In a “distance from the frontier”-analysis, countries are organized into percentiles by their
performance in the different indicators, and ordered by their distance to the frontier economy in
that indicator. The ranking above compares countries to another; the distance from the frontier
score benchmarks countries vis-à-vis the best practice. This technique is employed for example in
World Bank’s Doing Business and helps to tease out a country's absolute performance over time, as
opposed to only relative performance as in a ranking. The United Nations’ Human Development
Report (HDR) uses a type of distance to the frontier score, but mostly to normalize various data
points and create a ranking. Our method would yield the same ranking as above using this method,
only the index would range from 0 to 1.
Figure 33 measures countries’ overall performance to the survey frontier (Brazil), while tables 3-4
measure the distance from the frontier for each economy and issue area.
28
FIGURE 33.DISTANCE FROM THE FRONTIER BY COUNTRY, OVERALL SCORE
(100=sample frontier; 0=sample worst performer)
TABLE 3. DISTANCE FROM THE FRONTIER, EASE OF DOING ECOMMERCE, BY COUNTRY
(100 = sample frontier; 0 = sample worst performer)
Connectivity
and IT
infrastructure
Ecommerce
and digital
regulations
Ecommerce-
related logistics
Online
payments
Entrepreneurs’
capacity for
ecommerce
Access to
finance for
ecommerce
platforms and
merchants
Regulatory
environment for
doing business
Distance
from the
frontier
Brazil 100.0 97.0 100.0 100.0 100.0 100.0 85.2 100.0
India 96.6 100.0 97.5 90.0 84.2 93.7 100.0 95.9
Chile 86.1 94.3 71.4 75.9 73.4 79.3 85.2 81.5
Mexico 83.2 81.8 75.6 76.0 65.1 83.0 64.3 77.0
Singapore 62.0 67.2 64.6 66.3 55.6 75.6 54.9 65.1
Colombia 66.4 57.6 54.4 70.7 60.2 64.0 31.0 59.3
Uruguay 69.5 35.1 54.2 54.6 68.4 60.6 42.2 55.4
Philippines 39.9 67.3 55.7 50.8 29.7 64.0 44.4 50.8
Argentina 37.1 39.1 25.5 61.1 54.6 49.0 11.5 41.3
Kenya 31.8 29.7 17.7 66.1 12.5 48.1 4.7 32.2
Nigeria 15.5 16.5 9.1 55.7 50.5 37.2 20.5 30.5
Pakistan 1.5 11.4 19.8 22.5 11.9 51.0 33.4 21.8
South Africa 7.6 30.8 17.1 56.2 36.9 0.0 0.0 20.4
Bangladesh 22.2 14.8 0.0 3.3 47.7 26.0 4.6 15.3
Ghana 0.0 0.0 1.3 0.0 0.0 7.7 10.2 0.0
29
TABLE 4. DISTANCE FROM THE FRONTIER, EASE OF DOING CROSS-BORDER
ECOMMERCE, BY COUNTRY
(100 = sample frontier; 0 = sample worst performer)
C. INCLUSIVENESS INDEX
It is not immediately clear whether to weight respondents differently, however, this can be done
usefully if the objective is to score countries by inclusiveness. In that case we would stress, say, the
scores assigned by smallest companies. Table 5 shows the first cut at an ecommerce inclusiveness
score, focused on micro businesses’ (less than 10 employees) views. In this case, the ranking changes
only in that Pakistan went up, but the sample of micro firms for Pakistan as used here is very small.
The ranking remains similar to the overall ranking. (Singapore is left out due to small number of
observations for this size category.)
If inclusiveness is the aspiration, the country index can also be created by weighting responses by
micro enterprises and women-led firms more than all firms. This table helps capture barriers to
entrepreneurship; table 6 includes an inclusiveness score for small export-driven companies to
capture frictions hampering small companies that participate in trade. The data lend themselves to an
index of women-led companies; however, the sample of women-led companies in each size category
is too small for meaningful comparisons at this point.
Connectivity
and IT
infrastructure
cross-border
Ecommerce and
digital
regulations
cross-border
Ecommerce-
related logistics
cross-border
Online
payments cross-
border
Entrepreneurs’
capacity to
engage in cross-
border
ecommerce
Access to trade
finance for
cross-border
Regulatory
environment for
doing cross-
border business
Distance from
the frontier
Brazil 100.0 100.0 100.0 100.0 100.0 100.0 100.0 100.0
India 87.5 82.0 76.1 76.8 80.8 84.8 85.3 81.7
Mexico 86.2 77.7 78.6 73.7 70.6 74.9 71.4 75.8
Chile 75.6 77.9 67.5 71.6 69.7 77.3 82.8 74.4
Uruguay 75.7 48.6 47.9 65.5 51.7 65.9 51.6 58.5
Colombia 75.2 57.4 50.7 60.4 60.3 58.9 40.4 57.6
Singapore 47.6 42.5 49.0 56.5 43.3 57.3 39.0 48.2
Philippines 39.5 49.3 45.8 41.9 35.9 60.0 48.8 45.9
Argentina 48.8 38.1 37.7 54.0 51.5 47.0 30.8 44.3
Nigeria 25.4 30.8 18.2 46.9 47.8 27.7 35.9 33.3
Kenya 51.8 32.5 7.7 47.6 24.3 45.2 10.4 32.0
South Africa 17.9 24.0 15.6 40.0 35.0 40.4 9.7 26.8
Pakistan 13.2 3.2 11.1 19.3 17.9 38.2 22.9 18.4
Bangladesh 29.4 6.9 4.7 0.0 40.2 26.2 10.8 16.6
Ghana 0.0 0.0 0.0 3.0 0.0 0.0 0.0 0.0
30
TABLE 5. INCLUSIVENESS INDEX (FOCUSED ON SMALL BUSINESS WITH 0-50 EMPLOYEES)
Connectivity
and IT infrastructure
Ecommerce and digital regulations
Ecommerce-related logistics
Online payments
Entrepreneurs’ capacity for ecommerce
Access to finance for
ecommerce platforms
and merchants
Overall regulatory
environment for doing business
Inclusiveness Index - small
business
Vis-à-vis country index
Rank
Brazil 6.3 6.1 6.0 7.5 6.8 6.4 5.9 6.4 -0.8 1
Chile 6.5 6.4 5.8 6.7 6.8 5.7 6.4 6.3 -0.1 2
India 6.0 6.0 5.7 6.8 6.1 6.0 6.2 6.1 -0.5 3
Uruguay 6.2 5.1 5.5 5.8 6.3 5.3 5.3 5.6 -0.3 4
Mexico 5.7 5.7 5.4 5.9 5.9 5.2 5.4 5.6 -0.8 5
Colombia 5.9 5.3 5.3 6.1 6.0 5.1 4.9 5.5 -0.4 6
Philippines 4.9 5.7 5.5 5.7 5.0 5.5 5.2 5.4 -0.2 7
Kenya 5.4 5.1 4.8 6.1 4.7 5.0 4.7 5.1 0.0 8
Argentina 5.0 5.0 4.6 5.8 5.8 4.9 4.6 5.1 -0.4 9
Nigeria 4.4 4.8 4.2 5.5 5.5 3.9 5.4 4.8 -0.3 10
Bangladesh 5.0 4.6 4.3 4.0 5.9 4.0 4.7 4.7 0.1 11
Pakistan 4.5 4.3 4.7 4.5 4.2 4.8 5.4 4.6 0.0 12
South Africa
4.0 4.7 4.4 5.5 5.7 3.4 4.2 4.6 -0.3
13
Ghana 4.4 4.6 4.6 4.3 4.5 3.8 5.3 4.5 0.4 14
31
TABLE 6. INCLUSIVENESS INDEX (FOCUSED ON SMALL ONLINE SELLER EXPORTERS)
Connectivity
and IT infrastructure
Ecommerce and digital regulations
Ecommerce-related logistics
Online payments
Entrepreneurs’ capacity for ecommerce
Access to finance for
ecommerce platforms
and merchants
Regulatory environment
for doing business
Small online seller & exporter
Index
Vis-à-vis large online
seller & exporter business
index
Rank
Brazil 6.3 6.2 5.8 7.7 7.2 6.6 6.1 6.5 -1.9 1
Chile 7.1 6.8 6.1 6.4 8.1 5.0 6.1 6.5 -1.0 2
India 6.3 6.2 6.0 7.3 6.6 6.5 6.6 6.5 1.4 3
Mexico 6.5 6.9 6.1 6.0 7.7 5.9 5.7 6.4 0.1 4
South Africa 4.5 6.5 6.5 6.5 7.0 5.5 6.5 6.1 -0.5 5
Pakistan 6.1 5.8 6.5 6.4 5.8 6.2 5.7 6.1 -0.2 6
Uruguay 5.2 5.4 6.0 6.2 6.9 5.6 5.4 5.8 -1.2 7
Argentina 5.8 5.2 5.0 6.2 6.6 5.6 5.3 5.7 -0.2 8
Kenya 5.0 4.0 5.0 6.0 6.0 6.0 7.0 5.6 -2.0 9
Colombia 5.9 5.5 5.1 5.9 6.3 5.5 4.5 5.5 -1.8 10
Nigeria 4.6 4.8 4.5 6.1 5.7 3.4 5.5 4.9 -2.8 11
Philippines 4.7 4.6 5.2 4.6 4.8 4.9 5.4 4.9 -2.2 12
Ghana 4.6 4.9 4.5 4.9 4.8 4.6 5.8 4.9 -2.1 13
Bangladesh 5.0 4.8 4.5 4.0 5.8 4.2 4.9 4.8 -1.1 14
32
D. FINDINGS IN SUM
This survey and index pioneers in capturing firm-, sector-, and country-specific challenges and needs
for ecommerce – key to helping countries prioritize policy interventions aimed at fueling digital
trade, and to tailoring solutions to different types of firms. The results reviewed here have
highlighted that:
The Internet has become a very important feature in developing country companies’ sales
and purchases, and a key means for companies to internationalize. Compared to brick-and-
mortar companies, of which only a small fraction exports, a significant share of companies
surveyed here – all of which have some online presence due to taking this survey online -
sell and buy online across borders.
Perceived challenges to ecommerce vary significantly across countries, which means that
policy recommendations and interventions need to be tailored to each country’s
circumstances. The severity of these challenges tends to be negative correlated with
countries’ development levels.
Companies report access to finance, logistics, and online payments as posing especially
important problems in domestic ecommerce, and logistics and regulatory frameworks for
their cross-border ecommerce. The challenges also vary significantly by firms’ size and online
activity. For example, small companies are tend to be considerably more hampered in doing
ecommerce than large companies in practically every economy. This means that
interventions aimed at helping businesses sell more online need to be tailored to each
company. However, quite universally, the basic business environment is seen by companies
as critical for success at ecommerce.
Merchants and ecosystem companies’ views differ somewhat. Merchants’ views are more
related to their day-to-day business operations; ecosystem companies take more of a macro
perspective. Separating the two is useful as it provides for targeting solutions; for example,
the merchant survey provides useful insights if the goal is to get more SMEs to sell online,
while the ecosystem survey may be more helpful if a given government is looking for more
sophisticated views on how to structure the enabling regulatory environment for
ecommerce.
The barriers matter—and businesses believe that removing them will result in significant
revenue and employment gains for companies. If the top three barriers to ecommerce were
removed, companies would score annual revenue gains of 34 percent in their domestic
markets and 30 percent in international markets. Some countries such as Colombia and
Bangladesh would realize even greater gains. Brazilian companies report that if the top three
barriers to ecommerce were removed, they could increase employment by a very significant
28 percent.
This survey and database brings new and actionable dimensions to development debates. For
example, as granular as Enterprise Surveys are, they do not capture or analyze any of the variables
specific and often most pressing to ecommerce sellers, such as internet intermediary liability rules,
rural last-mile delivery, access to fast-disbursing online loans, fraud control in online payments, or
banks’ willingness to offer ecommerce merchant accounts. These and many other issues specific to
ecommerce are not at all satisfactorily addressed by databases such as Doing Business, UNCTAD’s
Ecommerce Index, or the WEF Networked Readiness Index. Yet they are highly pertinent to
companies engaged in ecommerce, and as such need to be surfaced in order for policymakers as well
as market participants to address them.
33
IV. IMPROVEMENTS AND POLICY
DIRECTIONS There are a number of ways to leverage these data. Perhaps the most pertinent and timely inquiry
building on this study is why certain countries outperform in the index created here, and others
underperform—and particularly the institutional and policy variables that help explain these
differences.
This survey can also be rerun annually to track countries over time, and help countries track their
performance over time. Ideally it is also run for the same companies year after year, to track any one
company’ performance and perceptions. Either way, further iterations of this index can be improved
with the following inclusions:
Asking companies about their job growth if barriers were removed; this is an important data
point for articulating the importance of measures to remove barriers to ecommerce to
policymakers.
Analyzing the market opportunity for removing a constraint. For example, it would be useful
to know how large a market unlocking rural last-mile delivery—something that companies
report as hampering ecommerce in practically every economy—would yield.
Requiring companies to include their geographic location would enable us to analyze the
spatial distribution of ecommerce activity and challenges, and for involving subnational
governments to ecommerce development activities.
Capturing further firm characteristics (e.g., skill intensity, growth in past five years, export
growth per annum) would allow us to study “ecommerce premium”, impact and gains from
engagement on ecommerce.
Asking merchants and ecosystem companies about the level, desirability, and availability of
foreign direct investment (FDI) in ecommerce, so as systematically catalogue merchants’
interest in selling on major global platforms and help policymakers design policies that help
regulate and incentivize, as desired, FDI in the ecommerce sector.
Expanding country samples, both for greater representativeness and for making finer cuts of
the data (for example, analyze how companies with a female CEO perform).
There are also several lines of work that appear timely, stemming for the interviews and workshops
that are in demand among the countries analyzed:
Country diagnostics, benchmarking of digital trade, enabling environment for digital trade,
activities to boost digital trade.
Best practice identification and knowledge-share across countries and regions.
Targeted solutions to small online sellers, such as small, fast disbursing online working capital
loans.
Impact assessments of potential reforms, e.g., in the areas of ecommerce regulations or in
trade facilitation for small parcels.
34
Ideation of fresh solutions to emerging problems. e.g., new facilities to systematically finance
SME ecommerce capacity-building.
Multi-stakeholder dialogues (“trade policymakers +”), e.g., for interoperability of payments,
digital regulations.
Creation of PPPs, e.g. commerce platforms and export promotion agencies.
35
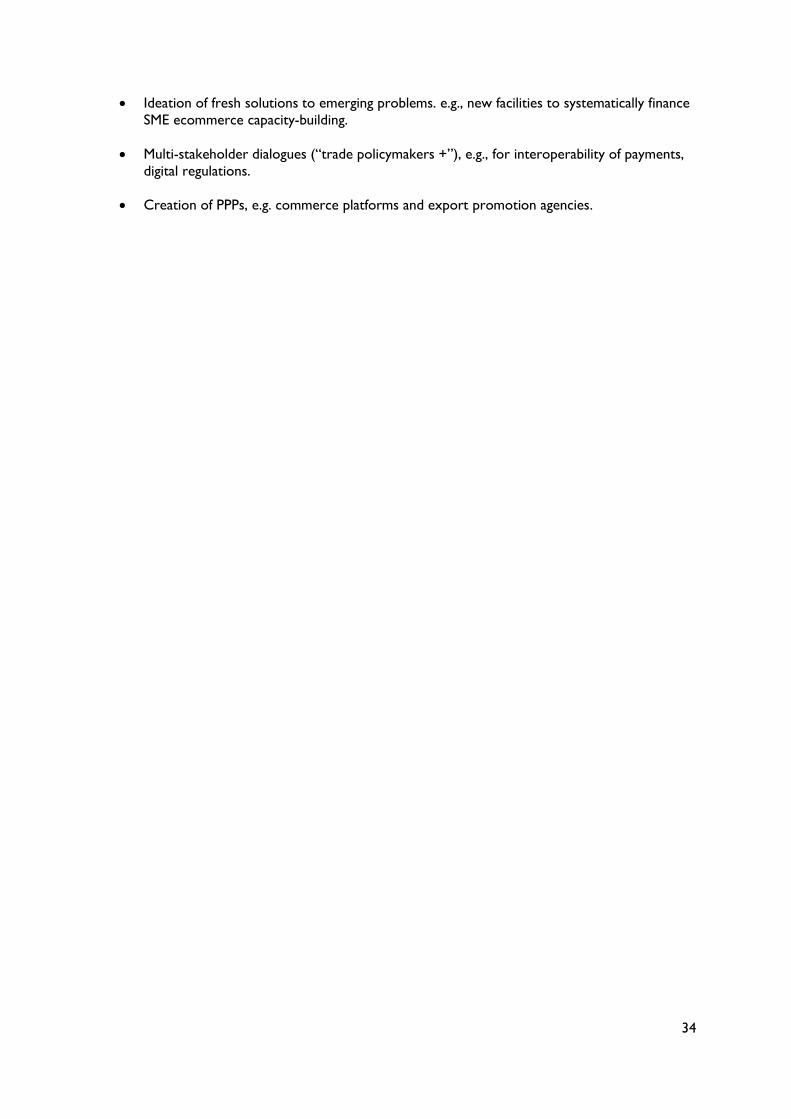
APPENDIX I – DESCRIPTIVE STATISTICS
ECOSYSTEM COMPANIES
By Size
By Sector
36
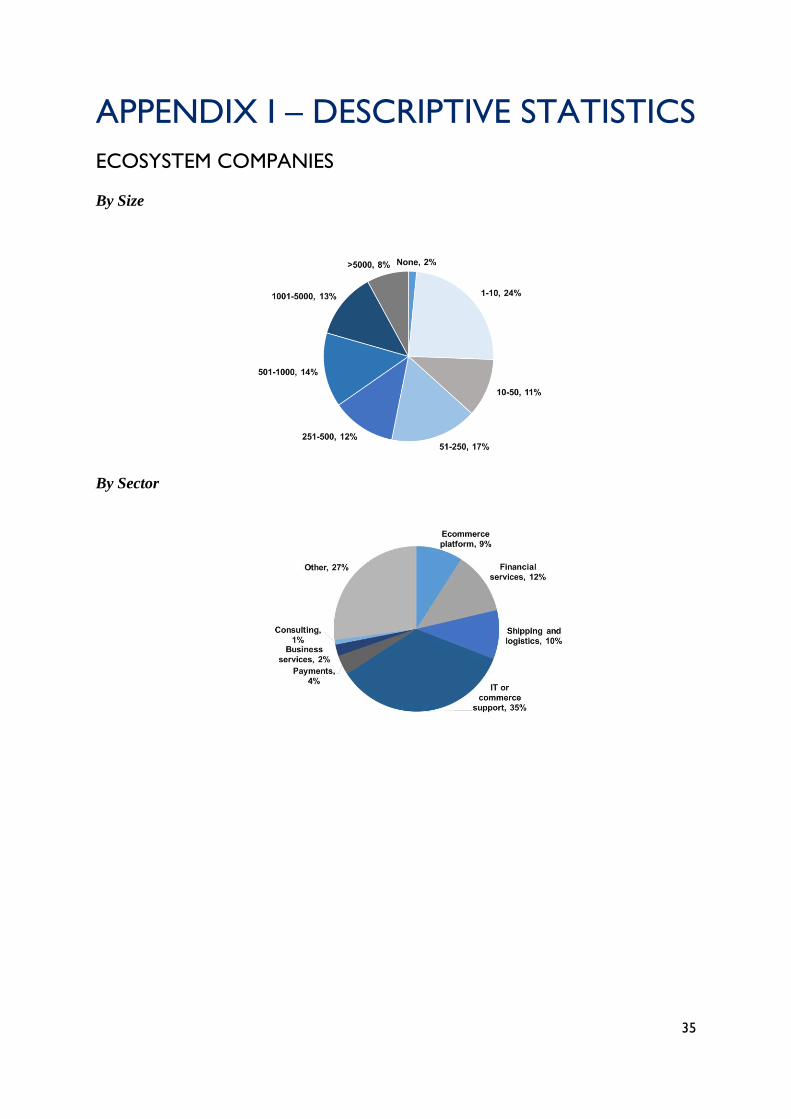
MERCHANTS
By Size
By Online Activity
37
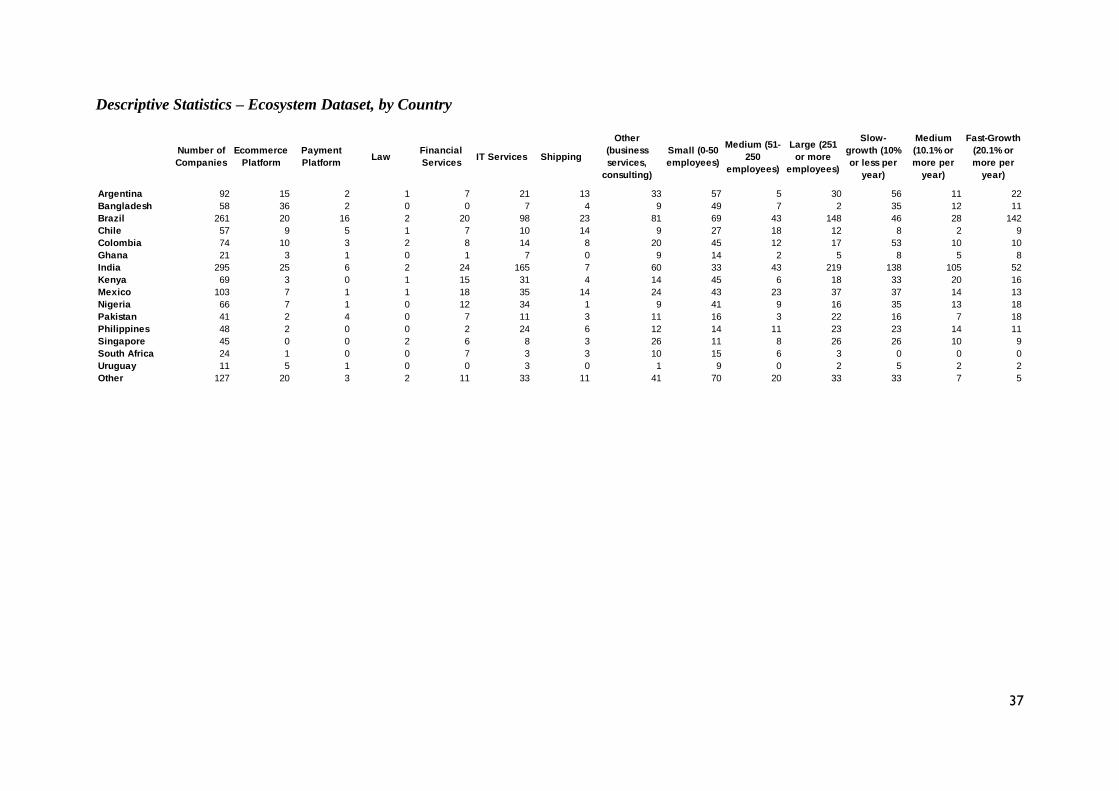
Descriptive Statistics – Ecosystem Dataset, by Country
Number of
Companies
Ecommerce
Platform
Payment
PlatformLaw
Financial
ServicesIT Services Shipping
Other
(business
services,
consulting)
Small (0-50
employees)
Medium (51-
250
employees)
Large (251
or more
employees)
Slow-
growth (10%
or less per
year)
Medium
(10.1% or
more per
year)
Fast-Growth
(20.1% or
more per
year)
Argentina 92 15 2 1 7 21 13 33 57 5 30 56 11 22
Bangladesh 58 36 2 0 0 7 4 9 49 7 2 35 12 11
Brazil 261 20 16 2 20 98 23 81 69 43 148 46 28 142
Chile 57 9 5 1 7 10 14 9 27 18 12 8 2 9
Colombia 74 10 3 2 8 14 8 20 45 12 17 53 10 10
Ghana 21 3 1 0 1 7 0 9 14 2 5 8 5 8
India 295 25 6 2 24 165 7 60 33 43 219 138 105 52
Kenya 69 3 0 1 15 31 4 14 45 6 18 33 20 16
Mexico 103 7 1 1 18 35 14 24 43 23 37 37 14 13
Nigeria 66 7 1 0 12 34 1 9 41 9 16 35 13 18
Pakistan 41 2 4 0 7 11 3 11 16 3 22 16 7 18
Philippines 48 2 0 0 2 24 6 12 14 11 23 23 14 11
Singapore 45 0 0 2 6 8 3 26 11 8 26 26 10 9
South Africa 24 1 0 0 7 3 3 10 15 6 3 0 0 0
Uruguay 11 5 1 0 0 3 0 1 9 0 2 5 2 2
Other 127 20 3 2 11 33 11 41 70 20 33 33 7 5
38
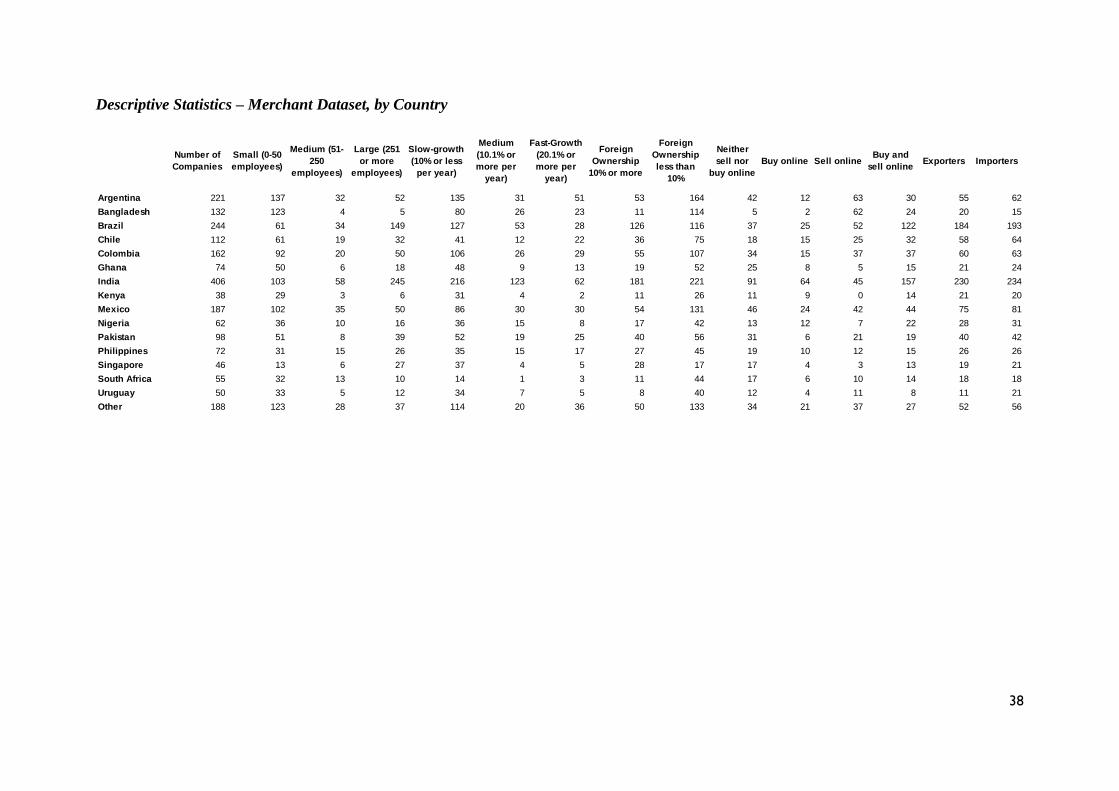
Descriptive Statistics – Merchant Dataset, by Country
Number of
Companies
Small (0-50
employees)
Medium (51-
250
employees)
Large (251
or more
employees)
Slow-growth
(10% or less
per year)
Medium
(10.1% or
more per
year)
Fast-Growth
(20.1% or
more per
year)
Foreign
Ownership
10% or more
Foreign
Ownership
less than
10%
Neither
sell nor
buy online
Buy online Sell onlineBuy and
sell onlineExporters Importers
Argentina 221 137 32 52 135 31 51 53 164 42 12 63 30 55 62
Bangladesh 132 123 4 5 80 26 23 11 114 5 2 62 24 20 15
Brazil 244 61 34 149 127 53 28 126 116 37 25 52 122 184 193
Chile 112 61 19 32 41 12 22 36 75 18 15 25 32 58 64
Colombia 162 92 20 50 106 26 29 55 107 34 15 37 37 60 63
Ghana 74 50 6 18 48 9 13 19 52 25 8 5 15 21 24
India 406 103 58 245 216 123 62 181 221 91 64 45 157 230 234
Kenya 38 29 3 6 31 4 2 11 26 11 9 0 14 21 20
Mexico 187 102 35 50 86 30 30 54 131 46 24 42 44 75 81
Nigeria 62 36 10 16 36 15 8 17 42 13 12 7 22 28 31
Pakistan 98 51 8 39 52 19 25 40 56 31 6 21 19 40 42
Philippines 72 31 15 26 35 15 17 27 45 19 10 12 15 26 26
Singapore 46 13 6 27 37 4 5 28 17 17 4 3 13 19 21
South Africa 55 32 13 10 14 1 3 11 44 17 6 10 14 18 18
Uruguay 50 33 5 12 34 7 5 8 40 12 4 11 8 11 21
Other 188 123 28 37 114 20 36 50 133 34 21 37 27 52 56