
Ecology – Population Structure · Population Biology • One of the most fascinating and fruitful...
46
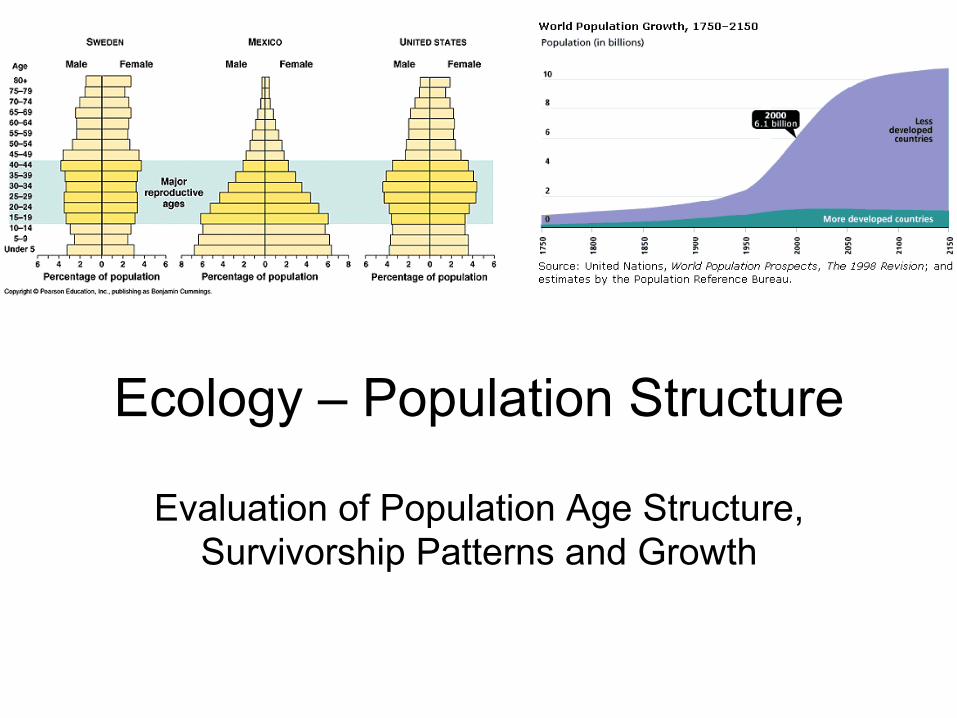
Ecology – Population Structure Evaluation of Population Age Structure, Survivorship Patterns and Growth
Transcript of Ecology – Population Structure · Population Biology • One of the most fascinating and fruitful...
Ecology – Population Structure
Evaluation of Population Age Structure, Survivorship Patterns and Growth

Population Biology
• One of the most fascinating and fruitful areas to study in ecology is at the population level
• The population is the evolutionary unit and we do need to keep that in mind
• How do we define a population? Is the following statement “a group of individuals of the same species in a given area” sufficient for the definition of a population?
• What is missing?

The realm of Population Ecology • Today we are going to deal with several
aspects of population biology, but we will focus much of our attention on three -
• First, Age Structure and methods of evaluating age structure in populations
• Second, we will look at general patterns of survivorship observed in natural populations and what that means to species
• Finally will look at population growth

Before we look at our focal areas…
• Population structure has many different meanings
• Other than age structure (which will be our major focus), what other sorts of characteristics of populations might we consider to contribute to structure in natural systems?

Let us consider some of the others…
• Certainly distribution in space and time (spatial and temporal distributions - dispersion)
• Genetic variability maintained by the population
• And we will look at movement patterns of individuals in the population (later in the course)

Let us first consider dispersion
• With the concept of dispersion, really here we are addressing the issue of the actual distribution of individuals in a given area
• In general terms, we often talk about the geographic range of a species. What does that actually mean?
• With more precision, we can look at this in terms of where, in space, the organisms actually exist


What might be the basis of different patterns of dispersion?
• That is, why are the individuals of a population distributed in a particular way?
• Random dispersion? • What about clumped dispersion? • Alternatively, what about the situation
where the spacing is uniform among individuals?


From a genetic perspective…
• We can look at this from the perspective of distinctness of populations and/or movement among populations and the coincident gene flow
• One very important measure of a population is the amount of genetic variability maintained in a natural population (this is of primary importance for a population)
• This measure is an evaluation of the amount of variation present in the population

Methods to Evaluate Variability
• We talked about variation and its sources when we looked at evolution. The phenotypic variability displayed by individuals is a result of the interaction between genetic features and environmental influences
• However, to accurately evaluate variation in the gene pool, we need to employ methods that look at genetic features – e.g.?

When evaluating any feature of a population – is it a closed entity?
• That is, for many analyses, we want to evaluate that population, or at least the group of individuals that we think is a population
• Many times the terms source and sink populations are used to describe such situations. Here, there is essentially one-way movement of individuals (and genes) from the source population or populations to other subpopulation(s)
• This obviously can create difficulties in the analysis of a population

Why is assessment of variation important information?
• These analyses give us a feel for population boundaries
• This can identify patterns in geographic variation, subpopulations, and even contribute to our understanding of historical events influencing this population – How?

Another Measure is Estimation of Density in a Geographic Area
• In looking at the dispersion of individuals in a population, it is important to be able to evaluate the density of organisms in that habitat. Why might this be of value?
• Generally, a complete census is not practical or even possible, rather we use estimating tools
• What is the most common estimating technique?

Mark – Recapture Methods
• This is a very effective and common technique used to estimate population size and often times a realistic measure of a closed system
• The calculation is simple: x/n = M/N (we will not be using this formula)
• This procedure gives us a quick measure of the population size in that area
Age Structure in Populations
• Basically, this is a function of the age or age class distribution in a population
• There are several ways to evaluate this: – Follow a cohort of individuals through time and
obtain direct measurement of number of individuals at each age class (this is ideal)
– Look at the entire population and measure the percentage of individuals in each age class
– Look at the age at which individuals die

These data can be used to construct Age Class Distributions

What do the three types mean?
• The previous figure displays human sample populations derived from the horizontal method of analysis
• Can we say anything about the stability of the populations? How are these data most useful?
• As an example, what if we measured the age structure distribution of a population of fish. What can we say about the population stability of a single population?

Other uses of this information • Detailed analysis of life history
characteristics, such as the age at which individuals die, can be used to construct life tables
• Let us look at these features from a study of a population of Darwin’s ground finches
• We can obtain this type of data only by following a cohort through time. (But, as you can imagine, this is not simple and often involves estimation of several parameters to reach our life table estimates.)

What are the features we want to measure?


Graphically, we can just look at survivorship in various species
• From natural populations, we can identify three general trends
• These are expressed as a plot of the log of the number of individuals surviving as a function of the percent of normal life span of an individual
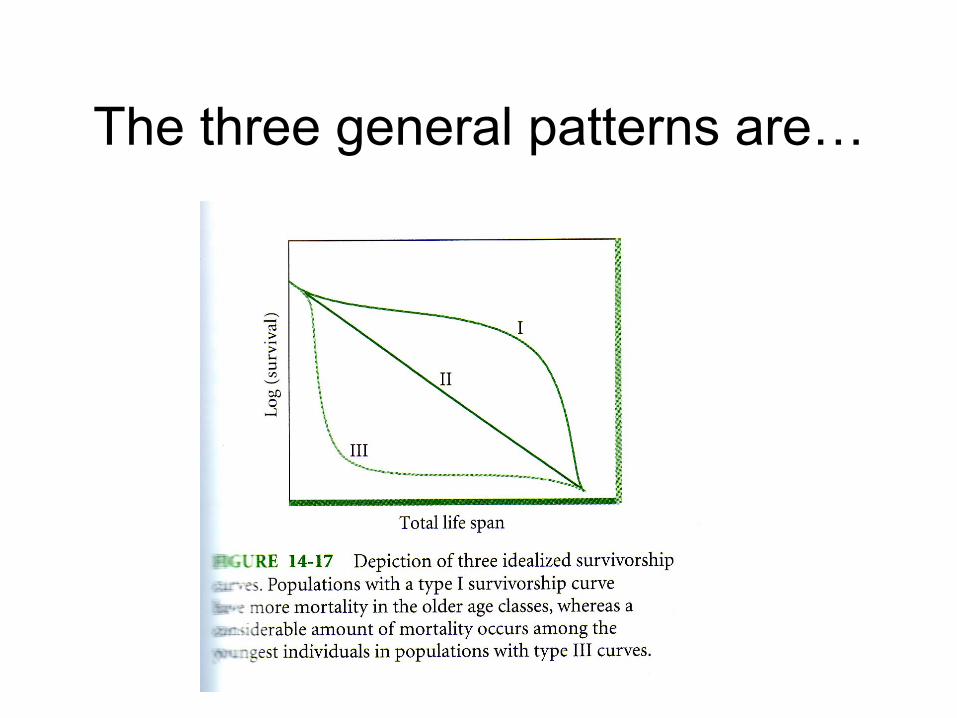
The three general patterns are…
Patterns indicate many features – much more than just survivorship • Conceptually, what does each curve tell
us? • We start to see patterns emerge, particularly
with regard to strategies of reproduction • We find suites of coincidental features. We
can divide the organisms into either r strategists or K strategists
• We will develop this in detail when we look at population growth patterns

Break time!

The various population measures
• These features identified so far all contain valuable information regarding the population under study
• We still have a very important component of population biology to address – growth
• We will look at population growth models and make some generalizations about organisms and their reproductive strategies


We can evaluate reproductive rates
• Simplistically, we can evaluate the rate of increase as B – D (on a population level)
• But population level measures are often difficult to determine. Alternatively, with our data we can predict the average output of an individual and the average death rate of an individual (from our bx and our lx). Simply put, the individual birth rate – the individual death rate (b – d) or r (it is not quite that simple, but we will treat the details in a few)

Mathematically, what is r?
• r is a very important variable for our consideration as much of population growth modeling and theory is based upon this value
• By definition, r is the intrinsic rate of increase or the rate of increase in a population under ideal conditions with a stable age distribution – simply put, the birth rate minus the death rate

Estimation of r from other data
• This estimation is based upon the probable output of all age classes to arrive at a particular estimate. It is, in effect, an estimation of rate from the data that will give us a population level characteristic or feature
• We can then use this information to calculate population size over time, e.g. Nt = N0ert (continuous reproductive output)

Look at this formula more closely
• The predictions here are the result of the capacity of the individuals to reproduce – without other restrictions. This formula describes exponential growth in a population (continuous addition of offspring) or geometric growth (for seasonally defined addition of offspring on a periodic basis)


Exponential growth in a population
The formula that represents the slope of this line, dN/dt=rN, is the instantaneous rate of increase for this population. That is, this formula tells us the rate of increase for the population at any population size for groups exhibiting exponential growth.

Now, let us do a reality check • What does exponential growth suggest?
Is that the situation we see under most natural conditions?
• One of the primary contributions to the thinking of Charles Darwin was an essay written by Thomas Malthus regarding population growth
• Although Malthus predicted an outcome for humans, it is applicable to all organisms under consideration – the struggle for resources


How can we apply this?
• Very early in the study of population ecology, the recognition of limited resources was considered when modeling population growth
• A term was devised, called the environmental resistance to growth
• Mathematically, the term is (K - N)
K
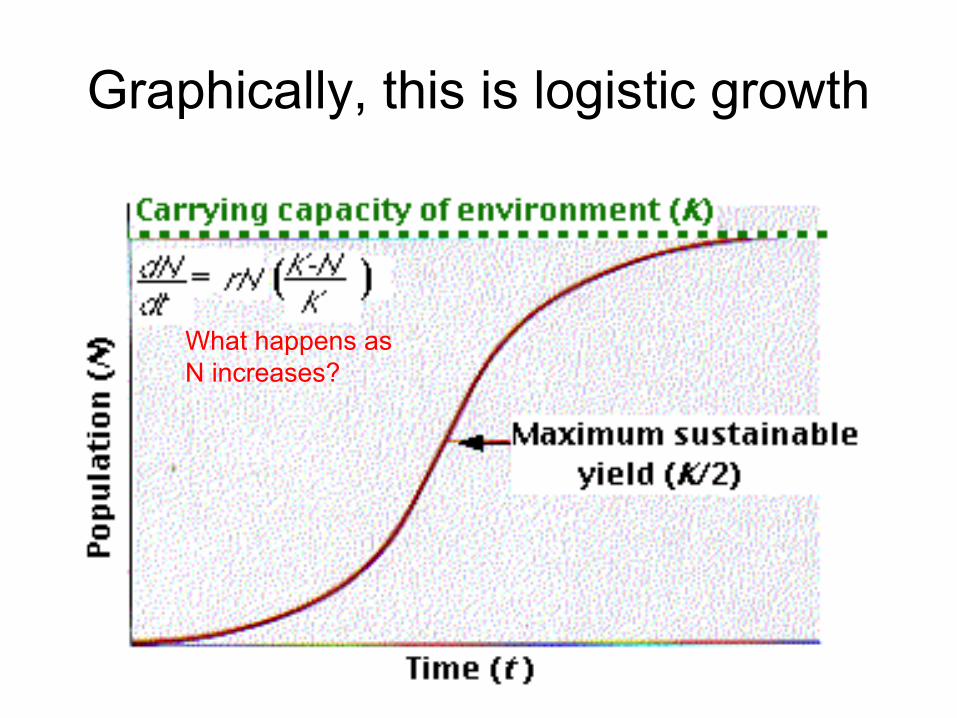
Graphically, this is logistic growth
What happens as N increases?

Predictions of Logistic Growth
• The reality of nature dictates that organisms will not exhibit exponential or geometric growth for extended periods of time
• That is, dN/dt=0 at N=K (remember the environmental resistance to growth)
• This is Logistic Population Growth

Look at the shape of that curve
• This curve is picture-perfect. A well-behaved population of organisms
• What directly influences the shape of this curve, and more importantly, the rate associated with the logistic population growth model?
• What happens when we change those parameters?

We can calculate the population size at some point in time t and the quantity b is basically the starting population size for the specific situation.

These curves are predictions
• This curve is a prediction of a “well-behaved population” of organisms
• The most important factor influencing this curve is the value of r (the difference between the birth rate and death rate)
• What happens when we change those parameters?

When r is small, ~1.5
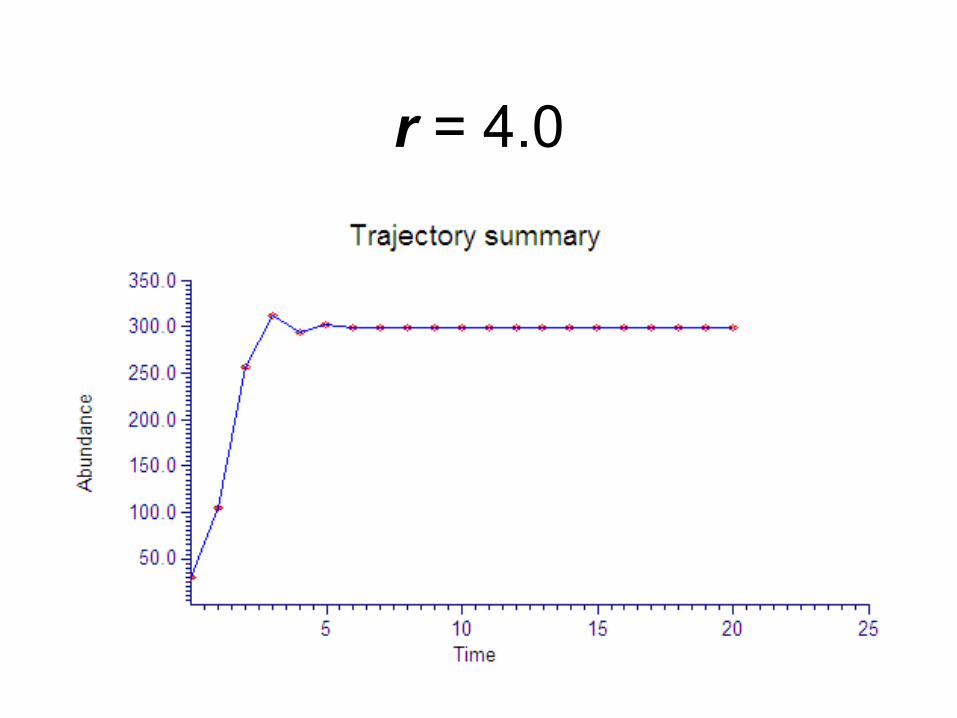
r = 4.0

r = 6.0
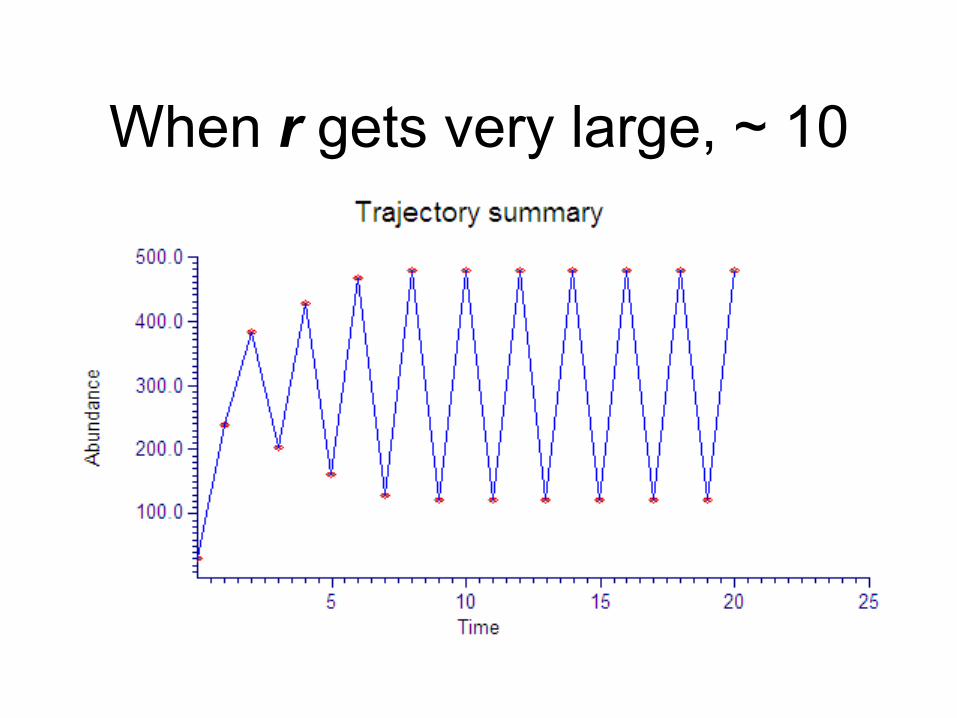
When r gets very large, ~ 10


