
Ecology: Lecture 1 Introduction. Photo: Stanford University News Service.
19
Ecology: Lecture 1 Ecology: Lecture 1 Introduction
-
Upload
jonathan-austin -
Category
Documents
-
view
215 -
download
1
Transcript of Ecology: Lecture 1 Introduction. Photo: Stanford University News Service.

Ecology: Lecture 1Ecology: Lecture 1
Introduction
Photo: Stanford University News Service


What is ecology?What is ecology?
“Ecology works at characterizing the patterns seen in nature, studying the complex interactions among organisms and their environments, and understanding the mechanisms involved in biological diversity.”

1. Characterizing the 1. Characterizing the patterns seen in naturepatterns seen in nature
Example: The River Continuum Many differences are seen between the
upstream and downstream stretches of a river Different types of invertebrates Different species of fish


2. 2. Studying complex interactions Studying complex interactions between organisms and their between organisms and their
environmentenvironment
Example: What causes the differences seen between upstream and downstream sites? Possibilities???

3. 3. Understanding the Understanding the mechanisms involved in mechanisms involved in
biodiversitybiodiversity Why do some reaches of a river
tend to have greater diversity than others? Why do some rivers have greater diversity than others?
Why do tropical rain forests and coral reefs have relatively high species diversity compared to other ecosystems?

The The absoluteabsolute geographical geographical boundaries of a species are set boundaries of a species are set
by abiotic factorsby abiotic factors
Global scale: Adelie penguins would overheat in the tropics

The The absoluteabsolute geographical geographical boundaries of a species are set boundaries of a species are set
by abiotic factorsby abiotic factors Local scale: Giant, green anemones
are found in pooling water in the intertidal, but not on vertical rock faces

Within limits set by abiotic factors,Within limits set by abiotic factors,biologicalbiological interactionsinteractions affect the affect the
presence & abundance of speciespresence & abundance of species
What are some of these biological interactions?

Why are there no polar Why are there no polar bears in the Antarctic?bears in the Antarctic?

Shelford’s law of toleranceShelford’s law of tolerance What do the axes mean? What do different
parts of the curve tell us about the species?

Seasonal or geographical Seasonal or geographical shifts in toleranceshifts in tolerance
What do the three different curves represent? (>1 possibility)
What does the arrow represent? What types of values belong on the x-axis?

Winter distribution of the Eastern phoebe:
Blue line: -4º isotherm, minimum average temp. JanuaryBlue patches: Deviation of phoebe distribution from -4º
isotherm.
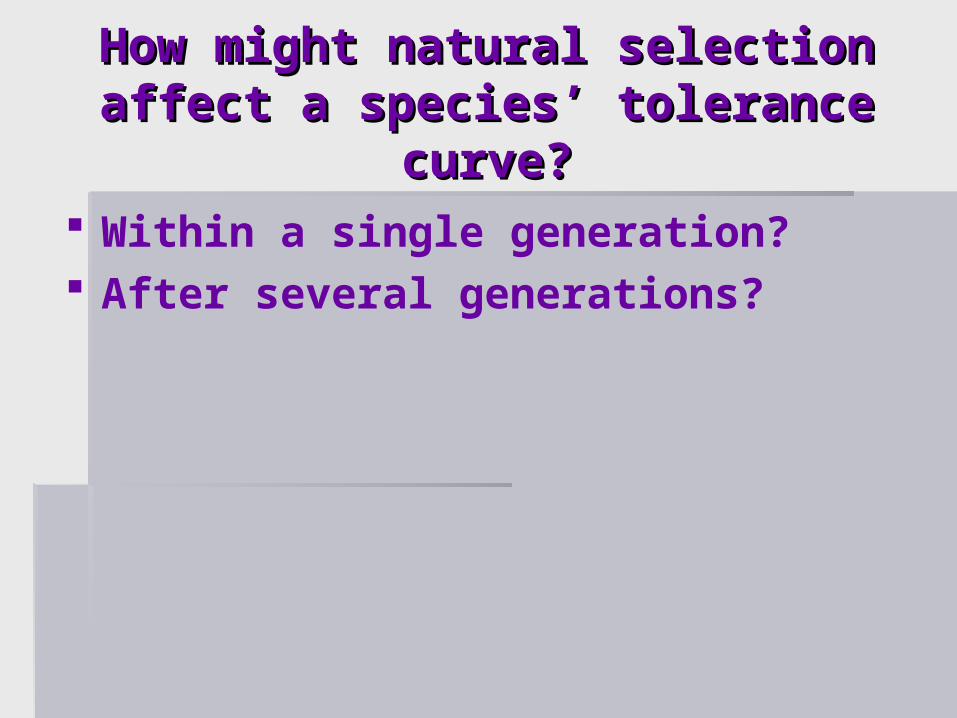
How might natural selection How might natural selection affect a species’ tolerance affect a species’ tolerance
curve?curve? Within a single generation? After several generations?

Global warming Global warming and species and species
shiftsshifts Example: malaria
Diagram from Bellarmine University website


![Stanford CS193p · request.entity = [NSEntityDescription entityForName:@“Photo” inManagedObjectContext:ctxt]; We are just asking the class NSEntityDescription to create an instance](https://static.fdocuments.us/doc/165x107/5f9894e9fcd3a1638d6ffbd2/stanford-cs193p-requestentity-nsentitydescription-entityfornameaoephotoa.jpg)


